Embed Size (px)
Citation preview
An analysis of the NYPD’s stop-and-frisk policy in the context
of claims of racial bias∗
Andrew Gelman† Jeffrey Fagan‡ Alex Kiss§
December 14, 2005
Abstract
Recent studies by police departments and researchers confirm that police stop racial and
ethnic minority citizens more often than whites, relative to their proportions in the popu-
lation. However, it has been argued that stop rates more accurately reflect rates of crimes
committed by each ethnic group, or that stop rates reflect elevated rates in specific social ar-
eas such as neighborhoods or precincts. Most of the research on stop rates and police-citizen
interactions has focused on traffic stops, and analyses of pedestrian stops are rare. In this
paper, we analyze data from 125,000 pedestrian stops by the New York Police Department
over a fifteen-month period. We disaggregate stops by police precinct, and compare stop
rates by racial and ethnic group controlling for previous race-specific arrest rates. We use
hierarchical multilevel models to adjust for precinct-level variability, thus directly address-
ing the question of geographic heterogeneity that arises in the analysis of pedestrian stops.
We find that persons of African and Hispanic descent were stopped more frequently than
whites, even after controlling for precinct variability and race-specific estimates of crime
participation.
Keywords: criminology, hierarchical model, multilevel model, overdispersed Poisson re-
gression, police stops, racial bias
∗We thank the New York City Police Department, the New York State Division of Criminal JusticeServices, and the Office of the New York State Attorney General for providing data for this research.Tamara Dumanovsky and Dong Xu made significant contributions to the analysis. Joe Bafumi, RajeevDehejia, Jim Liebman, Dan Rabinowitz, Caroline Rosenthal Gelman, and several reviewers provided helpfulcomments. Support for this research was provided in part by grants SES-9987748 and SES-0318115 fromthe National Science Foundation. All opinions are those of the authors.
†Department of Statistics and Department of Political Science, Columbia University, New York,[email protected]. http://www.stat.columbia.edu/∼gelman/
‡Law School and School of Public Health, Columbia University, New York, [email protected]§Department of Research Design and Biostatistics, Sunnybrook and Women’s College Health Sciences
Center, Toronto
1
1 Introduction: bias in police stops?
In the late 1990s, popular, legal, and political concerns were raised across the U.S. about
police harassment of minority groups in their everyday encounters with law enforcement.
These concerns focused on the extent to which police were stopping people on the highways
for “driving while black” (see Weitzer, 2000, Harris, 2002, and Lundman and Kaufman,
2003). Additional concerns were raised about racial bias in pedestrian stops of citizens by
police predicated on “zero tolerance” policies to control quality-of-life crimes and aggressive
policing strategies concentrated in minority communities that targeted illegal gun posses-
sion and drug trafficking (see Fagan, Zimring and Kim, 1998, Greene, 1999, Skolnick and
Caplovitz, 2001, Fagan and Davies, 2000, 2003, Fagan, 2002, and Gould and Mastrofski,
2004). These practices prompted angry reactions among minority citizens that widened the
breach between different racial/ethnic groups in their trust in the police (Lundman and
Kaufman, 2003, Tyler and Huo, 2003, and Weitzer and Tuch, 2002), provoking a crisis of
legitimacy with legal, moral and political dimensions (see Wang, 2001, Russell, 2002, and
Harris, 2002).
Racially disproportionate stops and searches by police take place in a wide range of
everyday citizen transactions and movements (Sykes and Clark, 1976, Langan et al., 2001,
Durose, Schmitt, and Langan, 2005) and have been perceived to be a problem by a majority
of Americans as measured by Gallup polls in 1999 and 2003. Whether these contacts
are racially motivated is a hotly contested question that has been the focus of public and
private litigation (Rudovsky, 2001), political mobilization, and self-scrutiny by several police
departments (see Garrett, 2001, and Walker, 2001). Further background on this controversy
and discussions of practical resolutions appear in Skolnick and Caplovitz (2001), Gross and
Livingston (2002), and Fridell et al. (2001).
Police have defended racially disparate patterns of stops on the grounds that minorities
commit disproportionately more crimes than whites (especially the types of crimes that
capture the attention of police), and that the spatial concentration and disparate impacts
of crimes committed by and against minorities justifies more aggressive enforcement in
minority communities (MacDonald, 2001). Police cite such differences in crime rates to
justify racial imbalances even in situations where they have a wide range of possible targets
or where their suspicion of criminal activity would not otherwise justify a stop or search
(Kennedy, 1997, Harcourt, 2001, Rudovsky, 2001). Using this logic, police claim that the
higher stop rates of African Americans and other minorities simply represent reasonable
2
and efficient police practice (see, for example, Bratton and Knobler, 1998, and Goldberg,
1999). Police often point to the high rates of seizures of contraband, weapons, and fugitives
in such stops, and also to a reduction of crime, to justify such aggressive policing (Kelling
and Cole, 1996).
Whether racially disparate stop rates reflect disproportionate crime rates or intentional,
racially biased targeting by police of minorities at rates beyond what any racial differences
in crime rates might justify, is the heart of the social and legal controversy on racial profiling
and racial discrimination by police (Fagan, 2002, Ayres, 2002a, Harris, 2002). Research to
date on racial “profiling” in policing is relatively new and has focused primarily on traffic
stops. Stops of pedestrians have received far less research attention, despite the essential
role of pedestrian stops in modern policing. Yet, both pedestrian and traffic stops are salient
events, and the conduct of both types of police interdictions carries great weight in citizen
assessments of the fairness and legitimacy of the police (Harris, 2002, Tyler and Huo, 2003).
In an era of declining crime rates, contemporary policy debates on policing strategies often
pivot on the evaluation of New York City’s aggressive policing strategy during the 1990s, a
strategy designed on aggressive stops and searches of pedestrians for a wide range of crimes
(Eck and Maguire, 2000, Skogan and Frydl, 2004).
This article focuses on a dispute about the New York City police department’s “stop
and frisk” policy: the lawful practice of “temporarily detaining, questioning, and, at times,
searching civilians on the street” (Spitzer, 1999). The U.S. Supreme Court has ruled po-
lice stop-and-frisk procedures to be constitutional under certain restrictions (Terry v. Ohio,
1968). The NYPD’s aggressive policing during the 1990s has been generally praised, but
near the end of the decade there were repeated complaints of harassment of minority com-
munities, especially by the elite Street Crimes Unit (Spitzer, 1999). These complaints came
in the context of the well-publicized assault by police of Abner Louima and the shootings
of Amadou Diallo and Patrick Dorismond. Citizen complaints about aggressive “stop and
frisk” tactics ultimately provoked civil litigation that alleged racial bias in the patterns of
“stop and frisk,” leading to a settlement that regulated the use of this tactic and estab-
lished extensive monitoring requirements (Kelvin Daniels v. City of New York, 2004). We
address this dispute by estimating the extent of racially disparate impacts of what came to
be known as the “New York strategy” and assessing whether the policy was racially neutral
when compared to the central claim that race-specific stop rates reflect nothing more than
race-specific crime rates.
We present a statistical study of the rates at which New Yorkers of different ethnic
3
groups were stopped by the police on the city streets. This study is based on work performed
with the New York State Attorney General’s Office (Spitzer, 1999) and reviewed by the U.S.
Commission on Civil Rights (2000). Two key issues addressed in our study are the baselines
used to compare rates of stops (recognized as a problem by Miller, 2000, Walker, 2001, and
Smith and Alpert, 2002) and local variation in the intensity of policing (as performed by the
Street Crimes Unit and implicitly recommended by Wilson and Kelling, 1982, and others).
We use multilevel modeling (see Raudenbush and Bryk, 2002, for a general overview and
Sampson, Raudenbush, and Earls, 1997, Sampson and Raudenbush, 1999, and Weidner,
Frase, and Pardoe, 2004, for examples in studies of crime) to adjust for local variation so
as to better compare the rates of police stops of different ethnic groups in New York City.
Were the police disproportionately stopping ethnic minorities? We address this question
in several different ways using data on police stops, and we conclude that members of
minority groups were stopped more often than whites, both in comparison to their overall
population and to the estimated rates of crime they have committed. We do not, however,
necessarily conclude that the NYPD engaged in discriminatory practices. The summary
statistics we study here cannot directly address questions of harassment or discrimination
but rather reveal statistical patterns that are relevant to these questions.
2 Background
2.1 Race, neighborhoods, and police stops
Nearly a century of legal and social trends set the stage for the current debate on race and
policing. Historically, close surveillance by police has been a part of everyday life for African
Americans and other minority groups (see, for example, Musto, 1973, and Kennedy, 1997).
In recent decades, the U.S. Supreme Court has sanctioned border interdictions of persons of
Mexican or Hispanic ethnicity to halt illegal immigration (U.S. v. Martinez-Fuerte, 1976),
as well as the racial components of drug courier profiling by airlines (U.S. v. Harvey, 1994).
In U.S. v. Whren (1996), the Supreme Court allowed the use of race as a basis for a police
stop as long as there were other factors that motivated the stop, and in Brown v. Oneonta
(2002), a federal district court permitted the use of race as a search criterion if there was
an explicit racial description of the suspect.
The legal standard to regulate the constitutionality of police conduct in citizen stops
derives from Terry v. Ohio (1968), which involved a pedestrian stop that established the pa-
rameters of the “reasonable suspicion” standard for police conduct in detaining citizens for
4
purposes of search or arrest. Recently, the courts have expanded the concept of“reasonable
suspicion” to include location as well as the individual’s behavior. In Illinois v. Ward-
low (2000), the Supreme Court noted that although an individual’s presence in a “high
crime area” does not meet the standard for a particularized suspicion of criminal activity,
a location’s characteristics are relevant to determining whether a behavior is sufficiently
suspicious to warrant further investigation. Since “high crime areas” often are areas with
concentrations of minority citizens (Massey and Denton, 1993), this logic places minority
neighborhoods at risk for elevating the suspiciousness of their residents.
Early studies on police selection of citizens for stops suggested that both the racial
characteristics of the suspect and the racial composition of the suspect’s neighborhood
influence police decisions to stop, search, or arrest a suspect (Reiss, 1971, Bittner, 1976).
Particularly in urban areas, suspect race interacts with neighborhood characteristics to
animate the formation of suspicion among police officers (Thompson, 1999, Smith et al.,
2006). Alpert et al. (2005) find that police are more likely to view a minority citizen
as suspicious—leading to a police stop—based on non-behavioral cues while relying on
behavioral cues to develop suspicion for white citizens.
But police also may substitute racial characteristics of communities for racial charac-
teristics of individuals in their cognitive schema of suspicion, resulting in elevated stop
rates in neighborhoods with high concentrations of minority populations. For example, in
a study of police practices in three cities, Smith (1986) showed that suspects in poor neigh-
borhoods were more likely to be arrested, in an analysis controlling for suspect behavior
and the type of crime. Suspects’ race and racial composition of the suspect’s neighborhood
were also significant predictors of police response. Coercive police responses may relate to
the perception that poor neighborhoods may have limited capacity for social control and
self-regulation. This strategy was formalized in the influential “Broken Windows” essay of
Wilson and Kelling (1982), who argued that police responses to disorder were critical to
communicate intolerance for crime and to halt its contagious spread. This claim has been
disputed, however (see Harcourt, 1998, 2001, Sampson and Raudenbush, 1999, and Taylor,
2000).
2.2 Approaches to studying data on police stops
Recent empirical evidence on police stops supports perceptions among minority citizens
that police disproportionately stop African American and Hispanic motorists, and that once
stopped, these citizens are more likely to be searched or arrested (Cole, 1999, Veneiro and
5
Zoubeck, 1999, Harris, 1999, Zingraff et al., 2000, Gross and Barnes, 2002). For example,
two surveys with nationwide probability samples, completed in 1999 and in 2002, showed
that African-Americans were far more likely than other Americans to report being stopped
on the highways by police (Langan et al., 2001, Durose et al., 2005). Both surveys showed
that minority drivers also were more likely to report being ticketed, arrested, handcuffed, or
searched by police, and that they more often were threatened with force or had force used
against them. These disparities in stop rates exact high social costs that, according to Loury
(2002), animate culturally meaningful forms of stigma that reinforce racial inequalities,
especially in the practice of law enforcement.
Traffic violations often serve as the rationale or pretext for stops of motorists (Walker,
2001, Harris, 2002), just as “suspicious behavior” is the spark for both pedestrian and traffic
stops (Alpert et al., 2005). As with traffic violations, the range of suspicious behaviors is
broad enough to challenge efforts to identify an appropriate baseline to which to compare
race-specific stop rates (see Miller, 2000, Smith and Alpert, 2002, and Gould and Mastrofski,
2004). Pedestrian stops are at the very core of policing, used to enforce narcotics and
weapons laws, to identify fugitives or other persons for whom warrants may be outstanding,
to investigate reported crimes and “suspicious” behavior, and to improve community quality
of life. For the NYPD, a “stop” intervention provides an occasion for the police to have
contact with persons presumably involved in low-level criminality without having to effect
a formal arrest, and under the lower constitutional standard of “reasonable suspicion”
(Spitzer, 1999). Indeed, because low-level “quality of life” and misdemeanor offenses were
more likely to be committed in the open, the “reasonable suspicion” standard is more easily
satisfied in these sorts of crimes (Rudovsky, 2001).
Two distinct approaches characterize recent efforts to model and understand racial dis-
parities in police stops. Each focuses less on identifying racial bias than on understanding
the role of race in explaining patterns of police behavior. Attributing bias is difficult: causal
claims about discrimination would require far more information than the typical adminis-
trative (observational) datasets can supply. Instead, reliable evidence of ethnic bias would
require experimental designs that control for other factors so as to isolate differences in
outcomes that could only be attributed to race or ethnicity. Such experiments are routinely
used in tests of discrimination in housing and employment (see, for example, Pager, 2003).
But observational studies that lack such controls are often embarrassed by omitted variable
biases: few studies can control for all the variables that police consider in deciding whether
to stop or search someone. Research in situ that relies on direct observation of police be-
6
havior (e.g., Gould and Mastrofski, 2004, Alpert et al., 2005) requires officers to articulate
the reasons for their actions, a task that is vulnerable to numerous validity threats.
The first approach to studying racial disparities bypasses the question of whether police
intend to discriminate on the basis of ethnicity or race, and instead focuses on disparate
impacts of police stop strategies. In this approach, comparisons of “hit rates,” or efficiencies
in the proportion of stops that yield positive results, serve as evidence of disparate impacts
of police stops. This type of analysis was used in several studies, including Ayres (2002a,b)
and Gross and Barnes (2002). This approach bypasses the question of who is stopped
(and for what reason), and instead looks only at disparate impacts or outcomes for different
groups. Outcome tests can show when a particular policy or decision-making outcome has a
disparate impact whose racial disproportionality is not justified by heightened institutional
productivity. In the context of profiling, outcome tests assume that the ex post probability
that a police search will uncover drugs or other contraband is a function of the degree of
probable cause that police use in deciding to stop and search a suspect (Ayres, 2002a). If
searches of minorities are less productive than searches of whites, this could be evidence
that police have a lower threshold of probable cause when searching minorities. At the very
least, it is a sign of differential treatment of minorities that in turn produces a disparate
impact.
Knowles, Persico, and Todd (2001) consider this “hit rate” approach theoretically as well
as empirically in a study finding that, of the drivers on Interstate 95 in Maryland stopped
by police on suspicion of drug trafficking, African Americans were as likely as the whites to
have drugs in their cars. The accompanying theoretical analysis posits a dynamic process
that considers both the behaviors of police and citizens of different races, and integrates
their decisions in an equilibrium where police calibrate their behavior to the probabilities
of detecting illegal behavior, and citizens in different racial groups adjust their propensities
to accommodate the likelihood of detection. They concluded that the search for drugs was
an efficient allocation of police resources, despite the disparate impacts of these stops on
minority citizens (Lamberth, 1997, Ayres, 2002a, Gross and Barnes, 2002). However, this
analysis omits several factors that might bias these claims, such as racial differences in
the attributes that police consider when deciding which motorists to stop, search or arrest
(see, for example, Alpert et al., 2005, Smith, Makarios and Alpert, 2006). Moreover, the
randomizing equilibrium assumptions in the Persico et al. approach—that both police and
potential offenders adjust their behavior in response to the joint probabilities of carrying
contraband and being stopped—tend to average across broad heterogeneous conditions both
7
in police decision making and offenders’ propensities to crime (Dharmapala and Ross, 2004),
and discount the effects of race-specific sensitivities toward crime decisions under varying
conditions of detection risk via police stop (Dominitz and Knowles, 2005). When these two
concerns are addressed, Dharmapala and Ross (2004) identify different types of equilibria
that lead to different conclusions about racial prejudice in police stops and searches.
We perform some analysis of “hit rates” for different ethnic groups stopped by police
in New York City (see Section 5.3 of this article) but for our main analyses (reported in
Sections 5.1 and 5.2) we use a different method and attempt to resolve these supply-side
or omitted-variable problems by controlling for race-specific rates of the targeted behaviors
in patrolled areas, assessing whether stop and search rates exceed what we would predict
from knowledge of the crime rates of different racial groups. This approach indexes stop
behavior to observables about the probability of crime or guilt among different racial groups.
Moreover, by disaggregating data across neighborhoods, our probability estimates explicitly
incorporate the externalities of neighborhood and race that historically have been observed
in policing (Skogan and Frydl, 2004). This approach requires estimates of the supply
of individuals who are engaged in the targeted behaviors (see Miller, 2000, Fagan and
Davies, 2000, Walker, 2001, and Smith and Alpert, 2002). To be sure, a finding that
police are stopping and searching minorities at a higher rate than is justified by their crime
participation does not require that we infer that police engaged in disparate treatment—
but, at a minimum, it is evidence that whatever criteria the police employed produced an
unjustified disparate impact.
Traffic violations often serve as the rationale or pretext for stops of motorists, just as
“suspicious behavior” is the spark for pedestrian stops. As with traffic violations, the range
of suspicious behaviors is broad enough that it is a challenge to identify an appropriate
baseline to which to compare the rate of stops (see Miller, 2000, and Smith and Alpert,
2002). Pedestrian stops are at the very core of policing, used to enforce narcotics and
weapons laws, to identify fugitives or other persons for whom warrants may be outstanding,
to investigate reported crimes and “suspicious” behavior, and to improve community quality
of life. For the NYPD, a “stop” intervention provides an occasion for the police to have
contact with persons presumably involved in low level criminality without having to effect
a formal arrest, and under the lower constitutional standard of “reasonable suspicion”
(Spitzer, 1999). Indeed, because low level “quality of life” and misdemeanor offenses were
more likely to be committed in the open, the “reasonable suspicion” standard was more
easily satisfied in these sorts of crimes (Rudovsky, 2001).
8
3 Data
3.1 “Stop and frisk” in New York City
The New York Police Department has a policy of keeping records on stops (on “UF-250
Forms”), and this information was collated for all stops (about 175,000 in total) from
January, 1998, through March, 1999 (Spitzer, 1999). The police are not required to fill out
the form for every stop. There are certain conditions under which the police are required
to fill out the form, and these “mandated stops” represent 72% of the stops recorded, with
the remaining reports being of stops for which reporting was optional. To address concerns
about possible selection bias in the nonmandated stops, we repeated our analyses for the
mandated stops only, and the results were essentially unchanged.
The UF-250 form has a place for the police officer to record the “Factors Which Caused
Officer to Reasonably Suspect Person Stopped (include information from third persons and
their identity, if known).” We examined a citywide sample of these forms and coded the
reasons for the stops.1 The following examples (from Spitzer, 1999) illustrate the rules that
motivated police decisions to stop suspects, and show the social and behavioral factors that
police apply in the process of forming reasonable suspicion:
“At TPO [time and place of occurrence] male was with person who fit description
of person wanted for GLA [grand larceny auto] in 072 pct. log . . . upon approach
male discarded small coin roller which contained 5 bags of alleged crack.”
“At T/P/O R/O [reporting officer] did observe below named person along w/3
others looking into numerous parked vehicles. R/O did maintain surveillance
on individuals for approx. 20 min. Subjects subsequently stopped to questioned
[sic] w/ neg results.”
“Slashing occurred at Canal street; person fit description; person was running.”
1Data on the rationale for the stop were analyzed for 15,869 of the 125,000 cases analyzed for the study.These data were obtained from a non-random sample of 50% of the cases in eight of the 75 police precincts(a total of 10,869 records), supplemented by a citywide sample of 5,000 records from all precincts (Spitzer,1999: 158). There were several reasons for this strategy. First, the stop rationales were recorded in text form,and the coding procedure was extremely time consuming and complex. Resources did not permit codingof the entire sample of 125,000 stops. Second, the eight precincts were chosen purposively to represent aspectrum both of racial population characteristics, crime problems and stop rates. To the extent possible, theprecincts were paired along these dimensions. The sampling strategy also was guided by power analyses ofthe expected distribution of constitutionally valid stops. While we certainly would have preferred a randomsample of all stops in all precincts, the selection of precincts and cases for this component of the originalstudy was guided by the policy questions in the original study.
9
“Several men getting in and out of a vehicle several times.”
“Def. Did have on a large bubble coat with a bulge in right pocket.”
“Person stopped did stop [sic] walking and reverse direction upon seeing police.
Attempted to enter store as police approached; Frisked for safety.”
Based on Federal and state law, some of these reasons for stopping a person are consti-
tutional and some are not. For example, courts have ruled that a bulge in the pocket is not
enough reason for the police to stop a person without his or her consent (People v. DeBour,
1976, People v. Holmes, 1996), and that walking away from the police is not a sufficient
reason to stop and frisk a person (Brown v. Texas, 1979, but see Illinois v. Wardlow, 2000).
However, if the police observe illegal activity, weapons (including “waistband bulges”), a
person who fits a description, or suspicious behavior in a crime area, then stops and frisks
have been ruled constitutional (Spitzer, 1999).
The New York State Attorney General’s office used rules such as these to characterize
the rationales for 61% of the stops in the sample as articulating a “reasonable suspicion”
that would justify a lawful stop, 15% of the stops as not articulating a reasonable suspicion,
and 24% as giving insufficient information to decide. For the controversial Street Crimes
Unit, 23% of stops were judged to not articulate a reasonable suspicion. (There was no
strong pattern by ethnicity here: the rate of stops judged to be unreasonable were about
the same for all ethnic groups.) The stops judged to be without “reasonable suspicion”
indeed seemed to be weaker, in that only 1 in 29 of these stops led to arrests, as compared
to 1 in 7 of the stops with reasonable suspicion.
3.2 Aggregate rates of stops for each ethnic group
With this as background, we analyze the entire stop-and-frisk dataset to see to what ex-
tent different ethnic groups were stopped by the police. We focus on blacks (African-
Americans), hispanics (Latinos), and whites (European-Americans). The ethnic categories
are as recorded by the police making the stops. We exclude members of other ethnic groups
(about 4% of the stops) because of the likelihood of ambiguities in classifications. (With
such a low frequency of “other,” even a small rate of misclassifications could cause large
distortions in the estimates for that group. For example, if only 4% of blacks, hispanics, and
whites were mistakenly labeled as “other,” then this would nearly double the estimates for
the “other” category while having very little effects on the three major groups. (See Hemen-
way, 1997, for an extended discussion of the problems that misclassifications can cause in
10
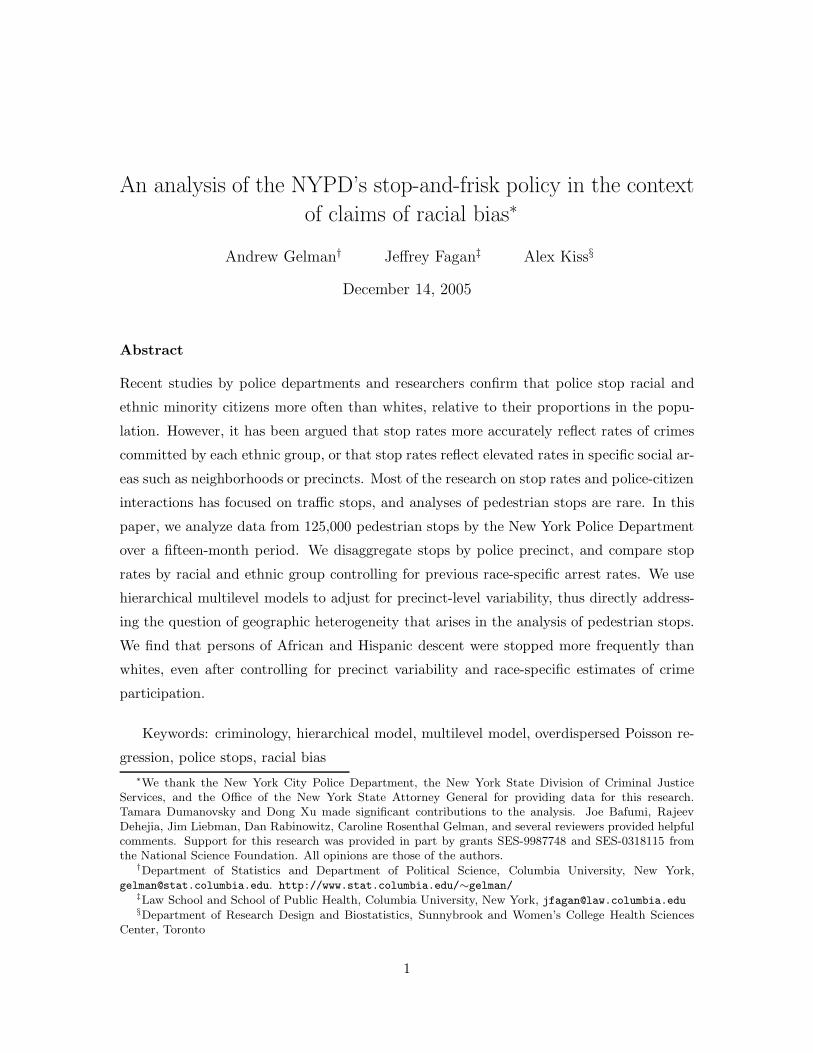
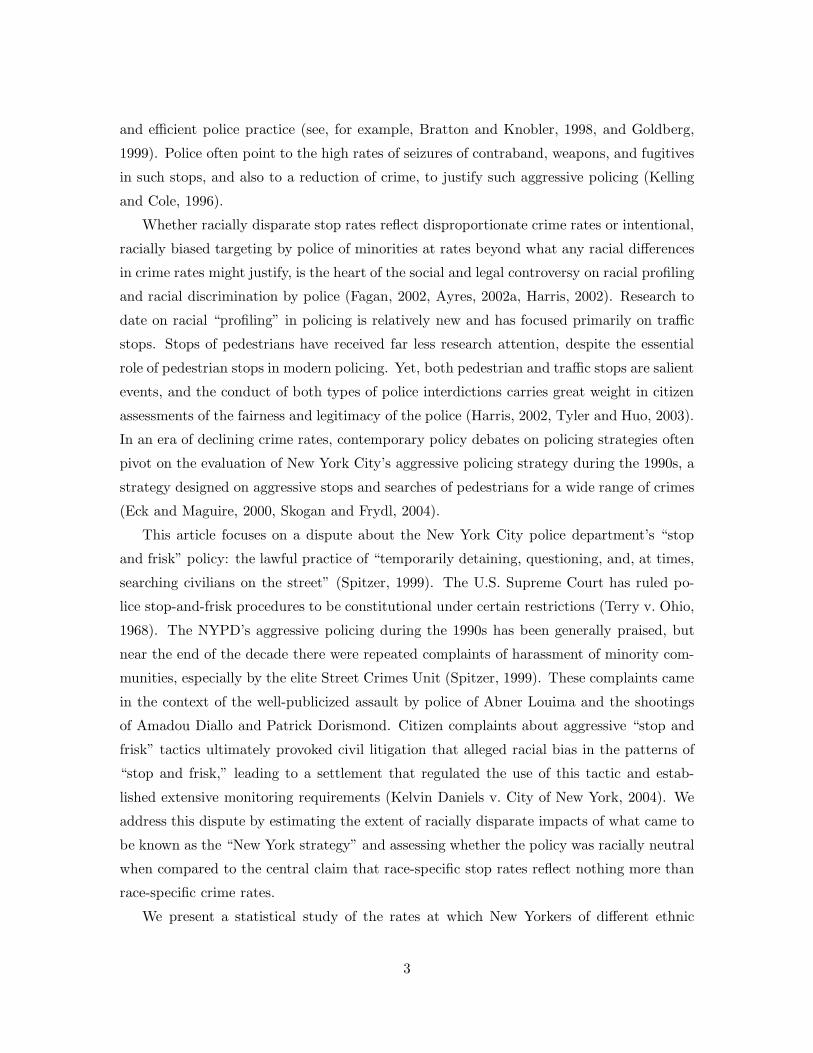
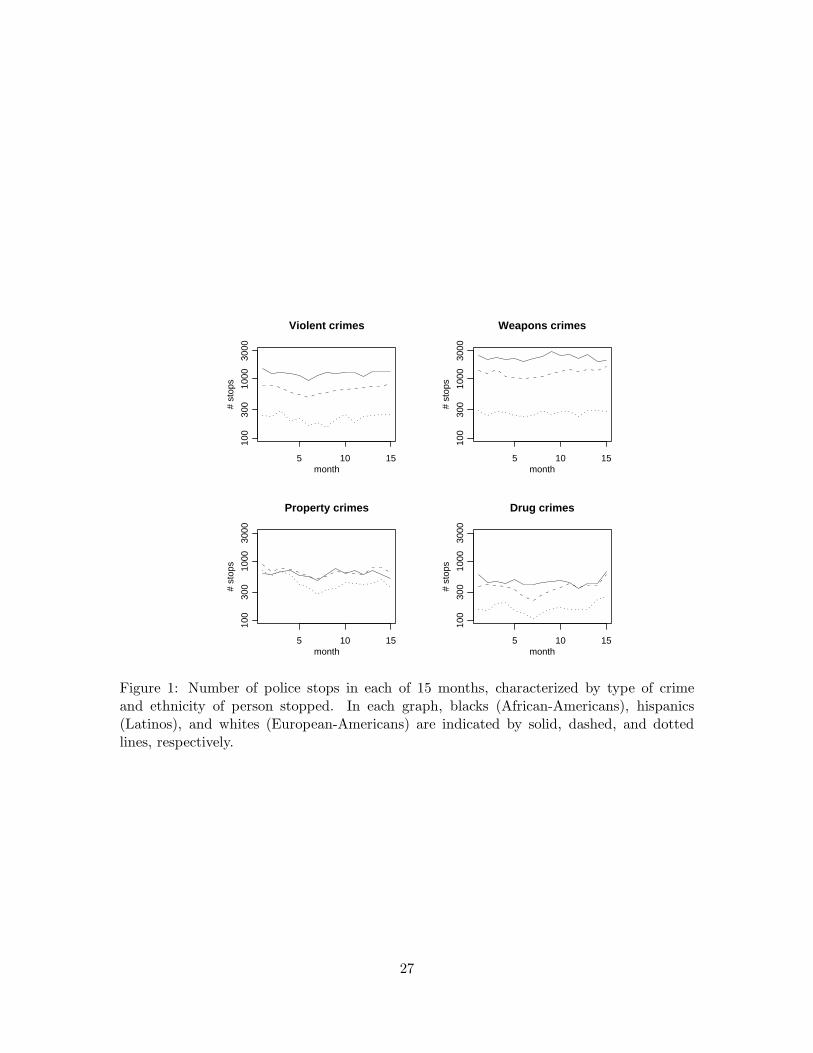
estimates of a small fraction of the population.) To give a sense of the data, we display
in Figure 1 the number of stops for blacks, hispanics, and whites over the fifteen-month
period, separately showing stops associated with each of four types of offenses (“suspected
charges” as characterized on the UF-250 form): violent crimes, weapons offenses, property
crimes, and drug crimes.
In total, blacks and hispanics represented 51% and 33% of the stops, respectively, despite
comprising only 26% and 24%, respectively, of the population of the city based on the 1990
Census.2
Perhaps a more relevant comparison, however, is to the number of crimes committed
by members of each ethnic group. For example, then-New York City Police Commissioner
Howard Safir stated (Safir, 1999),
“The racial/ethnic distribution of the subjects of ‘stop’ and frisk reports reflects
the demographics of known violent crime suspects as reported by crime victims.
Similarly, the demographics of arrestees in violent crimes also correspond with
the demographics of known violent crime suspects.”
Data on actual crimes are not available, of course, so as a proxy we use the number
of arrests within New York City in the previous year, 1997, as recorded by the Division
of Criminal Justice Services (DCJS) of New York State, as categorized by ethnic group
and crime type. These were deemed to be the best available measure of local crime rates
categorized by ethnicity, and they directly address concerns such as Safir’s that stop rates be
related to the ethnicicy of crime suspects. We use the previous year’s DCJS arrest rates to
represent the frequency of crimes that the police might suspect were committed by members
of each ethnic group. When compared in that way, the ratio of stops to DCJS arrests was
1.24 for whites, 1.54 for blacks, and 1.72 for hispanics: based on this comparison, blacks
are stopped 23% and hispanics 39% more often than whites.
2The population proportions change little if we use 1998 population estimates and count only males aged15–30, which is arguably a more reasonable baseline. For one of the supplementary analyses in this article,we also use the population for each ethnic group within each precinct in the city. Population estimates forthe police precincts with low residential populations but high daytime populations—due to commercial andbusiness activity—were adjusted using the U.S. Census Bureau “journey file,” provided by the New YorkCity Department of City Planning (see Spitzer, 1999, Appendix I, Appendix Table 1.A.1a). The journeyfile uses algorithms based on time traveled to work and the distribution of job classifications to estimate theday and night populations of census tracts. Tracts were aggregated to their corresponding police precinct toconstruct day and night population estimates, and separate stop estimates were computed for day and nighttime intervals. For these analyses, we aggregated separate estimates of stops by day and night to computetotal stop rates for each precinct.
11
4 Models
The summaries so far describe average rates for the whole city. Suppose the police make
more stops in high-crime areas but treat the different ethnic groups equally within any
locality. Then the citywide ratios could show strong differences between ethnic groups even
if stops are entirely determined by location rather than ethnicity. In order to separate these
two kinds of predictors, we perform multilevel analyses using the city’s 75 precincts. Allow-
ing precinct-level effects is consistent with theories of policing such as “broken windows”
that emphasize local, neighborhood-level strategies (Wilson and Kelling, 1982, Skogan,
1990). Because it is possible that the patterns are systematically different in neighborhoods
with different ethnic compositions, we divide the precincts into three categories in terms of
their black population: precincts that were less than 10% black, 10%–40% black, and over
40% black. We also account for variation in stop rates between the precincts within each
group. Each of the three categories represents roughly 1/3 of the precincts in the city, and
we perform separate analyses for each set.
4.1 Hierarchical Poisson regression model
For each ethnic group e = 1, 2, 3 and precinct p, we model the number of stops yep using
an overdispersed Poisson regression with indicators for ethnic groups, a hierarchical model
for data within precincts, and using nep, the number of DCJS arrests for that ethnic group
in that precinct (multiplied by 15/12 to scale to a fifteen-month period), as a baseline or
offset:
yep ∼ Poisson(
15
12nepe
µ+αe+βp+εep
)
βp ∼ N(0, σ2β)
εep ∼ N(0, σ2ε ), (1)
where the coefficients αe (which we constrain to sum to 0) control for ethnic groups, the βp’s
adjust for variation among precincts, and the εep’s allow for overdispersion. Of most interest
are the exponentiated coefficients exp(αe), which represent relative rates of stops compared
to arrests, after controlling for precinct. The parameter σβ represents variation in the rates
of stops among precincts, and σε represents variation in the data beyond that explained by
the Poisson model. To the extent that σε is estimated to be greater than 0, this is evidence
of overdispersion (McCullagh and Nelder, 1989). We fit the model using Bayesian inference
with a noninformative uniform prior distribution on the parameters µ, α, σβ , σε.
12
By comparing stop rates to arrest rates, we can also separately analyze stops associated
with different sorts of crimes. We do separate comparisons for violent crimes, weapons
offenses, property crimes, and drug crimes. For each, we model the number of stops yep
by ethnic group e and precinct p for that crime type, using as a baseline the DCJS arrest
count nep for that ethnic group, precinct, and crime type. (The subsetting by crime type is
implicit in this notation; to keep notation simple we do not introduce an additional subscript
for the four categories of crime.)
We thus estimate the model (1) for twelve separate subsets of the data, corresponding to
the four crime types and the three categories of precincts (less than 10% black population,
10–40% black, and over 40% black). The computations can be easily performed using the
Bayesian software Bugs (Spiegelhalter et al., 1994, 2003), which implements Markov chain
Monte Carlo simulation, as called from R (R Project, 2000, Gelman, 2003). For each fit, we
simulate three several independent Markov chains from different starting points, stopping
when the simulations from each chain alone are as variable as the simulations of all the chains
mixed together (Gelman and Rubin, 1992). We then gather the last half of the simulated
sequences, which can be used to compute posterior estimates and standard errors. For the
analyses reported in this article, 10,000 iterations were always sufficient for mixing of the
sequences. We report inferences using posterior means and standard deviations, which are
reasonable summaries given the large sample size (see, e.g., Gelman et al., 2003, chapter 4).
4.2 Alternative model specifications
In addition to fitting model (1) as described above, we consider two forms of alternative
specifications, first fitting the same model but changing the batching of precincts, and
second altering the role played in the model by the previous year’s arrests. We compare the
fits under these alternative models to assess the sensitivity of our findings to the details of
model specification.
Modeling variability across precincts
The batching of precincts into three categories is convenient and makes sense—neighbor-
hoods with different levels of minority populations differ in many ways, including policing
strategies applied to each type (Fagan and Davies, 2000). Thus, fitting the model separately
to each group of precincts is a way to include contextual effects. However, there is an
arbitrariness to the division. We explore this by partitioning the precincts into different
numbers of categories and seeing how the model estimates change.
13
Another approach to controlling for systematic variation among precincts is to include
precinct-level predictors, which can be included along with the individual precinct-level
effects in the multilevel model (see, e.g., Raudenbush and Bryk, 2000). As discussed earlier,
the precinct-level information that is of greatest interest, and also that has greatest potential
to affect our results, is the ethnic breakdown of the population. Thus we consider as
regression predictors the proportion black and hispanic in the precinct, replacing model (1)
by,
yep ∼ Poisson(
15
12nepe
µ+αe+ζ1z1p+ζ2z2p+βp+εep
)
, (2)
where z1p and z2p represent the proportion of the population in precinct p that are black
and hispanic, respectively. We also consider variants of model (2) including the quadratic
terms, z21p, z2
2p, and z1pz2p, to examine sensitivity to nonlinearity.
Modeling the relation of stops to previous year’s arrests
We also consider different ways of using the number of DCJS arrests nep in the previous
year, which plays the role of a baseline (or offset, in generalized linear models terminology)
in model (1). Including the past arrest rate as an offset makes sense since we are interested
in the rate of stops per crime, and we are using past arrests as a proxy for crime rate and
for police expectations about demographics of perpetrators. However, another option is to
include the logarithm of the number of past arrests as a linear predictor instead:
yep ∼ Poisson(
15
12eγ log nep+µ+αe+βp+εep
)
. (3)
Model (3) reduces to the offset-model (1) if γ = 1. We can thus fit (3) and see if the
inferences for αe change compared to the earlier model that implicitly fixes γ to 1.
We can take this idea further by modeling past arrests as a proxy rather than the actual
crime rate. We try this in two ways, for each labeling the true crime rate for each ethnicity
in each precinct as θep, with separate hierarchical Poisson regressions for this year’s stops
and last year’s arrests (as always, including the factor 1512
to account for our 15 months of
stop data). In the first formulation, we model last year’s arrests as Poisson distributed with
mean θ:
yep ∼ Poisson(
15
12θepe
µ+αe+βp+εep
)
nep ∼ Poisson(θep)
log θep = log Nep + α̃e + β̃p + ε̃ep. (4)
14
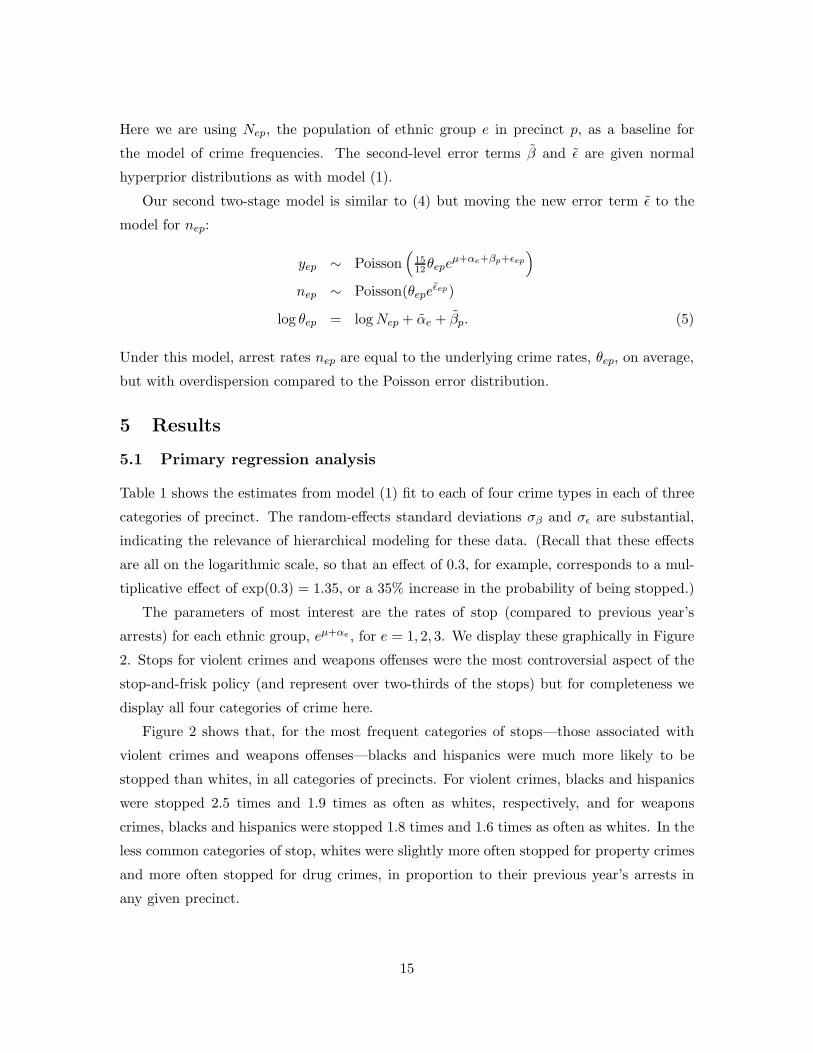
Here we are using Nep, the population of ethnic group e in precinct p, as a baseline for
the model of crime frequencies. The second-level error terms β̃ and ε̃ are given normal
hyperprior distributions as with model (1).
Our second two-stage model is similar to (4) but moving the new error term ε̃ to the
model for nep:
yep ∼ Poisson(
15
12θepe
µ+αe+βp+εep
)
nep ∼ Poisson(θepeε̃ep)
log θep = log Nep + α̃e + β̃p. (5)
Under this model, arrest rates nep are equal to the underlying crime rates, θep, on average,
but with overdispersion compared to the Poisson error distribution.
5 Results
5.1 Primary regression analysis
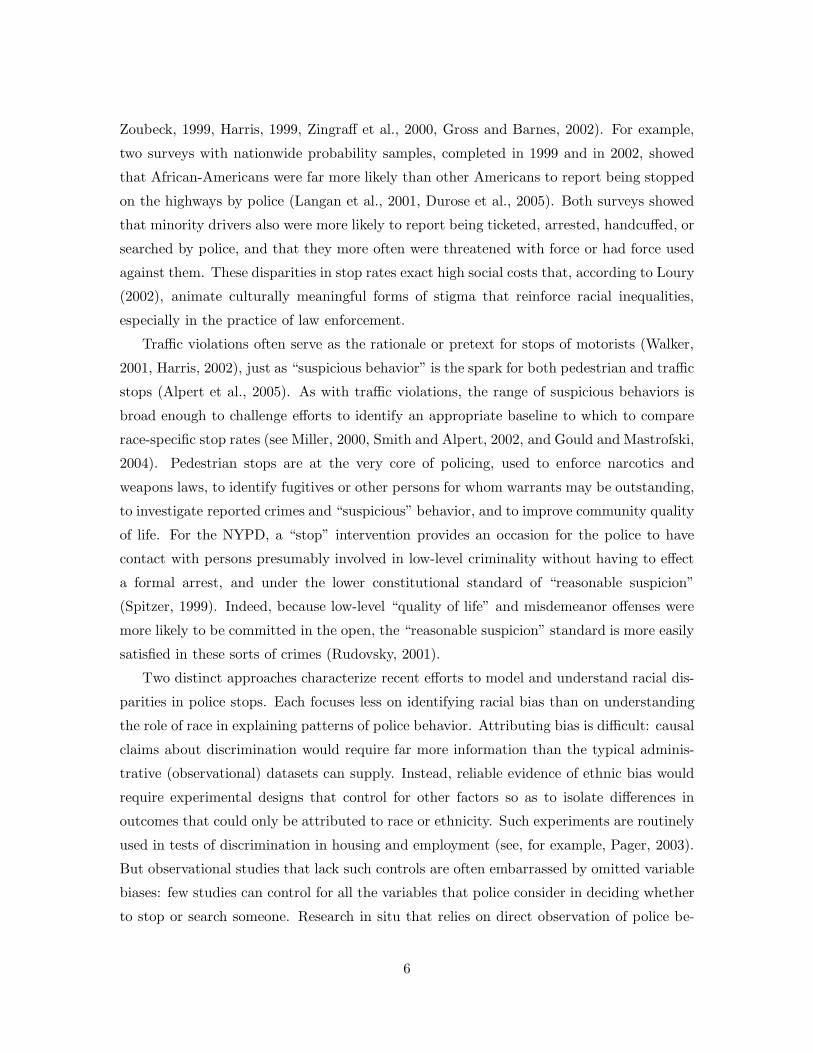
Table 1 shows the estimates from model (1) fit to each of four crime types in each of three
categories of precinct. The random-effects standard deviations σβ and σε are substantial,
indicating the relevance of hierarchical modeling for these data. (Recall that these effects
are all on the logarithmic scale, so that an effect of 0.3, for example, corresponds to a mul-
tiplicative effect of exp(0.3) = 1.35, or a 35% increase in the probability of being stopped.)
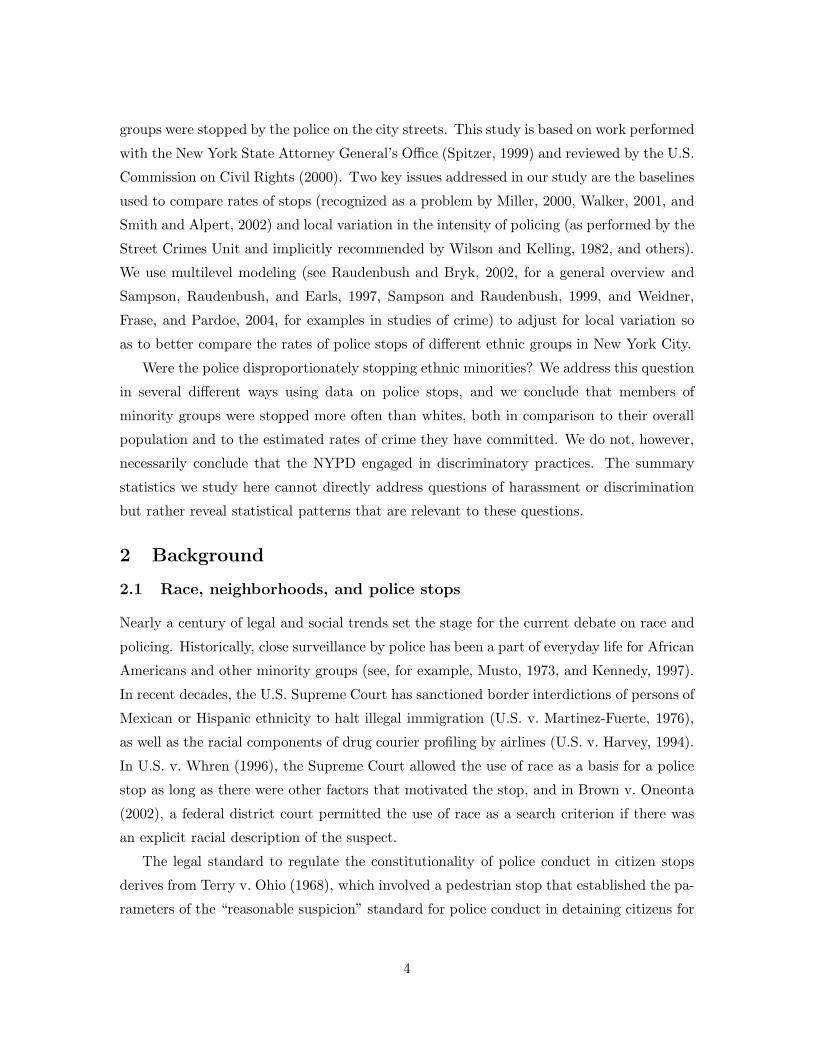
The parameters of most interest are the rates of stop (compared to previous year’s
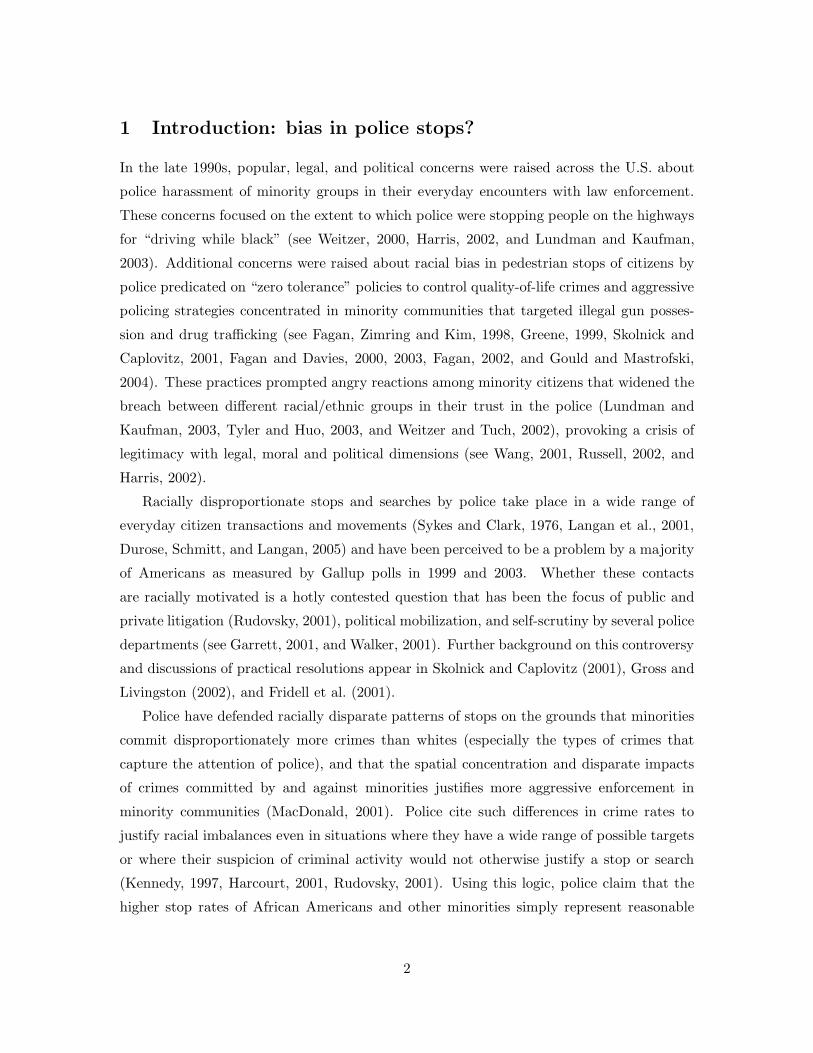
arrests) for each ethnic group, eµ+αe , for e = 1, 2, 3. We display these graphically in Figure
2. Stops for violent crimes and weapons offenses were the most controversial aspect of the
stop-and-frisk policy (and represent over two-thirds of the stops) but for completeness we
display all four categories of crime here.
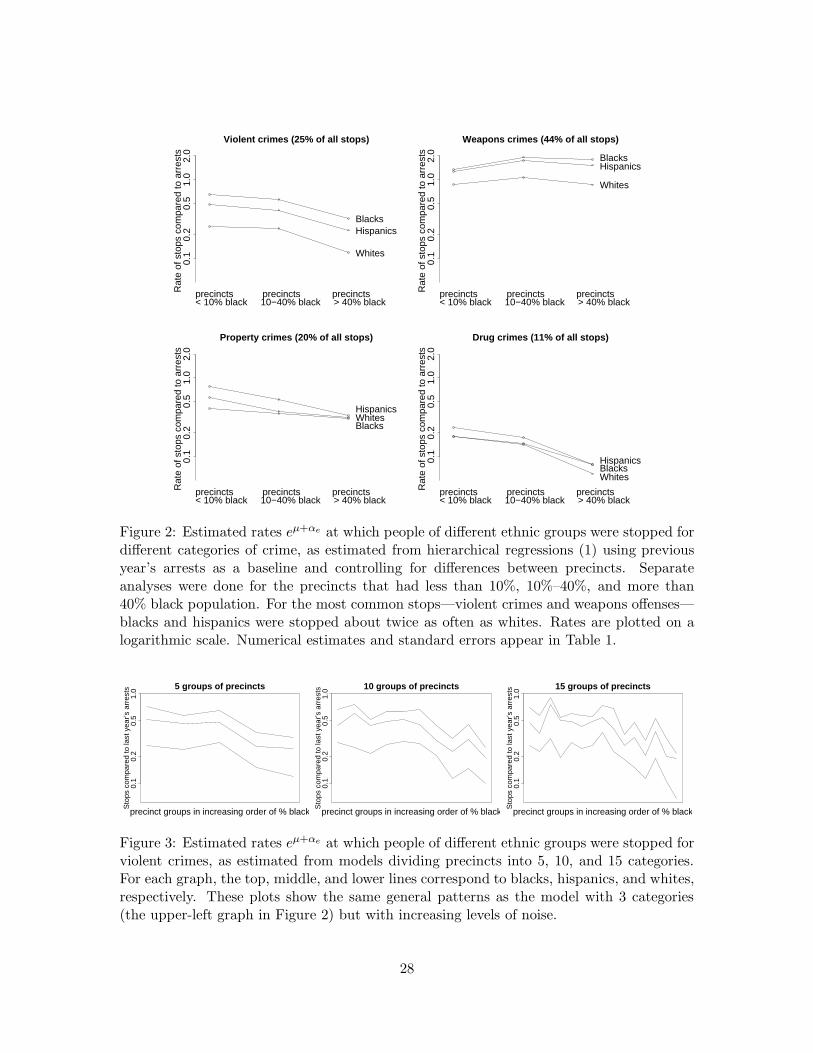
Figure 2 shows that, for the most frequent categories of stops—those associated with
violent crimes and weapons offenses—blacks and hispanics were much more likely to be
stopped than whites, in all categories of precincts. For violent crimes, blacks and hispanics
were stopped 2.5 times and 1.9 times as often as whites, respectively, and for weapons
crimes, blacks and hispanics were stopped 1.8 times and 1.6 times as often as whites. In the
less common categories of stop, whites were slightly more often stopped for property crimes
and more often stopped for drug crimes, in proportion to their previous year’s arrests in
any given precinct.
15
5.2 Alternative forms of the model
Fitting the alternative models described in Section 4.2 yielded similar results to our main
analysis. We discuss each alternative model in turn.
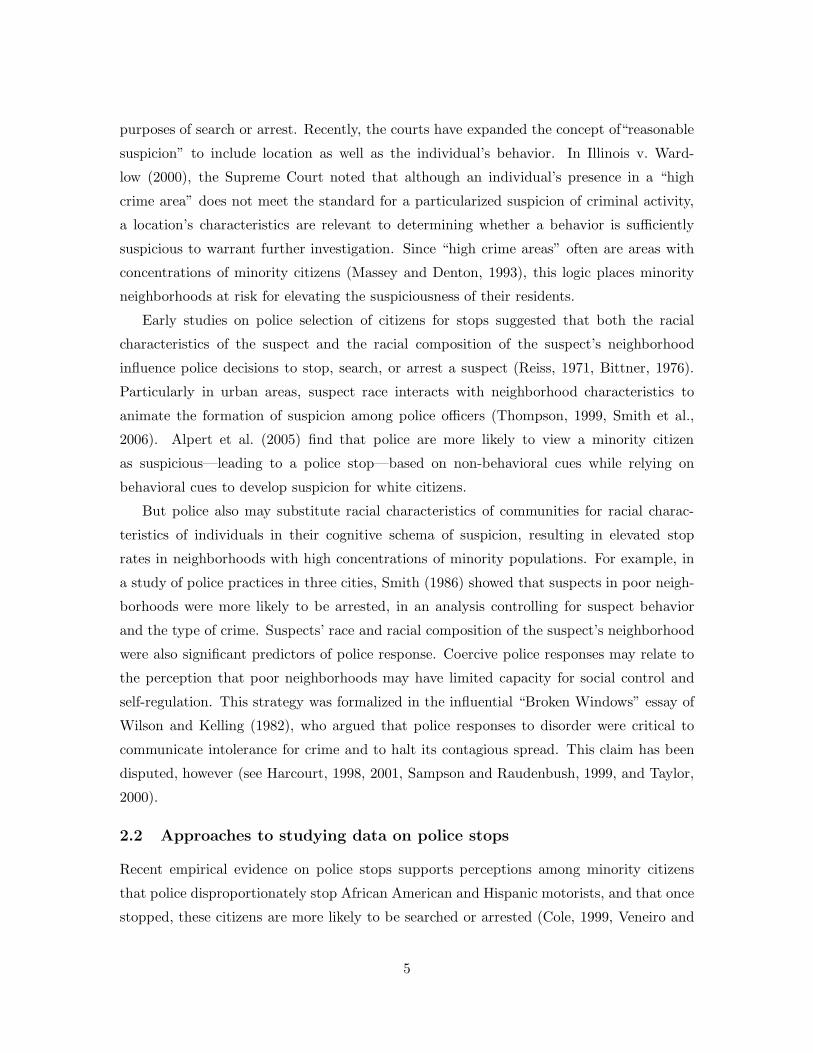
Figure 3 displays the estimated rates of stops for violent crimes, compared to the previous
year’s arrests, for each of the three ethnic groups, for analyses dividing the precincts into
5, 10, and 15 categories ordered by percent black population in precinct. For simplicity, we
only give results for violent crimes; these are typical of the alternative analyses for all four
crime types. For each of the three graphs in Figure 3, the model was separately estimated
for each of the three groups of precincts, and these estimates are connected in a line for
each ethnic group. Compared to the upper-left plot in Figure 2, which shows the results
from dividing the precincts into three categories, we see that dividing into more groups adds
noise to the estimation but does not change the overall pattern of differences between the
groups.
Table 2 shows the results from model (2), which is fit to all 75 precincts but controls
for the proportion black and proportion hispanic in precincts. The inferences are similar to
those obtained from the main analysis discussed in Section 5.1. Including quadratic terms
and interactions in the precinct-level model (2), and including the precinct-level predictors
in the models fit to each of the three subsets of the data, similarly had little effect on the
parameters of interest, αe.
Table 3 displays parameter estimates from the models that differently incorporate the
previous year’s arrest rates nep. For conciseness we display results for violent crimes only,
and for simplicity we include all 75 precincts in the models. (Similar results are obtained
when fitting the model separately in each of three categories of precincts, and for the other
crime types.) The first two columns of Table 3 shows the result from our main model (1)
and the alternative model (3), which includes log nep as a regression predictor. The two
models differ only in that the first restricts γ to be 1, but as we can see, γ is estimated very
close to 1 in the regression formulation, and the coefficients αe are essentially unchanged.
(The intercept changes a bit because log nep does not have a mean of 0.)
The last two columns in Table 3 show the estimates from the two-stage regression models
(4) and (5). The models differ in their estimates of the variance parameters σβ and σε, but
the estimates of the key parameters αe are essentially the same in the original model.
We also performed analyses including indicators for the month of arrest. These analyses
did not add anything informative to the comparison of ethnic groups.
16
5.3 Hit rates: proportions of stops that led to arrests
A different way to compare ethnic groups is to look at the fraction of stops on the street
that lead to arrests. Most stops do not lead to arrests, and most arrests do not come from
stops. In the analysis described above, we studied the rate at which the police stopped
people of different groups. Now we look briefly at what happens with these stops.
In the period for which we have data, 1 in 7.9 whites stopped were arrested, as compared
to approximately 1 in 8.8 hispanics and 1 in 9.5 blacks. These data are consistent with our
general conclusion that the police are disproportionately stopping minorities: the stops of
whites are more “efficient” and are more likely to lead to arrests, whereas for blacks and
hispanics, the police are stopping more indiscriminately, and fewer of the people stopped in
these broader sweeps are actually arrested. It is perfectly reasonable for the police to make
many stops that do not lead to arrests; the issue here is the comparison between ethnic
groups.
This can also be understood in terms of simple economic theory (following the reasoning
of Persico, Knowles, and Todd, 2001, for police stops for suspected drugs). It is reasonable
to suppose a diminishing return for stops in the sense that, at some point, little benefit will
be gained by stopping additional people. If the gain is approximately summarized by arrests,
then diminishing returns mean that the probability that a stop will lead to an arrest—in
economic terms, the marginal gain from stopping one more person—will decrease as the
number of people stopped increases. The stops of blacks and hispanics were less “efficient”
than those of whites, suggesting that the police have been using less rigorous standards when
stopping members of minority groups. We found similar results when separately analyzing
daytime and nighttime stops.
However, this “hit rate” analysis can be criticized as unfair to the police, who are
“damned if they do, damned if they don’t”: relatively few of the stops of minorities led to
arrests, and thus we conclude that police were more willing to stop minority group members
with less reason. But we could also make the argument the other way around: a relatively
high rate of whites stopped were arrested, so we could conclude that the police are biased
against whites in the sense of arresting them too often. Analyses that examined the validity
of arrests by race—that is, the proportion of arrests that lead to convictions–would help to
clarify this question. Unfortunately, such data are not readily available. We do not believe
this latter interpretation, but it is hard to rule it out from these data alone.
That is why we consider this part of the study to be only supporting evidence. Our main
analysis found that blacks and hispanics were stopped disproportionately often (compared
17
to their population or their crime rate, as measured by their rate of valid arrests in the
previous year), and the secondary analysis of the hit rates or “arrest efficiency” of these
stops is consistent with that finding.
6 Discussion and conclusions
In the period for which we had data, the NYPD’s records indicate that they were stopping
blacks and hispanics more often than whites, both in comparison to the populations of
these groups and to the best estimates of the rate of crimes committed by each group.
After controlling for precincts, the pattern still holds. More specifically, for violent crimes
and weapons offenses, blacks and hispanics are stopped about twice as often as whites. In
contrast, for the less common stops for property and drug crimes, whites and hispanics are
more often stopped than blacks, in comparison to the arrest rate for each ethnic group.
A related piece of evidence is that stops of blacks and hispanics were less likely than those
of whites to lead to arrest, which suggests that the standards were more relaxed for stopping
minority group members. Two different scenarios might explain the lower “hit rates” for
non-whites, one which suggests targeting of minorities while another suggests dynamics
of racial stereotyping and a more passive form of racial preference. In the first scenario,
police possibly used wider discretion and more relaxed constitutional standards in deciding
to stop minority citizens. This explanation would conform to the scenario of “pretextual”
stops discussed in several recent studies of motor vehicle stops (for example, Lundman
and Kaufman, 2003), and suggests that higher stops rates were intentional and purposive.
Alternatively, police could also simply more often form the perception of “suspicion” based
on a broader interpretation of the social cues that capture police attention and evoke official
reactions (Alpert et al., 2005). The latter conforms more closely to a social psychological
process of racial stereotyping where the attribution of suspicion is more readily attached to
specific behaviors and contexts for minorities than it might be for whites (Thompson, 1999,
Richardson and Pittinski, 2005).
We did find evidence of stops that are best explained as “racial incongruity” stops:
high rates of minority stops in predominantly white precincts. Indeed, being “out of place”
often is one of the triggers for suspicion (Alpert et al., 2005; Gould and Mastrofski, 2004).
Racial incongruity stops are most prominent in racially homogeneous areas. For example,
we observed high stop rates of African Americans in the predominantly white 19th precinct,
a sign of race-based selection of citizens for police interdiction. We also observed high stop
rates for whites in several precincts in the Bronx, especially for drug crimes, most likely
18
evidence that white drug buyers were entering predominantly minority neighborhoods where
street drug markets were common. Overall, though, these were relatively infrequent events
that produced misleading stop rates due to the population skew in such precincts.
To quickly summarize our findings: blacks and hispanics represented 51% and 33% of
the stops although representing only 26% and 24% of the New York City population. In
comparison to the number of arrests of each group in the previous year (used as a proxy
for the rate of criminal behavior), blacks were stopped 23% and hispanics 39% more often
than whites. Controlling for precinct actually increased these discrepancies, with minorities
between 1.5 and 2.5 times as often as whites (compared to the groups’ previous arrest
rates in the precincts where they were stopped) for the most common categories of stops
(violent crimes and drug crimes), with smaller differences for property and drug crimes.
The differences in stop rates among ethnic groups are real, they are substantial, and they
are not explained by previous arrest rates or precincts.
Our findings do not necessarily imply the NYPD was acting in an unfair or racist manner,
however. It is quite reasonable to suppose that effective policing requires many people to
be stopped and questioned in order to gather information about any given crime.
In the context of some difficult relations between the police and ethnic minority com-
munities in New York City, it is useful to have some quantitative sense of the issues under
dispute. Given that there have been complaints about the frequency with which the police
have been stopping blacks and hispanics, it is relevant to know that this is indeed a statis-
tical pattern. The police department then has the opportunity to explain their policies to
the affected communities.
In the years since this study was conducted, an extensive monitoring system was put
into place that would accomplish two goals. First, procedures were developed and imple-
mented that permitted monitoring of officers’ compliance with the mandates of the NYPD
Patrol Guide for accurate and comprehensive recording of all police stops. Second, the new
forms were entered into databases that would permit continuous monitoring of the racial
proportionality of stops and their outcomes (frisks, arrests). When coupled with accurate
reporting on race-specific measures of crime and arrest, the new procedures and monitoring
requirements will ensure that inquiries similar to this study can be institutionalized as part
of a framework of accountability mechanisms.
References
Alpert, G., MacDonald, J. H., and Dunham, R. G. (2005). Police suspicion and discre-
19
tionary decision making during citizen stops. Criminology 43, 407–434.
Ayres, I. (2002a). Outcome tests of racial disparities in police practices. Justice Research
and Policy 4, 131–142.
Ayres, I. (2002b). Pervasive Prejudice: Unconventional Evidence of Race and Gender
Discrimination. Chicago: University of Chicago Press.
Bratton, W., and Knobler, P. (1998). Turnaround. New York: Norton.
Brown v. Texas (1979). 443 U.S. 43. U.S. Supreme Court.
Brown v. Oneonta (2000). 221 F.3d 329 (2nd Cir.).
Cole, D. (1999). No Equal Justice: Race and Class in the Criminal Justice System. New
York: New Press.
Kelvin Daniels et al. v. City of New York, et al. (2004). Stipulation of Settlement, 99 Civ
1695 (SAS). Ordered January 9, 2004, filed January 13, 2004.
Dharmapala, D., and Ross, S. L. (2004). Racial bias in motor vehicle searches: additional
theory and evidence. Contributions to Economic Policy and Analysis 3 (1), article 12.
www.bepress.com/bejeap/contributions/vol13/iss1/art12
Dominitz, J., and Knowles, J. (2005). Crime minimization and racial bias: what can we
learn from police search data? PIER Working Paper Archive 05-019, Penn Institute for
Economic Research, Department of Economics, University of Pennsylvania.
Durose, M. R., Schmitt, E. L., and Langan, P. A. (2005). Contacts between police and
the public: findings from the 2002 national survey. NCJ 207845, Bureau of Justice
Statistics, U.S. Department of Justice.
Eck, J., and Maguire, E. (2000). Have changes in policing reduced violent crime? In The
Crime Drop in America, ed. A. Blumstein and J. Wallman.
Fagan, J. (2002). Law, social science and racial profiling. Justice, Research and Policy 4,
104–129.
Fagan, J., and Davies, G. (2000). Street stops and broken windows: Terry, race, and
disorder in New York City. Fordham Urban Law Journal 28, 457–504.
Fagan, J., and Davies, G. (2003). Policing guns: order maintenance and crime control in
New York. In Guns, Crime, and Punishment in America, ed. B. Harcourt. New York
University Press.
Fagan, J., Zimring, F. E., and Kim, J. (1998). Declining homicide in New York: a tale of
two trends. Journal of Criminal Law and Criminology 88, 1277–1324.
20
Fridell, L., Lunney, R., Diamond, D., Kubu, B., Scott, M., and Laing, C. (2001). Racially
biased policing: a principled response. Washington, D.C.: Police Executive Research
Forum. www.policeforum.org/racial.html.
Garrett, B. (2001). Remedying racial profiling through partnership, statistics, and reflective
policing. Columbia Human Rights Law Review 33, 41–148.
Gelman, A. (2003). Bugs.R: functions for calling Bugs from R.
www.stat.columbia.edu/∼gelman/bugsR/
Gelman, A., Carlin, J. B., Stern, H. S., and Rubin, D. B. (2003). Bayesian Data Analysis,
second edition. London: Chapman and Hall.
Gelman, A., and Rubin, D. B. (1992). Inference from iterative simulation using multiple
sequences (with discussion). Statistical Science 7, 457–511.
Goldberg, J. (1999). The color of suspicion. New York Times Magazine, June 20.
Gould, J., and Mastrofski, S. (2004). Suspect searches: assess police behavior under the
U.S. constitution. Criminology and Public Policy 3, 315–361.
Greene, J. (1999). Zero tolerance: a case study of police policies and practices in New York
City. Crime and Delinquency 45, 171–199.
Gross, S. R., and Barnes, K. Y. (2002). Road work: racial profiling and drug interdiction
on the highway. Michigan Law Review 101, 653–754.
Gross, S. R., and Livingston, D. (2002). Racial profiling under attack. Columbia Law
Review 102, 1413–1438.
Harcourt, B. E. (1998). Reflecting on the subject: a critique of the social influence con-
ception of deterrence, the broken windows theory, and order-maintenance policing New
York style. Michigan Law Review 97, 291.
Harcourt, B. E. (2001). Illusion of Order: The False Promise of Broken Windows Policing.
Cambridge Mass.: Harvard University Press.
Harris, D. A. (1999). The stories, the statistics, and the law: why “driving while black”
matters. Minnesota Law Review 84, 265–326.
Harris, D. A. (2002). Profiles in Injustice: Why Racial Profiling Cannot Work. New York:
New Press.
Hemenway, D. (1997). The myth of millions of annual self-defense gun uses: a case study
of survey overestimates of rare events. Chance 10 (3), 6–10.
Illinois v. Wardlow. 528 U.S. 119. U.S. Supreme Court.
21
Kelling, G., and Cole, C. (1996). Fixing Broken Windows. New York: Free Press.
Kennedy, R. (1997). Race, Crime and Law. Cambridge, Mass.: Harvard University Press.
Knowles, J., Persico, N., and Todd, P. (2001). Racial bias in motor-vehicle searches: theory
and evidence. Journal of Political Economy 109, 203–229.
Lamberth, J. (1997). Report of John Lamberth, Ph.D. American Civil Liberties Union.
www.aclu.org/court/lamberth.html.
Langan, P., Greenfeld, L. A., Smith, S. K., Durose, M. R., and Levin, D. J. (2001). Contacts
between police and the public: findings from the 1999 national survey. NCJ 184957,
Bureau of Justice Statistics, U.S. Department of Justice.
Loury, G. (2002). The Anatomy of Racial Inequality. Cambridge, Mass.: Harvard University
Press.
Lundman, R. J., and Kaufman, R. L. (2003). Driving while black: effects of race, ethnicity,
and gender on citizen self-reports of traffic stops and police actions. Criminology 41,
195–220.
MacDonald, H. (2001). The myth of racial profiling. City Journal 11, 2–5.
Massey, D., and Denton, N. (1993). American Apartheid: Segregation and the Making of
the Underclass. Cambridge, Mass.: Harvard University Press.
McCullagh, P., and Nelder, J. A. (1989). Generalized Linear Models, second edition. New
York: Chapman and Hall.
Miller, J. (2000). Profiling populations available for stops and searches. Police Research
Series Paper No. 121, Home Office Research, Development and Statistics Directorate,
United Kingdom.
Musto, D. (1973). The American Disease. New Haven, Conn.: Yale University Press.
Pager, D. (2003). The mark of a criminal record. American Journal of Sociology 108,
937–975.
People v. DeBour (1976). 40 N.Y.2d 210, 386 N.Y.S.2d 375.
People v. Holmes (1996). 89 N.Y.2d 838, 652 N.Y.S.2d 725.
Reiss, A. (1971). The Police and the Public. New Haven: Yale Univ. Press.
R Project (2000). The R project for statistical computing. www.r-project.org
Raudenbush, S. W., and Bryk, A. S. (2002). Hierarchical Linear Models, second edition.
Thousand Oaks, Calif.: Sage.
Richardson, M., and Pittinsky, T. L. (2005). The mistaken assumption of intentionality in
22
equal protection law: psychological science and the the interpretation of the Fourteenth
Amendment. KSG Working Paper RWP05-011. ssrn.com/abstract=722647
Rudovsky, D. (2001). Law enforcement by stereotypes and serendipity: racial profiling and
stops and searches without cause. University of Pennsylvania Journal of Constitutional
Law 3, 296–366.
Russell, K. K. (2002). Racial profiling: a status report of the legal, legislative, and empirical
literature. Rutgers Race and the Law Review 3, 61–81.
Safir, H. (1999). Statement before the New York City Council Public Safety Commission,
April 19. Cited in Spitzer (1999).
Sampson, R. J., and Raudenbush, S. W. (1999). Systematic social observation of public
spaces: a new look at disorder in urban neighborhoods. American Journal of Sociology
105, 622–630.
Sampson, R. J., Raudenbush, S. W., and Earls, F. (1997). Neighborhoods and violent
crime: a multilevel study of collective efficacy. Science 277, 918–924.
Skogan, W. (1990). Disorder and Decline: Crime and the Spiral of Decay in American
Cities. University of California Press.
Skogan, W., and Frydl, K., eds. (2004). The Evidence on Policing: Fairness and Efffective-
ness in Law Enforcement. Washington D.C.: National Academy Press.
Skolnick, J., and Capolovitz, A. (2001). Guns, drugs and profiling: ways to target guns and
minimize racial profiling. Arizona Law Review 43, 413–448.
Smith, D. A. (1986). The neighborhood context of police behavior. In Communities and
Crime: Crime and Justice: An Annual Review of Research, ed. A. J. Reiss and M.
Tonry, 313–342. University of Chicago Press.
Smith, M., and Alpert, G. (2002). Searching for direction: courts, social science and the
adjudication of racial profiling claims. Justice Quarterly.
Smith, M. R., Makarios, M., and Alpert, G. P. (2006). Differential suspicion: theory
specification and gender effects in the traffic stop context. Justice Quarterly, to appear.
Spiegelhalter, D., Thomas, A., Best, N., Gilks, W., and Lunn, D. (1994, 2003). BUGS:
Bayesian inference using Gibbs sampling. MRC Biostatistics Unit, Cambridge, England.
www.mrc-bsu.cam.ac.uk/bugs/
Spitzer, E. (1999). The New York City Police Department’s “stop and frisk” practices.
Office of the New York State Attorney General.
www.oag.state.ny.us/press/reports/stop frisk/stop frisk.html
23
Sykes, R. E., and Clark, J. P. (1976). A theory of deference exchange in police-civilian
encounters. American Journal of Sociology 81, 587–600.
Taylor, R. B. (2000). Breaking Away from Broken Windows. Baltimore Neighborhoods
and the Nationwide Fight Against Crime, Grime, Fear, and Decline. Boulder, Colo.:
Westview Press.
Terry v. Ohio (1968). 392 U.S. 1. U.S. Supreme Court.
Thompson, A. (1999). Stopping the usual suspects: race and the fourth amendment. New
York University Law Review 74, 956–1013.
Tyler, T. R., and Huo, Y. J. (2003). Trust in the Law. New York: Russell Sage Foundation.
U.S. Commission on Civil Rights (2000). Police practices and civil rights in New York City.
www.uscrr.gov/pubs/nypolice/main.htm
U.S. v. Martinez-Fuerte (1976). 428 U.S. 543. U.S. Supreme Court.
Veneiro, P., and Zoubeck, P. H. (1999). Interim report of the state police review team
regarding allegations of racial profiling. Office of the New Jersey State Attorney General.
Walker, S. (2001). Searching for the denominator: problems with police traffic stop data
and an early warning system solution. Justice Research and Policy 3, 63–95.
Wang, A. (2001). Illinois v. Wardlow and the crisis of legitimacy: an argument for a “real
cost” balancing test. Law and Inequality 19, 1–30.
Weidner, R. R., Frase, R., and Pardoe, I. (2004). Explaining sentence severity in large urban
counties: a multilevel analysis of contextual and case-level factors. Prison Journal, to
appear.
Weitzer, R. (2000). Racialized policing: residents’ perceptions in three neighborhoods. Law
and Society Review 34 129–155.
Weitzer, R., and Tuch, S. A. (2002). Perceptions of racial profiling: race, class and personal
experience. Criminology 50, 435–456.
Whren et al. v. U.S. (1996). 517 U.S. 806.
Wilson, J. Q., and Kelling, G. L. (1982). The police and neigborhood safety: broken
windows. Atlantic Monthly, March, 29–38.
Zingraff, M., Mason, H. M., Smith, W. R., Tomaskovic-Devey, D., Warren, P., McMurray,
H. L., and Fenlon, C. R., et al. (2000). Evaluating North Carolina state highway patrol
data: citations, warnings and searches in 1998.
www.nccrimecontrol.org/shp/ncshpreport.htm
24

Proportionblack Crime typein precinct Parameter Violent Weapons Property Drug
< 10% intercept −0.85 (0.07) 0.13 (0.07) −0.58 (0.21) −1.62 (0.16)α1 [blacks] 0.40 (0.06) 0.16 (0.05) −0.32 (0.06) −0.08 (0.09)α2 [hispanics] 0.13 (0.06) 0.12 (0.04) 0.32 (0.06) 0.17 (0.10)α3 [whites] −0.53 (0.06) −0.28 (0.05) 0.00 (0.06) −0.08 (0.09)σβ 0.33 (0.08) 0.38 (0.08) 1.19 (0.20) 0.87 (0.16)σε 0.30 (0.04) 0.23 (0.04) 0.32 (0.04) 0.50 (0.07)
10–40% intercept −0.97 (0.07) 0.42 (0.07) −0.89 (0.16) −1.87 (0.13)α1 [blacks] 0.38 (0.04) 0.24 (0.04) −0.16 (0.06) −0.05 (0.05)α2 [hispanics] 0.08 (0.04) 0.13 (0.04) 0.25 (0.06) 0.12 (0.06)α3 [whites] −0.46 (0.04) −0.36 (0.04) −0.08 (0.06) −0.07 (0.05)σβ 0.49 (0.07) 0.47 (0.07) 1.21 (0.17) 0.90 (0.13)σε 0.24 (0.03) 0.24 (0.03) 0.38 (0.04) 0.32 (0.04)
> 40% intercept −1.58 (0.10) 0.29 (0.11) −1.15 (0.19) −2.62 (0.12)α1 [blacks] 0.44 (0.06) 0.30 (0.07) −0.03 (0.07) 0.09 (0.06)α2 [hispanics] 0.11 (0.06) 0.14 (0.07) 0.04 (0.07) 0.09 (0.07)α3 [whites] −0.55 (0.08) −0.44 (0.08) −0.01 (0.07) −0.18 (0.09)σβ 0.48 (0.10) 0.47 (0.11) 0.96 (0.18) 0.54 (0.11)σε 0.24 (0.05) 0.37 (0.05) 0.42 (0.07) 0.28 (0.06)
Table 1: Estimates and standard errors for the constant term µ, ethnicity parameters αe,and the precinct-level and precinct-by-ethnicity level variance parameters σβ and σε, forthe hierarchical Poisson regression model (1), fit separately to three categories of precinctand four crime types. The estimates of eµ+αe are displayed graphically in Figure 2, andalternative model specifications are shown in Table 3.
25
Crime typeParameter Violent Weapons Property Drug
intercept −0.66 (0.08) 0.08 (0.11) −0.14 (0.24) −0.98 (0.17)α1 [blacks] 0.41 (0.03) 0.24 (0.03) −0.19 (0.04) −0.02 (0.04)α2 [hispanics] 0.10 (0.03) 0.12 (0.03) 0.23 (0.04) 0.15 (0.04)α3 [whites] −0.51 (0.03) −0.36 (0.03) −0.05 (0.04) −0.13 (0.04)ζ1 [coeff for prop. black] −1.22 (0.18) 0.10 (0.19) −1.11 (0.45) −1.71 (0.31)ζ2 [coeff for prop. hispanic] −0.33 (0.23) 0.71 (0.27) −1.50 (0.57) −1.89 (0.41)
σβ 0.40 (0.04) 0.43 (0.04) 1.04 (0.09) 0.68 (0.06)σε 0.25 (0.02) 0.27 (0.02) 0.37 (0.03) 0.37 (0.03)
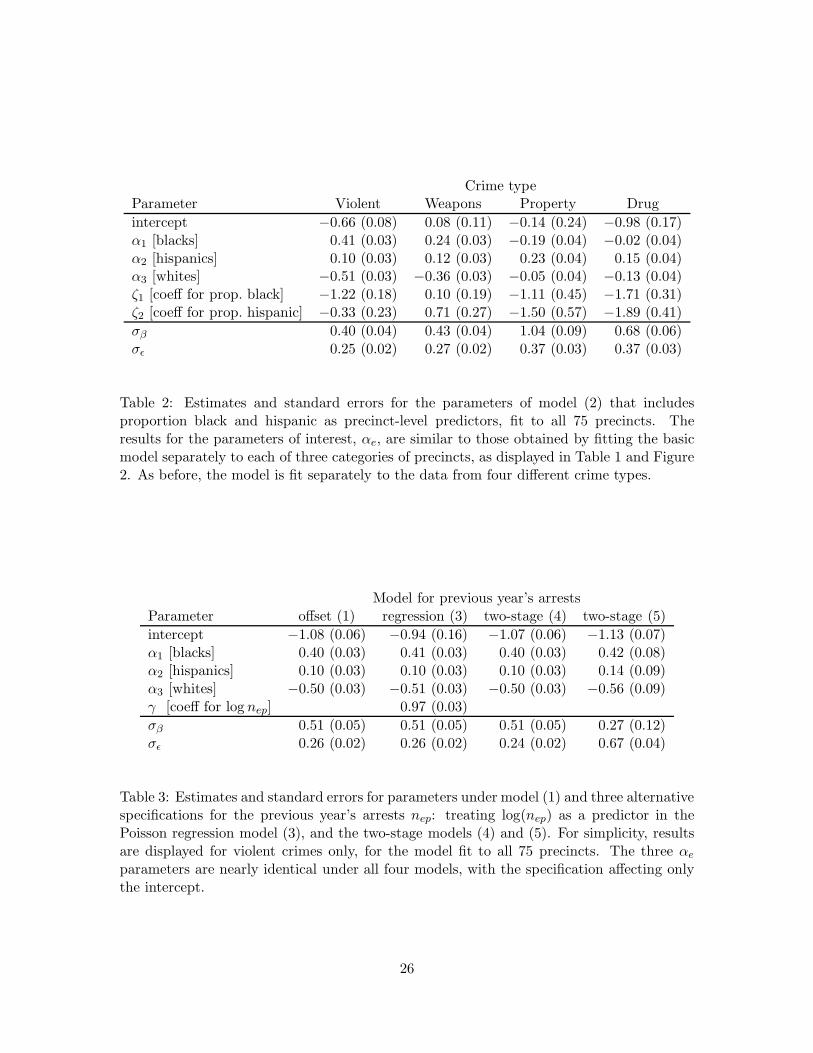
Table 2: Estimates and standard errors for the parameters of model (2) that includesproportion black and hispanic as precinct-level predictors, fit to all 75 precincts. Theresults for the parameters of interest, αe, are similar to those obtained by fitting the basicmodel separately to each of three categories of precincts, as displayed in Table 1 and Figure2. As before, the model is fit separately to the data from four different crime types.
Model for previous year’s arrestsParameter offset (1) regression (3) two-stage (4) two-stage (5)
intercept −1.08 (0.06) −0.94 (0.16) −1.07 (0.06) −1.13 (0.07)α1 [blacks] 0.40 (0.03) 0.41 (0.03) 0.40 (0.03) 0.42 (0.08)α2 [hispanics] 0.10 (0.03) 0.10 (0.03) 0.10 (0.03) 0.14 (0.09)α3 [whites] −0.50 (0.03) −0.51 (0.03) −0.50 (0.03) −0.56 (0.09)γ [coeff for log nep] 0.97 (0.03)
σβ 0.51 (0.05) 0.51 (0.05) 0.51 (0.05) 0.27 (0.12)σε 0.26 (0.02) 0.26 (0.02) 0.24 (0.02) 0.67 (0.04)
Table 3: Estimates and standard errors for parameters under model (1) and three alternativespecifications for the previous year’s arrests nep: treating log(nep) as a predictor in thePoisson regression model (3), and the two-stage models (4) and (5). For simplicity, resultsare displayed for violent crimes only, for the model fit to all 75 precincts. The three αe
parameters are nearly identical under all four models, with the specification affecting onlythe intercept.
26
Violent crimes
month
# st
ops
5 10 15
100
300
1000
3000
Weapons crimes
month
# st
ops
5 10 1510
030
010
0030
00
Property crimes
month
# st
ops
5 10 15
100
300
1000
3000
Drug crimes
month
# st
ops
5 10 15
100
300
1000
3000
Figure 1: Number of police stops in each of 15 months, characterized by type of crimeand ethnicity of person stopped. In each graph, blacks (African-Americans), hispanics(Latinos), and whites (European-Americans) are indicated by solid, dashed, and dottedlines, respectively.
27
Violent crimes (25% of all stops)
Rat
e of
sto
ps c
ompa
red
to a
rres
ts0.
10.
20.
51.
02.
0
precincts precincts precincts< 10% black 10−40% black > 40% black
BlacksHispanics
Whites
Weapons crimes (44% of all stops)
Rat
e of
sto
ps c
ompa
red
to a
rres
ts0.
10.
20.
51.
02.
0
precincts precincts precincts< 10% black 10−40% black > 40% black
BlacksHispanics
Whites
Property crimes (20% of all stops)
Rat
e of
sto
ps c
ompa
red
to a
rres
ts0.
10.
20.
51.
02.
0
precincts precincts precincts< 10% black 10−40% black > 40% black
Blacks
HispanicsWhites
Drug crimes (11% of all stops)
Rat
e of
sto
ps c
ompa
red
to a
rres
ts0.
10.
20.
51.
02.
0
precincts precincts precincts< 10% black 10−40% black > 40% black
BlacksHispanics
Whites
Figure 2: Estimated rates eµ+αe at which people of different ethnic groups were stopped fordifferent categories of crime, as estimated from hierarchical regressions (1) using previousyear’s arrests as a baseline and controlling for differences between precincts. Separateanalyses were done for the precincts that had less than 10%, 10%–40%, and more than40% black population. For the most common stops—violent crimes and weapons offenses—blacks and hispanics were stopped about twice as often as whites. Rates are plotted on alogarithmic scale. Numerical estimates and standard errors appear in Table 1.
0.1
0.2
0.5
1.0 5 groups of precincts
Sto
ps c
ompa
red
to la
st y
ear’s
arr
ests
precinct groups in increasing order of % black
0.1
0.2
0.5
1.0 10 groups of precincts
Sto
ps c
ompa
red
to la
st y
ear’s
arr
ests
precinct groups in increasing order of % black
0.1
0.2
0.5
1.0 15 groups of precincts
Sto
ps c
ompa
red
to la
st y
ear’s
arr
ests
precinct groups in increasing order of % black
Figure 3: Estimated rates eµ+αe at which people of different ethnic groups were stopped forviolent crimes, as estimated from models dividing precincts into 5, 10, and 15 categories.For each graph, the top, middle, and lower lines correspond to blacks, hispanics, and whites,respectively. These plots show the same general patterns as the model with 3 categories(the upper-left graph in Figure 2) but with increasing levels of noise.
28