Embed Size (px)
Citation preview
Journal of Economic Integration19(3), September 2004; 568-589
An Analysis of the Impact of Indo-Lanka Free Trade Agreement and Its Implications for Free
Trade in South Asia
Mahinda SiriwardanaUniversity of New England
Abstract
The Indo-Lanka Free Trade Agreement (ILFTA) which was signed in December
1998 between India and Sri Lanka has shown a promising start to trade
liberalisation among SAARC (South Asian Association for Regional Cooperation)
countries. This paper provides a quantitative assessment of the likely impact of the
ILFTA. We perform simulations using the Global Trade Analysis Project (GTAP)
model to quantify the impact of liberlised trade between Sri Lanka and India.
GTAP is a computable general equilibrium (CGE) model of the world economy.
Using the model simulations, the paper also examines the implications of
extending the free trade agreement to other SAARC nations. Results indicate that
both Sri Lanka and India will experience some welfare gains from ILFTA. The
extension of such trade agreement to all SAARC nations may create significant
welfare improvements in Sri Lanka.
• JEL Classification: F15
• Key words: Free Trade Agreement, General Equililorium, GTAP
I. Introduction
After several years of planning and contentious discussions, the governments ofSri Lanka and India signed a bilateral free trade agreement in December 1998(CBS, 1999). Since then it took further period of negotiations to decide exact terms
*Corresponding address: Mahinda Siriwardana, School of Economics University of New England, Armidale,N.S.W., Australia 2351, Phone: 02-67 732501; Email: [email protected]
2004-Center for International Economics, Sejong Institution, All Rights Reserved.
An Analysis of the Impact of Indo-Lanka Free trade Agreement and Its Implications.. 569
and conditions of this historic Indo-Lanka Free Trade Agreement (ILFTA) prior toits implementation in March 2000. This trade agreement is regarded as a signifi-cant landmark in establishing a free trade area in South Asia under the auspiciousof the South Asia Free Trade Agreement (SAFTA) which has now reached the finalstage of negotiations. The SAFTA is organised under the umbrella of the South AsianAssociation for Regional Corporation (SAARC).1 While the ultimate configurationof the free trade agreement for the region will be driven by a variety of politicaland economic considerations and negotiated outcomes, it is useful to provide somequantitative assessment of the ILFTA facilitating the debate of free trade in South Asia.This paper offers some preliminary findings of the impact of the ILFTA on botheconomies of Sri Lanka and India and attempts to evaluate the effects of expandingthis agreement to include the other SAARC nations.
We use the multi-country computable general equilibrium (CGE) model developedat the Global Trade Analysis Project (GTAP) to examine the impact of tradeliberalisation as proposed in the ILFTA. The GTAP model (Hertel, 1996) coversthe world economy and has been widely used in studies dealing with trade policyanalysis at global level. The simulations from the model help in understanding theimpact on trade, production, and resource allocation that might occur in differenteconomies and sectors due to the adoption of changes in different tariff structures.
The paper is organised as follows. Section II examines the economic structureand the trade patterns in the South Asian region and compares it with the worldeconomy. A brief review of some important features of the ILFTA is provided inSection III. An overview of the GTAP model is presented in Section IV. Section Voutlines three different trade liberalisation scenarios that have been evaluatedusing the GTAP model. Simulation results are reported and discussed in SectionVI. Section VII concludes.
II. Patterns of Trade and Economic Structure
We have aggregated 45 regions in the GTAP model into ten regions for thepurpose of analysis in this paper.2 Table 1 presents some economic indicators ofthe countries and regions in terms of external trade, GDP, factor endowments and
1The SAARC was formed in 1985 with representative countries of Bangladesh, Buthan, India, Maldives,Nepal, Pakistan, and Sri Lanka (Mukherji, 1998).
2See Appendix Table A1 for details.

570 Mahinda Siriwardana
factor proportions. The data are remarkably asymmetric among regions in theirshares of the world’s GDP, imports and exports. Within South Asia, the economicprominence of India is evident: It accounts for about 76 per cent of the GDP, 67per cent of imports, and 60 per cent of exports of the region. Sri Lanka is relativelya minor player in South Asia. However, South Asia is small compared to othermain trading partners as its share in world GDP is only 1.4 per cent and exportsand imports also represent relatively small shares (1.2 and 1.1 per cents,respectively) in the world trade. Judging by these figures, any change in tradepolicy in South Asia is likely to have a negligible impact on the world economy.
Of the three South Asian regions of Table 1, Sri Lanka has the highest tradedependency ratio and it is indeed one of the most open economies in the world.Interestingly, it is only second to Rest of East Asia (REA) and is well above most
Table 1. Factor endowments, Income Shares, Factor Intensity, and Trade Dependence (1995)
NAM JPN ANZ CHN REA IND LKA RSA EU ROWGDP & Trade Flows(billion U.S.$):
Exports (%)
Imports (%)
GDP (%)
Trade Dependence (%):
Exports/GDPImports/GDP
Factor Shares in Regional Value Added (%):
LandLabourCapitalResources
Factor Proportion (%):
Unskilled/Total Labour
1043.517.9
1133.919.3
7980.028.2
13.114.2
0.562.536.30.7
60.6
502.18.6
435.37.4
5091.718.0
9.98.5
0.557.941.30.3
62.5
82.91.4
87.91.5
405.31.4
20.521.7
0.859.038.81.4
59.4
289.75.0
279.64.7
813.42.9
35.634.4
5.043.648.62.8
78.0
598.510.3
649.411.0
1340.94.7
44.648.4
4.546.447.81.3
70.6
39.40.7
40.30.7
329.31.2
11.912.2
12.449.836.41.4
81.3
4.40.1
5.50.1
13.20.0
33.341.7
10.849.039.01.2
77.7
14.80.3
21.60.4
91.50.3
16.223.6
13.149.535.91.5
80.7
2336.040.0
2296.839.0
8209.729.0
28.528.0
0.366.732.60.4
61.6
922.315.7
940.315.9
4039.314.3
22.823.3
2.150.444.82.7
69.8
Source: GTAP Version 4 Database (McDougall et al., 1998).

An Analysis of the Impact of Indo-Lanka Free trade Agreement and Its Implications.. 571
developed economies in its dependence on international trade. Table 1 alsosuggests a significant variation in factor endowments between the South Asianeconomies and other economies in the world, suggesting that there is an amplescope for Heckscher-Ohlin type trade to occur. It is noticeable that the threeregions in South Asia have similar factor shares which may influence more intra-industry trade than inter-industry trade among themselves. They also have highershares of unskilled labour in the labour force in comparison to other economies.
Table 2 reports the share of each regions exports and imports by sector in totalworld trade. South Asian countries represent relatively small shares which areconsistent with their small GDP levels. It appears that agricultural products, andtextiles and apparel are the leading exports from and imports into the region. Of theworlds total exports and imports, South Asia accounts for about 1.1 per cent of whichIndias share is more than 50 per cent, showing its dominant position in the region.
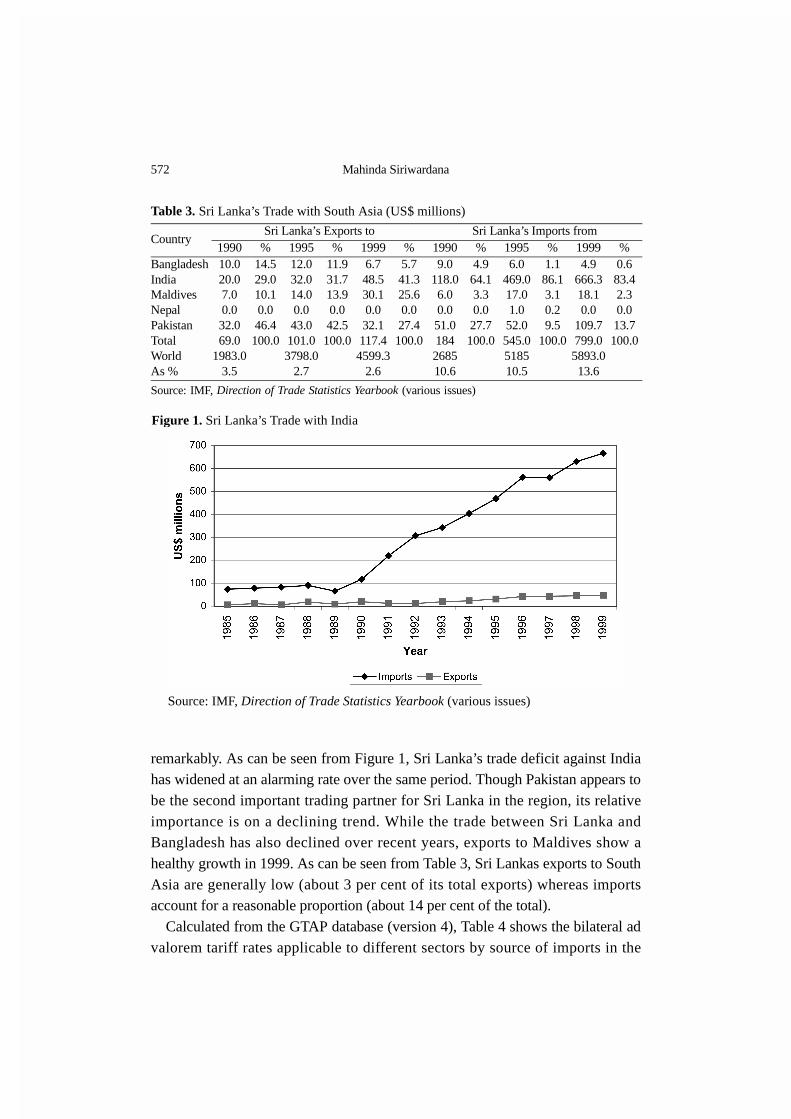
Trade between Sri Lanka and its South Asian trading partners are reported inTable 3. India is the main source of imports to Sri Lanka from the region as well asthe principal destination of its exports to South Asia. Over the ten-year periodbetween 1990 and 1999, trade between India and Sri Lanka has grown
Table 2. Export and Import Shares in World Trade by Sector in 1995 (%)
NAM JPN ANZ CHN REA IND LKA RSA EU ROW TotalShares in world exports:
Agricultural productsProcessed foodsMiningTextiles & apparelOther manufacturingServices
Total exports
Shares in world imports:
Agricultural productsProcessed foodsMiningTextiles & apparelOther manufacturingServices
Total imports
5.112.610.66.219.019.6
17.4
35.413.010.96.219.020.5
17.6
0.30.60.72.3
12.35.6
8.6
0.10.60.72.3
12.25.5
8.5
3.84.23.61.30.71.7
1.4
2.64.33.81.30.71.7
1.4
2.52.61.420.13.86.0
5.0
2.02.81.619.83.85.9
5.0
9.710.57.616.811.48.9
11.0
4.411.17.717.111.68.8
11.1
3.11.01.72.60.30.5
0.7
2.31.11.62.80.30.5
0.7
0.10.20.10.50.00.1
0.1
0.10.20.10.50.00.1
0.1
0.80.30.02.40.00.2
0.3
0.60.30.02.40.00.2
0.3
46.245.616.432.842.941.7
40.0
31.343.816.132.742.841.2
39.7
28.422.457.915.09.615.7
15.5
21.222.857.514.99.615.6
15.6
100.0100.0100.0100.0100.0100.0
100.0
100.0100.0100.0100.0100.0100.0
100.0
Source: GTAP Version 4 Database (McDougall et al., 1998).
572 Mahinda Siriwardana
remarkably. As can be seen from Figure 1, Sri Lanka’s trade deficit against Indiahas widened at an alarming rate over the same period. Though Pakistan appears tobe the second important trading partner for Sri Lanka in the region, its relativeimportance is on a declining trend. While the trade between Sri Lanka andBangladesh has also declined over recent years, exports to Maldives show ahealthy growth in 1999. As can be seen from Table 3, Sri Lankas exports to SouthAsia are generally low (about 3 per cent of its total exports) whereas importsaccount for a reasonable proportion (about 14 per cent of the total).
Calculated from the GTAP database (version 4), Table 4 shows the bilateral advalorem tariff rates applicable to different sectors by source of imports in the
Table 3. Sri Lanka’s Trade with South Asia (US$ millions)
CountrySri Lanka’s Exports to Sri Lanka’s Imports from
1990 % 1995 % 1999 % 1990 % 1995 % 1999 %BangladeshIndiaMaldivesNepalPakistanTotalWorldAs %
10.020.07.00.032.069.0
1983.03.5
14.529.010.10.046.4100.0
12.032.014.00.043.0
101.03798.0
2.7
11.931.713.90.042.5
100.0
6.748.530.10.032.1117.4
4599.32.6
5.741.325.60.027.4
100.0
9.0118.06.00.051.0184268510.6
4.964.13.30.0
27.7100.0
6.0469.017.01.0
52.0545.0518510.5
1.186.13.10.29.5
100.0
4.9666.318.10.0
109.7799.0
5893.013.6
0.683.42.30.013.7100.0
Source: IMF, Direction of Trade Statistics Yearbook (various issues)
Figure 1. Sri Lanka’s Trade with India
Source: IMF, Direction of Trade Statistics Yearbook (various issues)

An Analysis of the Impact of Indo-Lanka Free trade Agreement and Its Implications.. 573
South Asian region. While there is a significant variation in tariff rates betweensectors, the rates reported in the table clearly indicate that Sri Lanka is by far themost liberalised economy among the South Asian countries. Except for thebeverages and tobacco sector, the ad valorem rate of tariffs for other sectors rangesfrom zero to 35 per cent in Sri Lanka. The tariff barriers are uniformly high acrosssectors in India and even higher in RSA.
III. Indo-Lanka Free Trade Agreement
There is a considerable debate over the benefits of regional trading arrangements(RTA) as opposed to multilateral free trade (Krueger, 1999). RTAs could both
Table 4. Sectoral Bilateral Import Tariffs (percent ad valorem)
SectorSRI LANKA INDIA
REST OFSOUTH ASIA
On India
On Rest of South Asia
On Sri Lanka
On Rest of South Asia
On Sri Lanka
On India
1. Rice2. Wheat3. Other cereal grains4. Vegetables & fruits5. Sugar6. Plant-based fibers7. Other crops8. Meat products9. Vegetable oil & fats10. Milk products11. Other food products12. Beverages & tobacco13. Mining14. Textiles15. Weaving apparel & leather16. Wood & wood products17. Paper & paper products18. Chemical, rubber & plastic19. Nonmetallic mineral products20. Basic metal products21. Fabricated metal products22. Other manufactures23. Construction24. Services
12.0-16.0-2.035.024.00.0
33.011.011.00.0
17.0164.020.021.031.014.020.011.012.013.020.023.00.00.0
12.0-16.0-2.032.00.0
10.013.06.0
35.00.0
11.0164.014.020.028.010.020.01.0
34.015.016.013.00.00.0
4.0-16.0-2.051.068.050.055.058.065.00.0
61.0250.050.058.061.011.064.052.051.07.0
53.064.00.00.0
4.0-16.0-2.063.059.040.039.027.064.028.058.0
351.054.058.060.034.036.061.050.052.053.065.00.00.0
13.0-16.0-2.083.0
100.060.0
100.024.061.013.086.0
215.060.0
100.0100.0
9686.091.095.0
100.081.0
100.00.00.0
13.0-16.0-2.080.057.061.029.07.0
50.017.049.0
214.060.071.099.099.053.086.064.082.083.093.00.00.0
Source: GTAP Version 4 Database (McDougall et al., 1998).Note: Negative values imply import subsidies.
574 Mahinda Siriwardana
create and divert trade or perhaps only trade diverting. It has been argued that asdeveloping economies usually maintain high tariff barriers they may lose fromRTAs due to trade diversion as they rely heavily on RTA partners (Bhagwati andPanagariya, 1996; Panagariya, 1996, 1998, 1999). On the one hand, small developingcountries such as Sri Lanka may lose considerable tariff revenue with tradeliberalisation and on the other hand their price taking behaviour in the world marketsresults in higher prices being faced by domestic consumers despite tariff cuts3.
There has be a considerable opposition to the ILFTA by domestic industrialistsin both Sri Lanka and India. Both economies have an important import-competingsector which is likely to be hurt as two countries move toward free trade. As seenfrom data in Table 3, 83 per cent of imports to Sri Lanka from the region are fromIndia and it accounts for 49 per cent of Sri Lankan exports to the region. The freeflow of Indian products to the domestic market in Sri Lanka and the exploitationof the Indian market by Sri Lankan exporters may become the natural outcome whenthe free trade agreement becomes fully operational. As the smaller partner of RTA, theextent of the likely welfare implications for Sri Lanka could be enormous.
Table 5 briefly outlines the salient features of the ILFTA. While most of thedetails in the table are self-explanatory, perhaps some explanation is in order withrespect to the “negative list”. The negative list was drawn by both countries tosafeguard the domestic consumer-goods sector which may find foreigncompetition a severe threat to its long-term survival. In the case of Sri Lanka, the“negative list” contains manufactured industry products which are still at theirinfancy and most of the agricultural products. Likewise, the Indian “negative listincludes goods such as garments, alcohol, coconut and coconut oil which SriLanka can produce competitively (Siriwardana, 2001).
IV. Overview of the GTAP Model
The analytical framework used to quantify the impact of bilateral tariffreductions is the well-known GTAP model (Hertel, 1996). It is a comparative-static multi-regional CGE model of the Johansen type comprising a system oflinear equations in percentage change of variables. The modelling of each regionin GTAP is based on the ORANI model (Dixon et al., 1982). We use the latestversion of GTAP together with version four of the database which distinguishes 45
3See also Sirinivasan (1994, 1998).

An Analysis of the Impact of Indo-Lanka Free trade Agreement and Its Implications.. 575
regions and 50 sectors in each region.The model has many general features which include product differentiation by
country of origin, explicit recognition of savings by regional economies, a capitalgoods producing sector in each region to service investment, internationalmobility of capital, multiple trading regions, multiple goods and primary factors,empirically based differences in production technology and consumer preferencesacross regions, and explicit recognition of a global transport sector. It is alsofeatured by many policy variables, including taxes and subsidies on commoditiesas well as on primary factors, making the model more attractive to policy analysts.
In each region both factor and commodity markets are assumed to be perfectly
Table 5. The Salient Features of the Indo-Lanka Free Trade Agreement
Reduction of Tariffs: By India (i) 100 per cent removal of tariffs on 1351 items upon entry into force of the agreement
(Annexure E). (ii) 25 per cent tariff reduction for 528 textile items (all textile items in Chapters 51, 52, 58, 59,
60, 63 and a majority of textile items in Chapters 53-56). (iii) Except 429 items in the negative list of India (Annexure D (i) ), 50 per cent reduction of
tariffs for the remaining 2797 items upon entry into force of the agreement followed byphased out removal of tariffs up to 100 per cent in 2 stages within three years.
(iv) A 50 per cent fixed tariff concession for imports of tea from Sri Lanka on a preferentialbasis subject to an annual maximum quota of up to 15 million kgs.
(v) A 50 per cent fixed tariff concession for imports of garments from Sri Lanka subject to amaximum annual quota of 8 million pieces of which a minimum of 6 million piecesshould contain Indian fabrics.
By Sri Lanka (i) 100 per cent removal of tariffs on 319 items (raw materials and machinery for industries)
upon entry into force of the agreement (Annexure F 1). (ii) 50 per cent reduction of tariffs on 889 items upon entry into force of the agreement
(Annexure F II) followed by phased out removal of tariffs as follows: up to 70 per cent at the end of the first yearup to 90 per cent at the end of the second yearup to 100 per cent at the end of the third year
(iii) For 1180 items in Sri Lanka’s negative list (Annexure D (ii) ), there will be no duty preferences. (iv) For the remaining 2724 items, upon entry into force of the agreement, the removal of tar-
iffs will be phased out within eight years as follows:not less than 35 per cent before the end of the third yearnot less than 70 per cent before the end of the sixth yearnot less than 100 per cent before the end of the eighth year
Source: This information on free trade agreement was obtained from http://www.tradenetsl.sl/INDIA/fta/conind.htm and http://www.tradenetsl.sl/INDIA/fta/consl.htm
576 Mahinda Siriwardana
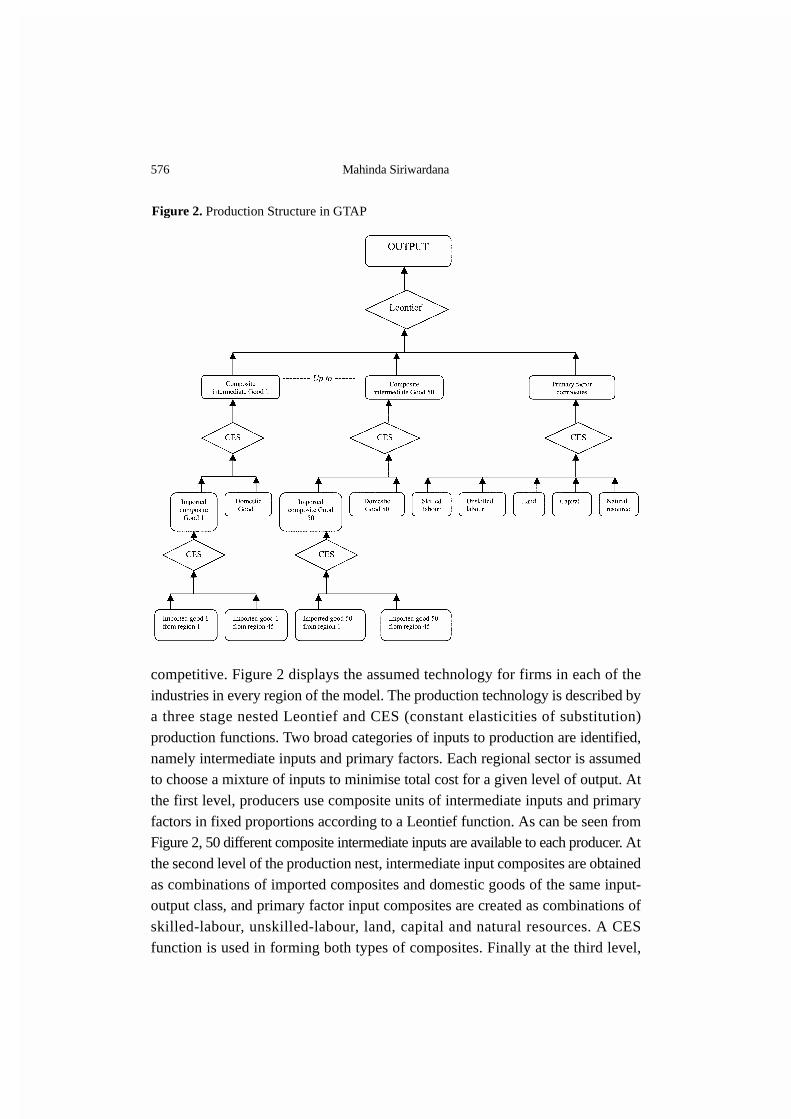
competitive. Figure 2 displays the assumed technology for firms in each of theindustries in every region of the model. The production technology is described bya three stage nested Leontief and CES (constant elasticities of substitution)production functions. Two broad categories of inputs to production are identified,namely intermediate inputs and primary factors. Each regional sector is assumedto choose a mixture of inputs to minimise total cost for a given level of output. Atthe first level, producers use composite units of intermediate inputs and primaryfactors in fixed proportions according to a Leontief function. As can be seen fromFigure 2, 50 different composite intermediate inputs are available to each producer. Atthe second level of the production nest, intermediate input composites are obtainedas combinations of imported composites and domestic goods of the same input-output class, and primary factor input composites are created as combinations ofskilled-labour, unskilled-labour, land, capital and natural resources. A CESfunction is used in forming both types of composites. Finally at the third level,
Figure 2. Production Structure in GTAP
An Analysis of the Impact of Indo-Lanka Free trade Agreement and Its Implications.. 577
imported composites are created via a CES aggregation of imported goods of thesame class from each region.
The firm’s decision to combine different inputs to produce its output largelydepends on the separability assumption adopted in production. For instance, it isassumed that producers choose their optimal mix of primary factors independentlyof the prices of intermediate inputs. By allowing the separability of this type, weimpose the restriction that the elasticity of substitution between any individualprimary factors is equal via the CES function. Adopting the CES function in theselection of intermediate inputs imposes a similar restriction. Importedintermediates are separable from domestically produced intermediate inputs. Asshown in Figure 2, producers first decide on the source of their imports andgenerate imported composites via CES function. Then depending on the importedcomposite price and the domestic good’s price, they then determine the optimalmix of imported composite and domestic good of the same input-output class.This is the well known “Armington approach” to modelling import demand.
Under the assumption of perfectly competitive factor markets, payments toprimary factors skilled labour, unskilled labour, capital, land, and natural resourcesare determined by the marginal productivity of these factors. Hence factor returnsequal their marginal revenue product. For example, the wage rate for unskilledworkers is equal to the marginal revenue product of unskilled labour. Under theassumption of full employment, GTAP can project the change in the nominalwage rate for unskilled labour. In a particular simulation, the change in the realwage for unskilled labour could be easily obtained by taking into account thechange in the consumer price index.
On the demand side, the GTAP model adopts a sophisticated specification ofconsumer behaviour which allows for differences in both price and incomeresponsiveness of demand in different regions, depending on the level of developmentand regional specific demand patterns. Each region has a single representativehousehold. This regional household receives all the income generated throughpayments to primary factors, and net tax revenue. Its behaviour is governed by anaggregate utility function over private household consumption, governmentconsumption, and savings. The aggregate utility is modelled by a Cobb-Douglasfunction with constant expenditure shares. The government consumption is alsodescribed by a Cobb-Douglas function over composite commodities where thedemand for the latter is a CES aggregation of imports and domestic goods. Privatehousehold consumption is explained by a CDE (Constant Difference of
578 Mahinda Siriwardana
Elasticities) expenditure function. These households purchase bundles ofcommodities where the bundles are CES aggregation of domestic goods andimported bundles. The imported bundles in turn are formed by a CES aggregationof imports from different regions.
Capital creation takes place in each region according to a technology that issimilar to producing current goods except that it requires only domestic andimported intermediate inputs. This capital creation services the investment whichis financed by a global pool of savings. Each region contributes a share of itsincome to a savings pool at a global bank. This bank is designed to mediate worldsavings and investment. There are two methods available in the standard GTAPmodel for allocating global savings to investment in each region. The first methodallocates global savings across investment in a fixed proportion of the total savings sothat the regional composition of global investment remains unaltered. The secondmethod allows investment to take place in each region according to the relativerates of return.
As noted before, the version four of GTAP database divides the world into 45countries and distinguishes 50 sectors (commodities). Given the focus of ourstudy, we aggregate the database into 10 regions and 24 sectors as shown in theAppendix Table A1. As our focus is on the bilateral tariff reductions between SriLanka, India, and Rest of South Asia (RSA), the regional aggregation adoptedhighlights the importance of those trading partners within South Asia.
V. Design of Alternative Scenarios of Trade Liberalisation with GTAP
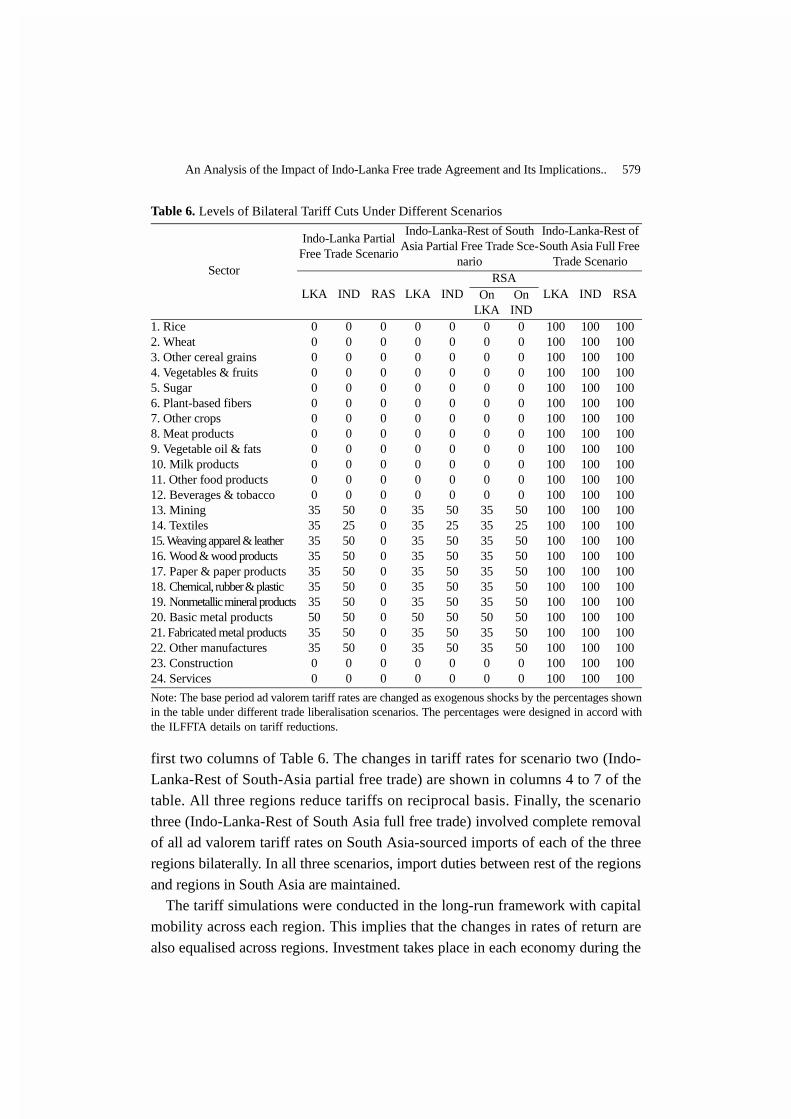
The simulation experiments conducted with the standard version of the GTAPmodel are outlined in this section. We present three trade liberalisation scenarios:Indo-Lanka partial free trade, Indo-Lanka-Rest of South Asia partial free trade,and Indo-Lanka-Rest of South Asia full free trade. Table 6 shows the respectivepercentage reductions in the sectoral ad valorem bilateral tariff rates by tradingpartners in our simulations. While our selection of the required percentage cut intariff rates is somewhat crude given the complexity of the ILFTA, we haveattempted to incorporate many of the features of the agreement including the“negative list”.
The GTAP simulation for the scenario one (Indo-Lanka partial free trade)involved reducing bilateral ad valorem tariff rates by the percentages shown in
An Analysis of the Impact of Indo-Lanka Free trade Agreement and Its Implications.. 579
first two columns of Table 6. The changes in tariff rates for scenario two (Indo-Lanka-Rest of South-Asia partial free trade) are shown in columns 4 to 7 of thetable. All three regions reduce tariffs on reciprocal basis. Finally, the scenariothree (Indo-Lanka-Rest of South Asia full free trade) involved complete removalof all ad valorem tariff rates on South Asia-sourced imports of each of the threeregions bilaterally. In all three scenarios, import duties between rest of the regionsand regions in South Asia are maintained.
The tariff simulations were conducted in the long-run framework with capitalmobility across each region. This implies that the changes in rates of return arealso equalised across regions. Investment takes place in each economy during the
Table 6. Levels of Bilateral Tariff Cuts Under Different Scenarios
Sector
Indo-Lanka Partial Free Trade Scenario
Indo-Lanka-Rest of South Asia Partial Free Trade Sce-
nario
Indo-Lanka-Rest of South Asia Full Free
Trade Scenario
LKA IND RAS LKA INDRSA
LKA IND RSAOnLKA
OnIND
1. Rice2. Wheat3. Other cereal grains4. Vegetables & fruits5. Sugar6. Plant-based fibers7. Other crops8. Meat products9. Vegetable oil & fats10. Milk products11. Other food products12. Beverages & tobacco13. Mining14. Textiles15. Weaving apparel & leather16. Wood & wood products17. Paper & paper products18. Chemical, rubber & plastic19. Nonmetallic mineral products20. Basic metal products21. Fabricated metal products22. Other manufactures23. Construction24. Services
0000000000003535353535353550353500
0000000000005025505050505050505000
000000000000000000000000
000000000000
3535353535353550353500
000000000000
5025505050505050505000
0000000000003535353535353550353500
0000000000005025505050505050505000
100100100100100100100100100100100100100100100100100100100100100100100100
100100100100100100100100100100100100100100100100100100100100100100100100
100100100100100100100100100100100100100100100100100100100100100100100100
Note: The base period ad valorem tariff rates are changed as exogenous shocks by the percentages shownin the table under different trade liberalisation scenarios. The percentages were designed in accord withthe ILFFTA details on tariff reductions.
580 Mahinda Siriwardana
period of tariff reductions making sure that sum of the regional investmentmatches with the changes in global savings. In addition we assume that aggregateemployment of labour and land are fixed in each region.
VI. Results of the GTAP Simulations
This section reports the impact of the ILFTA and its extension to the rest ofSouth Asia on important macroeconomic variables, sectoral outputs, and exportperformance. In order to isolate the outcome of the ILFTA from other tradeliberaliasation options considered in the paper, results are presented under each ofthe three scenarios.
A. Indo-Lanka Partial Free Trade Scenario
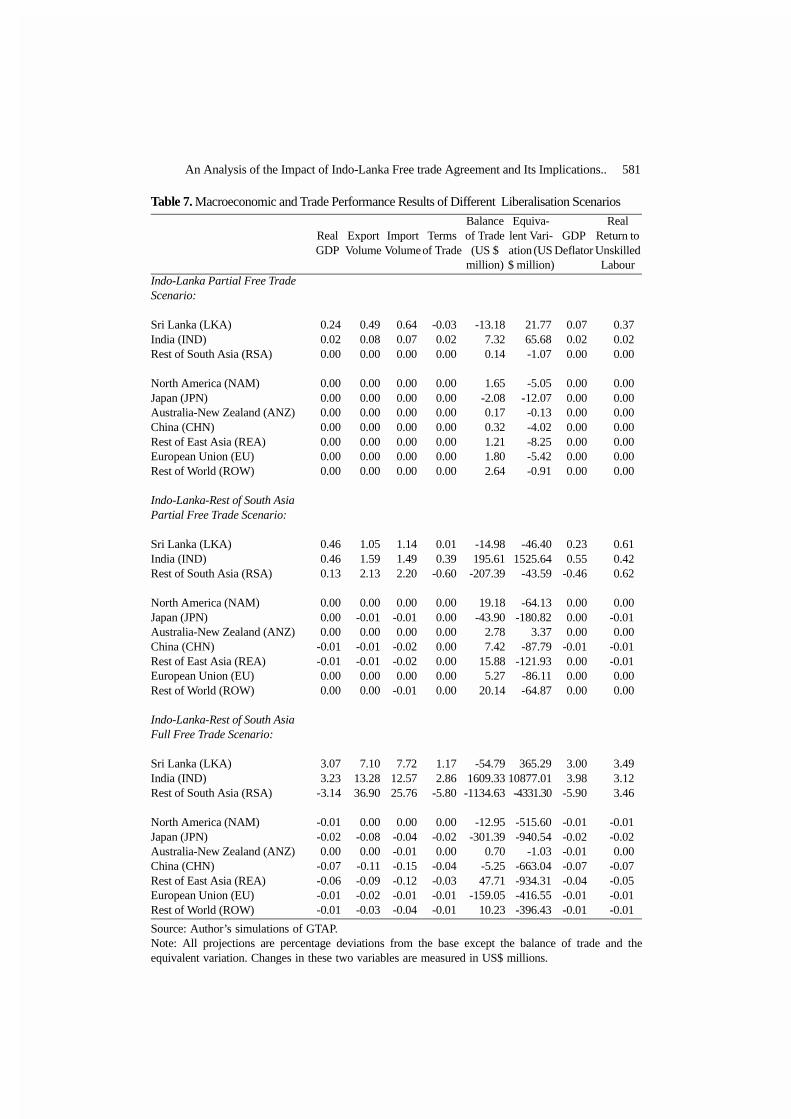
The first panel of Table 7 shows the macroeconomic and welfare effects of thetariff reductions as stipulated in the ILFTA. We find that the free trade agreementhas a much bigger impact on the Sri Lankan economy than on the Indian economy.Sri Lanka’s real GDP increases by 0.24 per cent whereas there is only a negligiblechange in India’s real GDP (0.02 per cent). Similarly, the trade results reported inTable 7 indicate a considerable expansion of export and import volumes of Sri Lanka.As imports grow faster than exports, a negative trade balance (US$ 13.1 millions)becomes inevitable. The trade expansion for India is trivial with a small positive tradebalance. Perhaps Sri Lanka’s more openness could be an explanatory factor for thenoticeable performance at the trade front in comparison to its RTA partner.
Other interesting aspects of the macroeconomic results relate to the terms oftrade effect and real returns to unskilled labour. It appears that the ILFTA may leadto an adverse terms of trade for Sri Lanka. India is projected to gain in its terms oftrade though it is very marginal. The terms of trade decline for Sri Lanka may bedue to its relative smallness of export trade with India and the similarity of theproducts both nations export. In a competitive market environment with open freertrade, Sri Lanka is perhaps experiencing a competitive disadvantage. The unskilledlabour force in Sri Lanka may experience a considerable improvement in their real incomesas a result of trade liberalisation under the agreement. This is a desirable outcome and iswelcomed by policy makers as many of those workers are employed in highly unskilledlabour intensive export oriented sectors such as textiles, and weaving apparel and leather.The welfare gains as projected by the equivalent variation is positive for both tradingpartners and Sri Lanka is placed in a better position when such gains are
An Analysis of the Impact of Indo-Lanka Free trade Agreement and Its Implications.. 581
Table 7. Macroeconomic and Trade Performance Results of Different Liberalisation Scenarios
RealGDP
ExportVolume
ImportVolume
Termsof Trade
Balance of Trade(US $
million)
Equiva-lent Vari-ation (US $ million)
GDPDeflator
Real Return to Unskilled Labour
Indo-Lanka Partial Free Trade Scenario:
Sri Lanka (LKA)India (IND)Rest of South Asia (RSA)
North America (NAM)Japan (JPN)Australia-New Zealand (ANZ)China (CHN)Rest of East Asia (REA)European Union (EU)Rest of World (ROW)
Indo-Lanka-Rest of South Asia Partial Free Trade Scenario:
Sri Lanka (LKA)India (IND)Rest of South Asia (RSA)
North America (NAM)Japan (JPN)Australia-New Zealand (ANZ)China (CHN)Rest of East Asia (REA)European Union (EU)Rest of World (ROW)
Indo-Lanka-Rest of South Asia Full Free Trade Scenario:
Sri Lanka (LKA)India (IND)Rest of South Asia (RSA)
North America (NAM)Japan (JPN)Australia-New Zealand (ANZ)China (CHN)Rest of East Asia (REA)European Union (EU)Rest of World (ROW)
0.240.020.00
0.000.000.000.000.000.000.00
0.460.460.13
0.000.000.00
-0.01-0.010.000.00
3.073.23
-3.14
-0.01-0.020.00
-0.07-0.06-0.01-0.01
0.490.080.00
0.000.000.000.000.000.000.00
1.051.592.13
0.00-0.010.00
-0.01-0.010.000.00
7.1013.2836.90
0.00-0.080.00
-0.11-0.09-0.02-0.03
0.640.070.00
0.000.000.000.000.000.000.00
1.141.492.20
0.00-0.010.00
-0.02-0.020.00
-0.01
7.7212.5725.76
0.00-0.04-0.01-0.15-0.12-0.01-0.04
-0.030.020.00
0.000.000.000.000.000.000.00
0.010.39
-0.60
0.000.000.000.000.000.000.00
1.172.86
-5.80
0.00-0.020.00
-0.04-0.03-0.01-0.01
-13.187.320.14
1.65-2.080.170.321.211.802.64
-14.98195.61
-207.39
19.18-43.90
2.787.42
15.885.27
20.14
-54.791609.33
-1134.63
-12.95-301.39
0.70-5.2547.71
-159.0510.23
21.7765.68-1.07
-5.05-12.07-0.13-4.02-8.25-5.42-0.91
-46.401525.64
-43.59
-64.13-180.82
3.37-87.79
-121.93-86.11-64.87
365.2910877.01-4331.30
-515.60-940.54
-1.03-663.04-934.31-416.55-396.43
0.070.020.00
0.000.000.000.000.000.000.00
0.230.55
-0.46
0.000.000.00
-0.010.000.000.00
3.003.98
-5.90
-0.01-0.02-0.01-0.07-0.04-0.01-0.01
0.370.020.00
0.000.000.000.000.000.000.00
0.610.420.62
0.00-0.010.00
-0.01-0.010.000.00
3.493.123.46
-0.01-0.020.00
-0.07-0.05-0.01-0.01
Source: Author’s simulations of GTAP.Note: All projections are percentage deviations from the base except the balance of trade and theequivalent variation. Changes in these two variables are measured in US$ millions.
582 Mahinda Siriwardana
considered relative to the real GDP.In general the ILFRA seems to have no discernible effect on rest of the world.
Japan is likely to be the only country which may experience some impact of the freetrade agreement between India and Sri Lanka. This is explained by the fact thatJapan is relatively an important trading partner for both countries. As expected intheory, there seems to be a minor negative welfare effect on rest of the world.
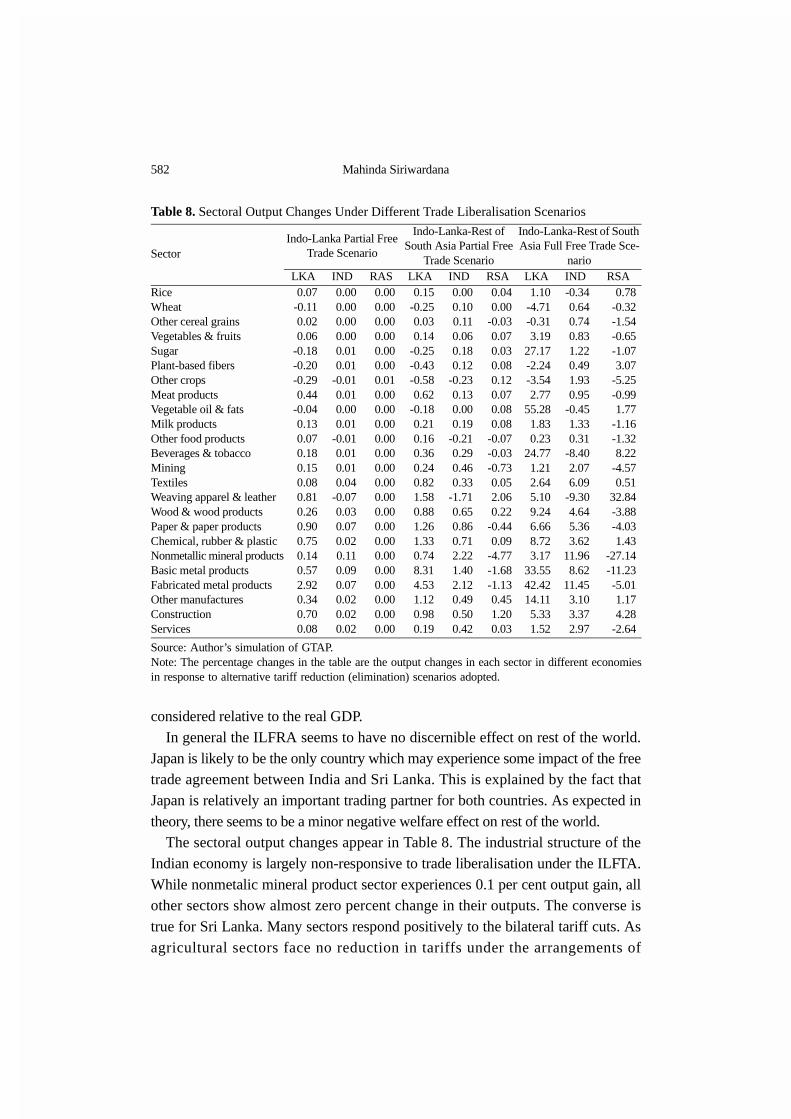
The sectoral output changes appear in Table 8. The industrial structure of theIndian economy is largely non-responsive to trade liberalisation under the ILFTA.While nonmetalic mineral product sector experiences 0.1 per cent output gain, allother sectors show almost zero percent change in their outputs. The converse istrue for Sri Lanka. Many sectors respond positively to the bilateral tariff cuts. Asagricultural sectors face no reduction in tariffs under the arrangements of
Table 8. Sectoral Output Changes Under Different Trade Liberalisation Scenarios
SectorIndo-Lanka Partial Free
Trade Scenario
Indo-Lanka-Rest of South Asia Partial Free
Trade Scenario
Indo-Lanka-Rest of South Asia Full Free Trade Sce-
narioLKA IND RAS LKA IND RSA LKA IND RSA
RiceWheatOther cereal grainsVegetables & fruitsSugarPlant-based fibersOther cropsMeat productsVegetable oil & fatsMilk productsOther food productsBeverages & tobaccoMiningTextilesWeaving apparel & leatherWood & wood productsPaper & paper productsChemical, rubber & plasticNonmetallic mineral productsBasic metal productsFabricated metal productsOther manufacturesConstructionServices
0.07-0.110.020.06
-0.18-0.20-0.290.44
-0.040.130.070.180.150.080.810.260.900.750.140.572.920.340.700.08
0.000.000.000.000.010.01
-0.010.010.000.01
-0.010.010.010.04
-0.070.030.070.020.110.090.070.020.020.02
0.000.000.000.000.000.000.010.000.000.000.000.000.000.000.000.000.000.000.000.000.000.000.000.00
0.15-0.250.030.14
-0.25-0.43-0.580.62
-0.180.210.160.360.240.821.580.881.261.330.748.314.531.120.980.19
0.000.100.110.060.180.12
-0.230.130.000.19
-0.210.290.460.33
-1.710.650.860.712.221.402.120.490.500.42
0.040.00
-0.030.070.030.080.120.070.080.08
-0.07-0.03-0.730.052.060.22
-0.440.09
-4.77-1.68-1.130.451.200.03
1.10-4.71-0.313.19
27.17-2.24-3.542.77
55.281.830.23
24.771.212.645.109.246.668.723.17
33.5542.4214.115.331.52
-0.340.640.740.831.220.491.930.95
-0.451.330.31
-8.402.076.09
-9.304.645.363.62
11.968.62
11.453.103.372.97
0.78-0.32-1.54-0.65-1.073.07
-5.25-0.991.77
-1.16-1.328.22
-4.570.51
32.84-3.88-4.031.43
-27.14-11.23-5.011.174.28
-2.64
Source: Author’s simulation of GTAP.Note: The percentage changes in the table are the output changes in each sector in different economiesin response to alternative tariff reduction (elimination) scenarios adopted.

An Analysis of the Impact of Indo-Lanka Free trade Agreement and Its Implications.. 583
“negative list”, tariff reforms tend to reduce most of the sectoral outputs. Thesignificant winners of the INLFTA on the Sri Lankan side are manufacturingsectors that are highly export oriented and that are heavily dependent on importedinputs. The fabricated metal products sector shows 2.9 per cent improvements inoutput and is a good example for the latter category. The model projects anappreciable performance for most of the manufacturing sectors which have exportmarket in India. The changes in export volumes reported in Table 9 are consistentwith the output responses which are projected by the model.
B. Indo-Lanka-Rest of South Asia Partial Free Trade Scenario
In this second trade liberalisation scenario, we consider that Sri Lanka and Indiaoffer same reciprocal tariff reduction arrangements to RSA. It is then similar to
Table 9. Changes in Export Volumes Under Different Trade Liberalization Scenarios
SectorIndo-Lanka Partial
Free Trade Scenario
Indo-Lanka-Rest of South Asia Partial Free
Trade Scenario
Indo-Lanka-Rest of South Asia Full Free
Trade ScenarioLKA IND RAS LKA IND RSA LKA IND RSA
1. Rice2. Wheat3. Other cereal grains4. Vegetables & fruits5. Sugar6. Plant-based fibers7. Other crops8. Meat products9. Vegetable oil & fats10. Milk products11. Other food products12. Beverages & tobacco13. Mining14. Textiles15. Weaving apparel & leather16. Wood & wood products17. Paper & paper products18. Chemical, rubber & plastic19. Nonmetallic mineral products20. Basic metal products21. Fabricated metal products22. Other manufactures23. Construction24. Services
-0.44-0.51-0.63-0.92-0.52-0.44-0.43-1.33-0.43-0.20-0.33-0.250.110.320.84
-0.6512.801.760.65
11.646.510.340.12
-0.69
-0.09-0.13-0.11-0.12-0.07-0.13-0.11-0.14-0.10-0.14-0.06-0.14-0.030.21
-0.160.161.870.110.860.600.68
-0.02-0.07-0.08
0.010.000.060.020.010.010.010.000.020.020.000.020.000.00
-0.010.01
-0.02-0.03-0.05-0.05-0.010.000.000.00
-0.61-1.11-1.52-1.79-0.53-0.92-0.84-2.32-1.17-0.59-0.70-0.750.063.241.642.19
15.462.893.47
70.849.961.12
-0.53-1.37
-2.00-2.86-2.89-2.80-2.34-2.88-2.42-3.00-2.14-2.92-1.28-3.100.481.42
-3.505.43
13.454.43
17.706.81
18.28-1.37-1.56-1.88
0.330.171.350.420.230.080.14
-0.280.770.18
-0.101.265.161.552.77
27.342.36
19.403.07
19.466.493.242.470.48
-13.87-15.64-21.6164.33
270.77-10.13-7.15
-10.04170.09
3.93-5.74
637.54-0.829.805.09
41.6262.7417.284.36
248.4994.1814.20-7.52
-10.00
-19.96-21.39-22.38
9.8817.25-3.4812.03
-20.22-14.53-20.27-0.40
778.54-0.2236.64
-18.3233.0680.2918.9490.2648.79
102.47-8.18
-10.55-12.53
13.367.76
17.54255.9719.1631.1947.6337.25
223.8584.0018.31
518.4429.5124.2149.27
116.1716.8199.2927.61
140.9559.0229.3521.559.44
Source: Author’s simulation of GTAP.Note: The numbers in the table are percentage deviations from the base period indicating how exports(volumes) of each economy will change in response to the different trade liberalisation scenarios.

584 Mahinda Siriwardana
establishing partial free trade area within South Asia. As shown by results in paneltwo of Table 7, such trilateral liberalisation approach tends to have much biggerimpact on real GDP of both Sri Lanka and India than of RSA. Export and importvolumes of all three regions increase while RSA being the winner in tradeperformance. However, its terms of trade decline, as trade is liberlised in theregion leaving a small gain in its overall GDP.
Consistent with poor terms of trade, Sri Lanka and RSA are likely to experiencetrade deficits in the event of partial trade liberalisation being adopted in SouthAsia. Interestingly, India turns out to be a considerable gainer from this trilateraltariff cut compared to the Indo-Lanka partial free trade scenario. This is clearlyevident from the improvement in welfare as measured by the equivalent variation. SriLanka and RSA are projected to lose their overall welfare despite improvements intheir GDP. However, the unskilled labour in South Asia tends to improve their realincome in much similar fashion across regions.
As in the case of bilateral tariff cuts between India and Sri Lanka, the rest of theworld regions show no change in their real GDP except China and REA whichshow negligible declines in GDP. Australia-New Zealand region is likely to haveminor welfare gain whereas all other regions are projected to have negative equivalentvariations in response to the formation of the South Asian partial free trade area.
Turning to the sectoral results in Table 8, it is noticed that India is beginning togather momentum from the trilateral tariff cuts as shown by the improvements inoutput performance of almost all the sectors. Sri Lanka consolidates its sectoraloutput changes in mining, manufacturing and service sectors at the expense of thecountry’s agricultural sectors. The latter group appears to be much moreunfavourably affected. RSAs response in terms of sectoral outputs is somewhatmixed and a third of its sectors are showing reductions in their outputs. The exportprojections reported in Table 9 under this scenario indicate that Sri Lanka andIndia improve their export volumes considerably and RSA also keeps up with theregional trend. Agricultural exports of Sri Lanka and India are affected badly whereasRSAs exports in that group of commodities experience a reasonable expansion.
C. Indo-Lanka-Rest of South Asia Full Free Trade Scenario
In this trade scenario, all bilateral tariffs are removed among member countries,while leaving tariff rates unchanged with nonmember countries. The trade policythus discriminates against non-South Asian countries but at the same time createsimproved market access for member countries within the region. As can be seen
An Analysis of the Impact of Indo-Lanka Free trade Agreement and Its Implications.. 585
from Table 7 (panel three), the policy of full free trade in South Asia is by far thebest option for India and Sri Lanka. Unfortunately, it is the worst for RSA as theirreal GDP declines (by 3.1 per cent) dramatically by entering into full free trade.
This contraction in real GDP for RSA is mainly due to the adverse impact onthe terms of trade that the region is projected to experience. The RSA’s volume ofexports grows at a faster rate than that of India and Sri Lanka and its increase inimport volume is well below that of exports. However, the declining terms of trademeans reduced purchasing power for RSA’s exports, which has undoubtedlycreated a considerable trade deficit for the region. Ultimately this trade deficitdictates the impact on real GDP in the region. Despite declining GDP, unskilledworkers in RSA experience an increase in wage rate. This wage rise is due to thehuge expansion in the output of Weaving, apparel & leather sector (by 32.8 percent) where majority of the unskilled workers are employed. As Table 8 shows,this sector expands at the expense of many other sectors and has a tendency toincrease the demand for unskilled labour in the economy. With the deflationaryeffects of liberalisation in general, the real returns to unskilled labour rise.
As in previous two trade policy scenarios, both Sri Lanka and RSA experiencemuch higher trade deficits. The results also indicate that the free trade area favoursthe largest nation, namely India, and it is projected to have substantial welfaregains as measured by the equivalent variation. Consistent with the decline in realGDP, RSA is likey to be worse off in terms of welfare though unskilled labour forceseemed to have achieved higher real incomes comparable to other RTA partners.
The formation of free trade area in South Asia may have trivial negative effecton nonmember countries (i.e., rest of the world regions). As would be expected,Asian neighbours (Japan, China, REA) seem to experience a relatively higherimpact. However, the magnitudes are not alarming relative to the size of GDP ofthese countries and regions so that it is safe to assume that the free trade in SouthAsia may not be a severe threat to the world economy.
Judging from the sectoral results of Table 8 and the export projections in Table9, India emerges to be a clear winner of free trade in the region. The entire removalof trade tariffs favours all sectors except weaving apparel and leather, beveragesand tobacco, and rice sectors. Interestingly, for Sri Lanka, the fear of agriculturistsfor free trade in South Asia is lessened to some extent as many sectors nowexperience considerable output gains. The economy in general is blessed by theimproved market access in the region as shown by a considerable increase insectoral performance. The free trade tends to fair poorly RSA as majority of its
586 Mahinda Siriwardana
sectors are projected to have their outputs declined.
VII. Conclusion
In this paper we have used the GTAP model to quantify the impact of the freetrade agreement between India and Sri Lanka. We also illustrate the implicationsof the extension of such agreement to include all SARRC countries. A departurefrom partial free trade as stipulated in the agreement to full free trade in SouthAsia is also examined in order to measure the impact on the regional economicperformance.
Several important conclusions could be drawn from the analysis of differentfree trade scenarios for South Asia. Based on simulation results of the Indo-Lankapartial free trade scenario, Sri Lanka seems to benefit relatively more than Indiafrom the ILFTA as shown by both GDP and welfare projections. The tradeagreement may enhance more imports from India to Sri Lanka at a much cheaperprice than before but the growth in exports is likely to be insufficient to pay for theincrease in imports. Thus an inevitable outcome for Sri Lanka is an increase in thetrade deficit which may perhaps result in a smaller growth in real GDP thanexpected. The ILFTA seems to have relatively minor impact on India. Itsperformance does not change much in GDP terms in response to liberalised tradewith Sri Lanka due to the relatively small trade that takes place between the twocountries. Surely, the reduction in duties by the Sri Lankan economy opens up anew market for Indian exporters and hence a positive trade balance is likelyagainst Sri Lanka. As would be expected, the free trade agreement has nosignificant influence on RSA as well as on rest of the world.
The extension of the ILFTA to all SAARC countries could be an interestingtrade policy scenario for South Asia. Our results indicate that Sri Lanka wouldbenefit from such regional trading arrangements by almost doubling its GDPperformance experienced from the ILFTA. India being the largest economy in theregion could improve its benefits from liberalisation in trade within the region andit has the potential to gain more than other members. Its trade balance willimprove while other members (i.e., Sri Lanka and RSA) experience substantialdeficits. The deterioration of the terms of trade for RSA is somewhat disturbingnews resulting a slower GDP growth for that group of countries in South Asia.
Our findings from the full free trade scenario in South Asia suggest that SriLanka and India will be clear winners while RSA becomes a looser in terms of GDP

An Analysis of the Impact of Indo-Lanka Free trade Agreement and Its Implications.. 587
growth. The latter group appears to be severely affected by the adverse terms oftrade with the elimination of bilatteral tariffs. India being the largest economy inthe region may enjoy the highest benefits from full free trade in South Asia. Theimproved market access in the region is in favor of all South Asian nations and ourresults clearly show that regional trade will expand considerably. The unskilledlabour force in the region will experience a real income growth. The resultsprovide some empirical evidence that nonmembers welfare could be reduced withthe formation of the South Asian free trade area though the extent of change inwelfare is trivial relative to the size of the nonmembers.
The policy implication from the results is that the bilateral trade liberalisationunder the ILFTA is not as bad as some segments of industrialists argue in Sri Lanka. Itis possible to remove tariff barriers without severely affecting the economicperformance of the country. There seems to be considerable gains to Sri Lanka fromthe agreement in the long run. However, these gains are realised at the expense of anincreased trade deficit. The extension of the agreement to all SARRC nations underSAFTA is likely to benefit the region as a whole by increased trade within South Asia.The SAARC nations should work hard to implement the SAFTA as soon as possibleas it appears to be potentially more beneficial than bilateral trade liberalisation for realGDP growth in the region. Full free trade in South Asia under SAFTA may perhapsdisadvantage smaller countries in the region and the SAARC must be prepared tooffer necessary assistance for such nations to ensure their full participation in theagreement. Tension may arise between agriculture and manufacturing under freetrade in South Asia, as the latter is likely to expand faster with the removal of tradebarriers. Such structural imbalance cannot be overlooked since a considerableproportion of the labour force is still engaged in agriculture in South Asia.
Acknowledgements
The author acknowledges the helpful comments and suggestions from theanonymous referee. The paper also benefited from comments of participants of theBiennial Conference of Hong Kong Economic Association on the Asian PacificEconomies in the New Millenium, December 14-16, 2000, Hong Kong. TheUniversity of New England provided financial support for this research.
Received 20 March 2002, Accepted 23 May 2003
588 Mahinda Siriwardana
References
Bhagwati, J. and Panagariya, A. (1996). The Economics of Preferential Trade Agreements,Washington D.C., AEI Press.
Central Bank of Sri Lanka (1999, pp.138-39). Annual Report: 1998, Colombo, Sri Lanka.Krueger, A. O. (1999). “Are Preferential Trading Arragements Trade-Liberalizing or
Protectionist?,” Journal of Economic Perspectives, 13: 105-124.Dixon, P.B., Parmenter, B.R., Sutton, J. and Vincent, D.P. (1982). ORANI: Multisectoral
Model of the Australian Economy, Amsterdam, North-Holland.Hertel, T.W. (1996). Global Trade Analysis: Modelling and Applications, , New York and
Cambridge, Cambridge University Press.International Monetary Fund, Direction of Trade Statistics Yearbook, various issues.McDougall, R.A., Elbehri, A. Truong, T.P. (1998). Global Trade, Assistance, and
Protection, Centre for Global Trade Analysis, Purdue University.Mukherji, I.N. (1998). “The South Asian Preferential Trading Arrangement: Identifying
Products in Indias Regional Trade,” Asia-Pacific Development Journal, 5: 37-70.Panagariya, A. (1996), “The Free Frade Areas of Americas : Good for Latin America?”,
The World Economy, 19: 485-516.Panagariya, A. (1998), “The Regionalism Debate : An Overview,” Center for International
Economics, Department of Economics, University of Maryland at Collegepark,Working paper NO.40
Panagariya, A. (1999), “The Trade Policy in South Asia : Recent Liberalization andFuture Agenda”, The World Economy, 22: 353-377
Srinivasan, T. N. (1994), “Regional Trading Arrangement and Beyond : Exploring someOptions for South Asia : Theory, Empirics, and Policy”, Report No. IDP-142, WorldBank, Washington D.C.
Srinivasan, T.N. (1998), Developing Countries and the Multinational Trading System :From GATT to the Uruguay Round and the Future, Dehli: Oxford University Press.
Siriwardana, M. (2000). “Looking Beyond SAARC: Some Trade Liberalisation Optionsfor Sri Lanka,” Asian Studies Review, 25: 453-477.

An Analysis of the Impact of Indo-Lanka Free trade Agreement and Its Implications.. 589
Appendix A1. Regional and Commodity Aggregation
Aggregated Region GTAP Region Aggregated Commodity GTAP Commodity1 North America (NAM)
2 Japan (JPN)3 Australia-New Zealand (ANZ)
4 China (CHN)
5 Rest of East Asia (REA)
6 India (IND)
7 Sri Lanka (LKA)
8 Rest of South Asia (RSA)
9 European Union (EU)
10 Rest of the World (ROW)
U.S.A.CanadaMexicoJapanAustraliaNew Zealand
ChinaHong KongIndonesiaMalaysiaPhilippinesThailandTaiwanSingaporeKoreaVietnam
India
Sri Lanka
Rest of South Asia
United KingdomGermanyDenmarkSwedenFinlandRest of European Union
Rest of the World (20 regions)
1 Rice
2 Wheat3 Other cereal grain4 Vegetables & fruits
5 Sugar
6 Plant-based fibers7 Other crops
8 Meat products
9 Vegetable & fats
10 Milk products
11 Other food products
12 Beverages & tobacco
13 Mining
14 Textiles
15 Weaving apparel & leather
16 Wood & wood products
17 Paper & paper products18 Chemical, rubber & plastic19 Nonmetallic mineral products 20 Basic metal products21 Fabricated metal products
22 Other manufactures23 Construction24 Services
Paddy rice, Processed rice
WheatCereal grains necVegetables, fruits, nuts, Oil seeds
Sugar cane, sugar beet, Sugar
Plant-based fibersCrops nec
Bovine cattle, sheep and goat, horse meat products, Animal products necMeat products necVegetable oils and fats
Raw milk, Dairy products
Fishing, Food products nec
Beverages & tobacco prods
Coal, Oil, Gas, Minerals necPetroleum, coal products
Textiles, Wool silk-worm cocoons
Wearing apparel, Leather products
Forestry, Wood products
Paper products, publishingChemical, rubber, plastic Mineral products necFerrous metals, Metals necMetal productsMotor vehicles and partsTransport equipment necElectronic equipmentMachinery & equipment necManufactures necConstructionElectricityWater, Gas manufacture,
distributionTrade, transportFinancial, business,
recreational servicesPublic admin. & defence,
education, healthDwellings
Source: McDougall et al., 1998.