Embed Size (px)
Citation preview
An Analysis of the Gender Pay Gap in the Egyptian
Labour Market
Amal Khairy Amin Mohamed (CAPMAS, Egypt)
Paper prepared for the IARIW-CAPMAS Special Conference “Experiences and Challenges in
Measuring Income, Wealth, Poverty and Inequality in the Middle East and North Africa”
Cairo, Egypt
November 23-25, 2015
Session 7: Inequality II
Tuesday, November 24, 2015
12:45-14:45
IARIW-CAPMAS conference on
“Experiences and Challenges in Measuring
National Income, Wealth, Poverty
And Inequality in the Arab World”
Cairo, Egypt
23-25 November, 2015
An analysis of the Gender Pay Gap in Egyptian Labour Market
By: Amal Khairy Amin Mohamed
Central Agency for Public
Mobilization and Statistics (CAPMAS)
Egypt
This paper investigates whether a gender pay gap exists within the Egyptian
Labour market and, if so, the extent of the phenomena; so the paper defines
what is meant by the Gender Gap and Gender Pay Gap, identifies how to
measure the Gender Pay Gap, studies the results of measuring the gender Pay
gap in the Egyptian Labour market according to economic activity, sectors, and
the governorates. And finally studies the evolution of the Gender Pay Gap in
Egypt during the last ten years.
Keywords: Gender Gap, Gender Pay Gap, Gender Discrimination, Equal pay,
Gender inequality.
2
Table of Contents
I. Introduction 3
II. A Brief Literature Review 4
III. Research methodologies and limitations 5
IV. Gender Gap and Gender Pay Gap definitions and measures 7
V. Gender Pay Gap in Egypt 8
a. Economic development of Egypt 8
b. Women in the Egyptian Labour market 11
c. Results of analysis for Gender Pay Gap in Egypt 14
VI. Conclusion & recommendations 27
VII. References 30
Acronyms
CAPMAS: Central Agency for public mobilization and statistics.
GPG: Gender Pay Gap.
ILO: International Labour Organization.
WEF: World Economic Forum.
ASewhw: The Annual Survey of employment, wages and hours of work.
ISIC Rev.3: International Standard Industrial Classification of All Economic
Activities Revision 3.
ISIC Rev.4: International Standard Industrial Classification of All Economic
Activities Revision 4.
3
I- Introduction:
There were several attempts to approve equal pay between men and women at
work since 1919, as the ILO Constitution has included, the concept of “equal pay
for women and men”, however, the first global agreement on equal pay was set in
1951; where the convention No. 100 was held, after World War II, as many
women take over the senior positions during the war.
The convention No. 100 was agreed by most Arab member states including
Egypt, with the exception of Bahrain, Kuwait, Oman and Qatar. After that, the
agreement No. 111 (1958) included "prohibits any distinction, exclusion or
preference based on several grounds including sex"; it has been endorsed by
more than 90% of the Member States of the Organization.
According to Global Wage Report 2014-2015, -provided by ILO every two
years, to review the main trends in wages in developed, emerging and developing
countries- the "gender pay gap" index, which measure inequality in wages
between men and women: women’s average wages are between 4 to 36 per cent,
less than men’s, but the gap widens in absolute terms for higher-earning women.
The ILO expects that at the current rate of progress, it will take 75 years to make
the principle of “equal pay for equal work” a reality for women and men. Women
make up 60% of the world’s working poor, they are denied access to decent work
and experience exploitative conditions at work.
According to WEF’s Global Gender Gap Report 2014, No single country has
closed the income gap between men and women, and women currently have 60
percent of the economic opportunities men have worldwide, an increase of just
four percentage points since WEF began its study in 2006.

4
Gender inequality in work not only has consequences for women; it carries major
costs for all, including businesses and the wider economy. In 2012 the (ILO)
estimated that globally an additional US$ 1.6 trillion in output could be generated
by reducing the gap in employment between women and men. Ensuring that
women’s work, both in and outside the home, is valued and rewarded fairly is a
key factor in fighting poverty and driving prosperity for all.
II- A Brief Literature Review:
There were a number of studies on discrimination against women in the Egyptian
Labour market, especially the gender pay gap.
(Said, Mona, 2006) study indicated that the relative rewards of women in 2006
have significantly improved compared to the situation in 1998. And although the
government sector remains a haven for women, paying them higher wages than
elsewhere, the magnitude of those wage gaps have significantly declined compared
to the past.
(El-Hamidi, Fatma, 2008) study evaluated the impact of trade liberalization and
reductions in trade barriers on gender wage inequality in Egypt. The study showed
that not only wage discrimination was observed regardless of sector of
employment, but also deterioration was detected. Results also indicate that tradable
sectors have experienced proportionately higher levels of wage differences
between men and women than non-tradable sectors.
(El-Haddad, Amirah, 2009) study showed that women receive lower wages than
men, not because men enjoy better skills or more advanced levels of education, but
because of discrimination based on sex.
(Hendy, Rana and Zaki, Chahir, 2010) paper developed a microsimulation analysis
to evaluate the impact of trade liberalization policies in Egypt on income
redistribution. This assessment allows them to find out to what extent such
5
macroeconomic policies affect, on the microeconomic level, females poverty,
wages and employment opportunities.
(El-Haddad, Amirah, 2011) analyzed data from a survey of firms and workers in
the textiles and clothing sector collected in 2009. There is a pay gap in this sector,
with men receiving an hourly wage 29 percent higher than that of women. This gap
arises partly as women are concentrated in the lower paid occupations and lower-
paying firms.
(Maged, wafaa, 2012) paper identified the challenges and obstacles of accessing
wages statistics, as lack of data and statistics regarding employment mechanism or
women's employment in the informal sector, Shortage of the field surveys because
of their high cost, and Lack of data flow from the community to the statistical
system, which results in a severe lack of statistics and information and the
reluctance of citizens from making statements as a result of the absence or low
statistical awareness.
(Al Azzawi, 2013) study investigated the extent of gender discrimination in the
Egyptian manufacturing sector, and the impact of trade reform on the gender wage
gap and on female employment. Study indicated that the gender wage gap, most of
which is “unexplained” by worker characteristics, is high and has increased
dramatically over time.
(Biltagy, Marwa, 2014) paper focused on estimating wage differences between
males and females in Egypt using the Oaxaca decomposition technique. It is
estimated that, the wage gap between males and females is 25% and the results
ascertain that the overall gap is attributed to discrimination against women.
III- Research methodologies and limitations:
The paper analyzed the gender pay gap in Egypt during the period (2004-2014). It
depended on results of The Annual Survey of employment, wages and hours of
6
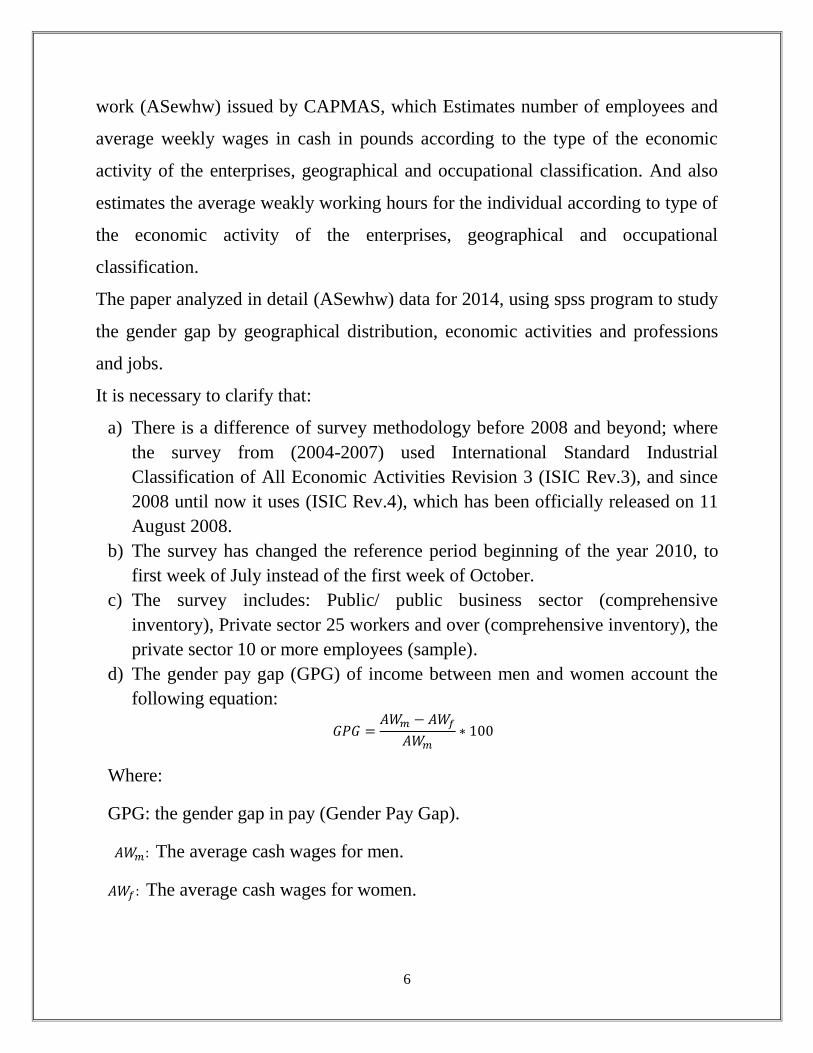
work (ASewhw) issued by CAPMAS, which Estimates number of employees and
average weekly wages in cash in pounds according to the type of the economic
activity of the enterprises, geographical and occupational classification. And also
estimates the average weakly working hours for the individual according to type of
the economic activity of the enterprises, geographical and occupational
classification.
The paper analyzed in detail (ASewhw) data for 2014, using spss program to study
the gender gap by geographical distribution, economic activities and professions
and jobs.
It is necessary to clarify that:
a) There is a difference of survey methodology before 2008 and beyond; where
the survey from (2004-2007) used International Standard Industrial
Classification of All Economic Activities Revision 3 (ISIC Rev.3), and since
2008 until now it uses (ISIC Rev.4), which has been officially released on 11
August 2008.
b) The survey has changed the reference period beginning of the year 2010, to
first week of July instead of the first week of October.
c) The survey includes: Public/ public business sector (comprehensive
inventory), Private sector 25 workers and over (comprehensive inventory), the
private sector 10 or more employees (sample).
d) The gender pay gap (GPG) of income between men and women account the
following equation:
𝐺𝑃𝐺 =𝐴𝑊𝑚 − 𝐴𝑊𝑓
𝐴𝑊𝑚∗ 100
Where:
GPG: the gender gap in pay (Gender Pay Gap).
𝐴𝑊𝑚: The average cash wages for men.
𝐴𝑊𝑓: The average cash wages for women.
7
IV- Gender Gap and Gender Pay Gap definitions and measures:
The gender gap is defined as "A disproportionate difference, as in attitudes and
voting preferences, between the sexes"1. Another definition is "the difference
between women and men in regard to social, political, economic, or other
attainments or attitudes, or the problem perceived to exist because of such
difference"2.
The United Nations -at the framework of its development program (UNDP)-
provided an innovative indicator of the gender gap (GII) in 2010. The index is one
of the first three experimental indicators that officially presented to measure the
gender gap in different countries, and these indicators are: Inequality-adjusted
Development Index (IHDI), multi-dimensional Human poverty index (MPI), and
the Gender Inequality Index (GII).
The main objective of (GII) index, is helping governments to understand the
implications of the gap between men and women, and to compare these gaps
across different countries.
The gender pay gap is "the difference between women’s and men’s average weekly
full-time equivalent earnings". It is derived from a comparison of the pay of men
and women employees doing equal work. The extent of the gender pay gap will
vary from one organization to another and from one part of the organization to
another.
The statistical gender pay gap is determined by calculating women's overall
average pay as a percentage of men's. So, for example, the pay gap is said to be 17
1 American Heritage, Dictionary of the English Language, Fifth Edition. Copyright 2011 by Houghton Mifflin Harcourt Publishing Company. Published by Houghton Mifflin Harcourt Publishing Company. 2 Random House Kernerman Webster's College Dictionary, 2010 K Dictionaries Ltd. Copyright 2005, 1997, 1991 by Random House, Inc.
8
per cent where women's pay is 83 per cent of men's. The gap is said to 'narrow' as
women's average pay moves closer to men's.3.
The gender pay gap index was defined by Eurostat as the "relative variation (as a
percentage) between the average wage between men and women".
The higher the ratio the higher the difference (the gap) in gender pay in the
economy4.
V- Gender Pay Gap in Egypt:
The paper will start with an overview of Economic development of Egypt, Then an
overview of Women in the Egyptian Labour market, before starting the analysis of
Gender Pay Gap in Egypt.
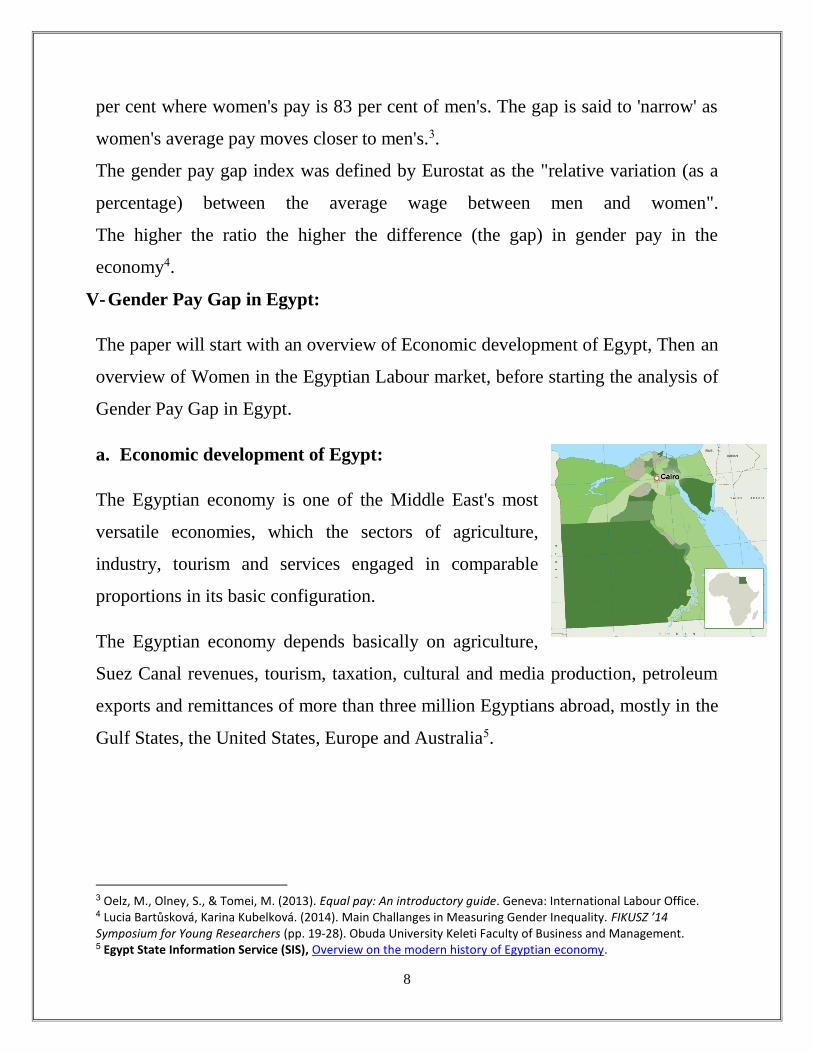
a. Economic development of Egypt:
The Egyptian economy is one of the Middle East's most
versatile economies, which the sectors of agriculture,
industry, tourism and services engaged in comparable
proportions in its basic configuration.
The Egyptian economy depends basically on agriculture,
Suez Canal revenues, tourism, taxation, cultural and media production, petroleum
exports and remittances of more than three million Egyptians abroad, mostly in the
Gulf States, the United States, Europe and Australia5.
3 Oelz, M., Olney, S., & Tomei, M. (2013). Equal pay: An introductory guide. Geneva: International Labour Office. 4 Lucia Bartůsková, Karina Kubelková. (2014). Main Challanges in Measuring Gender Inequality. FIKUSZ ’14 Symposium for Young Researchers (pp. 19-28). Obuda University Keleti Faculty of Business and Management. 5 Egypt State Information Service (SIS), Overview on the modern history of Egyptian economy.
9
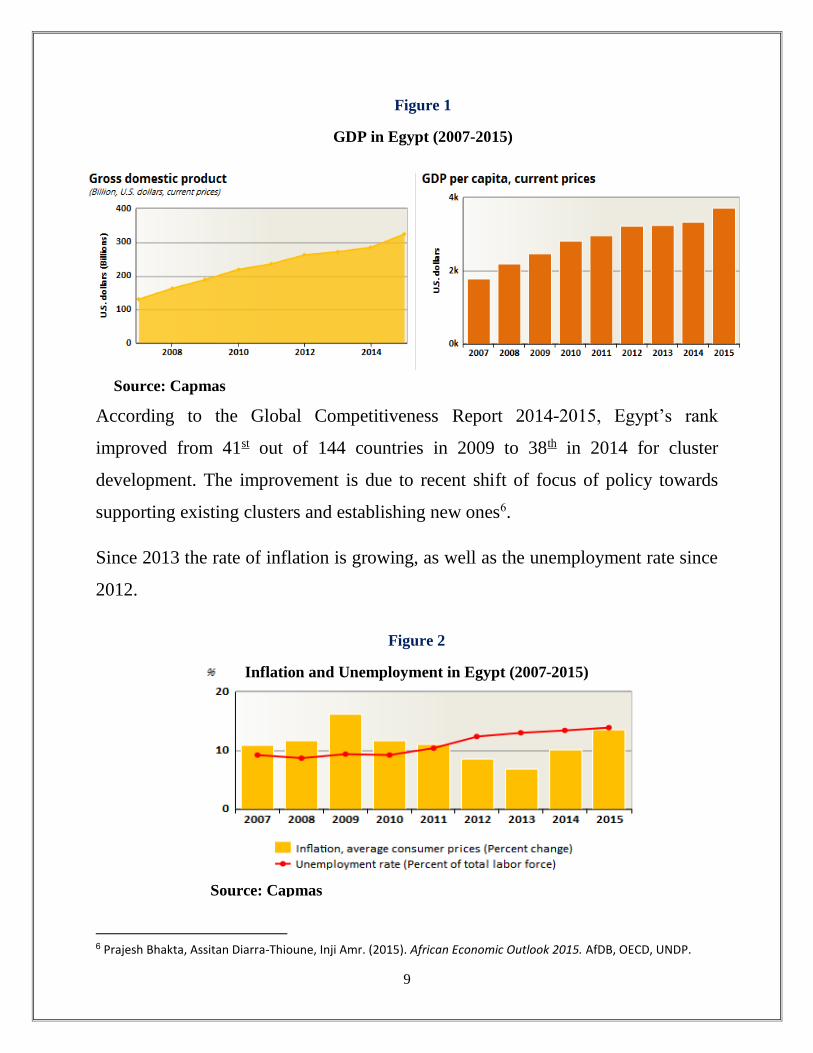
According to the Global Competitiveness Report 2014-2015, Egypt’s rank
improved from 41st out of 144 countries in 2009 to 38th in 2014 for cluster
development. The improvement is due to recent shift of focus of policy towards
supporting existing clusters and establishing new ones6.
Since 2013 the rate of inflation is growing, as well as the unemployment rate since
2012.
6 Prajesh Bhakta, Assitan Diarra-Thioune, Inji Amr. (2015). African Economic Outlook 2015. AfDB, OECD, UNDP.
Figure 1
GDP in Egypt (2007-2015)
Source: Capmas
Figure 2
Inflation and Unemployment in Egypt (2007-2015)
Source: Capmas
10
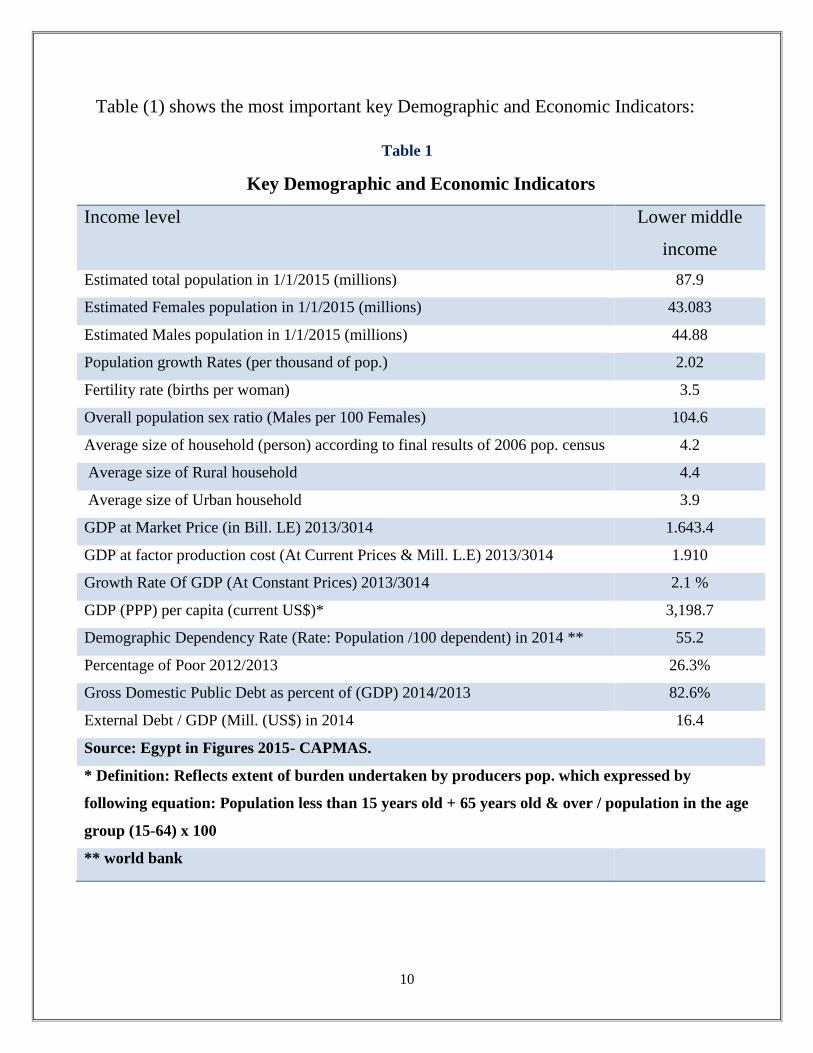
Table (1) shows the most important key Demographic and Economic Indicators:
Table 1
Key Demographic and Economic Indicators
Income level Lower middle
income
Estimated total population in 1/1/2015 (millions) 87.9
Estimated Females population in 1/1/2015 (millions) 43.083
Estimated Males population in 1/1/2015 (millions) 44.88
Population growth Rates (per thousand of pop.) 2.02
Fertility rate (births per woman) 3.5
Overall population sex ratio (Males per 100 Females) 104.6
Average size of household (person) according to final results of 2006 pop. census 4.2
Average size of Rural household 4.4
Average size of Urban household 3.9
GDP at Market Price (in Bill. LE) 2013/3014 1.643.4
GDP at factor production cost (At Current Prices & Mill. L.E) 2013/3014 1.910
Growth Rate Of GDP (At Constant Prices) 2013/3014 2.1 %
GDP (PPP) per capita (current US$)* 3,198.7
Demographic Dependency Rate (Rate: Population /100 dependent) in 2014 ** 55.2
Percentage of Poor 2012/2013 26.3%
Gross Domestic Public Debt as percent of (GDP) 2014/2013 82.6%
External Debt / GDP (Mill. (US$) in 2014 16.4
Source: Egypt in Figures 2015- CAPMAS.
* Definition: Reflects extent of burden undertaken by producers pop. which expressed by
following equation: Population less than 15 years old + 65 years old & over / population in the age
group (15-64) x 100
** world bank
11
- The employed person's share of GDP has increased from 12.704 to 13.074
pounds during the period (1998-2002), (2003 to 2007) and then fell to
12.980 pounds during the period (2008-2012). (World Bank, 2012).
b. Women in the Egyptian Labour market:
Article 11 of the Egyptian constitution obliges the state to achieve gender equality
regarding civilian, political, economic, social and cultural rights. It also urges the
state to take the measures necessary to ensure women’s fair representation in
parliament and calls for an end to discriminating against women. The article
obliges the state to protect women against all forms of violence and to provide
mothers and children with adequate care.
In the labour market, women are strongly discriminated against with only 26% of
them in the labour force. Although the Government does not have a clear published
strategy to achieve gender equality and women’s empowerment, donors and
specialised NGOs are active in the field. Programmes directed at the economic
integration of women through providing credit and financial literacy, as well as
self-defence and character development, are among the widest reaching. Given that
financial inclusion is a strategic objective for the government, donors are focusing
on microfinance for women in Upper Egypt where severe poverty prevails7.
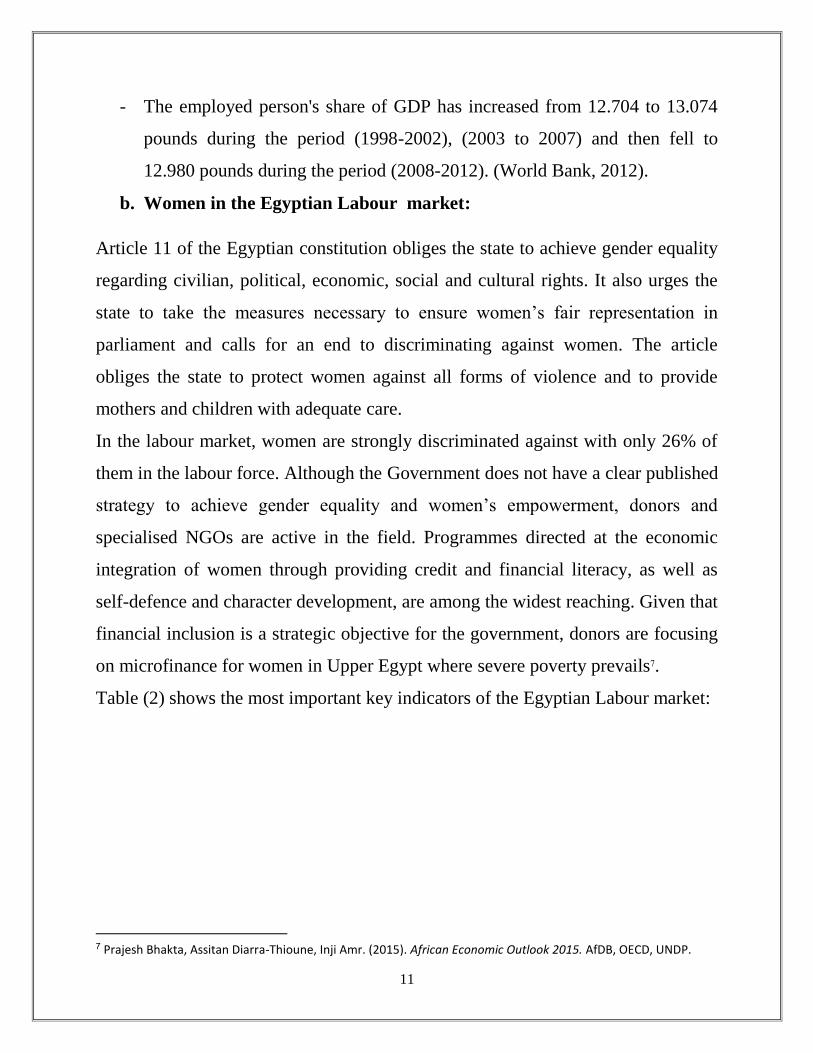
Table (2) shows the most important key indicators of the Egyptian Labour market:
7 Prajesh Bhakta, Assitan Diarra-Thioune, Inji Amr. (2015). African Economic Outlook 2015. AfDB, OECD, UNDP.
12
Table 2
Key Egyptian market Indicators
Total Force in 2013 (Unit: 1000) 27.6
Male Labour Force in 2013 (Unit: 1000) 21.1
Female Labour Force in 2013 (Unit: 1000) 6.4
Unemployment Rate (% of force) in 2013 13.2
Female adult unemployment rate (% of female force) 24.2
Male adult unemployment rate (% of male force) 9.8
Share of women in wage employment in the nonagricultural
sector (% of total nonagricultural employment)
18.6
Self-employed, female (% of females employed) 48.2
Self-employed, male (% of males employed) 36.6
Self-employed, total (% of total employed) 38.9
Vulnerable employment, female (% of female employment) 46
Vulnerable employment, male (% of male employment) 21.3
Vulnerable employment, total (% of total employment) 26.4
Wage and salaried workers, female (% of females employed) 51.8
Wage and salary workers, male (% of males employed) 63.4
Wage and salaried workers, total (% of total employed) 61.1
Ratio of female to male Labour force participation rate (%)
(national estimate)
31.26
Ratio of female to male Labour force participation rate (%)
(modeled ILO estimate)
31.68
Source: world Bank
13
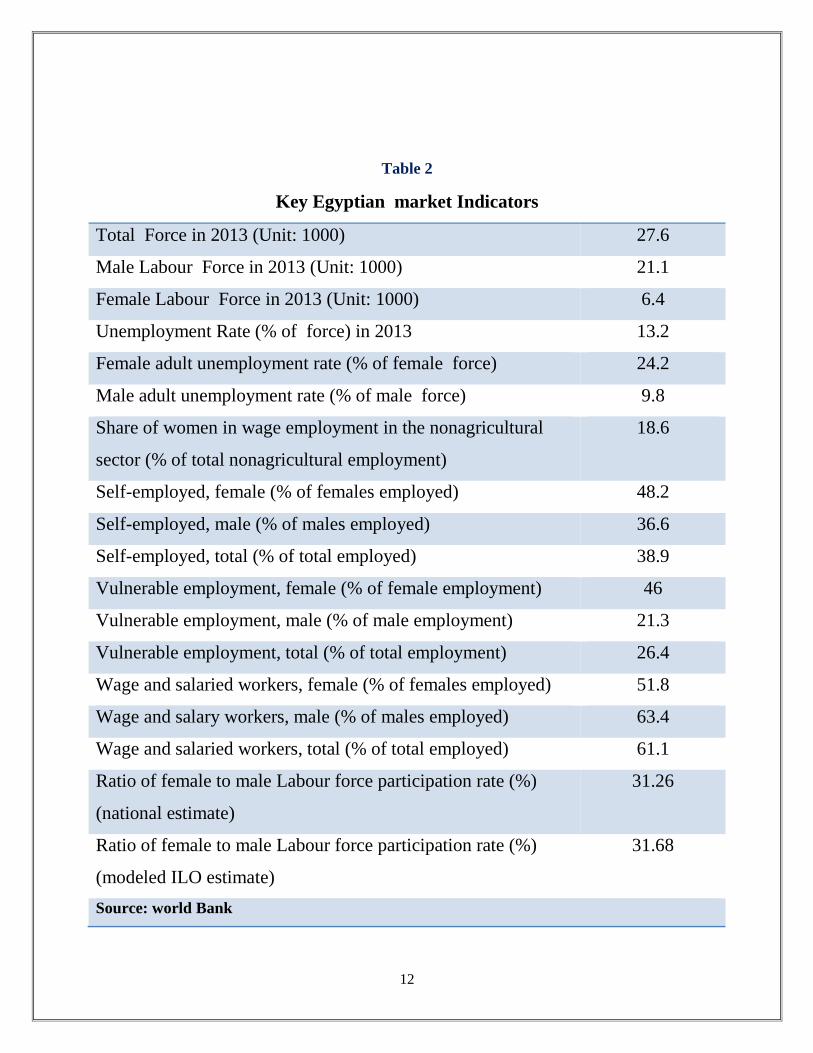
- The labor force in 2014 estimated to
76.3% for male, and 23.7 for
female.
- Unemployment rate in 2014
estimated to 9.6% for male, and 24%
for female.
- The proportion of female contribution
in the Labour force compared to
males decreases, also the contribution
of each of the male and female ratio
decreased during the period from
1990 - 2014, where the ratio of
males in 1990 decreased from
77.1% to 72.3% in 2014, and for
females from 26.2% in 1990 to
23.1% in 2014.
Source: CAPMAS - survey 1990 - 2014
9.6
24
0
5
10
15
20
25
30
Male Female
%
Figure (4)
Unemployment rate in 2014 by sex
Source: CAPMAS - Labour survey 2014
Male76%
Female24%
Figure (3)
Labour force in 2014 by sex
Source: CAPMAS - Labour survey 2014
77.1 74 7377 75 73.4 72.3
26.222 22 22.8 23.2 22.9 23.1
0
20
40
60
80
100
1990 1995 2000 2005 2010 2013 2014
%
Figure (5)
The proportion of contribution in the
labor force in Egypt
male female
14
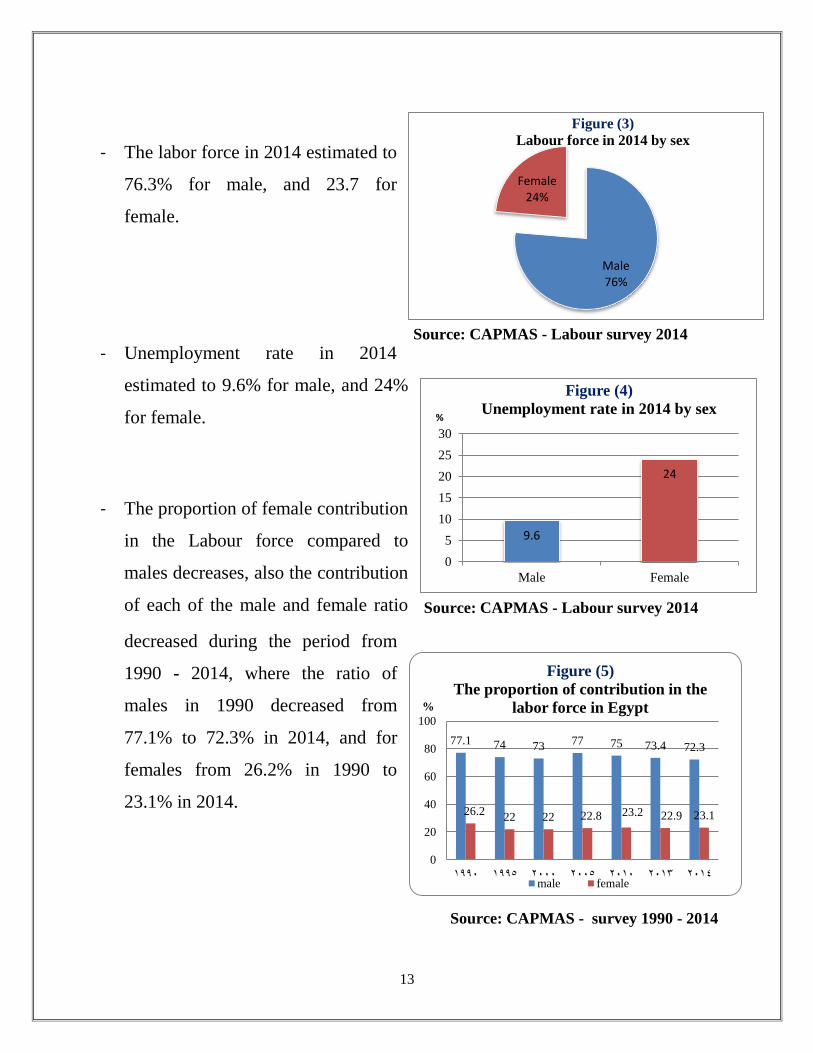
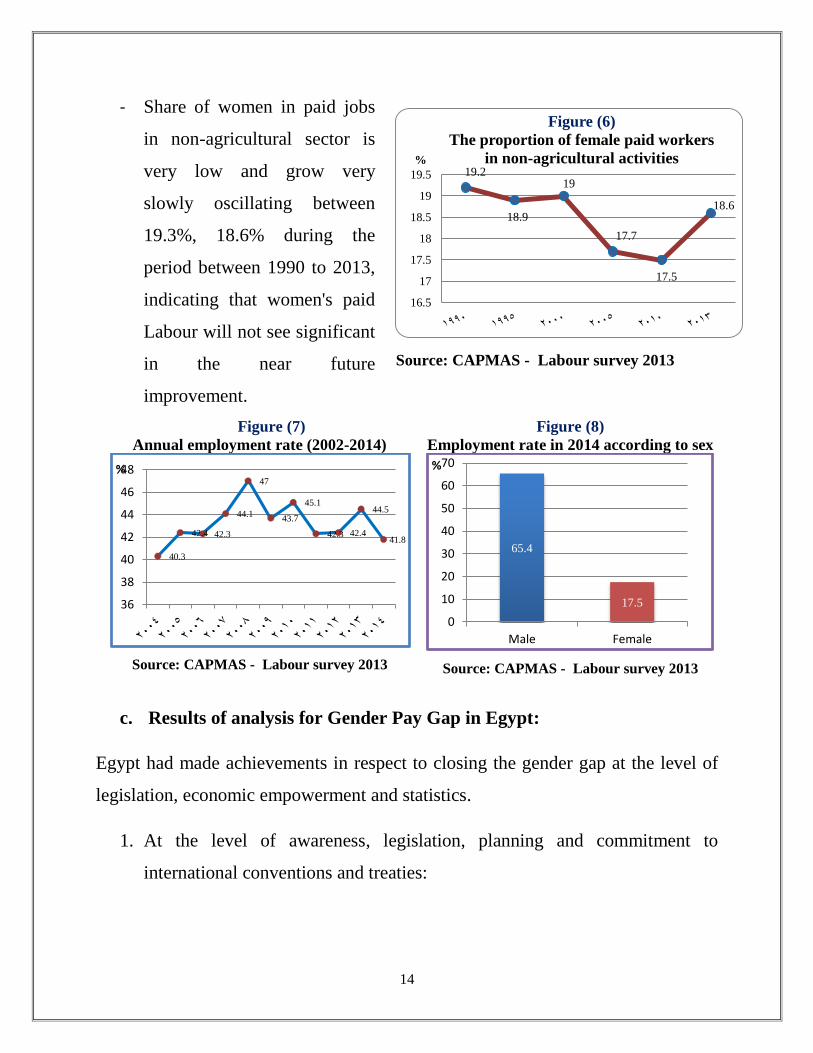
- Share of women in paid jobs
in non-agricultural sector is
very low and grow very
slowly oscillating between
19.3%, 18.6% during the
period between 1990 to 2013,
indicating that women's paid
Labour will not see significant
in the near future
improvement.
Figure (7)
Annual employment rate (2002-2014)
Figure (8)
Employment rate in 2014 according to sex
Source: CAPMAS - Labour survey 2013
Source: CAPMAS - Labour survey 2013
c. Results of analysis for Gender Pay Gap in Egypt:
Egypt had made achievements in respect to closing the gender gap at the level of
legislation, economic empowerment and statistics.
1. At the level of awareness, legislation, planning and commitment to
international conventions and treaties:
40.3
42.4 42.3
44.1
47
43.7
45.1
42.3 42.4
44.5
41.8
36
38
40
42
44
46
48%
65.4
17.5
0
10
20
30
40
50
60
70
Male Female
%
Source: CAPMAS - Labour survey 2013
19.2
18.9
19
17.7
17.5
18.6
16.5
17
17.5
18
18.5
19
19.5
%
Figure (6)
The proportion of female paid workers
in non-agricultural activities
15
Egypt has ratified the Convention of the Elimination of All Forms of
Discrimination against Women (Cedaw) and signed it in July 16, 1980, and ratified
it in September 1980.
2. At the level of economic empowerment:
Egyptian National Council for Women founded a center for the development of
women's skills includes branches in 16 governorates, it is aimed to the economic
empowerment of women by providing women wishing to join the labor market
with skills required to encourage them to do small projects. The center includes a
section for E-training, and a website dedicated to the E-marketing.
Responsive budget for gender issues:
At the framework of the official commitment to gender issues in legislation and
public policy, Egypt began to adopt the concept of responsive budgets to gender
issues. And this is extended to planning, monitoring and evaluation. Equal
Opportunities Unit in the Ministry of Finance, in cooperation with the National
Council for Women helped in spreading the concept of responsive budgets to
gender issues among workers in the Ministry of Finance and Participants in the
preparing the state budget project.
The poverty burden on women:
In the fight against poverty, Egypt continued its efforts within national strategies
and multifaceted programs devoted to the empowerment of rural women.
Among these projects: Breadwinner Women, rural women's program to create 27
NGO for rural pioneers, in addition to small grants project in four governorates.
16
3. At level of data and statistics:
CAPMAS publishes an annual booklet (women and men status) in order to give a
clear picture of the status of women compared to men in various fields,
highlighting the relationships, gaps and achieved progress in the direction of
equality and their equal opportunities in social, economic and political fields. And
developed new indicators to measure the non-stereotyped gender equality in the
areas of employment, health, education and political rights8.
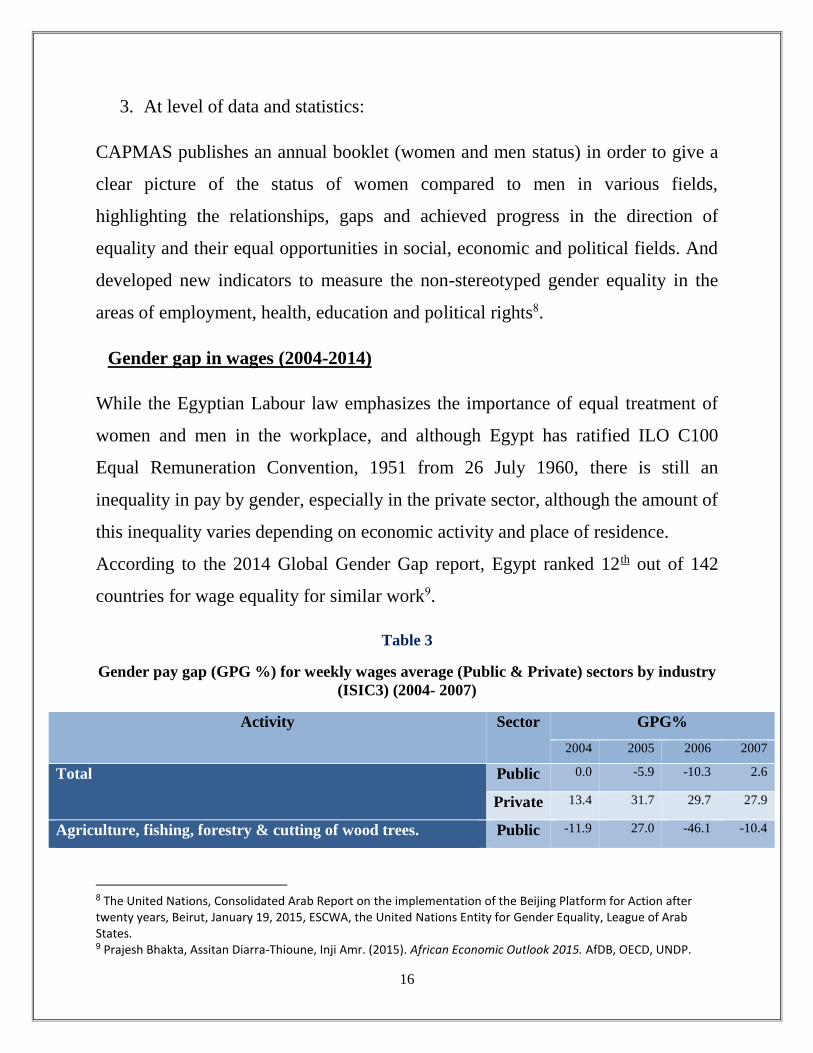
Gender gap in wages (2004-2014)
While the Egyptian Labour law emphasizes the importance of equal treatment of
women and men in the workplace, and although Egypt has ratified ILO C100
Equal Remuneration Convention, 1951 from 26 July 1960, there is still an
inequality in pay by gender, especially in the private sector, although the amount of
this inequality varies depending on economic activity and place of residence.
According to the 2014 Global Gender Gap report, Egypt ranked 12th out of 142
countries for wage equality for similar work9.
Table 3
Gender pay gap (GPG %) for weekly wages average (Public & Private) sectors by industry
(ISIC3) (2004- 2007)
Activity Sector GPG%
2004 2005 2006 2007
Total Public 0.0 -5.9 -10.3 2.6
Private 13.4 31.7 29.7 27.9
Agriculture, fishing, forestry & cutting of wood trees. Public -11.9 27.0 -46.1 -10.4
8 The United Nations, Consolidated Arab Report on the implementation of the Beijing Platform for Action after twenty years, Beirut, January 19, 2015, ESCWA, the United Nations Entity for Gender Equality, League of Arab States. 9 Prajesh Bhakta, Assitan Diarra-Thioune, Inji Amr. (2015). African Economic Outlook 2015. AfDB, OECD, UNDP.
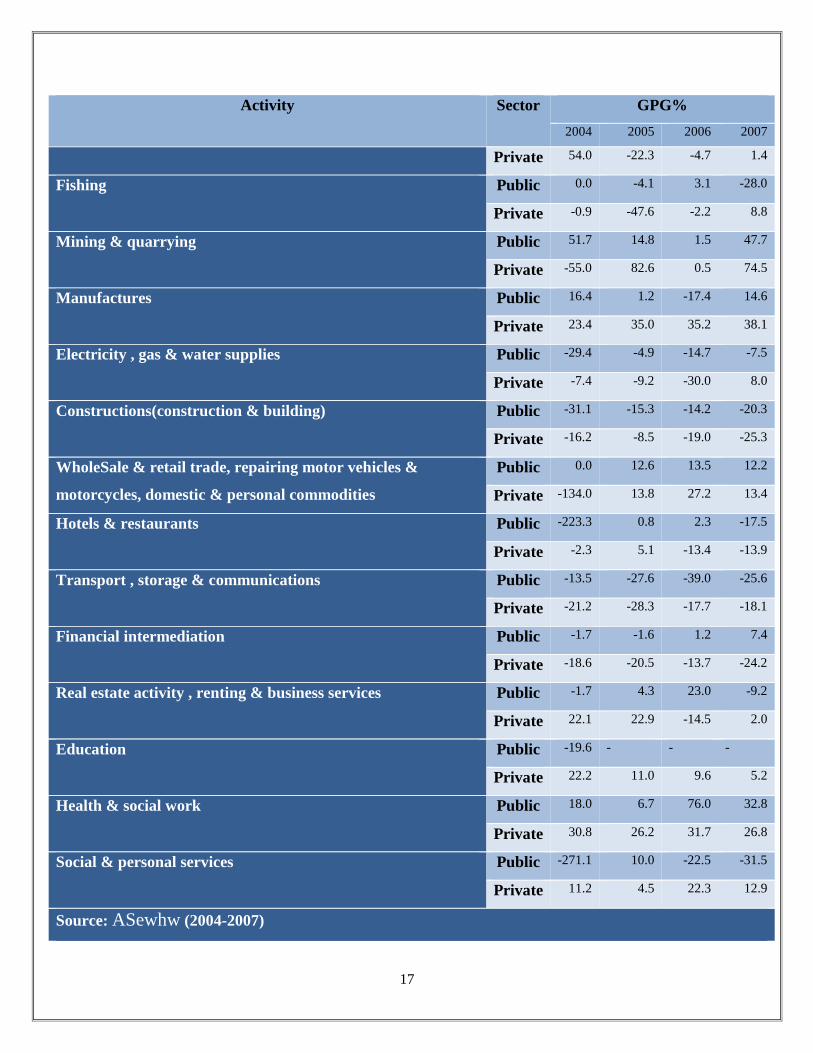
17
Activity Sector GPG%
2004 2005 2006 2007
Private 54.0 -22.3 -4.7 1.4
Fishing Public 0.0 -4.1 3.1 -28.0
Private -0.9 -47.6 -2.2 8.8
Mining & quarrying Public 51.7 14.8 1.5 47.7
Private -55.0 82.6 0.5 74.5
Manufactures Public 16.4 1.2 -17.4 14.6
Private 23.4 35.0 35.2 38.1
Electricity , gas & water supplies Public -29.4 -4.9 -14.7 -7.5
Private -7.4 -9.2 -30.0 8.0
Constructions(construction & building) Public -31.1 -15.3 -14.2 -20.3
Private -16.2 -8.5 -19.0 -25.3
WholeSale & retail trade, repairing motor vehicles &
motorcycles, domestic & personal commodities
Public 0.0 12.6 13.5 12.2
Private -134.0 13.8 27.2 13.4
Hotels & restaurants Public -223.3 0.8 2.3 -17.5
Private -2.3 5.1 -13.4 -13.9
Transport , storage & communications Public -13.5 -27.6 -39.0 -25.6
Private -21.2 -28.3 -17.7 -18.1
Financial intermediation Public -1.7 -1.6 1.2 7.4
Private -18.6 -20.5 -13.7 -24.2
Real estate activity , renting & business services Public -1.7 4.3 23.0 -9.2
Private 22.1 22.9 -14.5 2.0
Education Public -19.6 - - -
Private 22.2 11.0 9.6 5.2
Health & social work Public 18.0 6.7 76.0 32.8
Private 30.8 26.2 31.7 26.8
Social & personal services Public -271.1 10.0 -22.5 -31.5
Private 11.2 4.5 22.3 12.9
Source: ASewhw (2004-2007)
18
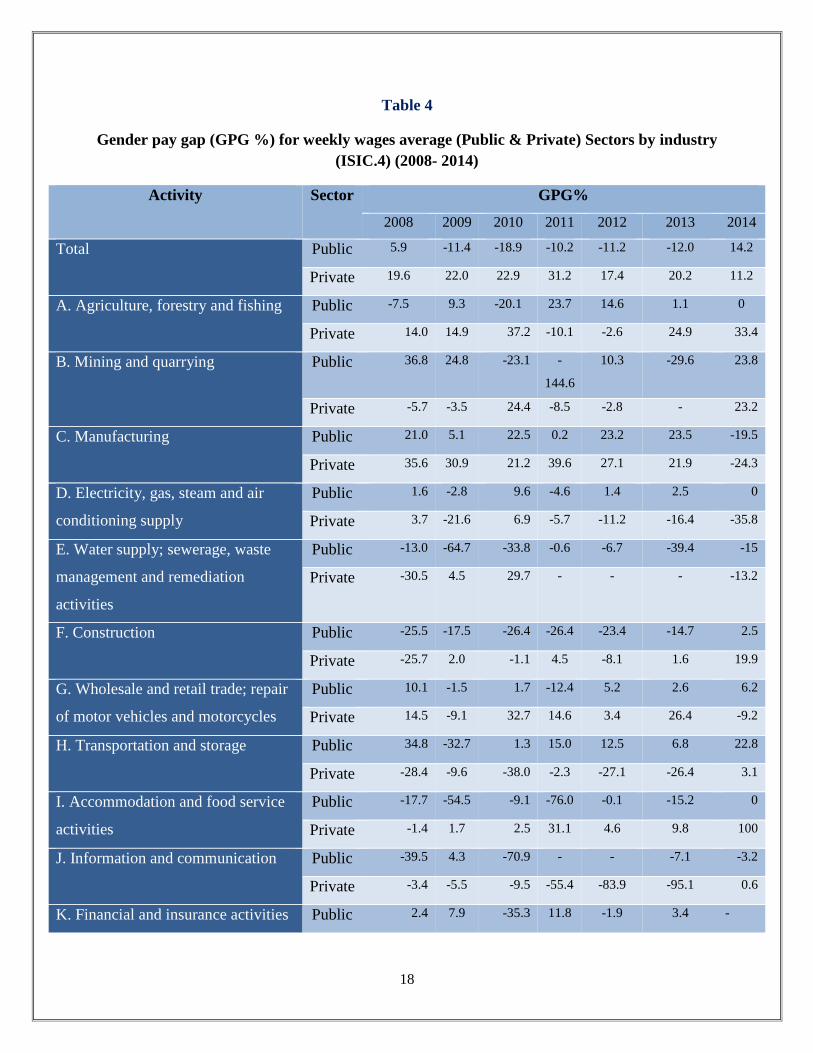
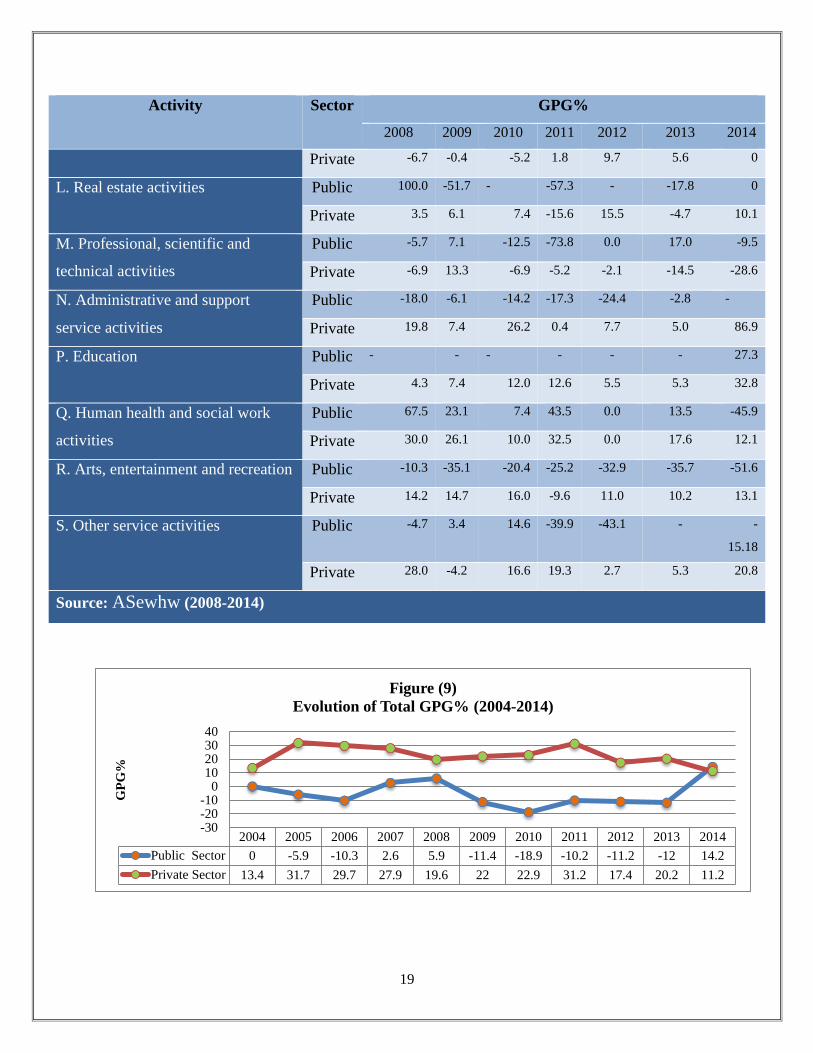
Table 4
Gender pay gap (GPG %) for weekly wages average (Public & Private) Sectors by industry
(ISIC.4) (2008- 2014)
Activity Sector GPG%
2008 2009 2010 2011 2012 2013 2014
Total Public 5.9 -11.4 -18.9 -10.2 -11.2 -12.0 14.2
Private 19.6 22.0 22.9 31.2 17.4 20.2 11.2
A. Agriculture, forestry and fishing Public -7.5 9.3 -20.1 23.7 14.6 1.1 0
Private 14.0 14.9 37.2 -10.1 -2.6 24.9 33.4
B. Mining and quarrying Public 36.8 24.8 -23.1 -
144.6
10.3 -29.6 23.8
Private -5.7 -3.5 24.4 -8.5 -2.8 - 23.2
C. Manufacturing Public 21.0 5.1 22.5 0.2 23.2 23.5 -19.5
Private 35.6 30.9 21.2 39.6 27.1 21.9 -24.3
D. Electricity, gas, steam and air
conditioning supply
Public 1.6 -2.8 9.6 -4.6 1.4 2.5 0
Private 3.7 -21.6 6.9 -5.7 -11.2 -16.4 -35.8
E. Water supply; sewerage, waste
management and remediation
activities
Public -13.0 -64.7 -33.8 -0.6 -6.7 -39.4 -15
Private -30.5 4.5 29.7 - - - -13.2
F. Construction Public -25.5 -17.5 -26.4 -26.4 -23.4 -14.7 2.5
Private -25.7 2.0 -1.1 4.5 -8.1 1.6 19.9
G. Wholesale and retail trade; repair
of motor vehicles and motorcycles
Public 10.1 -1.5 1.7 -12.4 5.2 2.6 6.2
Private 14.5 -9.1 32.7 14.6 3.4 26.4 -9.2
H. Transportation and storage Public 34.8 -32.7 1.3 15.0 12.5 6.8 22.8
Private -28.4 -9.6 -38.0 -2.3 -27.1 -26.4 3.1
I. Accommodation and food service
activities
Public -17.7 -54.5 -9.1 -76.0 -0.1 -15.2 0
Private -1.4 1.7 2.5 31.1 4.6 9.8 100
J. Information and communication Public -39.5 4.3 -70.9 - - -7.1 -3.2
Private -3.4 -5.5 -9.5 -55.4 -83.9 -95.1 0.6
K. Financial and insurance activities Public 2.4 7.9 -35.3 11.8 -1.9 3.4 -
19
Activity Sector GPG%
2008 2009 2010 2011 2012 2013 2014
Private -6.7 -0.4 -5.2 1.8 9.7 5.6 0
L. Real estate activities Public 100.0 -51.7 - -57.3 - -17.8 0
Private 3.5 6.1 7.4 -15.6 15.5 -4.7 10.1
M. Professional, scientific and
technical activities
Public -5.7 7.1 -12.5 -73.8 0.0 17.0 -9.5
Private -6.9 13.3 -6.9 -5.2 -2.1 -14.5 -28.6
N. Administrative and support
service activities
Public -18.0 -6.1 -14.2 -17.3 -24.4 -2.8 -
Private 19.8 7.4 26.2 0.4 7.7 5.0 86.9
P. Education Public - - - - - - 27.3
Private 4.3 7.4 12.0 12.6 5.5 5.3 32.8
Q. Human health and social work
activities
Public 67.5 23.1 7.4 43.5 0.0 13.5 -45.9
Private 30.0 26.1 10.0 32.5 0.0 17.6 12.1
R. Arts, entertainment and recreation Public -10.3 -35.1 -20.4 -25.2 -32.9 -35.7 -51.6
Private 14.2 14.7 16.0 -9.6 11.0 10.2 13.1
S. Other service activities Public -4.7 3.4 14.6 -39.9 -43.1 - -
15.18
Private 28.0 -4.2 16.6 19.3 2.7 5.3 20.8
Source: ASewhw (2008-2014)
2004 2005 2006 2007 2008 2009 2010 2011 2012 2013 2014
Public Sector 0 -5.9 -10.3 2.6 5.9 -11.4 -18.9 -10.2 -11.2 -12 14.2
Private Sector 13.4 31.7 29.7 27.9 19.6 22 22.9 31.2 17.4 20.2 11.2
-30-20-10
010203040
GP
G%
Figure (9)
Evolution of Total GPG% (2004-2014)
20
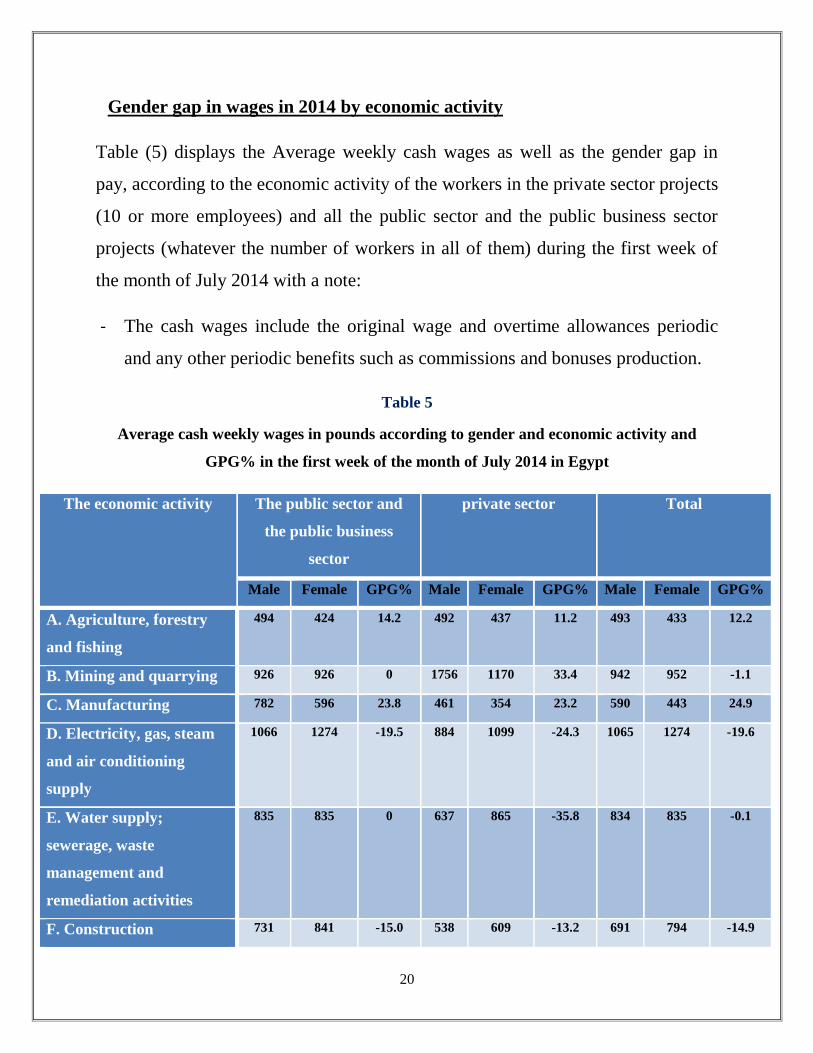
Gender gap in wages in 2014 by economic activity
Table (5) displays the Average weekly cash wages as well as the gender gap in
pay, according to the economic activity of the workers in the private sector projects
(10 or more employees) and all the public sector and the public business sector
projects (whatever the number of workers in all of them) during the first week of
the month of July 2014 with a note:
- The cash wages include the original wage and overtime allowances periodic
and any other periodic benefits such as commissions and bonuses production.
Table 5
Average cash weekly wages in pounds according to gender and economic activity and
GPG% in the first week of the month of July 2014 in Egypt
The economic activity The public sector and
the public business
sector
private sector Total
Male Female GPG% Male Female GPG% Male Female GPG%
A. Agriculture, forestry
and fishing
494 424 14.2 492 437 11.2 493 433 12.2
B. Mining and quarrying 926 926 0 1756 1170 33.4 942 952 -1.1
C. Manufacturing 782 596 23.8 461 354 23.2 590 443 24.9
D. Electricity, gas, steam
and air conditioning
supply
1066 1274 -19.5 884 1099 -24.3 1065 1274 -19.6
E. Water supply;
sewerage, waste
management and
remediation activities
835 835 0 637 865 -35.8 834 835 -0.1
F. Construction 731 841 -15.0 538 609 -13.2 691 794 -14.9

21
The economic activity The public sector and
the public business
sector
private sector Total
Male Female GPG% Male Female GPG% Male Female GPG%
G. Wholesale and retail
trade; repair of motor
vehicles and motorcycles
528 515 2.5 573 459 19.9 541 505 6.7
H. Transportation and
storage
1099 1031 6.2 652 712 -9.2 1070 1011 5.5
I. Accommodation and
food service activities
1021 788 22.8 385 373 3.1 420 402 4.3
J. Information and
communication
1523 1523 0 597 0 100 1513 1523 -0.7
K. Financial and
insurance activities
2486 2565 -3.2 2109 2097 0.6 2393 2436 -1.8
L. Real estate activities 0 0 - 488 488 0 488 488 0
M. Professional, scientific
and technical activities
533 533 0 652 586 10.1 581 554 4.6
N. Administrative and
support service activities
888 972 -9.5 370 476 -28.6 711 805 -13.2
P. Education 0 0 - 496 65 86.9 496 65 86.9
Q. Human health and
social work activities
1528 1111 27.3 393 264 32.8 507 327 35.5
R. Arts, entertainment
and recreation
876 1278 -45.9 356 313 12.1 409 391 4.4
S. Other service activities 927 1405 -51.6 498 433 13.1 509 516 -1.4
Total 1008 1161 -15.18 529 419 20.8 817 746 8.7
Source: Annual Bulletin of statistics of employment and wages, Central Agency for Public
Mobilization and Statistics, Egypt, May 2015.
22
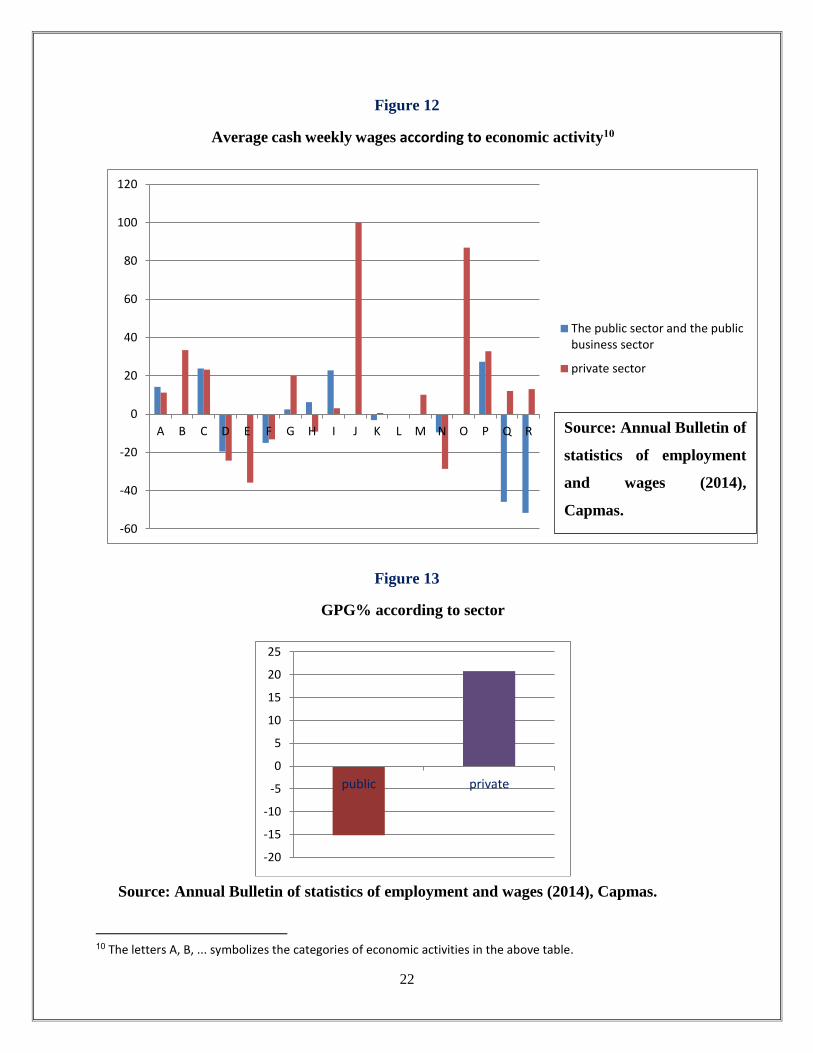
Figure 12
Average cash weekly wages according to economic activity10
Figure 13
GPG% according to sector
10 The letters A, B, ... symbolizes the categories of economic activities in the above table.
-60
-40
-20
0
20
40
60
80
100
120
A B C D E F G H I J K L M N O P Q R
The public sector and the publicbusiness sector
private sector
-20
-15
-10
-5
0
5
10
15
20
25
public private
Source: Annual Bulletin of
statistics of employment
and wages (2014),
Capmas.
Source: Annual Bulletin of statistics of employment and wages (2014), Capmas.
23
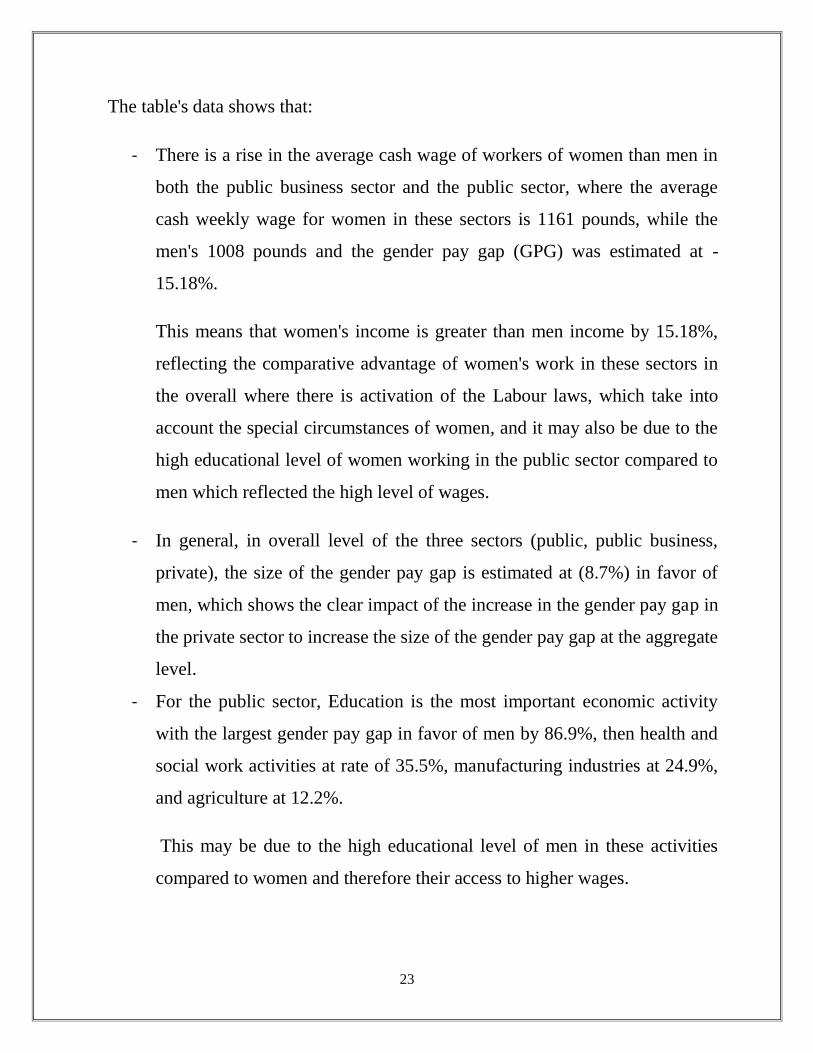
The table's data shows that:
- There is a rise in the average cash wage of workers of women than men in
both the public business sector and the public sector, where the average
cash weekly wage for women in these sectors is 1161 pounds, while the
men's 1008 pounds and the gender pay gap (GPG) was estimated at -
15.18%.
This means that women's income is greater than men income by 15.18%,
reflecting the comparative advantage of women's work in these sectors in
the overall where there is activation of the Labour laws, which take into
account the special circumstances of women, and it may also be due to the
high educational level of women working in the public sector compared to
men which reflected the high level of wages.
- In general, in overall level of the three sectors (public, public business,
private), the size of the gender pay gap is estimated at (8.7%) in favor of
men, which shows the clear impact of the increase in the gender pay gap in
the private sector to increase the size of the gender pay gap at the aggregate
level.
- For the public sector, Education is the most important economic activity
with the largest gender pay gap in favor of men by 86.9%, then health and
social work activities at rate of 35.5%, manufacturing industries at 24.9%,
and agriculture at 12.2%.
This may be due to the high educational level of men in these activities
compared to women and therefore their access to higher wages.
24
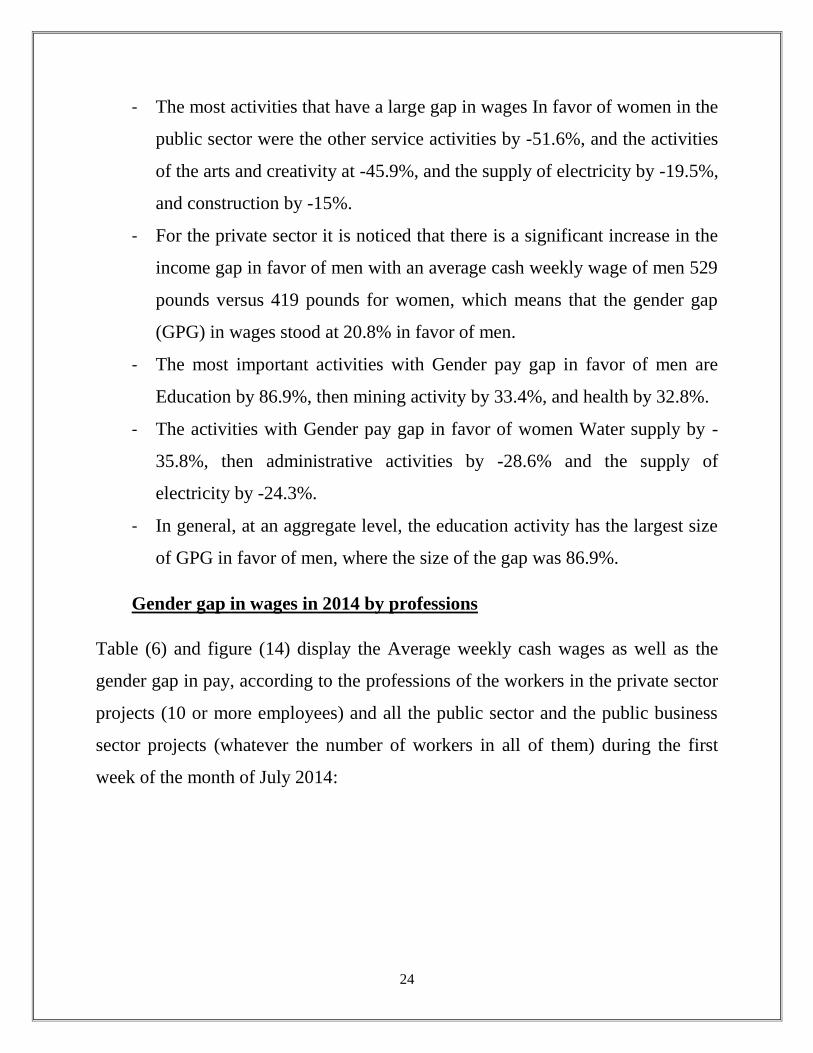
- The most activities that have a large gap in wages In favor of women in the
public sector were the other service activities by -51.6%, and the activities
of the arts and creativity at -45.9%, and the supply of electricity by -19.5%,
and construction by -15%.
- For the private sector it is noticed that there is a significant increase in the
income gap in favor of men with an average cash weekly wage of men 529
pounds versus 419 pounds for women, which means that the gender gap
(GPG) in wages stood at 20.8% in favor of men.
- The most important activities with Gender pay gap in favor of men are
Education by 86.9%, then mining activity by 33.4%, and health by 32.8%.
- The activities with Gender pay gap in favor of women Water supply by -
35.8%, then administrative activities by -28.6% and the supply of
electricity by -24.3%.
- In general, at an aggregate level, the education activity has the largest size
of GPG in favor of men, where the size of the gap was 86.9%.
Gender gap in wages in 2014 by professions
Table (6) and figure (14) display the Average weekly cash wages as well as the
gender gap in pay, according to the professions of the workers in the private sector
projects (10 or more employees) and all the public sector and the public business
sector projects (whatever the number of workers in all of them) during the first
week of the month of July 2014:
25
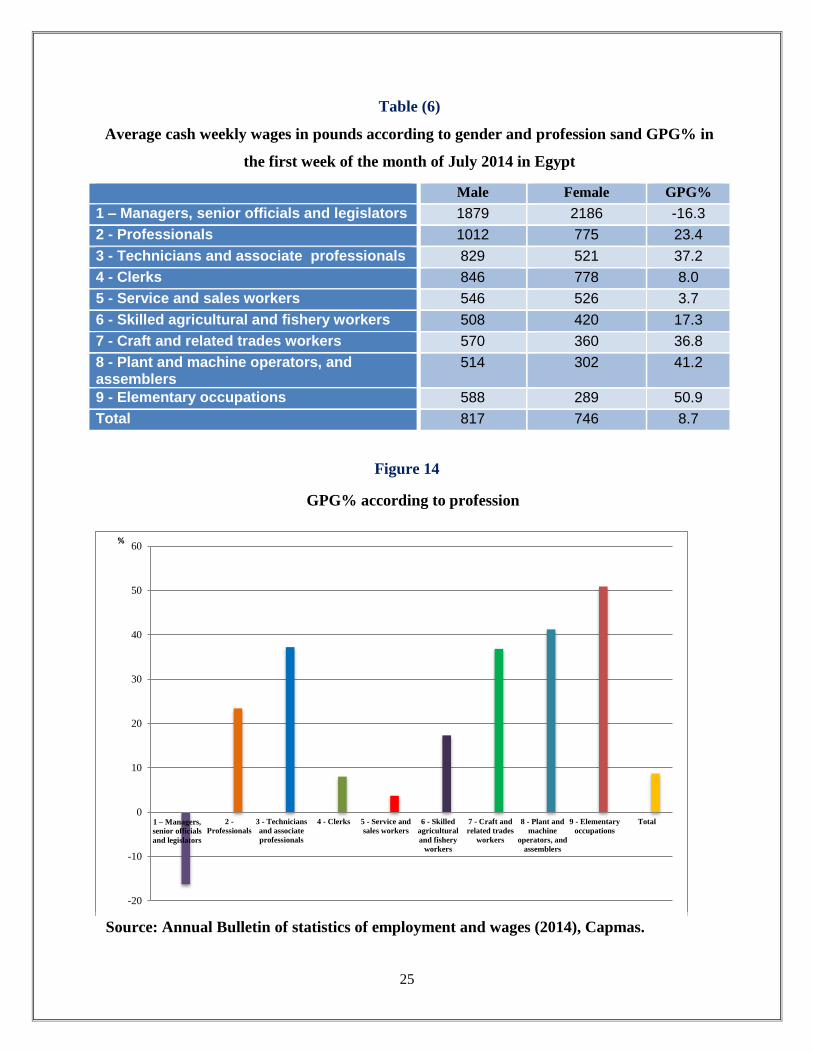
Table (6)
Average cash weekly wages in pounds according to gender and profession sand GPG% in
the first week of the month of July 2014 in Egypt
Male Female GPG%
1 – Managers, senior officials and legislators 1879 2186 -16.3
2 - Professionals 1012 775 23.4
3 - Technicians and associate professionals 829 521 37.2
4 - Clerks 846 778 8.0
5 - Service and sales workers 546 526 3.7
6 - Skilled agricultural and fishery workers 508 420 17.3
7 - Craft and related trades workers 570 360 36.8
8 - Plant and machine operators, and assemblers
514 302 41.2
9 - Elementary occupations 588 289 50.9
Total 817 746 8.7
Figure 14
GPG% according to profession
-20
-10
0
10
20
30
40
50
60
1 – Managers,
senior officials
and legislators
2 -
Professionals
3 - Technicians
and associate
professionals
4 - Clerks 5 - Service and
sales workers
6 - Skilled
agricultural
and fishery
workers
7 - Craft and
related trades
workers
8 - Plant and
machine
operators, and
assemblers
9 - Elementary
occupations
Total
%
Source: Annual Bulletin of statistics of employment and wages (2014), Capmas.
26
Table’s data shows that the highest rate of (GPG) in favor of males was in the
Elementary occupations by 50.9%, followed by Plant and machine operators, and
assemblers by 41.2%, to reach the lowest rate in Service and sales workers by
3.7%. However in Managers, senior officials and legislators professions the (GPG)
was in favor of females by -16.3%. In total it amounted to 8.7% in favor of males.
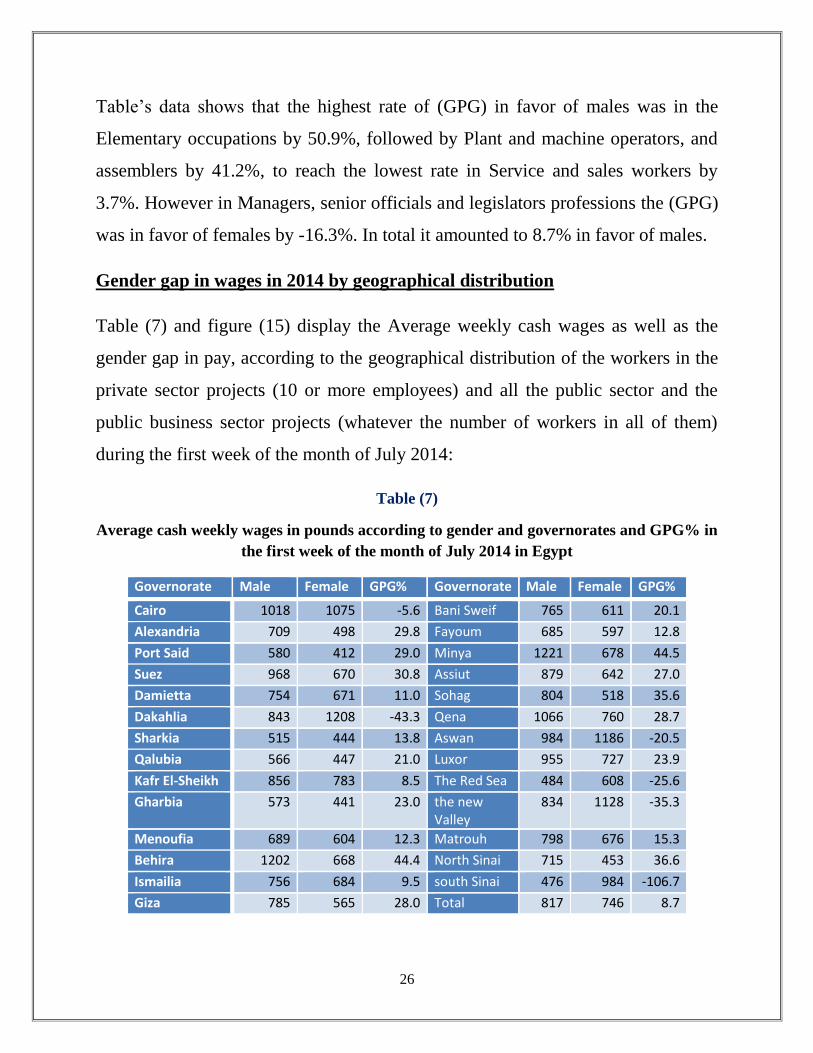
Gender gap in wages in 2014 by geographical distribution
Table (7) and figure (15) display the Average weekly cash wages as well as the
gender gap in pay, according to the geographical distribution of the workers in the
private sector projects (10 or more employees) and all the public sector and the
public business sector projects (whatever the number of workers in all of them)
during the first week of the month of July 2014:
Table (7)
Average cash weekly wages in pounds according to gender and governorates and GPG% in
the first week of the month of July 2014 in Egypt
Governorate Male Female GPG% Governorate Male Female GPG%
Cairo 1018 1075 -5.6 Bani Sweif 765 611 20.1
Alexandria 709 498 29.8 Fayoum 685 597 12.8
Port Said 580 412 29.0 Minya 1221 678 44.5
Suez 968 670 30.8 Assiut 879 642 27.0
Damietta 754 671 11.0 Sohag 804 518 35.6
Dakahlia 843 1208 -43.3 Qena 1066 760 28.7
Sharkia 515 444 13.8 Aswan 984 1186 -20.5
Qalubia 566 447 21.0 Luxor 955 727 23.9
Kafr El-Sheikh 856 783 8.5 The Red Sea 484 608 -25.6
Gharbia 573 441 23.0 the new Valley
834 1128 -35.3
Menoufia 689 604 12.3 Matrouh 798 676 15.3
Behira 1202 668 44.4 North Sinai 715 453 36.6
Ismailia 756 684 9.5 south Sinai 476 984 -106.7
Giza 785 565 28.0 Total 817 746 8.7
27
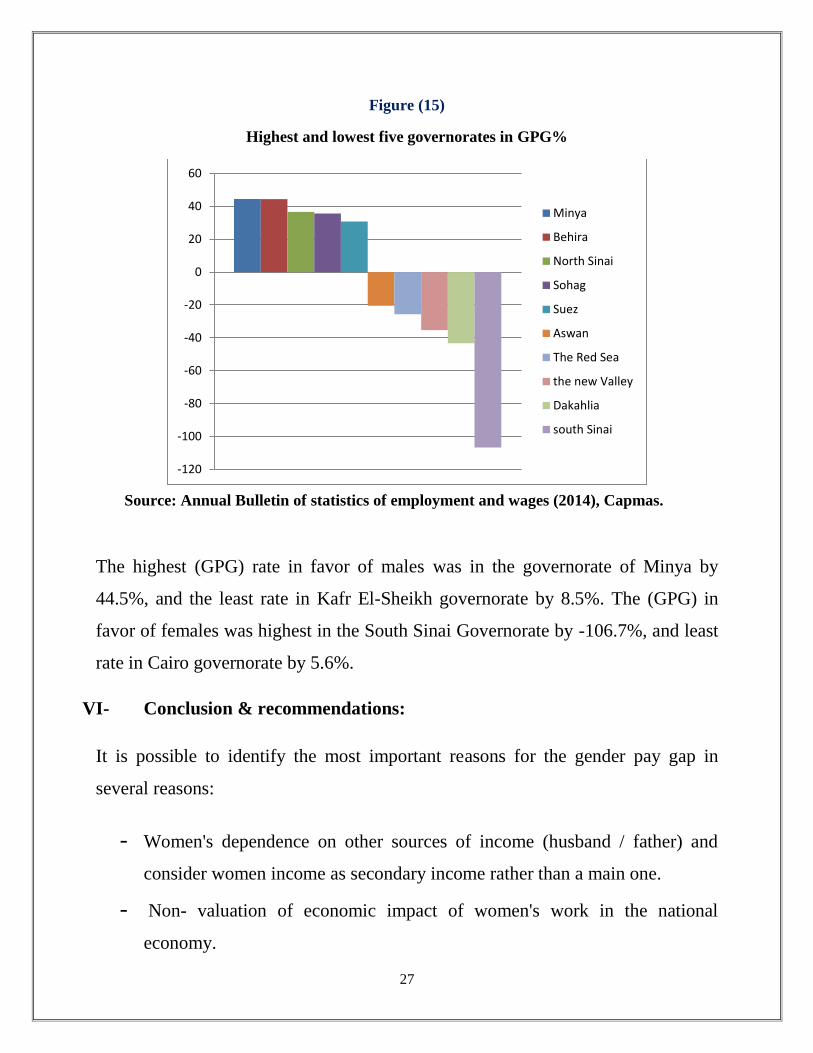
Figure (15)
Highest and lowest five governorates in GPG%
The highest (GPG) rate in favor of males was in the governorate of Minya by
44.5%, and the least rate in Kafr El-Sheikh governorate by 8.5%. The (GPG) in
favor of females was highest in the South Sinai Governorate by -106.7%, and least
rate in Cairo governorate by 5.6%.
VI- Conclusion & recommendations:
It is possible to identify the most important reasons for the gender pay gap in
several reasons:
- Women's dependence on other sources of income (husband / father) and
consider women income as secondary income rather than a main one.
- Non- valuation of economic impact of women's work in the national
economy.
-120
-100
-80
-60
-40
-20
0
20
40
60
Minya
Behira
North Sinai
Sohag
Suez
Aswan
The Red Sea
the new Valley
Dakahlia
south Sinai
Source: Annual Bulletin of statistics of employment and wages (2014), Capmas.
28
- Social patterns prevailing about the dominant role of the man.
- Professional experience weakness for women because of the frequent
absence from work for child care leave, maternity leave, accompany
husband abroad…
- Weakening of the bargaining power of women as a result of low
representation in Parliament and in the trade unions.
- Women's lack of information and awareness about their rights.
- Preference for the private sector to employ for female as a result of the
family commitments on women that limit their work under conditions of the
private sector.
- Women tend to work in the business with low pay as acts of secretarial and
nursing and day care business.
Recommendations:
- Develop economic programs, projects and budgets from a gender
perspective.
- Diversify and enrich the economic and social training options available to
women and work through a flexible systems of partial and temporary work,
or work from home or vocational distance training and e-marketing.
- A review of national legislation, including equal pay for men to achieve
equality in pay, bonuses and opportunities for rehabilitation and training,
especially in the private sector.
- Entrench the culture of work and production, especially for women who
suffer from difficult circumstances which limit their participation in the
labour market.
29
- Take affirmative action for women such as maternity leave and work half
the time and the care of children11.
- Review Contract systems in the private sector.
- The trade unions and civil society organizations must Exercise pressure on the
government and the parliament to pass the Equal Rights pay.
- Consultation with civil society and labor organizations on the adoption of
legislation limiting wage discrimination against women.
- Increase both the quantity and quality of data of gender and improve
evaluation of public policy.
- Introduce targets and measures to monitor progress on female
representation on boards of listed companies.
11 The United Nations, Consolidated Arab Report on the implementation of the Beijing Platform for Action after twenty years, Beirut, January 19, 2015, ESCWA, the United Nations Entity for Gender Equality, League of Arab States.
30
VII- References
1. American Heritage, Dictionary of the English Language, Fifth Edition.
Copyright 2011 by Houghton Mifflin Harcourt Publishing Company.
Published by Houghton Mifflin Harcourt Publishing Company.
2. Adjustment: The Case of Egypt, Research Program on Gender and Work, the
Economic Research Forum (ERF), Working Papers Series, November 2009.
3. Alazzawi, Shireen, Did trade liberalization benefit female workers? Evidence
on wage and employment effects from Egypt, The Economic Research Forum
(ERF), Working Paper 787, October 2013.
4. Assaad, Ragui, the Effects of Public Sector Hiring and Compensation Policies
on the Egyptian Labour Market, World Bank Econ Rev (1997) 11 (1): 85-118.
doi: 10.1093/wber/11.1.85.
5. Biltagy, Marwa, Estimation Of Gender Wage Differentials In Egypt Using
Oaxaca Decomposition Technique, Topics in Middle E astern and African
Economies Vol. 16, No. 1, May 2014, pp17-42.
6. Egypt State Information Service (SIS), Overview on the modern history of
Egyptian economy.
7. El-Haddad, Amirah, “Female Wages in the Egyptian Textiles and Clothing
Industry: Low Pay or Discrimination?” The Economic Research Forum (ERF),
Working Paper 633, 2011.
8. El-Hamidi, Fatma (2008) Trade Liberalization, Gender Segmentation, and
Wage Discrimination: Evidence from Egypt. In: ERF. (Unpublished).
9. Hendy, Rana and Zaki, Chahir, Assessing the Effects of Trade Liberalization
on Wage Inequalities in Egypt: A Microsimulation Analysis, the Economic
Research Forum (ERF), Working Paper 555, October 2010.

31
10. Lucia Bartůsková, Karina Kubelková. (2014). Main Challenges in Measuring
Gender Inequality. FIKUSZ ’14 Symposium for Young Researchers (pp. 19-
28). Obuda University Keleti Faculty of Business and Management.
11. Maged, Wafaa, Gender Pay Gap in Egypt, Economic Commission for Europe
Conference of European Statisticians, Group of Experts on Gender Statistics,
Work Session on Gender Statistics, Working paper 14, Geneva, 12-14 March
2012.
12. Oelz, M., Olney, S., & Tomei, M. (2013). Equal pay: An introductory guide.
Geneva: International Labour Office.
13. Prajesh Bhakta, Diarra-Thioune, Inji Amr. (2015). African Economic Outlook
2015. AfDB, OECD, UNDP.
14. Random House Kernerman Webster's College Dictionary, 2010 K Dictionaries
Ltd. Copyright 2005, 1997, 1991 by Random House, Inc.
15. Said, Mona, the fall and Rise of Earnings and Inequality in Egypt: New
Evidence from the ELMPS, 2006, The Economic Research Forum (ERF),
Published: 2007.
16. The United Nations, Consolidated Arab Report on the implementation of the
Beijing Platform for Action after twenty years, Beirut, January 19, 2015,
ESCWA, the United Nations Entity for Gender Equality, League of Arab
States.
17. Vishwanath, Tara et.al, narrowing the gap improving labour market
opportunities for women in Egypt, social and economic development group,
Middle East and North Africa region, report no. 54698-egm Arab republic of
Egypt, Gender Assessment 2010.