Embed Size (px)
Citation preview

Copyright is owned by the Author of the thesis. Permission is given for a copy to be downloaded by an individual for the purpose of research and private study only. The thesis may not be reproduced elsewhere without the permission of the Author.

AN ANALYSIS OF THE GAINS FROM ASIA-PACIFIC PORTFOLIO DIVERSIFICATION :
AN INDONESIAN PERSPECTIVE
A thesis presented in partial fulfilment of the requirements for the degree of Master of Business Studies
in Finance at Massey University New Zealand
AGUS SYARIF 1996
Abstract
This study examines the level of gains for Indonesian investors who diversify
their portfolios into Asia-Pacific stock markets compared to purely domestic
diversification. The study covers the national stock markets of Australia,
Hongkong, India, Japan, Malaysia, New Zealand, Philippines, Singapore, South
Korea, Taiwan, and Thailand over the period 1990-1994 and 1992-1994.
The two overlapping periods were chosen because there was an improved
performance of both the Indonesian market and the Asia-Pacific markets for the
latter period, in terms of both increased return and reduced risk. Potential
gains from Asia-Pacific diversification are shown to exist for the period 1990-
1994. In contrast, the period 1992-1994 indicates that the Indonesian investors
cannot significantly benefit from the Asia-Pacific diversification.
Thus this study indicates that the Indonesian investors should diversify their
portfolios within the Indonesian stock market instead of diversifying into Asia
Pacific portfolios.

ii
Acknowledgments
I wish to acknowledge the valuable guidance and assistance provided by
many people in area where they have high professional expertise. Special
thanks go to :
Martin Young, my Supervisor, for his guidance throughout the entire
process, reviewing my work carefully and promptly. The help of my
advisor, Professor L C Rose, is also much appreciated.
Particular thanks also go to, Syamsul Taufan, Pattanaree Phourangk ,and
Rita Ariani for their assistance on the JSX data as well as for their support
and encouragement to finish this research.

iii
Dedication
I owe my wife - Maulidati - and children - Agesha,
Isti, and Aji - a huge debt of gratitude for their
patience and understanding during the 3 years of
studying in New Zealand.

iv
TABLE OF CONTENTS
pages
Abstract ........................................................................................................... .
Acknowledgments.................................... .. .................. ...... .............. .... ............. 11
Dedicaton . . . . . . . .. . . . . ... . . .. .. . ........... .. . . .. . . ... .. . ... .. . . ... . .. . . . . .. .. . ... . .. .. . . .. . . . ... . . . . . . . . . .. . . . . . . . Ill
Table of Contents .............................................................................................. IV
List of Tables ...... ......................................................................... ............... ...... v
List of Figures . . . . .. . . . . . . .. .... ... . . . ... .. .. ....... ......... .. .. .. .. . . . ... .. ...... .. . . . .. . . . .. . ....... .. . . . ... . . VI
List of Appendices . . . .. . . .. .. ... .. . . ... . .. . .. . .. . .. ... .... .. . ........ .. .... ..... .... ....... .. . . .. . . . .. . . . . . . .. vu
CHAPTER 1 : INTRODUCTION ................. .. ................................. ............ ..... I 1.1. The Statement of Problem . ... . ......... ... . . . . ...... ... .. . ...... ... . . . . . ... . ... . . . . . . . . .. . . . . . 2 1.2. The Statement of the Subproblems ............... .......................................... 4 1.3. Hypothesis ............................................................................................. 4 1.4. Limitations ..... .................. ... ......................... .. ............. .............. ........ .. ... 4 1.5. The Definitions of Terms ........................................................................ 5 1.6. The Importance of the Study .... .... ...................................... ...... ............. . 6 1. 7. Organisation of the Study ...... .. ... .................... ......... .......... ...... .. ........ ..... 6
CHAPTER 2 : LITERATURE REVIEW ................ ............ .. ...... ...... .......... ....... 7 2.1. Introduction ............ ..... ........ ..... .................. .............. .... .............. ..... ....... 7 2.2. Markowitz Portfolio Selection ........................................... .................... .. 7 2.3. The Homogeneous Programming Method................... .... ... ....... ....... ... .. .. 11 2.4. International Diversification .................................................................... 15 2.5. Summary................................................................ ................................ 23
CHAPTER 3 : DAT A AND METHODOLOGY ....... ......................................... 24 3.1. Introduction ............................................................................................ 24 3.2. Data ........................ ............................................................................... 24 3.3. Methodology.................................................................... .. ................. .... 28 3.4. Summary ................................................................................................ 36
CHAPTER 4: ANALYSIS AND RESULT................................................. ..... . 37 4.1. Returns and Risks of Individual Stocks on the Indonesian Stock
Market.............................................. .. ........................... .. ...................... 37 4.2. Returns and Risks of Asia-Pacific Stock Markets .................................... 40 4.3. The Efficient Frontiers ............................................................................ 44

v
pages
4.4. The Optimal Portfolios ................................................ ............................ 48 4.5. The Gains from the Asia-Pacific Diversification....................................... 50 4.6. Summary ................................................................................................. 53
CHAPTER 5 : CONCLUSIONS.......................................................................... 55
Bibliography 57
Appendix 1 : The Returns, Standard Deviations, Coefficient of Variations, and Liquidities of the Individual Stocks on the Jakarta Stock Exchange 61
Appendix 2 : The Pairwise Correlation among the Asia-Pacific Stock Markets .. 66
vi
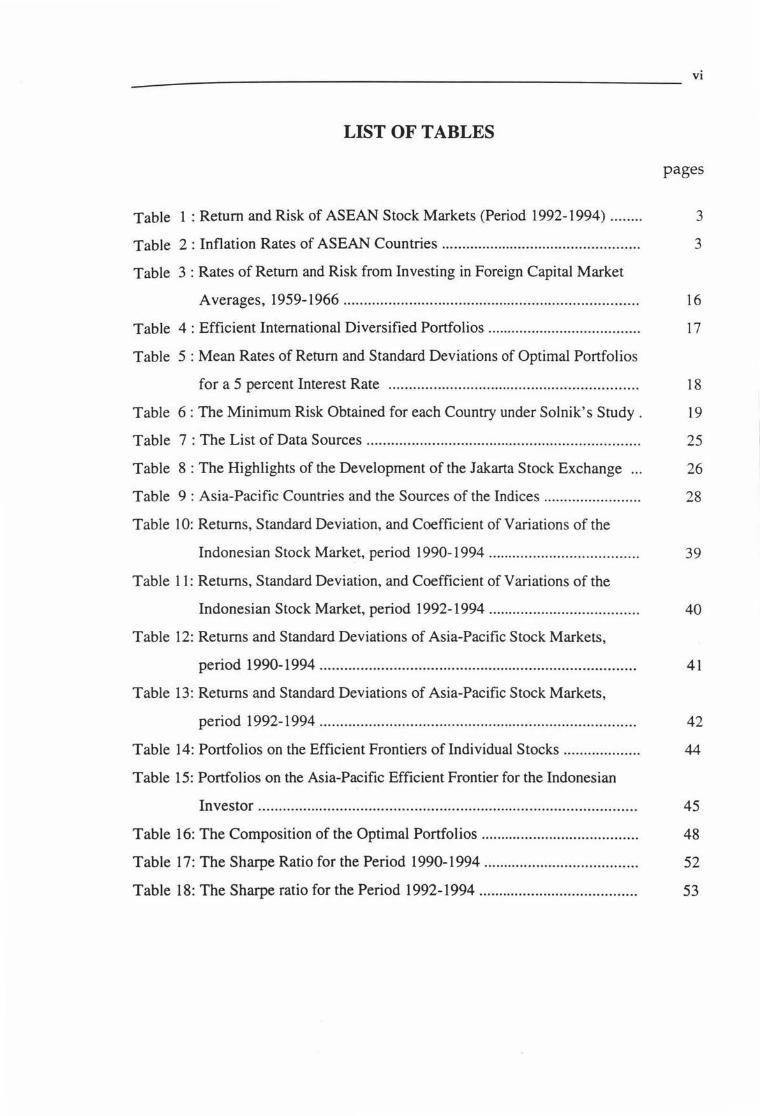
LIST OF TABLES
pages
Table 1 : Return and Risk of ASEAN Stock Markets (Period 1992-1994) .. .. . ... 3
Table 2 : Inflation Rates of ASEAN Countries ................................................. 3
Table 3 : Rates of Return and Risk from Investing in Foreign Capital Market
Averages, 1959-1966 ....................................................... ... .............. 16
Table 4 : Efficient International Diversified Portfolios ...................... ................ 17
Table 5 : Mean Rates of Return and Standard Deviations of Optimal Portfolios
for a 5 percent Interest Rate . . .. . ... ... . ... .. . .. . . ... . ...... .. . . . .. ........ .. . . . . . . . . . . . . 18
Table 6: The Minimum Risk Obtained for each Country under Solnik's Study . 19
Table 7 : The List of Data Sources .................................................... .............. . 25
Table 8 : The Highlights of the Development of the Jakarta Stock Exchange ... 26
Table 9 : Asia-Pacific Countries and the Sources of the Indices ........................ 28
Table 10: Returns, Standard Deviation, and Coefficient of Variations of the
Indonesian Stock Market, period 1990-1994 .. ......... ...... .................... 39
Table 11: Returns, Standard Deviation, and Coefficient of Variations of the
Indonesian Stock Market, period 1992-1994 ..................................... 40
Table 12: Returns and Standard Deviations of Asia-Pacific Stock Markets,
period 1990-1994 . . . . . . . . . . . . . . . . . . . . . . . .. . . . . . . . . . . .. . . .. . . . . ... . . . . . . . . . . . . . . . . . . . . . . . . . . . . . 41
Table 13: Returns and Standard Deviations of Asia-Pacific Stock Markets,
period 1992-1994 ................................................................. ..... ....... 42
Table 14: Portfolios on the Efficient Frontiers of Individual Stocks ................... 44
Table 15: Portfolios on the Asia-Pacific Efficient Frontier for the Indonesian
Investor ............. ...... ............................... .......................................... 45
Table 16: The Composition of the Optimal Portfolios ....................................... 48
Table 17: The Sharpe Ratio for the Period 1990-1994 ...................................... 52
Table 18: The Sharpe ratio for the Period 1992-1994 ....................................... 53
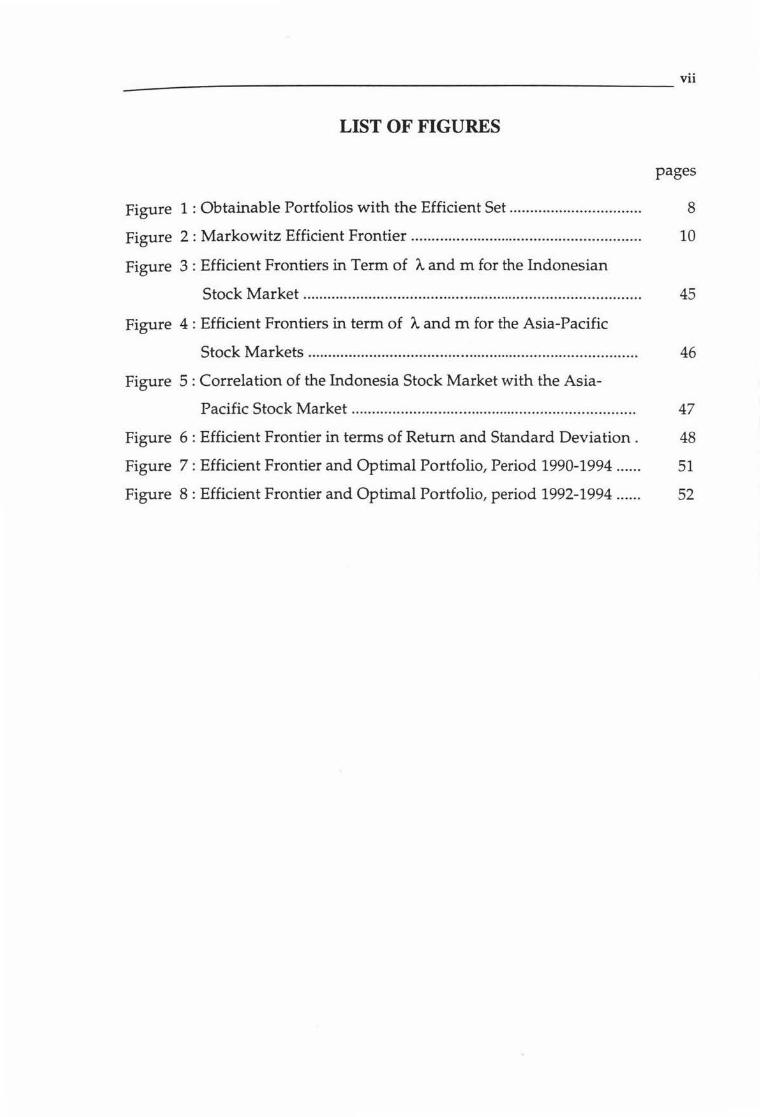
LIST OF FIGURES
pages
Figure 1 : Obtainable Portfolios with the Efficient Set .. .. ................ ... ........ . 8
Figure 2 : Markowitz Efficient Frontier ...... ..... .............. ........ .... ..... .............. 10
Figure 3 : Efficient Frontiers in Term of A and m for the Indonesian
Stock Market ...... ..... ....... .... ........... ...... ....... .. ...... .. . . .. ... ... .. .. .. . ..... .... 45
Figure 4: Efficient Frontiers in term of /..,and m for the Asia-Pacific
Stock Markets .............. .......... ......... .... ................ ..... . .... ... ....... .... .. . 46
Figure 5 : Correlation of the Indonesia Stock Market with the Asia-
Pacific Stock Market .... .. ... ........ ... ....... ................. ........... ......... ..... 47
Figure 6: Efficient Frontier in terms of Return and Standard Deviation. 48
Figure 7: Efficient Frontier and Optimal Portfolio, Period 1990-1994 ...... 51
Figure 8: Efficient Frontier and Optimal Portfolio, period 1992-1994 .... .. 52

LIST OF APPENDICES
Appendix 1: The Returns, Standard Deviations, Coefficient of Variations
and Liquidities of the Individual Stocks on the Jakarta Stock
pages
Exchange ............. ..................... .......... .............. .... ... ..... ....... ...... .. 61
Appendix 2: The Pairwise Correlation among the Asia-Pacific Stock
Markets......... .............................................................................. 66
CHAPTER!
INTRODUCTION
Spreading risk, through diversifying into several investments, is a common-sense
approach for risk averse investors. Markowitz1 , the pioneer of diversification,
found that covariance is an important factor in reducing the total risk of
investment. He stated that "it is necessary to avoid investing in securities with high
covariances among themselves. We should diversify across industries with
different economic characteristics, have lower covariances than firms within an
industry "(p.89).
In the search for securities that have low covariances or correlation, increasing
attention has been devoted by individual equity investors, pension fund
managers, and portfolio managers, not only to diversifying across industries, but
also across countries. Much research has been conducted into international
diversification since 1968. Notable among these researchers were Grubel2, Levy
and Sarnat3, Solnik4 and Eun and Resnick5. They have proven that diversifying
across countries can generate higher benefits than simply investing in diversified
domestic portfolios. But their research was based solely on developed country data
and perspectives.
Additionally, a few researchers have tried to investigate the gains of international
diversification from the perspective of emerging market investors with data being
taken from among these capital markets. In fact, there has been no prior published
study of international diversification benefits from the Indonesian perspective, in
particular into Asia-Pacific countries.
1 Mar1<owitz, H.M. (1952). Portfolio Selection. Journal of Finance, Z(1 ), 71-91 . 2 Grubel, H.G. (1968,December). Internationally Diversified Portfolios: Welfare Gains and Capital Flows. American Economie Review, 1299-1314. 3 Levy, H.,& Samat,M. (1970,September). lntemational Diversification of Investment Portfolios. American Economie Review, 668-675. 'Solnik, B. (1974,July-August). Why Not Diversify Internationally? Financial Analysts Journal, 20. 48-54. 5 Eun, C.S.,& Resnick,B.G.(1994,January). International Diversification of Investment Portfolios: U.S. and Japanese Perspectives. Management Science, ~(1), 140-161 .
1
Chapter 1 : Introduction 2
1.1. The Statement of problem
For an overall analysis of the investor viewpoint, the study examines the gains for
Indonesian investors who diversify their portfolios into Asia-Pacific markets
compared to purely domestic diversification.
Indonesia is one of the developing countries that has been undergoing a remarkable
development, particularly the development of the Indonesian capital markets. In a
short time the numbers of listed companies on the Jakarta Stock Exchange OSX)
have increased rapidly. In 1988 the number of listed companies was 24, this
increased to 124 companies in 1990, and at the end of 1994, there were 224
companies listed on the Jakarta Stock Exchange. An example of this remarkable
development is that trading volume rose of 23,666 percent, from 121.9 million
rupiah in 1988 to 28,970.8 million rupiah in 1990. In 1993 trading volume was
77,454.1 million rupiah.
This growth has not been matched by the JSX index's performance recently
however. The JSX index was 588.77 points at the end of 1993 and decreased to
452.57 points at the end of 1994. On account of the unstable condition of the market,
many Indonesian investors invest their money in foreign countries, especially in the
Singapore Stock Exchange where a number of companies now have majority
Indonesian ownership6•
This trend to offshore investment is being watched closely by the Indonesian
government and the players on the Indonesian stock market Despite the fact that
capital flows have been deregulated in Indonesia, capital outflows are viewed
negatively by the Indonesian government with the government actively trying to
6 Darudoyo, H., & Sayektl, S. (1995,Agustus). Mengapa mereka gencar diverslfikasi di Singapore? warta Ekonoml.15, 13-15.
Chapter 1 : Introduction 3
attract foreign capital for national development On account of this the Jakarta Stock
Exchange is actively trying to arouse more local interest in equities thus continuing
to fulfil its mission of raising money for Indonesian economic growth.
International diversification is also viewed as an attempt to find an alternative
investment for the Indonesian investor, based on offshore business opportunities.
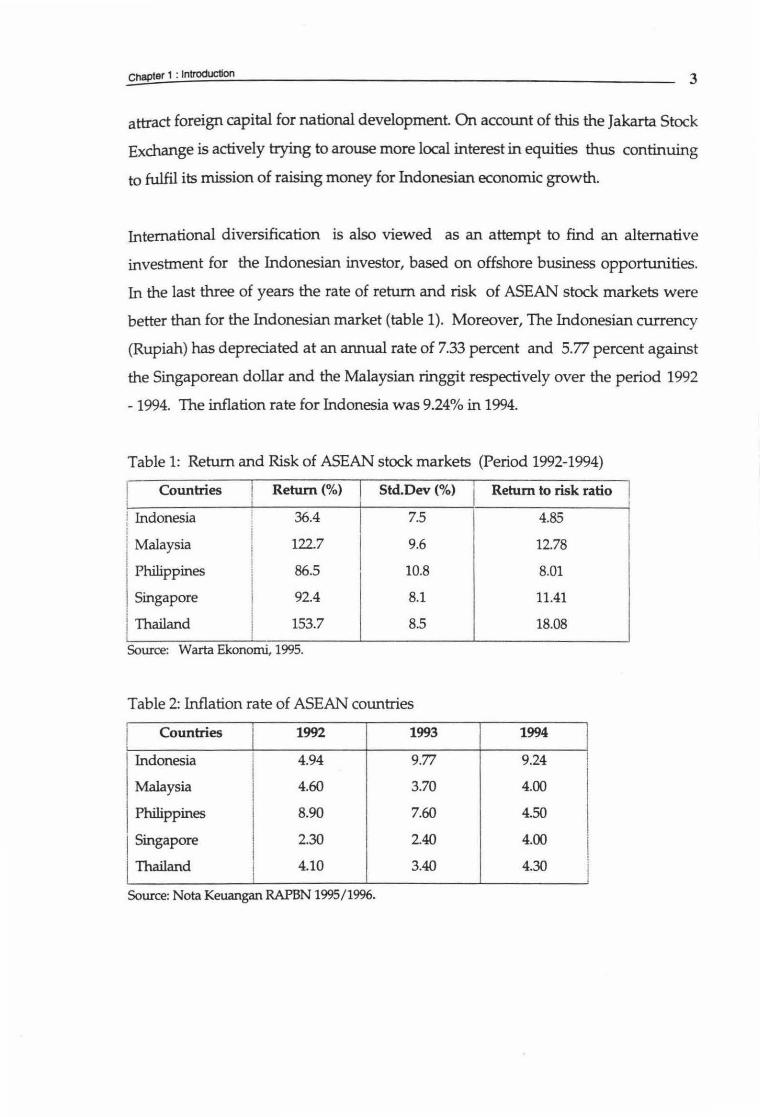
In the last three of years the rate of return and risk of ASEAN stock markets were
better than for the Indonesian market (table 1). Moreover, The Indonesian currency
(Rupiah) has depreciated at an annual rate of 7.33 percent and 5.77 percent against
the Singaporean dollar and the Malaysian ringgit respectively over the period 1992
- 1994. The inflation rate for Indonesia was 9.24% in 1994.
Table 1: Return and Risk of ASEAN stock markets (Period 1992-1994)
Countries I Return(%) Std.Dev(%) Return to risk ratio I I
I Indonesia 36.4 7.5 4.85 I I I 1 Malaysia 122.7 9.6 12.78
Philippines 86.5 10.8 8.01
Singapore 92.4 8.1 11.41
Thailand 153.7 8.5 18.08
Source: Warta Ekonomi, 1995.
Table 2: Inflation rate of ASEAN countries
Countries 1992 1993 1994
Indonesia 4.94 9.77 9.24
Malaysia 4.60 3.70 4.00
Philippines 8.90 7.60 4.50
Singapore 2.30 2.40 4.00
Thailand 4.10 3.40 4.30
Source: Nota Keuangan RAPBN 1995/1996.
chapter 1 : Introduction 4
1.2. The statement of the subproblems
The first subproblem of the study is to examine the return and risk from the
Indonesian equity market as well as the Asia-Pacific markets during the period of
1990-1994 inclusive. The study also evaluates the effect of exchange rate movements
on the performance of Asia-Pacific stock markets from the viewpoint of Indonesian
investors. The second subproblem is to determine the efficient frontier and the
optimal portfolios in both markets. The third subproblem is to examine the gains
achievable from Asia-Pacific portfolio diversification thus comparing the
performance of the Indonesian stock market with the Asia-Pacific stock markets.
1.3. Hypothesis
The following thesis question was examined from the Indonesian investor
perspective and subjected to hypothesis testing: Are the diversification gains from
Asia-Pacific portfolios better than those of the Indonesian market portfolio over
the periods 1990-1994 and 1992-1994?
To test the hypothesis, the study utilises the reward-to-variability index designed
by William Sharpe7. A positive value of the Sharpe ratio differential indicates that
the Indonesian investor can potentially gain from Asia-Pacific diversification.
Mathematically this index is difined as follows:
~S = Sat - S;""
where,
Sat= the Sharpe Ratio of Asia-Pacific diversified portfolios
S;nd= the Sharpe Ratio of Indonesian diversified portfolios
7 Sharpe, W.F. (1994, Fall). The Sharpe Ratio. The Journal of PortfoliO Management, 49-58.
Chapter 1 : Introduction 5
1.4. Limitations
The study uses two different indices for analysing the gains of diversification.
Individual indices were used to examine the performance of the Indonesian capital
market, but it was not for the Asia-Pacifc markets. In this case, the study uses
market indices to represent the Asia-Pacific markets. Even though many
researchers have used market indices in conducting their research, these indices
may not entirely reflect the performance of the national stock markets under study,
because the indices do not represent all the publicly listed stocks in the respective
markets.
1.5. The definitions of terms
To provide clarification of the terms used in this study, the following definitions are
explained:
Gain is measured by the Sharpe ratio differential, a positive value indicates that
Indonesian investors can potentially gain from Asia-Pacific diversification.
Asia-Pacific portfolio is a combination of stock investments from the Asia-Pacific
region for those countries with a reliable source of data from 1990.
Efficient portfolios are defined those which have a higher return for a given level of
risk as measured by standard deviation or lower risk for the same level of return.
Individual indices are the stock indices of securities actively traded on the Jakarta
Stock Exchange as reported in the JSX monthly statistics.
Chapter 1 : Introduction 6
Market indices are the Asia-Pacific stock market indices as reported in the Far
Eastern Economic Review.
Unadjusted return is stock return measured in local currencies.
Adjusted return is stock return measured in Indonesian unit currency, Rupiah.
1.6. The importance of the study
In general, the study will provide further insight into international diversification
from an emerging market perspective. Specifically, the importance of the study is
to address the issue of Indonesian investors who diversify their portfolios abroad,
by examining the current performance of the Indonesian capital market and Asia
Pacific markets.
1.7. Organisation of the study
This research study is split into five chapters. This first chapter has been an
introduction that comprises of the statement of the problem and their subproblems,
the research hypothesis, limitation, the definitions of terms, and the importance of
the study. The reviews of the related literature are presented in the second chapter.
The third chapter deals with the methodology used in portfolio selection, including
the procedure for selection, and the calculation of the return. The fourth chapter
analyses the empirical results. Finally, the fifth chapter details the conclusions
which can be drawn from this research report.

CHAPTER2
LITERATURE REVIEW
2.1. Introduction
This chapter reviews the development of portfolio diversification from its
pioneer, Markowitz, viz a viz development of international diversification. The
first of 3 parts reviews the Markowitz concept of mean-variance-criterion. The
second discusses the Homogeneous Programming method. Finally, the chapter
presents a review of the previous studies that have been undertaken on the
benefits of international diversification, either under the fixed exchange rate
system or under the flexible exchange rate system.
2.2. Markowitz Portfolio Selection
The Markowitz portfolio selection was developed as an extension of the
expected utility model, which asserts that a rational investor would seek out a
portfolio that maximises the expected utility, under conditions of uncertainty.
Each individual is faced with an alternative between investment and
consumption repeatedly in the future.
The Markowitz model determines the optimal investments for an investor by
considering the mean and variance as measures of return and risk for all
obtainable investments. It can be illustrated by the following example, given n
securities being considered for investment. All portfolios will have:
n n n
mean= E(R) = :E WiXi (1) ,and variance= cr2 = :E :E XiXjCij (2) ~l ~l ~ l
7
Chapter 2 : Literature Review 8
Where Wi is the percentage of funds invested in the ith security, Xi is the
expected return, Cii is the covariance between the ith and the jth securities.
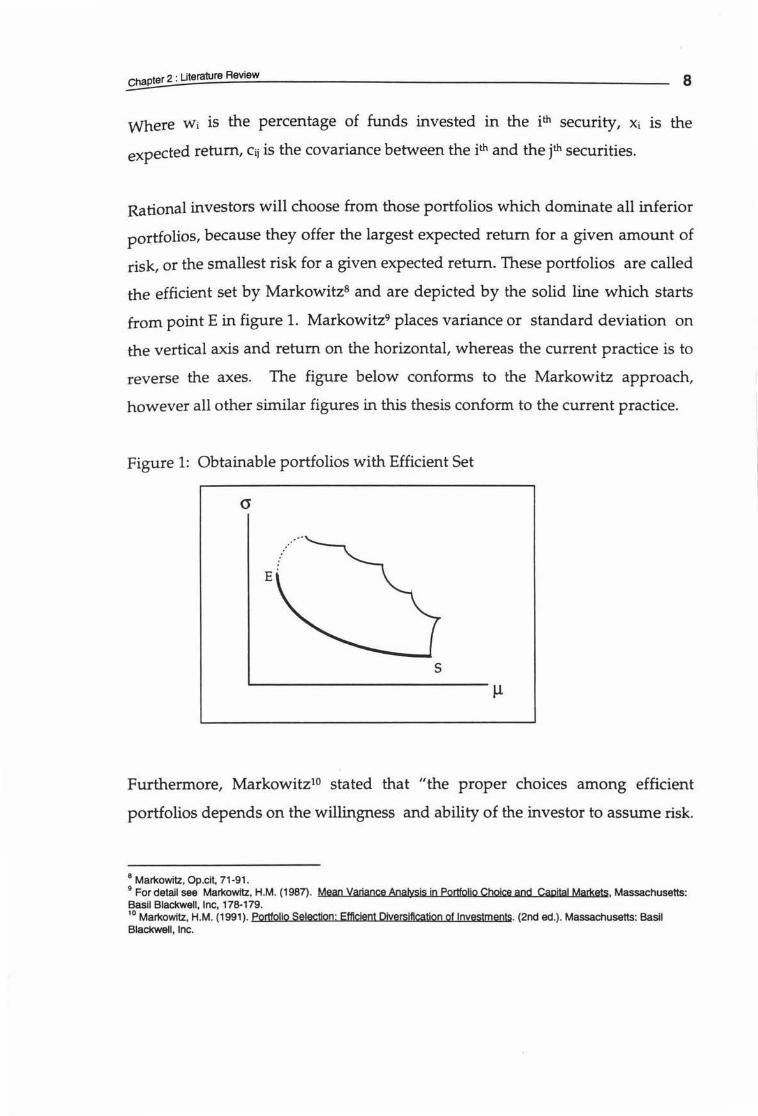
Rational investors will choose from those portfolios which dominate all inferior
portfolios, because they offer the largest expected return for a given amount of
risk, or the smallest risk for a given expected return. These portfolios are called
the efficient set by Markowitz8 and are depicted by the solid line which starts
from point E in figure 1. Markowitz9 places variance or standard deviation on
the vertical axis and return on the horizontal, whereas the current practice is to
reverse the axes. The figure below conforms to the Markowitz approach,
however all other similar figures in this thesis conform to the current practice.
Figure 1: Obtainable portfolios with Efficient Set
E
s µ
Furthermore, Markowitz10 stated that "the proper choices among efficient
portfolios depends on the willingness and ability of the investor to assume risk.
8 Markowitz, Op.cit, 71-91. 9 For detail see Markowitz, H.M. (1987). Mean Variance Analysis in Portfolio Choice and Capital Mar!sets. Massachusetts: Basil Blackwell, Inc, 178-179. 10 Markowitz, H.M. (1991). portfolio Selection: Efficient Diversification of Investments. (2nd ed.). Massachusetts: Basil Blackwell, Inc.
Chapter 2 : Literature Review 9
If safety is of extreme importance, likely return must be sacrificed to decrease
uncertainty. If a greater degree of uncertainty can be borne, a greater level of
likely return can be obtained"(p.6). This is the idea of diversification that has
laid the foundations of Modern Portfolio Theory. Thus the phenomenon of
diversification has been born to lead to a better allocation of the investment
dollar.
The rationale for diversifying portfolios can be mathematically illustrated as
follows:
E(Rp) = WiXi + WjXj (3)
Suppose there are two securities, i and j. Each security has the same return
and variance, that is 6% and 10% respectively. Covariance of return i and j is
0.07. Let us suppose 50% of funds are invested in each security. Thus the
expected return and variance of portfolio are follows:
E(Rp) = (.5)(.06) + (.5)(.06)
= .06
cr2(Rp) = (.5)2(.1) + (.5)2(.1) + 2(.5)(.5)(.07)
= .085 or 8.5%
This illustration shows the important point stressed by Markowitz in his 1952
notable paper, that is, the role of portfolio diversification in reducing risk
(variance). The above example shows us that the expected return is still the
same (6%) but the variance of this diversified portfolio (8.5%) is less than
variance i and variance j, 10%.

However, the Markowitz model does not determine the exact preferences of
every individual. It merely provides a set of efficient portfolios that have the
highest return for a given level of risk. Indifference curve analysis is utilised to
select the desired portfolio that best suits an individual investor's preferences.
In this case, the optimal portfolio for each investor is found at the point of
tangency between the indifference curve and the efficient frontier11 • The
optimal portfolio occurs at point o* in figure 2. Investors with different utility
preferences toward risk will hold different optimal portfolios.
Figure 2: Markowitz Efficient Frontier.
µ
s
The problem of portfolio selection can be statistically solved by the Quadratic
programming method. The method uses the maximisation of an objective
function subject to constraints12• It is specified by:
n n n
Maximise Z = AL eiXi - L L XiXjCij for all /.., 0 ~A.~ 00 (5) i=l i=l j=l
11 Witt, S.F.& Dobbins, R. (1979-80). Markowitz Contribution to Portfolio Theory. Managerial Finance, .5(1), 3-17. 12 Wallingford, E.A. (1967). A Survey and Comparison of Portfolio Selection Models. Journal of Financial & Quantitative ~.2,85-106.
C~h~ap~te~r~2~:Ut~·~era_ru_r_e_R_e~_·e_w ________________________________________________ ~11
n
Subject to: I. = 1 i=l
Xi~ 0 for all i = (1,2, ... n)
where: XiXi = the proportion invested in the ith and the jth securities respectively ei = the expected return ith Cii = the covariance between the ith and the j1h securities.
2.3. The Homogenous Programming Method
There have been many attempts to overcome the shortcomings of the
Markowitz quadratic programming method, i.e. it does not specify an exact
solution and is not practicable. Sharpe13, Lintner14, Moesekeis, and Elton et.al16
provide the alternative models to simplify the optimal portfolio selection.
Sharpe, Lintner, and Elton et.al. simplify the problem by using a single market
index. Moeseke eliminates the need to use a complex calculation by adapting
the minimax rule to normally distributed returns.
Sharpe and Lintner' s model approaches the portfolio selection with particular
emphasis on the determination of the prices of securities in a competitive
market, it can be stated as a positive theory. Meanwhile, the Markowitz and
Moeseke model are a normative theory that deal the normal behaviour of
investors in relation to an investor's risk preference.
13 Sharpe, W.F. (1964, September). Capital Asset Prices: A Theory of Market Equilibrium Under Conditions of Risk. JQumaI of Finance. 425-442. u Lintner, J. (1965, December). Security Prices, Risk and Maximal Gains from Diversification. Journal of Finance, 587-615. 15 Moeseke, P.v. (1965). Stochastic Linear Programming. Yale Economjc Essays, 1, 197·253. 16 Elton, E.J. et.al. (1976, December) . Simple Criteria for Optimal Portfolio Selection. Journal of Finance, 11(5), 1341·1357.
~C~ha~~~er~2~:~~~era_ru_~ __ R_evte_. _w ______________________________________________ 12
Sharpe and Lintner consider that the prices of securities can rise and fall due to
market or company factors. Market relative factors stem from external events
and company related factors are unique to particular securities. The former is
known as systematic risk, it cannot be reduced by diversification. The latter is
known as unsystematic risk that can be diversified away.
In light of the Markowitz model, Moeseke17 stated that "the set of efficient
decision is broad and the criterion clearly leaves further choice among efficient
decision to one's relative valuation of risk versus return" (p.207) . As an
alternative, Moeseke proposes the truncated-minimax criterion to determine
the efficient portfolios.
The truncated-minimax criterion assumes that the outcome distributions are
normally distributed. Therefore, it characterises the expected return and risk by
its first and second moment. The truncated minimax criterion is formulated as
follows:
cf>f(x) = Ef (x) - mcrf(x) (6)
where,
Ef(x) = the expected return on x
crf(x) = the standard deviation of returns for x
m = the risk preference parameter
Moeseke introduced a risk preference parameter, m, in terms of return and
standard deviation in his formula. It can be interpreted as both a confidence
limit and also as an investor attitude toward risk. For instance, the value of risk
preference varies among investors. The value of risk preference less than zero
17 Moeseke, P.v., Op.cit.
~C~ha~~~er~2~:~Ut~era_ru_~ __ R_e~_·e_w ______________________________________ ~----~13
represents a risk lover. On the other hand, the value greater than zero
represents a risk avertor. While, if m = 0 the investor is risk neutral and will
simply choose the investment with the highest expected return.
The investor will be able to determine the optimal portfolio after constructing
the set of efficient portfolios. From the duality theorem of homogeneous
programming, the dual solution gives the marginal return to the investment
dollar. An optimal portfolio can then be determined where the marginal return
is equal to the marginal cost. In this instance, Moeseke formulated an optimal
portfolio as follows,
A. = q>(x* Im)= ex* - max* (7)
where A. measures the marginal return to the investor using criterion q,. A
single point solution can be determined for the portfolio selection problem.
The homogeneous programming method has an interesting application of
measuring the risk preference parameter, m. At the optimal point , the risk
preference also reflects the reward-to-variability index, -m = cx*/ax*. In this
case, investor attitudes can be linked to the hypothesis of the research study.
The relationship is as follows: the risk preference of the Asia-Pacific market is
higher than the Indonesian one (Ina/~ m;rn1), when the gains from Asia-Pacific
diversification is superior to that of the Indonesian market diversification. In
other words, an Indonesian investor is less conservative in investing on the
Indonesian stock market than investing on the Asia-Pacific market.
furthermore, if Moeseke' s risk preference m is measured by including interest
rate1s in the nominator [-m=(Rj-Rf)+<J], the risk preference is similar to the
original Sharpe ratio19, SHP = (Rj-Rf)+<J. In this case, the ratio shows the
expected differential return per unit of risk associated with the differential
return. In addition, Levy and Sarnat20 defined the ratio as the price or
premium which investors place on the risk associated with their investments.
Therefore, the Moeseke risk preference is the optimality concept in another
way.
The homogeneous programming method uses an iterative process, under the
truncated criterion, to select the set of efficient portfolios. The iteration selects a
succession of more appropriate portfolios at each iteration. An optimal
combination of securities will be found, when a security that is already part of a
portfolio is selected for a second time. The method varies the level of risk
preference to generate the efficient frontier, then the appropriate interest rate
can be derived for a particular portfolio by the duality theorem of homogenous
programming. Any solution occurs when the primal (maximisation problem)
equals the dual (minimisation problem). The dual (A.) is the marginal return to
the investment dollar.
The homogeneous programming method can also be formulated in matrix
notation as follows,
max: <l>(x) = ex - m (x V x)t/2 (8)
subject to ux < 1 and Xi > 0
18 Green, N.G. (1993). A Test of Historical and Shrinkage Estimates of Expected Returns In International Portfolio Selection. Unpublished master thesis, Massey University, Palmerston North, New Zealand. 19 Sharpe, W.F. (1966). Mutual Fund Performance. Journal of Business, 39. 119-138. 20 Levy, H., & Samat, M. (1984). Portfolio and Investment Selection: Illeo!Y and Practice. London: Prentice Hall.
~Ch~a~p~te_r2_:_U_te_ra_ru_ra_R_8Vl_·e_w~~~~~~~~~~~~~~~~~~~~~~~15
where,
c = expected return per dollar invested in security i
x = proportion of budget (set at unity) invested in security i
m = the risk preference parameter
V = variance-covariance matrix of yields
u = unit vector of l's with n securities.
2.4. International Diversification
Since Markowitz launched his idea about the benefit of diversification, some
researchers have tried to extend the concept of diversification by examining the
gains from diversifying into international portfolios. Notable studies are
marked by two exchange rate systems, the fixed exchange rate system that was
established prior to 1973 and the flexible exchange rate or floating exchange
rate system. Studies under exchange rate regime were undertaken by Grubel,
Levy and Sarnat, and Solnik.
The period of the Fixed Exchange Rate System
Grubel21 presented the first article on international portfolio in 1968. Grubel
found that the international portfolio diversification generates a new kind of
world welfare gain from international economic relations. These gains differ in
nature from those traditional gains of trade and international factor
movements.
21 Grubel, H. (1968, December). lntematlonal Diversified Portfolios: Welfare Gains and Capital Flows. American Economic ~. ~. 129!H314.
Grubel' s study was constructed by using the monthly historical returns of
common stocks in 11 major stock markets of the world (USA, Canada, United
Kingdom, West Germany, France, Italy, Belgium, Netherlands, Japan,
Australia, and South Africa). This study covers the period January 1959 to
December 1966. Grubel used the geometric mean of 95 monthly rates to
compute the monthly average return based on the share price index in each
country under study. He utilised the quadratic programming method to
determine the portfolio selection.
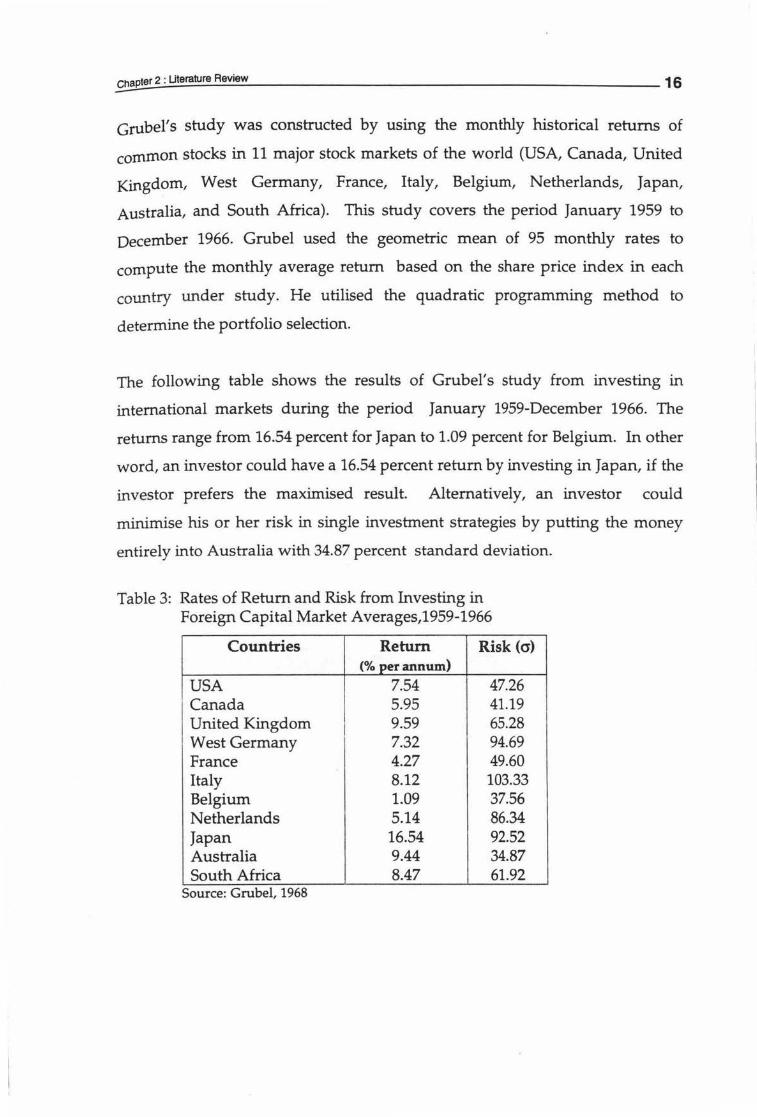
The following table shows the results of Grubel's study from investing in
international markets during the period January 1959-December 1966. The
returns range from 16.54 percent for Japan to 1.09 percent for Belgium. In other
word, an investor could have a 16.54 percent return by investing in Japan, if the
investor prefers the maximised result. Alternatively, an investor could
minimise his or her risk in single investment strategies by putting the money
entirely into Australia with 34.87 percent standard deviation.
Table 3: Rates of Return and Risk from Investing in Foreign Capital Market Averages,1959-1966
Countries Return Risk (a) (% per annum)
USA 7.54 47.26 · Canada 5.95 41.19
United Kingdom I 9.59 65.28 West Germany 7.32 94.69 France 4.27 49.60 Italy 8.12 103.33 Belgium 1.09 37.56 Netherlands 5.14 86.34 Japan 16.54 92.52 Australia 9.44 34.87 South Africa 8.47 61.92
Source: Grubel, 1968
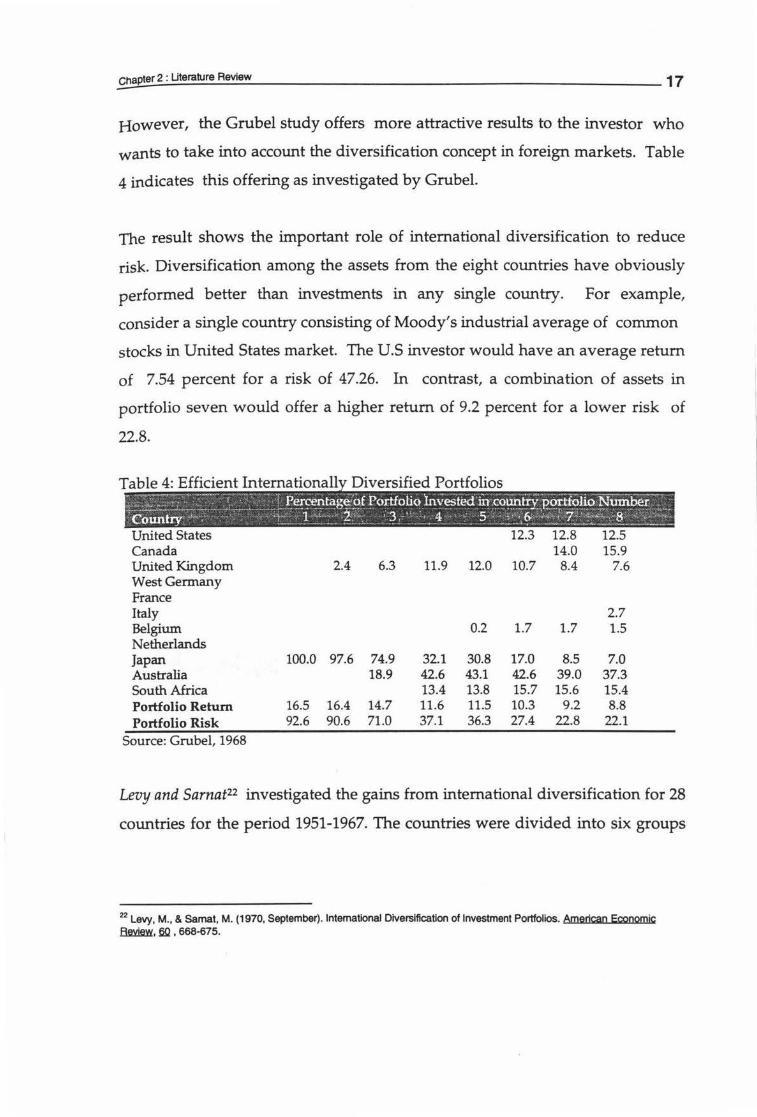
However, the Grubel study offers more attractive results to the investor who
wants to take into account the diversification concept in foreign markets. Table
4 indicates this offering as investigated by Grubel.
The result shows the important role of international diversification to reduce
risk. Diversification among the assets from the eight countries have obviously
performed better than investments in any single country. For example,
consider a single country consisting of Moody's industrial average of common
stocks in United States market. The U.S investor would have an average return
of 7.54 percent for a risk of 47.26. In contrast, a combination of assets in
portfolio seven would offer a higher return of 9.2 percent for a lower risk of
22.8.
United States 12.3 12.8 12.5 Canada 14.0 15.9 United Kingdom 2.4 6.3 11.9 12.0 10.7 8.4 7.6 West Germany France Italy 2.7 Belgium 0.2 1.7 1.7 1.5 Netherlands Japan 100.0 97.6 74.9 32.1 30.8 17.0 8.5 7.0 Australia 18.9 42.6 43.1 42.6 39.0 37.3 South Africa 13.4 13.8 15.7 15.6 15.4 Portfolio Return 16.5 16.4 14.7 11.6 11.5 10.3 9.2 8.8 Portfolio Risk 92.6 90.6 71.0 37.1 36.3 27.4 22.8 22.1
Source: Grubel, 1968
Levy and Sarnat22 investigated the gains from international diversification for 28
countries for the period 1951-1967. The countries were divided into six groups
22 Levy, M., & Samat, M. (1970, September). lntematlonal Diversification of Investment Portfolios. American Economic .BMw. 60 '668-675.
cnapter 2 : Literature Review 18
used as a comparison from the U.S investor viewpoint. This study used
arithmetic averages in calculating the share indices of common stocks for each
country and utilised the Sharpe-Lintner capital market line to determine the
optimal portfolios. Levy and Sarnat found that the U.S domestic return was
12.l percent and the standard deviation was also 12.1 percent.
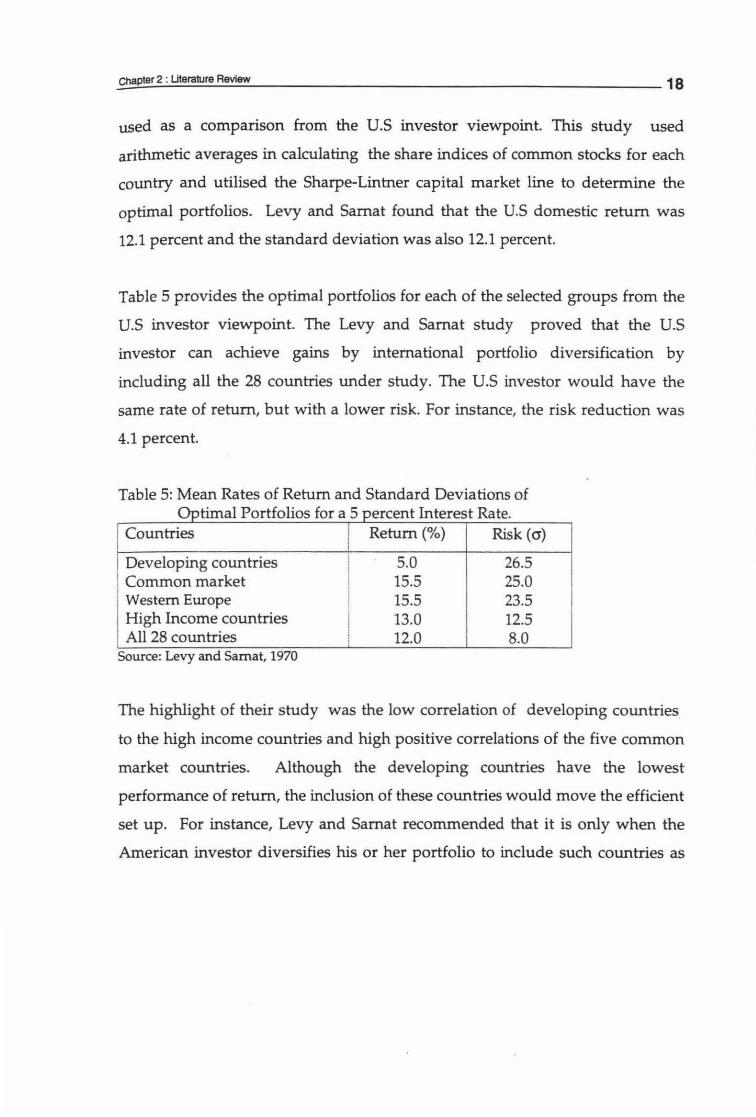
Table 5 provides the optimal portfolios for each of the selected groups from the
U.S investor viewpoint. The Levy and Sarnat study proved that the U.S
investor can achieve gains by international portfolio diversification by
including all the 28 countries under study. The U.S investor would have the
same rate of return, but with a lower risk. For instance, the risk reduction was
4.1 percent.
Table 5: Mean Rates of Return and Standard Deviations of Optimal Portfolios for a 5 percent Interest Rate.
Countries I I
Return(%) Risk (cr)
Developing countries l 5.0 26.5 Common market I 15.5 25.0
I
Western Europe I
15.5 23.5 High Income countries 13.0 12.5 I All 28 countries I 12.0 8.0
Source: Levy and Samat, 1970
The highlight of their study was the low correlation of developing countries
to the high income countries and high positive correlations of the five common
market countries. Although the developing countries have the lowest
performance of return, the inclusion of these countries would move the efficient
set up. For instance, Levy and Sarnat recommended that it is only when the
American investor diversifies his or her portfolio to include such countries as
~Ch~ap~t~er_2_: _~_era_ru_r_e_A8Vl8W_. ______________________________________________ 19
Japan and regional areas such as South America and Asia that a significant
improvement in his or her portfolio results occurs (p.673).
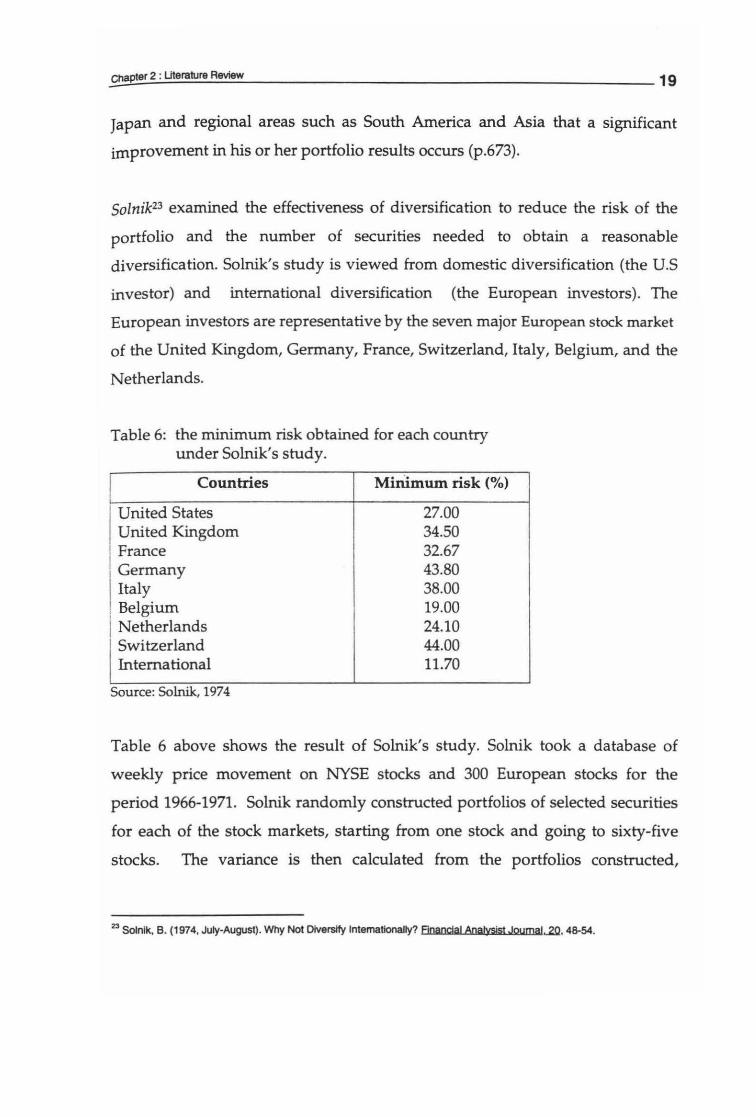
Solnik23 examined the effectiveness of diversification to reduce the risk of the
portfolio and the number of securities needed to obtain a reasonable
diversification. Solnik's study is viewed from domestic diversification (the U.S
investor) and international diversification (the European investors). The
European investors are representative by the seven major European stock market
of the United Kingdom, Germany, France, Switzerland, Italy, Belgium, and the
Netherlands.
Table 6: the minimum risk obtained for each country under Solnik's study.
Countries Mirumum risk (%)
United States 27.00 United Kingdom 34.50
I France 32.67 Germany 43.80 Italy 38.00
. Belgium 19.00 I Netherlands 24.10
Switzerland 44.00 International 11.70
Source: Solnik, 1974
Table 6 above shows the result of Solnik's study. Solnik took a database of
weekly price movement on NYSE stocks and 300 European stocks for the
period 1966-1971. Solnik randomly constructed portfolios of selected securities
for each of the stock markets, starting from one stock and going to sixty-five
stocks. The variance is then calculated from the portfolios constructed,
23 Solnlk, B. (1974, July-August). Why Not Diversify Internationally? Flnanclal Analysjst Joumal...2Q. 48-54.
averaging them for each size group. Solnik discovered that with the increased
number of stocks in the portfolio, the risk of the portfolio decreased. It
decreased sharply at first from one to ten stocks and then decreased more
gently as additional holdings were introduced.
Moreover, Solnik found that international diversification was more attractive
than purely domestic diversification. Solnik24 pointed out that an
internationally well-diversified portfolio would be one-tenth as risky as a
typical security and half as risky as a well-diversified portfolio of U.S stocks,
with the same number of holdings.
The next stage of Solnik's study was to show the effect of exchange rate
movements. By incorporating the exchange rate risk, the study discovered that
the risk of a portfolio unhedged against exchange rate movements is larger
than for a hedged portfolio. Although the study found that the effect of
exchange risk is very small, the international portfolio risk-reduction is still
substantial. The same result was detected by Joy et ai.2s
The Period of the Floating Exchange Rate System
Various studies have been conducted to reassess the benefit of international
diversification after the new exchange rate system established in 1973. Under
the floating exchange rate system, the exchange rate is now an asset price. An
investor has therefore to take into account the portion of volatility in a
portfolio's return caused by uncertainty in foreign exchange rate movements.
24 Solnik, 8 . Op.cit, p.51 25 Joy, M., Panton, D., Reilly, F., & Martin, S. (1976, March). Comovements of Major International Equity Markets. Ille Financial Review, 1-20.
~C~ha~p_te_r2_:_Ut_e_ra_ru_ffi_R_e_vte_· w~~~~~~~~~~~~~~~~~~~~~~~~21
Eun and Resnick26 undertook an empirical investigation of the impact of
exchange rate fluctuations upon international portfolio diversification. The
study covered the period of January 1973 to December 1982 and took a database
of monthly stock market indices from fifteen major countries27• The benefits of
international diversification is viewed from the viewpoint of fifteen national
investors using their own numeraire currencies.
In analysing the results, the study found that the effect of exchange rate
movements varied among the countries under study. The contribution of
currency factors were positive for the German, Japanese, Singaporean, and
Swiss stock markets, while the performance results of the Australian, Italian,
Spanish, Swedish, and UK markets were diminished. However, the study still
discovered that substantial gains existed from international diversification for
the every national investor.
The study also found that the risk of national stock markets increased when the
exchange rate adjustments were included. This reflects the volatile behaviour of
exchange rates during the observation period.
Another Eun and Resnick's study28 in international diversification used weekly
data of seven countries for the period of 1980-1985. The study found that
exchange rate returns are more volatile than the stock market returns by about
fifty percent. Furthermore, the study discovered that the exchange rate
movements had affected the risk of foreign investment in two ways, that is,
through its own variance and through its positive covariances with the local
26 Eun, C.S., & Resnick, B.G. (1985, Summer). Currency Factor in International Portfolio Diversification. Columbia Journal of ~orld Business, 45·53.
2 These countries are Australia, Belgium, Canada, France, Germany, Hong Kong, Italy, Japan, Netherlands, Singapore, Spain, Sweden, Switzerland, UK, and USA. 28 Eun, c.s .. & Resnick, B.G. (1988, March). Exchange Rate Uncertainty, Forward Contracts, and International Portfolio Selection. Jbe Journal of Finance. 43(1), 197-215.
_Ch_apt-"-e_r2_:_Ut_e_ra_ru_ra_R_e_vie_w~~~~~~~~~~~~~~~~~~~~~~~~22
stock market returns. This indicated that the exchange rate movements
reinforced the stock market movements. The implication was that a large
portion of exchange rate risk would remain non-diversifiable in a
multicurrency diversification. For instance, Eun and Resnick suggest that
hedging strategies are an important factor for the U.S investor to increase the
gains from international diversification substantially.
Adler and Simon29 compared the exchange rate risk exposure during the period
1976-1979 and 1980-1982. The study found that the exposure to exchange rate
risk was substantially higher in the period 1980-1982 and the gains from
international diversification had decreased. This finding was supported by
Raymond and Weil's study30• By comparing the Grubel and Fadner's
correlation coefficients from the fixed exchange rate system, Raymond and
Weil found that under flexible exchange rates international diversification
benefits still exist, but not to the extent as would have been the case had
exchange rates been pegged.
A study by Madura31 considered various country perspectives in international
diversification. Using quarterly stock indices for the period of January 1974 to
January 1988, the study proved that the gains from international diversification
still do exist. Meric and Meric32 also found that diversification across countries
is better than across industries.
211 Adler, M., & Simon, D. (January 1986). Exchange Rate Suprise In International Portfolios. Journal of Flnancial Management, 44-52. 30 Raymond, A.J., & Well, G. (1989, Aurumn). Diversification Benefits and Exchange-Rate Changes. Journal of Business p,nance & Accounting • .lfi(4), 455-465. ; Madura, J. (1992). Benefits from International Diversification: Across Time and Country Perspectives. Managerial Einance,
}ll(2), 1-5. Meric, I., & Meric, G. (1989). Potential Gains from International Portfolio Diversification and Inter-Temporal Stability and
Seasonality in International Stock Market Relationships, Journal of Banking and Finance, 627-640.
2.5. Summary
Chapter two reviewed two important literatures in the theory of portfolio
selection and then discussed the gains from international diversification.
Markowitz is the pioneer of Modern Portfolio Theory who laid down the
concept of diversification. The fundamental point of diversification is that the
riskiness of a security should not only be measured by the variance of the
security, but also by the covariance. Moeseke has on the other hand simplified
the process of selecting efficient and optimal portfolios. By using the
homogeneous programming method, one can determine an exact solution for
portfolio selection. The chapter went on to discuss the benefits of
diversification into the international market place. The review of various
studies has shown that international diversification was a superior strategy to
single market investment, particularly at the time of a fixed exchange rate
system.
CHAPTER3
DATA AND METHODOLOGY
3.1. Introduction
Analysing the gains from Asia-Pacific stock markets compared to the Indonesian
stock market, the data bases of these markets have been gathered for the period
of five years. The data for this study uses market indices for Asia-Pacific stock
market and individual indices for the Indonesian stock market. In this case, the
Indonesian companies selected are representative of the publicly listed
companies on the Jakarta Stock Exchange.
This chapter deals with the methodology used to create portfolio selection,
including the procedure of selection, and the calculation of the return on the
Indonesian stock market and the Asia-Pacific stock market. Furthermore, the
iterative process of the homogenous programming method for examining the
optimal portfolios is also described.
3.2. Data
Data Sources
The study is carried out with the monthly returns in the Indonesian stock market
and Asia-Pacific stock markets. The Indonesian stock market data consists of
month end prices, cash dividends, stock dividends, stock bonus, and stock splits
for 124 securities actively traded on the Jakarta Stock Exchange. The Asia-Pacific
data consists of month end market indices, exchange rates, and dividend yields.
The Indonesian data is compiled from various issues of the journal of Info
Pasar Modal (Indonesia), Kompas and the Jakarta Stock Exchange
monthly
24
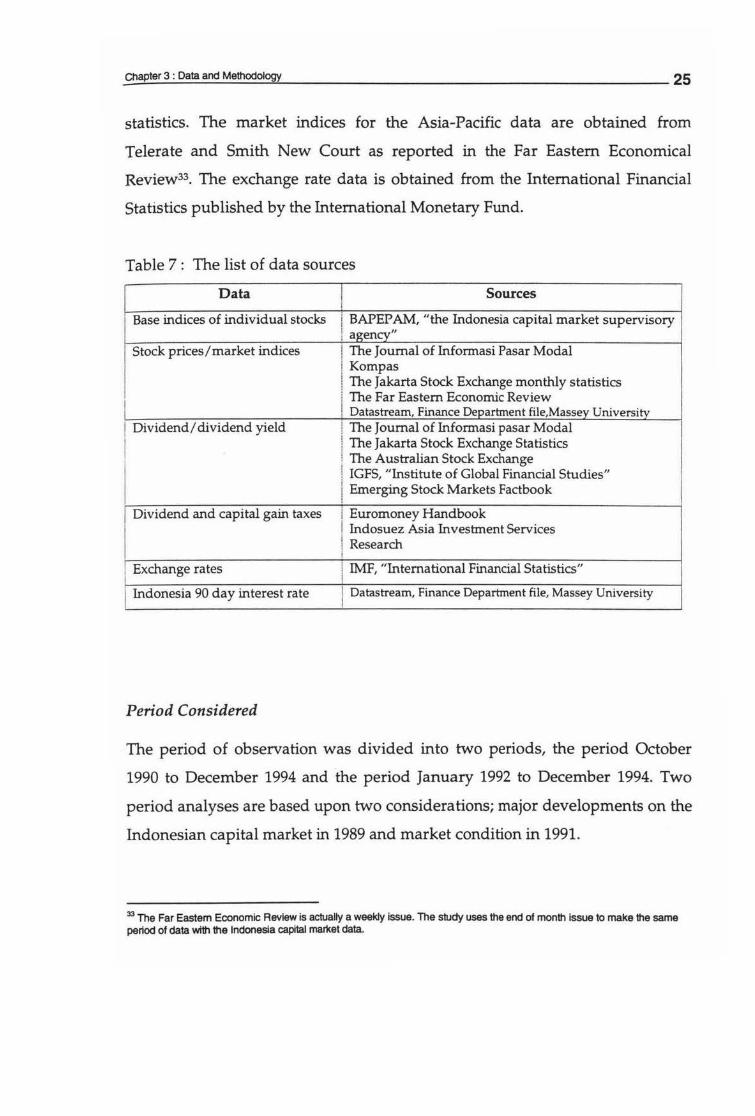
statistics. The market indices for the Asia-Pacific data are obtained from
Telerate and Smith New Court as reported in the Far Eastern Economical
Review33• The exchange rate data is obtained from the International Financial
Statistics published by the International Monetary Fund.
Table 7 : The list of data sources
Data ! Sources I i
I Base indices of individual stocks BAPEP AM, "the Indonesia capital market supervisory agency"
I Stock prices/market indices The J oumal of Informasi Pasar Modal Korn pas
I I The Jakarta Stock Exchange monthly statistics
I The Far Eastern Economic Review Datastream, Finance Department file,Massev University
Dividend/ dividend yield The Journal of lnformasi pasar Modal The Jakarta Stock Exchange Statistics The Australian Stock Exchange IGFS, "Institute of Global Financial Studies" Emerging Stock Markets Factbook
I Dividend and capital gain taxes Euromoney Handbook Indosuez Asia Investment Services
I Research
! Exchange rates i
IMF, "International Financial Statistics"
I Indonesia 90 day interest rate Datastream, Finance Department file, Massey University
Period Considered
The period of observation was divided into two periods, the period October
1990 to December 1994 and the period January 1992 to December 1994. Two
period analyses are based upon two considerations; major developments on the
Indonesian capital market in 1989 and market condition in 1991.
33 The Far Eastem Economic Review is actually a weekly issue. The study uses the end of month issue to make the same period of data with the Indonesia capital market data.
~C~hap~ter_3_: _Da_ta_a_nd_M_e_~_odol~ogy=-~~~~~~~~~~~~~~~~~~~~-26
Firstly, major developments on the Indonesian capital market have been
marked by a series of market deregulations since 1988. In December 1988 the
Indonesian government announced a package designed to accelerate economic
development by fostering the Indonesia capital markets and in September 1989
the government permitted foreign investors to participate in up to 49% of the
listed shares in the market.
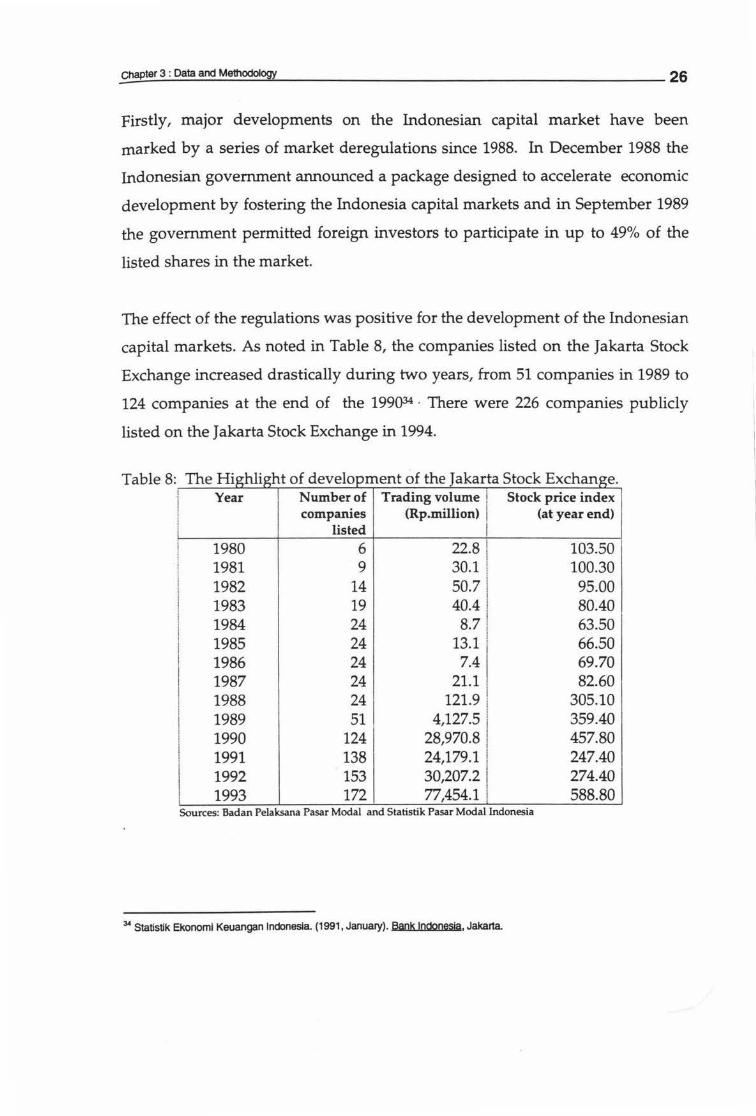
The effect of the regulations was positive for the development of the Indonesian
capital markets. As noted in Table 8, the companies listed on the Jakarta Stock
Exchange increased drastically during two years, from 51companiesin1989 to
124 companies at the end of the 199()34 · There were 226 companies publicly
listed on the Jakarta Stock Exchange in 1994.
Table 8 Th H. w· ht f d 1 e Ig lg 0 eve opment o t e a arta f h J k toe xc ange. S kE h
i Year Number of Trading volume i Stock price index
i companies (Rp.million) I (at year end) listed I
1980 6 22.8 ! 103.50 I
1981 9 30.l i 100.30 1982 14 50.7 I 95.00 1983 19 I 80.40 40.4 I 1984 24 8.7 : 63.50 1985 24 13.1 I 66.50 1986 24 7.4 69.70 1987 24 21.1 ! 82.60 1988 24 12i.9 I 305.10 1989 51 4,127.5 1 359.40 1990 124 28,970.8 i 457.80 1991 138 24,179.1 I 247.40
I 274.40 1992 153 30,207.2 I
1993 172 77,454.l i 588.80 Sources: Badan Pelaksana Pasar Modal and Statistik Pasar Modal Indonesia
34 Statistik Ekonoml Keuangan Indonesia (1991, January). Bank lndonesja, Jakarta
~C~hap~t_er_3_:_Da_ra_an __ d_M_e~_odo __ logy-=--------------------------------------------27
Table 8 shows the development of the Jakarta Stock Exchange, with little
improvement occurring prior to 1990. However from 1990 to 1993 the trading
volume shown in Rp. million has more than kept-pace with the increase in the
number of companies listed. Therefore, the period 1990 is considered most
important in the development of the Indonesian capital market history. It was
also considered that the number of 51 listed companies was neither sufficient
nor representative of investment on the Indonesian stock market currently.
Therefore, this study chooses the period of 1990 as a starting point.
The second period, January 1992 - December 1994, was chosen due to the bear
market that occurred on the Indonesian stock market in 1991. The Indonesian
stock market dropped sharply in 1991 (see Table 8). The JSX composite index
was 457.80 point at the end of 1990 and decreased to 247.40 point at the end of
1991. In other words, the market lost 40,78 percent during the year. According
to the Emerging Stocks Markets Factbook report35, the Indonesian stock market
performance was the third worst in the world in 1991.
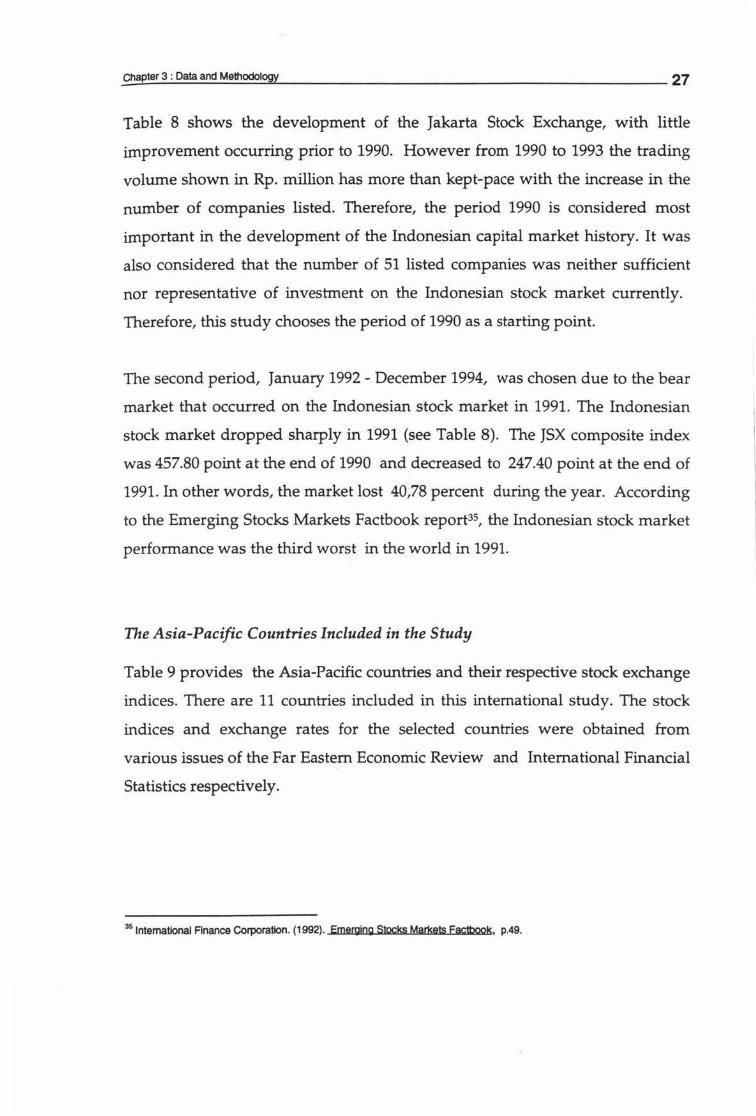
The Asia-Pacific Countries Included in the Study
Table 9 provides the Asia-Pacific countries and their respective stock exchange
indices. There are 11 countries included in this international study. The stock
indices and exchange rates for the selected countries were obtained from
various issues of the Far Eastern Economic Review and International Financial
Statistics respectively.
35 lntemational Finance Corporation. (1992). Emerging Stoc!ss Marlsets factbook, p.49.
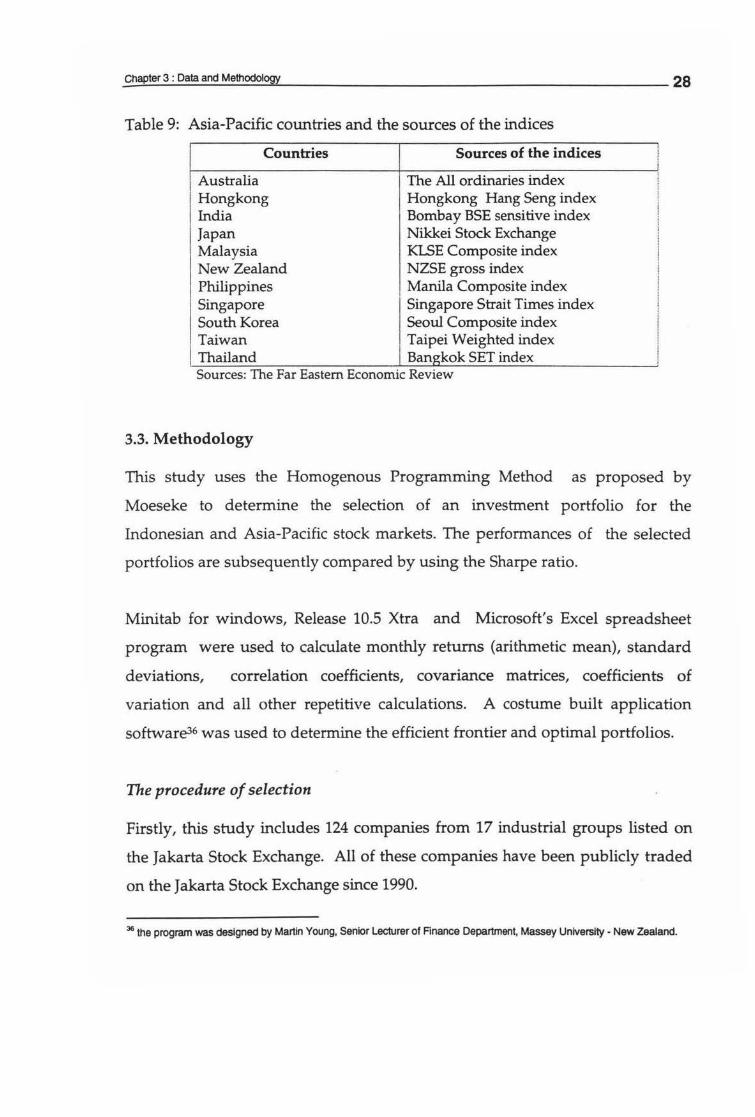
Table 9: Asia-Pacific countries and the sources of the indices
Countries Sources of the indices
1 Australia The All ordinaries index
I Hongkong Hongkong Hang Seng index India Bombay BSE sensitive index Japan Nikkei Stock Exchange Malaysia KLSE Composite index New Zealand NZSE gross index Philippines , Manila Composite index Singapore Singapore Strait Times index
I South Korea Seoul Composite index Taiwan Taipei Weighted index
I Thailand Bangkok SET index Sources: The Far Eastern Economic Review
3.3. Methodology
This study uses the Homogenous Programming Method as proposed by
Moeseke to determine the selection of an investment portfolio for the
Indonesian and Asia-Pacific stock markets. The performances of the selected
portfolios are subsequently compared by using the Sharpe ratio.
Minitab for windows, Release 10.5 Xtra and Microsoft's Excel spreadsheet
program were used to calculate monthly returns (arithmetic mean), standard
deviations, correlation coefficients, covariance matrices, coefficients of
variation and all other repetitive calculations. A costume built application
software36 was used to determine the efficient frontier and optimal portfolios.
The procedure of selection
Firstly, this study includes 124 companies from 17 industrial groups listed on
the Jakarta Stock Exchange. All of these companies have been publicly traded
on the Jakarta Stock Exchange since 1990.
36 the program was designed by Martin Young, Senior Lecturer of Finance Department, Massey University - New Zealand.
Secondly, the study evaluates the performance of individual stocks on the
Jakarta Stock Exchange, based on their performance in their industrial groups.
The lowest coefficient of variation and liquidity were deemed to be an
important criteria in the selection process. In other words, the study employs
the coefficient of variation in selecting the stocks and takes into account the
stock activities in the market as a measure of liquidity.
The process of selecting is as follows; a stock will be chosen if it has positive
rate of return (mean), the lowest rank according to the coefficient of variation
and is liquid. The study determines the frequency (how often the stock trades
in the market) as a liquidity indicator. The stock will be categorised as illiquid
if its average frequency of trade is less than 5 days per month during the
period of study. The illiquid stock will, then, be ignored and the proceeding
ranked stock will be included in the designed portfolio as representative of
their industries.
In light of liquidity, Harvey37 and Bekaert38 have included this factor in
selecting their portfolios. Harvey determined frequency, trading volume, and
market value as the basis of liquidity on selecting stocks. Meanwhile, Bekaert
used a turnover measure, that is, value traded divided by market capitalisation.
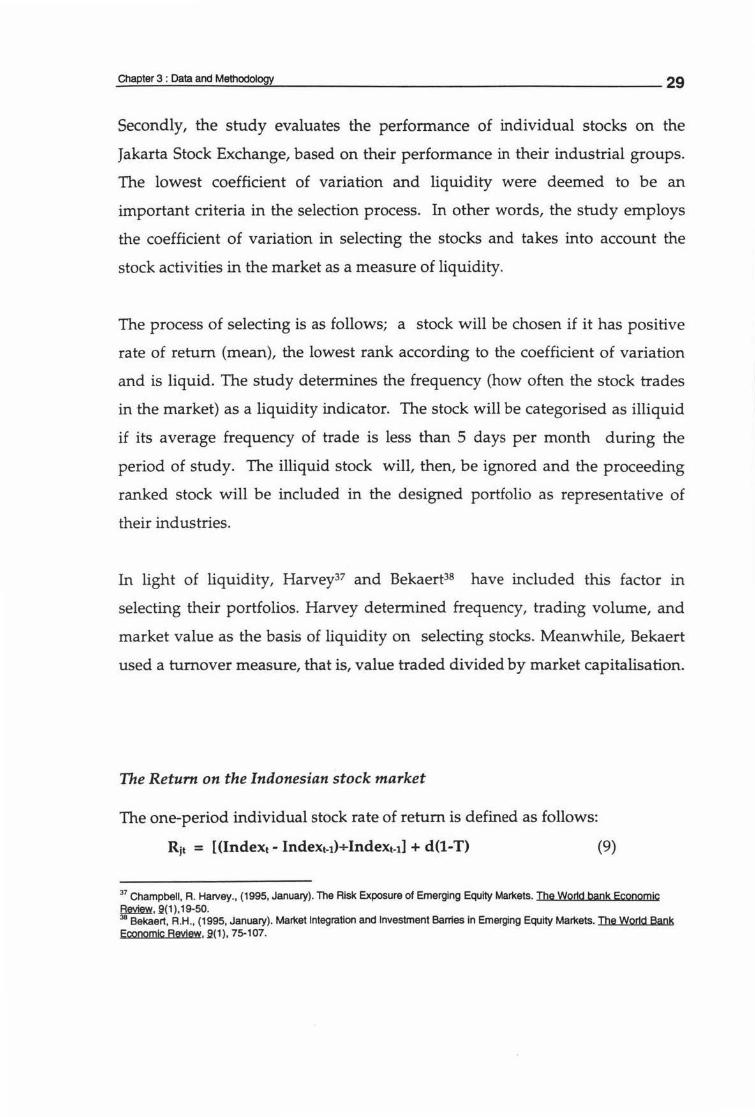
The Return on the Indonesian stock market
The one-period individual stock rate of return is defined as follows:
Rjt = [(lndex1 - lndex1-1)+Index1-1] + d(l-T) (9)
37 Champbell, R. Harvey., (1995, January). The Risk Exposure of Emerging Equity Markets. The Wodd bank Economjc ~. _e(1),19-50. 38 Bekaert, R.H., (1995, January). Market Integration and Investment Barries In Emerging Equity Markets. The Wodd Bank Economie Review, _e(1), 75-107.
_C_hap~t_er_3_: _Da_ra_a_nct_M_e_~_od_~_OfJ'i=-~~~~~~~~~~~~~~~~~~~~-30
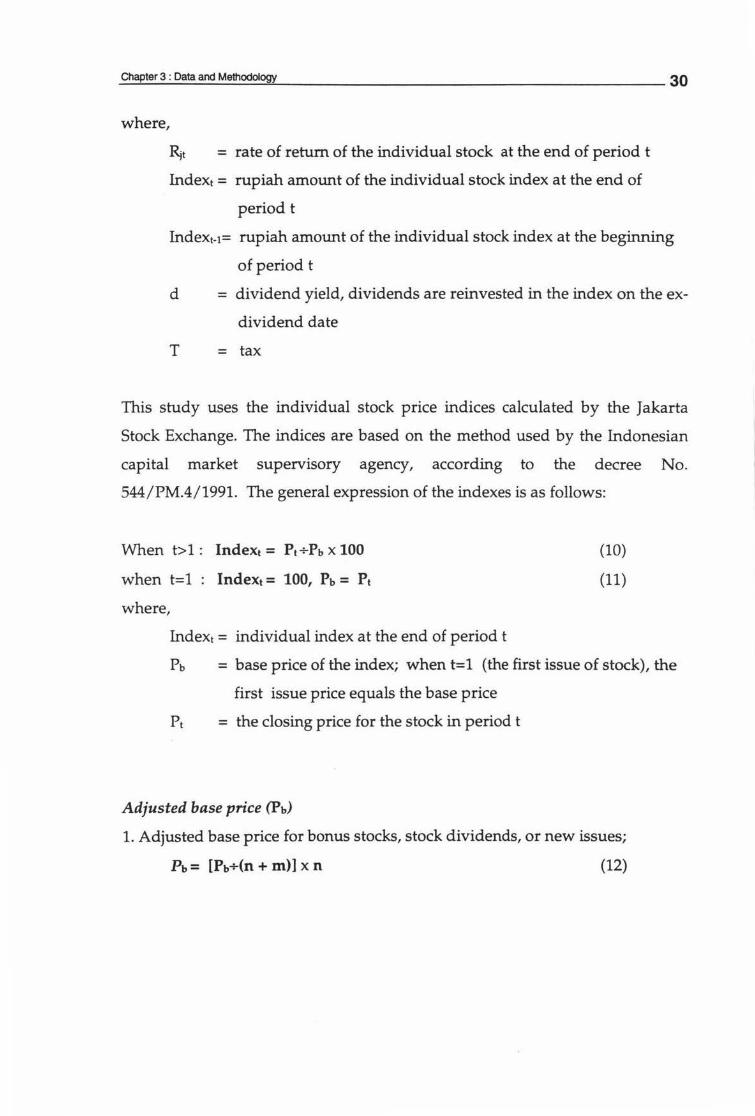
where,
~t = rate of return of the individual stock at the end of period t
Indext = rupiah amount of the individual stock index at the end of
period t
Index1-1= rupiah amount of the individual stock index at the beginning
of period t
d = dividend yield, dividends are reinvested in the index on the ex-
dividend date
T = tax
This study uses the individual stock price indices calculated by the Jakarta
Stock Exchange. The indices are based on the method used by the Indonesian
capital market supervisory agency, according to the decree No.
544/PM.4/1991. The general expression of the indexes is as follows:
When t> 1 : Ind ext = Pt +Pb x 100
when t=l Indext = 100, Pb= Pt
where,
Index1 = individual index at the end of period t
(10)
(11)
Pb = base price of the index; when t=l (the first issue of stock), the
first issue price equals the base price
Pt = the closing price for the stock in period t
Adjusted base price (Pb)
1. Adjusted base price for bonus stocks, stock dividends, or new issues;
Pb= [Pb+(n + m)] x n (12)
_C_hap-'-te_r3_:_o_a~_a_n_d_M_e~_odot~O<J'l-""'-~~~~~~~~~~~~~~~~~~~~~-31
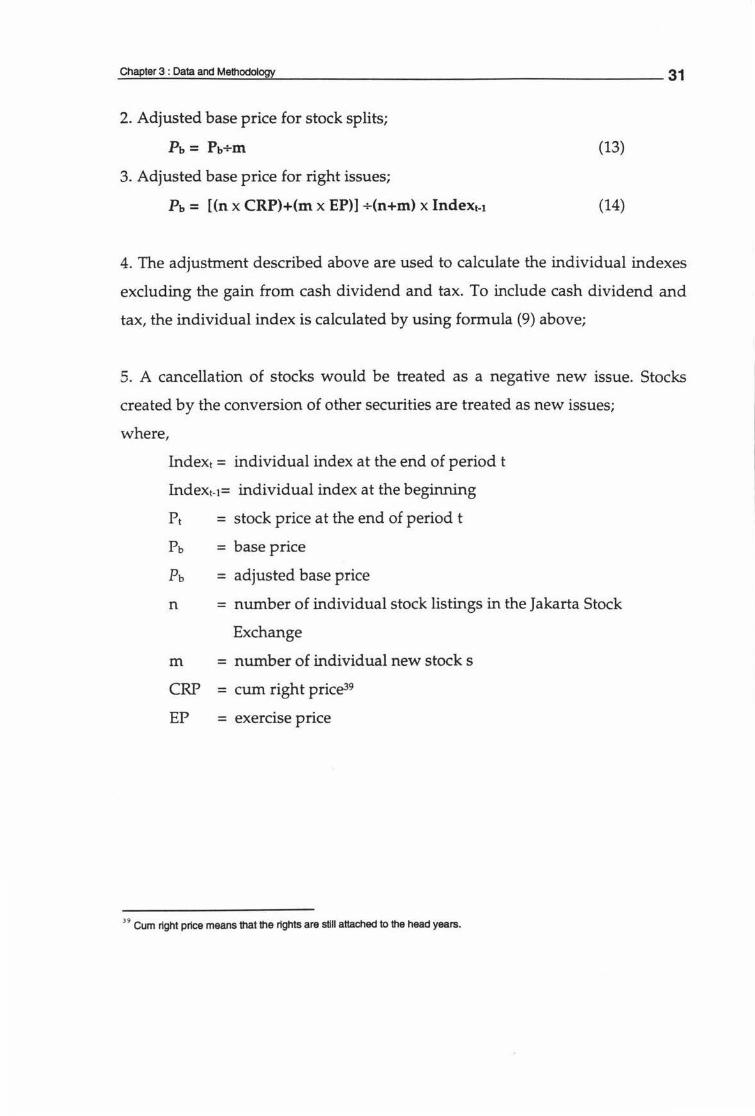
2. Adjusted base price for stock splits;
Pb= Pb+m
3. Adjusted base price for right issues;
Pb= [(n x CRP)+(m x EP)] +(n+m) x lndex1-1
(13)
(14)
4. The adjustment described above are used to calculate the individual indexes
excluding the gain from cash dividend and tax. To include cash dividend and
tax, the individual index is calculated by using formula (9) above;
5. A cancellation of stocks would be treated as a negative new issue. Stocks
created by the conversion of other securities are treated as new issues;
where,
Index1 = individual index at the end of period t
Index1-1= individual index at the beginning
Pi = stock price at the end of period t
Pb = base price
Pb = adjusted base price
n = number of individual stock listings in the Jakarta Stock
Exchange
m = number of individual new stock s
CRP = cum right price39
EP = exercise price
'• Cum right price means ~at ~e rights are still attached to ~e head years.
_C_hap .......... te_r3_:_D_am_and~_M_e~_odol~ogy-=-~~~~~~~~~~~~~~~~~~~~~-32
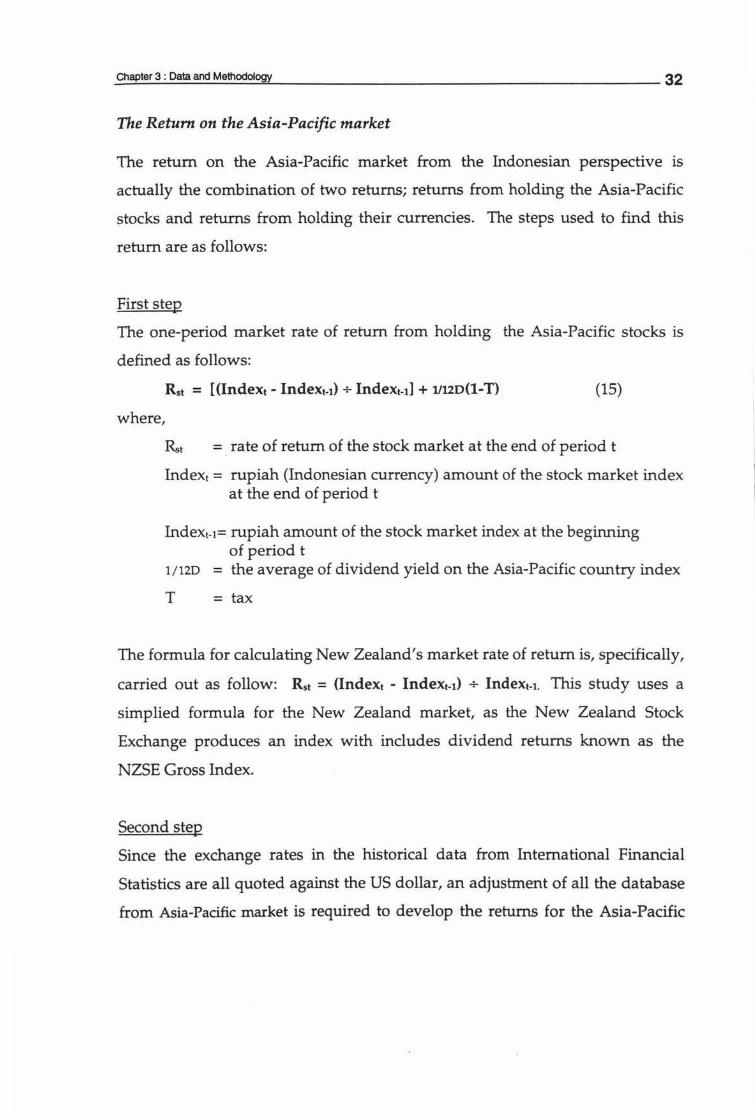
The Return on the Asia-Pacific market
The return on the Asia-Pacific market from the Indonesian perspective is
actually the combination of two returns; returns from holding the Asia-Pacific
stocks and returns from holding their currencies. The steps used to find this
return are as follows:
First step
The one-period market rate of return from holding the Asia-Pacific stocks is
defined as follows:
where,
Rst = [(lndext - lndeXt-1) + lndeXt-1l + 11120(1-T) (15)
Rs1 = rate of return of the stock market at the end of period t
Index1 = rupiah (Indonesian currency) amount of the stock market index at the end of period t
Index1-1= rupiah amount of the stock market index at the beginning of period t
1/120 = the average of dividend yield on the Asia-Pacific country index
T =tax
The formula for calculating New Zealand's market rate of return is, specifically,
carried out as follow: Rst = (lndext - lndeXt-1) + Index1-1. This study uses a
simplied formula for the New Zealand market, as the New Zealand Stock
Exchange produces an index with includes dividend returns known as the
NZSE Gross Index.
Second step
Since the exchange rates in the historical data from International Financial
Statistics are all quoted against the US dollar, an adjustment of all the database
from Asia-Pacific market is required to develop the returns for the Asia-Pacific
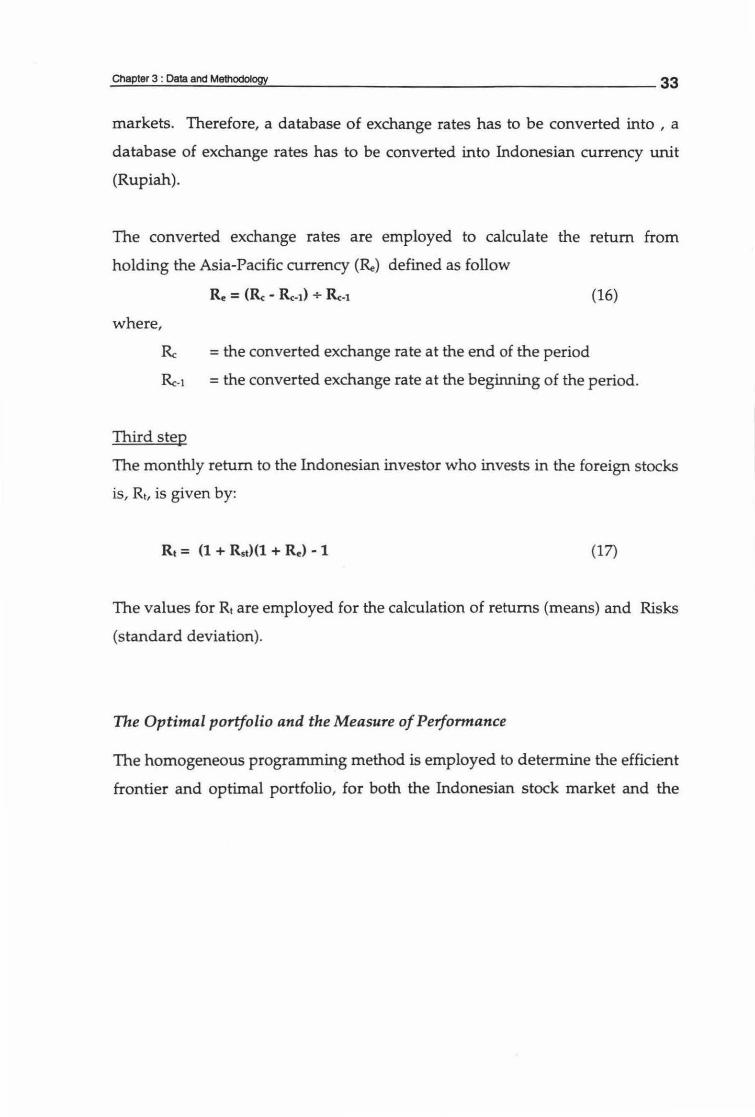
markets. Therefore, a database of exchange rates has to be converted into , a
database of exchange rates has to be converted into Indonesian currency unit
(Rupiah).
The converted exchange rates are employed to calculate the return from
holding the Asia-Pacific currency (Re) defined as follow
Re = (Re - Rc-1> + Rc.1 {16)
where,
Re =the converted exchange rate at the end of the period
Rc.1 =the converted exchange rate at the beginning of the period.
Third step
The monthly return to the Indonesian investor who invests in the foreign stocks
is, Rt, is given by:
R1 = (1 + Rs1Hl + Re) - 1 (17)
The values for Rt are employed for the calculation of returns (means) and Risks
(standard deviation).
The Optimal portfolio and the Measure of Performance
The homogeneous programming method is employed to determine the efficient
frontier and optimal portfolio, for both the Indonesian stock market and the
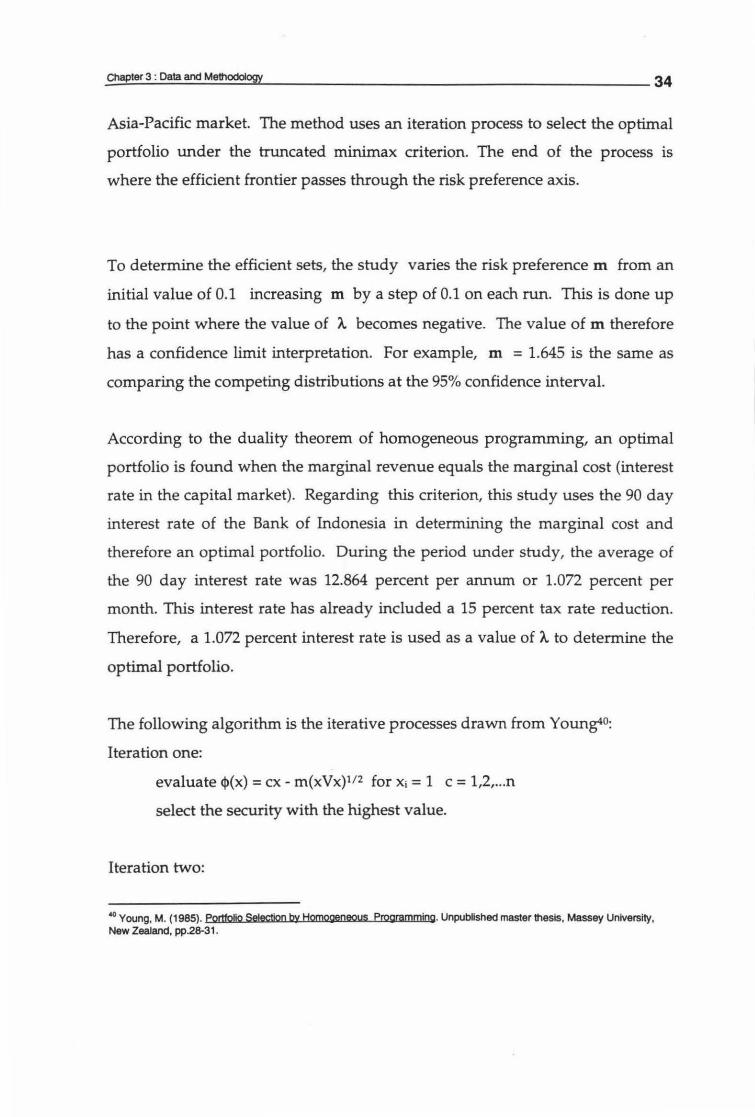
Asia-Pacific market. The method uses an iteration process to select the optimal
portfolio under the truncated minimax criterion. The end of the process is
where the efficient frontier passes through the risk preference axis.
To determine the efficient sets, the study varies the risk preference m from an
initial value of 0.1 increasing m by a step of 0.1 on each run. This is done up
to the point where the value of A. becomes negative. The value of m therefore
has a confidence limit interpretation. For example, m = 1.645 is the same as
comparing the competing distributions at the 95% confidence interval.
According to the duality theorem of homogeneous programming, an optimal
portfolio is found when the marginal revenue equals the marginal cost (interest
rate in the capital market). Regarding this criterion, this study uses the 90 day
interest rate of the Bank of Indonesia in determining the marginal cost and
therefore an optimal portfolio. During the period under study, the average of
the 90 day interest rate was 12.864 percent per annum or 1.072 percent per
month. This interest rate has already included a 15 percent tax rate reduction.
Therefore, a 1.072 percent interest rate is used as a value of A. to determine the
optimal portfolio.
The following algorithm is the iterative processes drawn from Young4°:
Iteration one:
evaluate <l>(x) =ex - m(xVx)112 for Xi = 1 c = 1,2, ... n
select the security with the highest value.
Iteration two:
"°Young, M. (1985). Portfolio Setectioo by Homogeneous programming. Unpublished master thesis, Massey University, New Zealand, pp28-31 .
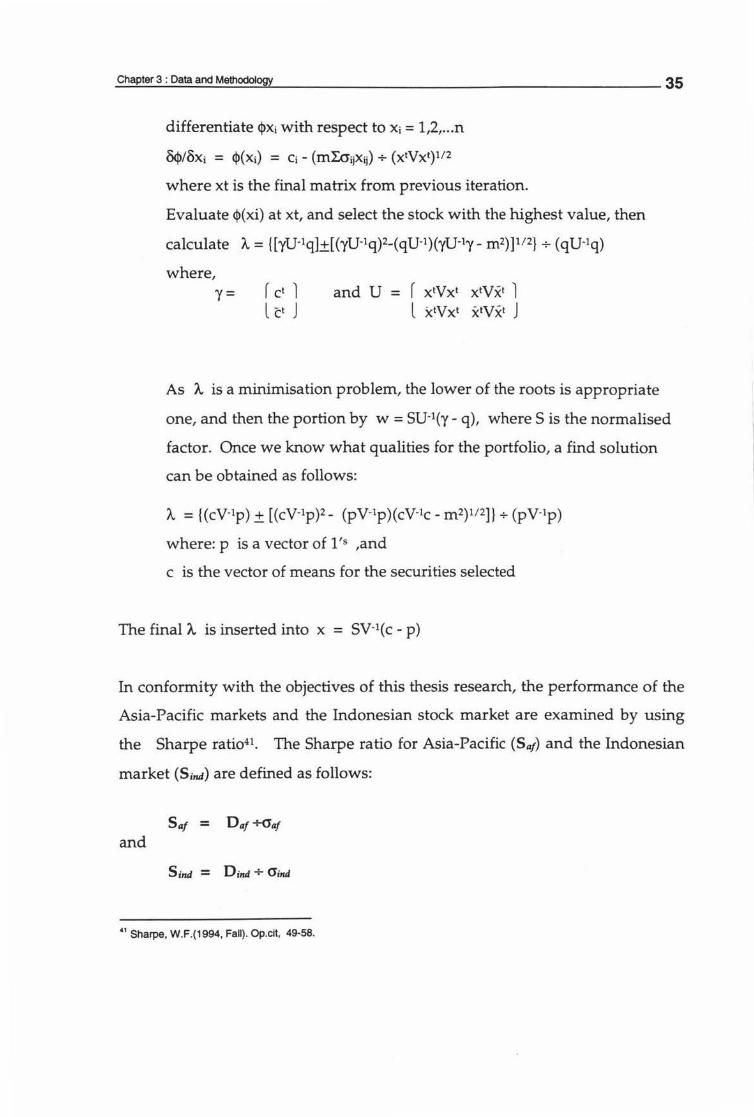
_C_hap~t_er_3_:_Da_ra_a_nd_M_e_~_odol~ogy""-~~~~~~~~~~~~~~~~~~~~-35
differentiate <j>xi with respect to Xi= 1,2, ... n
&p/Bxi = <j>(xi) = Ci - (mLcrijXij) + (x1Vxt)1 /2
where xt is the final matrix from previous iteration.
Evaluate <j>(xi) at xt, and select the stock with the highest value, then
calculate A.= {[yU-Iq]±[(yU-Iq)2-(qU-I)(yU-Iy- m2)]112} + (qU-Iq)
where, y= and U = r x1Vx1 x1Vx1 l
l x1Vx1 x1vx1 J
As A. is a minimisation problem, the lower of the roots is appropriate
one, and then the portion by w = SU-1(y- q), where Sis the normalised
factor. Once we know what qualities for the portfolio, a find solution
can be obtained as follows:
A. = {(cV-Ip) ± [(cV-Ip)L (pV-Ip)(cV-1c - m2)112]} + (pV-Ip)
where: p is a vector of l's ,and
c is the vector of means for the securities selected
The final A. is inserted into x = SV-1(c - p)
In conformity with the objectives of this thesis research, the performance of the
Asia-Pacific markets and the Indonesian stock market are examined by using
the Sharpe ratio41 . The Sharpe ratio for Asia-Pacific (Sat) and the Indonesian
market (S;ntI) are defined as follows:
Sat = Dat +<'Jaf and
41 Sharpe, W.F.(1994, Fall). Op.cit, 49-58.
where
Dat = the excess return on the Asia-Pacific portfolio
Dim1 = the excess return on the Indonesian portfolio
C1af = the standard deviation of the optimal portfolio for the Asia-Pacific
markets
CJind = the standard deviation of the optimal portfolio for the Indonesian
market.
Finally, the gains from the Asia-Pacific portfolio diversification can be
evaluated by the Sharpe ratio differential:
~S = Sat - Sim1
3.4. Summary
The chapter began with the data sources and period considered to investigate
the performance of the Indonesian stock market and the Asia-Pacific market.
The period used in the study was divided into two periods; October 1990 -
December 1994 and January 1992 - December 1994.
The process of selection has been explained for individual stocks on the Jakarta
Stock Exchange. The coefficient of variation and liquidity aspect were used to
determine the individual stock ranking in each industry group. An outline of
the procedures used to calculate return has been summarised, both for the
return on the Indonesian stock market and the return on the Asia-Pacific
markets.

CHAPTER4
ANALYSIS AND RESULTS
This chapter deals with the methodological framework delineated in Chapter 3
to analyse and discuss the empirical result of the study. The chapter is divided
into four parts. Firstly, it examines performance of the individual stocks on the
Indonesian stock market as well as the Asia-Pacific stock markets. The next part
discusses the efficient set generated by varying the risk preference parameter.
Then, the study utilises the homogeneous programming method to determine
the optimal portfolio and examine its composition. Finally, a comparative
examination is undertaken to analysis the gains from Asia-Pacific
diversification.
4.1. Returns and Risks of individual stocks on the Indonesian stock market
The study follows the procedure of selection delineated in the methodology to
choose the desired portfolio. The criteria are that the stock has a positive return,
the lowest coefficient of variation, and is liquid. There are 124 stocks from 17
industrial groups included in this study. The 17 industries are Banking,
Pharmaceutical Products, Insurance, Cement, Food and Beverages, Garment
and Apparel products, Automotive, Property, Hotel, Tobacco, Textile, Paper,
Electronics, Ceramic and Plastics, Metal and Cable, Trading and Chain store,
and Animal feeds.
After applying the procedure of selection, the study includes 11 industries in
the selected group for the period October 1990- December 1994 data and 14
industries for the period January 1992- December 1994. The detailed results are
as follows:
37
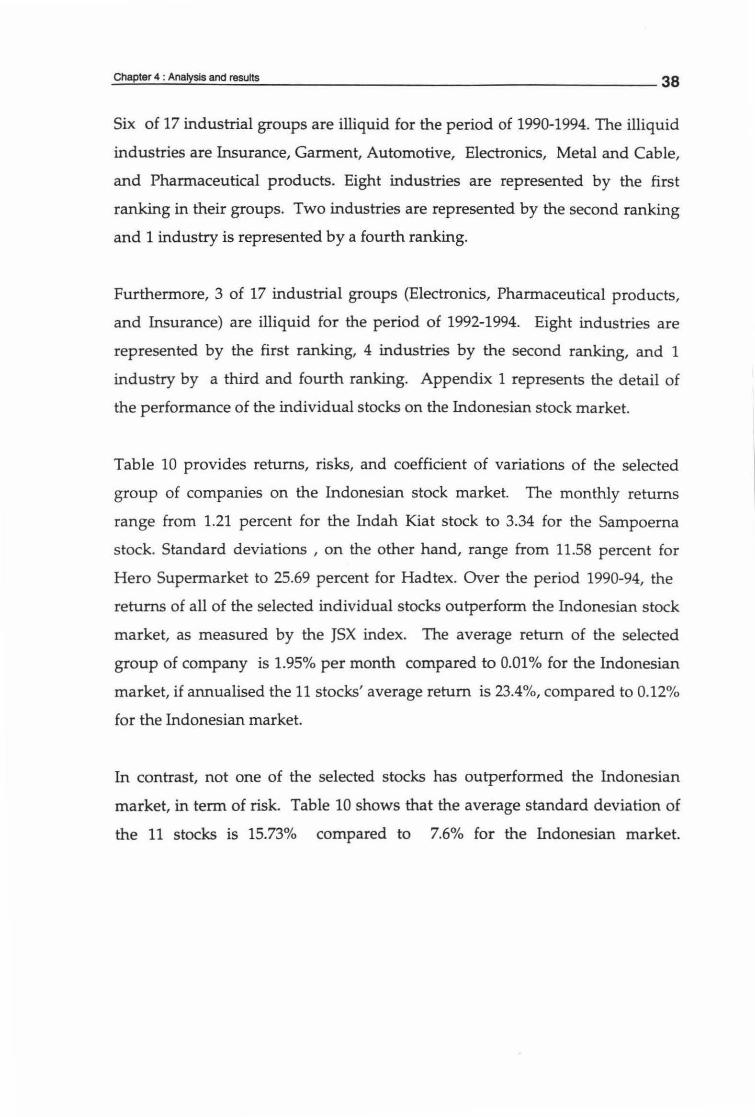
Six of 17 industrial groups are illiquid for the period of 1990-1994. The illiquid
industries are Insurance, Garment, Automotive, Electronics, Metal and Cable,
and Pharmaceutical products. Eight industries are represented by the first
ranking in their groups. Two industries are represented by the second ranking
and 1 industry is represented by a fourth ranking.
Furthermore, 3 of 17 industrial groups (Electronics, Pharmaceutical products,
and Insurance) are illiquid for the period of 1992-1994. Eight industries are
represented by the first ranking, 4 industries by the second ranking, and 1
industry by a third and fourth ranking. Appendix 1 represents the detail of
the performance of the individual stocks on the Indonesian stock market.
Table 10 provides returns, risks, and coefficient of variations of the selected
group of companies on the Indonesian stock market. The monthly returns
range from 1.21 percent for the Indah Kiat stock to 3.34 for the Sampoerna
stock. Standard deviations , on the other hand, range from 11.58 percent for
Hero Supermarket to 25.69 percent for Hadtex. Over the period 1990-94, the
returns of all of the selected individual stocks outperform the Indonesian stock
market, as measured by the JSX index. The average return of the selected
group of company is 1.95% per month compared to 0.01 % for the Indonesian
market, if annualised the 11 stocks' average return is 23.4%, compared to 0.12%
for the Indonesian market.
In contrast, not one of the selected stocks has outperformed the Indonesian
market, in term of risk. Table 10 shows that the average standard deviation of
the 11 stocks is 15.73% compared to 7.6% for the Indonesian market.
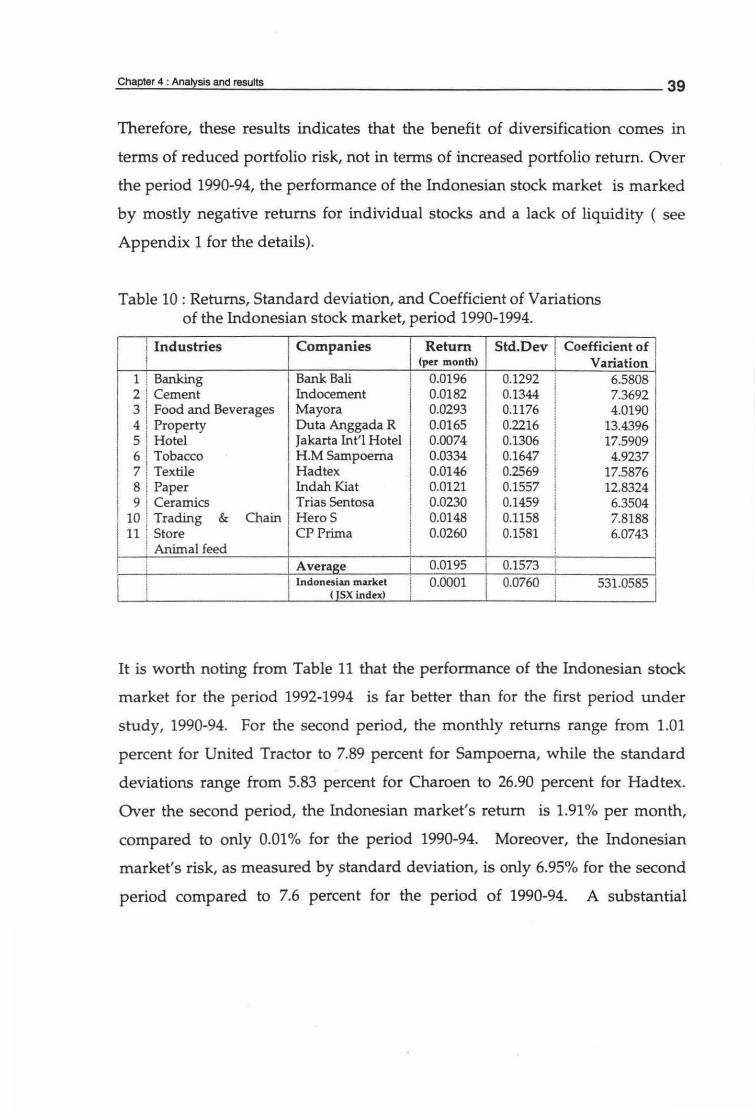
Therefore, these results indicates that the benefit of diversification comes in
terms of reduced portfolio risk, not in terms of increased portfolio return. Over
the period 1990-94, the performance of the Indonesian stock market is marked
by mostly negative returns for individual stocks and a lack of liquidity ( see
Appendix 1 for the details).
Table 10: Returns, Standard deviation, and Coefficient of Variations of the Indonesian stock market, period 1990-1994.
i Industries Companies Return Std.Dev I Coefficient of I (per month) i Variation
1 I Banking Bank Bali 0.0196 0.1292 I 6.5808 2 ! Cement Indocement 0.0182 0.1344 7.3692 3 I Food and Beverages Mayora 0.0293 0.1176 I 4.0190 4 I Property Duta Anggada R 0.0165 0.2216
I
I 13.4396 5 I Hotel Jakarta Int'l Hotel 0.0074 0.1306 I 17.5909 6 1 Tobacco HM Sampoema 0.0334 0.1647 4.9237 7 Textile Hadtex 0.0146 0.2569 I 17.5876 BI Paper Indah Kiat 0.0121 0.1557 I 12.8324 9 ! Ceramics Trias Sentosa
! 0.0230 0.1459 I 6.3504
10 i Trading & Chain HeroS I 0.0148 0.1158 I 7.8188 11 I Store CP Prima 0.0260 0.1581 6.0743
' Animal feed I ! I I
i ! Average I 0.0195 0.1573 I
!
I Indonesim market I 0.0001 0.0760 i 531.0585 ( JSX index) !
It is worth noting from Table 11 that the performance of the Indonesian stock
market for the period 1992-1994 is far better than for the first period under
study, 1990-94. For the second period, the monthly returns range from 1.01
percent for United Tractor to 7.89 percent for Sampoerna, while the standard
deviations range from 5.83 percent for Charoen to 26.90 percent for Hadtex.
Over the second period, the Indonesian market's return is 1.91 % per month,
compared to only 0.01 % for the period 1990-94. Moreover, the Indonesian
market's risk, as measured by standard deviation, is only 6.95% for the second
period compared to 7.6 percent for the period of 1990-94. A substantial
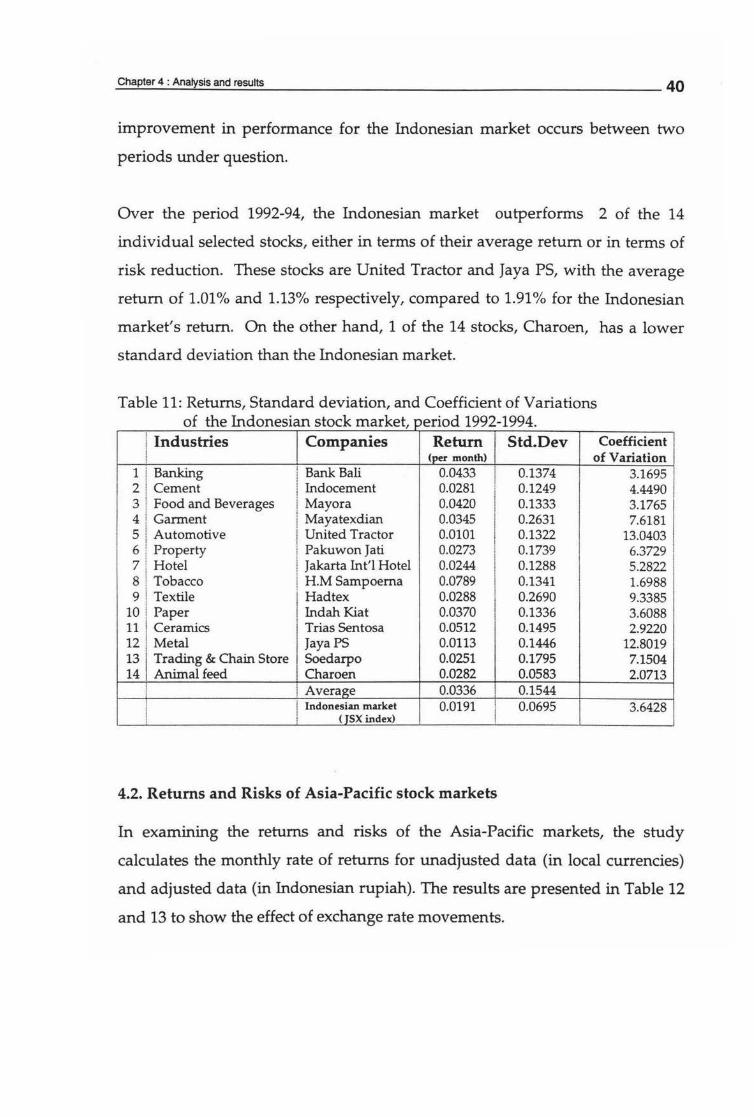
improvement in performance for the Indonesian market occurs between two
periods under question.
Over the period 1992-94, the Indonesian market outperforms 2 of the 14
individual selected stocks, either in terms of their average return or in terms of
risk reduction. These stocks are United Tractor and Jaya PS, with the average
return of 1.01 % and 1.13% respectively, compared to 1.91 % for the Indonesian
market's return. On the other hand, 1 of the 14 stocks, Charoen, has a lower
standard deviation than the Indonesian market.
Table 11: Returns, Standard deviation, and Coefficient of Variations 0 f th Ind t k k t . d 1992 1994 e ones1an soc mar e, per10 -
Industries Companies Return Std.Dev Coefficient (per month) of Variation
1 Banking Bank Bali 0.0433 0.1374 3.1695 2 Cement Indocement 0.0281 0.1249 4.4490 3 Food and Beverages Mayora 0.0420 0.1333 3.1765 4 Garment Mayatexdian 0.0345 0.2631 7.6181 5 Automotive United Tractor 0.0101 0.1322 I 13.0403 6 Property Pakuwon Jati 0.0273 0.1739
I 6.3729 .
7 Hotel Jakarta Int'l Hotel 0.0244 0.1288 5.2822 8 Tobacco H.M Sampoema 0.0789 0.1341 I 1.6988 9 Textile Hadtex 0.0288 0.2690 9.3385
10 Paper Indah Kiat 0.0370 0.1336 3.6088 11 Ceramics Trias Sentosa 0.0512 0.1495 2.9220 12 Metal Jaya PS 0.0113 0.1446 12.8019 13 Trading & Chain Store Soedarpo 0.0251 0.1795 7.1504 14 Animal feed Charoen 0.0282 0.0583 2.0713
Average 0.0336 0.1544 Indonesian market 0.0191 I 0.0695 3.6428
( TSX index) !
4.2. Returns and Risks of Asia-Pacific stock markets
In examining the returns and risks of the Asia-Pacific markets, the study
calculates the monthly rate of returns for unadjusted data (in local currencies)
and adjusted data (in Indonesian rupiah). The results are presented in Table 12
and 13 to show the effect of exchange rate movements.
_C_ha~pt_er_4_:A_n_a~~s_is_an_d~~~~-lts-'--~~~~~~~~~~~~~~~~~~~~41
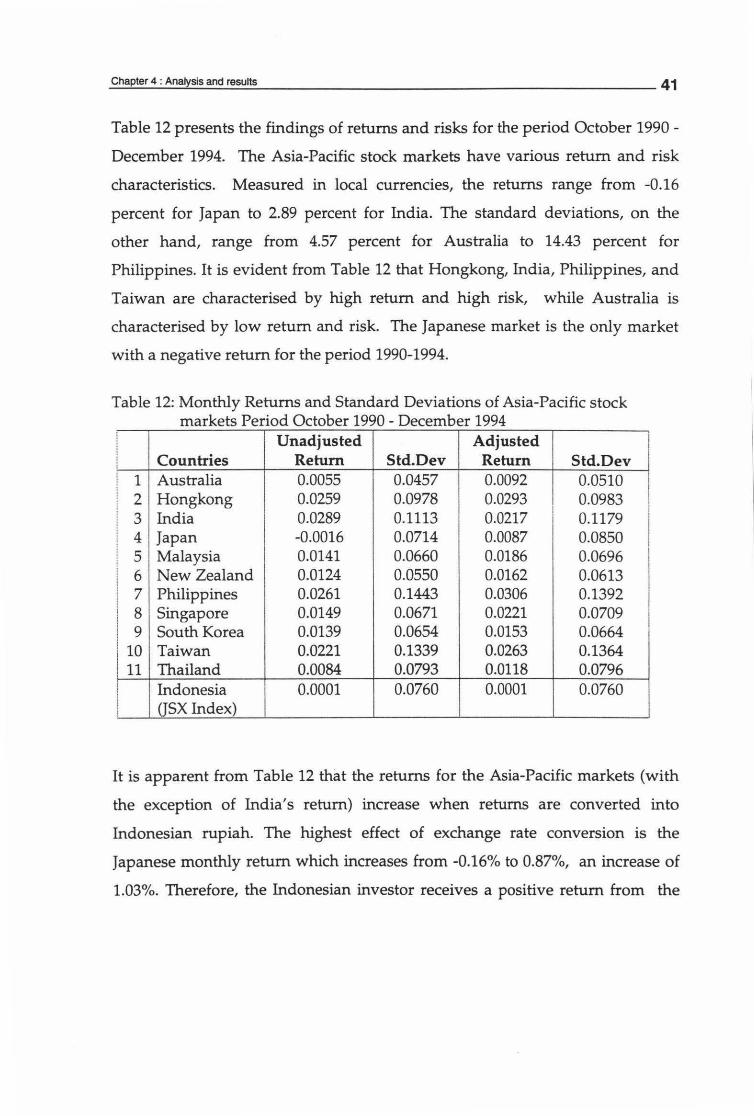
Table 12 presents the findings of returns and risks for the period October 1990 -
December 1994. The Asia-Pacific stock markets have various return and risk
characteristics. Measured in local currencies, the returns range from -0.16
percent for Japan to 2.89 percent for India. The standard deviations, on the
other hand, range from 4.57 percent for Australia to 14.43 percent for
Philippines. It is evident from Table 12 that Hongkong, India, Philippines, and
Taiwan are characterised by high return and high risk, while Australia is
characterised by low return and risk. The Japanese market is the only market
with a negative return for the period 1990-1994.
Table 12: Monthly Returns and Standard Deviations of Asia-Pacific stock markets Period October 1990 - December 1994
! Unadjusted Adjusted i
Countries Return Std.Dev Return Std.Dev !
i
! 1 Australia 0.0055 0.0457 0.0092 0.0510 !
! 2 Hongkong 0.0259 0.0978 0.0293 0.0983 i I i 3 India 0.0289 0.1113 0.0217 0.1179 ! !
4 Japan -0.0016 0.0714 0.0087 0.0850 i !
! 5 Malaysia 0.0141 0.0660 0.0186 0.0696 i
I 6 New Zealand 0.0124 0.0550 0.0162 0.0613 I 7 Philippines 0.0261 0.1443 0.0306 0.1392 l 8 Singapore 0.0149 0.0671 0.0221 0.0709 i ! 9 South Korea 0.0139 0.0654 0.0153 0.0664 ! I
i 10 Taiwan 0.0221 0.1339 0.0263 0.1364 I 11 Thailand 0.0084 0.0793 0.0118 0.0796 ! Indonesia 0.0001 0.0760 0.0001 0.0760 ! i asx Index) !
I
It is apparent from Table 12 that the returns for the Asia-Pacific markets (with
the exception of India's return) increase when returns are converted into
Indonesian rupiah. The highest effect of exchange rate conversion is the
Japanese monthly return which increases from -0.16% to 0.87%, an increase of
1.03%. Therefore, the Indonesian investor receives a positive return from the
exchange rate movements. In the case of India, the Indian rupee is the only
currency that depreciates against the Indonesian rupiah. Consequently, India's
adjusted return decreases.
The Australian, Malaysian, New Zealand, Singaporean, and South Korean
markets outperform the Indonesian market, in term of return as well as risk.
Meanwhile, Indonesia outperforms Hongkong, India, Japan, Philippines,
Taiwan, as well as Thailand, in term of risk.
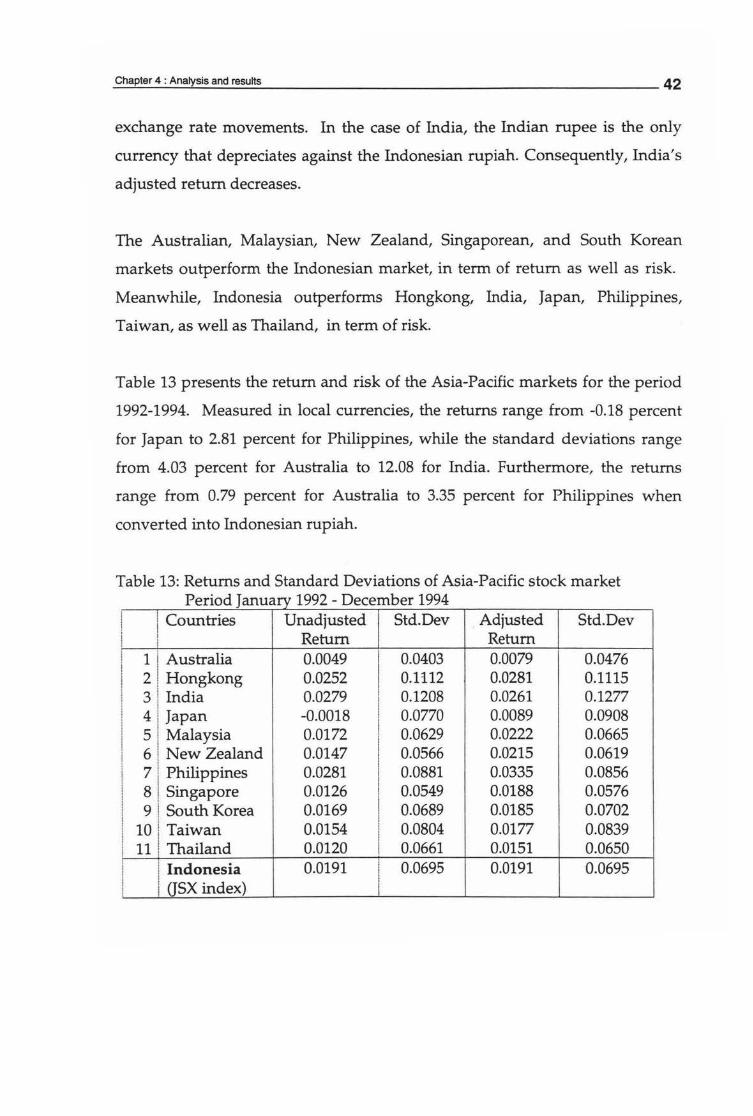
Table 13 presents the return and risk of the Asia-Pacific markets for the period
1992-1994. Measured in local currencies, the returns range from -0.18 percent
for Japan to 2.81 percent for Philippines, while the standard deviations range
from 4.03 percent for Australia to 12.08 for India. Furthermore, the returns
range from 0.79 percent for Australia to 3.35 percent for Philippines when
converted into Indonesian rupiah.
Table 13: Returns and Standard Deviations of Asia-Pacific stock market P . d J 1992 D b 1994 eno anuary - ecem er
Countries Unadjusted Std.Dev . Adjusted Std.Dev Return Return
1 Australia 0.0049 0.0403 0.0079 0.0476 2 Hongkong 0.0252 0.1112 0.0281 0.1115 3 India 0.0279 0.1208 0.0261 0.1277 4 Japan -0.0018 0.0770 0.0089 0.0908 5 Malaysia 0.0172 0.0629 0.0222 0.0665 6 New Zealand 0.0147 0.0566 0.0215 0.0619 7 Philippines 0.0281 0.0881 0.0335 0.0856 8 Singapore 0.0126 0.0549 0.0188 0.0576 9 South Korea 0.0169 0.0689 0.0185 0.0702
10 Taiwan 0.0154 0.0804 0.0177 0.0839 11 Thailand 0.0120 0.0661 0.0151 0.0650
Indonesia 0.0191 0.0695 0.0191 0.0695 (JSX index)
_C_ha~p_te_r4_:_A_na~~-si_s_an_d_ra_su_lt_s~~~~~~~~~~~~~~~~~~~~~~43
Over the period 1990-1994, the returns for Asia-Pacific markets outperform the
Indonesian market. The only exception is the Japanese market, the unadjusted
return for Japan is negative. In this case, the Indonesian market has performed
better than the Japanese market when rate of return is measured in the local
currency.
For the period 1992 - 1994, the Indonesian market shows a much better
performance than for the period 1990 - 1994. Table 13 indicates the
improvement on the Indonesian performance by outperforming Japan and
Taiwan, in term of return and risk, and also outperforming Australia,
Singapore, South Korea, and Thailand, in term of return.
It is noteworthy that the Japanese market, as measured in Yen, still shows
negative return for the period 1992-1994, that is, -0.18% with 7.7% standard
deviation. The performance of the Japanese market over the period 1992-1994 is
worse than over the period 1990-1994. Yet, the Indonesian investor receives
more benefit from the exchange rate movements of the Japanese Yen. The
Japanese return increases to 1.07% when converted into Indonesian rupiah.
This indicates the continuing appreciation of the Japanese currency against the
Indonesian currency.
Fluctuating exchange rates are indeed found to increase the potential gains for
the Philippines and Thai markets as well as making them less risky. The
evidence can be seen from Table 12 and 13, where the Philippines and Thai
adjusted standard deviations are lower than unadjusted one. Meanwhile, the
other markets show an increase in risk after adjustment for exchange rates.
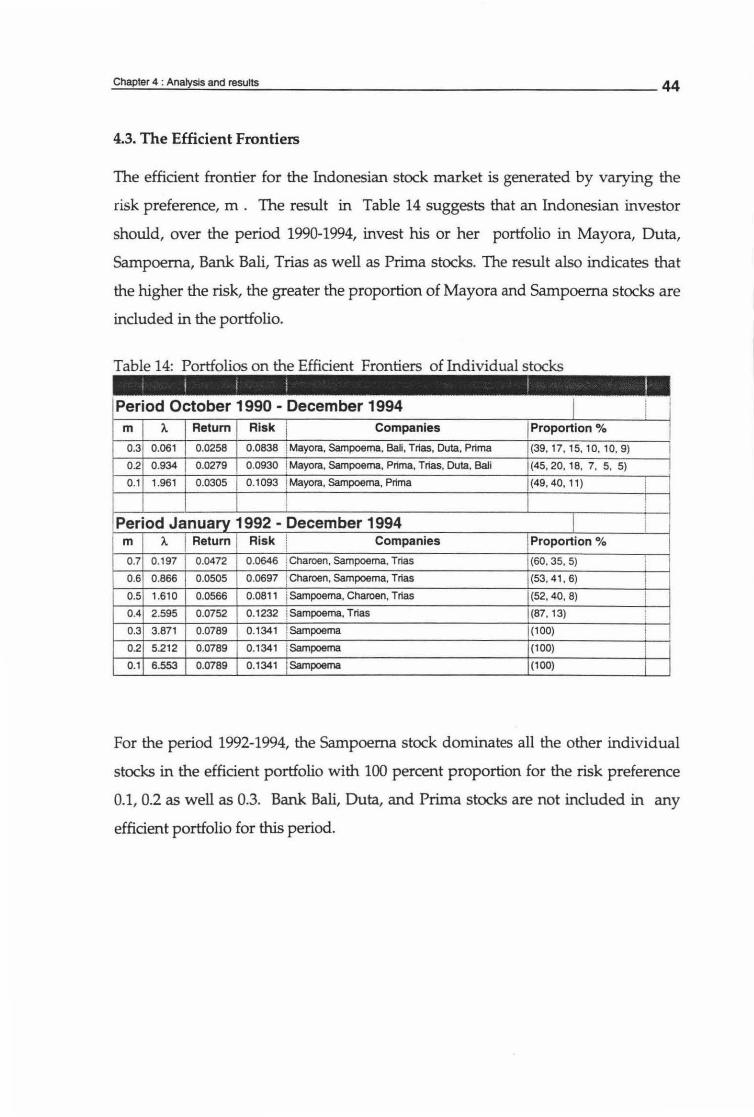
_C_hap-'--ra_r4_:_A_naly__._s_·s_an_d_r_es_u~~~~~~~~~~~~~~~~~~~~~~~~-44
4.3. The Efficient Frontiers
The efficient frontier for the Indonesian stock market is generated by varying the
risk preference, m . The result in Table 14 suggests that an Indonesian investor
should, over the period 1990-1994, invest his or her portfolio in Mayora, Duta,
Sampoema, Bank Bali, Trias as well as Prima stocks. The result also indicates that
the higher the risk, the greater the proportion of Mayora and Sampoema stocks are
included in the portfolio.
Table 14: Portfolios on the Efficient Frontiers of Individual stocks
Period October 1990 - December 1994 m A. Return Risk i Companies Proportion %
0.3 0.061 0.0258 0.0838 ! Mayora, Sampoema, Ball, Trias, Duta, Prima (39, 17, 15, 10, 10, 9)
0.2 0.934 0.0279 0.0930 ! Mayora, Sampoema, Prima, Trias, Dula, Bali (45, 20, 18, 7, 5, 5)
0.1 1.961 0.0305 0.1093 , Mayora, Sampoema, Prima (49, 40, 11)
! Period Janua 1992 - December 1994
A. Return Risk i
Companies Proportion % m i i
0.7 0.197 0.0472 0.0646 i Charoen, Sampoema, Trias (60, 35, 5)
0.6 0.866 0.0505 0.0697 J Charoen, Sampoema, Trias (53, 41 , 6)
0.5 1.610 0.0566 0.0811 ! Sampoema, Charoen, Trias (52, 40, 8)
0.4 2.595 0.0752 0.1232 !Sampoema, Trias (87, 13)
0.3 3.871 0.0789 0.1341 !Sampoema (100)
02 5212 0.0789 0.1341 !Sampoema (100)
0.1 6.553 0.0789 0.1341 Sampoema (100)
For the period 1992-1994, the Sampoerna stock dominates all the other individual
stocks in the efficient portfolio with 100 percent proportion for the risk preference
0.1, 0.2 as well as 0.3. Bank Bali, Duta, and Prima stocks are not included in any
efficient portfolio for this period.
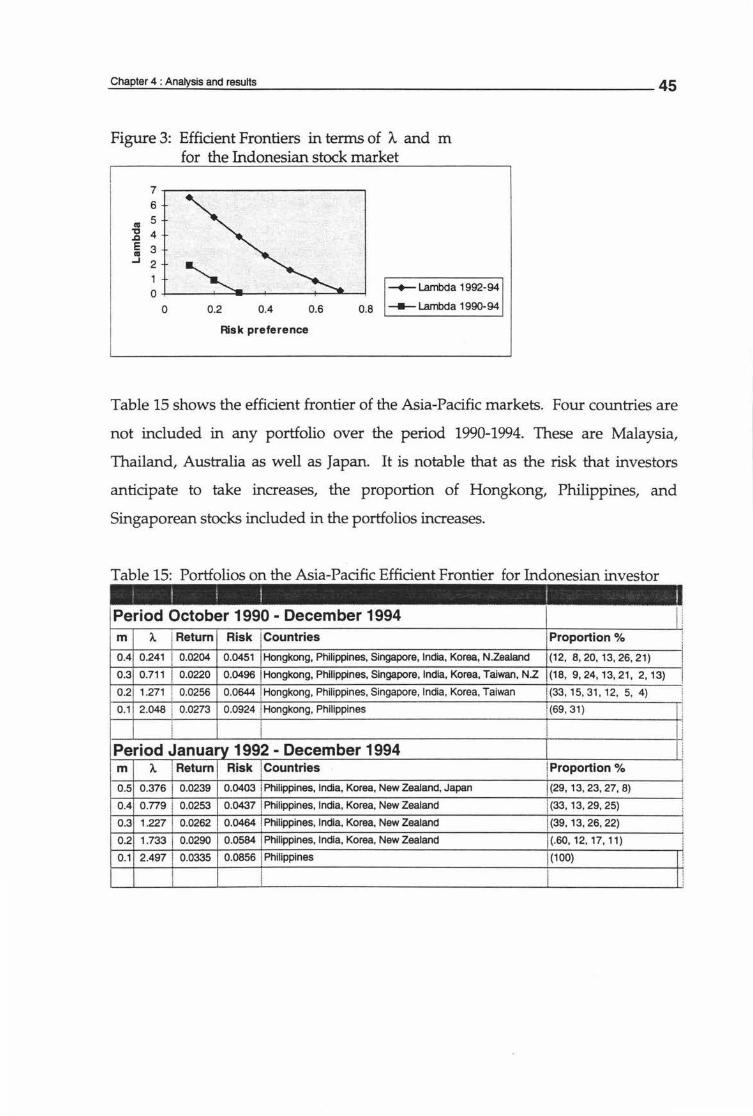
_C_h~ap~te_r_4_:_A_na~~~s_is_a_nd~r~e~su~lt~s~~~~~~~~~~~~~~~~~~~~~~~~~45
Figure 3: Efficient Frontiers in terms of A. and m for the Indonesian stock market
7~~~~~~~~~~~~--.
6
Ill 5 :g 4
~ 3 .J 2
1 O+-~~-'-~J---1-~~-+~--~
-+-Lambda 1992-94
0.8 .__Lambda 1990-94 0 0.2 0.4 0.6
Risk preference
Table 15 shows the efficient frontier of the Asia-Pacific markets. Four countries are
not included in any portfolio over the period 1990-1994. These are Malaysia,
Thailand, Australia as well as Japan. It is notable that as the risk that investors
anticipate to take increases, the proportion of Hongkong, Philippines, and
Singaporean stocks included in the portfolios increases.
Table 15: Portfolios on the Asia-Pacific Efficient Frontier for Indonesian investor l l ' l I '
Period October 1990 - December 1994 I I m A. jRetum Risk i Countries 'Proportion %
I
0.4 0241 I 0.0204 0.0451 jHongkong, Philippines, Singapore, India, Korea, N.Zealand (12, 8, 20, 13, 26, 21)
0.3 0.111 I 0.0220 0.0496 I Hongkong, Philippines, Singapore, India, Korea, Taiwan, N.Z (18, 9, 24, 13, 21, 2, 13)
0.2 1.271 : 0.0256 0.0644 ! Hongkong, Philippines, Singapore, India, Korea, Taiwan 1(33, 15, 31 , 12, 5, 4) !
0.1 2.048 ! 0.0273 0.0924 ! Hongkong, Philippines j(69, 31)
' I f I
Period January 1992 - December 1994 m A. I Return Risk iCountries ! Proportion %
! !
0.5 o.376 1 0.0239 0.0403 ! Philippines, India, Korea, New Zealand, Japan !(29, 13, 23, 27, 8)
0.4 0.779 ! 0.0253 0.0437 ! Philippines, India, Korea, New Zealand ! (33, 13, 29, 25)
0.3 1.227 ! 0.0262 0.0464 ! Philippines, India, Korea, New Zealand !(39, 13, 26, 22)
0.2 1.733 i 0.0290 0.0584 ! Philippines, India, Korea, New Zealand l(.60, 12, 17, 11)
0.1 2.497 : 0.0335 0.0856 ! Philippines !(100)
l I i
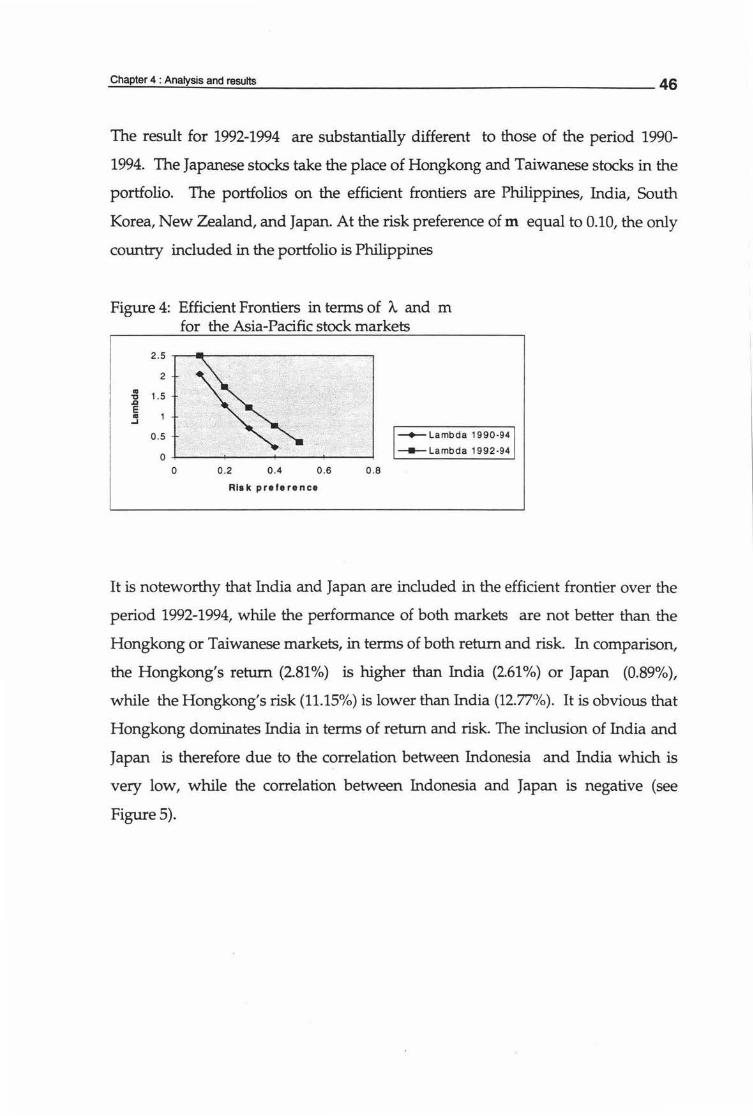
The result for 1992-1994 are substantially different to those of the period 1990-
1994. The Japanese stocks take the place of Hongkong and Taiwanese stocks in the
portfolio. The portfolios on the efficient frontiers are Philippines, India, South
Korea, New Zealand, and Japan. At the risk preference of m equal to 0.10, the only
country included in the portfolio is Philippines
Figure 4: Efficient Frontiers in terms of A. and m for the Asia-Pacific stock markets
2 .5
2 .. 1.5 "ti
.1:1 E .. .J
0 .5
0 0 0 .2 0 .4 0.6
Risk preference
0 .8
~Lambda 1990-94
---Lambda 1992·94
It is noteworthy that India and Japan are included in the efficient frontier over the
period 1992-1994, while the performance of both markets are not better than the
Hongkong or Taiwanese markets, in terms of both return and risk. In comparison,
the Hongkong's return (2.81 %) is higher than India (2.61 %) or Japan (0.89%),
while the Hongkong's risk (11.15%) is lower than India (12.77%). It is obvious that
Hongkong dominates India in terms of return and risk. The inclusion of India and
Japan is therefore due to the correlation between Indonesia and India which is
very low, while the correlation between Indonesia and Japan is negative (see
Figure 5).
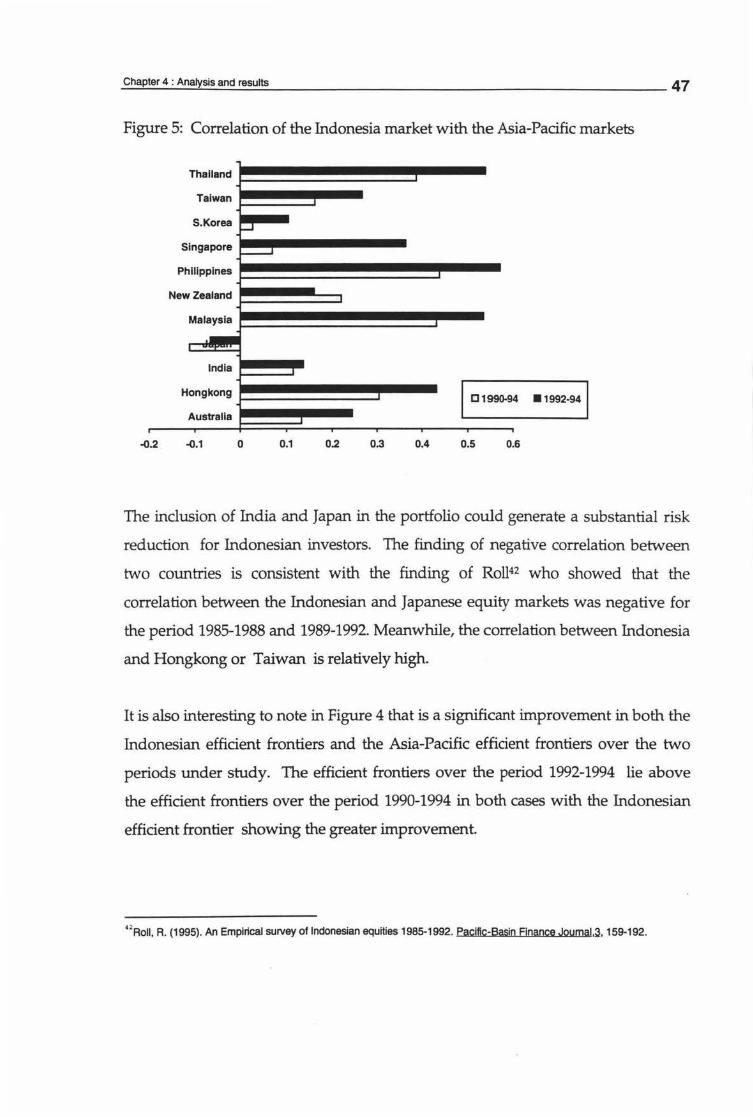
Figure 5: Correlation of the Indonesia market with the Asia-Pacific markets
Thailand
Taiwan
S.Korea u
Singapore ...___., Philippines
New Zealand
Malaysia -. India
I 01990-9 Hongkong
Australia
4 •1992-941
-0.2 -0.1 0 0.1 0.2 0.3 0.4 0.5 0.6
The inclusion of India and Japan in the portfolio could generate a substantial risk
reduction for Indonesian investors. The finding of negative correlation between
two countries is consistent with the finding of Roll42 who showed that the
correlation between the Indonesian and Japanese equity markets was negative for
the period 1985-1988 and 1989-1992. Meanwhile, the correlation between Indonesia
and Hongkong or Taiwan is relatively high.
It is also interesting to note in Figure 4 that is a significant improvement in both the
Indonesian efficient frontiers and the Asia-Pacific efficient frontiers over the two
periods under study. The efficient frontiers over the period 1992-1994 lie above
the efficient frontiers over the period 1990-1994 in both cases with the Indonesian
efficient frontier showing the greater improvement.
"Roll, R. (1995). An Empirical survey of Indonesian equities 1985-1992. Pacific-Basin Finance Journal.~. 159-192.
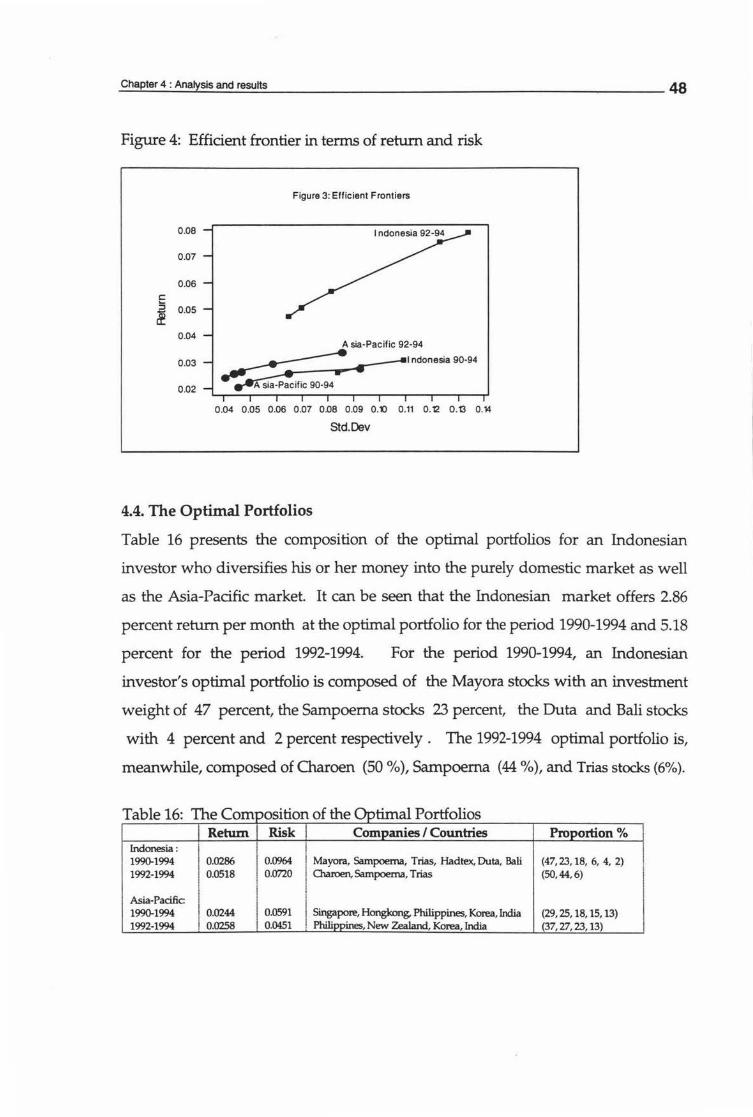
Figure 4: Efficient frontier in tenns of return and risk
O.OB
O.Q7
0.06
E ~ 0.05
0.04
0.03
0.02
Figure 3: Efficient Frontiers
A sia·Pacific 92·94
~ Indonesia 90·94
A sia·Pacitic 90·94
0.04 0.05 0.06 0.07 O.OB 0.09 O.'O 0.11 O.t2 0.13 0.14
Std.Dev
4.4. The Optimal Portfolios
Table 16 presents the composition of the optimal portfolios for an Indonesian
investor who diversifies his or her money into the purely domestic market as well
as the Asia-Pacific market. It can be seen that the Indonesian market offers 2.86
percent return per month at the optimal portfolio for the period 1990-1994 and 5.18
percent for the period 1992-1994. For the period 1990-1994, an Indonesian
investor's optimal portfolio is composed of the Mayora stocks with an investment
weight of 47 percent, the Sampoerna stocks 23 percent, the Duta and Bali stocks
with 4 percent and 2 percent respectively. The 1992-1994 optimal portfolio is,
meanwhile, composed of Charoen (50 %), Sarnpoerna (44 %), and Trias stocks (6%).
Table 16: The Com osition of the
Indonesia: 1990-1994 1992-1994
Asia-Pacific 1990-1994 1992-1994
Return Risk
I 0.0286 I o.0518
I 0.0244 ! 0.0258
i I o.0964 ' 0.0720
I I o.0591 I 0.0451
i I Mayora, Sampoema, Trias, Hadtex, Duta, Bali ! Cllaroen, Sampoema, Trias
I I Singapore, Hongkong, Philippines, Korea, India ! Phili ines, New Zealand, Korea, India
Pro ortion %
(47, 23, 18, 6, 4, 2) (50,44,6)
(29, 25, 18, 15, 13) (37, 27, 23, 13)
Investing in the Asia-Pacific markets, an Indonesian investor earns a lower return
than investing in the domestic market. The Asia-Pacific return is 2.44 percent per
month for the period 1990-1994 and 2.58 percent for the period 1992-1994. In this
case, an Indonesian investor's optimal portfolio is composed of the Singaporean
stocks with an investment weight of 29 percent, the Hongkong stocks at 26 percent,
Philippines 18 percent, Korea 15 percent, and India 13 percent in the period 1990-
1994. For the period 1992-1994, the composition of the optimal portfolio is
Philippines 37 percent, New Zealand 27 percent, South Korea 23 percent, and
India 13 percent.
The inclusion of India in the optimal portfolio is probably due to its negative
correlation with New Zealand, South Korea, and Hongkong who dominate the
other markets in terms of the investment proportion (see Appendix 2). Also, the
correlation between India and Indonesia or Philippines is very low.
The composition of optimal portfolios reveals that an Indonesian investor should
not invest in Japanese, Australian, Malaysian, and Thai markets in the two
periods under study. The Malaysian and Thai markets are not included due to
their high correlations with Indonesian, Philippines and Singaporean markets. It
can be noted that Malaysia, Indonesia, Philippines, Thailand, and Singapore are
the members of ASEAN (the Association of Southeast Asia Nation) countries. The
relatively high correlation among ASEAN countries supports the Santamaria and
Espitia study43 as well as Eun and Resnick study44 that economic integration of
countries, as well as close coordination of economic policies is reflected into closely
43 Santamaria, M., & Espitia, M. (1994). International Diversification among the capital Markets of the EEC. Applied Flnancjal Economjcs, ~. 1-10.
~Eun, C., & Resnick, B. (1987). International dtyersification under Estimation Risk: Actual vs. Potential Gains. In S.J. Khoury & A. Ghosh (eds), Recent Developments In International Banking and Finance. Lexington, Mass: Lexington Books, D.C. Heath & Co.
Chapter 4 : Analysis and results 50 ~-'--~~'--~~...;.;..._~~~~~~~~~~~~~~~~~~~-
related movement within the different country's capital market. The same tends to
hold for the United States and Canada, and EEC countries.
Japan and Australian markets are meanwhile marked by low returns and high
risks. Japan and Australia are thus excluded from the Indonesian investor's
optimal portfolio.
4.5. The Gains from the Asia-Pacific Diversification
As mentioned in the definition of terms, the diversification gain is measured by
the Sharpe ratio differential; a positive value indicates that Indonesian investors
can potentially gain from Asia-Pacific diversification. However, before analysing
the gains, it is of importance to discuss the effect of diversification toward risk and
return of the national markets.
Figure 5 shows the efficient frontier and optimal portfolio of the Asia-Pacific
markets as well as the optimal portfolio for the Indonesian market in the period
1990-1994. Obviously, the efficient frontier lies above the Asia-Pacific markets.
The optimal portfolio (the combination of Hongkong, Philippines, Korean, and
Indian markets) dominates almost all of the national markets in terms of risk and
return except for Hongkong, Philippines, Taiwan , and Indonesia who have higher
returns but more risk.
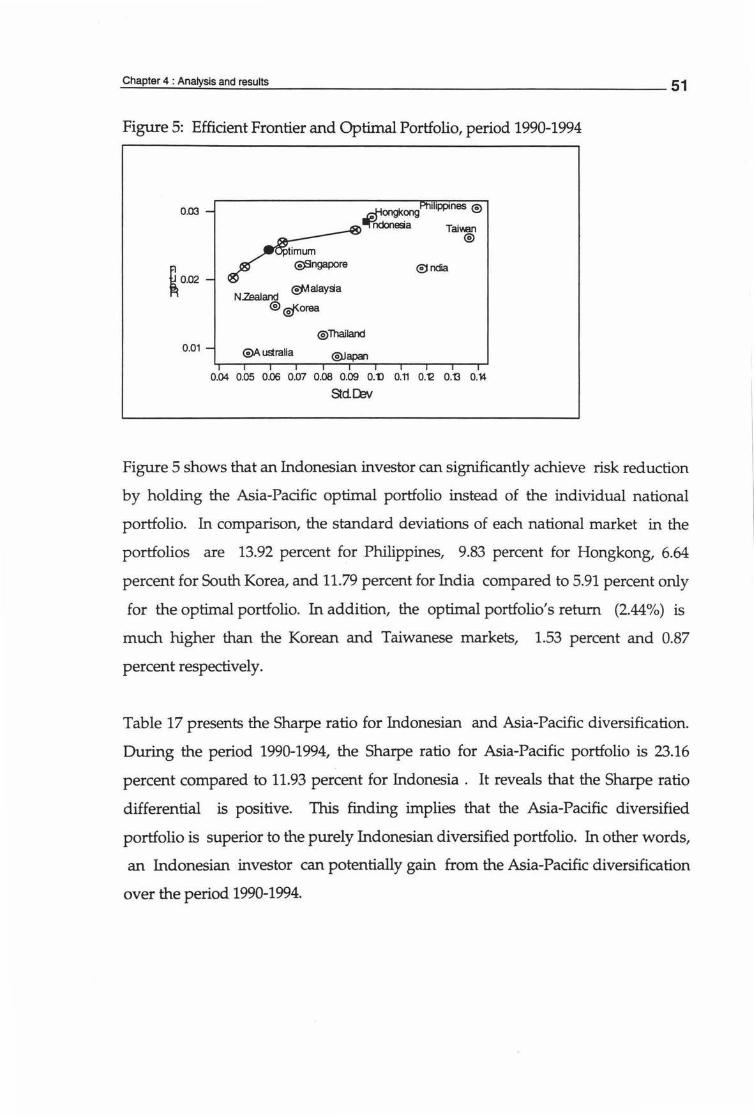
Figure 5: Efficient Frontier and Optimal Portfolio, period 1990-1994
0.03
0.01
@'}Ji ataysa NZealand
®@forea
r.;fiongkong i 1ppmes @
lllf'ndonesia Taiv.an ®
@Thailand
@Australia
0.04 0.05 0.06 0.07 0.08 0.09 0.tl 0.11 O."t<! 0.13 0.14
StdD'N
Figure 5 shows that an Indonesian investor can significantly achieve risk reduction
by holding the Asia-Pacific optimal portfolio instead of the individual national
portfolio. In comparison, the standard deviations of each national market in the
portfolios are 13.92 percent for Philippines, 9.83 percent for Hongkong, 6.64
percent for South Korea, and 11.79 percent for India compared to 5.91 percent only
for the optimal portfolio. In addition, the optimal portfolio's return (2.44%) is
much higher than the Korean and Taiwanese markets, 1.53 percent and 0.87
percent respectively.
Table 17 presents the Sharpe ratio for Indonesian and Asia-Pacific diversification.
During the period 1990-1994, the Sharpe ratio for Asia-Pacific portfolio is 23.16
percent compared to 11.93 percent for Indonesia . It reveals that the Sharpe ratio
differential is positive. This finding implies that the Asia-Pacific diversified
portfolio is superior to the purely Indonesian diversified portfolio. In other words,
an Indonesian investor can potentially gain from the Asia-Pacific diversification
over the period 1990-1994.
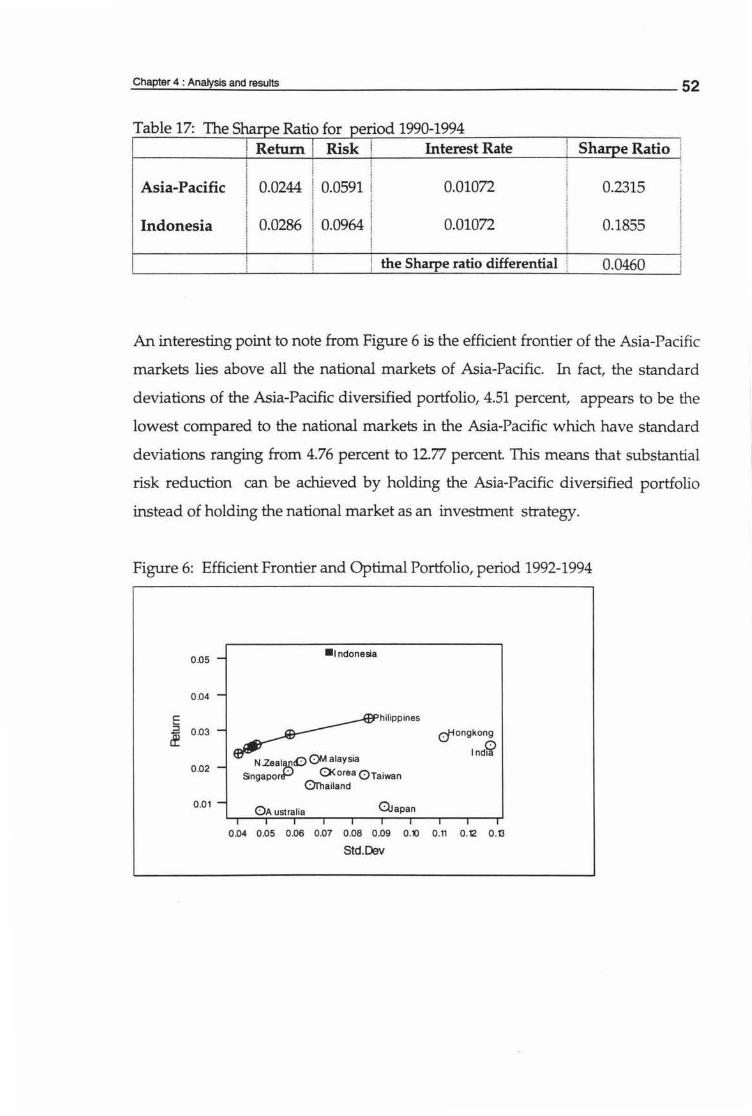
Table 17: The Sharpe Ratio for period 1990-1994 I Return I Risk i Interest Rate i Sharpe Ratio ! . ' l ' l
Asia-Pacific 0.0244 0.0591 0.01072 0.2315
Indonesia 0.0286 0.0964 0.01072 0.1855
the Sharpe ratio differential 0.0460 ' I
An interesting point to note from Figure 6 is the efficient frontier of the Asia-Pacific
markets lies above all the national markets of Asia-Pacific. In fact, the standard
deviations of the Asia-Pacific diversified portfolio, 4.51 percent, appears to be the
lowest compared to the national markets in the Asia-Pacific which have standard
deviations ranging from 4.76 percent to 12.77 percent. This means that substantial
risk reduction can be achieved by holding the Asia-Pacific diversified portfolio
instead of holding the national market as an investment strategy.
Figure 6: Efficient Frontier and Optimal Portfolio, period 1992-1994
0.05 -•Indonesia
0 .04 -
c: ~hilippines :s 0.03 -;f
N .zeal cO ()Malaysia 0
·02
- SingaporS:S O<orea 0Taiwan Oniailand
(fongkong
I nl(;{
0.01 -OA ustralia Oiapan
I I I I I I I I I I
0.04 0.05 0 .06 0.07 0.08 0.09 0.10 0 .11 0 .12 O.t3
Std.Dev
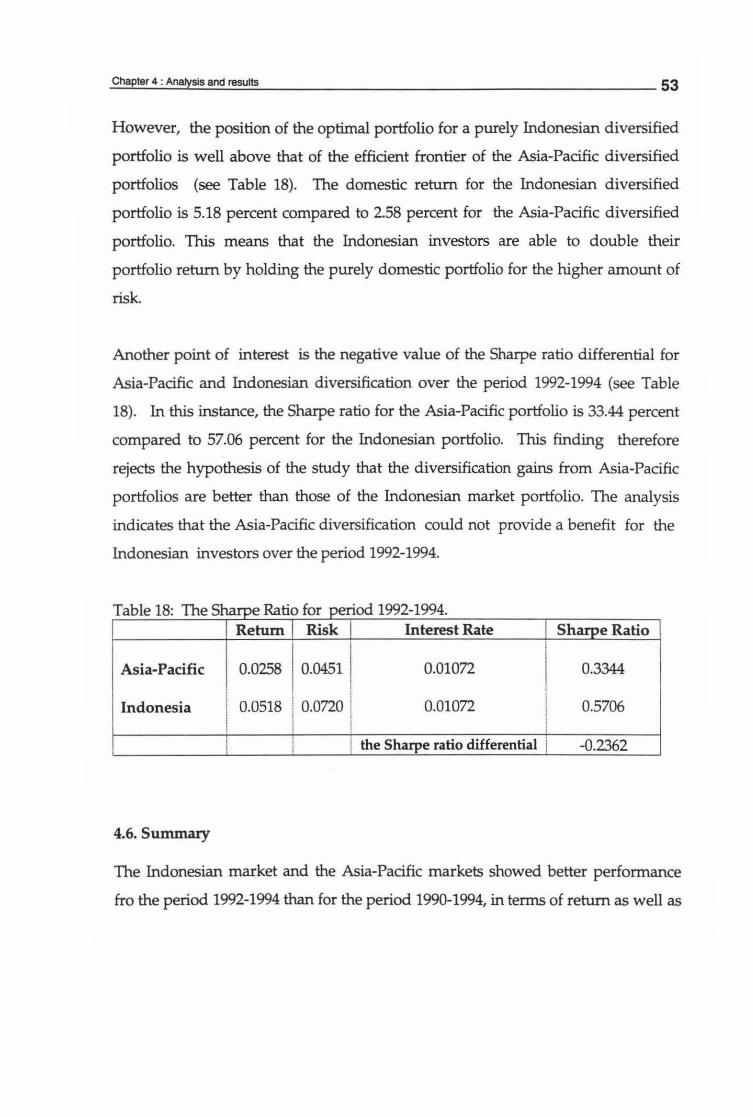
However, the position of the optimal portfolio for a purely Indonesian diversified
portfolio is well above that of the efficient frontier of the Asia-Pacific diversified
portfolios (see Table 18). The domestic return for the Indonesian diversified
portfolio is 5.18 percent compared to 2.58 percent for the Asia-Pacific diversified
portfolio. This means that the Indonesian investors are able to double their
portfolio return by holding the purely domestic portfolio for the higher amount of
risk.
Another point of interest is the negative value of the Sharpe ratio differential for
Asia-Pacific and Indonesian diversification over the period 1992-1994 (see Table
18). In this instance, the Sharpe ratio for the Asia-Pacific portfolio is 33.44 percent
compared to 57.06 percent for the Indonesian portfolio. This finding therefore
rejects the hypothesis of the study that the diversification gains from Asia-Pacific
portfolios are better than those of the Indonesian market portfolio. The analysis
indicates that the Asia-Pacific diversification could not provide a benefit for the
Indonesian investors over the period 1992-1994.
Table 18: The S e Ratio for eriod 1992-1994.
Asia-Pacific
Indonesia
4.6. Summary
Return Risk Interest Rate
0.0258 0.0451
0.0518 I o.o72o . I I
0.01072
0.01072
I the Sharpe ratio differential
Sh e Ratio
0.3344
0.5706
-0.2362
The Indonesian market and the Asia-Pacific markets showed better performance
fro the period 1992-1994 than for the period 1990-1994, in terms of return as well as
risk. Furthermore, the empirical results showed that the 1990-1994 efficient
frontiers lie below the 1992-1994 efficient frontiers. Interestingly, the 1992-1994
efficient frontier for the Indonesian market lies well above the efficient frontier for
Asia-Pacific markets.
The composition of optimal portfolios revealed that Mayora and Trias stocks
should be included in the purely domestic diversified portfolio for both periods.
Meanwhile the Philippines, South Korean, and Indian stock markets should be
included in the Asia-Pacific optimal portfolio in both periods. The Indian market
does not perform better than Thai, Taiwanese or Malaysian markets but the
inclusion of India is reasonable because the Indian market correlates negatively
with South Korean, New Zealand, and the Hongkong market. India also has a
relatively low degree of correlation with Philippines. Four of these countries
dominate the optimal portfolio over the two periods under study.
Gains from Asia-Pacific diversification do exist for the period 1990-1994. The
period 1992-1994 is, on the other hand, marked by a negative value of Sharpe ratio
differential, indicating that Indonesian investors cannot significantly gain from
Asia-Pacific diversification.
CHAPTER 5
CONCLUSIONS
The objective of this study has been to examine the gains for Indonesian investors
who diversify their portfolios into the Asia-Pacific stock markets compared to
purely domestic diversification.
Earlier studies have shown that the low correaltion among national stock markets
provided substantial risk reduction opportunities for the investors who diversified
their portfolios internationally. The previous evidence has lead to the conclusion
that an investor can significantly achieve risk reduction by holding the
international portfolios instead of the domestic portfolios. In other words, the gains
from international diversification do exist.
However, the empirical results of this study do not fully support this view,
particularly for the period 1992-1994. These results are elaborated upon next.
It was shown that the Indonesian market's performance between 1992-1994 was
substantially better than its performance during the period 1990-1994. The
Indonesian market's monthly return increased from 0.01 percent to 1.91 percent,
while standard deviation decreased from 7.60 percent to 6.95 percent. For the same
periods, the average return of the Asia-Pacific markets increased from 1.91 percent
to 1.99 percent, while standard deviation decreased from 8.87 percent to 7.89
percent. These comparisons reveal that the Asia-Pacific stock markets are
undergoing sustained growth, especially for such emerging markets as Indonesia,
Thailand, Philippines, and India.
Gains from Asia-Pacific diversification do exist for the period 1990-1994. For the
more recent period of 1992-1994, however the sharpe ratio has a negative value
55
indicating that the Indonesian investors cannot significantly gain from the Asia
Pacific diversification.
Thus this study suggest that Indonesian investors should diversify their portfolios
within the Indonesian market instead of investing abroad.
During the analysis it became apparent that there were significantly different
results for the two periods under study. The period 1990-1994 supported the
previous studies on the benefit of international diversification, the period 1992-
1994 did not. These results are therefore very much period specific and this
point needs to be emphasized. The superior result of the purely domestic
market indicates the necessity for further research that would yield valuable
information about the gains of international diversification in recent years,
especially from other emerging market perspectives.
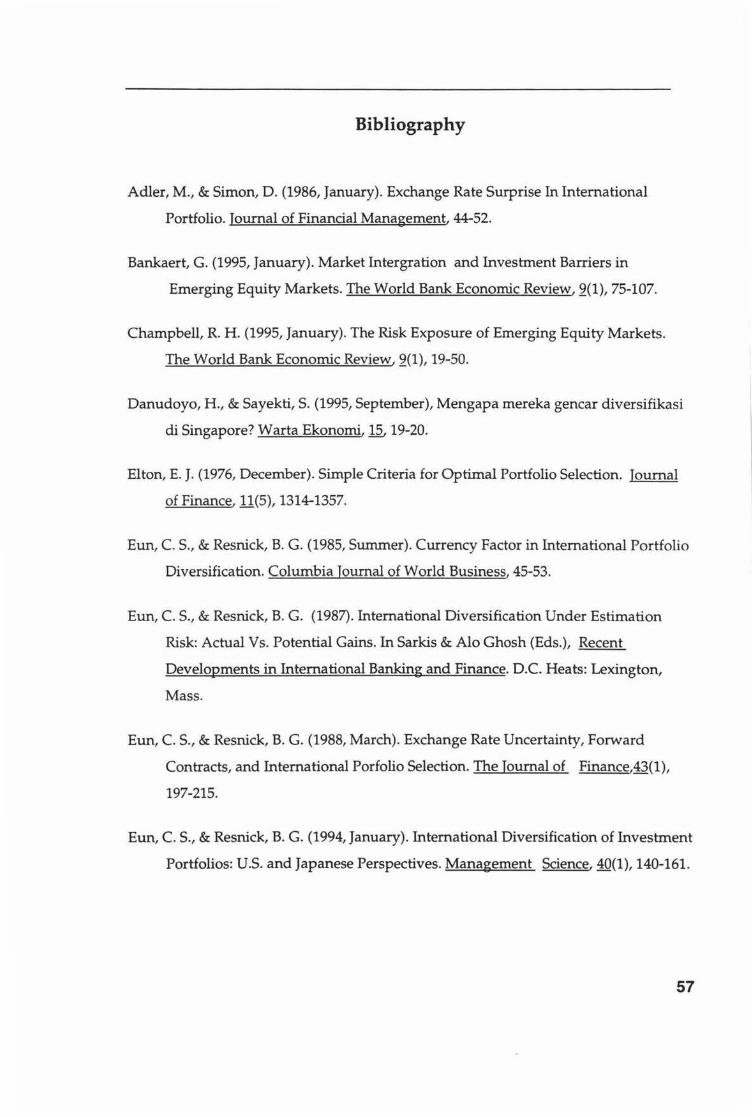
Bibliography
Adler, M., & Simon, D. (1986, January). Exchange Rate Surprise In International
Portfolio. Journal of Financial Management, 44-52.
Bankaert, G. (1995, January). Market Intergration and Investment Barriers in
Emerging Equity Markets. The World Bank Economic Review, 2(1), 75-107.
Champbell, R. H. (1995, January). The Risk Exposure of Emerging Equity Markets.
The World Bank Economic Review, 2(1), 19-50.
Danudoyo, H., & Sayekti, S. (1995, September), Mengapa mereka gencar diversifikasi
di Singapore? Warta Ekonomi, 12, 19-20.
Elton, E. J. (1976, December). Simple Criteria for Optimal Portfolio Selection. Journal
of Finance, 11(5), 1314-1357.
Eun, C. S., & Resnick, B. G. (1985, Summer). Currency Factor in International Portfolio
Diversification. Columbia Journal of World Business, 45-53.
Eun, C. S., & Resnick, B. G. (1987). International Diversification Under Estimation
Risk: Actual Vs. Potential Gains. In Sarkis & Alo Ghosh (Eds.), Recent
Developments in International Banking and Finance. D.C. Heats: Lexington,
Mass.
Eun, C. S., & Resnick, B. G. (1988, March). Exchange Rate Uncertainty, Forward
Contracts, and International Porfolio Selection. The Journal of Finance,43(1),
197-215.
Eun, C. S., & Resnick, B. G. (1994, January). International Diversification of Investment
Portfolios: U.S. and Japanese Perspectives. Management Science, 40(1), 140-161.
57
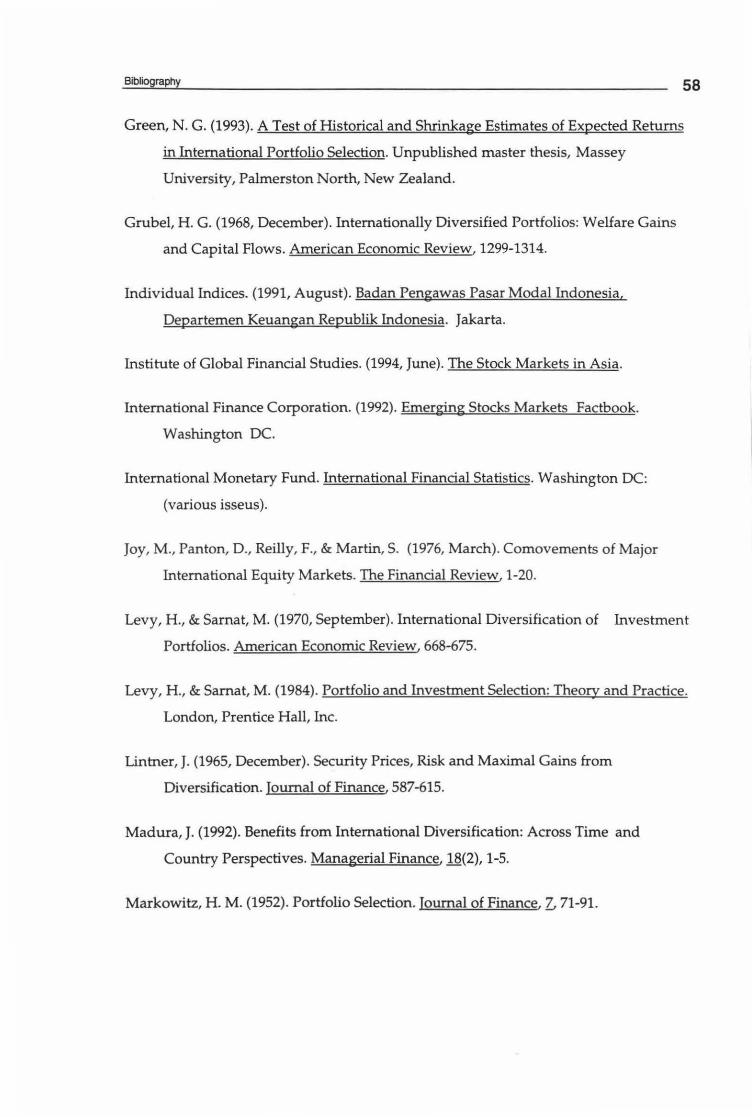
Bibliography 58
Green, N. G. (1993). A Test of Historical and Shrinkage Estimates of Expected Returns
in International Portfolio Selection. Unpublished master thesis, Massey
University, Palmerston North, New Zealand.
Grubel, H. G. (1968, December). Internationally Diversified Portfolios: Welfare Gains
and Capital Flows. American Economic Review, 1299-1314.
Individual Indices. (1991, August). Badan Pengawas Pasar Modal Indonesia,
Departernen Keuangan Republik Indonesia. Jakarta.
Institute of Global Financial Studies. (1994, June). The Stock Markets in Asia.
International Finance Corporation. (1992). Emerging Stocks Markets Factbook.
Washington DC.
International Monetary Fund. International Financial Statistics. Washington DC:
(various isseus).
Joy, M., Panton, D., Reilly, F., & Martin, S. (1976, March). Comovements of Major
International Equity Markets. The Financial Review, 1-20.
Levy, H ., & Sarnat, M. (1970, September). International Diversification of Investment
Portfolios. American Economic Review, 668-675.
Levy, H., & Sarnat, M. (1984). Portfolio and Investment Selection: Theory and Practice.
London, Prentice Hall, Inc.
Lintner, J. (1965, December). Security Prices, Risk and Maximal Gains from
Diversification. Journal of Finance, 587-615.
Madura, J. (1992). Benefits from International Diversification: Across Time and
Country Perspectives. Managerial Finance, 18(2), 1-5.
Markowitz, H. M. (1952). Portfolio Selection. Journal of Finance, Z 71-91.
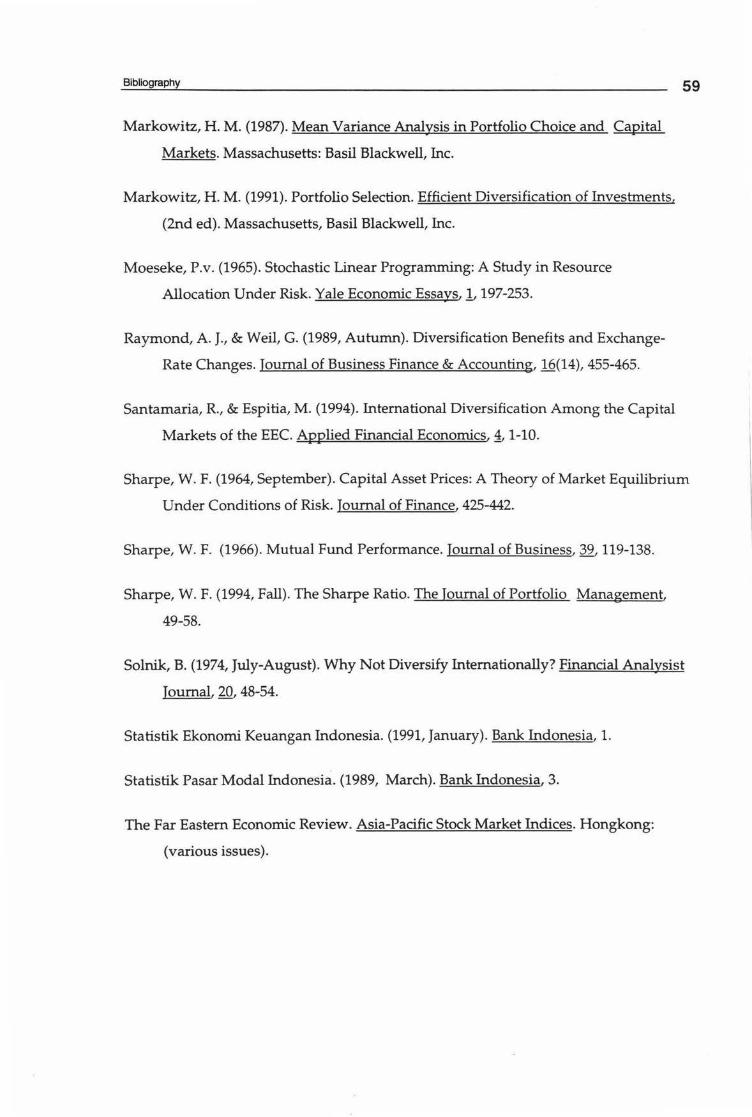
Bibliography
Markowitz, H. M. (1987). Mean Variance Analysis in Portfolio Choice and Capital
Markets. Massachusetts: Basil Blackwell, Inc.
Markowitz, H. M. (1991). Portfolio Selection. Efficient Diversification of Investments,
(2nd ed). Massachusetts, Basil Blackwell, Inc.
Moeseke, P.v. (1965). Stochastic Linear Programming: A Study in Resource
Allocation Under Risk. Yale Economic Essays, .1197-253.
Raymond, A. J., & Weil, G. (1989, Autumn). Diversification Benefits and Exchange
Rate Changes. Journal of Business Finance & Accounting, 16(14), 455-465.
Santamaria, R., & Espitia, M. (1994). International Diversification Among the Capital
Markets of the EEC. Applied Financial Economics,~ 1-10.
59
Sharpe, W. F. (1964, September). Capital Asset Prices: A Theory of Market Equilibrium
Under Conditions of Risk. Journal of Finance, 425-442.
Sharpe, W. F. (1966). Mutual Fund Performance. Journal of Business, Q2, 119-138.
Sharpe, W. F. (1994, Fall). The Sharpe Ratio. The Journal of Portfolio Management,
49-58.
Solnik, B. (1974, July-August). Why Not Diversify Internationally? Financial Analysist
Journal, £Q, 48-54.
Statistik Ekonomi Keuangan Indonesia. (1991, January). Bank Indonesia, 1.
Statistik Pasar Modal Indonesia. (1989, March). Bank Indonesia, 3.
The Far Eastern Economic Review. Asia-Pacific Stock Market Indices. Hongkong:
(various issues).

Bibliography 60
The Jakarta Stock Exchange. The JSX monthly statistics. Jakarta: various issues.
Wallingford, E.A. (1967). A Survey and Comparison of Portfolio Selection Models.
Journal of Financial & Quantitative Analysis, .b 85-106.
Witt, S. F. & Dobbins, R. (1979-80). Markowitz Contribution to Portfolio Theory.
Managerial Finance, 2(1), 3-17.
Young, M. (1985). Portfolio Selection by Homogeneous Programming. Unpublished
master thesis, Massey University, Palmerston North, New Zealand.
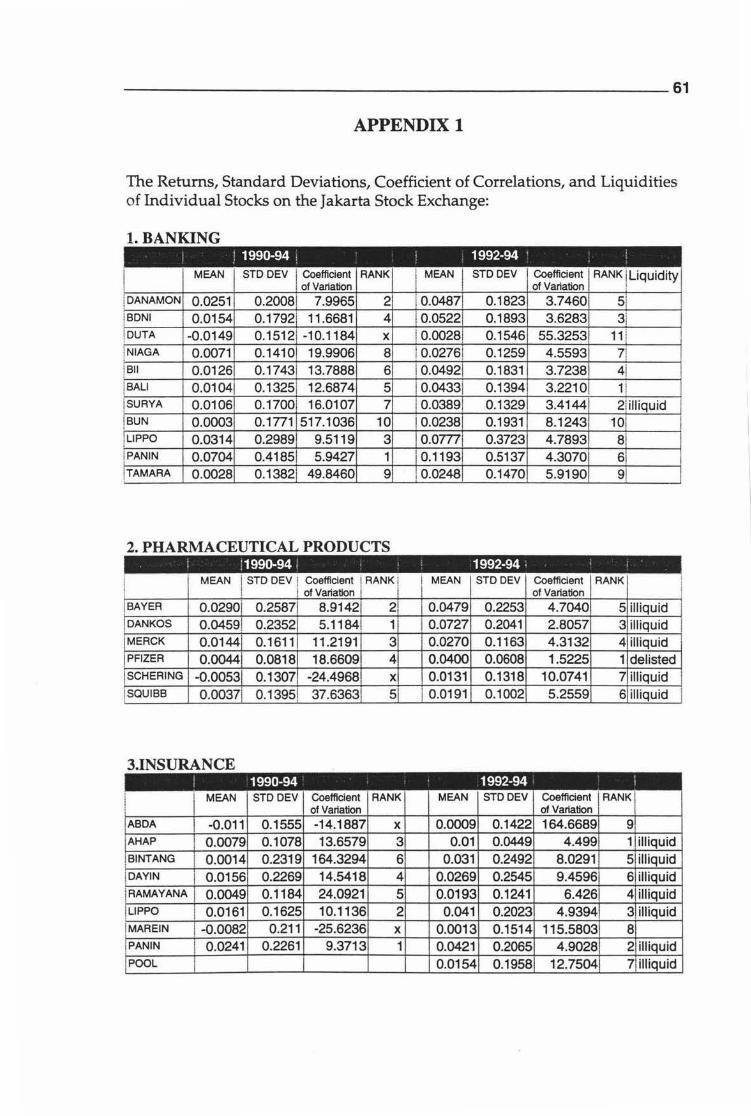
APPENDIX 1
The Returns, Standard Deviations, Coefficient of Correlations, and Liquidities of Individual Stocks on the Jakarta Stock Exchange:
I.BANKING
MEAN I STD DEV I Coefficient RANK I MEAN I STD DEV Coefficient RANK i Liquidity i of Variation of Variation J
DANA MON 0.0251 0.2008! 7.9965 2 ! 0.04871 0.1823 3.7460 5/ BONI 0.0154 0.17921 11.6681 4 ! 0.05221 0.1893 3.6283 31 DUTA -0.0149 0.15121 -10.1184 x ! 0.0028! 0.1546 55.3253 11 i NIAGA 0.0071 0.14101 19.9906 8 : 0.0276! 0.1259 4.5593 7!
I
Bii 0.0126 0.17431 13.7888 6 I o.0492 0.1831 3.7238 41 BALI 0.0104 0.13251 12.6874 5 I o.04331 0.1394 3.2210 11 SURYA 0.0106 0.17001 16.0107 7 i 0.0389! 0.1329 3.4144 2!i lliquid BUN 0.0003 0.1771 517.1036 10 I 0.0238 0.1931 8.1243 101 LIPPO 0.0314 0.29891 9.5119 3 0.07771 0.3723 4.7893 SI PANIN 0.0704 0.41851 5.9427 1 I 0.11931 0.5137 4.3070 61 TAMARA 0.0028 0.13821 49.8460 9 ! 0.0248 0.1470 5.9190 91
2. PHARMACEUTICAL PRODUCTS I '. 1990-94 ' 1992-94 '
MEAN i STD DEV I Coefficient i RANK I i MEAN STD DEV Coefficient RANK ! ! i of Variation ! i of Variation BAYER 0.02901 0.2587 8.9142 2 i 0.0479 0.2253 4.7040 5 illiquid DAN KOS 0.0459! 0.2352 5.11841 1 I 0.0121 0.2041 2.8057 3 illiquid I
I
MERCK 0.0144 0.1611 11.2191 3 0.0270 0.1163 4.3132 4 illiquid PFIZER 0.0044 0.0818 18.6609 4 0.0400 0.0608 1.5225 1 delisted I SCHER ING -0.0053 0.1307 -24.4968 x 0.0131 0.1318 10.0741 ?illiquid I SQUIBB 0.00371 0.13951 37.63631 5 I 0.0191 0.1002 5.2559 6 illiquid i
3.INSURANCE
MEAN STD DEV Coefficient RANK MEAN STD DEV Coefficient I RANK of Variation of Variation I
ABDA -0.011 0.1555 -14.1887 x 0.0009 0.1422 164.6689 9 AHAP ! 0.0079 0.1078 13.6579 3 0.01 0.0449 4.499 1l illiquid Bl NT ANG 0.0014 0.2319 164.3294 6 0.031 0.2492 8.0291 5 illiquid DAVIN 0.0156 0.2269 14.5418 4 0.0269 0.2545 9.45961 6 illiquid RAMAYANA ! 0.0049 0.1184 24.0921 5 0.0193 0.1241 6.426 4l illiquid LIPPO 0.0161 0.1625 10.1136 2 0.041 0.2023 4.9394 3 illiquid MAREIN I -o.oos2 0.211 -25.6236 x 0.0013 0.1514 115.5803 8 PANIN 0.0241 0.2261 9.3713 1 0.0421 0.2065 4.9028, 21illiquid POOL 0.0154 0.1958 12.7504 7 illiquid
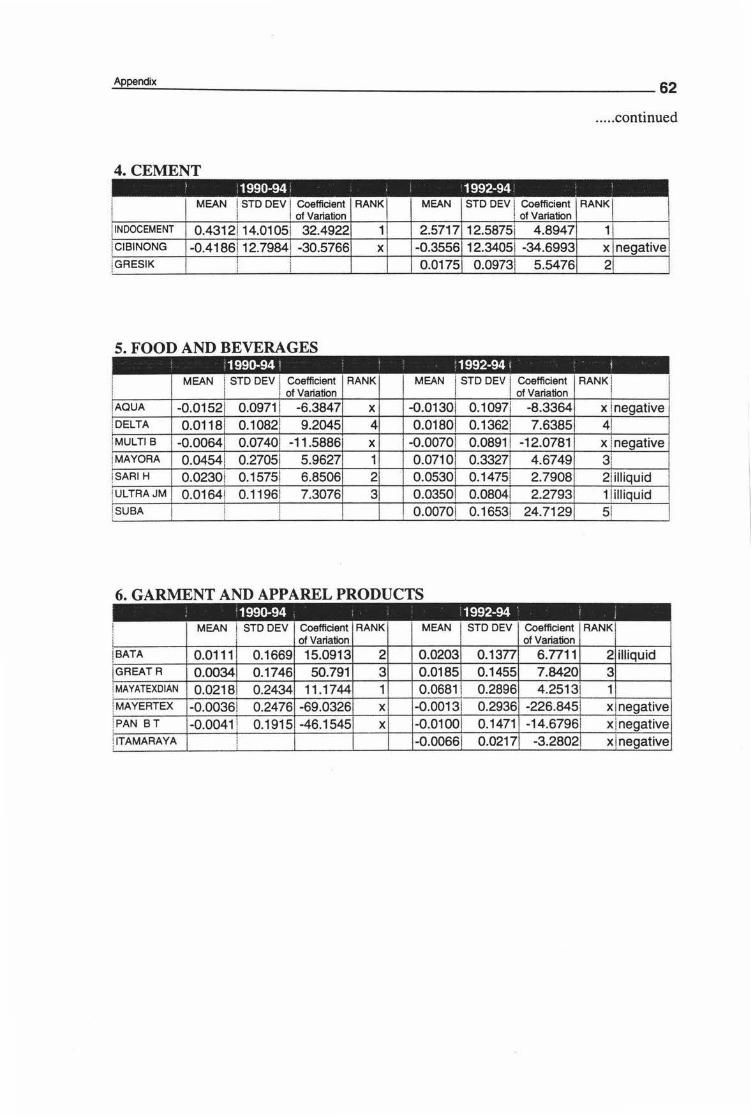
..... continued
4. CEMENT
MEAN STD DEV i Coefficient ! of Variation
RANK MEAN STD DEV Coefficient RANK of Variation
INDOCEMENT 0.4312 14.0105 32.4922 1 2.5717 12.5875\ 4.8947 1 CIBINONG -0.4186 12.7984 -30.5766 x -0.3556 12.34051 -34.6993 x negative GRESIK 0.0175 0.0973i 5.5476 2
5. FOOD AND BEVERAGES
MEAN i STD DEV i Coefficient RANK MEAN i STD DEV i Coefficient RANK ! · ' of Variation ! ! of Variation !
jAQUA -0.01521 0.0971 I -6.3847 x -0.01301 0.1097' -8.3364 x !negative !DELTA 0.01181 0.1082! 9.2045 4 0.01801 0.13621 7.6385 4i !MULTI B -0.0064i 0.0740! -11.5886 x -0.00701 0.0891 ! -12.0781 x i negative !MAYORA 0.04541 0.27051 5.9627 1 0.07101 0.33271 4.6749 3! iSARI H 0.0230! 0.15751 6.8506 2 0.05301 0.1475j 2.7908 2/illiquid jULTRAJM 0.0164! 0.1196! 7.3076 3 0.03501 0.08041 2.2793 1!illiquid iSUBA 0.00701 0.1653! 24.7129 Si
MEAN i STD DEV Coefficient RANK MEAN STD DEV Coefficient RANK ! of Variation of Variation
iBATA 0.0111 0.1669 15.0913 2 0.0203 0.1377 6.7711 2 illiquid !GREAT R 0.0034 0.1746 50.791 3 0.0185 0.1455 7.8420 3 !
[ M~YATEXDIAN 0.0218 0.2434 11.1744 1 0.0681 ! 0.2896 4.2513! 1 iMAYERTEX -0.00361 0.2476 -69.0326 x -0.0013! 0.2936 -226.845 x negative iPAN BT -0.0041 ! 0.1915 -46.1545 x -0.01001 0.1471 -14.67961 x negative !ITAMARAYA -0.00661 0.0217 -3.28021 x negative
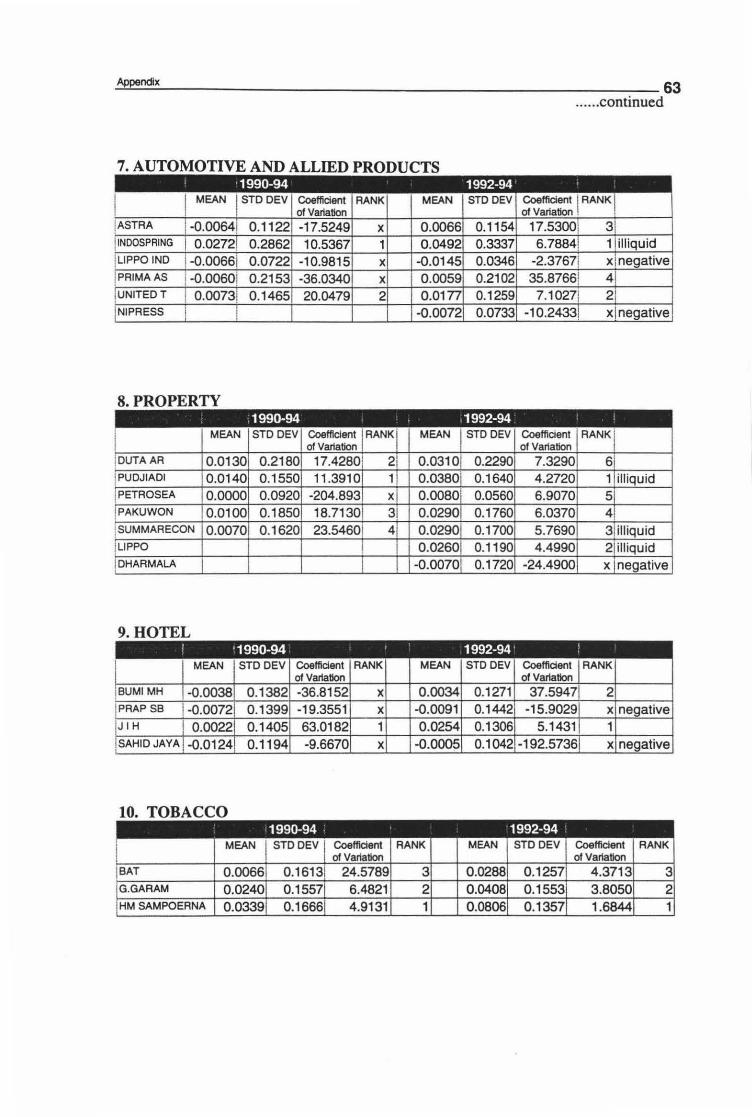
7. AUTOMOTIVE AND ALLIED PRODUCTS
I MEAN I STD DEV Coefficient RANK MEAN STD DEV Coefficient I RANK I 1 of Variation of Variation !
!ASTRA 1-0.0064! 0.1122 -17.5249 x 0.0066 0.1154 17.5300j 3 INDOSPRING 0.0272 0.2862 10.5367 1 0.0492 0.3337 6.7884, 1 illiquid LIPPO IND 1-0.00661 0.0722 -10.9815 x -0.0145 0.0346 -2.3767! x negative
!PRIMA AS ; -0.0060j 0.2153 -36.0340 x 0.0059 0.2102 35.8766i 4! UNITEDT 0.00731 0.1465 20.0479 2 o.01n 0.1259 7.1027i 2 NI PRESS -0.0072 0.0733 -10.24331 x negative
8.PROPERTY
Coefficient RANK I of Variation
!DUTA AR 0.0130 0.2180 2 0.0310 0.2290 7.3290 61 PUDJIADI 0.0140 0.1550 11 .3910 0.0380 0.1640 4.2720 1 illiquid PETROSEA 0.0000 0.0920 -204.893 x 0.0080 0.0560 6.9070 5 PAKUWON 0.0100 0.1850 18.7130 31 0.0290 0.1760 6.0370 4 SUMMAR ECON 0.0070 0.1620 23.5460 4 0.0290 0.1700 5.7690 3 illiquid LIPPO 0.0260 0.1190 4.4990 2lilliquid
IDHARMALA j
-0.0070 0.1720 -24.4900 x negative
9.HOTEL
-0.0038 0.1382 x 0.0034 0.1271 2 l -0.0072 0.1 399 -19.3551 x -0.0091 0.1 442 -15.9029 x negative
J I H 0.0022 0.1405 63.0182 1 0.0254 0.1 306 5.1431 ISAHID JAVA -0.0124 0.1194 -9.6670 x -0.0005 0.1042 -192.5736 x negative
10. TOBACCO
I Coefficient RANK Coefficient RANK of Variation of Variation
!BAT 0.0066 0.1613 24.5789 3 0.0288 0.1257 4.3713 3 G.GARAM 0.0240 0.1557 6.4821 2 0.0408 0.1553 3.8050 2 HM SAMPOERNA 0.0339 0.1666 4.9131 1 0.0806 0.1357 1.6844 1
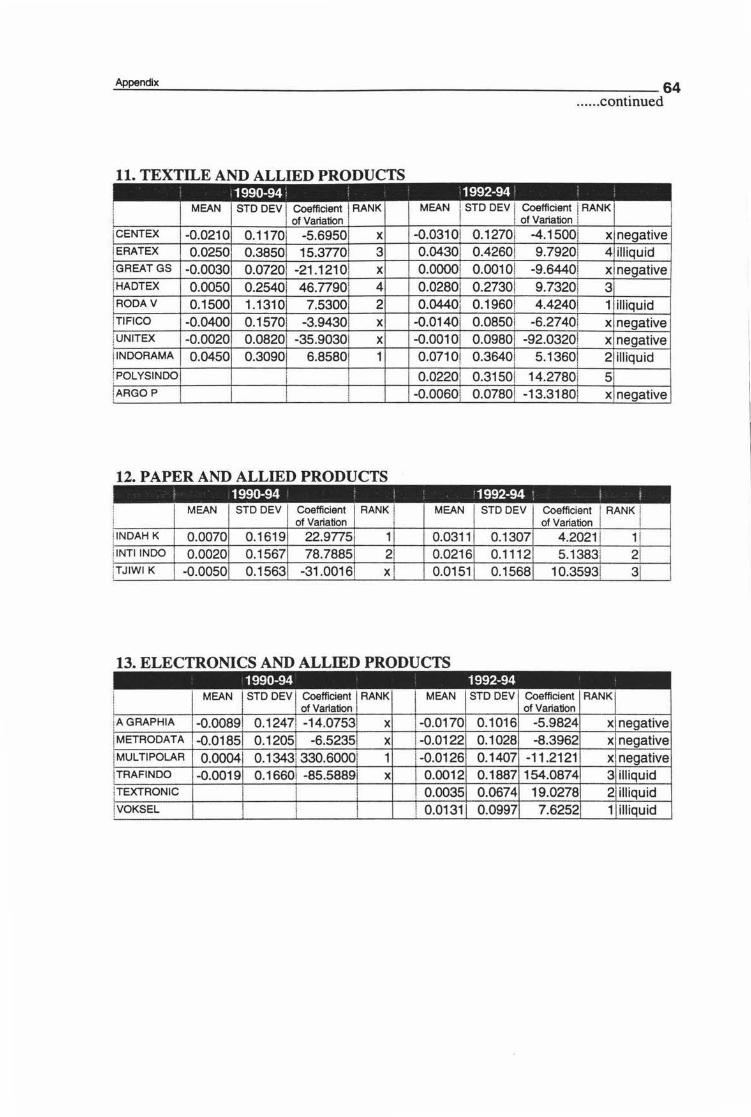
11. TEXTILE AND ALLIED PRODUCTS
MEAN
CENTEX -0.0210 ERATEX 0.0250 GREAT GS -0.0030 HADTEX 0.0050 RODAV 0.1500 TIFICO -0.0400 UNITEX -0.0020 INDORAMA 0.0450 POLYSINOO
ARGOP
INDAH K 0.0070 INTI INOO 0.0020 TJIWI K -0.0050
STD DEV I Coefficient I RANK i of Variation ,
0.11701 -5.69501 x 0.3850 15.3770! 3 0.07201 -21.12101 x 0.25401 46.7790! 4 1.1310 7.53001 2 0.1570 -3.9430! x 0.0820! -35.90301 x 0.30901 6.85801 1
Coefficient . RANK i of Variation !
0.1619 22.9775 1
0.1563 -31.0016! x
I STD DEV I Coefficient l RANK , ! of Variation i
-0.03101 0.0430! 0.0000! 0.02801 0.04401
-0.01401 -0.00101 0.07101
0.02201 -0.0060!
0.0311 0.0216 0.0151
0.1270! -4.15001 xnegative 0.4260 j 9.7920! 4 illiquid 0.00101 -9.6440! x i negative 0.2730! 9.7320! 3 0.1960! 4.42401 1 illiquid 0.0850! -6.2740! x negative 0.09801 -92.0320! x negative 0.3640 5.1360! 2 illiquid
0.31501 14.27801 5 0.0780! -13.31801 x negative
0.1307 0.1112 0.1568
Coefficient j RANK ! of Variation : i
4.2021 1 11 5.1383! 2j
10.35931 3i
13. ELECTRONICS AND ALLIED PRODUCTS
MEAN I STD DEV · Coefficient I RANK Coefficient RANK of Variation I of Variation
AGRAPHIA -0.0089! 0.12471 -14.0753! x i -0.0170 0.1016 -5.9824 x negative METRODATA -0.0185 0.1205 -6.5235, x ! -0.0122 0.1028 -8.3962 x'negative MULTIPOLAR 0.00041 0.13431330.6000! 1 ! -0.0126 0.1407 -11.2121 xi negative TRAFINOO -0.0019 0.16601 -85.58891 x I 0.0012 0.1887 154.0874 3 illiquid TEXTRON IC I ! 0.0035 0.0674 19.0278 2 illiquid I
VOKSEL ! 0.0131 0.0997 7.6252 1l illiquid
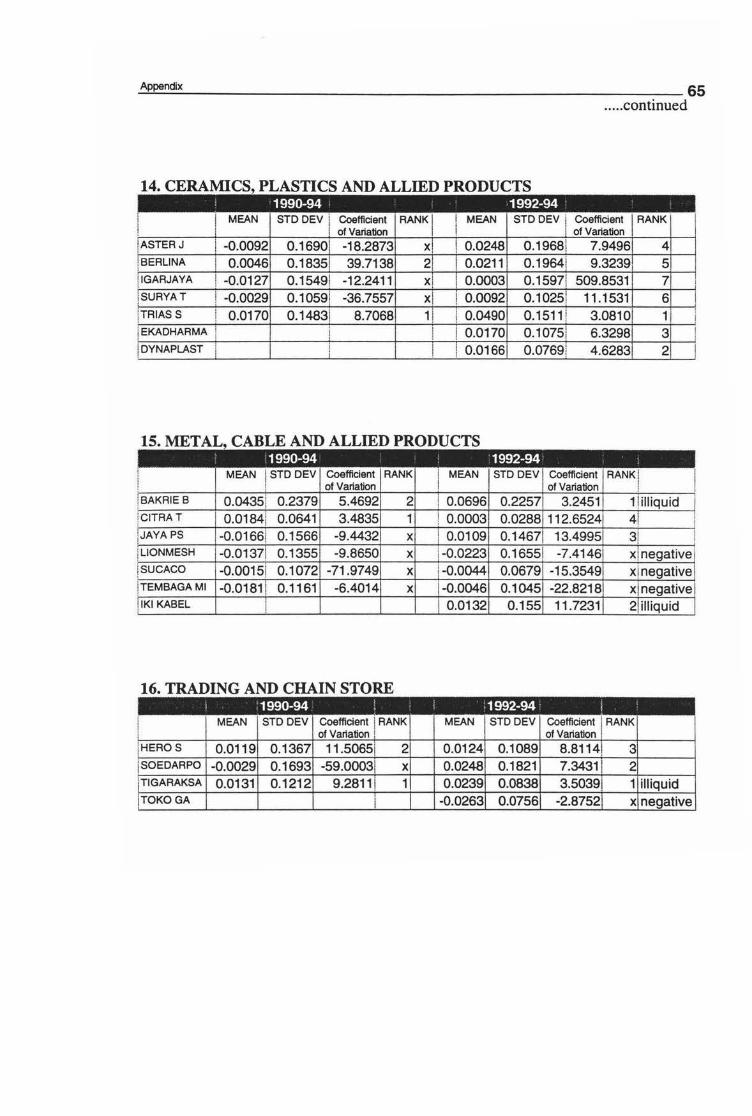
_Ap_pe_n_d_ix~~~~~~~~~~~~~~~~~~~~~~~~~~~~65 ..... continued
14. CERAMICS, PLASTICS AND ALLIED PRODUCTS
I MEAN STD DEV I Coefficient RANK ! i MEAN STD DEV i Coefficient RANK I
I of Variation I ! of Variation ASTERJ ! -0.0092 0.1690! -18.2873 x l 0.0248 0.1968\ 7.9496 4 BERLINA ! 0.0046 0.18351 39.7138 21 I 0.0211 0.1964j 9.3239 5 I
IGARJAYA ! -0.0127 0.15491 -12.2411 xi ! 0.0003 0.1597! 509.8531 7 SURYAT ! -0.0029 0.1059! -36.7557 xi ! 0.0092 0.1025: 11.1531 6 TRIAS S 0.0170 0.1483\ 8.7068 1! i 0.0490 0.1511 ! 3.0810 1 EKADHARMA j ! ! 0.0170 0.10751 6.3298 3 DYNAPLAST j ! 0.0166 0.0769! 4.6283 2
15. METAL, CABLE AND ALLIED PRODUCTS
MEAN I STD DEV Coefficient RANK i MEAN STD DEV Coefficient RANK ! of Variation I
of Variation ;
!
BAKRIE B 0.0435l 0.2379 5.4692 2 i 0.0696 0.2257 3.2451 1ii lliquid CITRAT 0.0184! 0.0641 3.4835 1 : 0.0003 0.0288 112.6524 4i JAVA PS -0.0166! 0.1566 -9.4432 x i 0.0109 0.1467 13.4995 3! LION MESH -0.01371 0.1355 -9.8650 x i -0.0223 0.1655 -7.4146 xjnegative SUCACO -0.0015! 0.1072 -71.9749 x i -0.0044 0.0679 -15.3549 x!negative TEMBAGAMI -0.0181 0.1161 -6.4014 x i -0.0046 0.1045 -22.8218 xi negative IKI KABEL I 0.0132 0.155 11.7231 2 illiquid
16. TRADING AND CHAIN STORE
MEAN STD DEV Coefficient ! RANK MEAN STD DEV Coefficient I RANK of Variation i of Variation i
HEROS 0.0119 0.1367 11.5065\ 2 0.0124 0.1089 8.8114! 3 SOE DAR PO -0.0029 0.1693 -59.00031 x 0.0248 0.1821 7.3431 ! 2 TIGARAKSA 0.0131 0.1212 9.2811 I 1 0.0239 0.0838 3.50391 1 illiquid TOKOGA -0.0263 0.0756 -2.8752 x negative

_Ap~pe...;,_;ndi_·x~~~~~~~~~~~~~~~~~~~~~~~~~~~~66 ..... continued
Coefficient i RANK I Coefficient RANK of Variation ! of Variation
CHAROEN I 0.0160 0 .1580 9.7130' 31 0.0270 0.0590 2.1570 1 CP PRIMA I 0.0220 0.1570 7.0150 1 0.0340 0.1670 4.8470 2 JAPFA 0.0510 0.4250 8.2640 2 0.0930 0.5220 5.5990 3 TJILATJAP ' -0.0040 0.1790 -45.3510! xj 0.0160 0.2030 12.6800 4
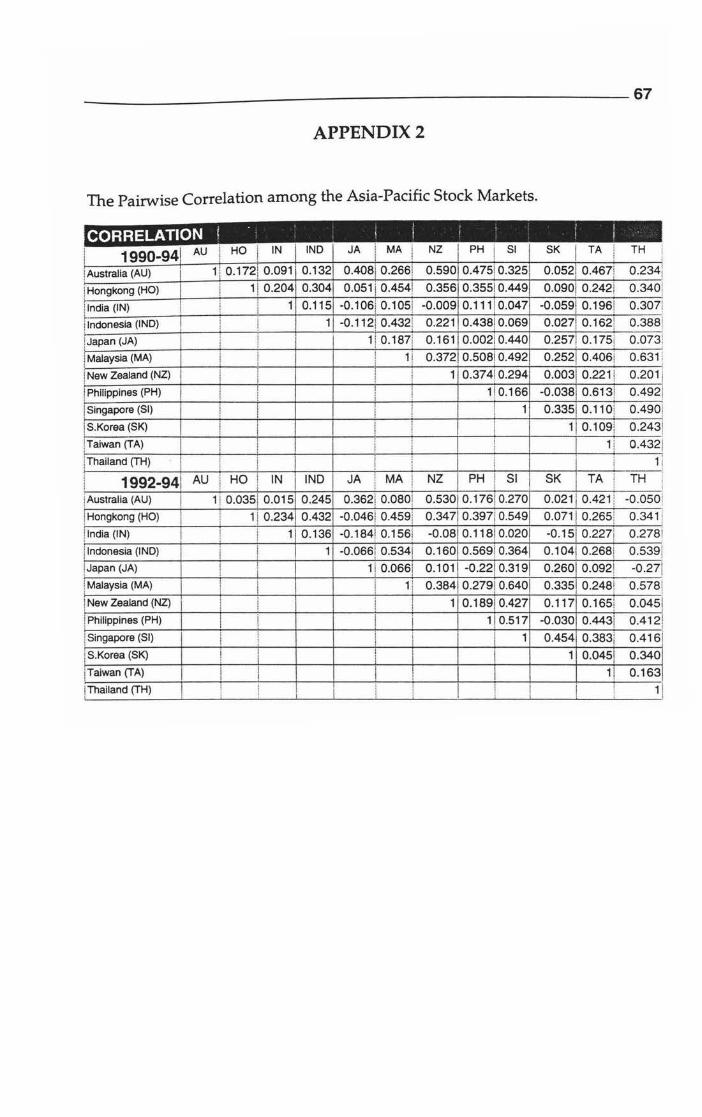
APPENDIX2
The Pairwise Correlation among the Asia-Pacific Stock Markets.
( ' ;
CORRELATION ' ! ' I
1990-94 AU HO i IN IND JA l MA !
NZ PH i SI I SK I TA TH i I 0.234l ! Australia (AU) 1 0.172J 0.091 0.132 0.408\ 0.266! 0.590 0.475! 0.3251 0.052 0.467!
! ! Hongkong (HO) 11 0.204 0.304 0.051 j 0.454! 0.356 0.355! 0.449 0.090 0.242! 0.340! >
I 1 0.115 -0.106j 0.105! -0.009 0.11110.047 -0.059 0.196! 0 .307! j lndia (IN) ;
rindonesia (IND) I 1 -0.112! 0.432! 0.221 0.438! 0.069 0.027 0.162! 0 .388!
!Japan (JA) 1 ! 0.187! 0.161 0.002! 0.440 0.257, 0.175j 0.073j
j Malaysia (MA) 1! 0.372 0.508! 0.492 0.252 0.406! 0 .631 !
J New Zealand (NZ) i 1 0.374) 0.294 0.003 0.221 ! 0 .201 1
! Philippines (PH) i 1! 0.166 -0.038 0 .613) 0 .492i
! Singapore (SI) l l ! 1 0.335 0.110! 0.4901 !
i S.Korea (SK) ; ! ! ! 1 0.109! 0 .243! ! !
jTaiwan (TA) l l i ! 1! 0.4321
! Thailand (TH) ; ! i ; I 1!
1992-94 AU HO ! IN IND JA l MA l NZ PH ; SI SK TA TH ! i ; I
! Australia (AU) I 1 0.035\ 0.015 0.245 0.362! 0.080 j 0.530 0.176! 0.270 0.021 1 0.421 ! -0 .050!
! Hongkong (HO) 11 0.2341 0.432 -0.046! 0.459! 0.347 0.397! 0.549 0.071 j 0.265! 0.341 i
!India (IN) 1 0 .136 -0.184! 0.156) -0.08 0.118! 0.0201 -0.151 0.2211 0.278!
! Indonesia (IND) ! 1 -0.066i 0.534! 0.160 0.569! 0.364 0.104 0.268! 0.539 j
!Japan (JA) 1! 0.066 j 0.101 ! -0.22! 0.319 0.260 0.092! -0.271
l Malaysia (MA) 1! 0.3841 0 .279! 0.640 0.335 0.248! 0.578 \
j New Zealand (NZ) ! ! 1 0.1891 0.427 0.117 0.165! 0.0451 ;
! Philippines (PH) l ! i 110.517 -0.030 0.443! 0.412! I
! Singapore (SI) ! j ! ; i 1 0.454 0.383i 0.4161
! S.Korea (SK) i ! 1 I 1 0.045! 0.3401 i
jTaiwan (TA) I I ·1 I 1! 0.1631 I I I
J Thailand (TH) ! ; ! ! 11


![Asia Pacific Youth to Business (Y2B) Forum Proposal [for Asia Pacific]](https://img.pdfslide.us/doc/110x75/568c4db71a28ab4916a50cbd/asia-pacific-youth-to-business-y2b-forum-proposal-for-asia-pacific.jpg)