Embed Size (px)
Citation preview
“AN ANALYSIS ON THE FINANCIAL STATEMENTS OF KERALA MINERALS AND METALS LTD, CHAVARA”
Submitted to
Mahatma Gandhi University, Kottayam
In Partial Fulfillment of the
Requirement for the award of the Degree of
MASTER OF BUSINESS ADMINISTRATION
Submitted ByAKHILESH.P.S
Reg.No:10492
Under the guidance of
Mr.VARGHESE.K.X(Department of Business Administration)
JAI BHARATH SCHOOL OF MANAGEMENT STUDIES
ARACKAPADY, PERUMBAVOOR, ERNAKULAM

2009-2011
ACKNOWLEDGEMENT
I express my whole gratitude to Jai Bharath School of Management Studies for lending me the opportunity to do this study.
I express my whole-hearted gratitude to Dr. K. R. Baburaj, Director, Jai Bharath School of Management Studies, for lending me the opportunity to do this study.
I would like to express my deep sense of gratitude to my internal guide Mr. VARGHESE.K.X,HOD for her innovative ideas and encouragement for this work.
I express my sincere thanks to KERALA MENERALS AND METALS LTD,CHAVARA for providing me this golden opportunity to do this study in the organization.
I would also take this opportunity to thank Ms.L.INDIRA (PERSONNEL OFFICER) KERALA MENERALS AND METALS LTD,CHAVARA who has given me a chance not only to do the project in the organization, but also helped me in providing sufficient data and necessary guidelines.
Last but not the least, I express my whole-hearted thanks to all the employees who have supported me with their time and effort.
AKHILESH.P.S

DECLARATION
I, hereby declare that the report entitled “AN ANALYSIS ON FINANACIAL STATEMENTS OF KERALA MENERALS AND METALS LTD,CHAVARA ” with special reference to KERALA MENERALS AND METALS LTD,CHAVARA has been done by me under the guidance of Mr.VARGHESE.K.X, HOD MBA, Jai Bharath School or Management Studies.Perumbavur,Ernakulam. I also declare that this project has been submitted by me, as fully or partially for the award of any Degree or Diploma earlier.
DATE: - AKHILESH.P.S
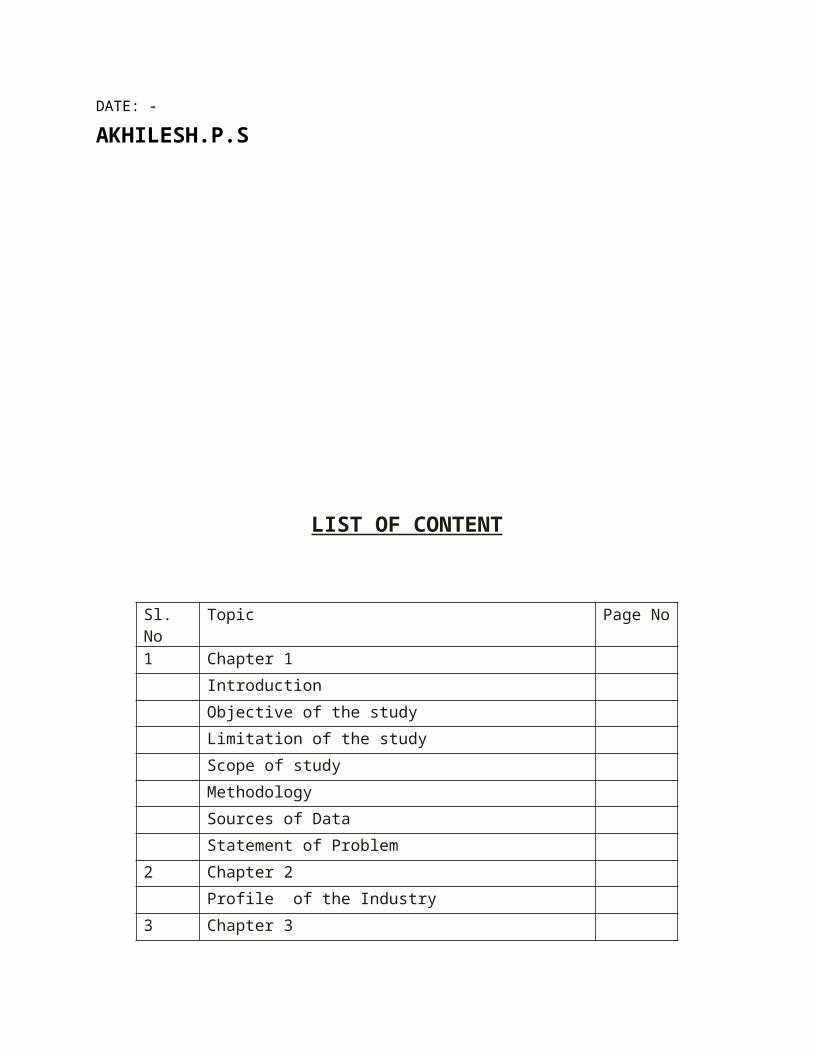
LIST OF CONTENT
Sl. No Topic Page No
1 Chapter 1
Introduction
Objective of the study
Limitation of the study
Scope of study
Methodology
Sources of Data
Statement of Problem
2 Chapter 2
Profile of the Industry
3 Chapter 3
Profile of the Company
Organizational Chart
SWOT Analysis
4 Chapter 4
Theoretical Background
Analysis & Interpretation
5 Findings
6 Suggestions & Recommendation
7 Conclusion
Appendices
Bibliography

INTRODUCTION
1.1 About the study
Working capital management is the life blood of any organization. Today,
working capital had got vital importance. Most of the business concern has to give special
attention on their investment than fixed capital. Working capital management usually involves
the administration on current assets namely cash and marketable securities, receivables and
inventories and the administration of current liability. The goal of working capital is to manage
current asset and current liability in such a way that a satisfactory level of working capital is
maintained.
Working capital management is short term financial management which is
concerned with decisions relating current assets and current liability. Funds are needed for short
term purposes i.e. for the purchase of raw materials, payment of wages and other day to day
expenses etc.
For a fast growth and expansion, any firms needs larger amount of
working capital. Therefore estimates of working capital on long term basis are also required to
determine expansion. Whether or not adequate working capital will be generated to meet the
firm’s
The KMML is one of among the major public sector undertaking in the
state. The working capital of the company mainly consists of stock, debtors and cash. This study
is mainly focusing on analyzing the management of cash, debtors and stock. Working capital
management is an important yard stick to measure a company operational and financial
efficiency. This aspect must from the part of the company’s strategic and operation
thinking .Efforts should consistently be made to improve the working capital position. This will
yield greater efficiencies and improves the working capital position. This will yield greater
efficiencies and improve the overall performance of the firm.
1.2 About the Industry
1.2.1World Scenario

The credit for recognizing the existence of titanium goes to Rev.Willam
Gregor who found traces of black magnetic and unfamiliar to him at Menaccan parish (UK) in
1790 and he named it Menaccanite. Subsequently Kiwin recovered a new white metallic oxide
and called it Menaccine. But it was in 1795 M. Klaporth who discovered titanium. He examined
Rutile and identified it as an oxide of a metal and named it as “Titanium” after “titan” of Greek
Mythology . It was named Titan because according to Greek mythology Titan is a God who is
very hard to be pleased and since the reactivity of the pigment was feeble with almost anything.
The first commercial product of titanium was an alloy additive to steel, where Ferro alloys were
developed in commercial scale. The use of titanium minerals in welding electrode coating gained
acceptance in the mid thirties while titanium metal has been of commercial importance since
1948.
The various Titanium minerals include Rutile, Anatase, Ilmenite, and
Leucoxene etc. Mining of Ilmenite is carried out in several countries like Australia, Norway,
SriLanka, Malaysia, South Africa and India. The total reserved of worlds Ilmenite is estimated
to be approximately 1722 million tons; range of heavy minerals in placer deposits varies from
twenty to eighty percentages.
Titanium dioxide is far more stable than any other pigment. Its perfect
non toxicity & chemical inertness make it an ideal choice as a white pigment. The light
scattering property of finely divided titanium dioxide is unmatched by any other non material.
The chemical is available in two crystalline forms, viz Anatase and Rutile, which are of much
commercial significance. The relatively softer anatase is the right material delustering artificial
fibres. Titanium dioxide is the whitest of white pigments and has replaced other less effective
pigments such as zinc oxide, lithopone etc. This is because of the unique combination of its
superior properties of high refractive index, low specific gravity, high hiding power and opacity
and no toxicity. It also has high tinting strength and dispersion properties as well as chemical
stability. The Titanium Dioxide
market is unique in that while it is a product approaching 100 years old, there are still no
functional alternatives that provide the same value in use of customers. The industry has gone
through a metamorphosis in the past decade. Looking over the next 20 years, at least some new

Titanium dioxide pigment will be made, though most of the industries additional capacity will
come from expansion Pigment consumption rose sharply in Western Europe and Asia/Pacific
(Excluding Japan) during the year 2000. East Asia is presently the most attractive region in the
world for Titanium Dioxide. The event that revolutionized the titanium dioxide industry was the
development of chloride technology by m/s DuPont around 1959. The chloride technology took
the US industry in short span. Most of the sulphate route plants was closed or replaced by
chloride route plants. Usage of TiO2 extremely widespread over 170 countries each spend over
$US 10,000 per year on TiO2 pigment. International trade accounts for 55% of global
consumption. The total reserve of Ilmenite in the world is estimated to be approximately 1722
million tones. The range of heavy mineral deposits is found in the eastern and western coastal of
length 6000km.
1.2.2 National Scenario
In 1909 a German Dr. Schomberg, discovered the presence of monazite in the
black Beach sand of Manavalkurichi in the East Travancore state. The presence of mineral sand
in the coir being exported later led to the discovery of certain other elements. The Geological
survey conducted later on in India, established the occurrence of monazite and metals like
Ilmenite, Rutile, Leucoxene, Silimenite & Zircon.
India has a wealth of titanium minerals with very low ratio of resource to utilization. A sound
titanium dioxide industry is essential to ensure optimum utilization of these resources as well as
to develop a vibrant industry in the field of this strategic mineral. Although some technology
base is available in the country for both sulphate and chloride processes of titanium dioxide
pigment manufacture, additional imports of know-how and technology are considered essential
to update the existing sulphate and chloride technologies in the country.
1.2.3 State Scenario

At present in Kerala TTP and KMML are the only two manufacturers who
produce Titanium Dioxide pigment. Indian Rare Earth Ltd (IRE) a Government of India
undertaking has a mineral separation unit in Chavara which separates minerals from the beach
sands. IRE also operates two mineral separation units, which are located in Manavalakurichi in
Tamilnadu and Challarpur in Orrissa. Firstly Travancore products were started by His Highness
Chitira Thirunal in 1946 and Titanium Dioxide using the Sulphate process technology. Later the
KMML which was situated in Chavara came into existence and started producing Titanium
Dioxide with the help of HCL acid process technology (Chloride technology).
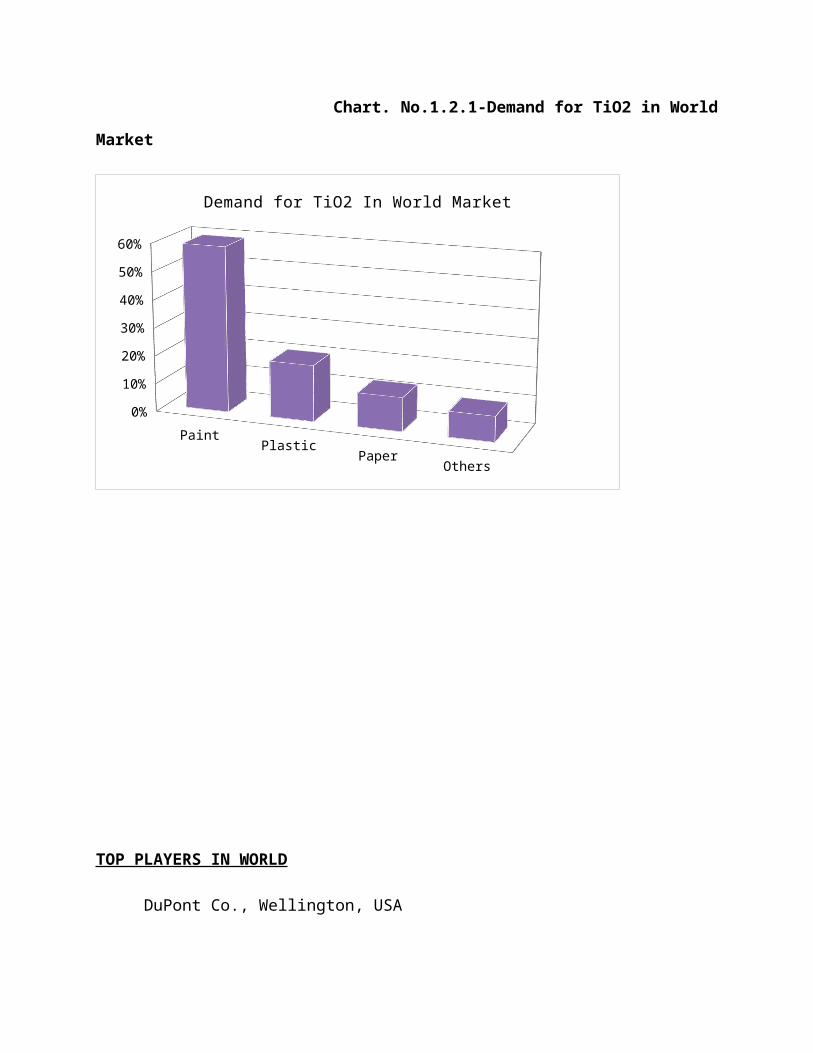
Chart. No.1.2.1-Demand for TiO2 in World Market
PaintPlastic
PaperOthers
0%
10%
20%
30%
40%
50%
60%
Demand for TiO2 In World Market
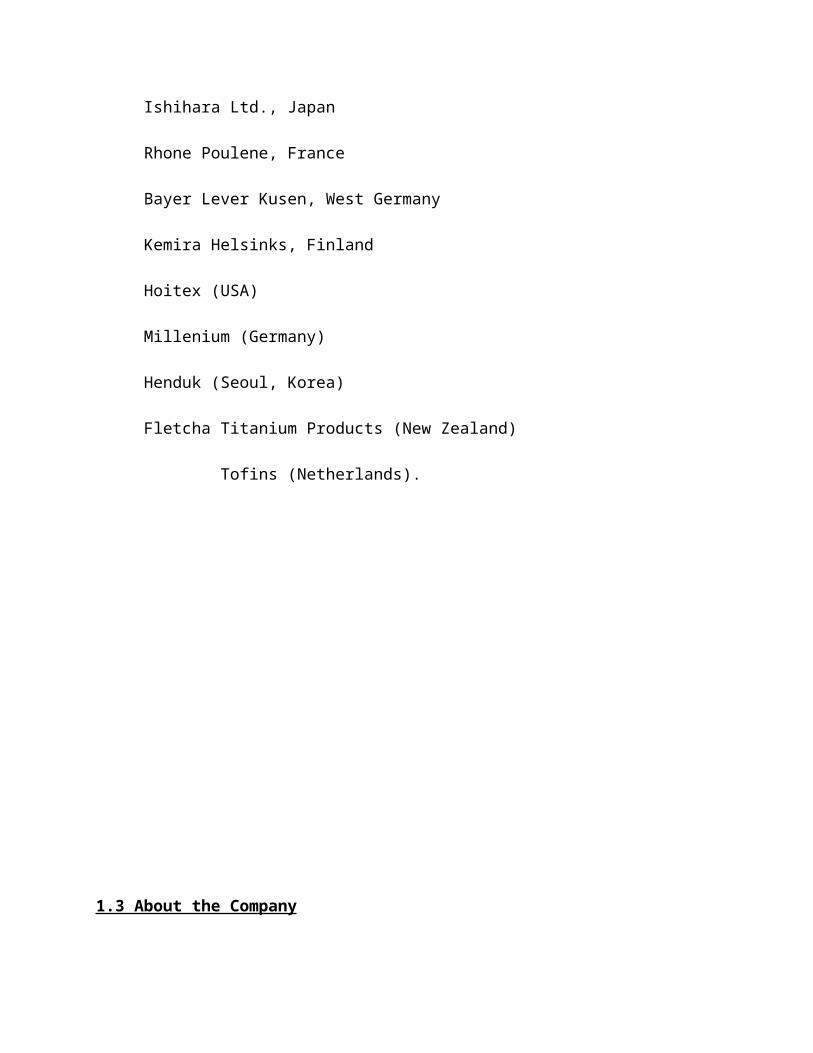
TOP PLAYERS IN WORLD
DuPont Co., Wellington, USA
Ishihara Ltd., Japan
Rhone Poulene, France
Bayer Lever Kusen, West Germany
Kemira Helsinks, Finland
Hoitex (USA)
Millenium (Germany)
Henduk (Seoul, Korea)
Fletcha Titanium Products (New Zealand)
Tofins (Netherlands).
1.3 About the Company

Kerala is blessed with rich and extensive mineral deposits. This deposits
stretch along the sea cost between Neendakara and Kayamkulam, a track generally known as
Chavara coast. This deposits stretch up to a distance of 18 km along the coastal strip and having
a depth of 8m. The dark sands of Travancore coast are rich in mineral deposits as monazite
illuminate Rutile Zircon etc.
Kerala minerals and metals Ltd is a pioneer industry in the titanium
dioxide pigment in India. Its product has worldwide recognition and it is one of the leading
revenue earning public sector enterprise under government of Kerala .It has nearly 2000 workers.
It is the first state level public sector enterprise in India to achieve “Export House Status” from
J.D.J of foreign trade in the year 2003.
EMERGENCE
It so happened that a German Chemist named Dr.Schlmbey found out
that, the coir exported from Kerala to Germany were smeared with pasty black soil .On
analyzing this clay sand, he discovered traces of Monazite. This land mark discovery led to a
series of studies and surveys which relieved that this sand contains several other earths like
illmenite. Zircon, Rutile, etc. Next year a man named Mr. Width setup a small unit at
Neendakara for recovering monazites. In1932 a full fledged mineral Industry in Chavara area
was established under the company name F.X Pereira & Sons Pvt Ltd. Soon three other
companies named M/s Travancore Minerals Company Ltd, associated Minerals Limited and
Hopkins & William Limited were established. Later all the three companies were amalgamated
and finally Indian Rare Earth Ltd were formed under the Atomic Department under the name
F.X.P Minerals. In the year 1956 the government of Kerala took over the F.X.Pereria and Sons
Pvt Ltd Company and placed under control of Industries Department. This was due Courts ruling
since the company was undergoing severe financial crisis .In 1972 the ownership of the company
was transferred to the state government as a fully owned company by the name Kerala Minerals
& Metals Ltd.
The Mineral separation unit is situated at Koviltholtam 18Kms north of
Quilon and is close to National Highway 47.They have got the permission to mine in the last four
bells out of the eight blocks in the Needakara-Kayamkulam belt where the huge mineral deposits
of minerals exist .At present they extract about 60,000 tone of black sand from the beach. They
use dry distillation process to separate minerals like illmenhe, Zerleon, Ruffle etc from the black
soil.
The construction work for the Ti0 2 pigment plant was started in the year
1974 for an installed capacity for about 22000 tones/year with the technical collaboration of M/s
Ker Mc GEP Chemicals of USA. M/s Woodall and was commissioned In the January 1984.But
initially the production capacity were about a more 4.5% and the under utilization of the
production capacity continued for more than a decade. Thus the company was in heavy loss and
in the year 1993 BIFR declared KMML as a sick company in its first sitting. IDBI was appointed
as the operating agency to formulate rehabilitation /revival package for the company .On
implementing this rehabilitation plans the company slowly improved its financial position and
began to show profit in its balance sheet. With the installation of inconel tubes instead of silica
tubes in the oxidation plant resulted in increasing production as well as quality improvement.
With this crucial introduction the company has been able to achieve 100% and above capacity
utilization.
PRESENT STATUS
It is India's first and only manufacturer of Rutile grade Titanium
Dioxide Pigments by Chloride route. The KMML products are marketed under the brand name
'KEMOX'. KEMOX RC 822 is a pigment grade from KMML Is a multiple application pigment,
which has great demand in the world market. KMML also produce six more grades at Titanium
Dioxide Pigments namely RC 800. RC 800 PG, RC 802. RC 804. RC 808 and RC 813. Their
product range also includes illmenite. TiCI4, Rutile, Leucoxene. Silimanite, Monazites, zircon
and Iron oxide bricks. KMML enjoys the monopolist position in the titanium dioxide pigment
manufacturer in India. Though It controls half the Indian Ti02 pigment market, It faces stiff
competition with foreign companies like:
a. DuPont
b. Ishah
IMPORTANT EVENTS
1932 KMML was established by private enterprises under the name
F.X. Pereira & Sons Pvt Ltd.
1956 Pereira & Sons Ltd was took by the Government of Kerala
Placed the under the control of its Industries department as
F.X.P Minerals.
1972 F.X. Pereira & Sons Pvt Ltd final converted as a limited company
Under the state government.
1974 The construction work of the T1O2 pigment unit In Sankara-
Mangalam was started.
1984 The TiO2 pigment unit In Shankaramangalam was
Commissioned.
1993 The Company declared as a sick unit due by BIFR and IDBI was
Appointed as operating agency for formulating rehabilitation
Package for the company.
1998 Company installed inconel tube Instead of Silica tube in the
Oxidation plant as a measure to overcome frequent breakdowns.
1999-2000 It was the first time that the company had achieved 100 %
capacity utilizations in a financial year.

1 -7-2000 The company got ISO 9002 certification.
2002- 03 The Company acquired the 'Export House Status' for the
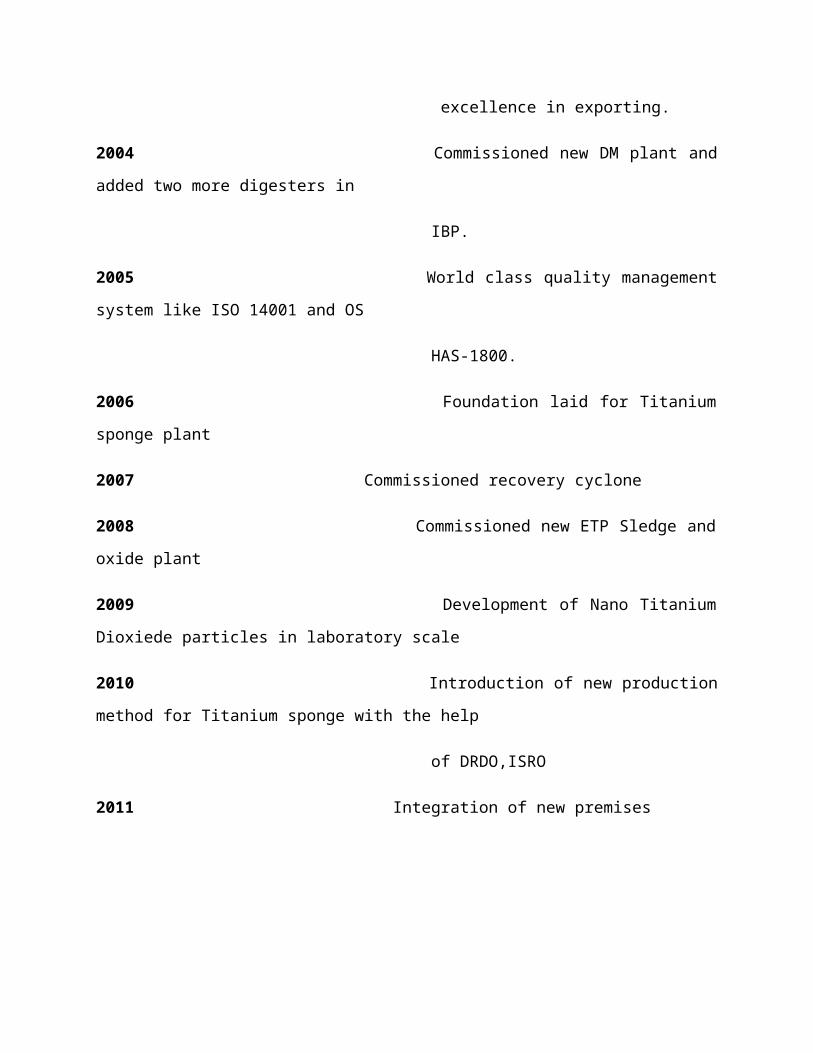
excellence in exporting.
2004 Commissioned new DM plant and added two more digesters in
IBP.
2005 World class quality management system like ISO 14001 and OS
HAS-1800.
2006 Foundation laid for Titanium sponge plant
2007 Commissioned recovery cyclone
2008 Commissioned new ETP Sledge and oxide plant
2009 Development of Nano Titanium Dioxiede particles in laboratory scale
2010 Introduction of new production method for Titanium sponge with the help
of DRDO,ISRO
2011 Integration of new premises

VISION OF KMML :
“Be a world class producer of mineral sand based value- added products.
MISSION OF KMML:
1. To become the nodal agency for promoting and establishing mineral based industries in the
state to ensure value addition and effective and controlled exploitation of the mineral reserve.
2. To develop adequate supply base for the services and utility for development of the mineral
based Industry.
3. To create more awareness about corporate social responsibilities for chemical industries in the
state.
4. To become the leader in controlling Green House Gas Emission so as to promote the concept
of Green House.
OBJECTIVES OF KMML:
1. To exploit the mineral wealth abundantly available in the coastal belt.
2. To manufacture value-added product like Titanium dioxide and Titanium metal through
Chloride route technology.
3. Large scale generation of employment in the state.
4. Overall development of local area in particular and state in general.

LOCATION
The company is located at Sankaramaangalam near Chavara, Kollam a coastal
town 85km North of Thiruvananthapuram. KMML is situated on the side of NH-47 to about 285
acres in area.
Chart.No.1.3.1-Location of the company
NH 47 Kollam COCHIN KOLLAM
ADMINISTRATIVE BLOCK
FINANCE DEPARTMENT
MARKETING DEPARTMENT
PERSONNEL DEPARTMENT
MATERIAL DEPARTMENT
ARP MAINTENANCE
IBP GODOWN
RAW ILMENITE
COAL YARD
BOILER PLANT
FACTORY GATE
OXYGEN PLANT
PPP UNIT 300
CENTRAL MECHANICAL REPAIR SHOP
ERS
PPP UNIT 100/200
EMERGENCY BLOCK
LAB

CUSTOMERS
Titanium dioxide pigment goes into the manufacturing of a variety of products
such as dress materials, facial creams, news print, woodprint, emulsions, enamels, plastics,
toothpaste, rubber products, cosmetics; packing packets, etc too have Ti02 pigment coating on
them. Paint industry is the prime user of Ti02 pigment in India as well as in the foreign countries.
Recently the automobile industry also extensively uses Ti02 pigment. Customers are divided into
two:
1. Direct customers
2. Stockists
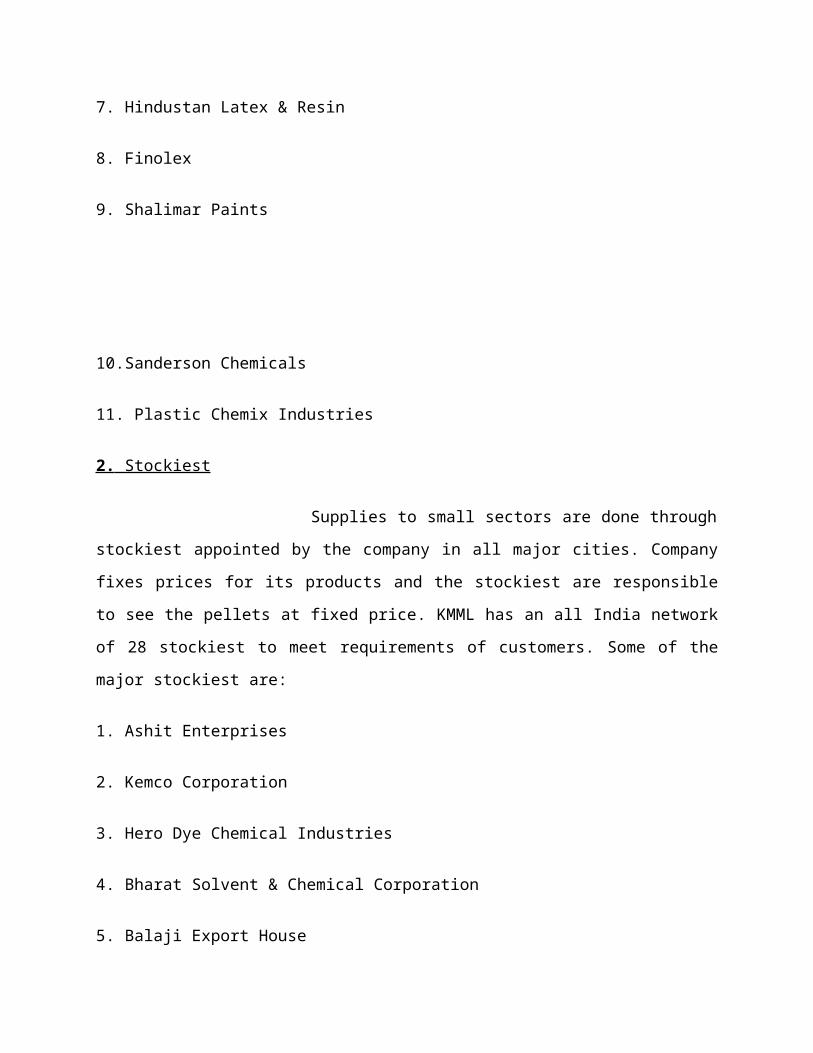
1. Direct Customers
Paint industry contribute large customers of Tio2, other largest customers include such industrial
as paper, plastic, polyester. The bulk of the products in KMML are consumed by companies
namely:-
1. Asian Paints
2. Berger Paints
3. Rajdhoot Paints
4. Mega Meditex
5. Camlin
6. Jenson & Nicholson

7. Hindustan Latex & Resin
8. Finolex
9. Shalimar Paints
10.Sanderson Chemicals
11. Plastic Chemix Industries
2. Stockiest
Supplies to small sectors are done through stockiest appointed by the company in
all major cities. Company fixes prices for its products and the stockiest are responsible to see the
pellets at fixed price. KMML has an all India network of 28 stockiest to meet requirements of
customers. Some of the major stockiest are:
1. Ashit Enterprises
2. Kemco Corporation
3. Hero Dye Chemical Industries
4. Bharat Solvent & Chemical Corporation
5. Balaji Export House
6. Karnataka Chemicals
7. Manorama Sales Corporation
8. Bajaj Chemicals
CERTIFICATIONS
KMML achieved ISO 9002 certificate by M/S Bureau virtues Quality
International (BVQI) and holes certification of United Kingdom Accreditations Service, Dutch
Council for certification (Holland) and Register Accreditations Board (USA). KMML has won
the 1997 National award for in-house research and development effort in industry for technology
absorption under the TAAS programme. The Kerala productivity Council award for high
productivity standard has also been won by KMML.
ISO 9001: 2000
KMML was certified for quality management system ISO9002:9004 in
June 2000 and was rectified and upgraded to ISO 9001:2000 quality management systems
(QMS) in November 2003 for its TP unit.
ISO 14001:2004
KMML has been certified an ISO 14001:2004 in the year 2005. As
recognition of protecting and safeguarding the environment by
Strictly complying statutory and regulative requirements
To control their impact on land, air and water and thus prevent pollution.
To reduce health and safety risks
To optimize the use of resources
OHSAS-18001-Safety Management System
Workplace Safety is emerging as one of the Key risk management
and regulatory compliance focus areas among many global companies. As authority result of this
trend, traditionalworkplace safety compliance systems, which were designed to be point
solutions at authority plant level, are giving way to enterprise wide safety management systems.
GLOBAL RECOGNITIONS

International Gold Medal Award for Quality & Efficiency from UK in 2003.
APCJ Award from Asia Pacific Coating Forum for the Best International Marketing
Campaign - May 2003
Table.No.1.3.1-National recognitions:
Award for R&D efforts in Industry 1992
FACT MKK Nair Memorial Productivity Award 1993 – 1994
Energy Conservation Award 1999
FACT MKK Nair Memorial Productivity Award 1999 – 2000
FACT MKK Nair Memorial Productivity Award 2000 – 2001
Energy Conservation Award 2001
CAPEXIL Award for best export performance 2003, 2004 & 2005
Award for best revenue Performance- Govt. of
India 2003 004

Special Awards for Exports from Chemicals and Allied Export Promotion Council
(CAPEXIL)
- 3rd time consecutively
KMML bags the “best public sector undertaking award 2010” !!
FUNCTIONAL DEPARTMENTS
In functional form of departmentation an organization group function
or activities into primary departments. The application of functional form of
departmentation means grouping activities into departments of Production, Marketing, Human
Resources development and finance. Like any other PSU, KMML has separate departments and
executive heads for each department. Each department specializes in its own area of operation.
The other activities of the plant like the catalytic process to the
production process are also divided into many departments.
1) Production Department
2) Marketing Department
3) Finance Department
4) Materials Department
5) Personnel And Administration Department
6) Fire And Safety Department
7) Data processing department
8) Technical department
9) Project department
10) Maintenance department
11) Project department
1) PRODUCTION DEPARTMENT

KMML always maintain high standard of perfection by achieving
technical excellence in every phase of production. Catering to strict guideline, KMML offers a
wide range of products for quality conscious customer. Production Department undertakes
activities and decision regarding the production work. Production is carried out in lot wise with
specific lot number. Each lot contain 15MT of TiO2, samples are collected from production at
specific intervals and examined thoroughly in the laboratory of the company. If any defect is
identified, then the lot is considered as inferior quality.
2) MARKETING DEPARTMENT
KMML has monopoly in Rutile grade TiO2 pigment industry. KMML
has a large number of customers all over the world. In KMML there is no separate department
for sales. So, marketing department is performing sales functions. The marketing department
keeps detailed report about customers, product, product group control, dispatch and payment.
FUNCTIONS OF MARKETING DEPARTMENT
The marketing functions undertaking by the marketing department of
the KMML can be broadly classified into three. Via
1. Functions of exchanging
2. Functions of physical supply
3. Marketing facilitating function.
3) FINANCE DEPARTMENT
Finance is the lifeblood of any organization. It deals with both the
acquisition of as well as allocation of funds. Hence finance department assumes a great role in

the organization. A finance department in an organization is responsible for maintaining fair and
just accounting, working capital management, long term funding decision making, costing
etc .The mains functions of the finance department In KMML are:
• To maintain clear and perfect accounting system
• Preparation of Profit & Loss accounts, Balance statement, cash flo Statement, fund flow
statement etc.
• Working Capital Management.
• Carrying activities pertaining to the long term and short-term requirement like closing
purchase, maintaining the accounts of the contractors, Income tax deductions, salary and
disbursement etc.
• Dealing with the financial institutions with matters regarding to salary disbursement, credit
arrangements, collecting payments from the customers etc.
The finance department consists of two sections, via
• An internal auditing section (or carrying out auditing functions internally and also for
maintaining internal audited records.
An account section for preparing P&L accounts, balance shee
Fig.No.1.3.2 Finance department structure
4) MATERIALS DEPARTMENT
The purchase department and store department placed under the
name MATERIALS in KMML. Assistant General Manager Materials is the departmental head
of these two departments. Under him there is a Deputy General Manager and below him
Manager (Materials).
The functions of material department can be grouped into three
Managing Director
General Manager (Finance)
Deputy Manager
Account OfficerCash
Assistant
Accountant
Account OfficerSalary
Assistant
Accountant
Account Officer
Tax
Assistant
Accountant
Account OfficerBudget
Assistant
Accountant
Account Officer
Direct Bills
Assistant
Accountant
Account Officer & Other Bills &
Sales Tax
Assistant
Accountant
Manager (Internal Audit)
Internal Audit Assistant

1. Purchase
2. Storage
3. Inventory control
5) STORES DEPARTMENT
Store department plays a prominent role in a company. Many a time
improper store activities lead to huge losses. The store department of the KMML is one which
runs efficiently and effectively. It incorporates many management techniques like inventory
control system, ABC classification of items, store reviewing based on moving & non moving
items and store location design. The activities carried out by a typical store department are as
follows.
a. Receiving materials
b. Inspection of material
c. Proper classification & codification of the material
d. Material handling
e. Storage & preservation of the material
f. Issue and dispatch
g. Stock record keeping stock verification report preparations
h. Stock accounting
6) ELECTRONIC DATA PROCESSING DEPARTMENT
The management information system is under the supervision of
the data processing department. Assistant general manager (EDP) is the top authority of the
department. There are around 200 personnel computers in the company and all the computers are
in local area network. The company is having a 10 megabytes PC backbone copper cabling. It
has 4 signals
1. Stores
2. Plant technical service
3. Illmenite beneficiation plant/ Acid regeneration plant.
4. Pigment processing unit / Laboratory
There is a direct connection from IBM service to purchase,
finance, marketing & personnel department. The entire information technology activities are
monitored by EDP section. KMML is using Oracle related Database Management System at
backend and power builder is used among the finance, purchase, stores, marketing, personnel &
production department. The database is fed into the system by each department, which is
required to generate various managements. A strict security control is incorporated in the
operations of various modules.
This department is in charge of developing and maintaining the
software necessary for each department in the company and also the maintenance of the 200
computers throughout the organization. The server used is a main database server which uses
Oracle 8. The front end used is the software called Power Builder. All the 200 computers used in
the company are networked..
7) PERSONNEL & ADMINISTRATION DEPARTMENT
Human Resource is the one of most valuable resource as for as a
company is concerned. An organization is a human grouping in which work is done for the
accomplishment of some specific goals or mission. The management of man it very important
and challenging Job. Important because it is not of managing men but of administering a social
system. The proper utilization of this resource will indicate whether a company is successful or
not. But managing this resource is complex one especially in a state like Kerala whore unionism
is strongly imparted m the minds of the workers. But the story of the KMML lies in the
personnel and administrative departments ability to property the human resources. This
department plays a prominent role in the day-to-day affairs of the Company.
THE FUNCTIONS OF P&A DEPARTMENT

Man power planning
Recruitment and selection
Grievance Handling Procedure
Workmen Category
Labor Welfare Activity
Industrial Relationship
Disciplinary Proceedings
8) FIRE AND SAFETY DEPARTMENT
Fire and safety department, which manage the process of giving
security to employees by providing training & giving license to employee& mechanist. The
safety department carries out the following activities:
1. Routine plant inspection
2. Plant safety inspection
3. Issue of safety work permits
4. Coordinates & organizing safety committee meetings
5. Giving safety education and training
6. Organizing safety promotional activities
7. Liaison with statutory authorities
8. Preparing and updating safety manuals
9. Coordinates safety auditing / surveys
9) MAINTENANCE DEPARTMENT

The maintenance department of KMML comprises with the
various functioning and the development of the machineries and equipments. The Joint General
Manager of maintenance is the top authority of the maintenance department
1. ELECTRICAL SECTION
It is controlled by the AGM (electrical).The main function of this
department is to ensure flow of electricity throughout the company
2. MECHANICAL SECTION
The AGM (mechanical) is the head of this section. The main
function is to ensure easy working of machine. The company is doing periodical shutdown to
carryout necessary maintenance and servicing of the plant.
3. INSTRUMENTATION
The AGM (instrumentation) is the head. This section inspects
safetyness of valves, mechanics est. and the working of instruments. A statutory body
occasionally visits the company to check the safety of the plant.
4. CIVIL
This section undertakes the functions relating to implanting new
machinery etc.These Manager (civil) is the head of this section.
9) TECHNICAL SERVICE DEPARTMENT
This department acts as third agency to the production and
maintenance department. The technical wing takes charge R&D, Quality control, laboratory and
technical services.KMML maintain a fully equipped R&D facility in the area of pigment and
plant technology with a view to establish world class products and competitiveness. This
excellent facility undertakes research, development and product improvement. Scientists and

engineers continuously pursue innovative technologies in the area of titanium dioxide pigment,
quality improvement and other allied products. The technical and sales service wing extends all
helps to customer in the field of application and users.
10) R&D DEPARTMENT
KMML’s Research and development has achieved following tasks in
recent times:
1. Developed new grade RC-802 will excellent balancing properties of glass and weather ability
2. Successfully developed an improved process of oxidation plant
3. Developed know how to convert iron oxide process of oxidation plant
4. Developed grade RC-808 special grade for automotive coating
11) PROJECT DEPARTMENT
This wing is engaged in the expansion programs of the company. They are engaged in the
building up of new projects and also decide upon the future plans of the company. Some major
projects on which they are currently engaged are:
1. Project for separation of Minerals at an estimate cost of Rs. 21 crores.
2. Capacity augmentation of Synthetic Rutile plant at an estimate cost of Rs.32 crores.
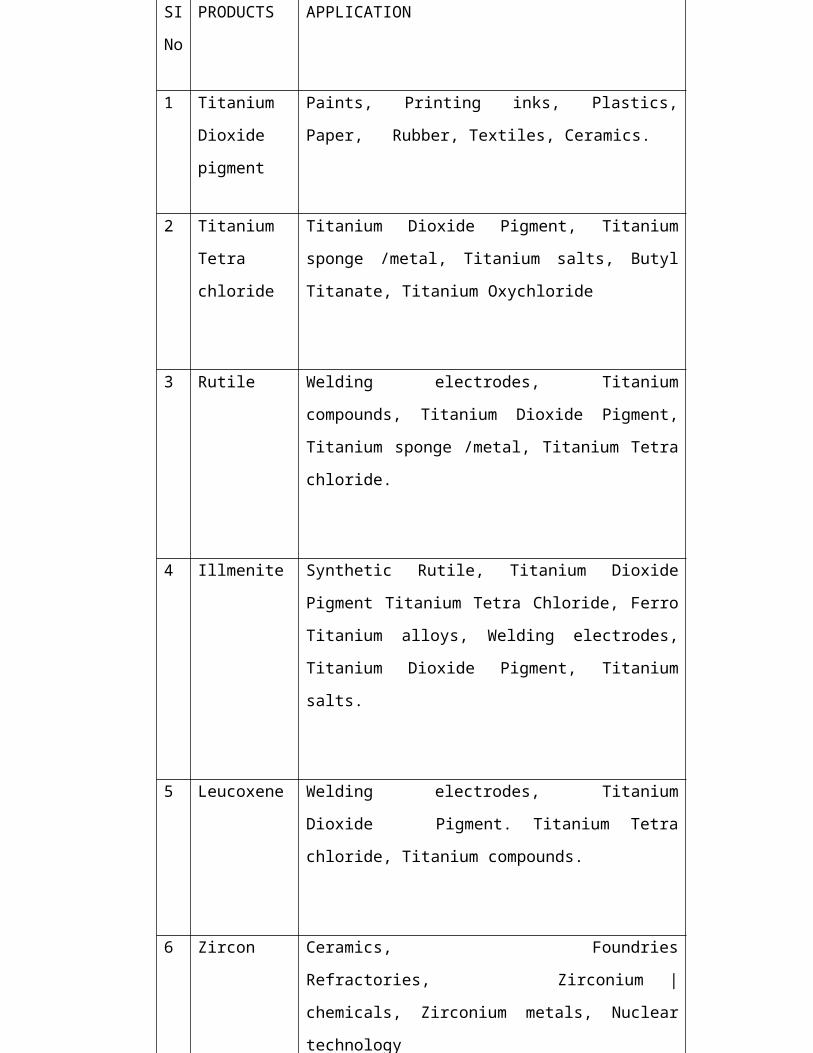
1.4 Product profile
KMML offers rutile grade Ti02 as the main product also offers Zircon,
Leucoxene, titanium tetra chloride as the secondary products. Titanium Tetra Chloride is
extensively used in the manufacture of Titanium dioxide pigment, Titanium sponge or metal.
The product profile of the KMML and their applications are shown in the figure below.
Table.No.1.4.1- Product profile

At
present
SI
No
PRODUCTS APPLICATION
1 Titanium
Dioxide
pigment
Paints, Printing inks, Plastics, Paper, Rubber,
Textiles, Ceramics.
2 Titanium
Tetra chloride
Titanium Dioxide Pigment, Titanium sponge /metal,
Titanium salts, Butyl Titanate, Titanium Oxychloride
3 Rutile Welding electrodes, Titanium compounds, Titanium
Dioxide Pigment, Titanium sponge /metal, Titanium Tetra
chloride.
4 Illmenite Synthetic Rutile, Titanium Dioxide Pigment Titanium
Tetra Chloride, Ferro Titanium alloys, Welding
electrodes, Titanium Dioxide Pigment, Titanium salts.
5 Leucoxene Welding electrodes, Titanium Dioxide Pigment.
Titanium Tetra chloride, Titanium compounds.
6 Zircon Ceramics, Foundries Refractories, Zirconium |
chemicals, Zirconium metals, Nuclear technology
7 Silimanite High temperature refractory, Ceramics.
8 Iron oxide
bricks
As Building Material
KMML produces six grades of titanium dioxide pigment under the brand name of KEMOX. The
different grades of Ti02 pigments that are produce in the KMML, their main properties and their
uses are:
ANALYSIS AND INTERPRETAIONS
Ratio analysis
One of the most important financial tool which have come to be
very frequently used for analyzing the financial strength and weakness of the enterprise is ratio
analysis. Ratio analysis is the process of determine and presenting arithmetical relationship
between the figures and the group of figures drawn from the statement. The ratio analysis of
working capital is used by the financial analyst to check upon the efficiency of the working
capital of the enterprise. It is found out by establishing the relationship between the items of
Balance sheet, Trading and Profit and loss account.
The ratios relating to working capital management, which have
been selected for the study, are:
a. LIQUIDITY RATIOS

1) Current ratio
2) Quick ratio
3) Absolute liquid ratio
b. LEVERAGE RATIOS
4) Debt –Equity Ratio
5) Proprietary Ratio
6) Total assets to debt ratio
7) Fixed Assets to Net worth Ratio
c. PROFITABILITY RATIOS
8) Gross profit ratio
9) Net profit ratio
10) Operating ratio
d. ACTIVITY RATIOS
11) Inventory turnover ratio
12) Fixed assets turnover ratio
13) Debtors turnover ratio
14) Working capital turnover ratio
ANALYSIS
1) Current Ratio

Current ratio is the most common ratio for measuring
liquidity. It represents the ratio of current assets to current liabilities. It is also called as working
capital ratio .It is calculated by dividing the current assets by current liabilities.
Current Ratio=Current assets / Current liabilities
Table No.5.1-Current ratio
Years Current assets
Current liability
Current ratio
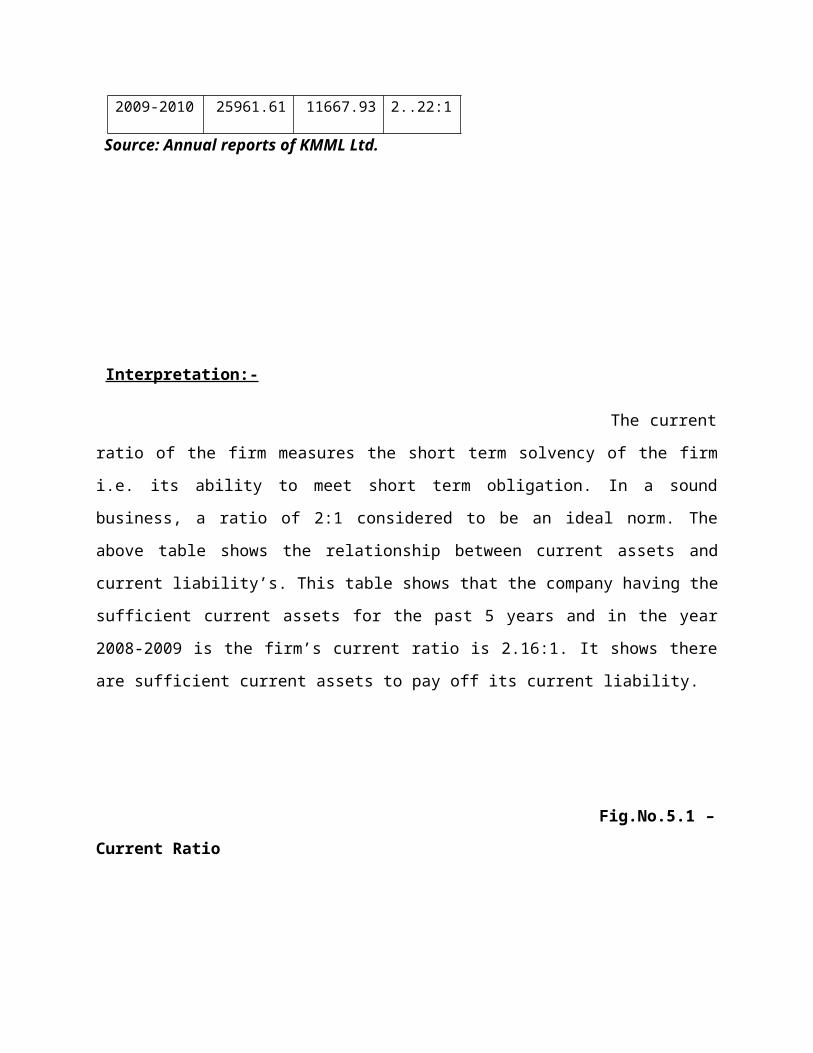
2005-2006 27130.94 6577.63 4.12:1
2006-2007 22531.31 5893.47 3.82:1
2007-2008 23688.82 10081.66 2.34:1
2008-2009 26044.46 12037.61 2.16:1
2009-2010 25961.61 11667.93 2..22:1
Source: Annual reports of KMML Ltd.
Interpretation:-
The current ratio of the firm measures the short term solvency of
the firm i.e. its ability to meet short term obligation. In a sound business, a ratio of 2:1
considered to be an ideal norm. The above table shows the relationship between current assets
and current liability’s. This table shows that the company having the sufficient current assets for
the past 5 years and in the year 2008-2009 is the firm’s current ratio is 2.16:1. It shows there are
sufficient current assets to pay off its current liability.
Fig.No.5.1 –Current Ratio
2005-2006 2006-2007 2007-2008 2008-2009 2009-20100
5000
10000
15000
20000
25000
30000
Years
Ratios
2) Quick ratio
This ratio is also known as” Acid Test Ratio or Liquidity
Ratio.”It shows the relation between the quick assets and current liabilities. It is determined by
dividing the quick assets by current liabilities. The term quick asset refers to the current assets
which can be converted into cash immediately.

Quick Ratio=Quick assets / Current liabilities
Table .No.5.2-Quick Ratio
Year Quick assets Current
liability
Quick ratio
2005-2006 19377.92 6577.63 2.94:1
2006-2007 10557.07 5893.47 1.79:1
2007-2008 11556.33 10081.66 1.14:1
2008-2009 17703.26 12037.61 1.47:1
2009-2010 19226.15 11667.93 1.64:1
Source: Annual reports of KMML Ltd.
Interpretation:-
The above table shows the relationship between Quick assets
and current liability’s. So under this table the year 2006-2010 the firm’s quick ratio is more than
the basic ratio of 1:1.It represents the company is having sufficient quick assets for the past few
years.
Fig.No.5. 2- Quick Ratio
2005-2006 2006-2007 2007-2008 2008-2009 2009-20100
2000
4000
6000
8000
10000
12000
14000
16000
18000
20000
QACL
Years
Ratios

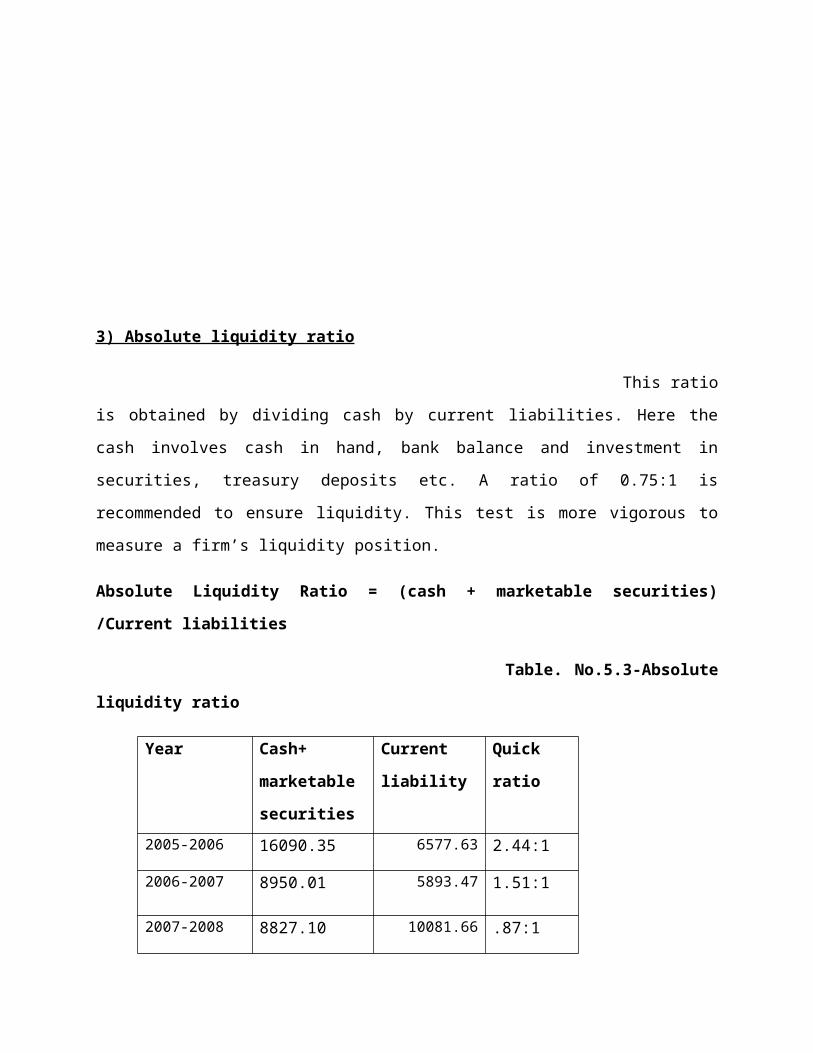
3) Absolute liquidity ratio
This ratio is obtained by dividing cash by current liabilities.
Here the cash involves cash in hand, bank balance and investment in securities, treasury deposits
etc. A ratio of 0.75:1 is recommended to ensure liquidity. This test is more vigorous to measure a
firm’s liquidity position.
Absolute Liquidity Ratio = (cash + marketable securities) /Current liabilities
Table. No.5.3-Absolute liquidity ratio
Year Cash+
marketable
securities
Current
liability
Quick ratio
2005-2006 16090.35 6577.63 2.44:1
2006-2007 8950.01 5893.47 1.51:1
2007-2008 8827.10 10081.66 .87:1
2008-2009 14076.20 12037.61 1.16:1
2009-2010 13808.32 11667.93 1.18:1
Source: Annual reports of KMML Ltd.

Interpretation:-
The standard absolute liquidity ratio is 0.75:1. This table
shows that the absolute liquidity ratio in the five years is good for the company .At present the
absolute liquidity ratio is in good position, indicating that cash form a major part of the current
assets.
Fig .No.5.3- Absolute liquidity ratio
2005-2006 2006-2007 2007-2008 2008-2009 2009-20100
2000
4000
6000
8000
10000
12000
14000
16000
18000
Years
Ratios

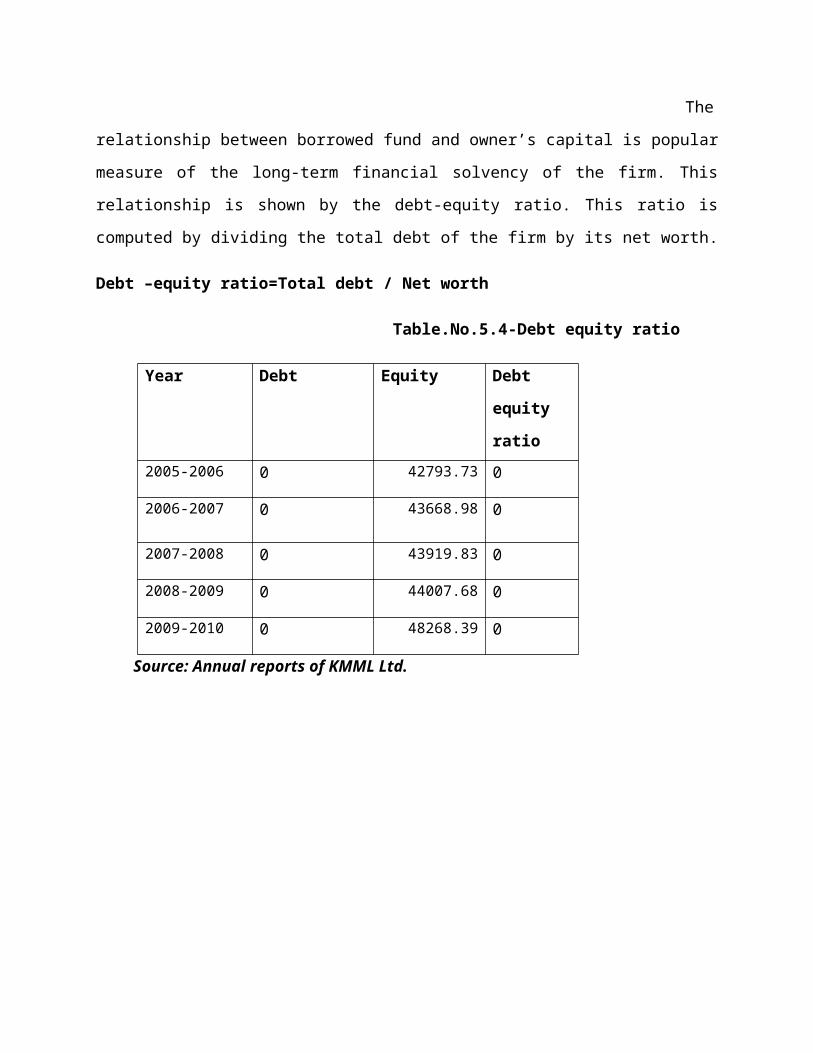
4) Debt-Equity Ratio
The relationship between borrowed fund and owner’s capital
is popular measure of the long-term financial solvency of the firm. This relationship is shown by
the debt-equity ratio. This ratio is computed by dividing the total debt of the firm by its net
worth.
Debt –equity ratio=Total debt / Net worth
Table.No.5.4-Debt equity ratio
Year Debt Equity Debt
equity
ratio
2005-2006 0 42793.73 0
2006-2007 0 43668.98 0
2007-2008 0 43919.83 0
2008-2009 0 44007.68 0
2009-2010 0 48268.39 0
Source: Annual reports of KMML Ltd.
Interpretation:-
The company can’t makes any borrowings so this ratio is
not important to the company .To improve the profitability; the company has to make the outside
borrowings.
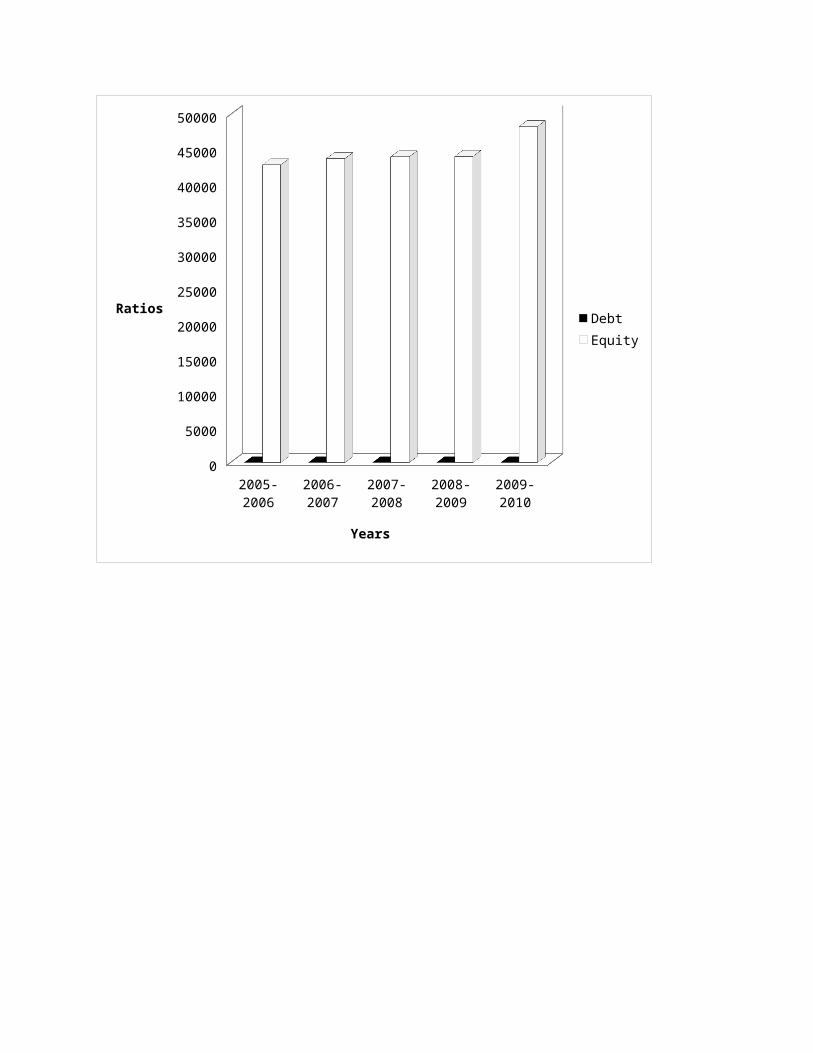
Fig No.5.4-Debt equity ratio

2005-2006 2006-2007 2007-2008 2008-2009 2009-20100
5000
10000
15000
20000
25000
30000
35000
40000
45000
50000
DebtEquity
Years
Ratios

5) Proprietary ratio
Proprietary ratio relates to the shareholder fund to total
assets. This ratio shows the long term solvency of the business. The acceptable form of the ratio
is 1:3.the ratio is calculated as follows:
Proprietary Ratio=Shareholders fund / Total assets
Table No. 5.5-Proprietary ratio
Year Shareholders
fund
Total assets Proprietary
ratio
2005-2006 42793.73 46106.96 .92:1
2006-2007 43668.98 41500.05 1.05:1
2007-2008 43919.83 42959.03 1.02:1
2008-2009 44007.68 57640.28 .76:1
2009-2010 48268.39 63518.36 .75:1
Source: Annual reports of KMML Ltd.

Interpretation:-
The ratio shows strength of the company. It helps the
creditors to find out the proportion of share holders fund in the total assets. Higher ratio indicates
a secured position to creditors and lower ratio indicates greater risk to creditors. The above table
shows that the year 2006-2007 and 2007-2008 is a decreasing trend and remain year’s shows
increasing trend.
Fig .No.5.5 Proprietary ratio
2005-2006 2006-2007 2007-2008 2008-2009 2009-20100
10000
20000
30000
40000
50000
60000
70000
Years
Ratios
6) Total assets to debt ratio
This ratio shows a good relationship between the total assets and debt.
Total assets to debt ratio=Total assets / Long term debt
Table.No.5.6-Total assets to debt ratio
Year Total assets Long-term
debt
Debt
equity

ratio
2005-2006 46106.96 0 0
2006-2007 41500.05 0 0
2007-2008 42959.03 0 0
2008-2009 57640.28 0 0
2009-2010 63518.36 0 0
Source: Annual reports of KMML Ltd.
Interpretation:-
The firm has no long term debt. Only total assets are
here for calculating the total assets to debt ratio. It is not good for the firm’s future life.

Fig.No.5.6-Total assets to debt ratio
2005-2006 2006-2007 2007-2008 2008-2009 2009-20100
10000
20000
30000
40000
50000
60000
70000
Total AssetsDebt
Years
Ratios
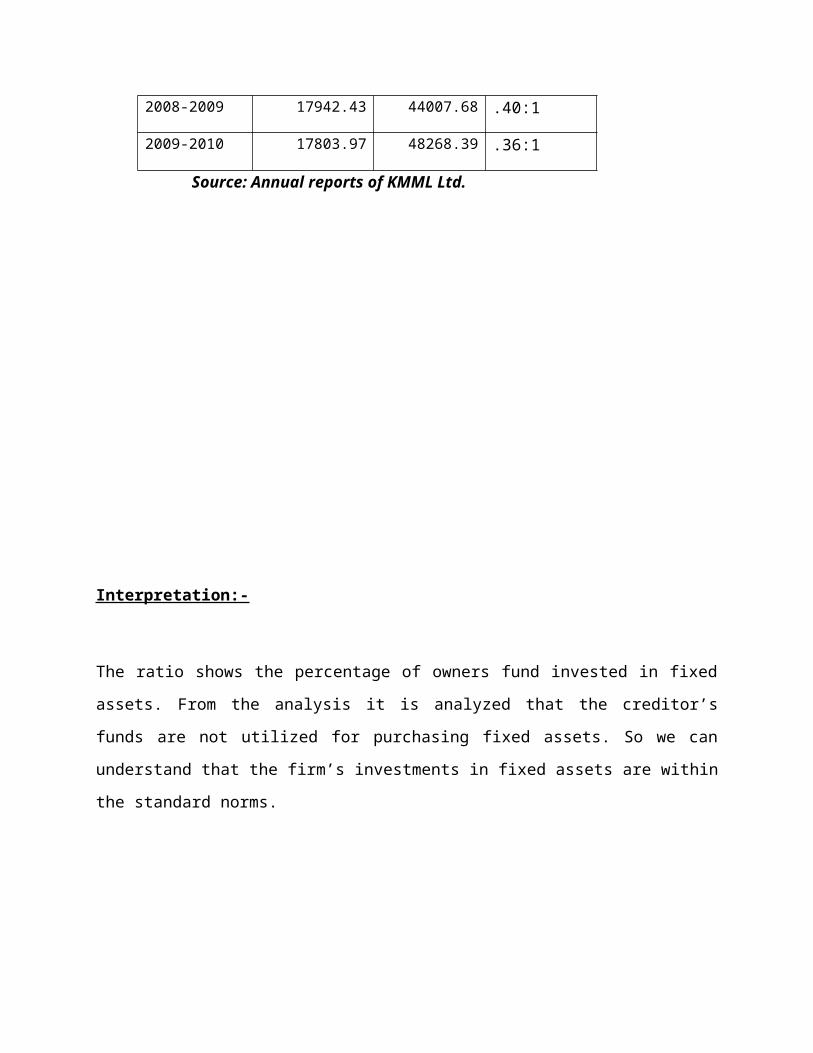
7) Fixed assets to net worth ratio
This ratio shows relationship between fixed assets and
shareholders fund. The purpose of this ratio is to find out the percentage of the owner’s fund to
invest in fixed assets. If the ratio is less than one it is assumed that more and more funds is used

to make investments in fixed assets. If the ratio is greater than one, it means that creditors fund
have been used to acquire a part of fixed assets.
Fixed assets to net worth ratio=Fixed assets / Net worth or share holder’s fund
Table No.5.7-Fixed assets to net worth ratio
Year Fixed assets Shareholders
fund
Fixed assets
to net worth
ratio
2005-2006 10157.90 42793.73 .23:1
2006-2007 11746.84 43668.98 .26:1
2007-2008 12862.52 43919.83 .29:1
2008-2009 17942.43 44007.68 .40:1
2009-2010 17803.97 48268.39 .36:1
Source: Annual reports of KMML Ltd.
Interpretation:-
The ratio shows the percentage of owners fund
invested in fixed assets. From the analysis it is analyzed that the creditor’s funds are not utilized
for purchasing fixed assets. So we can understand that the firm’s investments in fixed assets are
within the standard norms.
Fig.No.5.7-Fixed assets to net worth ratio
2005-2006 2006-2007 2007-2008 2008-2009 2009-20100
5000
10000
15000
20000
25000
30000
35000
40000
45000
50000
Years
Ratios

8) Gross profit ratio
The gross profit ratio plays an important role in two
management areas. In the area of financial management, the ratio serves as a valuable indicator
of the firm’s ability to utilize effectively outside source of fund.
Gross profit ratio= (Gross profit / Sales) * 100
Table.No.5.8-Gross profit ratio
Year Gross profit Sales Gross
profit ratio
2005-2006 6881.47 28967.07 23.75:1
2006-2007 5714.61 29574.49 19.32:1
2007-2008 8451.49 30748.69 27.48:1
2008-2009 17466.78 41908.91 41.67:1
2009-2010 22908.8 48395.20 47.33:1
Source: Annual reports of KMML Ltd.

Interpretation:-
A high ratio is favorable to the company’s financial
position. The above table shoes that the relationship between the firm’s gross profit of the
business and the net sales of the business. The highest gross profit ratio is 47.33:1 in 2010 and
the lowest ratio is 19.32 in 2007.
Fig.No.5.8- Gross profit ratio
2005-2006 2006-2007 2007-2008 2008-2009 2009-20100
5000
10000
15000
20000
25000
30000
35000
40000
45000
50000
GPSales
Years
Ratio
9) Net profit ratio
This ratio is also called as net profit to sales or net
profit margin ratio. It is determined by dividing the net income after tax to the net sales for the
period and measures the profit per rupee of sales. This ratio is calculated as follows:
Net profit ratio= (Net profit / Sales) *100
Table .No.5.9-Net profit ratio
Year Net profit Sales Net profit
ratio
2005-2006 862.61 28967.07 2.97:1
2006-2007 1237.15 29574.49 4.18:1
2007-2008 612.74 30748.69 1.99:1
2008-2009 449.76 41908.91 1.07:1
2009-2010 6063.23 48395.20 12.52:1
Source: Annual reports of KMML Ltd.

Interpretation:-
The net profit ratio is decreasing up to the year 2008-
2009.This is due to the increase in cost of production. It will affect the company survival and
profitability. And in the year 2009-2010net profit shows an increasing trend.
Fig . No.5.9-Net profit ratio
2005-2006 2006-2007 2007-2008 2008-2009 2009-20100
5000
10000
15000
20000
25000
30000
35000
40000
45000
50000
Years
Ratios
10) Operating ratio
Operating ratio measures the cost of operation per
rupee of sales. It is generally represented as percentage. Thus two elements of the ratio are cost
and net sales. Operating expenses and cost of goods sold. It’s calculated as.
Operating ratio= (Operating cost / Net sales) * 100
Table.No.5.10- Operating ratio
Year Operating cost Sales Operating
ratio

2005-2006 862.61 28967.07 78.43
2006-2007 1237.15 29574.49 82.64
2007-2008 612.74 30748.69 74.21
2008-2009 449.76 41908.91 60.49
2009-2010 6063.23 48395.20 60.58
Source: Annual reports of KMML Ltd.
Interpretation:-
The operating expenses of the company is increasing in
the year 2005-2006 and 2006-2007 .This is because of the operating expenses of the company
increases ,and in the remaining years it is decreased at increasing rate.
Fig.No.5.10-Operating ratio
2005-2006 2006-2007 2007-2008 2008-2009 2009-20100
5000
10000
15000
20000
25000
30000
35000
40000
45000
50000
Years
Ratios
11) Inventory turnover ratio
This ratio indicates whether investment in inventory
is sufficiently used or not .It. therefore, explains whether investment in inventories is within the
proper limit or not. It also measures the effectiveness of the firm’s sales efforts.

Inventory turnover ratio=cost of goods sold / average stock.
Table. No. 5.11-Inventory turnover ratio
Year Cost of goods
sold
Average stock Inventory
turnover
ratio
2005-2006 22085.60 7753.02 2.85:1
2006-2007 23859.88 11974.24 1.99:1
2007-2008 22297.20 12132.43 1.84:1
2008-2009 24442.13 7855.51 3.11:1
2009-2010 25486.13 7538.33 3.38:1
Source: Annual reports of KMML Ltd.
Interpretation:-

The table shows there is an increasing trend in the
year 2005-2006, after this year the coming two years is a slight decrease because of over
investment in inventory; in the year 2008-2009 the turnover ratio is increased.
Fig. No.5.11-Inventory turnover ratio
2005-2006 2006-2007 2007-2008 2008-2009 2009-20100
5000
10000
15000
20000
25000
30000
Years
Ratios

12) Fixed assets turnover ratio
This ratio indicates the extent to which the investments in
fixed assets contribute towards sales. If compared with the previous year, it indicates that
whether the investment in fixed asset has been judicious or not.
Fixed assets turnover ratio= Net sales / fixed assets.
Table.No.5.12-Fixed assets turnover ratio
Year Net sales Fixed assets Fixed assets
turnover
ratio
2005-2006 28967.07 10157.90 2.85:1
2006-2007 29574.49 11746.84 2.51:1
2007-2008 30748.69 12862.52 2.39:1
2008-2009 41908.91 17942.43 2.33:1
2009-2010 48395.20 17803.97 2.71:1
Source: Annual reports of KMML Ltd.

Interpretation:-
In the year 2005-2006 and 2009-2010 the fixed assets
turnover ratio is a satisfactory level because the fixed assets are utilized efficiently and other
years the turnover ratio is decreased.
Fig .No.5.12-fixed assets turnover ratio
2005-2006 2006-2007 2007-2008 2008-2009 2009-20100
5000
10000
15000
20000
25000
30000
35000
40000
45000
50000
Years
Ratios
13) Debtors turnover ratio
The purpose of this ratio is to discuss the credit collection
power and policy of the firm. For this ratio a relationship is established between account
receivables and the net credit sales of the period.
Debtors turnover ratio= Net credit sales / Average debtor
Table .No.5.13-Debtors turnover ratio
Year Net credit sales Average
Debtor
Debtors
turnover
ratio
2005-2006 28967.07 2612.57 11.09:1
2006-2007 29574.49 1453.40 20.34:1
2007-2008 30748.69 2606.48 11.79:1
2008-2009 41908.91 3203.56 13.08:1
2009-2010 48395.20 4709.92 10.27:1
Source: Annual reports of KMML Ltd.

Interpretation:-
In the year 2006-2007 the debtors turnover ratio is
increase due to decrease the collection periods that implies prompt payment by debtors. In the
remaining years debtors turnover ratio is decrease because the debtors take long period to make
payments.
Fig.No.5.13-Debtors turnover ratio

2005-2006 2006-2007 2007-2008 2008-2009 2009-20100
5000
10000
15000
20000
25000
30000
35000
40000
45000
50000
SalesDebtors
Years
Raios
14) Working capital turnover ratio
The ratio reflects the turnover of the firm’s net
working capital in the course of the year. It is a good measure of over trading .The ratio is
calculated by dividing the net sales by net working capital.
Working capital turnover ratio= Net sales / Net working capital.
Table.No.5.14-Working capital turnover ratio

Year Net sales Working
capital
Working
capital
turnover
ratio
2005-2006 28967.07 20553.31 1.41:1
2006-2007 29574.49 16635.84 1.77:1
2007-2008 30748.69 13607.16 2.26:1
2008-2009 41908.91 14006.85 2.79:1
2009-2010 48395.20 14293.68 3.38:1
Source: Annual reports of KMML Ltd.
Interpretation:-
In the above table shows that sales is more than the net
working capital. This shows that the improvement in the efficiency of the company in
maintaining required amount of working capital.
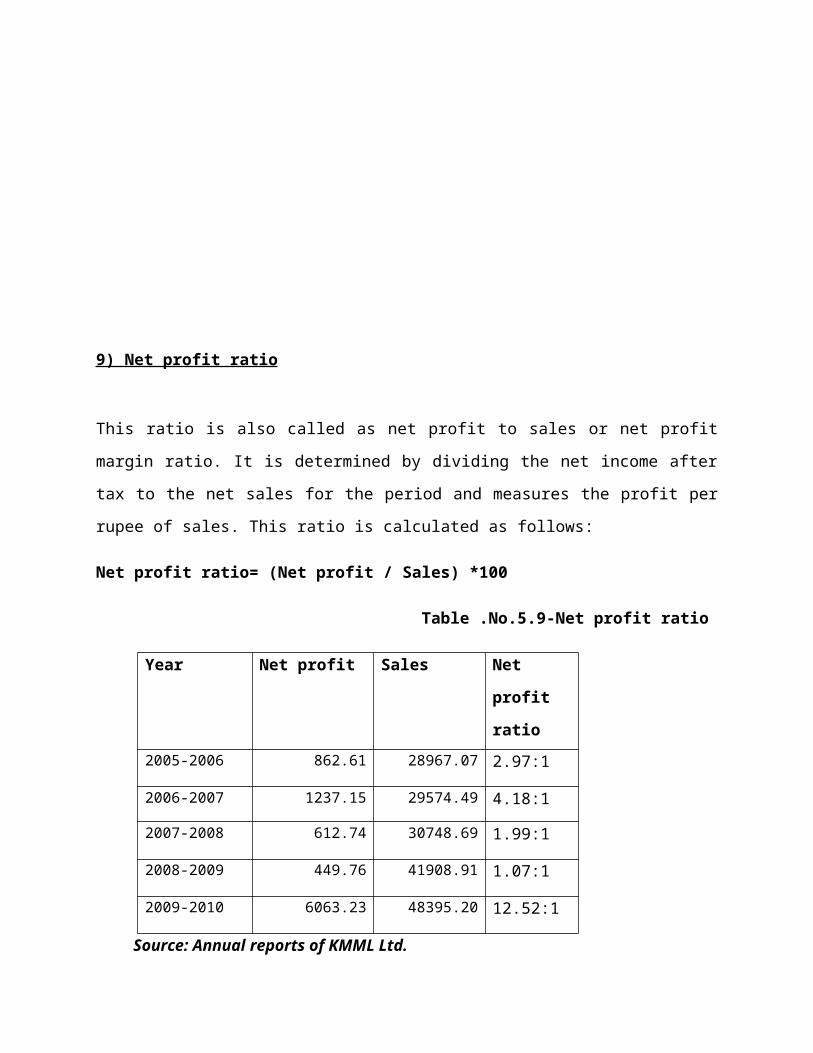
Fig.No.5.14-Workingcapital turnover ratio
2005-2006 2006-2007 2007-2008 2008-2009 2009-20100
5000
10000
15000
20000
25000
30000
35000
40000
45000
50000
Years
Ratios
FINDINGS AND SUGGESTIONS
Findings
1) The current ratio of the company is good. The company has sufficient current assets to
meet the current liability. And the quick ratio and absolute liquidity ratios are also in the
satisfactory level. That is the company’s liquidity position is good.
2) The company’s debt –equity ratio is very low. It means that company cannot borrow funds
from the public.
3) Under fixed assets to net worth ratio shows that the creditor’s funds are not utilized for
purchasing fixed assets.
4) The net profit ratio shows a decreasing and increasing trend the decreasing trend is
negatively affecting the profitability of the firm.
5) The fixed assets of the firm utilized efficiently, it is good for the business.
6) Company’s net working capital shows a decreasing trend.
7) The sales and fixed assets of the company show an increasing trend.
8) Debtors turnover ratio is not in good position.
Suggestions
1) To increase the profitability, the investment on fixed assets can be increased.
2) The company should try to maintain the present liquidity position.
3) Company should try to reduce the manufacturing and the selling cost.

4) Now the company’s working capital position is just satisfactory, but for the smooth
running of the company, it is not enough so the company should bring more working
capital.
5) To reduce credit sales on order to avoid the high risk.
6) The company should improve the activities relating to the collection of debts.
Balance Sheet as on 31st March -2010
Particulars As per schedule
As at 31/03/2010 (Rs in lakhs)
Sources of fund - -Share holders fund - -

Share capital A 3093.27Reserves and surplus B 45175.12Deferred tax liability C 1184.47Total - 49451.86
Application of fundsFixed assetsGross block O 33707.00-depreciation 15903.03Net block 17803.97
123661.25Capital work in progress F30465.22
Investment G 17.60Current assets ,loans $ advance HCurrent assetsInventories 6735.46Sundry debtors 4709.92Cash and Bank balances 13808.32Other current assets 707.91Loans and advance H 7073.93
33035.54Less current liabilities and provisionsCurrent liabilities D 11667.93Provisions E 2398.57
14066.50Net current assets 18969.04Total 49451.86
Balance Sheet as on31st March -2009

Particulars As per schedule
As at 31/03/2009 (Rs in lakhs)
Sources of fund - -Share holders fund - -Share capital A 3093.27Reserves and surplus B 40914.41Deferred tax liability C 768.07Total - 44775.75
Application of fundsFixed assetsGross block O 32593.71-depreciation 14651.28Net block 17942.43
6600.55Capital work in progress F24542.98
Investment G 17.60Current assets ,loans $ advance HCurrent assetsInventories 8341.20Sundry debtors 3203.56Cash and Bank balances 14076.20Other current assets 423.50Loans and advance H 7035.24
33079.70Less current liabilities and provisionsCurrent liabilities D 12037.61Provisions E 826.92
12864.53Net current assets 20215.17Total 44775.75

Balance Sheet as on 31st March -2008
Particulars As per schedule
As at 31/03/2008 (Rs in lakhs)
Sources of fund - -Share holders fund - -Share capital A 3093.27Reserves and surplus B 40826.56Deferred tax liabilityTotal
C-
284.7344144.56
Application of fundsFixed assets R 12862.52Capital work in progress G 11033.42Investment 17.60Current assets H 23688.82 Loans and advance 19270.21
42959.03
Less current liabilities and provisions -Current liabilities D 10081.66Provisions E 12646.35
22728.01Net current assets 20231.02
Miscellaneous expenses J 0.00
Total 44144.56

Balance Sheet as on 31st March -2007
Particulars As per schedule
As at 31/03/2007(Rs in lakhs)
Sources of fund - -Share holders fund - -Share capital A 3093.27Reserves and surplus B 40575.71Deferred tax liabilityTotal
C-
182.7543851.73
Application of funds
Fixed assets R 11746.84Capital work in progress F 9037.29Investment G 17.60Current assets H 22531.31 Loans and advance I 18968.74
41500.05
Less current liabilities and provisions -Current liabilities D 5895.47Provisions E 12554.58
18450.05Net current assets 23050
Miscellaneous expenses J 0.00
Total 43851.73

Balance Sheet as on 31st March -2006
Particulars As per schedule
As at 31/03/2006(Rs in lakhs)
Sources of fund - -
Share holders fund - -Share capital A 3093.27Reserves and surplus B 39700.46Deferred tax liabilityTotal
C-
298.8343092.56
Application of funds
Fixed assets R 10157090Capital work in progress F 5163.18Investment G 0.10Current assets H 27130.94 Loans and advance I 18975.96
46106.90
Less current liabilities and provisions -Current liabilities D 6577.63Provisions E 11775.42
185353.05Net current assets 27753.85
Miscellaneous expenses J 17.53
Total 43092.56