Embed Size (px)
Citation preview

December 2017
An Analysis of Racial and Ethnic Disparities in Case Dispositions and Sentencing Outcomes for Criminal Cases Presented to and Processed by the Office of the San Francisco District Attorney
John MacDonald Department of Criminology University of Pennsylvania [email protected]
Steven Raphael Goldman School of Public Policy University of California, Berkeley
We are grateful to Yotam Shem Tov for his excellent research assistance on this project and Alissa Skog for helping think through the structure of the administrative datasets. We are especially grateful to Maria McKee and Tara Regan Anderson for the many insights they provided us over the course of this project. This research was supported by a grant from the Frank and Denise Quattrone Foundation.

2
EXECUTIVE SUMMARY
In this project, we document and explore the sources of racial and ethnic disparities in
outcomes for criminal cases that are presented to and prosecuted by the San Francisco District
Attorney’s Office (SFDA). We assess the degree to which racial and ethnic disparities in case
outcomes are attributable to characteristics of the cases that are presented to the SFDA (e.g.,
seriousness of arrest charges and criminal history) in comparison to aspects of case processing
that generate disparate impacts. We also explore the extent to which disparities remain after
making statistical adjustments for case characteristics and specific case processing aspects, such
as pre-trial detention. The study merges administrative data from the SFDA case management
system, data on jail admission and release from the San Francisco Sheriff’s Department, and
statewide criminal history data from the California Department of Justice.
Our principal conclusions are as follows:
CONCLUSION #1: Racial and ethnic disparities in case disposition outcomes tend to disfavor
African-Americans, Asians, and Hispanics relative to White suspects arrested in City and County
of San Francisco. Figure ES1 displays average values for a select set of case disposition outcomes
by race and ethnicity. The figure shows the percent of cases where charges are not filed, where
the defendant is successfully diverted, where the defendant is released to another agency or
where a motion to revoke probation is filed, where felony charges are filed after a felony arrest,
where a felony arrest results in a felony conviction, and the percentage of cases that result in a
prison sentence. Figure ES1 also displays the average sentence in months for cases that result in
a new conviction. There are several notable patterns in these outcomes.

3
Figure ES1: Average Differences in Select Case Outcomes by the Race/Ethnicity of Criminal Defendants Processed by the Office of the San Francisco District Attorney
First, Blacks fare poorly relative to Whites for each outcome. Black defendants are less
likely to have their cases dropped or dismissed, less likely to be successfully diverted, more
likely to be released to another agency or have a motion to revoke filed against them, and
when convicted, receive the longest incarceration sentences and are the most likely to receive a
prison sentence.
Second, Asian and Hispanic defendants also fare poorly for several outcomes relative to
White defendants. Asian suspects face a much lower likelihood that their case is dismissed and
a higher likelihood of conviction. Broad disposition outcomes are similar for Hispanic and White
60.5 58.651.4
60.1
020
4060
Per
cent
of C
ases
NH White NH Black NH Asian Hispanic
A. Case Dismissed or Not Filed4.0
2.5
3.6 3.7
01
23
4P
erce
nt o
f Cas
es
NH White NH Black NH Asian Hispanic
B. Case Sucesfully Diverted
10.9
17.0
10.5 9.6
05
1015
20P
erce
nt o
f Cas
es
NH White NH Black NH Asian Hispanic
C. Release to Other Agency or File Motion to Revoke37.2 38.9 38.8 38.7
010
2030
40P
erce
nt o
f Cas
es
NH White NH Black NH Asian Hispanic
D. Felony Arrests Where Felony Charges are Filed
25.5 26.9 24.8 25.4
010
2030
Per
cent
of C
ases
NH White NH Black NH Asian Hispanic
E. Felony Arrests Resulting in Felony Conviction
6.1
8.9
6.07.6
02
46
810
Sen
tenc
e in
Mon
ths
NH White NH Black NH Asian Hispanic
F. Average Sentence for Felony Convictions
1.1
2.1
1.1
1.5
0.5
11.
52
Per
cent
of C
ases
NH White NH Black NH Asian Hispanic
G. Cases Resulting in a New Prison Sentence

4
defendants, though Hispanic defendants are slightly less likely to be successfully diverted and
slightly more likely to receive a prison sentence.
Figure ES2: Average Differences in Select Case Characteristics by the Race/Ethnicity of Criminal Defendants Processed by the Office of the San Francisco District Attorney
CONCLUSION #2: There are large average differences in case characteristics by race and
ethnicity that predict relatively worse disposition outcomes for Black and Asian defendants
and to a lesser degree Hispanic defendants relative to Whites. Figure ES2 displays the percent
of cases by race and ethnicity that involve a felony arrest, the percent of cases where the suspect
at the time of arrest has another pending cases or is on probation or parole (has another open
case at the time of arrest), the average number of prior felony convictions, the average number
of prior prison sentences, and the average number of prior jail sentences. Relative to White
45.7
54.3 56.0
47.0
020
4060
Per
cent
of C
ases
NH White NH Black NH Asian Hispanic
A. Arrested for a Felony
22.0
35.0
20.0 19.0
010
2030
40P
erce
nt o
f Cas
esNH White NH Black NH Asian Hispanic
B. Other Open Case at the Time of the Arrest
0.54
0.82
0.32
0.44
0.2
.4.6
.8N
umbe
r of P
riors
NH White NH Black NH Asian Hispanic
C. Average Number of Prior Felony Convictions
0.06
0.13
0.050.06
0.0
5.1
.15
Num
ber o
f Prio
rs
NH White NH Black NH Asian Hispanic
D. Average Number of Prior Prison Sentences
0.62
0.77
0.36
0.54
0.2
.4.6
.8N
umbe
r of P
riors
NH White NH Black NH Asian Hispanic
E. Average Number of Prior Jail Sentences

5
defendants, Black defendants are more likely to have been arrested for a felony, are more likely
to have an open case at the time of arrest, and have more extensive criminal history records at
the time of arrest (more felony convictions and prior incarceration sentences). All of these
differences in case characteristics by race and ethnicity tend to increase a defendant’s chance of
a more punitive disposition. For example, having an active criminal justice status or an extensive
criminal history may legitimately factor into choices regarding whether to pursue a case, what
charges to file, and sentencing outcomes.
There are also large racial disparities in the likelihood and extent of pre-trial detention.
Table ES1 displays the percent of defendants by race and ethnicity who experience two or more
days of pre-trial detention, that experience seven or more days of pre-trial detention, and that
experience 30 or more days of pre-trial detention. Asian, White, and Hispanic defendants
experience similar levels of pre-trial detention, while Black defendants are detained pre-trial at
higher rates at the two, seven, and thirty-day markers. Recent research has established that pre-
trial detention often leads to worse disposition outcomes.
Table ES1 Percentage of Defendants Detained Pre-Trial for Two or More Days, Seven or More Days, and Thirty or More Days by Race and Ethnicity Detained two or
more days Detained seven or more days
Detained thirty or more days
Non-Hispanic White 42.4% 21.3% 11.5% Non-Hispanic Black 59.9% 34.0% 20.1% Non-Hispanic Asian 45.5% 23.3% 13.6% Hispanic 42.0% 20.6% 11.8%
CONCLUSION #3: Nearly all of the racial and ethnic disparities in case outcomes can be
attributed to case characteristics that are determined prior to a case being presented to the

6
office of the SFDA. Figures ES3 through ES5 graphically display the disparities in key disposition
outcomes relative to White defendants. The figures display the raw average difference in each
outcome and the difference that remains after statistically adjusting for differences in
underlying arrest charges, criminal justice status at the time of arrest, the extent of pre-trial
detention, and criminal history on the disposition outcome. In most instances the figures
reveal that disparities in outcomes can be largely attributed to differences in case
characteristics.
Figures ES3 through ES5 are constructed as follows. Using the left side of Figure ES3 as
an example and focusing on the highest marker for Black arrestees at the top of the figure, the
blue dot in the middle of the blue bar marks the differences in the proportion of cases where
charges are not filed or where the case is dismissed between Black and White defendants (with
the value measured along the horizontal axis on the bottom of the graph). Hence, the raw
difference in this variable for Black defendants relative to White defendants is approximately
0.02 (i.e., Black defendants are roughly 2% points less likely to have a case dismissed or not filed).
The horizontal line passing through the dot shows the margin of error within which we are fairly
certain that the true value of the differential lies. A shorter line indicates a more precisely
measured difference. The vertical line at zero allows one to visibly position the difference given
by the dot relative to the no-effect value (i.e., zero). Moreover, if the line indicating zero is
outside of the margin of error, we can conclude that the racial disparity is statistically and
significantly different from no difference. Within each racial group the figure presents two
estimates: (1) the raw difference in the outcome, and (2) the difference that remains after

7
statistically adjusting for racial differences in arrest charges, active criminal justice status, pre-
trial detention, and criminal history.
In Figure ES3 we see that once we account for differences in case characteristics, Black
defendants are slightly more likely to have their cases dismissed or to not have charges filed
relative to White defendants. Similarly, we find no remaining difference in the likelihood of a
successful diversion once these case characteristic are taken into account. This general pattern
is repeated for each of the disposition outcomes. Raw differences reveal disparities that tend to
disfavor non-White defendants. Statistical adjustment for case characteristics explains most of
the observable disparity, and in many instance explains all of an observable disparity.
Figure ES3: Racial Disparities in Case Disposition Outcomes Relative to White Suspects with and without Controls for Arrest Charges, Criminal Justice Status at Arrest, Detention through Arraignment, and San Francisco and Statewide Criminal History
Notes: The dots in the figure represent estimates of the difference in the outcome relative to whites. The line through the dot demarks the 95 percent confidence interval for the estimate.
Black
Hispanic
Asian
-.1 -.05 0 .05 -.1 -.05 0 .05
Case not filed or dismissed Diversion
No statistical controlsInclusive of statistical controls
Difference relative to whites

8
Figure ES4: Racial Disparities in the Likelihood that a Felony Arrest Results in the Filing of Felony Charges and a Felony Conviction with and without Controls for Arrest Charges, Criminal Justice Status at Arrest, Detention through Arraignment, and San Francisco and Statewide Criminal History
Notes: The dots in the figure represent estimates of the difference in the outcome relative to whites. The line through the dot demarks the 95 percent confidence interval for the estimate.
Figure ES5: Racial Disparities in Average Sentence for Those Convicted and Racial Disparities in the Likelihood that an Arrest Results in a Prison Sentence With and Without Controls for Arrest Charges, Criminal Justice Status at Arrest, Detention through Arraignment, and San Francisco and Statewide Criminal History
Notes: The dots in the figure represent estimates of the difference in the outcome relative to whites. The line through the dot demarks the 95 percent confidence interval for the estimate.
Black
Hispanic
Asian
-.02 0 .02 .04Difference relative to whites
No statistical controls
Inclusive of statistical controls
Felony Arrests Resulting in Felony Charges Filed
Black
Hispanic
Asian
-.02 -.01 0 .01 .02Difference relative to whites
No statistical controls
Inclusive of statistical controls
Felony Arrests Resulting in Felony Conviction
Black
Hispanic
Asian
-1 0 1 2 3 4Difference relative to whites
No statistical controls
Inclusive of controls for pre-determined factors
Inclusive of controls for pre-determined factors and filing choices
Sentence Length for Those Convicted
Black
Hispanic
Asian
-.005 0 .005 .01Difference relative to whites
No statistical controls
Inclusive of statisitical controls
Likelihood of Receiving a Prison Sentence

9
CONCUSION #4: Pre-trial detention, criminal history, and criminal justice status at time of
arrest generate relatively worse outcomes for Blacks relative to Whites. Asian-White
disparities in outcomes are due almost entirely to differences in arrest charges. The patterns
displayed in Figures ES3 through ES5 suggest that the observed differences in case disposition
outcomes between racial and ethnic groups can be explained by observable case characteristics
related to criminal history, the seriousness of the alleged offense, and whether the individual is
detained pre-trial. The relative contributions of these factors varies across groups and depends
on the average difference between groups in a specific factor (such as prior felony conviction)
and how those factors impact case outcomes.
Tables ES2 through ES4 qualitatively summarize the role of these factors in explaining
differences in outcomes for a given group relative to Whites. For each of the disposition
outcomes, the tables first list whether a difference disfavors the non-White group, and then
provides information about the contribution of each set of factors on aggravating (marked with
an “A”), mitigating (marked with an “M”), or having no measurable effect (marked by “NE”) on
the difference relative to Whites. The table also notes whether a difference disfavoring the non-
White group remains after adjusting for these factors, and the proportion explained by
observable case characteristics.
There are several patterns that emerge from this summary. Criminal history, pre-trial
detention, and criminal justice status at the time of arrest tend to aggravate disparities in
outcomes between Black and White defendants, while differences in arrest charges have

10
inconsistent effects across outcomes. Differences in arrest charges tend to aggravate Asian-
White disparities while difference in criminal justice status at the time of arrest tend to mitigate
Hispanic-White disparities. While there are a few outcomes where observable characteristics do
not entirely explain observed differentials, many of the differentials are fully explained by case
characteristics.
Table ES2 Summary of the Effects of Case Characteristics on Black-White Disparities in Case Disposition Outcomes Charges
not filed, case dismissed
Successful diversion
Felony charges filed
Felony conviction
Average sentence for those convicted
Likelihood of prison sentence
Differential disfavoring Black defendants?
Yes Yes Yes Yes Yes Yes
Contribution of difference in arrest charges
M M A A A A
Contribution of difference in CJ status
A A M M A A
Contribution of difference in pre-trial detention
A A A A A A
Contribution of differences in criminal history
A A M A A A
Residual differential favoring white defendants?
Yes No No No No Yes
% explained by case characteristics if residual difference remains
82% - - - - 86%
A – Difference in case characteristics category aggravates the Black-White differential. M – Difference in case characteristics category mitigates the Black-White differential. NE – No significant effect of case characteristics category on Black-White differential.

11
Table ES3 Summary of the Effects of Case Characteristics on Hispanic-White Disparities in Case Disposition Outcomes Charges
not filed, case dismissed
Successful diversion
Felony charges filed
Felony conviction
Average sentence for those convicted
Likelihood of prison sentence
Differential disfavoring Hispanic defendants?
No No Yes No Yes Yes
Contribution of difference in arrest charges
A A A M A A
Contribution of difference in CJ status
M M A A M M
Contribution of difference in pre-trial detention
M NE NE NE A A
Contribution of differences in criminal history
M M A NE A A
Residual differential favoring white defendants?
No No No No No No
% explained by case characteristics if residual difference remains
- - - - - -
A – Difference in case characteristics category aggravates the Hispanic-White differential. M – Difference in case characteristics category mitigates the Hispanic-White differential. NE – No significant effect of case characteristics category on Hispanic-White differential.

12
Table ES4 Summary of the Effects of Case Characteristics on Asian-White Disparities in Case Disposition Outcomes Charges
not filed, case dismissed
Successful diversion
Felony charges filed
Felony conviction
Average sentence for those convicted
Likelihood of prison sentence
Differential disfavoring Asian defendants?
Yes No Yes No No No
Contribution of difference in arrest charges
A A NE NE NE A
Contribution of difference in CJ status
M M A A M M
Contribution of difference in pre-trial detention
A NE M M NE A
Contribution of differences in criminal history
NE M A M NE NE
Residual differential favoring white defendants?
Yes No Yes No No No
% explained by case characteristics if residual difference remains
80% - 0% - - -
A – Difference in case characteristics category aggravates the Asian-White differential. M – Difference in case characteristics category mitigates the Asian-White differential. NE – No significant effect of case characteristics category on Asian-White differential.

13
CONCLUSION #5: The passage and implementation of California Proposition 47 in November of
2014 narrowed racial disparities in outcomes. This narrowing appears to operate through a
diminished effect of pre-trial detention and criminal history in determining case outcomes.
Proposition 47 redefined several low level felony offenses that may be charged as either a felony
or misdemeanor to misdemeanors. The effects of the proposition on the state’s prison
population and the population of county jails were felt immediately. Given that our study period
spans the implementation of proposition 47, we are able to assess how the implementation of
this change impacts racial disparities in case outcomes and disproportionality more generally.
We observe that the proportion of defendants that are Black declines with the implementation
of proposition 47. We also observe declines for all groups in the proportion of arrests that are
felony arrests.
For nearly all disposition outcomes, racial disparities narrow with the passage of
proposition 47. In addition, the relative contribution of case characteristics that tend to
exacerbate racial disparities also diminish. To illustrate, Table ES5 present the overall difference
in average sentence length for convicted Black, Hispanic, and Asian defendants relative to White
defendants. The table presents the average differences for cases with arrest dates before
proposition 47 and after proposition 47. The table also presents the contribution of differences
in arrest charges, criminal justice status at time of arrest, pre-trial detention, and criminal history
to the overall racial disparity, with the remaining unexplained difference presented at the
bottom. Several notable patterns are evident in this table. First, raw racial disparities decline by
nearly 50 percent. Second, the factors that tend to be more prevalent in cases involving Black
defendants (active criminal justice status, prior criminal convictions and arrests, pre-trial
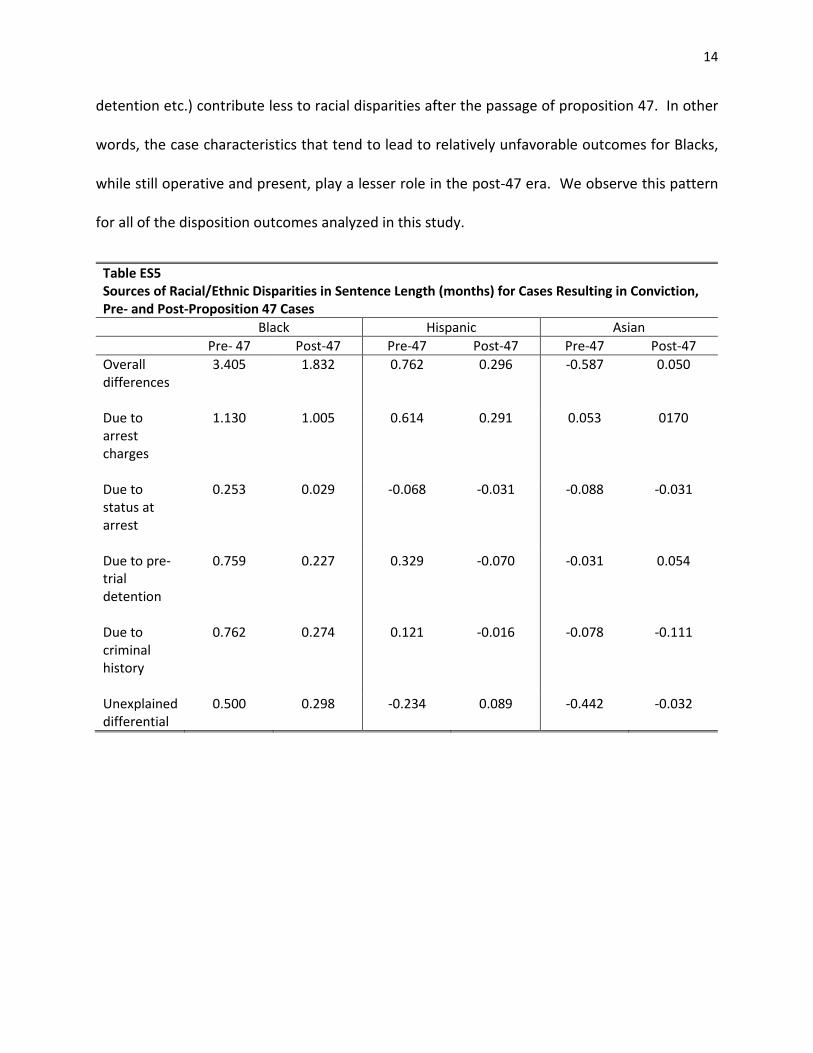
14
detention etc.) contribute less to racial disparities after the passage of proposition 47. In other
words, the case characteristics that tend to lead to relatively unfavorable outcomes for Blacks,
while still operative and present, play a lesser role in the post-47 era. We observe this pattern
for all of the disposition outcomes analyzed in this study.
Table ES5 Sources of Racial/Ethnic Disparities in Sentence Length (months) for Cases Resulting in Conviction, Pre- and Post-Proposition 47 Cases Black Hispanic Asian Pre- 47 Post-47 Pre-47 Post-47 Pre-47 Post-47 Overall differences
3.405 1.832 0.762 0.296 -0.587 0.050
Due to arrest charges
1.130 1.005 0.614 0.291 0.053 0170
Due to status at arrest
0.253 0.029 -0.068 -0.031 -0.088 -0.031
Due to pre-trial detention
0.759 0.227 0.329 -0.070 -0.031 0.054
Due to criminal history
0.762 0.274 0.121 -0.016 -0.078 -0.111
Unexplained differential
0.500 0.298 -0.234 0.089 -0.442 -0.032

15
1. Introduction
Racial and ethnic minorities are heavily over-represented among those involved with the
criminal justice system in the United States. For example, Blacks account for nearly 27 percent
of arrests,1 35 percent of the population of local jails (Minton and Zeng 2015), and 35 percent of
the prison population (Carson and Anderson 2016). Yet Blacks make up only 13 percent of the
general population.2 Racial disparities in incarceration are particularly large, as Blacks are
incarcerated in state or federal prisons at a rate that is nearly seven times that for Whites, and
slightly over twice the rate for Hispanics.3 Yet, simple comparisons of Black-White differences
in the ratio of criminal justice contact relative to the population don’t adequately address the
sources of these disparities or whether they are unjust. After all, the U.S. arrest and prison
population is not a random sample of the residential population. These issues have been well
known for decades (Blumstein et al. 1983), but disagreement remains on the size and the sources
of racial disparities in criminal justice. There are, for example, also large racial disparities in the
likelihood of becoming a crime victim. The rate of non-homicide violent victimization for Blacks
in 2015 was 130 percent the rate for Whites (Truman and Morgan 2016). In 2015, Blacks
comprised 52 percent of homicide victims4 and were murdered at a rate nearly seven times that
of Whites.
1 See https://ucr.fbi.gov/crime-in-the-u.s/2015/crime-in-the-u.s.-2015/tables/table-43, accessed on April 10, 2017. 2 See https://www.census.gov/quickfacts/table/PST045216/00, accessed on April 10, 2017 3 The number of state and federal prisoners per 100,000 U.S. residents was 2,228 for Blacks, 319 for whites, and 1,084 for Hispanics (Carson and Anderson 2016). 4 See https://ucr.fbi.gov/crime-in-the-u.s/2015/crime-in-the-u.s.-2015/tables/expanded_homicide_data_table_1_murder_victims_by_race_ethnicity_and_sex_2015.xls, accessed on April 10, 2017.

16
There are similar racial disparities in criminal justice involvement and victimization rates
within the City and County of San Francisco. As of the 2010 census, Blacks accounted for roughly
6 percent of the county’s population. By contrast, between 2008 and 2014 Blacks accounted for
41 percent of those arrested, 43 percent of those booked into jail, 38 percent of cases filed by
the Office of the District Attorney, and 39 percent of new convictions.5 Similar to the national
statistics, Blacks accounted for half of homicide victims for homicides occurring within the City
and County of San Francisco.6
Differences by race and ethnicity in the extent of involvement with the criminal justice
system are the result of differences in offending patterns, differences in treatment by law
enforcement and other agents of the criminal justice system, disparate impacts across groups of
policies and practices applied in a race-neutral manner, or some combination thereof. Early
reviews of racial disparities do document differences in offending levels (Hindelang, 1978;
Sampson and Lauritsen 1997, Tonry 1995), with relatively higher rates of offending among Blacks
relative to Whites. For example, 36 percent of robbery victims in 2006 report that the offender
was Black (Bureau of Justice Statistics, 2008). More recently, O’Flaherty (2015, chapter 11)
documents higher offending rates among Blacks for homicide and robbery based on official
homicide reports and victimization survey data. Raphael and Rozo (2017) find racial and ethnic
disparities in the severity of arrest charges among youth arrested in California, with Black youth
more likely to be arrested for felonies relative to White and Latino youth. Evidence regarding
5 This figure for total arrests comes from tabulations by the authors using data from California’s Monthly Arrest and Citation Register. The remaining figures are from tabulations of the administrative data used for this study. 6 This figure comes from our tabulations of the Supplemental Homicide Report Files from the Federal Bureau of Investigation for the years 2008 through 2013.

17
differences in offending for other ethnic groups is more mixed. Foreign born individuals, for
example, offending rates appear to be lower relative to the native born.7 Such racial and ethnic
differences in offending rates and severity translate directly into differences in criminal justice
involvement.
On the other hand, there is ample research documenting disparities in treatment by the
criminal justice system that cannot be explained by observable aspects of the underlying criminal
incident. For example, Rozo and Raphael (2017) find that Black and Latino youth arrests are
considerably more likely to be officially booked relative White youth arrests after accounting for
the youth’s age, most serious arrest charge, and prior arrest history. Moreover, police agencies
that patrol cities with larger minority populations have substantially higher youth booking rates
than agencies that patrol cities with relatively smaller minority populations. Starr and Rehavi
(2014) find that U.S. Attorneys covering federal districts with larger minority populations
prosecute otherwise similar cases more aggressively. They also find that after accounting for
differences in the arrest charges recorded by the U.S. Marshal’s Service, U.S. Attorneys are more
likely to file charges triggering mandatory minimum sentences for cases involving Black
defendants, resulting in on average 10 percent longer sentences. Mustard (2001) documents
racial disparities in sentences handed down by federal judges that cannot be explained by
difference in offense severity and criminal history. Mustard also documents racial disparities in
the propensity to downward depart from the sentencing guidelines in exchange for substantial
7 For example, Butcher and Piehl (2008) find that the foreign born are less likely to be incarcerated than the native born and that difference appears to be due to selective migration of the law abiding to the United States and a greater responsiveness to deterrence among immigrants in the U.S. Kneebone and Raphael (2011) document larger declines in crime between 1990 and 2008 in cities where the proportion foreign born increased.

18
assistance in the prosecution of another. As a final example, Ayres and Waldfogel (1994) present
evidence from the early 1990s that judges in New Haven, Connecticut set bail amounts that are
excessive relative to the risk of pre-trial misconduct for Black relative to White criminal
defendants.
There are many examples of policies that may be applied in a race-neutral manner yet
yield racially disparate impacts in criminal justice involvement. Perhaps the most salient example
in U.S. federal sentencing policy concerns the higher sentences meted out for crack-cocaine
offenses (for which Blacks are more likely to be charged and convicted) relative to powder-
cocaine offenses (which are more likely to involve White offenders). A further example comes
from the growing body of quasi-experimental research finding that pre-trial detention increases
the likelihood of conviction (Dobbie, Golden, and Yang 2016; Heaton, Mayson, and Stevenson
2017; Stevenson 2017) and may even increase the likelihood of future offending (Heaton,
Mayson, and Stevenson 2017). To the extent that racial differences in average income lead to
racial disparities in the ability to make bail, even a race-neutral process for determining who is
and who is not detained pre-trial may result in a racially disparate impact in detention and the
likelihood of conviction. In federal sentencing, Fischman and Schanzenbach (2012) find that the
greater discretion afforded to federal judges following the 2005 Supreme Court decision in U.S.
vs. Booker did not moderate sentences for convicted Black relative to White defendants. This
differential was due largely to the fact that Black defendants in federal court are more likely to
be charged with and convicted of a crime triggering a mandatory minimum sentence that
subsequently constrains from below the sentencing options available to judges. In California,
MacDonald, Arkes, Nicosia, and Pacula (2014) find that Blacks are nearly twice as likely as Whites

19
to be sentenced to prison for a drug offense between 1995 and 2005, but that this difference is
completely explained by differences in criminal history factors and the seriousness of the
arresting offenses. In particular, Blacks were more likely to have prior violent felony arrests and
active probation violations. A higher prevalence of prior arrests and convictions for violent
offenses among Blacks will by statute increase the chance that they will be sent to prison, even
if decisions about prosecution and sentencing are applied in a race-neutral manner.
In this project, we document and explore the sources of racial disparities in outcomes for
criminal cases that are presented to and/or prosecuted by the office of the San Francisco District
Attorney (SFDA). We assess the degree to which observed racial disparities are attributable to
characteristics of the cases that are presented to the SFDA (for example, arrest charges, criminal
justice status, criminal history) as opposed to aspects of case processing that generate racially
disparate impacts. We also explore the extent to which racial disparities remain after statistically
adjusting for case characteristics and specific case processing aspects (for example, the extent of
pre-trial detention). The study merges administrative data from the SFDA case management
system, data form the San Francisco County Court Management System, data on jail admission
and release from the San Francisco Sheriff’s Department, and statewide criminal history data
from the California Department of Justice.
Our principal findings indicate that racial disparities in criminal case outcomes in San
Francisco are driven mostly by the seriousness of the arresting offense, prior criminal history, and
pretrial detention. The passage of Proposition 47 appears to have narrowed much of these
disparities through minimizing the impact of pretrial detention and criminal history in influencing
court dispositions. The following specific list of conclusions can be drawn:

20
• There are racial disparities in case disposition outcomes that tend to disfavor Blacks,
Asians, and Hispanics relative to White suspects arrested within San Francisco. Black
suspects are less likely than Whites to have their cases dropped, dismissed, or successfully
diverted, and more likely to be released to another criminal justice agency or have a
motion to revoke filed against them as a result of arrest. When convicted, Blacks are more
likely than Whites to receive prison sentences and sentences of longer durations. Asian
suspects relative to Whites also face a significantly lower likelihood of having their case
dismissed and a higher likelihood of conviction. Broad disposition outcomes, including
cases being dropped, dismissed, or diverted, are fairly similar for Hispanic and White
suspects.
• Nearly all of the racial disparities in prosecution and court disposition outcomes can be
attributed to average differences in case characteristics that are determined prior to a
case being presented to the office of the SFDA as well as differences in the prevalence
of pre-trial detention. There is substantial variation across cases presented to the SFDA
in the arrest charges, criminal justice status of individuals at the time of arrest (e.g.,
whether they have another open case or are on probation), criminal history, and whether
the suspect is being detained. These factors are all strongly related to case disposition
outcomes. Moreover, there are large racial and ethnic disparities in these factors. For
example, Black suspects are considerably more likely relative to White suspects to have
an active criminal justice status at the time of arrest, to be in detention, and to have a
lengthy criminal history. Asian suspects are more likely relative to White suspects to have

21
been arrested for a serious felony. Statistical adjustment for these differences in case
characteristics explains most if not all of the unadjusted disparities in case outcomes.
• Pre-trial detention, criminal history, and criminal justice status at time of arrest
generate relatively worse outcomes for Black suspects. Black suspects are more likely
to be booked at arrest and more likely to be detained at the time that a case is presented
to the SFDA relative to other racial and ethnic groups. This is statistically associated with
a lower likelihood that a case is dropped and increases the chance of felony charges being
filed, being convicted, and in some instances longer sentences. Differences in criminal
history are key contributors to the relatively poor outcomes for Black suspects and
defendants.
• Asian-White disparities in outcomes are due almost entirely to differences in arrest
charges. We observe very large Asian-White differentials in conviction rates. We also
observe big difference in the list of charges recorded by police officers between Asian and
Whites suspects. We do not observe large disparities however, in criminal history, pre-
trial detention, or criminal justice status at the time of arrest. Nearly all, and for many
outcomes, all of the Asian-White disparities are driven by average differences in the
severity of arrest charges.
• The passage and implementation of California Proposition 47 in November of 2014
narrowed racial disparities in outcomes. This narrowing appears to operate through a
diminished effect of pre-trial detention and criminal history in determining case
outcomes. We document declines in racial disparities in the likelihood that an arrest is
booked into jail, that cases are dropped, that a case results in a conviction, and in
22
sentences for those convicted. It is still the case, post-proposition 47, that pre-trial
detention and a prior criminal history works to the disadvantage of criminal suspects.
However, the degree to which these factors contribute to sentencing outcomes
diminishes. Moreover, the diminished impact of these pre-determined factors favors
Blacks and contributes to the narrowing of the gap in case outcomes.
• After adjusting for differences in pre-determined case characteristics and the extent of
pre-trial detention, we find little evidence of racial disparities in the likelihood that a
case filed by the SFDA is dismissed by the court. Research on unwarranted racial
disparities in the criminal justice system often tests for differences in outcomes that are
suggestive of individuals from a specific group being held to a different standard. We
devise the following outcome test for cases filed by the SFDA. To the extent that the SFDA
is differentially filing cases in a discriminatory manner, one should observe disparities by
the race/ethnicity of the defendant in the likelihood that the case is rejected by the court.
After statistically adjusting for pre-determined case characteristics, we find little evidence
in support of this hypothesis.
2. Description of the Case Processing Flow and the Data Used in This Study
In the following section we discuss the case process flow and data used in this study.
Criminal cases generally begin with an arrest. Arrests may result in either a booking into a county
jail, a street citation and release, or an informal release with warning and no further actions. For
those cases generating a booking or a street citation the majority are referred to the district
attorney (DA), with nearly all felony arrests referred to the DA and a subset of misdemeanor

23
arrests referred at the discretion of the police. For referred cases, the DA’s office may choose to
file charges, may release the individual to another agency such as a local probation department,
state parole, or another county’s district attorney pursuing a separate case, or dismiss the
charges altogether. For filed charges, there are many potential outcomes. The defendant’s case
may be dismissed at a later date either by the court or the DA. The defendant may be referred
to a diversion program8 and, in the event that the program is successfully completed, avoid
conviction. The defendant may be convicted of the crime either through a plea agreement or via
trial, or the defendant may be found not guilty. For those who are convicted, sentencing
outcomes range from fines to a probation term, to jail time coupled with probation, to a state
prison sentence. As we will see shortly, the most severe sentencing outcomes tend to be the
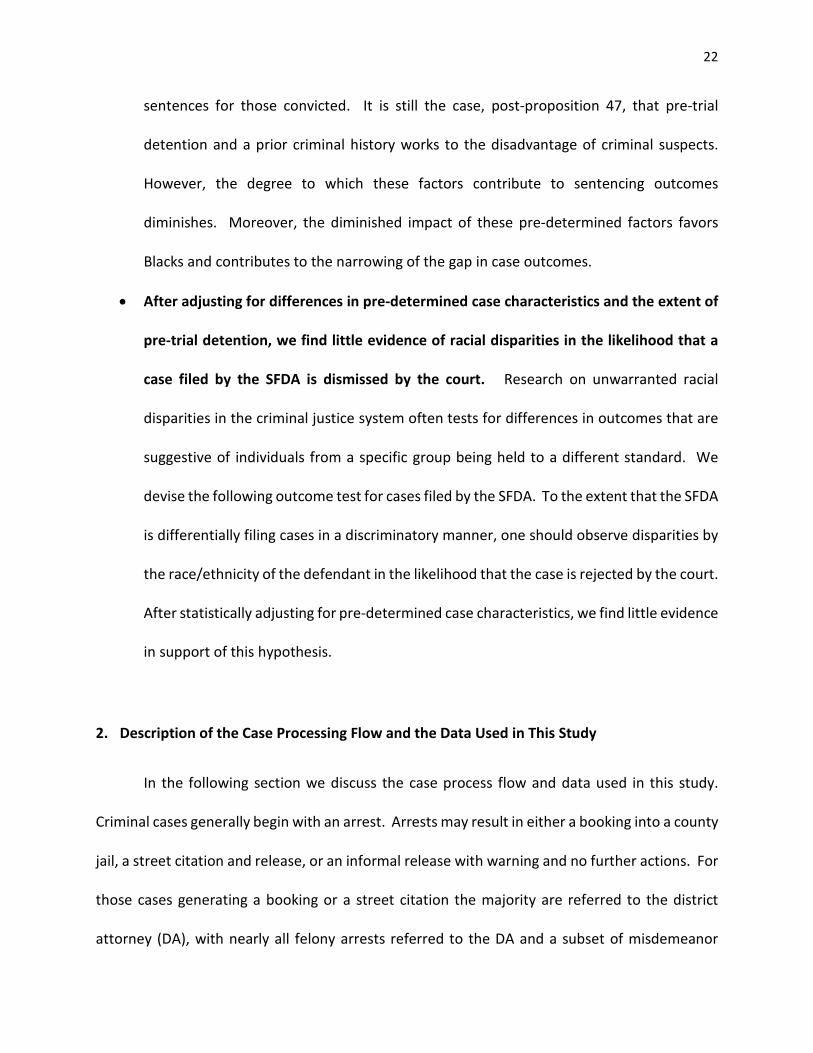
least likely. Figure 2.1 shows a schematic of the standard flow of criminal case processing and
key agencies in determining outcomes.
Figure 2.1 Criminal Case Processing Flow
8 Many defendants are automatically eligible for pretrial diversion based on their offense charges and prior criminal history. Conversely, many defendants are conditionally eligible based on mitigating circumstances. Of course, there are many defendants for whom the alleged offense, prior criminal history, or current criminal justice status renders them ineligible for pre-trial diversion. Diversion programs in San Francisco operate through the San Francisco Collaborative Court System, comprised of a set of specialty courts devoted to adults (such as the Behavioral Health Court, the Drug Court, and the Intensive Supervision Court), families and juveniles, and devoted to wellness programs in the juvenile justice system.
Arrest Booking
Citation
Informal
Charge Diversion
Conviction
Dismissed
Prison
Jail
Probation
SFPD SFDA Superior Court

24
The manner in which these steps are recorded in official administrative records is complex
and involves multiple criminal justice agencies. An arrest generates an incident number that may
apply to multiple criminal suspects, but typically involves only one. The actual criminal act as
observed and recorded by the police is summarized through a series of arrest charges, where
there are often multiple charges per incident. The actual alleged criminal activity associated with
an arrest is assigned a court or docket number that uniquely identifies person-specific cases that
may be referred to the DA for further action. Single arrest incidents may involve multiple court
numbers. For example, someone arrested for shoplifting who is on probation for an earlier
offense will pick up new charges on the old case (which is referenced under the court number
assigned at the initial arrest date for the earlier offense) and new charges for the current activity.
In this example, the arrest incident will list multiple charges nested within the two separate court
numbers. Other situations may lead to multiple arrests for a single court case and multiple court
numbers per arrest. For example, a failure to appear for a court date may lead to an arrest
warrant and a subsequent arrest. An arrest for activities observed by the police that occur while
a separate case is being processed may generate charges for the new offense, and new charges
on the old offense for pre-trial misconduct. Someone who is arrested with an open case and is
on probation for an earlier offense may generate an arrest with new charges accumulating on
three separate court numbers. As one can imagine, there are many such instances recorded in
San Francisco’s administrative data especially for those individuals who are frequently arrested.
The unit of analysis that is most relevant to the workflow and decision-making of the SFDA
is the criminal case as indexed by the court-number. While a given defendant may have multiple
open cases at any given time, and cases may be combined at sentencing or sometimes dismissed

25
at intake to focus on more serious charges from a separate incident involving the same
defendant, the court number is the most intuitive way to structure our analysis. We construct a
data set from administrative case records in the following manner. We identify all of the charges
accumulated on a given court number. We use the most serious charge to link the court number
to a specific arrest date. This is functionally equivalent to attaching each court number to the
earliest arrest date for the case. Next, we identify the seven most serious arrest charges
associated with a given court number, regardless of whether all charges are accumulated in one
arrest or across multiple arrests, and use these arrest charges to characterize the nature of the
alleged offense as recorded by the arresting officer. The overwhelming majority of cases involve
seven or fewer arrest charges.
We use the data constructed from arrests where the court number defines the unit of
analysis as the scaffolding from which we build out the remainder of the data set. We then
merged information on charges filed by the SFDA (if any), the disposition of each charge, and
sentencing information when relevant. In addition, we merged information on whether the
individual was booked into jail, how long they were detained, and the reason for release for the
arrest generating the original court number. We also merged data to each arrest from the
individual’s California criminal history record as of the date of the arrest and use the San Francisco
administrative data to generate a local criminal history for all recorded incidents occurring from
2008 onwards. Our final dataset has one record per court number and includes demographic
information, information on pre-trial detention and booking, information on specific arrest
charge, information on filed charges, case disposition outcomes, sentencing outcomes, and
various measures of the individual’s local and statewide criminal history at the time of arrest.
26
The data for this project comes from several administrative sources. First, we were
provided with arrest-level data and data on charges filed from the SFDA’s DAMION case
management system and San Francisco County’s Court Management System. These data cover
all arrests and court dispositions occurring between 2008 and July 2016. In addition to complete
lists of arrest charges and charges filed, these data also include information pertaining to the
disposition of each charge, demographics about the individuals (age, gender, race), personal
identifiers that we use to impute Hispanic ethnicity,9 and sentencing details for those convicted.
Second, the San Francisco Sheriff’s Department provided us with data on all bookings into county
jail from 2010 through 2017. These data included admissions date, admissions reason, the court
numbers associated with the incident, the reason for the booking and jail admission, the release
date, and finally the release reason. Third, the California Department of Justice provided data on
the full criminal histories of each individual in our analysis sample through 2017. The Automated
Criminal History record system includes all arrest and criminal dispositions reported to the
Department of Justice from criminal justice agencies within California. We use these data to
construct complete California criminal histories at the time of arrest for each of the cases in our
analysis period.
9 We use a data set constructed by the U.S. Census Bureau that calculates for each surname in the United States for which at least 100 people have the surname the proportion of individuals who self-identify as Hispanic. The names data base covers the surnames of roughly 90 percent of the U.S. resident population. We merge this data set to the administrative data by surname. We identify as Hispanic all individuals with surnames where the proportion who self-identify as Hispanic is 85 percent or higher.

27
3. Basic Patterns in Arrests, Arrest Processing, the SFDA’s Caseload, and Case Dispositions
Our introductory discussion noted that there are important differences in the average
characteristics of the cases involving defendants from different racial and ethnic groups, with the
defendants in some groups, on average, arrested for more serious offenses and having more
extensive criminal histories than others. Of course, there is enormous heterogeneity within racial
and ethnic groups in the severity of offenses and criminal history. There certainly are Black
defendants arrested for relatively less serious offenses with little to no criminal history as well as
White defendants arrested for very serious offenses with lengthy criminal history records and
visa-versa. Nonetheless, average differences across groups in case characteristics will translate
into average differences in disposition and sentencing outcomes.
Ultimately, we will present a statistical analysis of racial and ethnic disparities in case
outcomes that uses multivariate regression methods to statistically adjust for differences in the
nature of criminal cases between groups. Here, however, we begin by creating an empirical
portrait of the cases presented to the SFDA. The purpose of this section is to provide a baseline
characterization of how criminal suspects and defendants of different racial and ethnic groups
differ on average in terms of the nature of the alleged offense, criminal history, pre-trial
detention outcomes, and ultimate case outcomes. This baseline characterization will
demonstrate how cases differ in terms of the case characteristics that are determined prior to
presentation to the SFDA, and also provides a benchmark comparison of outcomes disparities
against which we will compare the disparities that remain after statistical adjustment for case
characteristics.
28
A. Difference in offending frequency, offense severity, and criminal history
Generally speaking, more serious offenses are more likely to be pursued by the SFDA,
more likely to result in a conviction, and on average more likely to result in more severe
punishment. Moreover, criminal defendants with more extensive criminal histories are more
likely to fare poorly. They may be ineligible for diversion, may be less likely to receive the benefit
of the doubt at the filing stage, may be eligible for supplemental charges associated with their
prior criminal histories, and may be sentenced more harshly when judges have the discretion.
Here we document racial disparities in the nature of arrest offenses and criminal history
that we observe in the SFDA caseload. We begin by describing the racial composition of criminal
suspects involved in the cases presented to the SFDA by police departments in San Francisco
County. The first column of Table 3.1 presents the breakdown of criminal suspects associated
with each court number originating between 2008 and July 2016. We define six mutually-
exclusive racial/ethnic groups, with four racial groups for non-Hispanic suspects (White, Black,
Asian, Other) and a separate category for Hispanic defendants. Non-Hispanic Blacks account for
the largest single share of cases (42.3 percent), followed by Whites (32.8 percent), and then
Hispanics (14.3 percent), with these three groups accounting for slightly over 90 percent of cases.
Black accounted for only six percent of the resident population of San Francisco.10 The second
and third columns present comparable figures for cases with arrest dates preceding the passage
10 Among the roughly two-thirds of cases that are booked following arrest, we are able to observe the addresses of the suspects. These data reveal that over a fifth of those arrested and booked are not San Francisco residents. Hence, if there are racial disparities in the proportion of arrestees who do not reside in the city, the actual over-representation of Blacks may differ from what is implied by Table 3.1. Among the sample for whom we can observe home address the percent who do not live in the city is 78 for Whites, 80 for Blacks, 73 for Asians, and 72 for Hispanics.

29
of Proposition 47 and cases following the passage of the proposition. The most notable pre-post
47 change is that the percent of cases where the suspect is Black declines from approximately 43
to 38 percent. This five percentage point decline is offset by slight increases in percentages Asian,
other, and Hispanic.
The fourth column of figures tabulates the racial distribution of criminal suspects in a
slightly different manner. Rather than tabulating the distribution for criminal cases we tabulate
the racial distribution for unique suspects, effectively accounting for the fact that many
individuals in the data are observed with more than one court number over our observation
period. Black defendants account for 31 percent of unique suspects. This lower number relative
to the Black percentage of cases reflect the fact that the average Black defendant accumulated
more cases relative to other groups (with 2.6 cases per Black defendant, on average). In contrast,
the proportion of unique criminal suspects that are Hispanic is higher than the proportion of
cases involving a Hispanic suspect, as the average number of cases per Hispanic suspect is
relatively low (average cases per suspect are presented in the final column).
Similar to many other jurisdictions, a relatively small share of criminal suspects account
for a disproportionate share of cases presented to the SFDA. This is clearly visible in Figure 3.1.
The figure presents the relationship between the proportion of cases accounted for by a given
proportion of suspects after sorting the data from the most to least active. The vertical axis
measures the proportion of all cases while the horizontal axis measures the proportion of all
suspects. The coordinates associated with a specific point on the plotted line shows the
proportion of cases (read off the vertical axis) that is attributable to a given proportion of the
most active suspects (read off the horizontal axis). The figure indicates that the roughly five
30
percent of suspects with the most cases filed against them between 2008 and mid years 2016
account for slightly more than 30 percent of all cases presented to the SFDA. Similar, the most
active 30 percent of suspects account for nearly 65 percent of cases presented to the SFDA. The
figures in Table 3.1 suggest that Black and White suspects tend to be over-represented among
those who accumulate more than one case and in turn account for a disproportionate share of
cases, while Asian and Hispanic suspects tend to be under-represented among the group of
suspects with multiple cases.
Tables 3.2 and 3.3 characterize the severity of the cases in terms of the most serious arrest
charge. Table 3.2 presents figures for all cases in our observation period while Table 3.3 presents
comparable tabulations for the pre and post-Proposition 47 periods. We present the percent of
cases by most serious arrest charge for each racial/ethnic group. Here we exclude the small
group of cases involving individuals in the “other race” category.11 In table 3.2 we see some
notable differences in offense severity, with Asian and Black suspects most likely to be arrested
for a felony, followed by Hispanic and White suspects. Within specific offense categories, Asians
are the most likely to be arrested for a violent felony offense (indicated by a person-based
offense under the felony category) followed by Hispanic and Black suspects. Black suspects are
by far the most likely to be arrested for a felony drug offense.
In table 3.3, we observe declines in the proportion of cases with felony arrest charges
among Whites, Black, and Hispanic suspects, but not Asian suspects associated with the passage
of proportion 47. The declines in the proportion of felony cases in the SFDA’s workload are driven
11 Given the great heterogeneity in this catchall residual racial category, and the relatively small share of cases coded as such, our formal analysis focuses on White, Black, Asian, and Hispanic suspects and defendants.

31
primarily by declines in the proportion of cases that involve felony drug arrests. For example,
while roughly 23 percent of cases involving Black defendants involved a felony drug arrest charge
in the pre-47 period, this figure falls to 9 percent following the proposition’s passage. We see
similar declines in the relative importance of felony drug arrests for all of the other racial and
ethnic groups.
Table 3.4 presents further comparisons of case characteristics by race and ethnicity.
Specifically, the table presents information on the average number of arrest charges associated
with each court number, whether the individual has an active criminal justice status at the time
of arrest, and a summary of past arrests and convictions occurring within the City and County of
San Francisco since 2008 (the beginning of our observation period). The local criminal history
variables measures prior arrests and convictions within San Francisco at the time of arrest. For
these variables, criminal history is calculated for cases commencing in 2010 or later to assure that
we have at least two years of data for which to observe local criminal activity.
Table 3.4 reveals several racial/ethnic disparities in other aspects of the cases presented
to the DA. While the number of arrest charges associated with a given incident does not vary
appreciably across groups, cases involving Blacks are considerably more likely to involve more
than one court number, suggesting that they are more likely to have an open case or be on
probation in San Francisco at the time of arrest. Fully 35 percent of cases involving Black suspects
have more than one court number compared to 22 percent of cases with White suspects, 20
percent of cases involving Asian suspects, and 19 percent of cases involving Hispanic suspects.
Black suspects are more likely to have prior convictions, prior jail sentences in San Francisco, and
a prior prison sentence handed down by a San Francisco court. Blacks also have more prior

32
arrests within each of the offense-type categories listed in Tale 3.4. As a final characterization of
criminal history within the city, we tabulated the proportion of cases where at the time of the
arrest there were no prior arrests or convictions in San Francisco from 2008 on. For White
suspects, 48 percent have no prior San Francisco criminal history. The comparable figures for
Black, Asian, and Hispanic suspects are 30 percent, 59 percent, and 56 percent respectively.
Our characterization of criminal history using available San Francisco data is by
construction incomplete. First, we only observe data from 2008 onwards and thus will miss any
arrests or convictions that occur within San Francisco prior to the beginning of our study period.
Second, individuals often have criminal histories in several counties, and in many instances
several states. To address this issue, we requested and were granted access to the criminal
history records of each of the individuals in our data set maintained by the California Department
of Justice in the Automated Criminal History System (ACHS). The ACHS data includes information
on arrests, convictions, and prison admissions occurring in any of California’s 58 counties. The
data are structured in cycles, with an incident leading to an arrest opening the cycle and
subsequent pertaining actions, inclusive of further arrests, case dispositions, sentences, prison
admissions and releases, or actions by an appeals court, being recorded within an open cycle.
We use these data to more fully characterize each individual’s criminal history at the time of
arrest. We do so by tabulating the number of prior arrest cycles by most serious charge, the
number of prior convictions by most serious charge, and the number of prior probation, jail, and
prison sentences. We also use the data to characterize the degree to which each person’s
criminal history involved activity within the City and County of San Francisco as opposed to

33
activity in other California counties. The data do not contain arrests and convictions occurring
within other states.12
Table 3.5 summarizes prior convictions, arrest cycles, and sentences at the time of arrest
using the state ACHS data for criminal suspects in our data set by race/ethnicity. The patterns in
table 3.5 largely parallel the patterns observed for local criminal history. Black suspects are the
most likely to have a prior felony conviction, followed by White and then Hispanic suspects.
Blacks also have the highest average number of prior felony and misdemeanor arrest cycles,
again followed by White, Hispanic, and Asian suspects. Similar patterns are observed for prior
prison, jail, and probation sentences. Within offense categories, we observe that Black suspects
are the most likely to have prior felony person, property, and drug convictions and the highest
average number of arrests cycles within these offense categories. Again, White suspects tend to
have the second most severe criminal histories on average followed by Hispanic and Asian
defendants.
Table 3.6 tabulates the average number of prior convictions and arrest cycles by whether
the arrest and prosecution occurred within San Francisco, outside of San Francisco but in another
Bay Area county,13 or within a non-Bay Area California county. For each group, less than half of
12 In our multivariate statistical models we control for variables measuring criminal history from both the San Francisco administrative records as well as the state ACHS. In theory, all of the records in the San Francisco data should be included in the state’s database. However the ACHS has many arrest cycles where the ultimate arrest disposition is never reported by local criminal justice agencies and in some instances case dispositions where there are no recorded arrests. Moreover, arrests that are not booked (for example street citations) and that are not pursued by the local DA will often not appear in the ACHS records, as bookings are the incidents that tend to open an arrest cycle. Hence, while most of the incident recorded in the SF data are indeed observed in the state data, there are likely to be many arrests and convictions for lesser offenses that are not. 13 Other Bay Area counties are defined as Alameda, Contra Costa, Marin, Napa, San Mateo, Santa Clara, Solano and Sonoma counties.
34
prior convictions occur within the San Francisco, with most non San Francisco convictions
occurring within one of the other Bay Area counties. Prior arrest cycles on the other hand, appear
to be roughly evenly split between cycles that commence in San Francisco and cycles that
commence in other counties.
B. Differences in the processing of arrests and pre-trial detention
How an arrest is processed may ultimately impact the disposition of a criminal case.
Individuals who are detained and issued a street citation are never admitted to jail and may be
better able to mount a criminal defense. Those who are booked into jail and are detained pre-
trial may be anxious to settle matters and accept pleas that they may not otherwise accept if they
were not in custody. Moreover, people differ in their ability to make bail, due to personal
differences in wealth, income, and access to credit as well as differences in these markers of
financial security within one’s familial and social networks. To the extent that there are
racial/ethnic disparities in these financial indicators, this may translate into disparities in pre-trial
processing that ultimately impact case disposition and sentencing.
We begin by documenting racial disparities in the proportion of arrests that are booked
into jail. Most arrests are booked, especially felony arrests, though booking rates do vary and for
wobbler crimes and misdemeanor offenses officers have greater discretion regarding whether to
book the arrests or issue a street citation. Table 3.7 presents the proportion of suspects that are
booked at arrest by race/ethnicity. Our data on bookings cover the period from 2010 through
July 2016. Hence, in this subsection we drop cases with an arrest date in calendar years 2008
and 2009. We present separate tabulations for cases with arrest date prior to November 2014

35
and those with arrest dates occurring in November 2014 and later. This stratification of the data
corresponds with the passage of state proposition 47 that reclassified several lesser felony
offenses that can be prosecuted as either a felony or a misdemeanor (wobbler chargers) to a
misdemeanor. One would expect that this change would lead to a decline in the proportion of
arrests that are booked, as the share of felony-eligible offenses declined. The table also presents
tabulations for the full sample of arrests and two sub-samples. First, we present booking rates
for cases involving a single court number (i.e., no open San Francisco case or San Francisco
probation term). In addition, we also present bookings tabulations for cases where the suspect
has no observable San Francisco criminal history. Within each of these sub-groups we present
separate tabulations for the pre- and post-proposition 47 periods.
Beginning with all cases in the pre-proposition 47 period, there are enormous disparities
in the likelihood that suspects are booked at arrest. Asian suspects have the highest booking rate
(at 92 percent), followed by Black suspects (83 percent), Hispanic suspects (74 percent), and
White suspects (72 percent). The effect of proposition 47 on booking rates for Black and Hispanic
suspects is quite large, with a decline of 14 percentage points for Black suspects and 10
percentage points for Hispanic suspects. There is a more modest decline in booking rates for
White suspects (6 percentage points) and a slight increase for Asian suspects (an increase of 3
percentage points). Booking rates are generally lower for arrests involving only a single court
number (with Asian suspects being the exception) and lower still for suspects with no prior
history in San Francisco since 2008.
Table 3.8 presents the average and median number of detention days following an arrest
by race and ethnicity. We present tabulations for cases without multiple court numbers at arrest,

36
and cases where the individual has no prior San Francisco history. The figures for median
detention days (the detention day value that is just greater than half for the group) are
considerably lower than the averages due largely to a small number of cases where the defendant
is detained in jail for a fairly lengthy period. Generally speaking, the racial disparities in bookings
rates documented in Table 3.7 translate into racial disparities in pre-trial detention times. Blacks
have the highest average and median values followed by Asian, Hispanic, and White defendants.
Individuals without multiple court numbers at arrest and who have no prior San Francisco
criminal history are detained for much shorter periods for all racial/ethnic groups, though Black
still experience the most pre-trial detention.
Table 3.9 presents tabulations for all cases by race for the pre- and post-proposition 47
periods. There is a remarkable narrowing of racial disparities in pre-trial detention days with the
implementation of proportion 47. Prior to the proposition’s implementation, the average pre-
trial detention time for whites and blacks was approximately 17.4 and 33.5 days, respectively. In
the post period, average detention days for Whites drops to approximately 12 days and to 18
days for Blacks. There are also notable declines for Hispanics (from approximately 20 to 12 days)
and a slight decline for Asians (from 21 to 18 days).
The notable disparities in bookings rates and pre-trial detention days may be due in part
to differences in the severity of arrest charges, differences in the criminal history of the suspect,
and differences in the criminal justice status of the arrested individual. Indeed, we documented
differences by race and ethnicity in the average severity of arrest charges as well as the
proportion with open cases at the time of arrest. To explore whether these differences in cases
characteristics explain differences in booking and pre-trial detention, here we estimate

37
disparities in these outcomes relative to White suspects with and without statistical adjustment
for these possible explanatory factors. To be specific, we use multivariate regression models to
estimate (1) the basic difference in booking rates relative to Whites without statistical
adjustments, (2) the comparable differences after accounting for the effect of specific arrest
charges and having an active criminal justice status on booking and pre-trial detention, and (3)
the differences in booking rates and pre-trial detention days after accounting for the effects of
specific arrest charges, criminal justice status at time of arrest, and observed local and statewide
criminal history.14
Figure 3.2 graphically displays these results for booking rate disparities. The figures are
constructed as follows. Focusing on the highest marker for Black arrestees at the top of the
figure, the blue dot in the middle of the blue bar marks the differences in the proportion of arrests
booked between Whites and Blacks (with the value measured along the horizontal axis on the
14 Specifically, we use linear regression to estimate these statistically adjusted disparities. For example, to estimate differences in bookings rates relative to whites, we first estimate the linear probability model Bookingi =α + βBlacki+ γAsiani + φHispanici + εi, where i indexes individual arrests, Bookingi is a dummy variable equal to one if the arrest is booked, Blacki, Asiani, and Hispanici are dummy variables that take on the value of one for black, Asian, and Hispanic arrestees respectively, and εi provides the random error term. Estimates of the coefficients β, γ, and φ measure the difference in the booking rates relative to whites for Blacks, Asians, and Hispanics respectively. After estimating this simple specification, we re-estimate the model including dummy variables for the seven most serious arrest charges (with 69 charge category dummies per charge) as well as an indicator variable measuring whether there are multiple court numbers associated with the single arrest. The estimates of β, γ, and φ from this alternative specification provide estimates of the racial disparities in booking rates after accounting for differences in arrest charges and differences in having an active criminal justice status at the time of the arrest. Finally, to the second specification we add controls for the number of person, property, drug, other sex, weapons, and other felony arrests, the number of prior person, property, drug and other misdemeanor arrests, the number of local ordinance arrests, the number of prior convictions, the number of prior probation sentences, the number of prior jail sentences, and the number of prior prison sentences occurring in San Francisco. All of these variables are controlled for using dummy variables for the count of each history variable (indicating one, two, three, and four or more incidents) and pertain to criminal history accrued in San Francisco since 2008. We also control for the number of arrest cycles, convictions, prior prison terms, jail terms and probation sentences using a more expansive offense categorization. These variable sets are discussed in detail in section 4. The estimates of β, γ, and φ from this third model provide the estimates of the racial disparities holding constant arrest charges, current criminal justice status, and local and statewide criminal history. We estimate these models using data for arrests occurring in 2010 or later.

38
bottom of the graph). Hence, the raw difference in booking rates for Black suspects relative to
White suspects is roughly 9 percentage points. The horizontal line passing through the dot shows
the 95 percent confidence interval (corresponding to the margin of error) within which we are
fairly certain that the true value of the differential lies. A shorter line indicates a more precisely
measured differential. The vertical line at zero allows one to visibly position the estimate given
by the dot relative to the no-effect value (i.e., zero). Moreover, if the line indicating zero is
outside of the demarcated confidence interval, we can conclude that the racial disparity is
statistically and significantly different from zero (or no difference). Within each racial group the
figure presents three estimate, from top to bottom in the following order: (1) the basic
unadjusted booking rate differential relative to Whites, (2) the differential after adjusting for
differences in arrest charges and whether the person has an active criminal justice status, and (3)
the differential after adjusting for arrest charges, status, and local and statewide criminal history.
The figure reveals that much of the unadjusted Black-White disparity in booking rates can
be explained by differences in arrest charge severity and criminal justice status at the time of
arrest. Specifically, Blacks are about 9 percentage points more likely to be booked at arrest than
whites. However, after adjusting for arrest charges and status the disparity falls to roughly 4
percentage points. Holding constant criminal history reduces the differential further to roughly
2.5 percentage points. These findings suggest that 72% of the observed Black-White disparity in
bookings is explained by arrest severity and criminal history. All three estimates for Blacks are
statistically significant.

39
The unadjusted Hispanic-White differential is positive yet not statistically significant (i.e.,
the zero line lies within the confidence interval of the estimate). Adjusting for arrest charges and
criminal history reduces the disparities to zero.
The largest disparities in booking rates are observed for Asian suspects, with an
unadjusted differential relative to whites of 23 percentage points. Slightly more than half of the
difference can be explained by differences in charge severity and criminal justice status at time
of arrest. Adding criminal history variables to the list of controlled-for factors does not narrow
the Asian-White difference. All three estimates are statistically significant.
Figure 3.3 reproduces this analysis presenting separate estimates for the periods before
and after proposition 47. The estimates for the pre-period largely parallel what we see for the
entire period in Figure 3.2. There are sizable and statistically significant disparities for Blacks
relative to Whites that are only partially explained by differences in arrest charges and criminal
history, similar but larger disparities for Asians, and little evidence of a disparity for Hispanics.
With the passage of proposition 47, the unadjusted Black-White disparities drops by half, with
the remaining disparity fully explained by differences in arrest charges, status at time of arrest,
and criminal history. We observe a slight widening of Hispanic-White disparities that are positive
and statistically significant after adjusting for case characteristics and criminal histories. Finally,
the Asian-White disparities actually widen with the passage of proposition 47.
Figures 3.4 and 3.5 reproduce this analysis using days of detention following arrest as the
explanatory variable. This measure is equal to zero for those who receive a street citation and
for those who bail out on the day of arrest. For the entire sample period (figure 3.4) the largest

40
disparities relative to Whites in pre-trial detention occur for Blacks, with an unadjusted difference
of approximately 15 days on average. After including measures of arrest charges and status at
time of arrest, the disparity shrinks to 5 days on average. The inclusion of arrest charges, status
at time of arrest, and criminal history reduces the Black-White disparity to an average of 2 days.
All three estimates are statistically significant.
The raw differential for Hispanics relative to Whites is roughly 2.5 days and statistically
significant. Adjusting for criminal history, arrest charges, and status narrows this differential
slightly and renders them statistically insignificant.
Finally, in contrast to the high booking rates for Asian suspects relative to all other groups,
the differential in pre-trial detention days relative to Whites is modest, with an unadjusted
differential of roughly 4.5 days. Statistically adjusting for case characteristics and criminal history
reduces the disparity to zero.
Turning to figure 3.5, the main observable effect of proposition 47 is the narrowing of the
Black-White and Hispanic-White differentials in pre-trial detention days by nearly two-thirds.
Looking at the unadjusted differentials we see the average differences in days detained between
Black and White suspects decline from roughly 15 to 5 days with the passage of the proposition.
Statistical adjustment for arrest charges, history, and status reduces this differential to zero. For
Hispanics the implementation of proposition 47 reduces the unadjusted differential in detention
days relative to Whites to zero. For Asian suspects, we see a slight widening of the detention
days differentials but statistically adjusted estimates are small and statistically insignificant.
C. Disparities in Case Disposition and Sentencing

41
The ultimate disposition of an arrest will depend on case characteristics that are pre-
determined by the time a case is presented to the district attorney, as well as choices that the
office of the SFDA makes pertaining to whether to file charges, what charges to file, and how to
negotiate with a defendant. There are several factors that are beyond the SFDA’s control that
will likely result in racial disparities in case outcomes. For example, Blacks are more likely to have
an active criminal justice status at the time of arrest and tend to have relatively more serious
charges listed by the arresting officers. Blacks are more likely to be booked and detained while
awaiting arraignment and while awaiting the decisions of the DA, a factor that tends to weaken
the bargaining position of defendants and increase the likelihood of a conviction. Regarding
factors under the DA’s control, cases are often dismissed prior to arraignment. This may occur
due to weak evidence, probable cause issues at arrest that compromise the ability to pursue the
case, or a judgment call that a particular offense is not of sufficient severity to warrant action.
Similarly, for certain offenses the DA may file charges that carry less severe penalties relative to
the arrest charges, or drop or modify charges in negotiating plea agreements with a defendant’s
legal counsel.
We will ultimately assess the relative contribution of factors that are pre-determined
prior to a case being presented to the DA as well as factors that evolve and are decided upon
during the processing of case (such as pre-trial detention and charging decisions) on racial
disparities in case disposition. Here, we begin by documenting the broad differences in outcomes
as well as intermediate charging actions that may contribute to disparities in outcomes.
Table 3.10 presents a broad characterization of the ultimate disposition of arrests by race
and ethnicity. For each arrest, we group dispositions into four mutually exclusive and exhaustive

42
categories. First, we identify cases where the SFDA does not file charges, or where following
filing the case is dismissed by either the DA or a court. Second, we define cases where the
individual is diverted to an alternative sanction/treatment alternative and successfully completes
the diversion program without a conviction. These two categories of dismissal and diversion
represent outcomes where the individual is not convicted or sanctioned for the offense.
Individuals with open cases or who are on parole or probation are frequently released to
another agency for further action, or have a motion to revoke filed against them. There are
natural reasons for this to occur, including that it avoids the need to allocate DA resources to a
case where a punishment can occur for violating an existing court order. In many instances, these
individuals will experience an incarceration spell, though usually based upon the action and
jurisdictional authority of another agency. These cases do not result in new criminal convictions
associated with the arrest. Finally, some subset of arrests results in a new criminal convictions.
In table 3.10, we present the percent of each group that fall into these four categories as well as
the sub-total percentages where the cases are either successfully diverted or dismissed and cases
where there is a release to another agency, the filing of a motion to revoke, or a new conviction.
In panel A of table 3.10, we see that the arrests of Asian suspects are the least likely to
result in a diversion or dismissal and the most likely to results in a revocation or conviction. This
pattern is driven primarily by a relatively high conviction rate for Asian defendants
(approximately 35 percent) relative to other groups of defendants (approximately 27, 25, and 22
percent resulting in new convictions for Hispanic, White, and Black defendants, respectively).
Cases involving Black suspects are the most likely to result in a motion to revoke or a release to
another agency (approximately 17 percent for Blacks compared with 10 to 11 percent for the
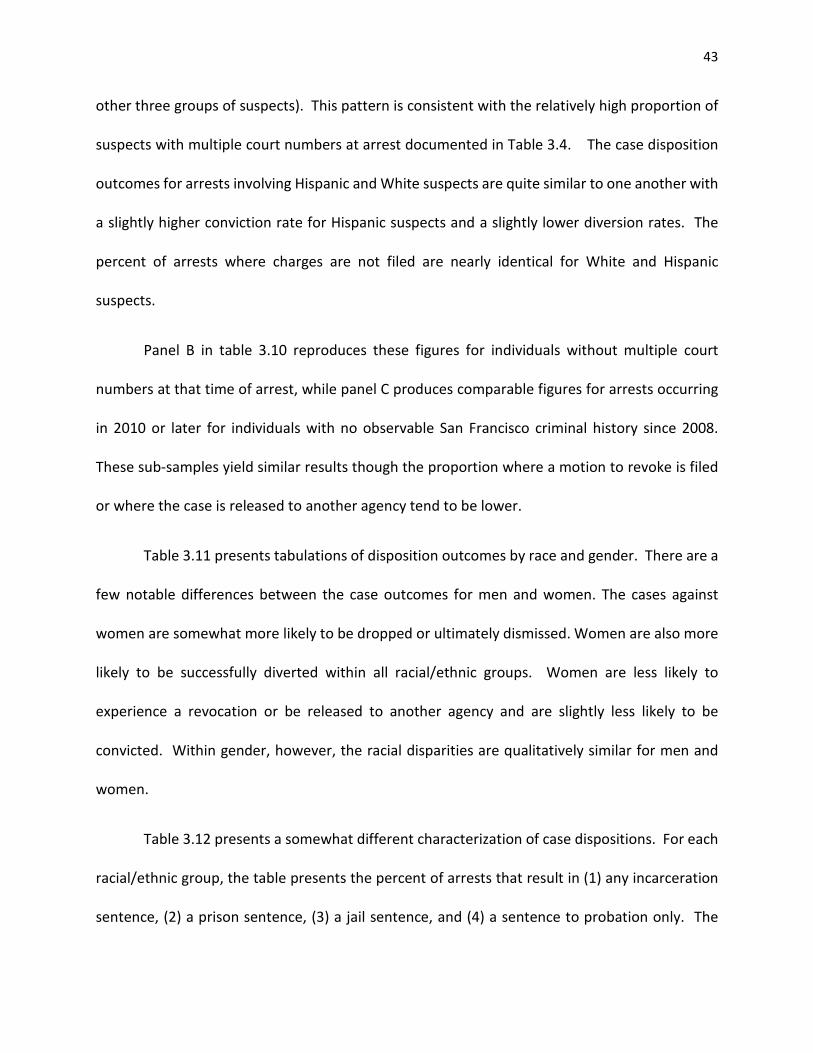
43
other three groups of suspects). This pattern is consistent with the relatively high proportion of
suspects with multiple court numbers at arrest documented in Table 3.4. The case disposition
outcomes for arrests involving Hispanic and White suspects are quite similar to one another with
a slightly higher conviction rate for Hispanic suspects and a slightly lower diversion rates. The
percent of arrests where charges are not filed are nearly identical for White and Hispanic
suspects.
Panel B in table 3.10 reproduces these figures for individuals without multiple court
numbers at that time of arrest, while panel C produces comparable figures for arrests occurring
in 2010 or later for individuals with no observable San Francisco criminal history since 2008.
These sub-samples yield similar results though the proportion where a motion to revoke is filed
or where the case is released to another agency tend to be lower.
Table 3.11 presents tabulations of disposition outcomes by race and gender. There are a
few notable differences between the case outcomes for men and women. The cases against
women are somewhat more likely to be dropped or ultimately dismissed. Women are also more
likely to be successfully diverted within all racial/ethnic groups. Women are less likely to
experience a revocation or be released to another agency and are slightly less likely to be
convicted. Within gender, however, the racial disparities are qualitatively similar for men and
women.
Table 3.12 presents a somewhat different characterization of case dispositions. For each
racial/ethnic group, the table presents the percent of arrests that result in (1) any incarceration
sentence, (2) a prison sentence, (3) a jail sentence, and (4) a sentence to probation only. The

44
table presents figures for all arrests, arrest where the suspect does not have multiple court
numbers, and arrests occurring in 2010 or late where the suspect has no criminal history (from
2008 through the date of the arrest) in San Francisco. We should caution in interpreting these
figures that we cannot observe the incarceration outcomes for individuals who are released to
another agency or who have a motion to revoke filed against them. It is likely the case that many
of these cases result in an incarceration spell. However, measuring these outcomes would
require information on the agencies to which each case is released as well as case management
data from these agencies that would permit tracking the ultimate outcomes. Unfortunately, we
do not have access to this additional information.
Before discussing the racial and ethnic disparities, there are some general patterns in
Table 3.12 that merit discussion. First, in most cases resulting in a conviction, incarceration is
part of the sentence. This can be seen by comparing the figures for “any incarceration” in the
first column of Table 3.12 with the figures for the percent convicted in the fifth column of Table
3.10. Within each group, the lion’s share of individuals convicted received some form of
incarceration sentences. Second, a prison sentence in San Francisco is a relatively rare outcome,
with no more than roughly two percent of any one group receiving a prison sentence. Probation-
only sentence are also quite rare. Regarding the patterns by racial/ethnic group, we see that
Asian defendants are the most likely to receive an incarceration sentence associated with a new
conviction followed by Hispanic suspects, White suspects, and Black suspects. Blacks are the
most likely to receive a prison term and the least likely to receive a new jail sentence. This pattern
should be interpreted with caution in light of the fact that nearly a fifth of Black suspects are

45
released to another criminal justice agency or have a motion to revoke filed against them, a path
that is likely to generate jail or prison time.
The patterns across groups are roughly similar whether we analyze all cases, arrests
without multiple court numbers at the time of arrest, or arrests with no prior history in San
Francisco. We do see higher percentages receiving new incarceration sentences for these less
active arrestees, a factor likely attributable to the lower rate of release to other agencies.
Figures 3.6 through 3.9 graphically display difference in filing outcomes by race and
highlight the link between the initial choices by the SFDA in how to handle a new case and the
ultimate outcome of the case. Figure 3.6A shows the proportion of felony arrests that result in
the filing of felony charges, the filing of (at worst) misdemeanor charges, and a decision to
immediately release the case to another agency or seek a motion to revoke (and, by extension
not file any new charges). We see roughly similar rates for the filing of felony charges against
Black, Asian, and Hispanic defendants and lower rates (of roughly 1.5 percentage points) for
White defendants. Black suspects are the least likely to have the charges downgraded to a
misdemeanor while Asian suspects are the most likely. Black suspects are by far the most likely
to have their case released to another agency.
Panel B shows key disposition outcomes for these cases including the proportion of
arrests resulting in a felony conviction, a misdemeanor conviction, a release to another
agency/revocation, and the proportion resulting in a successful diversion. The proportion of
arrests ultimately resulting in felony convictions are roughly similar for Asian, White and Hispanic
defendants but discretely higher for black defendants (by about 1.3 percentage points relative to

46
White defendants). The figure reveals a small though non-trivial proportion of cases that result
in successful diversion with the highest successful diversion rates for White and Asian arrests and
the lowest diversion rates for Hispanic and Black arrests. Again, we see that Black arrestees are
most likely to be released to another agency or experience a revocation of their community
corrections status. Note the proportion released to other agencies/revoked increases slightly for
all groups relative to the proportions in this category at the filing decision. This results from a
small proportion of cases where charges are filed where the SFDA ultimately pursues an
alternative action.
Figure 3.7 presents a comparable figure for misdemeanor arrests. We rarely see
individuals arrested for a misdemeanor who are charged with felonies. Actual misdemeanor
charges are most likely to be filed against Asian suspects (occurring in roughly 54 percent of
arrests), followed by Hispanic suspects (35 percent), White suspects (34 percent), and Black
suspects (28 percent). Again we see the highest percentage of cases released to other agencies
for Black suspects (8.1 percent) and relatively comparable percentages for the other three groups
(ranging from 4.1 to 4.5 percent). Misdemeanor conviction rates (displayed in figure 3.7B) are
lower than misdemeanor charge filing rates, though the inter-group patterns in conviction rates
largely parallel the filing pattern. Similar to our findings for felony filings and convictions, we see
an increase in the proportion released to other agencies and the highest proportion with a
revocation or release to another agency for Black arrestees.
In figure 3.8, we dig deeper into felony arrests and compare the proportion of arrests
where felony charges are filed and that result in a felony conviction after stratifying the cases by
the most serious arrest offense. Within each charge category we tabulate separate figures for

47
suspects by race and ethnicity. Looking within specific charge categories reveals patterns that
are masked by a more aggregated comparison. For example, for felony person offense charges
(generally referred to as a violent crime), felony charges are most likely to be filed against Black
suspects (39.5 percent), followed by Hispanic suspects (32.7 percent), Asian suspects (32.6
percent), and White suspects (31.2 percent). While the proportion of these arrests resulting in
actually felony convictions are lower relative to felony filings, the differences across racial groups
for felony person arrests correspond quite closely to difference in felony filing rates. Filings and
felony conviction rates are relatively similar for felony person offenses. Hispanic suspects
arrested for a drug felony are the most likely to have felony charges filed against them, and they
are the most likely to be convicted of a felony among those arrested for a felony drug offense.
Asian suspects are the most likely to have felony charges filed against them for lewd behavior
and for other felonies.
Figure 3.9 presents similar comparison for misdemeanor arrest, charges, and convictions.
Filing rates tend to be lower as are convictions rates for all offense categories with the exception
of misdemeanor property crimes. There are few consistent patterns across the offenses in the
rankings of filing and conviction rates by racial/ethnic groupings.
As a final set of descriptive statistics, Table 3.13 presents descriptive statistics for
sentencing outcomes for arrests that result in conviction (regardless of whether the sentence
reflects credit for time served, a jail sentence requiring time served beyond adjudication or a
prison sentence). The table presents figures for the average sentence, the sentence at the 25th
percentile (the value that exceeds one quarter of all sentences), the median sentence, and the
sentence at the 75th percentile (the value that exceed 75 percent of all sentences). Panel A

48
presents results for those convicted of a felony while panel B presents results for misdemeanor
convictions. Average sentences are 6 to 9 months with the longest sentences handed down to
Blacks followed by Hispanic, White, and Asian defendants. Median sentences are much lower
than the average sentence reflecting the small number of cases with long prison sentences.
D. Summary of Basic Patterns Observed in the Data
The analysis presented in this section revealed several important stylized facts regarding
racial disparities in San Francisco criminal justice outcomes. At the risk of oversimplification, we
believe the main takeaways from this section are the following.
• There are differences in criminal history records and the degree to which members of
different racial and ethnic groups are repeatedly interacting with the criminal justice
system in San Francisco. For example, Black suspects are more likely to appear in multiple
cases during our observation period and are more likely to have an active criminal justice
status at arrest. Black and Asian suspects are more likely to be arrested for a felony
relative to White and Hispanic suspects. Black suspects tend to have more extensive
criminal histories.
• Black suspects are more likely than Whites to be booked at arrest, and are the most likely
of all groups to be detained pre-trial for the longest time periods. The relatively higher
booking rates and lengthier pre-trial detention for Blacks is explained in part by
differences in arrest charge severity and criminal history, though approximately one fifth
of the disparity remain even after accounting for these factors. Asian suspects are also
more likely than Whites to be booked at arrest. The disparities in bookings for Asian

49
suspects relative to Whites are not explained by case characteristics related to charge
severity and criminal history. The implementation of proposition 47 greatly narrowed the
booking rate and pre-trial detention disparities between Black, Hispanic, and White
suspects, but had little impact on these outcomes for Asian suspects.
• The arrests of Blacks are the most likely to result in a release to another agency (such as
county probation or state parole) or a motion to revoke and the least likely to result in a
successful diversion. The arrests of Asian suspects are the most likely to result in a new
criminal conviction.
• For felony arrests and charges significantly more likely to be filed against Black, Hispanic,
and Asian defendants compared to White defendants. When we look within broad arrest
offense categories, we find a relatively higher propensity to file felony charges against
Blacks for felony person offenses, a higher propensity to file felony charges against
Hispanic suspects for felony drug offenses, and a higher propensity to file felony charges
against Asian suspects for offenses falling into the felony lewd behavior category. Racial
disparities in felony conviction rates for these crimes parallel racial disparities in filing
rates.
• Among those convicted of felonies, Blacks tend to receive longer sentences.
To be sure, these disparities are interrelated, and interact with one another. Disparities in
booking rates are certainly related to disparities in criminal history, which in turn may depend on
differential propensities to offend and/or differential prior treatment by the police. Differences
in the rate at which individual suspects are released to other agencies will depend on difference
in the extent to which other agencies can claim jurisdiction over specific groups of suspects (for

50
example, probation or other jurisdictions pursuing prosecution). In the next section, we lay out
a strategy for disentangling the effects of prior case characteristics from choices in the SFDA’s
office in determining racial disparities in disposition and sentencing outcomes. We also outline
a strategy for an “outcome test” for differential treatment of suspects of different races and
ethnicity based on the cumulative decision made by police and prosecutors through the filing
decision.

51
Table 3.1 Racial/Ethnic Composition of Cases Presented to the SFDA, of Unique Criminal Suspects, and the Average Number of Cases Per Suspect for the Period 2008 through July 2016 Percent of All
Cases Percent of
Pre-Prop 47 Cases
Percent of Post-Prop 47
Cases
Percent of Suspects
Cases per Suspect
Non-Hispanic White 32.8 32.8 32.7 25.9 1.8 Black 42.3 43.2 37.8 31.3 2.6 Asian 3.2 2.9 4.5 4.1 1.5 Other 7.5 7.1 9.2 11.4 1.3 Hispanic 14.3 14.0 15.8 17.4 1.6
The first two column approximately sum to 100. Small deviations from 100 percent are due to rounding.

52
Table 3.2 Percent Distributions of Cases by the Most Serious Arrest Charge within Racial/Ethnic Groups, All Cases Presented to the SFDA from 2008 through July 2016 Case type Non-Hispanic
White Non-Hispanic
Black Non-Hispanic
Asian Hispanic
Felony 45.74 54.28 55.98 47.03 Person 12.65 14.81 22.24 16.89 Property 12.99 12.49 16.34 8.75 Drug 14.92 21.23 10.97 15.73 Weapon 0.63 1.29 1.08 1.11 Other sex 0.6 0.63 0.7 0.6 Other 3.95 3.83 4.65 3.95 Misdemeanor 42.74 29.67 36.19 42.91 Person 9.19 7.11 7.73 8.93 Property 4.89 3.01 1.96 3.5 Drug 3.51 4.28 1.46 2.68 Other 25.15 15.27 25.04 27.8 Local Ordinance 11.52 16.04 7.84 10.05
Bolded sub-totals approximately add to 100 within each column. Small deviations from 100 percent are due to rounding errors.

Table 3.3 Percent Distributions of Cases by the Most Serious Arrest Charge within Racial/Ethnic Groups, Comparison of Arrests Made in the Pre and Post-Proposition 47 Periods
Non-Hispanic White Non-Hispanic Black Non-Hispanic Asian Hispanic Pre Prop. 47 Post Prop. 47 Pre Prop. 47 Post Prop. 47 Pre Prop. 47 Post Prop. 47 Pre Prop. 47 Post Prop. 47
Felony 46.82 40.50 55.15 49.48 55.47 57.59 48.30 41.59 Person 12.19 14.87 14.01 19.21 20.45 27.81 16.54 18.36 Property 13.15 12.17 12.18 14.24 16.49 15.87 8.89 8.18 Drug 16.62 6.66 23.48 8.68 12.53 6.03 17.46 8.25 Weapon 0.56 1.00 1.13 2.22 0.92 1.65 0.94 1.81 Other sex 0.60 0.64 0.65 0.56 0.48 1.40 0.64 0.51 Other 3.70 5.16 3.70 4.57 4.60 4.83 3.83 4.48 Misdemeanor 41.39 49.38 27.66 40.96 37.12 33.21 41.21 50.24 Person 8.72 11.48 6.44 10.78 7.33 8.89 8.55 10.54 Property 4.46 7.05 2.61 5.29 1.91 2.16 3.36 4.13 Drug 3.62 3.35 4.32 4.45 1.35 1.78 2.68 2.98 Other 24.59 27.50 14.29 20.44 26.53 20.38 26.62 32.59 Local Ordinance 11.80 10.13 17.21 9.55 7.41 9.21 10.48 8.18

Table 3.4 Additional Case Characteristics At time of Presentation and Criminal Histories within the City and County of San Francisco by Race
Non-Hispanic White
Non-Hispanic Black
Non-Hispanic Asian
Hispanic
Average arrest charge variables # arrest charges 2.34 2.32 2.91 2.46 # felony arrest charges 1.00 1.170 1.55 1.06 # misd. arrest charges 1.11 0.87 1.18 1.19 Proportion with multiple court numbers at arrest
0.22 0.35 0.20 0.19
SF Criminal history variables1 Prior convictions 0.67 0.98 0.58 0.44 Prior probation only 0.00 0.00 0.00 0.00 Prior jail sentence 0.47 0.72 0.43 0.32 Prior prison sentence
0.05 0.10 0.03 0.04
SF Prior Arrests Prior felony person 0.22 0.53 0.22 0.26 Prior felony property 0.62 0.71 0.53 0.29 Prior felony drug 0.38 1.04 0.28 0.33 Prior felony lewd beh. 001 0.03 0.00 0.01 Prior felony weapons 0.02 0.04 0.01 0.02 Prior felony other 0.13 0.25 0.10 0.11 Prior misd. person 0.17 0.23 0.11 0.13 Prior misd. Property 0.18 0.16 0.12 0.09 Prior misd. Drug 0.11 0.24 0.08 0.08 Prior misd other 0.47 0.60 0.33 0.32 Prior local ordinance
0.50 0.98 0.36 0.33
No prior SF cases
0.48 0.30 0.59 0.56
N 67,566 87,155 6,597 29,493 N 2010 and later 47,604 58,528 6,260 20,432
1. For the criminal history variables we only report values for cases presented 2010 or later. The values represent criminal histories observed for cases filed within the City and County of San Francisco from 2008 onwards.

55
Table 3.5 Criminal History From California Department of Justice Automated Criminal History System: Prior Felony and Misdemeanor Convictions and Arrests as of the Event Arrest Date
Non-Hispanic White
Non-Hispanic Black
Non-Hispanic Asian
Hispanic
Felony convictions 0.54 0.82 0.32 0.44 Misd. convictions 0.35 0.29 0.20 0.33 Fel. arrest cycles 1.61 2.77 0.98 1.36 Mis. arrest cycles 1.61 1.67 0.76 1.31 Prior prison 0.06 0.13 0.04 0.05 Prior jail 0.62 0.77 0.36 0.54 Prior probation 0.62 0.74 0.39 0.55 Prior convictions Fel. person 0.10 0.20 0.07 0.11 Fel. property 0.23 0.30 0.15 0.14 Fel. drug 0.16 0.28 0.08 0.14 Fel. lewd 0.01 0.01 0.00 0.00 Fel. weapons 0.01 0.02 0.01 0.01 Fel. other 0.03 0.02 0.02 0.03 Mis. person 0.06 0.06 0.02 0.05 Mis. property 0.05 0.05 0.03 0.04 Mis. drug 0.06 0.03 0.02 0.04 Mis. other 0.18 0.15 0.12 0.20 Prior arrest cycles Fel. person 0.28 0.63 0.23 0.36 Fel. property 0.64 0.90 0.41 0.39 Fel. drug 0.55 1.06 0.25 0.47 Fel. lewd 0.02 0.03 0.01 0.01 Fel. weapons 0.04 0.06 0.03 0.04 Fel. other 0.09 0.08 0.05 0.08 Mis. person 0.24 0.32 0.11 0.21 Mis. property 0.20 0.23 0.11 0.13 Mis. drug 0.33 0.25 0.10 0.21 Mis. other 0.85 0.87 0.44 0.75

56
Table 3.6 Convictions and Arrests from California Department of Justice Automated Criminal History System Reported by San Francisco, Reported by Another Bay Area County, and Reported by a non-Bay Area California County: Prior Felony and Misdemeanor Convictions and Arrests as of the Event Arrest Date
Non-Hispanic White
Non-Hispanic Black
Non-Hispanic Asian
Hispanic
Convictions San Francisco 0.28 0.53 0.16 0.27 Other Bay Area 0.38 0.46 0.30 0.36 Rest of CA 0.23 0.13 0.05 0.14 Arrest Cycles San Francisco 1.61 2.65 0.86 1.35 Other Bay Area 1.02 1.53 0.72 0.94 Rest of CA 0.60 0.26 0.16 0.38

57
Table 3.7 Proportion of Arrests Booked into Jail For All Arrests with Arrest Dates in 2010 or Later by Race/Ethnicity and By Whether the Arrest Occurred Before or After the Passage of Proposition 47 All Cases Cases without multiple
arrest numbers Cases with no San
Francisco history since 2008
Before prop 47
After prop 47
Before prop 47
After prop 47
Before prop 47
After prop 47
White 0.72 0.64 0.68 0.59 0.65 0.57 Black 0.83 0.69 0.77 0.63 0.73 0.57 Asian 0.92 0.95 0.91 0.95 0.93 0.97 Hispanic 0.74 0.64 0.69 0.59 0.67 0.54

58
Table 3.8 Mean and Median Days Detained in Jail by Race/Ethnicity for Cases Occurring 2010 or Later All Cases Cases without multiple
arrest numbers Cases with no San
Francisco history since 2008
Mean Days Detained
Median Days
Detained
Mean Days Detained
Median Days
Detained
Mean Days Detained
Median Days
Detained White 16.16 1 9.86 0 8.52 0 Black 29.98 3 18.82 1 19.17 1 Asian 20.44 1 14.40 1 12.93 0 Hispanic 18.30 1 11.87 0 11.02 0

59
Table 3.9 Mean and Median Days Detained in Jail by Race/Ethnicity Before and After Proposition 47 for Cases Occurring 2010 or Later Before Proposition 47 After Proposition 47 Mean Median Mean Median White 17.47 1 12.01 0 Black 33.47 3 17.86 1 Asian 21.33 1 17.75 1 Hispanic 20.49 1 12.35 0
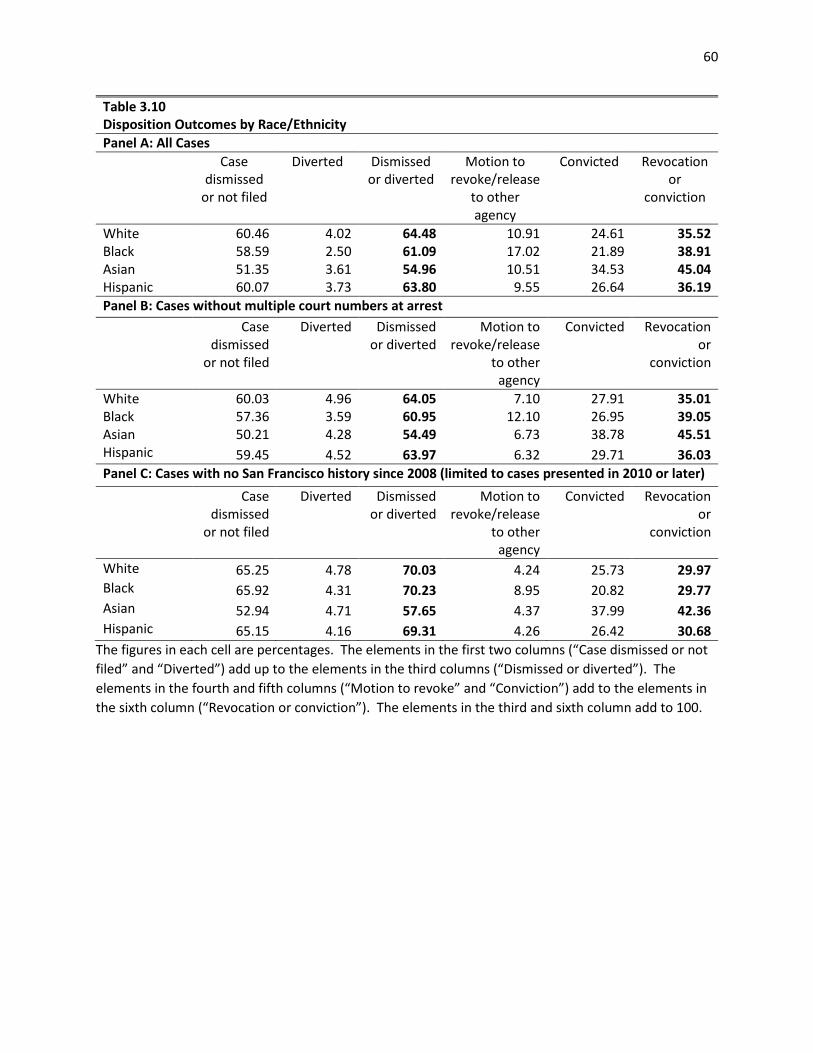
60
Table 3.10 Disposition Outcomes by Race/Ethnicity Panel A: All Cases Case
dismissed or not filed
Diverted Dismissed or diverted
Motion to revoke/release
to other agency
Convicted Revocation or
conviction
White 60.46 4.02 64.48 10.91 24.61 35.52 Black 58.59 2.50 61.09 17.02 21.89 38.91 Asian 51.35 3.61 54.96 10.51 34.53 45.04 Hispanic 60.07 3.73 63.80 9.55 26.64 36.19 Panel B: Cases without multiple court numbers at arrest Case
dismissed or not filed
Diverted Dismissed or diverted
Motion to revoke/release
to other agency
Convicted Revocation or
conviction
White 60.03 4.96 64.05 7.10 27.91 35.01 Black 57.36 3.59 60.95 12.10 26.95 39.05 Asian 50.21 4.28 54.49 6.73 38.78 45.51 Hispanic 59.45 4.52 63.97 6.32 29.71 36.03 Panel C: Cases with no San Francisco history since 2008 (limited to cases presented in 2010 or later) Case
dismissed or not filed
Diverted Dismissed or diverted
Motion to revoke/release
to other agency
Convicted Revocation or
conviction
White 65.25 4.78 70.03 4.24 25.73 29.97 Black 65.92 4.31 70.23 8.95 20.82 29.77 Asian 52.94 4.71 57.65 4.37 37.99 42.36 Hispanic 65.15 4.16 69.31 4.26 26.42 30.68
The figures in each cell are percentages. The elements in the first two columns (“Case dismissed or not filed” and “Diverted”) add up to the elements in the third columns (“Dismissed or diverted”). The elements in the fourth and fifth columns (“Motion to revoke” and “Conviction”) add to the elements in the sixth column (“Revocation or conviction”). The elements in the third and sixth column add to 100.

61
Table 3.11 Disposition Outcomes by Gender and by Race/Ethnicity Case
dismissed or not filed
Diverted Dismissed or
diverted
Motion to revoke/release to other agency
Convicted Revocation or
conviction Males White 59.62 3.71 63.33 11.74 24.93 36.67 Black 57.83 1.95 59.78 18.18 22.04 40.22 Asian 50.34 3.05 53.39 11.37 35.24 46.61 Hispanic 59.62 3.71 63.33 9.97 27.19 37.16 Females
White 64.20 5.40 69.60 7.25 23.15 30.40 Black 61.72 4.78 66.50 12.24 21.26 33.50 Asian 55.39 5.78 61.17 7.16 31.66 38.82 Hispanic 62.87 6.02 68.89 7.26 23.16 30.42
The figures in each cell are percentages. The elements in the first two columns (“Case dismissed or not filed” and “Diverted”) add up to the elements in the third columns (“Dismissed or diverted”). The elements in the fourth and fifth columns (“Motion to revoke” and “Conviction”) add to the elements in the sixth column (“Revocation or conviction”). The elements in the third and sixth column add to 100.

62
Table 3.12 The Percentage of Cases Resulting in any Form of Incarceration Sentence, a Prison Sentence, a Jail Sentence or a Probation-Only Sentence by Race Ethnicity Panel A: All Cases
Any Incarceration Prison Jail Probation Only White 20.51% 1.10% 19.41% 0.16% Black 18.28% 2.14% 16.13% 0.14% Asian 29.95% 1.17% 28.78% 0.17% Hispanic 22.63% 1.50% 21.13% 0.13% Panel B: Cases without multiple court numbers at arrest Any Incarceration Prison Jail Probation Only White 23.09% 0.87% 22.21% 0.19% Black 22.08% 1.94% 20.14% 0.19% Asian 33.68% 0.90% 32.78% 0.17% Hispanic 25.11% 1.27% 23.83% 0.13% Panel C: Cases with no San Francisco history since 2008 (limited to cases presented in 2010 or later)
Any Incarceration Prison Jail Probation Only White 22.68% 0.42% 22.26% 0.19% Black 17.76% 1.32% 16.44% 0.21% Asian 34.23% 0.65% 33.57% 0.19% Hispanic 23.57% 0.79% 22.77% 0.11%

63
Table 3.13 Incarceration Sentences (in months) Conditional on Conviction by Race and Ethnicity Panel A: Felony Conviction
Average 25th Percentile Median 75th Percentile White 6.09 0.16 0.99 6 Black 8.94 0.23 1.81 12 Asian 5.96 0.10 1.02 6 Hispanic 7.60 0.33 1.38 6 Panel B: Non-Felony Conviction Average 25th Percentile Median 75th Percentile White 0.55 0.03 0.07 0.36 Black 1.00 0 0.10 0.63 Asian 0.69 0.03 0.07 0.33 Hispanic 0.66 0.0 0.10 0.46
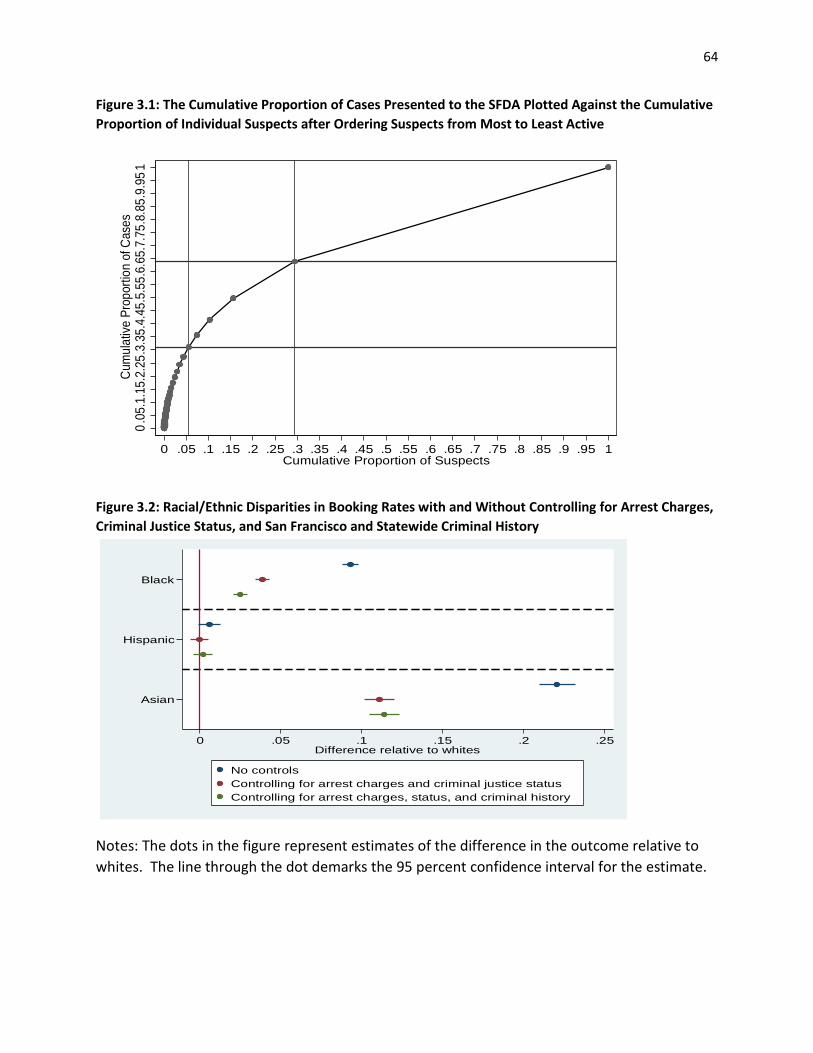
64
Figure 3.1: The Cumulative Proportion of Cases Presented to the SFDA Plotted Against the Cumulative Proportion of Individual Suspects after Ordering Suspects from Most to Least Active
Figure 3.2: Racial/Ethnic Disparities in Booking Rates with and Without Controlling for Arrest Charges, Criminal Justice Status, and San Francisco and Statewide Criminal History
Notes: The dots in the figure represent estimates of the difference in the outcome relative to whites. The line through the dot demarks the 95 percent confidence interval for the estimate.
0.05
.1.1
5.2.
25.3
.35.
4.45
.5.5
5.6.
65.7
.75.
8.85
.9.9
5 1Cu
mul
ative
Pro
porti
on o
f Cas
es
0 .05 .1 .15 .2 .25 .3 .35 .4 .45 .5 .55 .6 .65 .7 .75 .8 .85 .9 .95 1Cumulative Proportion of Suspects
Black
Hispanic
Asian
0 .05 .1 .15 .2 .25Difference relative to whites
No controlsControlling for arrest charges and criminal justice statusControlling for arrest charges, status, and criminal history

65
Figure 3.3: Racial/Ethnic Disparities in Booking Rates Before and After the Passage of Proposition 47, With and Without Controlling for Arrest Charges, Criminal Justice Status, and San Francisco and Statewide Criminal History
Notes: The dots in the figure represent estimates of the difference in the outcome relative to whites. The line through the dot demarks the 95 percent confidence interval for the estimate.
Figure 3.4: Racial/Ethnic Disparities in Average Jail Detention Days with and Without Controlling for Arrest Charges, Criminal Justice Status, and San Francisco and Statewide Criminal History
Notes: The dots in the figure represent estimates of the difference in the outcome relative to whites. The line through the dot demarks the 95 percent confidence interval for the estimate.
Black
Hispanic
Asian
0 .1 .2 .3 0 .1 .2 .3
Before Proposition 47 After Proposition 47
No controlsControlling for arrest charges and criminal justice statusControlling for arrest charges, status, and criminal history
Difference relative to whites
Black
Hispanic
Asian
-5 0 5 10 15Difference relative to whites
No controlsControlling for arrest charges and criminal justice statusControlling for arrest charges, status, and criminal history

66
Figure 3.5: Racial/Ethnic Disparities in Average Jail Detention Days, Before and After the Passage of Proposition 47, With and Without Controlling for Arrest Charges, Criminal Justice Status, and San Francisco and Statewide Criminal History
Notes: The dots in the figure represent estimates of the difference in the outcome relative to whites. The line through the dot demarks the 95 percent confidence interval for the estimate.
Black
Hispanic
Asian
-5 0 5 10 15 -5 0 5 10 15
Before Proposition 47 After Proposition 47
No controlsControlling for arrest charges and criminal justice statusControlling for arrest charges, status, and criminal history
Difference relative to whites

67
Figure 3.6: Initial Charge Filing Outcomes and Key Disposition Outcomes for Felony Arrests by Race and Ethnicity
0.388
0.113 0.107
0.389
0.064
0.178
0.387
0.095 0.099
0.372
0.1060.128
0.1
.2.3
.4P
ropo
rtion
of A
rres
ts
Asian Black Hispanic White
A. Most Serious Charges Filed
Proportion with Felony Charges Filed
Proportion with Misdemeanor Charges Filed
Proportion Released to Other Agency/Revoked
0.248
0.064
0.130
0.043
0.269
0.037
0.203
0.029
0.254
0.056
0.119
0.039
0.255
0.062
0.144
0.046
0.1
.2.3
Pro
porti
on o
f Arr
ests
Asian Black Hispanic White
B. Most Serious Disposition Outcome
Proportion with Felony Conviction
Proportion with Misdemeanor Conviction
Proportion Released to Other Agency/Revoked
Proportion Succesfully Diverted

68
Figure 3.7: Initial Charge Filing Outcomes and Key Disposition Outcomes for Misdemeanor Arrests by Race and Ethnicity
0.005
0.542
0.0450.005
0.275
0.081
0.004
0.345
0.0410.004
0.337
0.045
0.2
.4.6
Pro
porti
on o
f Arr
ests
Asian Black Hispanic White
A. Most Serious Charges Filed
Proportion with Felony Charges Filed
Proportion with Misdemeanor Charges Filed
Proportion Released to Other Agency/Revoked
0.003
0.430
0.0550.027
0.004
0.1350.097
0.0280.003
0.220
0.050 0.0320.003
0.205
0.0550.032
0.1
.2.3
.4P
ropo
rtion
of A
rres
ts
Asian Black Hispanic White
B. Most Serious Disposition Outcome
Proportion with Felony Conviction
Proportion with Misdemeanor Conviction
Proportion Released to Other Agency/Revoked
Proportion Succesfully Diverted

69
Figure 3.8: Proportion of Felony Arrests by Offense Type Resulting in Felony Charges Filed (figure on the left) and a Felony Conviction (figure on the right)
0.202
0.162
0.110
0.239
0.420
0.386
0.337
0.674
0.214
0.376
0.464
0.478
0.455
0.525
0.452
0.491
0.413
0.412
0.397
0.435
0.312
0.327
0.395
0.326
0 .2 .4 .6 .8Felony Charges Filed
Felony other
Felony Lewd Behavior, other sex
Felony weapons
Felony drug
Felony property
Felony person
White
Hispanic
BlackAsian
WhiteHispanic
Black
Asian
White
Hispanic
BlackAsian
WhiteHispanic
Black
Asian
White
Hispanic
BlackAsian
WhiteHispanic
Black
Asian
Felony charges filed
0.143
0.105
0.079
0.177
0.288
0.281
0.283
0.391
0.128
0.261
0.273
0.319
0.270
0.310
0.298
0.293
0.316
0.296
0.296
0.300
0.220
0.226
0.271
0.195
0 .1 .2 .3 .4Convicted of a Felony
Felony other
Felony Lewd Behavior, other sex
Felony weapons
Felony drug
Felony property
Felony person
White
Hispanic
BlackAsian
WhiteHispanic
Black
Asian
White
Hispanic
BlackAsian
WhiteHispanic
Black
Asian
White
Hispanic
BlackAsian
WhiteHispanic
Black
Asian
Felony conviction

70
Figure 3.9: Proportion of Misdemeanor Arrests by Offense Type Resulting in Misdemeanor Charges Filed (figure on the left) and a Non-Felony Conviction (figure on the right)
0.072
0.067
0.061
0.030
0.389
0.414
0.300
0.668
0.173
0.181
0.115
0.328
0.553
0.489
0.545
0.667
0.196
0.208
0.220
0.266
0 .2 .4 .6 .8Misdemenor Charges Filed
Local ordinance
Misdemeanor other
Misdemeanor drug
Misdemeanor property
Misdemeanor person
White
Hispanic
Black
Asian
White
Hispanic
Black
Asian
White
Hispanic
Black
Asian
White
Hispanic
Black
Asian
White
Hispanic
Black
Asian
Misdemeanor charges filed
0.032
0.027
0.028
0.023
0.274
0.307
0.168
0.585
0.093
0.113
0.044
0.203
0.236
0.138
0.225
0.342
0.088
0.091
0.096
0.080
0 .2 .4 .6Convicted of a Non-Felony
Local ordinance
Misdemeanor other
Misdemeanor drug
Misdemeanor property
Misdemeanor person
White
Hispanic
Black
Asian
White
Hispanic
Black
Asian
White
Hispanic
Black
Asian
White
Hispanic
Black
Asian
White
Hispanic
Black
Asian
Non-Felony conviction

71
4. Empirical Strategy for Disentangling the Effects of Prior Case Characteristics vs. SFDA Adjudication Choices in Explaining Racial and Ethnic Disparities in Disposition and Sentencing Outcomes
The primary focus of this study is how practices and procedures in the SFDA’s office
contribute to or mitigate racial disparities in case dispositions. With this aim in mind, it is
important to distinguish between factors that are likely to impact case outcomes that are
determined prior to case submission to the office of the SFDA and factors that are under the
control of the SFDA. When a case is referred to the DA, there are many aspects of the case that
are determined and beyond the control of the office. First, whether the individual was booked
and detained or simply issued a street citation is a product of how the arrest is handled by the
police. Moreover, whether an individual who is detained bails out of jail prior to or after
arraignment depends on the access the individual has to personal resources needed to post
bond. As racial disparities in pre-trial detention may contribute to racial disparities in case
outcomes, this factor must be accounted for. Second, each new case comes with a list of criminal
charges as recorded by the arresting officer. These charges will reflect the underlying alleged
criminal behavior and to some degree the discretion of the arresting officer. Third, the criminal
history of the arrestee and whether the individual is on probation or parole or has another open
criminal case is predetermined and certainly relevant to how a case is handled.
Regarding factors under the control of the SFDA, the office can choose whether to file
charges, whether to release the individual to another agency, whether to levy special allegations
such as charges that trigger various sentencing enhancements, and whether to impede pre-trial
release. Moreover, the office may file charges that differ from those recorded at arrest, with

72
these differences usually tending towards lower severity as we documented in the previous
section.
Understanding the contribution of pre-determined factors and choices under the control
of the SFDA to racial disparities requires that we separately analyze the contributions of these
variables. In this section, we layout our empirical methodology for addressing this issue. We
begin first by discussing a simple multivariate analysis that sequentially controls for the
characteristics of cases presented to the SFDA with the aim of decomposing racial disparities in
disposition and sentencing outcomes into their root sources. Next, we discuss an alternative
strategy to test for differential treatment of criminal suspects by race and ethnicity that relies on
the outcomes of criminal cases filed by the SFDA. The outcome test basically assesses whether
there is a racial disparity in the rate at which filed cases are dismissed by the court. Such a
disparity may be the result of police holding suspects of certain groups to differential standards,
the DA filing weaker cases against suspects from specific groups, or both. Below, we detail the
methods used to implement these two analytical strategies.
A. Multivariate Analysis of Disposition Outcomes
Our primary empirical results employ multivariate regression analysis to assess the
degree to which disparities in specific outcomes can be explained by factors that are
predetermined from the perspective of the SFDA and factors that are under the control of the
SFDA. We begin by estimating a base model that omits all statistical controls. Specifically, let i
index individual arrests and define Outcomei as the disposition or sentencing outcome of interest.
Define the variables Blacki, Hispanici, and Asiani as indicator variables that take the value of one

73
for Black, Hispanic, and Asian arrests, respectively. Restricting, the sample to arrests involving
suspects that are White, Black, Asian, or Hispanic, we estimate the following model:
(1)
where εi is a random error term, and α, β1, β2, β3 are parameters to be estimated. The estimates
of β1, β2, and β3 provide baseline estimates of the average disparity in the outcome of analysis
for Black, Asian, and Hispanic suspects relative to White suspects arrested within San Francisco
and referred to the SFDA. This represents the raw disparity as it does not adjust for any case-
related factors.
Next, we estimate a more complex specification that accounts for factors that are pre-
determined prior to a case’s referral to the SFDA. Specifically, let k=(1,…,7) index the seven most
serious charges recorded on a given court number with severity declining as we move from
charge 1 to charge 7, and let j=(1,…,66) index the 66 specific offense categories listed in Table
4.1. Define the indicator variable Arrest Chargekji as equal to one if charge number k for suspect
i, is for offense j. Define the variable Attemptki as an indicator variable equal to one if the charge
k is recorded as attempt and the variable Multiplei as an indicator variable indicating that multiple
court numbers are recorded at arrest i. Finally, define the variables Detainmi where m=(0,1,,…,29)
as dummy variables indicating zero through 29 days of pre-trial detention (the omitted category
being thirty days or more). Using these additional variables plus measures of criminal history (to
be discussed shortly), we estimate a modified version of equation (1) given by
(2)
,321 iiiii HispanicAsianBlackOutcome εβββα ++++=

74
Estimates of β1, β2, and β3 from equation (2) provide the remaining disparities in the outcomes
of interest between Black, Asian, and Hispanic suspects relative to White suspects after
accounting for racial differences in arrest charges, whether the charge was attempt, criminal
history inclusive of having multiple court numbers associated with an arrest, and the extent of
pre-trial detention. Comparing these differentials from estimating equation (2) to the
comparable differentials from estimating equation (1) permits assessment of the degree to which
pre-determined factors explain the racial disparities that we documented in the previous section.
To be specific, to the extent that the residual disparities from equation (2) are smaller than the
unadjusted disparities from equation (1), one would conclude that the predetermined factors
listed on the right hand side of equation (2) are responsible for the differences.
We can be more specific regarding the contributions of specific factors to racial disparities
in outcomes. Gelbach (2016) presents a simple methodology for decomposing the change in a
regression coefficient associated with adding control variables to a multivariate model. The
methodology is best illustrated with a simple hypothetical example. Suppose that the mean
difference between Black and White suspects in the proportion of cases that are released to
another agency is 10 percentage points. Suppose further that once one adjusts for whether the
arrest was for a felony and whether the suspect has an open case at the time of the arrest the
disparity reduces the zero. Clearly controlling for these two factors explains the racial disparity.
.
29
0
7
1
66
1
7
1321
)(
arg
im
mimi
k j kkikkjikjiiii
historyoffensefDetainMultiple
AttempteChArrestHisapnicAsianBlackOutcome
εκϕ
δγβββα
+++
++++++=
∑
∑∑ ∑
=
= = =

75
However, how much should be attributed to the racial disparity in the likelihood of an open case
relative to the racial disparity in the likelihood that it was a felony arrest?
Gelbach shows that the differences between the adjusted and unadjusted differential
would be equal to the sum of (1) the racial disparity in the proportion of cases that are open
multiplied by the effect of having an open case on the likelihood of being referred to another
agency (with the effect measured from the multivariate regression), and (2) the racial disparity
in the likelihood that the arrest was a felony arrest multiplied by the effect of a felony arrest on
the likelihood of an external referral. In other words, we can use the change in the disparity
associated with the multivariate adjustment to apportion relative blame to these two factors in
creating the racial disposition disparity. Moreover, this method easily extends to situations where
there are many control variables used in the multivariate analysis.15
Using this methodology, we decompose racial disparities in disposition and sentencing
outcomes into the following underlying sources:
• a component due to racial disparities in the nature of the arrest charge list
• a component due to racial disparities in the likelihood of having an open case (measured
by multiple court numbers associated with a single arrest),
• a component associated with racial disparities in the extent of pre-trial detention
15 More formally, suppose we first estimate the bivariate base regression model Outcomei = αbase + βbaseBlacki + εi where Outcomei is the dependent variable of interest, Blacki is a dummy variable indicating a Black suspect, and εi is a random error term. In this model the estimate of the coefficient βbase provides the unadjusted racial disparity in this outcome. Suppose we then estimate the multivariate model Outcomei = αmulti + βmultiBlacki +φOpen Casei+γFelony arresti + εi where we have added the additional variables Open Casei and Felony arresti which are indicators of having another open case at the time of arrest and that the arrest was for a felony charge. Gelbach (2016) shows that the difference between βbase and βmulti is given by the following equation: βbase - βmulti = φΔopen case +γΔFelony Arrest, where Δopen case and ΔFelony Arrest are the black white disparities in the proportion of arrests where the suspect already has an open case and the proportion of arrests that are felony arrests.

76
• a component associated with racial disparities in criminal history,
• and the unexplained component that remains after controlling for pre-determined case
characteristics.
In the results below, we find that most of the racial disparities in outcomes can be attributable
to average racial disparities in these factors. However, for some outcomes small disparities
remain. For these outcomes, we estimate a more detailed specification that adds factors under
the control of the SFDA. Specifically, define Filed Chargekji as a set of indicator variables equal to
one if the kth charge for arrest i is for offense j, , and define the variable Special Allegationi as an
indicator variable equal to one if special allegation charges are filed by the SFDA beyond the
arrest charge list. With these additional variables we estimate the following specification:
(3)
Comparing estimate of β1, β2, and β3 from estimating equation (3) to those from estimating
equation (2) will reveal the extent to which choices made by the DA following presentation of
the case by the police explain racial disparities in the outcomes (as we assume that filing and
special allegations are at the discretion of the DA).
In addition to estimating these equations for the whole sample of cases pooled, we
explore heterogeneity in effect sizes along several dimensions. Specifically, we estimate separate
.
7
1
66
1
7
1
29
0
7
1
66
1
7
1321
arg)(
arg
ii
k j kkikkjikj
mmimi
k j kkikkjikjiiii
AllegationSpecial
AttemptFiledeChFiledhistoryoffensefDetainMultiple
AttempteChArrestHisapnicAsianBlackOutcome
εϖ
θλκϕ
δγβββα
++
+++++
++++++=
∑∑ ∑∑
∑∑ ∑
= = ==
= = =

77
models for cases where there is only one court number associated with the arrest and where the
suspect has no recent San Francisco criminal history. We also explore heterogeneity in the
results associated with estimating separate models for the pre- and post-proposition 47 periods.
Before proceeding to the actual results, we must discuss in a bit more detail how some of
the variables listed in the model specifications are constructed and measured. The administrative
data for this project has fairly complete data on race but does not fully document Hispanic
ethnicity. To address this shortcoming, we merge each record by surname to data from the U.S.
Census Bureau indicating the percent of people with the same surname in the U.S. who self-
identify as Hispanic. The Census Bureau data includes all surnames with at least 100 individual
respondents observed in the 2000 census, a database that covers roughly 90 percent of the
population. We were able to merge roughly 90 percent of our cases to this data base and impute
Hispanic ethnicity for anyone with a surname where 85 percent or more of respondents self-
identify as Hispanic.
Arrest charges and filed charges are recorded by penal codes in the administrative data.
We use a penal code crosswalk maintained by the California Department of Justice to map each
penal code into one of 66 specific offense categories. Table 4.1 presents the distribution of cases
across these offense categories (with bolded figures providing sub totals that sum to 100 percent
within columns) for suspects from each racial and ethnic group. The offenses are listed from
most to least severe, with the ordering relying on a charge severity hierarchy developed for the
purposes of classifying offenses in the Federal Bureau of Investigation’s Uniform Crime Reporting
Program. We identify the seven most serious arrest charges for each case and create dummy
variables indicating whether each of the seven charges is described by the 66 categories. Note,

78
for cases that have fewer than seven arrest charges, all of the dummy variables for the higher
order charges (for example, charges 5, 6, or 7) will be zero. We also use the classification schema
to identify the seven most serious filed charges and create sets of dummy variables consistent
with the model specification in equation (3).
We received from the SFDA a list of supplement charges deemed special allegations that
are filed by the DA in cases that are eligible for specific enhancements, such as enhancements
for gang affiliation or specific weapons charges. We use this information to flag cases where
special allegations are levied and control for this variable in model (3).
As the reader will note, in model (2) we control for whether the defendant is detained for
up to 29 days pre-trial, with a dummy variables specification that permits a flexible functional
form relationship between the outcomes of analysis and pre-trial detention. To be sure, factors
other than the actions of the DA such as wealth and access to social networks may impact pre-
trial detention after arraignment independently of the actions of the SFDA. Moreover, there are
enormous racial disparities in the averages of these control variables, and the manner in which
they are included may influence the conclusions we draw from the analysis. Beyond arraignment,
however, further pre-trial detention may certainly be influenced by the DA’s office, and thus pre-
trial detention is not entirely a pre-determined factors. It is likely impossible to disentangle the
effects of defendant indigence from the actions of the ADA in charge of a case in determining the
extent of pre-trial detention. To assess the maximal contribution of pre-trial detention to racial
disparity (that is to say, an upper bound estimate) we control for the extent of pre-trial detention
both pre and post arraignment.

79
Finally, we employ two sets of variables to measure the individual’s criminal history at
the time of arrest. Using the San Francisco administrative records, we measure prior arrests,
prior convictions, and prior prison, jail, and probation sentences since 2008. We use the offense
categories deployed in table 3.4 and for each category and create three dummy variables
measuring one, two, or three or more of each arrest, conviction or sentencing outcome occurring
within San Francisco. We use the state criminal history record data to calculate similar criminal
history variables for arrest cycles, convictions, and prison, jail, and probation sentences. For the
arrest cycles we use a somewhat more expansive/disaggregated set of offense categories, with
felony offenses being classified into murder, rape, robbery, assault, kidnapping, burglary, larceny
theft/fraud, drugs, other sex, weapons, and other felony. Misdemeanor arrests and convictions
are classified as person, property, drug, theft, or other. To classify each offense observed in the
in state criminal history records, we identify the most serious arrest and conviction charges and
the most serious sentence. Again for each criminal history element (e.g., murder arrests, burglary
convictions, prison sentences) we created dummy variables indicating one, two, or three or more
of each and fully control for these variables in model specifications (2) and (3).
B. An Outcome Test for Differential Treatment
The methodology discussed above essentially tests whether observed disparities can be
completely explained by observable case factors, and then attempts to attribute responsibility to
factors that are predetermined from the DA’s perspective as opposed to factors that are under
the DA’s control. Residual disparities that remain after statistical adjustment may be due to
differential treatment or legitimate differences in case factors that are not observed with
administrative data. The inherent ambiguity of remaining disparities have led researchers to

80
seek alternative tests for discriminatory behavior that rely on very specific outcome tests
intended to identify situations where members of different groups are held to differential
standard. Early examples of this methodology appear in debates during the 1990s surrounding
discrimination in home mortgage markets. An influential study by economists at the Boston
Federal Research Bank documented that Black and Hispanic loan applicants were considerably
more likely to be denied after adjusting for credit history, property characteristics, and a host of
other factors usually considered by lenders when evaluating a potential borrower (Munnell et.
al. 1996). The methodology employed was quite similar in nature to what we proposed in the
previous section. Critics of the results of this study argued that a better gauge of differential
treatment would be to test whether Black and Hispanic applicants with approved loans were less
likely to default on their loans relative to white applicants, the argument being that if minority
borrowers are being held to a higher underwriting standard they should exhibit better outcomes
than White applicants. Hence testing for a racial or ethnic difference in this particular outcome
amounts to testing for a difference in treatment in the evaluation of applicants from different
groups.
A drawback of this method concerns a subtle technical assumption that must be met for
the results of this particular test to be definitive. Namely, such tests often rely on the assumption
that the underlying distributions of whatever factor is being used to separate those who are
approved from those who are denied is the same across racial groups. In the context of the
mortgage example, suppose that Black and White loan applicants are held to the same standard
(for example, must have a credit score that exceeds a given minimum), and thus that there is no
discrimination. Assume further that among those who meet the standard Black applicants have

81
lower average credit scores than White applicants. Hence, a fair process will result in higher
default rates among approved Black applicants relative to approved White applicants given the
differences in credit scores among the approved. In fact, in this example holding Black applicants
to a higher standard (that is to say, introducing discrimination) would tend to equalize default
rates. Hence, a test of outcomes that shows equal default rates may be consistent with
differential treatment if this subtle assumption is violated.
Despite this caveat, outcome tests have been applied to several criminal justice outcomes
to test for differential treatment of racial and ethnic minorities. For example, Ayres and
Waldfogel (1994) provide an outcome test for racial discrimination in bail setting based on the
fees charges by bail bond dealers. The authors argue that competition among bail bond servicers
should drive the price of a bond (usually the non-refundable fee that an arrestee must pay the
bondsman) to the average cost of posting bail (equal to the likelihood that the individual flees
multiplied by the forfeited bail). They show that in New Haven, Connecticut during the early
1990s, bail amounts for Black defendants exceeded on average the bail amounts set for White
defendants. However, the ratio of the fee to the bail amount for Black pre-trial defendants was
lower than the comparable ratio for White defendants, suggesting that bail bond services were
revealing the belief through their pricing that courts were setting unreasonably high bail amounts
for Black suspects.
Outcome tests have been applied widely in empirical assessments of whether specific
police departments are engaging in racial profiling. The basic form of the test involves assessing
whether searches of members of different racial groups yield differential outcomes in terms of
contraband discovery. For example, if White searches generate a drug discovery 20 percent of

82
the time while Black searches generate discovery 10 percent of the time, the data suggest that
the police may be differentially targeting black suspects and in a manner that cannot be justified
by a differential propensity to carry.16 Hence, differences in “hit rates” are often used as a
potential indicator of racial profiling or, on an individual officer basis, of a potential problematic
officer. Key studies of racial profiling by the police that rely on tests for differential hit rates
include Anwar and Fang (2006), Antonovics and Knight (2009), Ayres and Borowsky (2008),
Knowles, Persico and Todd (2001), and Sanga (2009).
Here we propose a version of the outcome test adapted to cases filed by the SFDA’s office.
To be specific, we restrict the sample to cases where charges are filed by the SFDA and test for
whether the rate at which cases are dismissed by the court differs across racial/ethnic groups.
To the extent that the dismissal rate is higher for one group relative to another holding all pre-
determined factors constant, one would infer that judges are more likely to find problems in the
cases filed against member of a specific group. To be sure, such an outcome may reflect
differential treatment by the police not checked by the filing decision of the SFDA or implicit
differential evidentiary and severity thresholds used to determine whether to file. Moreover,
16 This of course raises a more fundamental question regarding the actual objectives that police are pursuing or should be pursuing. If police are seeking to maximize contraband discovery, then the evidence from the outcome test would be consistent with racial profiling. However, one might contend that discovering contraband should be pursued only as a means toward minimizing the social costs of crime and punishment. Manski (2006) offers a more general framework for analyzing optimal enforcement strategies where the social costs of completed offenses, punishment, and searches are considered in allocating enforcement resources and determining the optimal rates to stop and search individuals from different demographic groups. Optimal enforcement strategies depend on the degree to which the criminal behavior of individuals can be deterred and the degree to which deterrence effects vary across individuals. Social costs are minimized by concentrating enforcement on groups whose offending is more responsive to changes in the search probability. In the face of such heterogeneity, an optimal strategy may certainly result in differential ex-post offending (i.e. hit rates) among members of difference groups. With this alternative framing of society’s objectives, there are no clear predictions regarding how hit rates should vary in the presence of discriminatory treatment targeted at one demographic group.

83
judges may themselves exhibit bias in deciding which cases to dismiss. Hence, interpreting these
differentials requires care and caveating, issues we will discuss in greater detail with the
presentation of the results below.
Figure 4.1 presents comparisons of the proportion of filed cases that are dismissed by the
court by race and ethnicity. The figure presents separate estimates for all cases pooled, for cases
where the arrest is not associated with multiple court numbers, and for arrests where the
individual has no observable criminal history in San Francisco. We do see the highest dismissal
rates for cases filed against Black defendants and lowest rates for cases filed against Asian
defendants. Below we will assess whether these disparities can be explained by differential cases
characteristics using multivariate regression analysis.

84
Table 4.1 Distribution of Cases Presented to the District Attorney by Most Serious Arrest Charge Using Detailed Charge Categories and by Race ( bolded sub-totals sum to 100 percent within columns) White Black Asian Hispanic Felony Person 12.65 14.8 22.21 16.88 Willful Homicide 0.5 0.85 1.47 1.07 Manslaughter - Non Vehicular 0.01 0 0.05 0.01 Manslaughter -Vehicular 0.03 0.01 0.03 0.03 Forcible Rape 0.16 0.22 0.44 0.32 Robbery 1.9 4.53 3.14 3.17 Assault 10.03 9.12 16.93 12.25 Kidnapping 0.02 0.07 0.15 0.03 Felony Property 12.98 12.5 16.34 8.76 Burglary 5.77 5.85 6.16 3.46 Theft 6.29 5.73 8.85 4.49 Motor Vehicle Theft 0.59 0.56 0.8 0.55 Forgery, Checks, Access Cards 0.33 0.36 0.53 0.26 Felony Drugs 14.93 21.24 10.99 15.74 Narcotics 7.71 16.93 4.28 11.32 Marijuana 3.11 2.32 2.52 1.79 Dangerous Drugs 4.06 1.89 4.14 2.59 Other Drug Law Violations 0.05 0.1 0.05 0.04 Felony Lewd Behavior, Other Sex 0.61 0.64 0.7 0.62 Lewd and Lascivious 0.06 0.03 0.09 0.15 Unlawful Sexual Intercourse 0.02 0.01 0 0.02 Other Sex Law Violations 0.53 0.6 0.61 0.45 Weapons 0.63 1.29 1.09 1.11 Felony Other 3.96 3.82 4.66 3.95 Drive Under the Influence 0.53 0.16 0.94 0.78 Hit and Run 0.11 0.04 0.14 0.14 Escape 0.02 0.01 0.02 0.01 Bookmaking 0 0 0 0 Arson 0.22 0.08 0.38 0.07 Felony Traffic, Accessory, Treason, Abortion, Bigamy, Bribery, Extortion, Neglect, Perjury, Malicious Mischief, Gambling, Other Felony 2.14 1.36 2.35 2.09

85
Table 4.1 Distribution of Cases Presented to the District Attorney by Most Serious Arrest Charge Using Detailed Charge Categories and by Race ( bolded sub-totals sum to 100 percent within columns) White Black Asian Hispanic Federal Offense 0.02 0.01 0.03 0.02 Probation/Parole –Felony 0.92 2.16 0.8 0.84 Misdemeanor Person 13.61 9.77 9.42 11.98 Vehicular Manslaughter 0.01 0.01 0.08 0 Assault and Battery 9.17 7.09 7.63 8.92 Petty Theft 4.43 2.67 1.71 3.06 Misdemeanor Property 0.47 0.34 0.26 0.45 Other Theft 0.44 0.32 0.24 0.43 Checks, Access Cards 0.03 0.02 0.02 0.02 Misdemeanor Drug 3.57 4.34 1.45 2.73 Marijuana 0.9 0.92 0.39 0.79 Dangerous Drugs 0.77 0.45 0.26 0.74 Other Drug Law Violations 1.9 2.97 0.8 1.2 Misdemeanor Other 25.23 15.32 25.21 27.86 Indecent Exposure 0.14 0.08 0.05 0.09 Annoying Children 0.17 0.12 0.02 0.31 Obscene Matter 0.01 0 0 0 Lewd Conduct 0.04 0.01 0.03 0.02 Prostitution 1.86 1.41 0.77 3.04 Contributing Delinquency of Minor 0.01 0.01 0.02 0.04 Liquor Laws 0.89 0.53 0.97 1.27 Disorderly Conduct 2.95 1.78 0.41 0.99 Disturbing Peace 0.3 0.16 0.11 0.19 Vandalism 1.17 0.4 0.35 0.82 Malicious Mischief 0.08 0.06 0.08 0.07 Trespassing 3.24 1.57 0.7 1.63 Weapons 0.17 0.12 0.14 0.2 Drive Under the Influence 7.04 1.68 16.96 8.41 Hit and Run 0.19 0.09 0.09 0.33 Selected Traffic 0.09 0.08 0.12 0.18 Joy Riding 0.01 0.01 0.02 0.01 Gambling 0.01 0.03 0.02 0.04 Non-Support 0 0 0 0 Glue Sniffing 0.01 0 0 0.01 CI/CO Ordinances 0.31 0.17 0 0.17 Failure to Appear/Non-Traffic 0.02 0 0 0 Other Misdemeanors 2.9 3.99 3 2.95

86
Table 4.1 Distribution of Cases Presented to the District Attorney by Most Serious Arrest Charge Using Detailed Charge Categories and by Race ( bolded sub-totals sum to 100 percent within columns) White Black Asian Hispanic Burglary tools 0.31 0.19 0.21 0.14 Other Sex Offenses 0.01 0.01 0.02 0.05 Arson-Misdemeanor 0 0 0 0 Probation-Parole Misdemeanor 0 0.01 0 0 Truancy 0 0 0 0 Miscellaneous Traffic 3.15 2.7 1 6.78 Burglary Misdemeanor 0.15 0.11 0.12 0.12 Local Ordinance, Other 10.32 15.23 7.55 8.59 Unknown 1.05 0.7 0.17 1.35

87
Figure 4.1: Proportion of Filed Cases Dismissed by the Court by Race/Ethnicity
0.120
0.187
0.169 0.167
0.0
5.1
.15
.2P
ropo
rtion
of c
ases
dis
mis
sed
by th
e co
urt
Asian Black Hispanic White
A. All Cases
0.117
0.194
0.166 0.167
0.0
5.1
.15
.2P
ropo
rtion
of c
ases
dis
mis
sed
by th
e co
urt
Asian Black Hispanic White
B. Cases Without Multiple Court Numbers at Arrest
0.127
0.1650.151
0.159
0.0
5.1
.15
.2P
ropo
rtion
of c
ases
dis
mis
sed
by th
e co
urt
Asian Black Hispanic White
C. Cases With No San Francisco History Since 2008 (2010 and later)

88
5. Empirical Results Part I: Multivariate Analysis of Disposition Outcomes
In this section, we present the main analysis of racial/ethnic disparities in case disposition
outcomes. We begin with an analysis of broad disposition outcomes (whether a case is filed,
results in a successful diversion, an alternative action, or a conviction), followed by an analysis of
the filing choices made by the SFDA. We then analyze racial disparities in felony conviction for
felony arrests and any conviction for misdemeanor arrests. Finally, we analyze the determinants
of disparities in the likelihood of receiving an incarceration sentence, the likelihood of receiving
a prison sentence, and sentence length conditional on conviction.
For each outcome, we begin by graphically displaying the unadjusted disparities relative
to White suspects for Black, Hispanic, and Asian suspects. We then compare these unadjusted
differentials to those that statistically adjust for arrest charges, criminal justice status at the time
of arrest, post-arrest pre-arraignment detention, and criminal history. We focus on arrests
occurring in 2010 or later for the purpose of having at least two years of prior data from which
to construct the local criminal history and since our data on pre-trial detention begins in 2010.
For some outcomes, we present separate analysis for all cases and for cases where there are not
multiple court numbers associated with the arrest and where the individual has no recent San
Francisco criminal history. The latter analysis is intended to identify a sub-sample that are more
comparable across race in terms of recent criminal history and criminal justice involvement. For
several outcomes, we also present separate analysis for cases occurring prior to the passage of
proposition 47 and after the passage of the proposition.

89
Following the comparison of the unadjusted and statistically adjusted disparities, we
decompose the sources of the differences in these disparities. To be specific, we assess the
degree to which the difference between the raw disparity in felony conviction rates between say
Black and White felony-arrest suspects and the statistically adjusted disparity is explained by
differences in arrest charges, criminal justice status, pre-trial detention, and criminal history. This
analysis employs the Gelbach (2016) decomposition method discussed in the previous section,
and takes into account the racial disparities in these explanatory factors and the impact of the
explanatory factor in question on the outcome being analyzed.
Note, as we discussed in the previous section the list of factors used to statistically adjust
the observable disparities are factors that are for the most part pre-determined from the
viewpoint of the SFDA –i.e., arrest charges, early detention, criminal history – and hence are not
influenced by choices made by the office. In some of the models, we find that there are
disparities in outcomes that are not fully explained by this list of factors. In these instances, we
explore whether adding additional case characteristics under the control of the SFDA further
explains the disparities. In particular, we add detailed controls for the actual filed charges as well
as control for whether special allegation charges are added to the charge list by the SFDA.
A. Broad Case Disposition Outcomes
Figure 5.1 graphically displays racial/ethnic disparities in (1) the likelihood that a case is
not filed or is dismissed, (2) the likelihood that a case results in a successful diversion, (3) the
likelihood that a case is released to another agency or a motion to revoke is filed (labeled an
alternative action is taken), and (4) the likelihood that the case results in any sort of conviction.

90
Disparities are measured relative to White suspects. For each racial/ethnic group, the figure first
displays the raw differential followed by the statistically adjusted differential. For each estimate,
the dot marks the differential relative to Whites while the bar through the dot shows the margin
of error of the estimate.17 A vertical line is inserted at the differential value of zero. Estimates
where the margin of error does not cross this vertical zero line represent statistically significant
differences while estimates where zero lies within the margin of error are not statistically
significant.
Black suspects are slightly less likely to simply have a case dropped or dismissed (by about
two percentage points) relative to Whites, while Asian suspects are considerably less likely to
have a case dropped or dismissed (a difference of approximately 10 percentage points). The
Hispanic-White differential for this outcome is not significantly different from zero. Statistically
adjusting for case characteristics explains all of the disparity in this outcome for Blacks relative
to Whites. In fact, after adjusting for observable case characteristics, Black suspects are slightly
more likely to have their cases dropped relative to White suspects. Nearly all of the Asian-White
disparity can be attributed to average differences in cases characteristics, with the residual
disparity of roughly two percentage point much lower than the unadjusted disparity of over ten
percentage point. For Hispanic suspects, we see that once we account for differences relative to
Whites in arrest charges, criminal justice status, pre-trial detention, and criminal history, Hispanic
suspects are slightly more likely to have cases dropped or dismissed. Racial and ethnic disparities
in the likelihood that a case results in a successful diversion are generally quite small (never
17 To be more precise, the bar shows the 95 percent confidence interval for each estimate.

91
greater than one percentage point). Statistically adjusting for case characteristics eliminates the
disparity in this outcome between Black and White suspects and leads to a slight positive
differential between Asian and White suspects. The Hispanic-White differentials in this outcome
are statistically insignificant.
The largest Black-White disparity occurs for the likelihood that an alternative action is
taken. The arrest of a Black suspect is roughly 6 percentage points more likely to result in being
released to another agency or to end in a motion to revoke. Hispanic suspects are slightly less
likely to experience this outcome (1.4 percentage points less likely relative to Whites), while the
difference between Asian and White suspects is small and statistically insignificant. Most of the
Black-White disparity in this outcome can be explained by observable case characteristics (the
statistically adjusted disparity is roughly one percentage points). Note, we cannot observe
whether the individual has an active criminal justice status in another jurisdiction. Hence, the
observed remaining disparity may be attributable to being on parole at the time of arrest, being
on probation in another county, or having an outstanding warrant from outside of San Francisco.
Finally, we observe the largest raw disparities in conviction rates for Asian suspects relative to
White suspects (on the order of 10 percentage points). This disparity is fully explained by pre-
determined case characteristics. Arrests of Blacks are significantly less likely to result in a new
conviction (with a raw difference of roughly three percentage points and a statistically adjusted
difference of 2 percentage points). Hispanic suspects are significantly more likely to be convicted,
with a raw differential of one percentage point. Observable case characteristics explain the entire
differential. In fact, once these characteristics are taken into account, we see that Hispanic
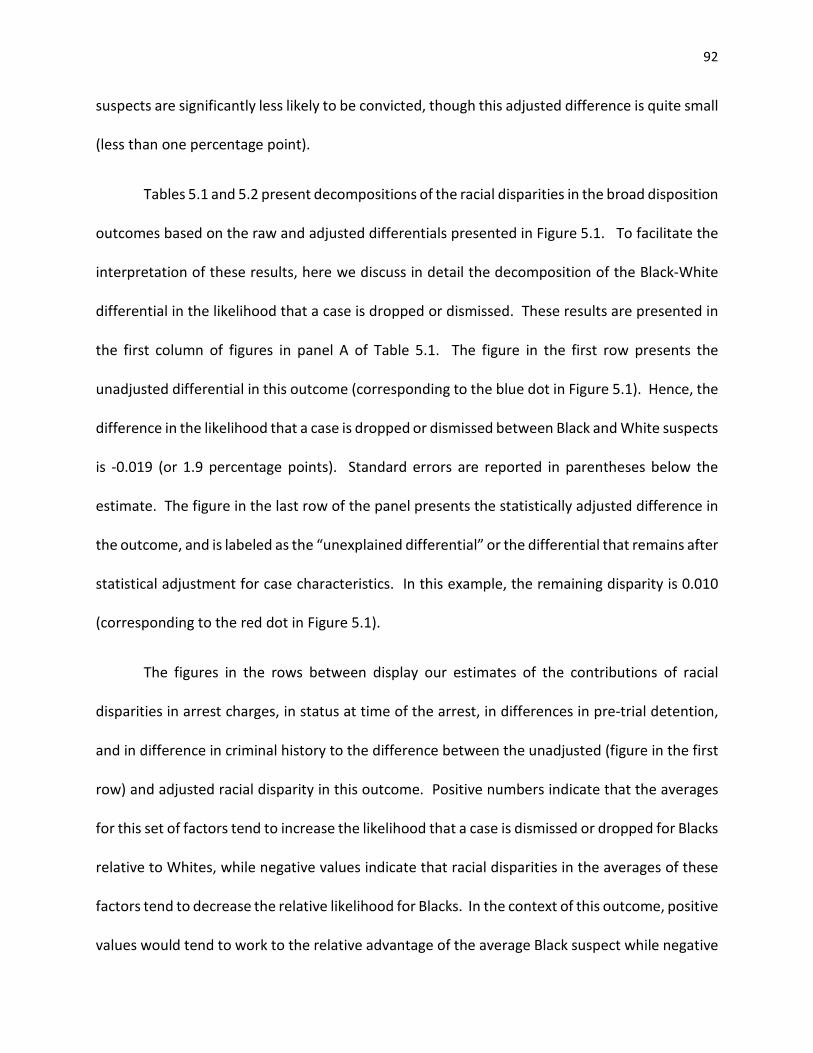
92
suspects are significantly less likely to be convicted, though this adjusted difference is quite small
(less than one percentage point).
Tables 5.1 and 5.2 present decompositions of the racial disparities in the broad disposition
outcomes based on the raw and adjusted differentials presented in Figure 5.1. To facilitate the
interpretation of these results, here we discuss in detail the decomposition of the Black-White
differential in the likelihood that a case is dropped or dismissed. These results are presented in
the first column of figures in panel A of Table 5.1. The figure in the first row presents the
unadjusted differential in this outcome (corresponding to the blue dot in Figure 5.1). Hence, the
difference in the likelihood that a case is dropped or dismissed between Black and White suspects
is -0.019 (or 1.9 percentage points). Standard errors are reported in parentheses below the
estimate. The figure in the last row of the panel presents the statistically adjusted difference in
the outcome, and is labeled as the “unexplained differential” or the differential that remains after
statistical adjustment for case characteristics. In this example, the remaining disparity is 0.010
(corresponding to the red dot in Figure 5.1).
The figures in the rows between display our estimates of the contributions of racial
disparities in arrest charges, in status at time of the arrest, in differences in pre-trial detention,
and in difference in criminal history to the difference between the unadjusted (figure in the first
row) and adjusted racial disparity in this outcome. Positive numbers indicate that the averages
for this set of factors tend to increase the likelihood that a case is dismissed or dropped for Blacks
relative to Whites, while negative values indicate that racial disparities in the averages of these
factors tend to decrease the relative likelihood for Blacks. In the context of this outcome, positive
values would tend to work to the relative advantage of the average Black suspect while negative

93
values work to their disadvantage. Starting from the statistically adjusted differential in the last
row, consecutively adding the contribution of each of these sets of case characteristics in the
rows above eventually yields the overall differential at the top of the table. Hence, the figures in
the second through fifth row provide an accounting of how each of these sets of case
characteristics explain the change between the adjusted and unadjusted differential.
For example, consider the value of -0.015 in the row labeled “Due to difference in criminal
history.” This figure indicates that given the average difference in criminal history between Black
and White suspects and the effect of criminal history on the likelihood that a case is dropped or
dismissed, the differences in criminal history would independently reduce the relative likelihood
that a case against an Black suspect is dropped by 1.5 percentage points. Similarly, difference in
pre-trial detention reduce this relative likelihood by 4.8 percentage points, while differences in
criminal justice status reduce this relative likelihood by 0.9 percentage points. On the other hand,
difference in arrest charges would increase the likelihood by 4.3 percentage points. In other
words, Black suspects are more likely relative to White suspects to be arrested for charges that
are often dropped or dismissed. Hence, for this outcome and for the Black-White differential,
average differences in status at arrest, pre-trial detention, and criminal history tend to reduce
the likelihood that cases are dropped against Black suspects while differences in arrest charges
tend to increase the likelihood. Collectively, these factors account for all of the raw racial
disparity in these outcomes.
Rather than walk through each decomposition individually, here we will highlight key
patterns that appear throughout all four outcomes. For African-American suspects, differences
in criminal history tend to work to their relative disadvantage, significantly decreasing the

94
likelihood that a case is dropped and that the case results in a successful diversion, while
increasing the likelihood that a case is released to another agency, that a motion to revoke is
filed, and that the case results in a new conviction. Average differences in arrest charges seem
to mitigate the negative outcomes (new conviction or case being released to another agency)
while increasing the likelihood a positive outcome (case being dismissed or a successful
diversion). This is particularly interesting since in section 3 we documented that Black suspects
are more likely to be arrested for a felony charge. Together these two sets of findings suggest
that African-Americans are arrested for less serious felonies that tend to results in dismissal or
diversion.
Black suspects are clearly disadvantaged by pre-trial detention. This factor alone
decreases the likelihood (relative to Whites) that a case is dropped or dismissed by 4.8
percentage points, increases the likelihood of being turned over to another agency by 2.0
percentage points, and increases the likelihood of a new conviction by 2.8 percentage points (all
estimates statistically significant at the one percent level of confidence).18 In terms of
magnitudes, the relative contributions of differences in pre-trial detention to racial disparities in
disposition outcomes are as large, or larger than, racial differences in criminal history. Finally,
racial disparities in the likelihood of having an active criminal justice status at the time of the
18 We also estimated these models with a more restrictive set of controls for pre-trial detention. Specifically, we estimated models with controls for no pre-trial detention, one day of detention, and two days of detention (with two or more days being the omitted group). This alternative specification is akin to controlling for pre-arraignment detention only. The contribution of pre-arraignment detention in these alternative specifications to the black-white disparities in these broad case disposition outcomes was 3.6 percentage points for the likelihood that the case is dropped, 1.7 percentage points for the likelihood that the case is referred to another agency, and two percentage points for the likelihood of a new conviction. These values are fairly close to the larger values reported above when we control for up to thirty days of pre-trial detention, suggesting that most of the effects of pre-trial detention are operating through early pre-arraignment detention.

95
arrest (gauged here as multiple court numbers associated with the arrest) generally works to the
disadvantage of Black suspects.
Turning to the relative disparities between Asian and White suspects, the main raw
differences we observe are for cases being dropped or dismissed (occurs roughly 10 percentage
points less frequently for Asian suspects) and convictions (occurs roughly 10 percentage points
more frequently for Asian suspects). In both instances, differences in the severity of arrest
charges between Asian and White suspects explains nearly all if not all of these disparities.
Differences in criminal history tend to work to the advantage of Asian suspects as do differences
in criminal justice status at the time of the arrest. These factors however are minor contributors.
Differences in arrest-charge severity are the main set of case characteristics driving Asian-White
disparities in disposition outcomes.
The raw differences in outcomes between Hispanic and White defendants are generally
quite small and often statistically insignificant. Hispanic suspects are significantly more likely to
be convicted (by roughly one percentage points) and less likely to be released to another agency
(by 1.4 percentage points). For the former outcomes, differences in arrest charge increase the
likelihood a new conviction for Hispanics (by 1.9 percentage points) though this is mitigated to
some degree by a lower likelihood pre-trial detention and less serious criminal histories among
Hispanic suspects relative to White suspects. The lower likelihood of being released to another
agency for Hispanics relative to Whites is explained entirely by a lower likelihood of having an
active criminal justice status and a less serious criminal history among Hispanic suspects.

96
Our comparison of average case characteristics by race and ethnicity reveals quite large
disparities in offense and criminal history characteristics. One might be concerned that the
differences across groups are too large along many dimensions to be adequately addressed using
multivariate regression techniques. To address this concern, Tables 5.3 and 5.4 reproduce the
analysis after restricting the sample of cases to those where there is only one court number
associated with the arrest (our proxy for an active criminal justice status) and where the
individual has no recent San Francisco criminal history. By necessity, the tables omits the
contributions of differences in criminal justice status at arrest as the sample has been restricted
to eliminate racial differences in this factor However, we still allow for a contribution of criminal
history that predates 2008 for incidents occurring in San Francisco or that occur elsewhere in the
state.
Black suspects are no more or less likely to have a case dropped or dismissed relative to
White suspects for this sample of “first timers.” Similarly, the Black-White difference in the
likelihood of a successful diversion is small and statistically insignificant. We still see that Black
suspects are significantly more likely to be released to another agency (by 3.1 percentage points)
and less likely to be convicted (by 4.1 percentage points). Behind the raw differences however,
there are distinct compositional effect associated with case characteristics. Again, we see that
arrest charge disparities tend to work towards increasing the likelihood that cases against Black
suspects are dropped and decrease the likelihood that cases result in a new conviction. Pre-trial
detention reduces the likelihood that a case is dropped, increases the likelihood of release to
another agency, and increases the likelihood of a new conviction for Blacks suspects.

97
We still see large disparities between Asian and White suspects in the likelihood that a
case is dropped (12 percentage points lower for Asian suspects) and the likelihood of conviction
(12 percentage points higher for Asian suspects). These disparities are for the most part
attributable to differences between White and Asian suspects in the composition of arrest
charges and statewide criminal history. Hispanic-White differences for all outcomes are
generally quite small (less than one percentage point for all raw disparities).
The results thus far suggest that racial and ethnic disparities in cases disposition outcomes
can for the most part be attributed to differences in case characteristics. The results also suggest
that outcomes depend on factors beyond the charges recorded at arrest, including criminal
history, criminal justice status at time of arrest, and whether one is detained prior to
arraignment. One might expect that the passage and implementation of proposition 47 in
November 2014 may have impacted the effects of these case characteristics on disposition
outcomes, and by extension, overall racial disparities in outcomes. Proposition 47 redefined a
set of drug and property crimes that could be charged either as a felony or misdemeanor as
straight misdemeanors. The proposition led to an immediate decline in arrests for drug felonies
and a somewhat smaller decline in drug arrests overall. The proposition also resulted in a decline
in property offense arrests and declines in bookings for drug and property offenses.
A decline in bookings and an increase in street citations should reduce the likelihood of
pre-trial detention for many crimes. In section 3, we saw that proposition 47 narrowed pre-trial
detention disparities, a factor that may translate into smaller disposition outcomes differences
and a lesser effect of pre-trial detention. Similarly, criminal history and status at time of arrest
likely matters more for felony arrests relative to misdemeanor arrest. Given racial disparities in

98
these background factors, the impact of proposition 47 may vary by racial groups, and in a
manner that is likely to narrow racial disparities by reducing the discretion in what can be charged
as a felony offense.
To investigate this possibility, Tables 5.5 and 5.6 reproduce the analysis of broad case
disposition outcomes for the time period prior to proposition 47 (all arrests made before
November 2014) and for the time period following the passage and implementation of
proposition 47 (all arrests made in November 2014 and later). The structure and interpretation
of the tables are similar to that of tables 5.1 and 5.2. Here, however, for each racial disparity
group we include two sets of estimates in two separate columns; one set analyzing the pre-
proposition 47 period and one set analyzing the post proposition 47 periods.
Beginning with the Black-White comparisons, we see substantial narrowing of the
unadjusted disparities relative to Whites. The overall Black-White differences narrows for cases
being dropped (from -2 to -1.2 percentage points), diverted (from -1.3 to 0.4 percentage points),
alternative actions taken (from 6.9 to 3.7 percentage points), and convictions (from -3 to -2.2
percentage points). We observe narrowing in the contributions of arrest charges, criminal
history, current criminal justice status, and pre-trial detention for all outcomes. We see similar
evidence of narrowing differentials for Asian-White disparities. While the raw disparity in the
likelihood that a case is dropped or dismissed remains the same (with Asian suspects 10
percentage points less likely relative to White to have cases dropped), we observe a substantial
narrowing in conviction rates. Hispanic-White differentials tend to the smaller side during both
the pre and post-proposition 47.

99
B. Differences in the propensity to file felony charges
Figure 5.2 presents estimates of racial/ethnic disparities in the likelihood that felony
charges are filed by the SFDA. The figure is structured in the same manner as that for the analysis
of disposition outcomes. For each racial/ethnic group, we present estimates of the difference
relative to Whites and present estimates of raw differences (labeled “no statistical controls”) and
differentials statistically adjusted for the list of pre-determined case characteristics used to
analyze disposition outcomes. We restrict the sample to felony arrests. Thus a positive
differential is indicative of a higher propensity to downgrade the offense to misdemeanor or to
not file charges at all for whites, while a negative differential indicates the opposite.
While we observe a positive and statistically significant unadjusted differential for Black
suspects relative to Whites, the difference is negative after adjusting for case characteristics. In
other words, once we hold constant arrest charges, criminal justice status at arrest, pre-trial
detention, and criminal history, felony charges are filed less frequently for African-American
suspects arrested for a felony offense. Similarly, we find a significantly higher rate of felony filings
against Hispanic suspects. However, adjusting for case characteristics reduces the differential
and renders the remaining difference statistically insignificant. The Asian-White differential is
relatively insensitive to controls for case characteristics and is marginally significant after
statistical adjustment. In all comparisons, the difference in the propensity to file felony charges
are relatively small (never more than 1.5 percentage points).
Table 5.7 presents a decomposition of the difference between the unadjusted and
adjusted racial disparities. For black suspects, differences in the composition of arrest charges

100
increase the likelihood of the filing of felony charges by 1.7 percentage points. The higher
likelihood of pre-trial detention also tends to increase the likelihood that felony charges are filed.
These two factors alone explain all of the unadjusted differential in this outcome. For Asian
suspects, controlling for observable case characteristics does not explain the 1.6 percentage
point difference in the likelihood that felony charges are filed.
C. Felony Conviction and Convictions Resulting from Misdemeanor Arrests
We have already analyzed racial disparities in the likelihood of conviction following arrest.
Here we focus more specifically on the likelihood of a felony conviction following a felony arrest
and the likelihood of any conviction following a misdemeanor arrest. We analyze these more
specific outcomes for the following reasons. Certainly the sentencing and collateral
consequences of felony convictions are the most severe. Felony convictions are the most likely
to result in an incarceration sentence and the necessary condition for a new prison term.
Moreover, a felony conviction often carries long-lasting consequences for employment
prospects, the ability to procure housing, and in some instance being able to participate in fairly
routine activities such as participating at a child’s school.
Cases resulting from misdemeanor arrests are the most likely to be dropped and may be
offenses for which effective counsel, being able to bail out of jail, etc. may have bigger impacts
on ultimate outcomes. We have already documented racial disparities in the contribution of
factors such as pre-trial detention. Such disparities may load more onto disparities in the
outcomes of misdemeanor cases to the extent that suspects of specific groups have differential
access to resources that may help in mitigating the consequences of the arrest.

101
Figure 5.3 displays raw disparities in the likelihood that a felony arrest results in a felony
conviction as well disparities that statistically adjust for pre-determined case characteristics.
Again, all disparities are measured relative to White suspects. We observe a statistically
significant and positive disparity between Black and White suspects (on the order of 1.3
percentage points). Adjusting for differences in pre-determined characteristics results in a
negative and statistically significant differential of 1.7 percentage points. In other words, after
adjusting for pre-determined case characteristics, Black suspects arrested on felony charges are
less likely to be convicted of a felony. For Hispanic and Asian suspects, we find statistically
insignificant differentials relative to White suspects for both the unadjusted and statistically
adjusted comparisons.
Table 5.8 presents the decompositions of the differences between the two differential
estimates apportioning relative culpability for the observed changes among the various sets of
pre-determined case characteristics. For Black suspects, we see that differences in arrest charges
relative to Whites alone would predict a 0.7 percentage point higher likelihood of a felony
conviction, equal in magnitude to the raw differential in this outcome. In addition, the results
indicate that the higher likelihood of pre-trial detention among Black suspects would increase
the likelihood of a felony conviction relative to White suspects by 2.9 percentage points. Note
this effect operates independently of all of the other sets of case characteristics controlled for in
the model (i.e., arrest charges, status at time of arrest, criminal history). Differences in criminal
history also significantly contribute to racial disparities in this outcome, though the magnitude of
the contribution of differences in criminal history is smaller than the impact of pre-trial detention.
The significant negative unexplained differential is consistent with the conjecture that to some

102
degree the disadvantages faced by Black suspects associated with factors such as pre-trial
detention are being partially offset in practice by how cases are handled within the SFDA office.
The unadjusted differential in felony conviction rates between Asian and White suspects
is small and statistically significant. Nonetheless, we see significant and largely offsetting
contributions of case characteristics to the Asian-White disparity. Status at arrest tends to
increase the likelihood (relative to whites) of a felony conviction for Asian suspects. However,
differences in criminal history and pre-trial detention reduce the felony conviction rates relative
to whites by a more than offsetting magnitude. The adjusted and unadjusted differentials are
the smallest for the Hispanic-White differential. Moreover, differences in average pre-
determined case characteristics do not independently contribute beyond small magnitudes to
these differentials.
Figure 5.4 displays the unadjusted and adjusted differentials in the likelihood that a
misdemeanor arrest results in a conviction. Most notably, we observe a sizable negative Black-
White difference in this outcome (of nearly seven percentage points) that declines to
approximately one percentage point after adjusting for observable case characteristics. We also
observe a very large and positive Asian-White differential of approximately 22 percentage points
that is completely explained by controlling for case characteristics. There is a very small yet
statistically significant and positive Hispanic-White disparity in this outcome that becomes
slightly negative and significant after adjusting for observable characteristics.
Table 5.9 presents the accompanying decompositions. For the Black-White
decomposition, we see that differences in arrest charges alone reduce the likelihood of a

103
conviction following a misdemeanor arrest by 6.5 percentage points for Black suspects relative
to White suspects. This magnitude is nearly equal to the overall unadjusted disparity in this
outcome. Again, we see that pre-trial detention works to the relative disadvantage of Black
suspects, increasing the conviction rate differential holding all else constant by 1.2 percentage
points. For the Asian-White differential, differences in arrest charges almost entirely explain the
differential. For the Hispanic-White differential, we see that Hispanic suspects are arrested for
charges that are more likely to result in conviction relative to white suspects.
D. Incarceration, Prison Sentences, and Overall Sentence Length
The final outcomes analyzed in this section pertain to incarceration sentences. We
analyze three outcomes: the likelihood that the arrest results in an incarceration sentence of any
kind (whether prison or jail), the likelihood that the arrest results in a new prison commitment,
and sentence length in months (regardless of whether it is a prison or jail sentence) for those
convicted of an offense. We present both analytical results for the entire observation period as
well as separate results for the pre- and post-proposition 47 time periods. For one outcome
(sentence length), we observe a Black-Whitedisparity that cannot be fully explained by pre-
determined case characteristics. We explore the extent to which the remaining differential can
be explained by adding further controls for variables under the control of the SFDA. Specifically,
we include results in our graphical analysis of an additional model that controls for the specific
filed charges (in addition to arrest charges) as well as a control for whether special allegations
are added by the SFDA when filing a case with the court.

104
Figure 5.5 graphically presents estimates of racial/ethnic disparities in the likelihood that
an arrest results in an incarceration sentence of any kind. We see that Blacks are less likely
relative to White suspects to receive a new incarceration sentence, both in the raw differential
as well as the adjusted differential. Any conclusions from this result should be qualified by the
fact that Black suspects are more likely to be released to another agency, a pathway that may
increase the likelihood of jail or prison time that we cannot observe in the data. To address this
issue in the decomposition analysis to follow, we also present separate estimates for cases
without multiple court numbers at arrest and where there is no recent San Francisco criminal
history.
Figure 5.5 reveals a small, positive, yet statistically significant Hispanic-White differential
that turns negative and insignificant once case characteristics are controlled for. There is a large
Asian-White disparity in the likelihood that the arrest results in an incarceration sentence, on the
order of 10 percentage points. Controlling for case characteristics reduces this disparity to a
small, negative, and marginally significant value.
Figure 5.6 presents results from models of racial disparities in the likelihood that a case
results in a state prison sentence. We should note from the outset that prison sentences are
quite rare in San Francisco (with White suspects sentenced to prison in roughly one percent of
the cases that we observe in the data). Nonetheless, we do observe disparities for this outcome
that merit careful analysis and study. The unadjusted disparity between Black and White
suspects is approximately one percentage point and is statistically significant. Adjusting for pre-
determined case characteristics eliminates the disparity yielding a small and statistically
insignificant residual difference. The Hispanic-White differential in the likelihood of receiving a

105
prison sentence is positive and significant but disappears once we control for pre-determined
case characteristics. The unadjusted Asian-White differential is positive yet not statistically
significant and becomes negative and marginally significant after statistical adjustment for case
characteristics.
Figure 5.7 presents our final graphical display for this section. The figure displays
unadjusted and adjusted racial disparities (relative to Whites) in sentence lengths measured in
months. Sentence length is calculated only for those who are convicted of some charge and is
set to zero for those who receive a non-incarceration sentence. Black defendants who are
convicted receive a sentence that is approximately 3 months longer on average than sentences
received by convicted White defendants. Controlling for predetermined case characteristics
explains most of this disparity, with an unexplained disparity remaining of roughly 0.4 months.
The additional estimate in green marks the differential after adjusting for the specific charges
filed by the SFDA inclusive of whether special allegations are added. Controlling for these
additional variables narrows the disparity slightly. These results suggest that the specifics of filing
choices explain only a small fraction of the disparity in this outcome beyond what is explained by
predetermined case characteristics. We also see a statistically significant longer average
sentence for convicted Hispanic defendants relative to convicted White defendants of
approximately one month. Differences in predetermined characteristics explain all of the
differences between Hispanic and White defendants in sentence length. The Asian-White
differentials in sentence length are slightly negative and are all statistically insignificant.
Having documented the basic differentials in these sentencing outcomes, we now take a
deeper dive into understanding the sources of theses differentials and how they may vary for

106
different groups of suspects and defendants. Specifically, we present decomposition analyses of
the contribution of the various sets of pre-determined characteristics to the sentencing
outcomes for convicted defendants (similar to our previous analysis of the other disposition
outcomes). In addition, we present separate analysis for each of these outcomes for all cases,
for cases where there is only a single court number associated with the arrest and no recent San
Francisco criminal history, for cases with incident dates occurring during the pre-proposition 47
period, and cases with incident dates occurring during the post-proposition 47 period.
Tables 5.10 and 5.11 present decompositions for racial disparities in whether there is any
incarceration sentence. Panel A of table 5.10 present results for all cases while panel B of table
5.10 presents analysis for those with no criminal justice status and limited criminal history.
Regarding the Black-White differentials, differences in criminal history and differences in pre-trial
detention tend to increase this differential (i.e., increase the relative likelihood of an
incarceration sentence for Blacks) while differences in arrest charges greatly reduce the
differential. The magnitude of the contribution of arrest charges is as large as the overall
differential and largely explains the lower likelihood of some incarceration for Black defendants.
For the Hispanic-White differential, differences in arrest charge more than explain the relatively
higher likelihood of an incarceration sentence for Hispanic defendants. Similarly, differences in
arrest charges explain almost all of the large Asian-White disparity in receiving some
incarceration as part of the sentence. The results for the sub-sample without multiple court
numbers and no recent San Francisco criminal history largely accord with the results for all cases.
Here however, we see no raw difference in incarceration sentences between White and Black

107
defendants, differences in pre-trial detention disadvantaging Blacks, and significant and negative
unexplained differential favoring Blacks.
In Table 5.11, we see a narrowing in the raw differentials relative to White defendants for
all groups with the passage and implementation of proposition 47, with a very large reduction in
the incarceration differential between Asian and White defendants. For the most part, racial
differences in arrest charge contribute less to disparity in this outcome for all groups and pre-
trial detention contributes less to the Black-White disparity in this outcome. Tables 5.12 and 5.13
provide a comparable analysis of racial disparities in the likelihood that convicted defendants
receive a prison sentence. Controlling for pre-determined characteristics reduces the Black-
White disparity in this outcome from just under 1 to approximately 0.02 percentage points.
Racial disparities in arrest charges, criminal history, and criminal justice status at time of arrest,
and pre-trial detention all increase the relative likelihood of a prison sentence for Blacks.
Together these factors explain all of the disparity. The small yet statistically significant difference
between Hispanic and White defendants in the likelihood of receiving a prison sentence is
entirely explained by differences in arrest charges. There are few notable patterns in the Asian-
White differential, as both the adjusted and unadjusted differentials are statistically insignificant.
For the most part, the results in panel B for less criminal involved defendants parallel the results
in Panel A.
In Table 5.13, we find a substantial narrowing of the Black-White differential in the
likelihood of receiving a prison sentence with the passage of proposition 47 (from one percentage
point to four-tenths of a percentage point). Differences in arrest charges and differences in
criminal history contribute less to this differential. Moreover, once pre-determined

108
characteristics are controlled for in the post-proposition 47 period the Black-White differential in
this outcome becomes very small and statistically insignificant. The passage of proposition 47
reduces the Hispanic-White differential to zero and slightly widens the Asian-White differential
in this outcome.
Finally, Tables 5.14 and 5.15 present decomposition analyses of racial disparities in
sentence length conditional on having been convicted. The structure of the tables is similar to
those for the other two incarceration outcomes that we have already discussed. Beginning with
the results for all cases in Panel A of Table 5.14, we see that predetermined case characteristics
accounts for roughly 2.6 months of the three-month difference in sentence length between Black
and White defendants. Roughly 1.1 months of the differential is due to difference in arrest
charges, a fifth of a month is due to differences in criminal justice status at arrest, two thirds of
a month is due to differences in pre-trial detention, while two thirds of a month is due to
differences in criminal history. The Hispanic-White differential of 0.660 months is fully explained
by differences in arrest charges. There are no significant differences between Asian and White
defendants. The patterns in panel B for defendants without multiple court numbers at arrest
and without a recent criminal history are similar to the results in panel A.
Table 5.15 again reveals a sizable impact of proposition 47 on this particular sentencing
outcome. The raw Black-White differential declines by roughly one half from 3.4 months to 1.8
months with the passage of proposition 47. The contributions of criminal history, criminal justice
status at arrest, and pre-trial detention to the Black-White differential diminish in parallel. In
addition, we see that the unexplained differential (that which remains after adjusting for
predetermined characteristics) declines form 0.5 months to 0.3 months. The passage of

109
proposition 47 eliminates the raw disparity between Hispanic and White defendants. There is
little evidence of significant differentials between Asian and White defendants either pre- or
post-proposition 47.
E. Summary of Findings from this Section
We have analyzed a broad array of outcomes and have presented a large number of
results. While the results are detailed and nuanced, there are several salient patterns that can be
summarized. In particular, we believe the analysis reveals the following key findings.
• There are sizable unadjusted racial and ethnic disparities relative to Whites in case
disposition and sentencing outcomes that disfavor Black and Asian defendants.
Outcomes for White and Hispanic defendants are largely similar, and when differences
exist they tend to disfavor Hispanics.
• For all of the outcomes, racial disparities are either entirely or mostly explained by
predetermined case characteristics.
• Black suspects are relatively disadvantaged on average by pre-trial detention, having an
active criminal justices status at the time of arrest, and their more extensive criminal
history. These factors alone account for nearly all of the differential outcomes (relative
to Whites) that we observe for Black defendants relative to White defendants in
unadjusted comparisons.
• Proposition 47 narrowed inter-racial disparities in outcomes. This narrowing operated
through a diminishing of the effects of pre-trial detention, status at arrest, and criminal
history on case disposition and sentencing outcomes in the post-proposition 47 period.

110
Table 5.1 Sources of Racial/Ethnic Disparities in the Likelihood that a Case is Not Filed or that the Case Results in a Successful Diversion Panel A: Decomposition of the difference relative to White suspects in the likelihood that the case is not filed or dismissed by the District Attorney Black Hispanic Asian Overall differences -0.019a
(0.003)
0.004 (0.004)
-0.099a
(0.007)
Due to differences in arrest charges
0.043a
(0.002)
-0.018a
(0.002) -0.080a
(0.004)
Due to differences in status at arrest
-0.009a
(0.001)
0.002a
(0.001) 0.001a
(0.001)
Due to differences in pre-trial detention
-0.048a
(0.001)
0.004a
(0.001) -0.006a
(0.001)
Due to differences in criminal history
-0.015a
(0.001)
0.007a
(0.001) -0.0001
(0.001)
Unexplained differential
0.010a
(0.003) 0.008a
(0.003) -0.019a
(0.005) Panel B: Decomposition of the difference relative to White suspects in the likelihood that the case results in a successful diversion Black Hispanic Asian Overall differences -0.011a
(0.001)
-0.002 (0.001)
-0.001 (0.002)
Due to differences in arrest charges
0.002a
(00004)
-0.004a
(0.0004) -0.010a
(0.001)
Due to differences in status at arrest
-0.002a
(0.0002)
0.001a
(0.0001) 0.0003a
(0.0001)
Due to differences in pre-trial detention
-0.0006b
(0.0002)
-0.000 (0.000)
0.0001
(0.0001)
Due to differences in criminal history
-0.009a
(0.0004)
0.003a
(0.0002) 0.002a
(0.0002)
Unexplained differential
-0.002c
(0.001) -0.0002 (0.001)
0.005b
(0.002) Standard errors are in parentheses.
a. Statistically significant at the one percent level of confidence. b. Statistically significant at the five percent level of confidence. c. Statistically significant at the 10 percent level of confidence.

111
Table 5.2 Sources of Racial/Ethnic Disparities in the Likelihood that a Case is Transferred to Another Agency (Alternative Action Taken) or that the Case Results in a Conviction Panel A: Decomposition of the difference relative to White suspects in the likelihood that an alternative action is taken Black Hispanic Asian Overall differences 0.062a
(0.002)
-0.014a
(0.003) -0.003c
(0.002)
Due to differences in arrest charges
-0.018a
(0.001)
0.004a
(0.001) -0.004a
(0.001)
Due to differences in status at arrest
0.022a
(0.001)
-0.006a
(0.001) -0.004a
(0.001)
Due to differences in pre-trial detention
0.020a
(0.001)
-0.003a
(0.0004) 0.002b
(0.001)
Due to differences in criminal history
0.025a
(0.001)
-0.008a
(0.0004) -0.008a
(0.001)
Unexplained differential
0.013a
(0.002) -0.0004 (0.003)
0.010b
(0.004) Panel B: Decomposition of the difference relative to White suspects in the likelihood that the case results in conviction Black Hispanic Asian Overall differences -0.028a
(0.003)
0.009b
(0.004) 0.098a
(0.006)
Due to differences in arrest charges
-0.026a
(0.002)
0.019a
(0.002) 0.089a
(0.003)
Due to differences in status at arrest
-0.011a
(0.0003)
0.003a
(0.0004) 0.002a
(0.0005)
Due to differences in pre-trial detention
0.028a
(0.001)
-0.001
(0.0008) 0.004a
(0.001)
Due to differences in criminal history
0.003a (0.001)
-0.005a
(0.0008) 0.008a
(0.001)
Unexplained differential
-0.021a
(0.002) -0.008a
(0.003) -0.004 (0.004)
Standard errors are in parentheses.
a. Statistically significant at the one percent level of confidence. b. Statistically significant at the five percent level of confidence. c. Statistically significant at the 10 percent level of confidence.

112
Table 5.3 Sources of Racial/Ethnic Disparities in the Likelihood that a Case is Not Filed or that the Case Results in a Successful Diversion for Cases Without Multiple Court Numbers and Where the Individual has no San Francisco Criminal History Panel A: Decomposition of the difference relative to White suspects in the likelihood that the case is not filed or dismissed by the District Attorney Black Hispanic Asian Overall differences 0.008
(0.005)
0.003 (0.006)
-0.122a
(0.008)
Due to differences in arrest charges
0.030a
(0.003)
-0.0007 (0.003)
-0.084a
(0.005)
Due to differences in pre-trial detention
-0.028a
(0.001)
-0.009a
(0.001) -0.004c
(0.002)
Due to differences in criminal history
-0.003 (0.002)
0.0002 (0.001)
-0.016a
(0.002)
Unexplained differential
0.011a
(0.004) 0.013a
(0.004) -0.018a
(0.007) Panel B: Decomposition of the difference relative to White suspects in the likelihood that the case results in a successful diversion Black Hispanic Asian Overall differences -0.001
(0.002)
-0.008a
(0.003) -0.001 (0.004)
Due to differences in arrest charges
0.007a
(0.001)
-0.003 (0.001)a
-0.013a
(0.001)
Due to differences in pre-trial detention
0.0001
(0.0004) -0.0006a
(0.0002)
0.0007c (0.0003)
Due to differences in criminal history
-0.007a
(0.001 0.0008a
(0.0003) -0.0001 (0.0005)
Unexplained differential
-0.001 (0.002)
-0.005b
(0.002) 0.011a
(0.004) Standard errors are in parentheses.
a. Statistically significant at the one percent level of confidence. b. Statistically significant at the five percent level of confidence. c. Statistically significant at the 10 percent level of confidence.

113
Table 5.4 Sources of Racial/Ethnic Disparities in the Likelihood that a Case is Transferred to Another Agency (Alternative Action Taken) or that the Case Results in a Conviction for Cases Without Multiple Court Numbers and Where the Individual has no San Francisco Criminal History Panel A: Decomposition of the difference relative to White suspects in the likelihood that an alternative action is taken Black Hispanic Asian Overall differences 0.031a
(0.002)
0.0004 (0.002)
0.001 (0.003)
Due to differences in arrest charges
0.003a
(0.0006)
0.0004 (0.0005)
-0.006a
(0.001)
Due to differences in pre-trial detention
0.008a
(0.0004)
0.002a
(0.0003) 0.002a
(0.0004)
Due to differences in criminal history
0.008a
(0.001) -0.0001 (0.0003)
-0.002a
(0.0006)
Unexplained differential
0.012a
(0.002) -0.002 (0.002)
0.008b
(0.003) Panel B: Decomposition of the difference relative to White suspects in the likelihood that the case results in conviction Black Hispanic Asian Overall differences -0.041a
(0.005)
0.005 (0.005)
0.121a
(0.008)
Due to differences in arrest charges
-0.041a
(0.003)
0.005b
(0.003) 0.104a
(0.004)
Due to differences in pre-trial detention
0.022a
(0.001)
0.007a
(0.001) 0.002a
(0.001)
Due to differences in criminal history
0.002 (0.001)
-0.001 (0.001)
0.023a
(0.002)
Unexplained differential
-0.024a (0.003)
-0.007b (0.004)
-0.008 (0.006)
Standard errors are in parentheses.
a. Statistically significant at the one percent level of confidence. b. Statistically significant at the five percent level of confidence. c. Statistically significant at the 10 percent level of confidence.

114
Table 5.5 Sources of Racial/Ethnic Disparities in the Likelihood that a Case is Not Filed or that the Case Results in a Successful Diversion, Pre and Post Proposition 47 Cases Panel A: Decomposition of the difference relative to White suspects in the likelihood that the case is not filed or dismissed by the District Attorney Black Hispanic Asian Pre- 47 Post-47 Pre-47 Post-47 Pre-47 Post-47 Overall differences
-0.020a
(0.003) -0.012b
(0.006) -0.005 (0.005)
0.025a
(0.008) -0.100a
(0.008) -0.100a
(0.013)
Due to arrest charges
0.050a
(0.002) 0.014a
(0.004) -0.021a
(0.003) -0.006 (0.005)
-0.082a
(0.004) -0.058a
(0.007)
Due to status at arrest
-0.008a
(0.001) -0.005a
(0.001) 0.002a
(0.001) 0.005a
(0.001) 0.001a
(0.0003) -0.001 (0.002)
Due to pre-trial detention
-0.049a
(0.001) -0.030a
(0.001) 0.001
(0.001) 0.012a
(0.002) -0.0002 (0.002)
-0.032a
(0.004)
Due to criminal history
-0.018a
(0.001) -0.010a
(0.002) 0.006a
(0.001) 0.008a
(0.001) 0.0002a
(0.001) -0.002 (0.001)
Unexplained differential
0.004 (0.003)
0.018a
(0.005) 0.007c (0.004)
0.005
(0.006) -0.019a
(0.006) -0.007 (0.010)
Panel B: Decomposition of the difference relative to White suspects in the likelihood that the case results in a successful diversion Black Hispanic Asian Pre- 47 Post-47 Pre-47 Post-47 Pre-47 Post-47 Overall differences
-0.013a
(0.001) -0.004a
(0.001) -0.0002 (0.001)
-0.005a
(0.002) -0.002 (0.003)
0.003 (0.003)
Due to arrest charges
0.003a
(0.001) -0.0000 (0.0005)
-0.004a
(0.001) -0.003a
(0.001) -0.011a
(0.001) -0.001
(0.001)
Due to status at arrest
-0.003a
(0.0002) -0.0002a
(0.0001) 0.001a
(0.0001) 0.0003a
(0.0001) 0.0004a
(0.0001) -0.0000 (0.0001)
Due to pre-trial detention
-0.001a (0.0003)
-0.0003 (0.0002)
-0.0002c (0.0001)
0.000 (0.001)
-0.0002 (0.0002)
0.0005 (0.0004)
Due to criminal history
-0.011a
(0.0005) -0.003a (0.001)
0.004a
(0.0003) 0.001a
(0.0003) 0.002a
(0.0005) 0.0000
(0.0005)
Unexplained differential
-0.002
(0.001) -0.0005 (0.002)
-0.001 (0.002)
-0.003c
(0.002) 0.006b
(0.003) 0.003
(0.003) Standard errors in parentheses. a. Statistically significant at the one percent level of confidence. b. Statistically significant at the five percent level of confidence. c. Statistically significant at the ten percent level of confidence.
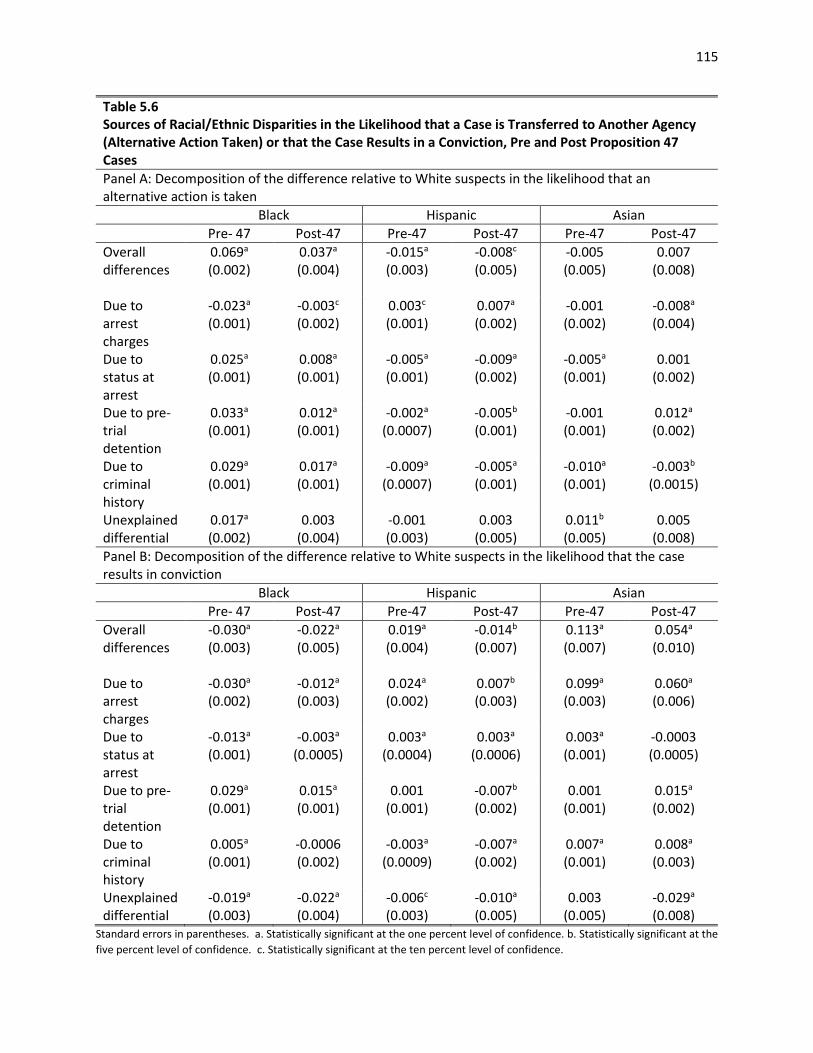
115
Table 5.6 Sources of Racial/Ethnic Disparities in the Likelihood that a Case is Transferred to Another Agency (Alternative Action Taken) or that the Case Results in a Conviction, Pre and Post Proposition 47 Cases Panel A: Decomposition of the difference relative to White suspects in the likelihood that an alternative action is taken Black Hispanic Asian Pre- 47 Post-47 Pre-47 Post-47 Pre-47 Post-47 Overall differences
0.069a
(0.002) 0.037a
(0.004) -0.015a
(0.003) -0.008c
(0.005) -0.005 (0.005)
0.007 (0.008)
Due to arrest charges
-0.023a
(0.001) -0.003c
(0.002) 0.003c (0.001)
0.007a
(0.002) -0.001 (0.002)
-0.008a
(0.004)
Due to status at arrest
0.025a
(0.001) 0.008a
(0.001) -0.005a
(0.001) -0.009a
(0.002) -0.005a
(0.001) 0.001
(0.002)
Due to pre-trial detention
0.033a
(0.001) 0.012a
(0.001) -0.002a
(0.0007) -0.005b
(0.001) -0.001 (0.001)
0.012a (0.002)
Due to criminal history
0.029a
(0.001) 0.017a
(0.001) -0.009a
(0.0007) -0.005a
(0.001) -0.010a
(0.001) -0.003b
(0.0015)
Unexplained differential
0.017a
(0.002) 0.003
(0.004) -0.001 (0.003)
0.003 (0.005)
0.011b
(0.005) 0.005
(0.008) Panel B: Decomposition of the difference relative to White suspects in the likelihood that the case results in conviction Black Hispanic Asian Pre- 47 Post-47 Pre-47 Post-47 Pre-47 Post-47 Overall differences
-0.030a
(0.003) -0.022a
(0.005) 0.019a
(0.004) -0.014b
(0.007) 0.113a
(0.007) 0.054a
(0.010)
Due to arrest charges
-0.030a
(0.002) -0.012a
(0.003) 0.024a
(0.002) 0.007b (0.003)
0.099a
(0.003) 0.060a
(0.006)
Due to status at arrest
-0.013a
(0.001) -0.003a
(0.0005) 0.003a
(0.0004) 0.003a
(0.0006) 0.003a
(0.001) -0.0003 (0.0005)
Due to pre-trial detention
0.029a
(0.001) 0.015a
(0.001) 0.001
(0.001) -0.007b
(0.002) 0.001
(0.001) 0.015a
(0.002)
Due to criminal history
0.005a
(0.001) -0.0006 (0.002)
-0.003a
(0.0009) -0.007a
(0.002) 0.007a
(0.001) 0.008a
(0.003)
Unexplained differential
-0.019a
(0.003) -0.022a
(0.004) -0.006c (0.003)
-0.010a
(0.005) 0.003
(0.005) -0.029a
(0.008) Standard errors in parentheses. a. Statistically significant at the one percent level of confidence. b. Statistically significant at the five percent level of confidence. c. Statistically significant at the ten percent level of confidence.

116
Table 5.7 Sources of Racial/Ethnic Disparities in the Likelihood that a Felony Arrest Results in Filing of Felony Charges Black Hispanic Asian Overall differences 0.016a
(0.004)
0.015a
(0.006) 0.016c
(0.009)
Due to differences in arrest charges
0.017a
(0.002)
0.003b
(0.003) 0.001
(0.004)
Due to differences in status at arrest
-0.010a
(0.005)
0.003a
(0.0006) 0.005a
(0.001)
Due to differences in pre-trial detention
0.034a
(0.001)
0.002 (0.002)
-0.010a
(0.003)
Due to differences in criminal history
-0.009a
(0.001)
0.007a
(0.001) 0.003b
(0.001)
Unexplained differential
-0.016b
(0.004) -0.0006 (0.004)
0.017b
(0.007) Standard errors are in parentheses.
a. Statistically significant at the one percent level of confidence. b. Statistically significant at the five percent level of confidence. c. Statistically significant at the 10 percent level of confidence.

117
Table 5.8 Sources of Racial/Ethnic Disparities in the Likelihood that a Felony Arrest Results in a Felony Conviction Black Hispanic Asian Overall differences 0.013a
(0.004)
-0.001 (0.005)
-0.008 (0.008)
Due to differences in arrest charges
0.007a
(0.002)
-0.002a
(0.0002) 0.003
(0.003)
Due to differences in status at arrest
-0.009a (0.001)
0.003a (0.001)
0.004a
(0.001)
Due to differences in pre-trial detention
0.029a
(0.001)
0.002 (0.002)
-0.008a
(0.003)
Due to differences in criminal history
0.004a
(0.001)
-0.002
(0.001) -0.006a (0.002)
Unexplained differential
-0.017b
(0.004) -0.003 (0.005)
-0.0002 (0.007)
Standard errors are in parentheses.
a. Statistically significant at the one percent level of confidence. b. Statistically significant at the five percent level of confidence. c. Statistically significant at the 10 percent level of confidence.

118
Table 5.9 Sources of Racial/Ethnic Disparities in the Likelihood that a Misdemeanor Arrest Results in Any Conviction Black Hispanic Asian Overall differences -0.069a
(0.004)
0.015a
(0.005) 0.224a
(0.009)
Due to differences in arrest charges
-0.065a
(0.003)
0.032a
(0.003) 0199a
(0.006)
Due to differences in status at arrest
-0.002a
(0.0002)
0.0004 (0.0003)
-0.002a
(0.0005)
Due to differences in pre-trial detention
0.012a
(0.0007)
-0.004a
(0.001) 0.008a
(0.001)
Due to differences in criminal history
-0.002a
(0.001)
-0.004a
(0.001) 0.028a
(0.001)
Unexplained differential
-0.012a
(0.003) -0.009a
(0.003) -0.009 (0.006)
Standard errors are in parentheses.
a. Statistically significant at the one percent level of confidence. b. Statistically significant at the five percent level of confidence. c. Statistically significant at the 10 percent level of confidence.

119
Table 5.10 Sources of Racial/Ethnic Disparities in the Likelihood that a Case Results in an Incarceration Sentence Panel A: All Cases Black Hispanic Asian Overall differences -0.025a
(0.002)
0.015a
(0.003) 0.097a
(0.005)
Due to differences in arrest charges
-0.024a
(0.001)
0.020a
(0.002) 0.094a
(0.003)
Due to differences in status at arrest
-0.009a
(0.0003)
0.003a
(0.0002) 0.001a
(0.0004)
Due to differences in pre-trial detention
0.024a
(0.0005)
-0.0007
(0.0007) 0.003a
(0.001)
Due to differences in criminal history
0.003a
(0.0009)
-0.003a
(0.0003) 0.007a
(0.001)
Unexplained differential
-0.019a
(0.002) -0.004 (0.003)
-0.008c (0.004)
Panel B: Arrests Without Multiple Court Numbers and With No San Francisco Criminal History Black Hispanic Asian Overall differences 0.003
(0.004)
0.022a
(0.006) 0.082a
(0.011)
Due to differences in arrest charges
0.013a
(0.002)
0.029a
(0.003) 0.066a
(0.005)
Due to differences in pre-trial detention
0.014a
(0.001)
-0.0004 (0.001)
0.021a
(0.002)
Due to differences in criminal history
-0.0009 (0.001)
-0.0006 (0.0009)
0.009a
(0.002)
Unexplained differential
-0.024a
(0.004) -0.006 (0.005)
-0.013 (0.009)
Standard errors are in parentheses.
a. Statistically significant at the one percent level of confidence. b. Statistically significant at the five percent level of confidence. c. Statistically significant at the 10 percent level of confidence.

120
Table 5.11 Sources of Racial/Ethnic Disparities in the Likelihood that a Case Results in an Incarceration Sentence, Pre- and Post-Proposition 47 Cases Black Hispanic Asian Pre- 47 Post-47 Pre-47 Post-47 Pre-47 Post-47 Overall differences
-0.027a
(0.003) -0.022a
(0.005) 0.026a
(0.004) -0.012b
(0.006) 0.114a
(0.006) 0.048a
(0.010)
Due to arrest charges
-0.027a
(0.002)
-0.010a
(0.002) 0.025a
(0.002) 0.009a
(0.003) 0.104a
(0.004) 0.063a
(0.005)
Due to status at arrest
-0.011a
(0.0005) -0.002a
(0.0004) 0.002a
(0.0004) 0.003a
(0.0005) 0.002a
(0.0005) -0.0003 (0.0007)
Due to pre-trial detention
0.026a
(0.001) 0.012a
(0.001) 0.001
(0.0008) -0.006a
(0.001) 0.0008 (0.001)
0.011a
(0.002)
Due to criminal history
0.004a
(0.001) 0.0005b
(0.002) -0.001c
(0.0008) -0.006a
(0.002) 0.006a (0.001)
0.007a
(0.002)
Unexplained differential
-0.018a
(0.002) -0.022a
(0.004) -0.001 (0.003)
-0.013a
(0.005) -0.001 (0.005)
-0.032a
(0.009) Standard errors are in parentheses.
a. Statistically significant at the one percent level of confidence. b. Statistically significant at the five percent level of confidence. c. Statistically significant at the 10 percent level of confidence.

121
Table 5.12 Sources of Racial/Ethnic Disparities in the Likelihood that a Case Results in a Prison Sentence Panel A: All Cases Black Hispanic Asian Overall differences 0.009a
(0.001) 0.003a
(0.001) 0.002
(0.001)
Due to differences in arrest charges
0.003a
(0.0003)
0.003a
(0.0003) 0.005a
(0.0005)
Due to differences in status at arrest
0.001a
(0.0001)
-0.0003a
(0.00005) -0.0002a
(0.00005)
Due to differences in pre-trial detention
0.002a (0.0002)
0.0003b (0.0001)
0.0004c
(0.0002)
Due to differences in criminal history
0.002a
(0.0003)
0.0003c
(0.001) 0.0001
(0.0001)
Unexplained differential
0.0002
(0.0007) -0.0003 (0.0009)
-0.0028c (0.0014)
Panel B: Arrests Without Multiple Court Numbers and With No San Francisco Criminal History Black Hispanic Asian Overall differences 0.007a
(0.001) 0.003
(0.002) 0.002
(0.003)
Due to differences in arrest charges
0.004a
(0.0004)
0.003a
(0.0005) 0.005a
(0.0009)
Due to differences in pre-trial detention
0.002a
(0.0002)
0.0008a
(0.0003) 0.002a
(0.0005)
Due to differences in criminal history
0.001a
(0.0002) 0.0000
(0.0002) 0.0004
(0.0003)
Unexplained differential
-0.0003
(0.001) -0.0009 (0.001)
-0.005c
(0.003) Standard errors are in parentheses.
a. Statistically significant at the one percent level of confidence. b. Statistically significant at the five percent level of confidence. c. Statistically significant at the 10 percent level of confidence.

122
Table 5.13 Sources of Racial/Ethnic Disparities in the Likelihood that a Case Results in a Prison Sentence, Pre- and Post-Proposition 47 Cases Black Hispanic Asian Pre- 47 Post-47 Pre-47 Post-47 Pre-47 Post-47 Overall differences
0.010a
(0.001) 0.004a
(0.001) 0.004a
(0.001) 0.0004 (0.001)
0.002 (0.002)
0.004c
(0.002)
Due to arrest charges
0.003a
(0.0004) 0.002a
(0.0003) 0.003a
(0.0004) 0.0009b
(0.0004) 0.005a
(0.0006) 0.003a
(0.001)
Due to status at arrest
0.001a
(0.0002) 0.0002a
(0.0001) -0.0003a
(0.00005) -0.0002a
(0.0001) -0.0003a
(0.0001) 0.00002
(0.00006)
Due to pre-trial detention
0.003a (0.0002)
0.0004b (0.0002)
0.0005a (0.0001)
-0.00002 (0.0002)
0.0003
(0.0003) 0.0002
(0.0003)
Due to criminal history
0.003a
(0.0002) 0.0006
(0.0004) 0.0002
(0.0002) 0.00002 (0.0002)
0.00003
(0.0002) 0.00008 (0.0003)
Unexplained differential
0.0001
(0.0008) 0.0007 (0.001)
-0.0000 (0.001)
-0.0003 (0.001)
-0.003 (0.002)
0.0008 (0.002)
Standard errors are in parentheses.
a. Statistically significant at the one percent level of confidence. b. Statistically significant at the five percent level of confidence. c. Statistically significant at the 10 percent level of confidence.

123
Table 5.14 Sources of Racial/Ethnic Disparities in Sentence Length (months) for Cases Resulting in Conviction Panel A: All Cases Black Hispanic Asian Overall differences 3.099a
(0.174)
0.660a
(0.227) -0.448 (0.317)
Due to differences in arrest charges
1.114a
(0.096)
0.591a
(0.103) 0.080
(0.143)
Due to differences in status at arrest
0.202a
(0.020)
-0.065a
(0.016) -0.081a
(0.022)
Due to differences in pre-trial detention
0.674a
(0.056)
0.230a (0.050)
-0.013 (0.072)
Due to differences in criminal history
0.685a
(0.068)
0.127a
(0.048) -0.032 (0.059)
Unexplained differential
0.424a
(0.165) -0.222 (0.197)
-0.402 (0.274)
Panel B: Arrests Without Multiple Court Numbers and With No San Francisco Criminal History Black Hispanic Asian Overall differences 2.052a
(0.219) 0.655b
(0.317) -0.304 (0.492)
Due to differences in arrest charges
0.764a
(0.104)
0.398a
(0.144) 0.522b (0.204)
Due to differences in pre-trial detention
0.494b
(0.062)
0.286a (0.087)
0.143 (0.129)
Due to differences in criminal history
0.371a
(0.060) 0.099c
(0.059) 0.064
(0.085)
Unexplained differential
0.423b
(0.207) -0.128 (0.290)
-1.032b (0.441)
Standard errors are in parentheses.
a. Statistically significant at the one percent level of confidence. b. Statistically significant at the five percent level of confidence. c. Statistically significant at the 10 percent level of confidence.

124
Table 5.15 Sources of Racial/Ethnic Disparities in Sentence Length (months) for Cases Resulting in Conviction, Pre- and Post-Proposition 47 Cases Black Hispanic Asian Pre- 47 Post-47 Pre-47 Post-47 Pre-47 Post-47 Overall differences
3.405a
(0.209) 1.832a
(0.244) 0.762a
(0.274) 0.296
(0.312) -0.587 (0.380)
0.050 (0.448)
Due to arrest charges
1.130a
(0.122) 1.005a
(0.143) 0.614a
(0.133) 0.291b
(0.169) 0.053
(0.183) 0170
(0.232)
Due to status at arrest
0.253a
(0.026) 0.029a
(0.013) -0.068a
(0.019) -0.031c
(0.016) -0.088a
(0.027) -0.031 (0.020)
Due to pre-trial detention
0.759a
(0.069) 0.227a (0.076)
0.329a (0.059)
-0.070 (0.077)
-0.031 (0.087)
0.054 (0.107)
Due to criminal history
0.762a
(0.083) 0.274a
(0.112) 0.121b
(0.059) -0.016 (0.95)
-0.078 (0.075)
-0.111 (0.120)
Unexplained differential
0.500a
(0.196) 0.298
(0.241) -0.234 (0.241)
0.089 (0.288)
-0.442 (0.333)
-0.032 (0.405)
Standard errors are in parentheses.
a. Statistically significant at the one percent level of confidence. b. Statistically significant at the five percent level of confidence. c. Statistically significant at the 10 percent level of confidence.

125
Figure 5.1: Racial Disparities in Case Disposition Outcomes Relative to White Suspects with and without Controls for Arrest Charges, Criminal Justice Status at Arrest, Detention through Arraignment, and San Francisco and Statewide Criminal History
Notes: The dots in the figure represent estimates of the difference in the outcome relative to whites. The line through the dot demarks the 95 percent confidence interval for the estimate.
Black
Hispanic
Asian
-.1 -.05 0 .05 -.1 -.05 0 .05
Case not filed or dismissed Diversion
No statistical controlsInclusive of statistical controls
Difference relative to whites
Black
Hispanic
Asian
-.05 0 .05 .1 -.05 0 .05 .1
Alternative action taken Convicted
No statistical controlsInclusive of statistical controls
Difference relative to whites

126
Figure 5.2: Racial Disparities in the Likelihood that a Felony Arrest Results in the Filing of Felony Charges with and without Controls for Arrest Charges, Criminal Justice Status at Arrest, Detention through Arraignment, and San Francisco and Statewide Criminal History
Notes: The dots in the figure represent estimates of the difference in the outcome relative to whites. The line through the dot demarks the 95 percent confidence interval for the estimate.
Figure 5.3: Racial Disparities in the Likelihood that a Felony Arrest Results in a Felony Conviction With and without Controls for Arrest Charges, Criminal Justice Status at Arrest, Detention through Arraignment, and San Francisco and Statewide Criminal History
Notes: The dots in the figure represent estimates of the difference in the outcome relative to whites. The line through the dot demarks the 95 percent confidence interval for the estimate.
Black
Hispanic
Asian
-.02 0 .02 .04Difference relative to whites
No statistical controlsInclusive of statistical controls
Black
Hispanic
Asian
-.02 -.01 0 .01 .02Difference relative to whites
No statistical controlsInclusive of statistical controls

127
Figure 5.4: Racial Disparities in the Likelihood that a Misdemeanor Arrest Results in Any Conviction With and without Controls for Arrest Charges, Criminal Justice Status at Arrest, Detention through Arraignment, and San Francisco and Statewide Criminal History
Notes: The dots in the figure represent estimates of the difference in the outcome relative to whites. The line through the dot demarks the 95 percent confidence interval for the estimate.
Figure 5.5: Racial Disparities in the Likelihood that an Arrest Results in an Incarceration Sentence With and Without Controls for Arrest Charges, Criminal Justice Status at Arrest, Detention through Arraignment, and San Francisco and Statewide Criminal History
Notes: The dots in the figure represent estimates of the difference in the outcome relative to whites. The line through the dot demarks the 95 percent confidence interval for the estimate.
Black
Hispanic
Asian
-.1 0 .1 .2 .3Difference relative to whites
No statistical controlsInclusive of statistical controls
Black
Hispanic
Asian
-.05 0 .05 .1Difference relative to whites
No statistical controlsInclusive of statistical controls

128
Figure 5.6: Racial Disparities in the Likelihood that an Arrest Results in a Prison Sentence Without Controls for Arrest Charges, Criminal Justice Status at Arrest, Detention through Arraignment, and San Francisco and Statewide Criminal History
Notes: The dots in the figure represent estimates of the difference in the outcome relative to whites. The line through the dot demarks the 95 percent confidence interval for the estimate.
Figure 5.7: Racial Disparities in Sentence Length (in months) for Cases Resulting in a Conviction, With and Without Controls for Arrest Charges, Criminal Justice Status at Arrest, Detention through Arraignment, Criminal History, and Charge Filing Choices
Notes: The dots in the figure represent estimates of the difference in the outcome relative to whites. The line through the dot demarks the 95 percent confidence interval for the estimate.
Black
Hispanic
Asian
-.005 0 .005 .01Difference relative to whites
No statistical controlsInclusive of statisitical controls
Black
Hispanic
Asian
-1 0 1 2 3 4Difference relative to whites
No statistical controlsInclusive of controls for pre-determined factorsInclusive of controls for pre-determined factors and filing choices

129
6. Testing for Differential Rejection Rates among Filed Cases
Our final set of analytical results assesses whether there are racial disparities in the
likelihood that cases filed by the SFDA are more likely to be dismissed by the court. To reiterate
the discussion from section 4, an analysis of rejection rates is intended to assess whether cases
that are filed against members of a given group are more likely to be deemed problematic and
rejected by the court. To the extent that this were true, one might conclude that the SFDA is
more likely to bring problematic cases against members of one group and thus are holding these
suspects to a lower standard in filing formal charges.
Of course, there are alternative interpretations of such outcome tests. Given that the
decision being analyzed is made by the court, one might contend that a higher likelihood that
(for example) cases against Asian defendants are dismissed by the court is evidence that the court
is discriminating in a manner that favors Asians. Moreover, the quality of the case presented to
the SFDA may vary differentially across groups even for cases that meet the threshold for filing,
a fact that may reflect earlier discrimination by the police. For example, if the police tend to
submit more marginal cases against Asian suspects, yet cases that meet some minimum
threshold for filing charges, these cases may be differentially rejected once reviewed by a judge.
Hence, the outcome test here presents an omnibus test for differential treatment for cases that
make it past the filing stage, where the differential treatment may reflect biased policing, biased
processing by the SFDA, or biased evaluation by judges.
With these caveats in mind, we proceed to the estimation results. Figure 6.1 graphically
displays racial disparities in the likelihood that a filed case is rejected by the court. Again we

130
present unadjusted differences as well as differences that statistically adjust for predetermined
case characteristics. The top graph in figure 6.1 presents results for all cases. We do see a
significantly higher rejection rate for Black defendants of roughly 2.1 percentage points.
Statistical adjustment reduces the disparity to under one percentage point. Though considerably
smaller in magnitude, the differential is still statistically significant. For the Hispanic-White
differential in this outcome, both the raw and adjusted differentials are statistically insignificant
and very small. For Asian defendants, we see a lower rejection rate relative to White defendants
(of roughly 3.3 percentage points) that declines to zero and becomes statistically insignificant
once we control for predetermined case characteristics.
The bottom graph in Figure 6.1 presents comparable analysis for individuals with only one
court number associated with an arrest and with no recent criminal history. The results with and
without statistical adjustment basically parallel the results for all cases. Here, however, even the
unadjusted difference between Black and White defendants is relatively small (less than one
percentage point).
Figure 6.2 presents an analysis for the pre-proposition 47 period (top graph) and the post-
proposition 47 period (bottom graph). Interestingly, we see a higher rejection rate (marginally
significant both with and without statistical adjustment) for Black defendants relative to White
defendants in the pre-proposition 47 period of roughly two percentage points. This differential
narrows with the passage of proposition 47 and becomes statistically insignificant. For Asian and
Hispanic defendants, statistical adjustment for predetermined characteristics yields insignificant
differentials relative to white defendants in both the pre and post-proposition 47 periods.

131
Figure 6.3 presents separate estimates for felony cases by broad offense category (where
the most serious arrest charge is used to classify cases). In all cases the differentials relative to
White defendants are small and nearly all are statistically insignificant with and without adjusting
for pre-determined characteristics. We do see significantly higher rejection rates for offenses
that fall in the “other felony” category and significantly lower rejection rates for offenses that fall
in the “felony lewd” category for Black and Hispanic defendants relative to White defendants.
Finally figure 6.4 presents a similar analysis for specific misdemeanors offenses. Here
there are no statistically significant differentials once predetermined case characteristics are
statistically accounted for.
To summarize, the results presented in this section display little evidence of differential
case rejection by courts, with some evidence of small statistically significant differentials in the
pre-prop 47 era, but uniformly insignificant differentials in the post period.

132
Figure 6.1: Racial Disparities in the Likelihood that a Filed Case is Rejected by the Court, With and Without Controls for Arrest Charges, Criminal Justice Status at Arrest, Detention through Arraignment, and Criminal History: All Cases (top graph) and Cases without Multiple Court Numbers at Arrest and No Recent San Francisco Criminal history (bottom graph)
Notes: The dots in the figure represent estimates of the difference in the outcome relative to whites. The line through the dot demarks the 95 percent confidence interval for the estimate.
Black
Hispanic
Asian
-.04 -.02 0 .02 .04Difference relative to whites
No statistical controlsInclusive of statistical controls
All Cases
Black
Hispanic
Asian
-.06 -.04 -.02 0 .02Difference relative to whites
No statistical controlsInclusive of statistical controls
No multiple court numbers or recent SF history

133
Figure 6.2: Racial Disparities in the Likelihood that a Filed Case is Rejected by the Court, With and Without Controls for Arrest Charges, Criminal Justice Status at Arrest, Detention through Arraignment, and Criminal History: Pre-Proposition 47 (top graph) and Post-Proposition 47 (bottom graph)
Notes: The dots in the figure represent estimates of the difference in the outcome relative to whites. The line through the dot demarks the 95 percent confidence interval for the estimate.
Black
Hispanic
Asian
-.1 -.05 0 .05Difference relative to whites
No statistical controlsInclusive of statistical controls
Before Proposition 47
Black
Hispanic
Asian
-.06 -.04 -.02 0 .02 .04Difference relative to whites
No statistical controlsInclusive of statistical controls
After Proposition 47

134
Figure 6.3 Racial Disparities in the Likelihood that a Filed Felony Case is Rejected by the Court by Broad Offenses Type, With and Without Controls for Arrest Charges, Criminal Justice Status at Arrest, Detention through Arraignment, and Criminal History
Notes: The dots in the figure represent estimates of the difference in the outcome relative to whites. The line through the dot demarks the 95 percent confidence interval for the estimate.
Felony_PersonFelony_Property
Felony_DrugFelony_Weapons
Felony_LewdFelony_Other
Felony_PersonFelony_Property
Felony_DrugFelony_Weapons
Felony_LewdFelony_Other
-.2 0 .2 .4
-.2 0 .2 .4
Black Hispanic
Asian
No Statistical ControlsInclusive of statistical controls
Difference relative to whites

135
Figure 6.4: Racial Disparities in the Likelihood that a Filed Misdemeanor Case is Rejected by the Court by Broad Offenses Type, With and Without Controls for Arrest Charges, Criminal Justice Status at Arrest, Detention through Arraignment, and Criminal History
Notes: The dots in the figure represent estimates of the difference in the outcome relative to whites. The line through the dot demarks the 95 percent confidence interval for the estimate.
Mis_Person
Mis_Property
Mis_Drug
Mis_Other
Local_Ordinance
Mis_Person
Mis_Property
Mis_Drug
Mis_Other
Local_Ordinance
-.5 0 .5
-.5 0 .5
Black Hispanic
Asian
No Statistical ControlsInclusive of statistical controls
Difference relative to whites

136
7. Conclusion
In summary, this study finds substantial racial and ethnic disparities in criminal justice
outcomes that tend to disfavor minority defendants, and Blacks in particular. For the most part,
these disparities can be attributed to average differences across racial and ethnic groups in case
characteristics related to arrest charges, pre-trial detention, and criminal history. Disparities in
disposition and sentencing outcomes narrow considerably with the passage of proposition 47.
Proposition 47 reclassified relatively low level felony offenses as misdemeanors. This study
demonstrates that this change had a disproportionate impact on Black defendants on disposition
and sentencing outcomes and helped narrow the racial gap associated with a criminal history and
being detained pre-trial.
We find little evidence of overt bias against any one race or ethnic group in the processing
of criminal offenses. For nearly all of the outcomes we study, simple statistical controls for
predetermined case characteristics can fully or mostly account for observed disparities, and in
some instances they over-explain disparities. Moreover, we find little evidence that courts reject
the cases brought by the SFDA against Black, Hispanic, and Asian defendants at a rate higher than
that of White defendants.
That being said, the results indicate that factors associated with poverty that may have
nothing to do with the actual underlying offense bear upon disposition and sentencing outcomes
in a manner that disfavors Black defendants in particular. Prime among these factors is the
observed impact of pre-trial detention. Moreover, prior criminal history statistically predicts
relatively poorer outcomes. While the importance of these factors have diminished, they still
predict worse outcomes even after accounting for the characteristics of the underlying offense.

137
Moreover, the disparate impacts of these factors may accumulate over the course of a
particular defendant’s life, and in a manner that may appear to be statistically explainable by
their official criminal history record. While we do not address the cumulative effects of these
disparities, it is possible to think through how small differences in the conditions of one’s case
can carry over into to future cases and lead to larger disparities over time that may systematically
vary by race. Consider for example, two defendants who are arrested for the first time for the
same offense. Suppose that one of the defendants is from a poor family and a poor community
and the other comes from a family with greater access to financial resources. The first defendant
is detained pre-trial and ultimately agrees to a plea deal with a sentence of time served. The
second defendant posts bail, mounts a defense from stronger bargaining positions (i.e., the
defendant’s immediate freedom is not a bargaining chip), and ultimately has the case dropped.
Now suppose that both defendants are arrested for a second offense. The first defendant will
have a prior conviction, a factor that may further increase the likelihood of pre-trial detention,
lead to additional charges associated with the prior, and perhaps result in a worse disposition
outcome from the viewpoint of the defendant. Moreover, the differences in outcomes for the
second offense between defendant one and two may be “explainable” by differences in their
official criminal history.

138
References
Ayres, Ian and Joel Waldfogel (1994), “A Market Test for Race Discrimination in Bail Setting,” Stanford Law Review, 46: 987-1047. Anwar, Shamena and Hanming Fang (2006), “An Alternative Test of Racial Prejudice in Motor Vehicle Searches: Theory and Evidence,” American Economic Review, 96(1): 127-151. Antonovics, Kate and Brian G. Knight (2009), “A New Look at Racial Profiling: Evidence from the Boston Police Department,” Review of Economics and Statistics, 91(1): 163-177. Ayres, Ian and Jonathan Borowsky (2008), A Study of Racially Disparate Outcomes in the Los Angeles Police Departments, report prepared for the ACLU of Southern California. Ayres, Ian and Joel Waldfogel (1994), “A Market Test for Race Discrimination in Bail Setting,” Stanford Law Review, 46: 987-1047. Blumstein, A., Cohen, J., Martin, S., and Tonry, M. (1983). Research on Sentencing: The Search for Reform, Volume I. Washington D.C.: The National Academies Press.
Butcher, Kristin and Anne Morrison Piehl (2008) “Crime, Corrections, and California: What Does Immigration Have to Do with It?,” California Counts, Public Policy Institute of California, San Francisco, California.
Bureau of Justice Statistics (2008), Criminal Victimization in the United States, 2006 Statistical Tables, U.S. Department of Justice Office of Justice Programs, Bureau of Justice Statistics, Washington D.C., NCJ223436.
Carson, Ann E. and Elizabeth Anderson (2016), Prisoners in 2015, U.S. Department of Justice Office of Justice Programs, Bureau of Justice Statistics, Washington D.C., NCJ 250229.
Dobbie, Will; Golden, Jacob and Crystal Yang, “The Effect of Pre-trial Detention on Conviction, Future Crime, and Employment: Evidence from Randomly Assigned Judges,” forthcoming American Economic Review.
Fischman, Joshua B. and Max M. Schanzenbach (2012), “Racial Disparities Under the Federal Sentencing Guidelines: The Role of Judicial Discretion and Mandatory Minimums,” Journal of Empirical Legal Studies, 9(4): 729-764.
Gelbach, Jonah B. (2016), “When do Covariates Matter? And Which Ones and How Much?” Journal of Labor Economics, 34: 509-543.
Heaton, Paul; Mayson, Sandra and Megan Stevenson (2017), “The Downstream Consequences of Misdemeanor Pre-trial Detention,” Stanford Law Review, 69: 711.
139
Hindelang, M. J. (1978). Race and Involvement in Common Law Personal Crimes. American Sociological Review, 43(1), 93.
Kneebone, Elizabeth and Steven Raphael (2011), City and Suburban Crime Trends in Metropolitan America, The Brookings Institution. Knowles, John; Persico, Nicola and Petra Todd (2001), “Racial Bias in Motor Vehicle Searches: Theory and Evidence,” Journal of Political Economy, 109(1): 203-229.
MacDonald, J., Arkes, J., Nicosia, N., and Pacula, R. L. (2014). Decomposing Racial Disparities in Prison and Drug Treatment Commitments for Criminal Offenders in California. The Journal of Legal Studies, 43(1), 155–187.
Manski, Charles F. (2006), “Search Profiling with Partial Knowledge of Deterrence,” The Economic Journal, 116: 385-401.
Minton, Todd D. and Zhen Zeng (2015), Jail Inmates at Midyear 2014, U.S. Department of Justice Office of Justice Programs, Bureau of Justice Statistics, Washington D.C., NCJ 248629.
Munnell, Alicia H.; Tootell, Geoffrey M.B.; Browne, Lynne E. and James McEneaney (1996), “Mortgage Lending in Boston: Interpreting the HMDA Data,” American Economic Review, 86(1): 25-53. Mustard, David B. (2001), “Racial, Ethnic and Gender Disparities in Sentencing: Evidence from the U.S. Federal Courts,” Journal of Law and Economics, 44(1): 285-314.
O’Flaherty, Brendan (2015), The Economics of Race in the United States, Harvard University Press, Cambridge, MA. Raphael, Steven and Sandra Rozo (2017), “Racial Disparities in the Acquisition of Juvenile Arrest Records,” Goldman School of Public Policy Working Paper, UC Berkeley. Samson, Robert J. and Janet L. Lauritsen (1997), “Racial and Ethnic Disparities in Crime and Criminal Justice in the United States,” Crime and Policy, 21 311-374. Sanga, Sarath (2009), “Reconsidering Racial Bias in Motor Vehicle Searches: Theory and Evidence,” Journal of Political Economy, 117(6): 1155-1159. Starr, Sonja B. and M. Marit Rehavi (2014), “Racial Disparity in Federal Criminal Sentences,” Journal of Political Economy, 122(6): 1320-1354.
Stevenson, Megan (2017), “Distortion of Justice: How the Inability to Pay Bail Affects Case Outcomes,” unpublished manuscript.

140
Tonry, Michael (1995), Malign Neglect: Race, Crime, and Punishment in America, Oxford University Press: New York.
Truman, Jennifer L. and Rachel E. Morgan (2016), Criminal Victimization, U.S. Department of Justice Office of Justice Programs, Bureau of Justice Statistics, Washington D.C., NCJ 250180.