Embed Size (px)
Citation preview

Region 1 2006 Westat State Analysis LRE Grant: Final Report January 9, 2007
Northeast Regional Resource Center 1
An Analysis of LRE Placement Data Collectionfor Region 1:
Verification, Consistency, and Comparability
Bruce BullEDSIS
Kristin Reedy, Ed.D.
Northeast Regional Resource CenterLearning Innovations at WestEd
20 Winter Sport LaneWilliston, VT 05495
January 2007
Region 1 2006 Westat State Analysis LRE Grant: Final Report

Region 1 2006 Westat State Analysis LRE Grant: Final Report January 9, 2007
Northeast Regional Resource Center 2
An Analysis of LRE Placement Data Collection for Region 1:Verification, Consistency, and Comparability
Final Report
Table of Contents
ABSTRACT.................................................................................................. 3
EXECUTIVE SUMMARY ............................................................................. 4
BACKGROUND INFORMATION ................................................................. 6
POLICY ISSUE ADDRESSED..................................................................... 7
METHOD ..................................................................................................... 7
RESULTS .................................................................................................... 11
DISCUSSION............................................................................................... 23
TABLE 1 Number of useable surveys by State 8
TABLE 2 Employment titles/positions of survey respondents 8
TABLE 3 State respondents knowledge of TA and training availability 12
TABLE 4 Percent of respondents who used TA and their perceived value of TAused
13
TABLE 5 Mean frequency of using different assists when determining difficultto code LRE situations (5-point scale 1-never to 5-always)
13
TABLE 6 State used school age placement definitions of educationalenvironments of children with disabilities ages 6-21
14
FIGURE 1 Student scenario LRE classifications grouped by State 15
FIGURE 2 State classifications by scenario 19
APPENDIX A NORTHEAST STATES LRE DATA.............................................33
APPENDIX B CHECKLIST OF LRE MATERIALS.............................................35APPENDIX C PROCESS FORM........................................................................36APPENDIX D GENERIC SURVEY INSTRUMENT ..........................................37APPENDIX E TA AND TRAINING RESULTS....................................................42APPENDIX F STATE SCHOOL AGE LRE DEFINITIONS ................................43APPENDIX G AGGREGATE AND STATE LEVEL CONSENSUS
ON CODING LRE FOR SCHOOL AGE SCENARIOS ...................48

Region 1 2006 Westat State Analysis LRE Grant: Final Report January 9, 2007
Northeast Regional Resource Center 3
An Analysis of LRE Placement Data Collection for Region 1:Verification, Consistency, and Comparability
Final Report
ABSTRACT
Historically, states in the northeast region have differed considerably from neighboringstates in the percentage of their special education student population served in differenteducational environments. Placement data indicate the degree to which students withdisabilities are placed in the least restrictive environment (LRE) along the continuum ofplacement options. This study investigated the degree of consistency with whichplacement classifications are used by different raters or coders within and across stateswithin the region and explored possible explanations for state-to-state variation inplacement patterns. State-specific surveys were created and each contained a core setof questions and exact scenarios. State respondents (special education local districtpersonnel) independently assigned an LRE placement classification to the fictitiousstudents in scenarios based on state-provided LRE placement descriptions. Additionalquestions were asked about availability, utilization, and perceived value of state-delivered training and technical assistance relative to LRE knowledge transfer. Widevariation existed in the scenario response patterns of respondents both within statesand across states. Local, regional, and national recommendations are provided forimproving the reliability of LRE data.

Region 1 2006 Westat State Analysis LRE Grant: Final Report January 9, 2007
Northeast Regional Resource Center 4
EXECUTIVE SUMMARY
States are required to report placement data for students with disabilities served underthe Individuals with Disabilities Education Act (IDEA) to the U.S. Office of SpecialEducation Programs (OSEP) on an annual basis. Placement data indicate the degree towhich students with disabilities are placed in the least restrictive environment (LRE)along the continuum of placement options. LRE data indicate the environment in whichspecial education services are provided and are often used to determine the likelihoodof intervention by the State Education Agency (SEA) to the local level. Placement datamay also be used to determine levels of intervention by OSEP at the state level. In thenortheast, a large amount of variation exists across states with respect to IDEA Part BLRE data. The purpose of this study was to determine if circumstances other thandifferences in service delivery models might affect LRE data within states in thenortheast region. The study focused on placement data for school age students.
Three specific policy questions were addressed regarding LRE data and a fourth policyquestion was added during the study. The additional question addressed theavailability, utilization, and perceived value of various LRE technical assistance (TA)and training opportunities that SEAs make available to local education agencies (LEAs).The policy questions investigated were:
1. To what degree are state directions for reporting/counting children in specificplacement categories consistent with OSEP directions?
2. To what degree are state directions to LEAs for reporting/counting children inspecific placement categories consistent across states?
3. How do LEAs’ understanding of those directions and the actual reporting ofdata compare or are comparable across LEAs within and across states?
4. What types of technical assistance and training are available to LEAs onclassifying LRE placement information and what is their level of utilization andperceived value?
SEA Directors of Special Education in the northeast authorized the Northeast RegionalResource Center (NERRC) to initiate this study on their behalf. NERRC, in turn,contracted with an independent consultant to do the work. The consultant was invited tomeet with SEA Directors before involving state IDEA Data Managers. Data Managersprovided state information relative to LRE placement, provided input on difficult to codeschool age special education scenarios, and outlined the types of technical assistanceand training provided by their state. The consultant worked closely with six of the eightnortheastern states to create a state-specific online survey. Two states chose not toparticipate in the survey.
The consultant created and housed the online surveys. Section one of the surveyfocused on the availability, utilization, and perceived value of different types of technicalassistance and trainings an SEA might make available. Section two consisted of LREscenarios for school age Part B students. Respondents were asked to categorize eachplacement based on state provided LRE placement descriptions. The URL for eachonline survey was provided to each participating SEA. Without OMB clearance, federal

Region 1 2006 Westat State Analysis LRE Grant: Final Report January 9, 2007
Northeast Regional Resource Center 5
funding of this study restricted the number of LEA surveys administered to nine perstate, and the nine LEAs were not randomly selected. The six participating statesgenerated 45 useable surveys from a total possible of 54 (nine surveys across sixstates), a response rate of 83 percent. Therefore, this sample is not representative ofany state or the northeast region. Selected findings are included below. Surveyrespondents were predominately local Special Education Directors, with an averagetenure in their position of over 10 years. They generally scored themselves as “highlyconfident” in the LRE data their district reported to the state.
Respondents in most states were inconsistent with respect to their knowledge of whatLRE technical assistance and trainings were available from their SEA. Across all of thestates, respondents within a state disagreed on the very existence (or nonexistence) ofthe 11 technical assistance and training methodologies in exactly half of the cases. (SeeTable 3.) Respondents placed more value on technical assistance methodologies thatwere one-on-one or interactive in nature, rather than group trainings and staticdocuments. The one exception was a Data Dictionary that five respondents indicatedthey had access to and used. The mean score calculated from these five respondentson use of the Data Dictionary was higher than all other methods of imparting knowledgeabout reporting LRE placement data.
Large variation existed in the way respondents classified the same special educationscenarios. Regionally there was inconsistency in the way respondents classified thesame scenario. Moreover, except for the respondents from the state of New York, therewas inconsistency in the way respondents within a state classified the same scenario.
In the review of state LRE definitions, two states were found to have modified thelanguage of the OSEP LRE definitions. New Jersey adopted the OSEP-proposed 2006definitions one year early. This was believed to have had no impact on LRE placementdeterminations or understanding of placement definitions. Massachusetts, however,included the terms “Full Inclusion, Partial Inclusion, and Substantially SeparateClassroom” within the three OSEP placement definitions based on time in theregular/general education classroom. It was hypothesized that these descriptors mightincrease opportunities for miscoding students for this state. A limited review ofMassachusetts’s LRE data suggests this possibility may be worth further exploration.
The existence of large variation in LRE data at the LEA level within a state suggeststhat states may be prudent to thoroughly investigate their LRE data. Moreover, stepsshould be taken to improve technical assistance and supports to increase the reliabilityof the reporting of local LRE data. Recommendations are provided to assist specialeducation administrators, at multiple levels, with the collection and reporting of accurateLRE data.
This work was funded by the Office of Special Education Programs via a Westat 2006 State
Analysis Grant. The Northeast Regional Resource Center was the successful proposer and hired
Bruce Bull of Education Data Services and Information Systems to conduct the work.

Region 1 2006 Westat State Analysis LRE Grant: Final Report January 9, 2007
Northeast Regional Resource Center 6
BACKGROUND INFORMATION
Data on the educational environments in which students with disabilities served underIDEA receive special education are classified, collected, reported, and often used at thenational, state, and local level as an important indicator of special education servicedelivery. These data, referred to as educational environment, placement, or in thisreport Least Restrictive Environment (LRE) data, are sometimes used as a measure ofthe degree to which students with disabilities have access to the general educationcurriculum and are being educated in the least restrictive environment. These data areused by states and by the Office of Special Education Programs (OSEP) for importantand consequential purposes. At the national level, states have been ranked byeducational environment data as a way of targeting states for OSEP-directed technicalassistance. At the state level, local district LRE data are sometimes used to determinestate-to-local focused monitoring. Now placement data are required in states' StatePerformance Plans (SPPs) and Annual Performance Reports (APRs) and will be usedby OSEP to make state determinations under Section 616 of IDEA 2004. Each Statemust collect valid and reliable information as needed to report annually to OSEP on theindicators established by the U.S. Secretary of Education for the State PerformancePlans [34 CFR 300.601(b) and 20 U.S.C. 1416(b)]. OSEP annually reviews each state’sperformance report and makes a determination of the state’s relative need forassistance and/or intervention in implementing the requirements of Part B of the Act.
Those not familiar with these high stakes LRE data might assume LRE placementdefinitions are uniformly understood and consistently applied when reporting LRE datato the state and subsequently to the federal level. However, there is a considerabledegree of variability across states on the percentages of students reported to bereceiving special education services in various LRE placement categories. Reviewingthe IDEA Annual Reports to Congress or the data available on the www.ideadata.orgWeb site attests to state-to-state variation in LRE data. Much of this variation is due toreal differences in the ways special education and related services are provided indifferent states. For example, the percentage of students served in private schoolsdiffers significantly across states across the U.S. (Appendix A has LRE differences fornortheast states.)
In addition to state level differences, experienced IDEA Data Managers, SEA Directorsof Special Education, SPP writers, and OSEP personnel, among others, can attest towidely varying LRE data among districts within a single state. Different placementdescriptions, different levels of definitional understanding, challenges in calculating timein the general education classroom, attendance (or lack of) at instructional trainings,available resource materials, etc.—as well as differences in special educationdelivery—are “areas of interest” in looking at LRE variation within a state.
Knowing that cross-state differences in service delivery do exist, this study attempted toascertain if factors, other than differences in service delivery models, might becontributing to the wide LRE variation demonstrated across and within the northeaststates. The existence of variation in LRE data at the LEA and SEA level suggests thatstates may be prudent to similarly investigate the accuracy and inter-rater reliability oftheir LRE data. The focus of this study was Part B LRE data for the school age

Region 1 2006 Westat State Analysis LRE Grant: Final Report January 9, 2007
Northeast Regional Resource Center 7
population served under IDEA. The study did not address preschool children reportedunder Section 619.
POLICY ISSUES ADDRESSED
For this study, three specific policy questions were addressed regarding LRE datacollection in states within the northeast region.
1. To what degree are state directions for reporting/counting children in specificplacement categories consistent with OSEP directions?
2. To what degree are state directions to LEAs for reporting/counting children inspecific placement categories consistent across states?
3. How do LEAs’ understanding of those directions and the actual reporting ofdata compare or are comparable across LEAs within and across states?
Additionally, through the course of the investigation, a fourth policy question wasdeveloped and addressed:
4. What types of technical assistance and training are available to LEAs onclassifying LRE placement information and what is their level of utilization andperceived value?
Answers to these questions are expected to help the region as a whole and specificSEAs within the northeast understand the reasons behind some of the variation in theirLRE data.
METHOD
This section describes how information was gathered and used in this study. Details areincluded on: participants, materials used, and procedures followed to gather the desiredLRE data.
Participants
The eight states of Region 1 (CT, ME, MA, NH, NJ, NY, RI, and VT) participated in thisstudy. All eight states provided information about their policies for communicating LREdata collection information to their LEAs. However, only six of the eight statesparticipated in the LEA survey that captured district level information on LRE. Withinthe confines of this federally funded study each participating state could have amaximum of nine LEA respondents to their state’s survey. Two states were unable tosecure nine completed surveys, and other states had instances where a respondent’ssurvey was not adequately completed and could not be used. A total of 45 usablesurveys were gathered from 54 possible across the six states (83%). Table 1 providesdetail on the completed surveys by each state.

Region 1 2006 Westat State Analysis LRE Grant: Final Report January 9, 2007
Northeast Regional Resource Center 8
Table 1. Number of useable surveys by State
State CT MA ME NH NJ NY RI VT
Total Surveys 9 9 6 9 6 9 NA NA
Usable Surveys 9 8 6* 8 6 8 NA NA
Total 45 Useable Surveys from 6 States
*Two ME surveys were partially completed and were used whenever possible.
As shown in Table 2, the vast majority of survey respondents were local SpecialEducation Directors (or the equivalent based on state preferred title).
Table 2. Employment titles/positions of survey respondents
Assistant Director of Special Education 1
Assistant Superintendent of Student Services 1
Committee on Special Education (CSE) Chairperson 2
Executive Director of Student Services and Special Education 1
Special Ed Secretary/Administrative Assistant /Child Count Data Entry Clerk 3
Special Education Director or Director of Special Education 37
Totals 45
Materials
This study gathered information through paper forms and electronic surveys. Each itemis described below.
1. Checklist of LRE Materials (Appendix B) This form, usually completed by thePart B Data Manager, provided insight into the types of training/technicalassistance states provided to their LEAs regarding the collection of LRE data.This information was later used in the LEA surveys.
2. Process Form (Appendix C) Completed onsite by the state Data Managers atthe OSEP/ OSEP/Westat 2006 Overlapping Part B & Part C Data Meeting, thisform provided the consultant with more insight into the processes used by eachSEA relative to the collection of IDEA 618 data. Answers to specific LRE datacollection questions were provided.
3. Difficult Scenarios Shared Based on their experience Data Managers wereasked to provide the consultant with two examples of real scenarios that weredifficult to determine the correct LRE category. Most Data Managers providedthis to the consultant during the face-to-face meeting.
4. Select Survey Tool SelectSurvey.NET is the software tool the consultant usedfor the creation of the online surveys. The consultant created individual statesurveys, which were housed on the consultant’s server and formed thefoundation for the collection of data used in this study. Each Data Manager

Region 1 2006 Westat State Analysis LRE Grant: Final Report January 9, 2007
Northeast Regional Resource Center 9
reviewed and approved their state’s survey online before sharing the state-specific survey URL with their potential LEA respondents.
Each state survey consisted of two sets of questions. The first set inquired aboutthe availability and usefulness of technical assistance and trainings designed totransfer LRE data knowledge from the SEA to the LEAs. Methods included forexample, a Data Dictionary, hands-on-training, Frequently Asked Questions (FAQs)documents, availability of an SEA expert, etc. The second set of questions on eachstate survey contained special education placement scenarios. Respondents wereasked to code these scenarios based on OSEP-established (and sometimes SEA-refined) LRE category definitions. See Appendix D for a blank copy of the genericsurvey instrument. The survey instrument contains the content used across the sixstate surveys.
Note that each state survey was unique. States were allowed to include additionalscenarios, state-specific language, and add technical assistance/training activities,to make the survey as meaningful as possible for their state. State-specific surveymodifications were also done to comply with the respondent restriction required ofthis study. Specifically, this was a federally funded study and therefore a maximumof nine respondents per survey was permitted in order to comply with federalpaperwork burden policies and information gathering restrictions. Creating uniquesurveys for each state maximized the total number of potential respondents.
Procedures
The following are the procedures used in this study and the approximate date of theprocedure.
1. Fall 2005 Prior to the proposal being submitted, each SEA wrote a letter of supportfor the project. In most—but not all—cases, this support translated to involvementfor the entirety of this study.
2. March – November 2006 The contracted consultant and NERRC maintainedfrequent communication prior to and throughout the study. Ongoing emails andevery other week teleconferences developed and maintained excellentcommunication. This was most helpful when small obstacles arose. At those points,NERRC knew the background and together the consultant and NERRC formulatedimmediate and effective solutions.
3. April 2006 The consultant was invited and attended a regional meeting to describethe project to the northeast SEA Directors. He provided an overview of the studyincluding the expected level of involvement from each state. The consultant askedSEA Directors to share information and handouts with state Part B Data Managers.As designed, after that regional meeting, most SEA project communication occurredbetween the consultant and the state IDEA Part B Data Managers.
4. May 2006 The consultant held a 1-hour face-to-face introduction and work sessionwith Part B Data Managers from the eight northeast states at the NERRC-hosted
Region 1 2006 Westat State Analysis LRE Grant: Final Report January 9, 2007
Northeast Regional Resource Center 10
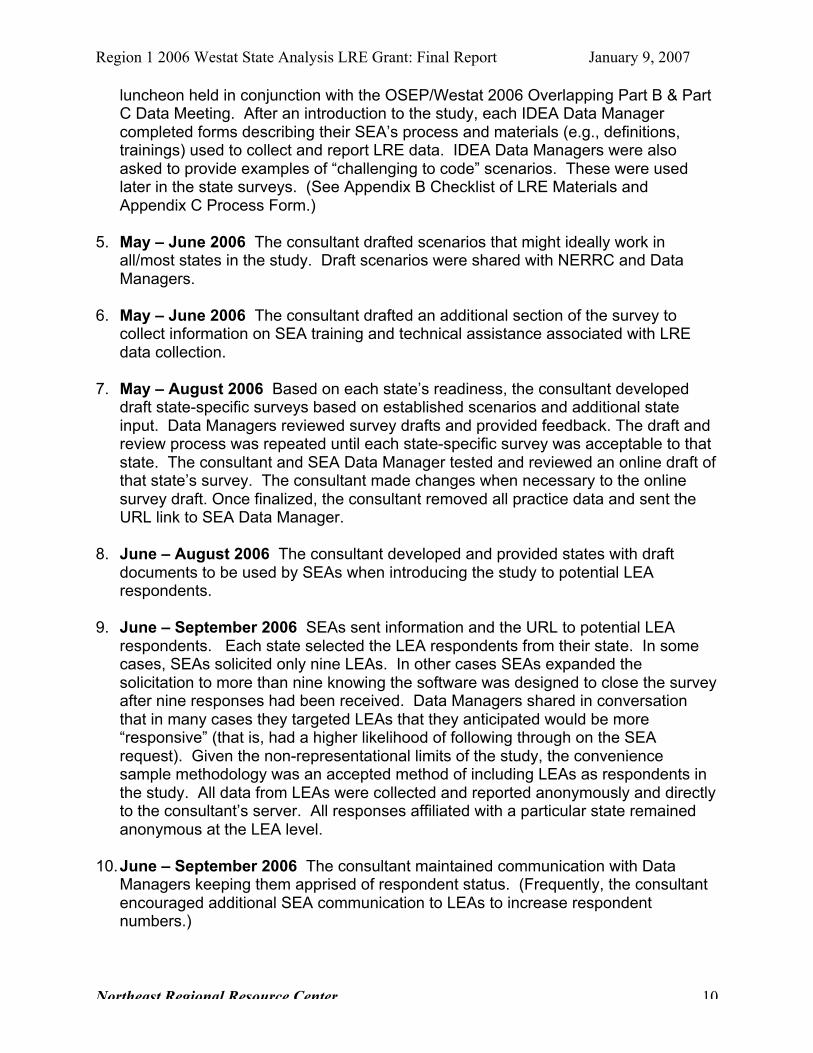
luncheon held in conjunction with the OSEP/Westat 2006 Overlapping Part B & PartC Data Meeting. After an introduction to the study, each IDEA Data Managercompleted forms describing their SEA’s process and materials (e.g., definitions,trainings) used to collect and report LRE data. IDEA Data Managers were alsoasked to provide examples of “challenging to code” scenarios. These were usedlater in the state surveys. (See Appendix B Checklist of LRE Materials andAppendix C Process Form.)
5. May – June 2006 The consultant drafted scenarios that might ideally work inall/most states in the study. Draft scenarios were shared with NERRC and DataManagers.
6. May – June 2006 The consultant drafted an additional section of the survey tocollect information on SEA training and technical assistance associated with LREdata collection.
7. May – August 2006 Based on each state’s readiness, the consultant developeddraft state-specific surveys based on established scenarios and additional stateinput. Data Managers reviewed survey drafts and provided feedback. The draft andreview process was repeated until each state-specific survey was acceptable to thatstate. The consultant and SEA Data Manager tested and reviewed an online draft ofthat state’s survey. The consultant made changes when necessary to the onlinesurvey draft. Once finalized, the consultant removed all practice data and sent theURL link to SEA Data Manager.
8. June – August 2006 The consultant developed and provided states with draftdocuments to be used by SEAs when introducing the study to potential LEArespondents.
9. June – September 2006 SEAs sent information and the URL to potential LEArespondents. Each state selected the LEA respondents from their state. In somecases, SEAs solicited only nine LEAs. In other cases SEAs expanded thesolicitation to more than nine knowing the software was designed to close the surveyafter nine responses had been received. Data Managers shared in conversationthat in many cases they targeted LEAs that they anticipated would be more“responsive” (that is, had a higher likelihood of following through on the SEArequest). Given the non-representational limits of the study, the conveniencesample methodology was an accepted method of including LEAs as respondents inthe study. All data from LEAs were collected and reported anonymously and directlyto the consultant’s server. All responses affiliated with a particular state remainedanonymous at the LEA level.
10. June – September 2006 The consultant maintained communication with DataManagers keeping them apprised of respondent status. (Frequently, the consultantencouraged additional SEA communication to LEAs to increase respondentnumbers.)
Region 1 2006 Westat State Analysis LRE Grant: Final Report January 9, 2007
Northeast Regional Resource Center 11
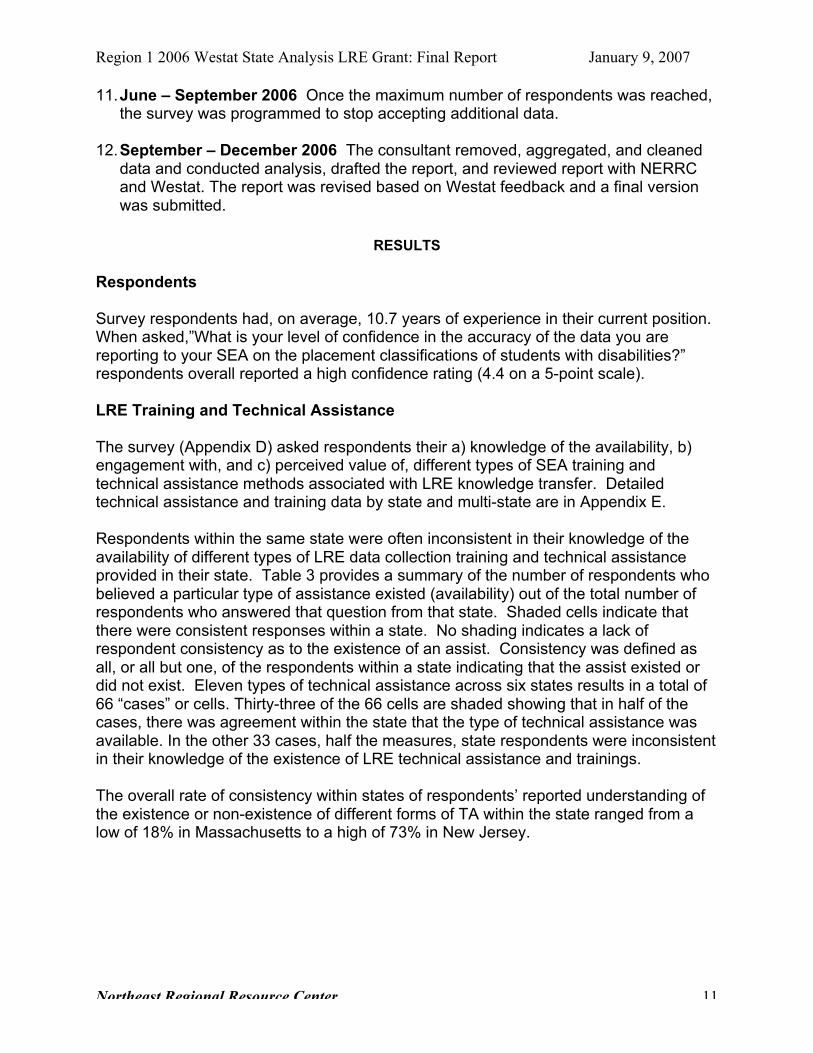
11. June – September 2006 Once the maximum number of respondents was reached,the survey was programmed to stop accepting additional data.
12. September – December 2006 The consultant removed, aggregated, and cleaneddata and conducted analysis, drafted the report, and reviewed report with NERRCand Westat. The report was revised based on Westat feedback and a final versionwas submitted.
RESULTS
Respondents
Survey respondents had, on average, 10.7 years of experience in their current position.When asked,”What is your level of confidence in the accuracy of the data you arereporting to your SEA on the placement classifications of students with disabilities?”respondents overall reported a high confidence rating (4.4 on a 5-point scale).
LRE Training and Technical Assistance
The survey (Appendix D) asked respondents their a) knowledge of the availability, b)engagement with, and c) perceived value of, different types of SEA training andtechnical assistance methods associated with LRE knowledge transfer. Detailedtechnical assistance and training data by state and multi-state are in Appendix E.
Respondents within the same state were often inconsistent in their knowledge of theavailability of different types of LRE data collection training and technical assistanceprovided in their state. Table 3 provides a summary of the number of respondents whobelieved a particular type of assistance existed (availability) out of the total number ofrespondents who answered that question from that state. Shaded cells indicate thatthere were consistent responses within a state. No shading indicates a lack ofrespondent consistency as to the existence of an assist. Consistency was defined asall, or all but one, of the respondents within a state indicating that the assist existed ordid not exist. Eleven types of technical assistance across six states results in a total of66 “cases” or cells. Thirty-three of the 66 cells are shaded showing that in half of thecases, there was agreement within the state that the type of technical assistance wasavailable. In the other 33 cases, half the measures, state respondents were inconsistentin their knowledge of the existence of LRE technical assistance and trainings.
The overall rate of consistency within states of respondents’ reported understanding ofthe existence or non-existence of different forms of TA within the state ranged from alow of 18% in Massachusetts to a high of 73% in New Jersey.

Region 1 2006 Westat State Analysis LRE Grant: Final Report January 9, 2007
Northeast Regional Resource Center 12
Table 3. State respondents knowledge of TA and training availability *
Type of Training or TechnicalAssistance
CT MA ME NH NJ NY
1. Data Dictionary 2 of 9 1 of 8 0 of 4 4 of 8 2 of 6 4 of 8
2. Expert Available Via Phone 9 of 9 5 of 8 3 of 4 7 of 8 6 of 6 7 of 8
3. Expert Available Via E-mail 9 of 9 5 of 8 3 of 4 7 of 8 5 of 6 5 of 8
4. Colleague Available 9 of 9 5 of 8 2 of 4 7 of 8 6 of 6 7 of 8
5. Training Video 2 of 9 2 of 8 1 of 6 0 of 8 0 of 6 0 of 8
6. Frequently Asked Questions andAnswers Posted
5 of 9 5 of 8 1 of 4 2 of 8 5 of 6 5 of 8
7. Documents (other than DataDictionary)
9 of 9 4 of 8 2 of 4 7 of 8 6 of 6 8 of 8
8. Face-to-face Training 9 of 9 6 of 8 3 of 6 5 of 8 4 of 6 6 of 8
9. Hands-on Training 2 of 9 4 of 8 2 of 6 4 of 8 2 of 6 2 of 8
10. Automated Help Inside anApplication
2 of 9 3 of 8 3 of 5 1 of 8 1 of 6 4 of 8
11. Distance Learning 0 of 9 1 of 8 3 of 6 1 of 8 1 of 6 1 of 8
Summary of state respondents’agreement that all or all but onerespondent agreed a TA typeexisted or did not exist.
6 / 11(55%)
2 / 11(18%)
5 / 11(45%)
7 / 11(64%)
8 / 11(73%)
5 / 11(45%)
* Shaded cells indicate consistent responses within a state, defined as all or all but one ofthe respondents within a state indicating that the assist existed or did not exist.
To ascertain a measure of utilization or ”engagement with” technical assistance, thesurvey asked respondents who indicated that a technical assistance or training existed,if they had used (engaged) that particular type of assist in the last 24 months. Thosewho had engaged with the assist were asked to assign a value to that technicalassistance. Table 4 displays the percentage of those engaging with each type oftechnical assistance or training and the mean value they assigned to the assist.(Technical assistance and training are displayed in descending order based on meanvalues.) The availability of a Data Dictionary is the most highly valued form of technicalassistance, as reported by the five respondents who used it. Based on a frequencycount, the three most frequently reported available forms of TA were “Expert AvailableVia Phone” (n=37), “Colleague Available” (n=36) and “Documents other than DataDictionary” (n=36). Utilization is the percent of respondents that reported using anavailable assist. The two forms of technical assistance with the highest reportedutilization are Colleague Available” (83%) and “Frequently Asked Questions andAnswers” (83%).

Region 1 2006 Westat State Analysis LRE Grant: Final Report January 9, 2007
Northeast Regional Resource Center 13
Table 4. Percent of respondents who used TA and their perceived value of TA used
Type of Training or
Technical Assistance
Respondents who Used/Engaged the TA
Of Those Saying it was Available
Mean Value
1 (low) – 5(high)
Data Dictionary 5 used of the 13 saying was available (38%) 4.80 (n = 5)
Expert Available Via Phone 28 used of the 37 saying was available (76%) 4.39 (n =28)
Expert Available Via E-mail 26 used of the 34 saying was available (76%) 4.27 (n = 26)
Colleague Available 30 used of the 36 saying was available (83%) 4.27 (n = 30)
Training Video 1 used of the 5 saying was available (20%) 4.00 (n = 1)
Frequently Asked Questions
and Answers19 used of the 23 saying was available (83%) 4.00 (n = 19)
Documents (other than DataDictionary)
27 used of the 36 saying was available (75%) 3.85 (n = 27)
Face-to-face Training 23 used of the 33 saying was available (70%) 3.83 (n = 23)
Hands-on Training 12 used of the 16 saying was available (75%) 3.67 (n = 12)
Automated Help Inside an
Application7 used of the 14 saying was available (50%) 3.43 (n = 7)
Distance Learning 2 used of the 7 saying was available (29%) 3.00 (n = 2)
After being asked about their knowledge, use and perceived value of different types oftraining and TA, respondents were asked to rate the frequency that they used each offour different methods when faced with a difficult to code LRE scenario. (See Table 5.)The highest mean rating (3.60) was earned for “Reviewing TA Materials,” comparedwith “Take Best Guess,” which had the lowest mean rating of 2.42.
Table 5. Mean frequency of using different assists when determining difficult tocode LRE situations (5-point scale 1-never to 5-always)
Take BestGuess
Call Someone atthe SEA
Ask Colleague Review TAMaterials
2.42 3.35 3.49 3.60
State Definitions
A review was conducted of each state’s LRE definitions. (See Appendix F for completedefinitions from northeast states.) Most states used the OSEP language as provided inOSEP’s Section 618 report forms. However two states that were surveyed modified thelanguage defining the different LRE placements. New Jersey used (2005-06) theOSEP-proposed Part B language for the 2006-07 school year. Massachusetts addeddescriptors (full inclusion, partial inclusion, and substantially separate classroom) to the

Region 1 2006 Westat State Analysis LRE Grant: Final Report January 9, 2007
Northeast Regional Resource Center 14
time outside regular class placement categories. Procedurally, each state’s definitionswere included verbatim in their state specific survey. Definitional differences are shownby state in Table 6.
Categorization of School-Age Scenarios
Throughout this study the question, “What is the ‘correct’ answer?” was asked byrespondents. The study was not, however, designed to determine the correctness of aparticular scenario classification. Rather, the study measured state and regionalrespondent differences in classifying LRE placement scenarios. To measure thisvariation, the last part of the survey queried respondents on their categorization ofschool age special education LRE scenarios. Respondents were asked to classify theplacements based on their own state-specific LRE definitions. (State-specific scenarios,included in some state surveys, are not reported in this report.)
These classification findings demonstrate inconsistency both across the region andwithin each state when classifying the same scenario. Results are presented here intwo figures. Data are first viewed in scenario-specific horizontal stacked bars (Figure1). The text of each scenario is presented. To the right of the scenario text is a graph
Table 6. State used school age placement definitions of educational environmentsof children with disabilities ages 6-21
KeyOSEP Definitions
NH, ME, NY, CTNJ Language MA Language
< 21Special educationoutside regular class less
than 21 percent of day
Included in general edsetting at least 80% of
day
All ages, Full InclusionSpecial education services
outside the General
Education Classroom lessthan 21% of the time
21-60
Special education
outside regular class at
least 21 percent of dayand no more than 60
percent of day
Included in general ed
between 40% and 80%
of day
All ages, Partial Inclusion
Special education services
outside the GeneralEducation Classroom 21%
to 60% of the time
> 60
Special educationoutside regular class
more than 60 percent of
day.
Included in general edup to 39% of the day
All ages, SubstantiallySeparate Classroom Special
education services outside
the General Education
Classroom more than 60%of the time
PuS Public separate school Same as OSEPAll ages, Public Separate
Day School
PrS Private separate school Same as OSEPAll ages, Private SeparateDay School
PuR Public residential facilitySame as OSEP All ages, Public Residential
Institutional Facilities
PrR Private residential facility Same as OSEP All ages, Residential School
H Homebound/Hospital Same as OSEP Homebound/Hospital

Region 1 2006 Westat State Analysis LRE Grant: Final Report January 9, 2007
Northeast Regional Resource Center 15
depicting the percentages of LRE placement responses reported for that scenario byeach surveyed state. The responses from each state are shown on one horizontal bar.Additionally, the top bar in each graph (labeled All) shows the aggregate of all studyrespondents for that scenario. The purpose of this view is to show the differences andsimilarities across states with respect to each scenario, with a particular emphasis onregional variation.
Perfect agreement would be each bar for each state having the same color/pattern.This would indicate that respondents across states in the study classified the samescenario with the same LRE placement code.
Figure 1. Student scenario LRE classifications grouped by State
LRE Classification Key
Outside regular class < 21% of Day
Outside regular class 21-60 % of Day
Outside regular class > 60% of Day
Public separate school
Private separate school
Public residential facility
Private residential facility
Don’t know
Steve
Steve’s parents removed Steve,
a 7th grader, from public school
and placed him in a private prepschool in their district. Later
Steve is found eligible for
special education. Steve nowreceives 2 hours a day of pull-
out services in the resource
room at the private school.
Steve Scenario Classifications
0% 20% 40% 60% 80% 100%
CT
ME
MA
NH
NJ
NY
All

Region 1 2006 Westat State Analysis LRE Grant: Final Report January 9, 2007
Northeast Regional Resource Center 16
Jamie
Jamie goes to the local high
school in the morning for 15 hoursa week. While there Jamie
receives 5 hours a week of special
education in a co-taught program.(The co-taught classroom has one
special education teacher and one
general education teacher. The
general education teacher is theteacher of record for this
classroom.) In the afternoon
Jamie goes to a work studyprogram at the local McDonald’s
for a total of 15 hours a week.
Jamie Scenario Classifications
0% 20% 40% 60% 80% 100%
CT
ME
MA
NH
NJ
NY
All
Holly 1
(Holly 1) A district places Holly ata residential school for students
with sensory impairments. Holly
lives close to the school, so shetakes the bus to and from school
as a day student. Assume this is a
public residential school.
Holly 1 Scenario Classifications
0% 20% 40% 60% 80% 100%
CT
ME
MA
NH
NJ
NY
All

Region 1 2006 Westat State Analysis LRE Grant: Final Report January 9, 2007
Northeast Regional Resource Center 17
Holly 2
(Holly 2) What is Holly's
placement if the school is a private
residential school?
Holly 2 Scenario Classifications
0% 20% 40% 60% 80% 100%
CT
ME
MA
NH
NJ
NY
All
Pat
The district placed Pat at a privateseparate school for students on
IEPs. Though still attending there
part of the day, he is nowtransitioning back to his local high
school. Currently his daily routine
is to attend the private school from
9 - 12 then he is bussed to thepublic high school. In the
afternoon he is in two general
education classes with aninstructional assistant who is
responsible for Pat and another
student with disabilities. He alsoattends one special education life
skills class at the public high
school. Each high school class is
an hour long.
Pat Scenario Classifications
0% 20% 40% 60% 80% 100%
CT
ME
MA
NH
NJ
NY
All

Region 1 2006 Westat State Analysis LRE Grant: Final Report January 9, 2007
Northeast Regional Resource Center 18
Jane
Jane is a parentally placed private
school student with a Service
Plan. During the first part of the
year she received 1 hour ofspeech/week on a “pull-out” basis.
The district decided to put her on
an IEP in November but servicelevels and placement remain the
same.
Jane Scenario Classifications
0% 20% 40% 60% 80% 100%
CT
ME
MA
NH
NJ
NY
All
NJ did not score Jane scenario
Matt
Matt has two classes in communityjob experience, two general educationcontent courses with specialeducation support as needed, oneclass in a resource room with aspecial education teacher on studyskills, and one elective class with noadditional support. He has no otherclasses and the frequency andduration of all classes is the same.One of the community job experienceclasses is a general ed class, theother is a special education class.Also, in one general education classMatt is counted on enrollment by thespecial education teacher, in the otherclass the regular ed teacher countshim for attendance.
Matt Scenario Classifications
0% 20% 40% 60% 80% 100%
CT
ME
MA
NH
NJ
NY
All
As can be seen in Figure 1, respondents across the states were inconsistent in howthey coded these difficult scenarios. None of the scenarios show high levels ofagreement across the states. For example, for the Holly 2 scenario, five differentplacement categories were used with varying degrees across state respondents. Therewere no scenarios in which states were in agreement on the appropriate placementcategory. However, some scenarios show similar variation patterns.

Region 1 2006 Westat State Analysis LRE Grant: Final Report January 9, 2007
Northeast Regional Resource Center 19
The next set of graphs (Figure 2) displays the same data in vertical bar graphs with astate focus. Each vertical bar graph shows how the respondents from a given stateclassified each scenario. The purpose of this view is to show the state specific variationor patterns of LRE placement classifications.
Figure 2. State classifications by scenario
LRE Classification Key
Outside regular class < 21% of Day
Outside regular class 21-60 % of Day
Outside regular class > 60% of Day
Public separate school
Private separate school
Public residential facility
Private residential facility
Don’t know
CT Scenario Classifications
0%
10%
20%
30%
40%
50%
60%
70%
80%
90%
100%
Steve Jamie Holly 1 Holly 2 Pat Jane Matt

Region 1 2006 Westat State Analysis LRE Grant: Final Report January 9, 2007
Northeast Regional Resource Center 20
MA Scenario Classifications
0%
10%
20%
30%
40%
50%
60%
70%
80%
90%
100%
Steve Jamie Holly 1 Holly 2 Pat Jane Matt
ME Scenario Classifications
0%
10%
20%
30%
40%
50%
60%
70%
80%
90%
100%
Steve Jamie Holly 1 Holly 2 Pat Jane Matt

Region 1 2006 Westat State Analysis LRE Grant: Final Report January 9, 2007
Northeast Regional Resource Center 21
NH Scenario Classifications
0%
10%
20%
30%
40%
50%
60%
70%
80%
90%
100%
Steve Jamie Holly 1 Holly 2 Pat Jane Matt
NJ Scenario Classifications
0%
10%
20%
30%
40%
50%
60%
70%
80%
90%
100%
Steve Jamie Holly 1 Holly 2 Pat Jane Matt
NJ d
id n
ot
sco
re J
an
e s
cen
ario

Region 1 2006 Westat State Analysis LRE Grant: Final Report January 9, 2007
Northeast Regional Resource Center 22
NY Scenario Classifications
0%
10%
20%
30%
40%
50%
60%
70%
80%
90%
100%
Steve Jamie Holly 1 Holly 2 Pat Jane Matt
Again, ideally the bars would be a single color for each scenario indicating agreementamong state respondents on each scenario. The more colors in the stacked bar, theless agreement existed. Except for the state of NY, there were differences within eachstate on every scenario. In New York, there was unanimity on the classification for fourof the seven scenarios: Jamie, Holly 1, Holly 2, and Jane. No other state demonstrated100% agreement on any of the scenarios.
Figures 1 and 2 show very little agreement among respondents in how scenarios wereclassified. With the exception of New York, within state agreement was essentially non-existent. Some classification patterns do exist across states, suggesting thatrespondents across states have similar challenges when classifying difficult to codeplacements. Appendix G contains a data table with further analyses of the scenarioclassification data.
Finally, at the very end of the survey respondents were given the opportunity to providefeedback or comments. Three general comments represented a broader perspectiveand have potential implications for data collection practices in other sates, as notedbelow:
1. These are the (types of) examples that I find helpful for directors orsupervisors to have correct responses.
2. I think the tendency is (to) err on the side of being more conservative whenthere is doubt. It would be so much easier if rather than a percentage, theState provide the number of minutes (i.e., 300 minutes or less per week vs.21% or less, etc.).
3. More training needs to be offered . . . at least more specific resources on theDOE site.

Region 1 2006 Westat State Analysis LRE Grant: Final Report January 9, 2007
Northeast Regional Resource Center 23
DISCUSSION
The purpose of this study was to determine if circumstances other than differences inservice delivery models might affect LRE data within and across states in the northeastregion. The study focused on LRE placement classifications for school age IDEA Part Bstudents.
Three specific policy questions were addressed regarding LRE data and a fourth policyquestion was added during the study. The additional question addressed theavailability, utility and perceived value of the various types of LRE technical assistanceand training SEAs make available to LEAs. The policy questions investigated were:
1. To what degree are state directions for reporting/counting children in specificplacement categories consistent with OSEP directions?
2. To what degree are state directions to LEAs for reporting/counting children inspecific placement categories consistent across states?
3. How do LEAs’ understanding of those directions and the actual reporting ofdata compare or are comparable across LEAs within and across states?
4. What types of technical assistance and training are available to LEAs onclassifying LRE placement information and what is their level of utilization andperceived value?
The findings of this study suggest that there are very real differences in how both LEAswithin a state and LEAs across states interpret and classify the same school age specialeducation LRE scenarios. It is the overall finding of this study that inter-rater reliabilityissues, rather than cross-state differences in special education delivery models,contribute to the variation in LRE data exhibited in the northeast. The remainder of thissection will acknowledge the limitations of the study, highlight important results in lightof the policy issues addressed, provide recommendations for future studies in this area,and most importantly provide recommendations to be considered at the state, regional,and national level to address or alleviate potential inter-rater reliability issues concerningLRE data.
Limitations
The following limitations affected this study, listed in descending order of influence.
First and foremost, the study restricted the number of responses that could be collected.Federal funding of this study, without OMB clearance, restricted the number of LEAsurveys administered to nine per state, therefore the sample was not representative ofany state or the northeast region. Once this restriction was realized, the study designwas modified to maximize the number of respondents that could be included. This wasdone by creating unique surveys for each state. However, the resulting sample was toosmall to draw any definitive state or regional conclusions.
Second, the respondent group itself may not have been reflective of those mostinvolved in categorizing and reporting LRE data. Although the survey was designed for

Region 1 2006 Westat State Analysis LRE Grant: Final Report January 9, 2007
Northeast Regional Resource Center 24
anyone associated with LRE data determination and transference, 37 out of 45 (82%) ofrespondents were local Special Education Directors. In many cases, local SpecialEducation Directors are not involved with the day-to-day student-level data issues suchas LRE classification. Although the respondent group had more than 10 years averagetenure in their current positions and self-reported a high confidence level in theaccuracy of LRE data submitted to their SEA, their actual level of involvement with LREdata and determining LRE classification was not known. It could be that theiradministrative position limits their awareness of the nuances sometimes associated withclassifying such data. The predominance of local Special Education Directors asrespondents may have occurred because SEAs were directly involved with contactingpotential LEAs to complete the survey. This may have made local Special EducationDirectors feel obligated to complete the survey themselves. Additionally, in most statesthe survey was open during the summer months—a time when local Special EducationDirectors are usually more available than other staff.
A third limitation was that two states limited their involvement to sharing information onlyon state level processes. No survey was conducted of LEAs within these two states. Inboth cases, personnel changes at the state level contributed to this decision. In light ofthe loss of two states, these findings do not reflect the entirety of Region 1.
Fourth, the timing of the survey administration study was difficult. The study wasfunded late in the school year. Creating the surveys took until the end of May for thefirst state and later for other states due to their workloads and internal schedules.Summer was a difficult time to get closure on the state-specific surveys. Repeatedextensions of the survey deadline (through September) occurred in an effort tomaximize the number of LEA responses.
Finally, not surprisingly, states had different levels of interest and involvement. Somestates got off to a fast start—others kept this project “on their desk” for many weeksbefore they began. One state had three involved people reviewing survey language,editing scenarios, and making recommendations for their state survey. Some stateshad to wait for approval from their SEA Director who was directly involved withreviewing. In other states, the Part B Data Manager was (by experience or default)empowered to make decisions and move the work forward. As such, the frequency,duration, and level of communication across states varied greatly.
Policy Issue Results
The purpose of this study was to collect data from states in the northeast and use theresults to address three (original) specific LRE data policy questions and one additionaltechnical assistance question. Findings relative to the policy questions are reviewedbelow. Policy questions 1 and 2 are combined due to their similar nature and theavailability of data used to answer these two questions.

Region 1 2006 Westat State Analysis LRE Grant: Final Report January 9, 2007
Northeast Regional Resource Center 25
Policy Questions 1 and 2
1. To what degree are state directions for reporting/counting children in specificplacement categories consistent with OSEP directions?
2. To what degree are state directions to LEAs for reporting/counting children inspecific placement categories consistent across states?
Question 1 inquires how each state’s directions differ from the OSEP directions.Question 2 inquires how state directions differ across northeast states. To answerthese questions, this study looked at the LRE definitions each state used. Theconsultant asked each state to provide the exact LRE classification name and LREdefinition each state used in 2005-06 for purposes of collecting and reporting 2005-06LRE data. Each state provided that information (or acknowledged that they used theOSEP definitions.). (See Table 6 for a summary of LRE categories by each state in thesurvey, and Appendix F for detail on state school age LRE definitions for all eight statesin the northeast.) For the two states that did not participate in the survey (VT and RI)LRE categories were gathered from state IEPs.
Five of the eight states (CT, ME, NH, NY, and VT) used the exact OSEP 2005-06 LREcategories and definitions. The definitions used by the three remaining states (MA, NJ,RI) are described below, with specific reference to how any changes might affect LREdata.
Massachusetts
Massachusetts uses a slightly different definition for the OSEP setting known as“Special Education outside the regular class less than 21% of the day.” InMassachusetts, this setting is entitled:
All ages, Full Inclusion: Special education services outside the GeneralEducation Classroom less than 21% of the time.
The addition of the term “full inclusion” (and the additions of the terms “partial inclusion”and “substantially separate classroom” in the next two OSEP percent of day categories)may have the undesired consequence of confusing some staff that have theresponsibility to classify and report LEA data. Hopefully, the vast majority ofMassachusetts categorizers read the entirety of the definitions and understand theprogression associated with time outside the general education classroom. However,the additional descriptors of “full inclusion” and “partial inclusion” could inadvertentlycause some to misclassify certain students. This seems most possible when classifyingthose students receiving a small part (less than 21% of the day) of their specialeducation outside the regular class. Instead of being correctly placed in theMassachusetts category with the “full inclusion” descriptor, the unfamiliar might put suchstudents in the category with the “partial inclusion” descriptor. This incorrectassumption could occur if they interpreted students receiving less than 100% of theirspecial education outside the regular education classroom as being only partially

Region 1 2006 Westat State Analysis LRE Grant: Final Report January 9, 2007
Northeast Regional Resource Center 26
included and therefore placed them in the second percentage category with the “partialinclusion” label.
Reviewing aggregate Massachusetts data substantiates that this topic may merit furtherinvestigation. If the term “full inclusion” would increase the likelihood that somestudents (who should correctly be classified in the “outside regular class less than 21%category”) are mistakenly placed in the 21 – 60% category, then Massachusetts’s datamight show a proportionally lower percent of students in the “less than 21% category”than other states. Indeed, based on the 2004 data1 (the latest data available when theproposal was written) at www.ideadata.org Massachusetts had the lowest percentage ofstudents categorized “outside the regular class less than 21% of the day” of anynortheastern state at 45.88%. Compared with their neighboring states, Massachusettsis 1.25 standard deviations below the northeast mean (59.33%) for this category. Notunsurprisingly, their 2004 data were the highest (32.91%) of any northeastern state for“outside regular class at least 21 percent of day and no more than 60 percent of day.”In this category—a category Massachusetts labels “partial inclusion”—Massachusetts is1.37 standard deviations above the regional norm. Overall, Massachusetts data and itscomparison to other states within the region, suggests that this state’s placementdefinitions may be worthy of further exploration.
Massachusetts includes an “All Ages” descriptor within their Part B LRE titles. Althoughthe focus of this study is strictly school age Part B (not Preschool/619), this wasdeemed to have no affect on findings for this study.
New Jersey
New Jersey adopted and used in 2005-06 language that was proposed by OSEP for2006-07. Due to the consistency of the language in the OSEP definitions, this earlyadoption of OSEP language is not a definitional change or reinterpretation of existingcategories. Conceptually, there exists a one-to-one relationship between the OSEPcategories of 2005-06 and the OSEP categories of 2006-07. Because the New Jerseychanges were clearly designed to emulate the future OSEP changes and thesechanges only affected three LRE categories (percentage of day calculations), thisdefinitional shift is believed to have no affect on New Jersey’s year-to-year LRE data.Specific to this study, the language change had no affect and kept New Jersey’s datainline with the majority of other states.2
Rhode Island
Rhode Island does not ask LEAs to categorize student LRE placement. Instead theSEA collects data on a series of questions. (See excerpt from RI IEP in Appendix F.)
1 During the course of this study the 2005 data were released. MA retained the highest percentage of all
northeast states in the 21-60% category, with slight improvement in their under 21% category movingthem up to an average of 49.27%, just under one standard deviation below the northeast region as awhole.2 Anytime change occurs—even simple language—there is potential likelihood of data shift. This can bedue to changing databases, documents, applications, trainings, etc.

Region 1 2006 Westat State Analysis LRE Grant: Final Report January 9, 2007
Northeast Regional Resource Center 27
With these data, the SEA staff determines LRE categories by calculating the percentageof time in the regular class for each student. (Because their LEA constituency is notasked to categorize student LRE data, the survey portion of this study was notapplicable in Rhode Island and was a large factor influencing their non-participation inthe survey.) This study attempted to have those at the Rhode Island SEA who makethe LRE placement determinations respond to the survey and/or provide a phoneinterview with the consultant on the Rhode Island process. Because Rhode Island didnot choose to participate, it is unknown how the state’s LRE data categories classifiedat the SEA level affects their data. Reviewing the Rhode Island data for 2004 and 2005shows no particular anomalies.
Policy Question 3
3. How do LEAs’ understanding of those directions and the actual reporting of datacompare or are comparable across LEAs within and across states?
To truly answer policy question 3 a representative sample of LEAs would be neededfrom within each state. Since that was not possible within the limitations of this study,data were gathered that attempted to explore the questions surrounding LEA inter-judgereliability within and across northeast states.
While a larger sample is needed to come to a definitive conclusion, the individual stategraphs in Figure 2 suggest that LEA respondents in this study were not consistentwithin their states in classifying LRE placement scenarios. Except for the respondentsfrom New York, in which a high degree of inter-rater reliability was demonstrated,respondents within each of the other states surveyed were never in total agreementregarding how to classify a single scenario.
If respondents within a state are not in agreement in how to classify a scenario, itfollows that little cross-state agreement would exist for the same scenario. The “all”state bar in the graphs in Figure 1 shows little agreement across states with respect tohow respondents classified a scenario. There are, however, patterns of responsesacross states. This could mean that respondents in different states struggle similarly intheir classification process. Although the study is based on a small and non-representative sample from the northeast, the findings indicate a need for cohesive anduniform training and technical assistance methods that cross state borders. Many of therecommendations below suggest regional and national (not just state) approaches forimproving the reliability of the LRE classifications.
In sum, generally states in the northeast (with the possible exception of New York) werenot consistent in the way they individually classified the LRE placement of school agespecial education scenarios. While this study focused on the northeast states, there isno reason to suspect states in the northeast have any more or less internal LREconsistency than other regions of the U.S.

Region 1 2006 Westat State Analysis LRE Grant: Final Report January 9, 2007
Northeast Regional Resource Center 28
Policy Question 4
In an effort to proactively provide additional information that might assist these SEAsthis study took on a fourth policy question as part of this work.
4. What types of technical assistance and training are available to LEAs on classifyingLRE placement information and what is their level of utilization and perceived value?
Tables 3 and 4 presented data from questions designed to elicit respondents’ a)knowledge of availability, b) engagement with, and c) perceived value of different typesof SEA training and technical assistance. Results show that the respondents favoredtargeted technical assistance, that is, technical assistance designed to answer specificquestions when needed. Data Dictionary, Expert Availability and Colleagues areexamples of providing targeted (as opposed to general) assistance.
The availability of a Data Dictionary is the most highly valued form of technicalassistance, as reported by five respondents. (However, as reported in Appendix E, theexistence of a Data Dictionary was never reported by a majority of respondents in anystate, casting some doubt on respondent’s understanding of a Data Dictionary.)Generally, types of assistance characterized as “interactive” scored high. It seemsimportant for respondents to communicate with others about a specific LRE placementissue—especially when they need immediate assistance. Trainings of a schedulednature were noticeably less valued by respondents. It could be that such trainings aremore general in nature—however the content of trainings was not part of this study.
Some specific training improvements are included in the recommendations. Withrespect to the existence of training and technical assistance there was noticeable lackof knowledge among respondents about what training and TA is available within theirstate. (See Appendix E for more detailed data.) There was also considerable range inthe degree of within state agreement regarding the availability of particular forms ofassistance. The rate of agreement within states in terms of availability of particularforms of TA within the state ranged from a low of 18% in Massachusetts to a high of73% in New Jersey. This may in part be explained by the fact that the majority ofrespondents were local Special Education Directors—not necessarily the primaryaudience for trainings and ongoing TA on data collection. However, even local SpecialEducation Directors should be expected to have an awareness of the types of SEAtraining and technical assistance available to their local staff. This is especiallyimportant when new personnel come into a position and may be inquiring of theirSpecial Education Director about what available assistance.
Training and technical assistance results influence the recommendations noted later inthis section. It is hoped that the summary results—especially at the individual statelevel—will be useful to each state in this study. Logically reviewing training materialsand processes would assist LEA staff in improving inter-rater reliability.

Region 1 2006 Westat State Analysis LRE Grant: Final Report January 9, 2007
Northeast Regional Resource Center 29
Suggestions for Future Studies
The following suggestions are provided to assist future investigators of specialeducation LRE classification.
1. Expand the sample. Any future study would do well to capture the input of manymore respondents—ideally collect data on the universe of LEAs within a state.
2. To the extent possible, use the same survey instrument. This will not only limitbias that can inadvertently be built into instruments by language choice, surveylength, question order—but will simplify the development, streamline thecommunication, and reduce administration functions.
3. If administering the survey via the web (recommended), program the surveysoftware so that respondents that do not complete the survey are encouraged todo so before exiting. In this study, a small number of respondents started thesurvey but only answered a few questions before stopping. This made theirresults basically unusable. Given the limited number of respondents allowed perstate, this was especially troublesome.
4. Consider surveying multiple respondents within a district. For example, surveythe LRE data knowledge of the Special Education Director and data secretaryand a special education teacher. This would greatly increase the chance ofaccessing the person most likely to make LRE data classifications within thatdistrict. Second, it would provide insight into the LRE data knowledge of distinctgroups of personnel employed in special education positions.
5. Future investigations may wish to gather information on what would makeselected trainings and technical assistance on LRE more or less useful.
6. When possible, gather survey data from special education personnel during theschool year, outside the months of June – August.
7. Cleary communicate to State Directors of Special Education what commitmentsare necessary for study participation. Ask them to communicate thesecommitments to the IDEA Data Managers. Helping the SEA understand thestate benefits of the study (e.g., target areas for training) may help ensureparticipation and responsiveness.
State, Regional, and National Recommendations
Aggregate LRE placement data are regularly reviewed and the results of LRE datacollections can determine intervention at the state or federal level. These data are ameasure for determining the degree to which students with disabilities have access tothe general education curriculum and are receiving special education and relatedservices in the least restrictive environment. Ideally, these data would be reliable andaccurate and exhibit a very high degree of inter-rater agreement. Without acceptablyhigh rates of inter-rater reliability, data are not comparable within or across states.Based on findings from this study, recommendations are made for improving LRE datareliability within LEAs, within a state, within a region, and therefore nationally. Withinthese recommendations “state” refers to State Departments of Education, “regional”

Region 1 2006 Westat State Analysis LRE Grant: Final Report January 9, 2007
Northeast Regional Resource Center 30
refers to Regional Resource Center (RRC) regions, and “national” refers to theassistance available via Westat /OSEP.
1. Discuss different ways scenarios are classified. (State, Regional, National)In this study many districts within a state classified a scenario differently from otherdistricts within the same state. Frequent and open discussion—not lecture—that seeksto understand different interpretations can begin to inform documents and trainings thatcan help address state variation. To the extent this can be done regionally, or evennationally (through Data Manager meetings and discussion of common trainingmaterials) less variation will eventually be found in LRE data. Encouraging opendiscussion with peer-to-peer learning can move a state, region, and in time the country,towards greatly improved LRE inter-rater agreement.
2. Update training materials (Regional, National)Develop regional and/or national training and TA materials specifically to assist SEAs inworking with LEAs that, based on the data, may be experiencing difficulty in correctlycoding LRE placements. Since states train on LRE in various ways, providing somesomewhat standardized training materials for SEAs would be useful. Similarly to thepresent study, consider an investigation of how definitions, technical assistance, trainingand other factors might be affecting LRE data in states or regions. Then designmaterials accordingly.
3. Create an extensive list of hard-to-code scenarios. (State, Regional, National)Collect the hardest-to-code real life scenarios at the local, state, regional, and nationallevel. Gather and record all the facts available on the student in question. Change thedetails so it remains anonymous and determine the correct placement code. (Thiscould be done by a well-informed and representative committee of experts.) Then buildan online searchable and dynamic database where users can look up the scenarios onthe Web. This would provide users at all levels with similar exemplars as well as anexcellent teaching tool.
4. Hotline for hard-to-code scenarios. (State, Regional, National)Respondents in this study reported high value to the availability of an expert beingavailable via phone or email to assist with LRE coding. States might considerdeveloping a customer hotline during the child count reporting period to immediately(within one working day) answer any LRE placement questions. Ideally, Westat / OSEPcould provide this same level of timely response when SEA Data Managers have similarquestions. State IDEA Data Managers need to be seen as responsive to their LEAconstituents and the “teachable moment” is immediately after a question is asked. Tothe extent that the most difficult to code scenarios could be pre-captured and classifiedin state, regional, or national training materials (#2 above), an immediate nationalhotline would be less needed.
5. Improve state level trainings. (State, Regional, National) Based on this study, state level trainings to LEAs of a face-to-face and hands-on natureare frequent but not as highly valued as other methods of knowledge transfer. Considerwhat needs to be done to improve such trainings, such as:

Region 1 2006 Westat State Analysis LRE Grant: Final Report January 9, 2007
Northeast Regional Resource Center 31
Having attendees bring one or two examples of difficult to code studentsbased on real life. Discuss the scenarios as a group. Share materials (SEA,RRC, National) that are designed to assist the LEAs in classifying LREscenarios.
Assist LEAs in reviewing their year-to-year change reports (if available).Alternatively, have LEAs pull and analyze their data.
Survey participant satisfaction with SEA trainings (and optionally, othermethods of technical assistance). Based on responses, incorporate newmethods and materials into trainings.
Consider holding a focus group specifically for soliciting feedback on datatrainings. Concentrate on how to improve all aspects of LRE training andtechnical assistance.
6. Consider target audience to announce trainings. (State)The respondents for this study were predominantly local Special EducationDirectors—and their self-report data suggests they were not well informed about theexistence of specific LRE technical assistance and trainings. Depending oncommunication policies, copy local directors on all e-mail and paper correspondencerelative to LRE assists. Also at SEA conferences consider having a data support staffat a table for a day to share with interested local special education directors what datacollections exist, what trainings exist, due dates, etc. Providing an attractive one pageannual calendar of data events is particularly helpful to visual learners. Encourage localSpecial Education Directors to contact the SEA whenever a new local data supportperson is hired.
7. Develop LEA year-to-year change reports. (State, Regional)Similar to Westat’s use of SEA level data, SEAs should develop reports that present tothe LEA both in graphic and tabular form the LRE changes within a district from oneyear to the next. Ideally, these can be viewed by the LEA while they are in the laststages of their current year submission process. LEAs with changes that exceed adesignated level should be required to explain the changes to the SEA. (Occasionally,data system errors can account for substantial shifts in an LEA’s data. Providing year-to-year change reports assists in providing an early alert to the LEA.) The RegionalResource Centers could assist one or more states that are not doing this bycoordinating collaborative sharing within the region, and across regions, helping SEAsdevelop year-to-year report formats, and coordinating the development of LEA trainingmaterials for using the reports.
8. Develop student-level year-to-year change reports. (State, Regional)States with individual student level collection capacity can design student specificreports to flag whenever an individual student moves two or more points on the LREplacement continuum from one year to the next. LEAs with such students could then berequired to provide an explanation whenever a preset number and/or percent of suchchanges exist. Such data could also be useful for LEA monitoring. State assignedunique identifiers are required. The Regional Resource Center could assist states inthe region to design such reports and LEA training materials.

Region 1 2006 Westat State Analysis LRE Grant: Final Report January 9, 2007
Northeast Regional Resource Center 32
9. Develop a pre-test for IDEA Data Managers. (State) An additional idea, notbased on any specific aspect of this study, is to develop a pre-test for IDEA DataManagers. A pre-test would serve as an introduction to the complexity of issuessurrounding LRE. It might encourage new (and experienced) IDEA Data Managers toaccess the resources and technical assistance available on LRE. A Regional ResourceCenter could also develop such a test for fostering regional discussions with state IDEAData Managers.
Conclusion
This study began with the premise that LRE data are important; therefore accuracy(reliability) of LRE data is critical. Based on a small number of respondents, this studysheds doubt about the accuracy of LRE data within and across the northeastern states.However, there is no reason to believe that this group of states is any more or lessdifferent than any other group of states. It is our belief that many, possibly most, SEAIDEA Data Managers suspect inter-rater reliability problems in the collection of LREdata within their own state. Findings and recommendations from this study can be usedto improve the accuracy of LRE data at classroom, district, state, region and nationallevels.
The study was conducted under the direction of the Northeast Regional Resource Center
(NERRC) Director Kristin Reedy, Ed.D. Bruce Bull of Education Data Services and InformationSystems (EDSIS) was the consultant and conducted the work.
Region 1 2006 Westat State Analysis LRE Grant: Final Report January 9, 2007
Northeast Regional Resource Center 33
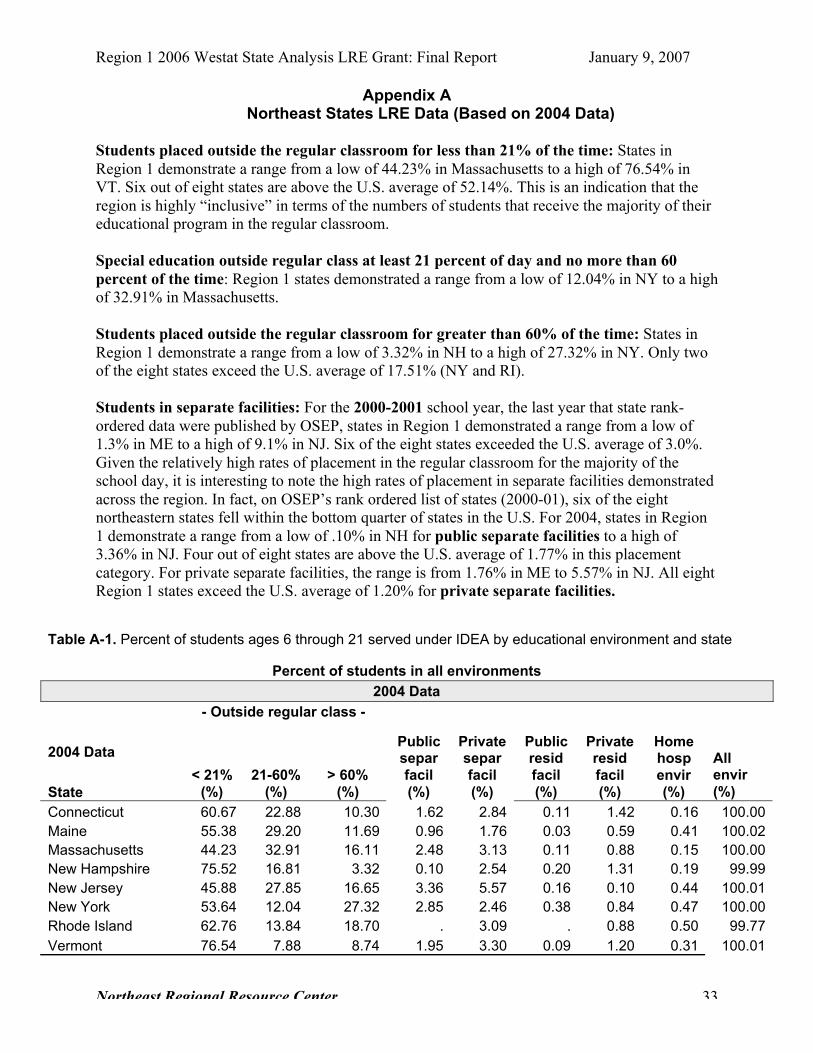
Appendix ANortheast States LRE Data (Based on 2004 Data)
Students placed outside the regular classroom for less than 21% of the time: States in
Region 1 demonstrate a range from a low of 44.23% in Massachusetts to a high of 76.54% in
VT. Six out of eight states are above the U.S. average of 52.14%. This is an indication that the
region is highly “inclusive” in terms of the numbers of students that receive the majority of their
educational program in the regular classroom.
Special education outside regular class at least 21 percent of day and no more than 60
percent of the time: Region 1 states demonstrated a range from a low of 12.04% in NY to a high
of 32.91% in Massachusetts.
Students placed outside the regular classroom for greater than 60% of the time: States in
Region 1 demonstrate a range from a low of 3.32% in NH to a high of 27.32% in NY. Only two
of the eight states exceed the U.S. average of 17.51% (NY and RI).
Students in separate facilities: For the 2000-2001 school year, the last year that state rank-
ordered data were published by OSEP, states in Region 1 demonstrated a range from a low of
1.3% in ME to a high of 9.1% in NJ. Six of the eight states exceeded the U.S. average of 3.0%.
Given the relatively high rates of placement in the regular classroom for the majority of the
school day, it is interesting to note the high rates of placement in separate facilities demonstrated
across the region. In fact, on OSEP’s rank ordered list of states (2000-01), six of the eight
northeastern states fell within the bottom quarter of states in the U.S. For 2004, states in Region
1 demonstrate a range from a low of .10% in NH for public separate facilities to a high of
3.36% in NJ. Four out of eight states are above the U.S. average of 1.77% in this placement
category. For private separate facilities, the range is from 1.76% in ME to 5.57% in NJ. All eight
Region 1 states exceed the U.S. average of 1.20% for private separate facilities.
Table A-1. Percent of students ages 6 through 21 served under IDEA by educational environment and state
Percent of students in all environments
2004 Data
- Outside regular class -
2004 Data
State
< 21%
(%)
21-60%
(%)
> 60%
(%)
Publicsepar
facil
(%)
Privatesepar
facil
(%)
Publicresid
facil
(%)
Privateresid
facil
(%)
Homehosp
envir
(%)
Allenvir
(%)
Connecticut 60.67 22.88 10.30 1.62 2.84 0.11 1.42 0.16 100.00
Maine 55.38 29.20 11.69 0.96 1.76 0.03 0.59 0.41 100.02
Massachusetts 44.23 32.91 16.11 2.48 3.13 0.11 0.88 0.15 100.00
New Hampshire 75.52 16.81 3.32 0.10 2.54 0.20 1.31 0.19 99.99
New Jersey 45.88 27.85 16.65 3.36 5.57 0.16 0.10 0.44 100.01
New York 53.64 12.04 27.32 2.85 2.46 0.38 0.84 0.47 100.00
Rhode Island 62.76 13.84 18.70 . 3.09 . 0.88 0.50 99.77
Vermont 76.54 7.88 8.74 1.95 3.30 0.09 1.20 0.31 100.01
Region 1 2006 Westat State Analysis LRE Grant: Final Report January 9, 2007
Northeast Regional Resource Center 34
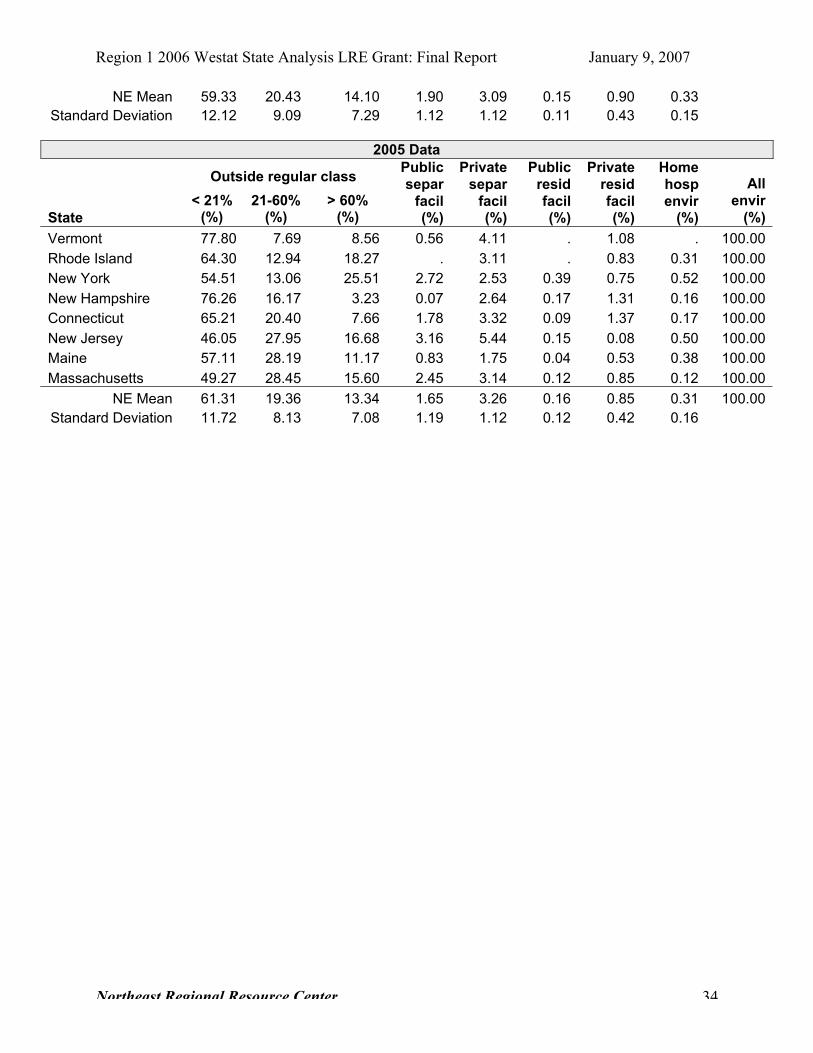
NE Mean 59.33 20.43 14.10 1.90 3.09 0.15 0.90 0.33
Standard Deviation 12.12 9.09 7.29 1.12 1.12 0.11 0.43 0.15
2005 Data
Outside regular class
State
< 21%(%)
21-60%(%)
> 60%(%)
Public
separ
facil(%)
Private
separ
facil(%)
Public
resid
facil(%)
Private
resid
facil(%)
Home
hosp
envir(%)
All
envir
(%)
Vermont 77.80 7.69 8.56 0.56 4.11 . 1.08 . 100.00
Rhode Island 64.30 12.94 18.27 . 3.11 . 0.83 0.31 100.00
New York 54.51 13.06 25.51 2.72 2.53 0.39 0.75 0.52 100.00
New Hampshire 76.26 16.17 3.23 0.07 2.64 0.17 1.31 0.16 100.00
Connecticut 65.21 20.40 7.66 1.78 3.32 0.09 1.37 0.17 100.00
New Jersey 46.05 27.95 16.68 3.16 5.44 0.15 0.08 0.50 100.00
Maine 57.11 28.19 11.17 0.83 1.75 0.04 0.53 0.38 100.00
Massachusetts 49.27 28.45 15.60 2.45 3.14 0.12 0.85 0.12 100.00
NE Mean 61.31 19.36 13.34 1.65 3.26 0.16 0.85 0.31 100.00
Standard Deviation 11.72 8.13 7.08 1.19 1.12 0.12 0.42 0.16

Region 1 2006 Westat State Analysis LRE Grant: Final Report January 9, 2007
Northeast Regional Resource Center 35
Appendix BAdvance Project Checklist for LRE Materials
State: ____ Date: ________
LRE-Specific MaterialAvailableto Review
NotAvailable
NotSure
OnWeb?
Comment
1. Copies of Forms
2. State Data Dictionarywith LRE Definitions
3. Online Help from StateData System(s)
4. Face-to-Face TrainingMaterials
5. Training Videos /Online Flash
6. FAQs Regarding LRE
7. Other
8. Other
9. Other
Initial Thoughts onExpanded Survey Option
General Comments
State Materials Form

Region 1 2006 Westat State Analysis LRE Grant: Final Report January 9, 2007
Northeast Regional Resource Center 36
Appendix CProcess Form
A portion of this LRE study looks at processes that can affect the way LRE data are reported.Please answer each question and submit completed questionnaires at the end of today’slunch meeting. Thank you!
1. Briefly, describe your SEA’s internal process to implement any annual OSEP changes toIDEA data requirements and/or definitions? (E.g., informal discussions, formalcommittee(s) review, IT submission process.)
2. If/when your SEA can not/will not abide by a new data requirement or definition (for theimmediate future or long term), what internal SEA processes is there for making thisdecision?
For the remainder of the items please think specifically about LRE.3. Does your state require LRE definitions on the IEP? If yes, to what degree do the LRE
definitions exactly mirror OSEP definitions?
4. What materials does your SEA use to inform LEAs of updates to LRE definitions?
5. What processes does your SEA use to inform LEAs of updates to LRE definitions?
6. Indicate the feedback your SEA provides to LEAs relative to their submitted LRE data.a) Are year-to-year changes in annual child count LRE data brought to the LEA’s
attention? If so, when?
b) Are LRE trend analyses conducted by the SEA and reported to the LEA?
c) Are LRE trend analyses conducted by the LEA that is monitored or reviewed by theSEA?
d) Are student level change reports provided back to the LEA by the SEA?
e) Does the state use a verification process (e.g., sampling of files) to check reportedLRE data at the individual student level? If yes, describe.
f) Other?
7. How do LEAs communicate the definitions (old or updated) to those responsible fortransmitting LRE data from the IEP to the SEA?
8. Finally, to what degree are the OSEP changes received by your SEA in time to make thenecessary changes in the collection processes

Region 1 2006 Westat State Analysis LRE Grant: Final Report January 9, 2007
Northeast Regional Resource Center 37
Appendix DGeneric Survey Instrument
Actual surveys were state specific and built in a program called SelectSurvey. Below isthe text of all the questions that were asked of all states.
IntroductionThis survey is designed to gather information on how the educational placement of students withdisabilities is determined and reported to the State Education Agency (SEA). The Northeast RegionalResource Center (NERRC) received a grant from Westat to conduct a regional study of the specialeducation placement patterns and processes in the northeastern states. This survey is part of that work.Your responses can remain anonymous—no names are requested. Your responses will be combinedwith those from other Local Education Agencies (LEAs) in your state and in the northeast region, toprovide insight on the topic of placement.
Access to student records is not required for this survey, and the survey can be completed from anylocation with Internet access. This is NOT a state monitoring activity. It is NOT part of any LEAinvestigation. And it is NOT part of any child count data verification process. It is only a state affiliatedactivity in that SEA directors from all of the northeastern states supported NERRC in proposing andconducting this study.
Challenges interacting with the online survey process should be addressed to Bruce Bull. (503.589.9660x 21, [email protected].) He is in the Pacific time zone and therefore 3 hours behind us. Questionsregarding survey content or a specific item should be addressed to: ____________ or _________@-_______
We truly appreciate your time (estimated survey response time 15-20 minutes) and input on this topic.
Demographics / Experience1. Pick the one category that most accurately categorizes your current job: * _ Special Ed Secretary/Administrative Assistant /Child Count Data Entry Clerk_ IEP Team Chair / Special Ed Liaison_ Special Education Teacher_ Special Education Director or Director of Special Education_ Other, please specify
2. How many YEARS have you been in the above position? (Round to nearest whole year.)* The valuemust be between 0 and 40, inclusive.
3. In general, what is your level of confidence in the accuracy of the data you are reporting to your SEAon the placement classifications of students with disabilities? * 1 (Low) 2 3 4 5 (High) Confidence
Technical Assistance and TrainingWe want to know about the availability and usefulness of different types of technical assistance (TA)and/or training you may have access to and/or received specifically on the topic of categorizing andreporting placement data to the SEA.
4. Were FACE-TO-FACE trainings/workshops available regarding placement data? * Yes No
5. In the last 24 months, did you engage in any FACE-TO-FACE trainings/workshops regardingplacement data?* Yes No
6. How valuable to you was that FACE-TO-FACE training/workshop?* 1 (Low) 2 3 4 5 (High) Value

Region 1 2006 Westat State Analysis LRE Grant: Final Report January 9, 2007
Northeast Regional Resource Center 38
7. Were DISTANCE LEARNING trainings/workshops available regarding placement data? * Yes No
8. In the last 24 months, did you engage in any DISTANCE LEARNING trainings/workshops regardingplacement data?* Yes No
9. How valuable to you was that DISTANCE LEARNING training/workshop?* 1 (Low) 2 3 4 5 (High) Value
10. Were HANDS-ON computer trainings/workshops available regarding placement data? (These mayhave been in conjunction with face-to-face trainings or distance learning trainings.) * Yes No
11. In the last 24 months, did you engage in any HANDS-ON trainings/workshops regarding placementdata?* Yes No
12. How valuable to you was that HANDS-ON training/workshop?* 1 (Low) 2 3 4 5 (High) Value
13. Was VIDEO of taped trainings (e.g., VHS, online) available regarding placement data? * Yes No
14. In the last 24 months, did you view any VIDEO of taped trainings/workshops regarding placementdata?* Yes No
15. How valuable to you was that VIDEO of trainings/workshops regarding placement data?* 1 (Low) 2 3 4 5 (High) Value
16. Was AUTOMATED HELP available from the data system or application (e.g., online help screens)? *Yes No
17. In the last 24 months, did you engage any AUTOMATED HELPS from the data system orapplication? * Yes No
18. How valuable to you was that AUTOMATED HELP?* 1 (Low) 2 3 4 5 (High) Value
19. Was a DATA DICTIONARY available to you regarding placement data? * Yes No
20. In the last 24 months, did you access the DATA DICTIONARY regarding placement data?*Yes No
21. How valuable to you was that DATA DICTIONARY?* 1 (Low) 2 3 4 5 (High) Value
22. Were DOCUMENTS such as memos, letters, process manuals, etc. (other than a Data Dictionary)available to help you address the topic of education placement? * Yes No
23. In the last 24 months, did you access any DOCUMENTS (other than a Data Dictionary) to assist youwith placement data?* Yes No
24. How valuable to you were those DOCUMENTS (other than a Data Dictionary)?* 1 (Low) 2 3 4 5 (High) Value
25. Was a "state EXPERT" available to you via EMAIL to answer questions you had regarding educationplacement?* Yes No
26. In the last 24 months, did you engage a state "EXPERT" via EMAIL to assist you regardingplacement data?* Yes No
27. How valuable to you was the EMAIL assistance from the state "EXPERT"?*

Region 1 2006 Westat State Analysis LRE Grant: Final Report January 9, 2007
Northeast Regional Resource Center 39
1 (Low) 2 3 4 5 (High) Value
28. Was a "state EXPERT" available to you via PHONE to answer questions you had regardingeducation placement?* Yes No29. In the last 24 months, did you engage a state "EXPERT" via PHONE to assist you regardingplacement data?* Yes No
30. How valuable to you was the PHONE assistance from the state "EXPERT"?* 1 (Low) 2 3 4 5 (High) Value
31. Were FAQs (frequently asked questions with answers) available to you regarding placement data?Yes No
32. In the last 24 months, did you access the FAQs regarding placement data?* Yes No
33. How valuable to you were these FAQs?* 1 (Low) 2 3 4 5 (High) Value
34. Was HELP FROM A COLLEAGUE available to you regarding placement data? * Yes No
35. In the last 24 months, did you access any HELP FROM A COLLEAGUE regarding placement data?*Yes No
36. How valuable to you was that HELP FROM A COLLEAGUE?* 1 (Low) 2 3 4 5 (High) Value
37. Please share any other types of TA you received or had available to you regarding understandingand reporting special education placement data. You may also provide additional comments on any of theabove types of technical assistance if you wish.
38. When you have a student that is difficult to code, what process(es) do you use to determine theplacement? *
a)Take my best educated guess Never Rarely Sometimes Often Alwaysb) Ask a colleague Never Rarely Sometimes Often Alwaysc) Call someone at the state Never Rarely Sometimes Often Alwaysd) Review TA materials Never Rarely Sometimes Often Always
39. What else would assist you in classifying special education placement determinations?
ScenariosAs you know, a student may receive education in multiple settings (e.g., regular class, self containedspecial education class, private residential school). At times, categorizing educational placement can bedifficult. This survey is designed to get information on “difficult to code” school age students. Getting yourhonest and independent perspective will provide us insight into placement categorization.
Please read each school age scenario that follows and pick the best response base on the "School AgeDefinitions". (School age definitions are contained in the link.)
On some scenarios you may wish you had additional information to categorize more accurately. However,there is no additional information. As you may suspect, we have created some scenarios that are difficultto code. Also, this is not a “group exercise.” Getting your independent perspective is important.

Region 1 2006 Westat State Analysis LRE Grant: Final Report January 9, 2007
Northeast Regional Resource Center 40
40. Steve’s parents removed Steve, a 7th grader, from public school and placed him in a private prepschool in their district. Later Steve is found eligible for special education. Steve now receives 2 hours aday of pull-out services in the resource room at the private school. * _ Sp Ed outside regular class less than 21% of day_ Sp Ed outside reg cl at least 21% not more than 60%_ Sp Ed outside regular class more than 60% of day_ Public separate school_ Private separate school_ Public residential facility_ Private residential facility_ Homebound/Hospital_ Don't know
41. Jamie goes to the local high school in the morning for 15 hours a week. While there Jamie receives 5hours a week of special education in a co-taught program. (The co-taught classroom has one specialeducation teacher and one general education teacher. The general education teacher is the teacher ofrecord for this classroom.) In the afternoon Jamie goes to a work study program at the local McDonald’sfor a total of 15 hours a week.* _ Sp Ed outside regular class less than 21% of day_ Sp Ed outside reg cl at least 21% not more than 60%_ Sp Ed outside regular class more than 60% of day_ Public separate school_ Private separate school_ Public residential facility_ Private residential facility_ Homebound/Hospital_ Don't know
42. A district places Holly at a residential school for students with sensory impairments. Holly lives closeto the school, so she takes the bus to and from school as a day student. Assume this is a publicresidential school.* _ Sp Ed outside regular class less than 21% of day_ Sp Ed outside reg cl at least 21% not more than 60%_ Sp Ed outside regular class more than 60% of day_ Public separate school_ Private separate school_ Public residential facility_ Private residential facility_ Homebound/Hospital_ Don't know
43. What is Holly's placement if the school is a private residential school?* _ Sp Ed outside regular class less than 21% of day_ Sp Ed outside reg cl at least 21% not more than 60%_ Sp Ed outside regular class more than 60% of day_ Public separate school_ Private separate school_ Public residential facility_ Private residential facility_ Homebound/Hospital_ Don't know
44. The district placed Pat at a private separate school for students on IEPs. Though still attending therepart of the day, he is now transitioning back to his local high school. Currently his daily routine is to attendthe private school from 9 - 12 then he is bussed to the public high school. In the afternoon he is in twogeneral education classes with an instructional assistant who is responsible for Pat and another student

Region 1 2006 Westat State Analysis LRE Grant: Final Report January 9, 2007
Northeast Regional Resource Center 41
with disabilities. He also attends one special education life skills class at the public high school. Each highschool class is an hour long.* _ Sp Ed outside regular class less than 21% of day_ Sp Ed outside reg cl at least 21% not more than 60%_ Sp Ed outside regular class more than 60% of day_ Public separate school_ Private separate school_ Public residential facility_ Private residential facility_ Homebound/Hospital_ Don't know
45. Jane is a parentally placed private school student with a Service Plan. During the first part of the yearshe received 1 hour of speech/week on a “pull-out” basis. The district decided to put her on an IEP inNovember but service levels and placement remain the same. * _ Sp Ed outside regular class less than 21% of day_ Sp Ed outside reg cl at least 21% not more than 60%_ Sp Ed outside regular class more than 60% of day_ Public separate school_ Private separate school_ Public residential facility_ Private residential facility_ Homebound/Hospital_ Don't know
46. Matt has two classes in community job experience, two general education content courses withspecial education support as needed, one class in a resource room with a special education teacher onstudy skills, and one elective class with no additional support. He has no other classes and the frequencyand duration of all classes is the same. One of the community job experience classes is a general edclass, the other is a special education class. Also, in one general education class Matt is counted onenrollment by the special education teacher, in the other class the regular ed teacher counts him forattendance. *_ Sp Ed outside regular class less than 21% of day_ Sp Ed outside reg cl at least 21% not more than 60%_ Sp Ed outside regular class more than 60% of day_ Public separate school_ Private separate school_ Public residential facility_ Private residential facility_ Homebound/Hospital_ Don't know
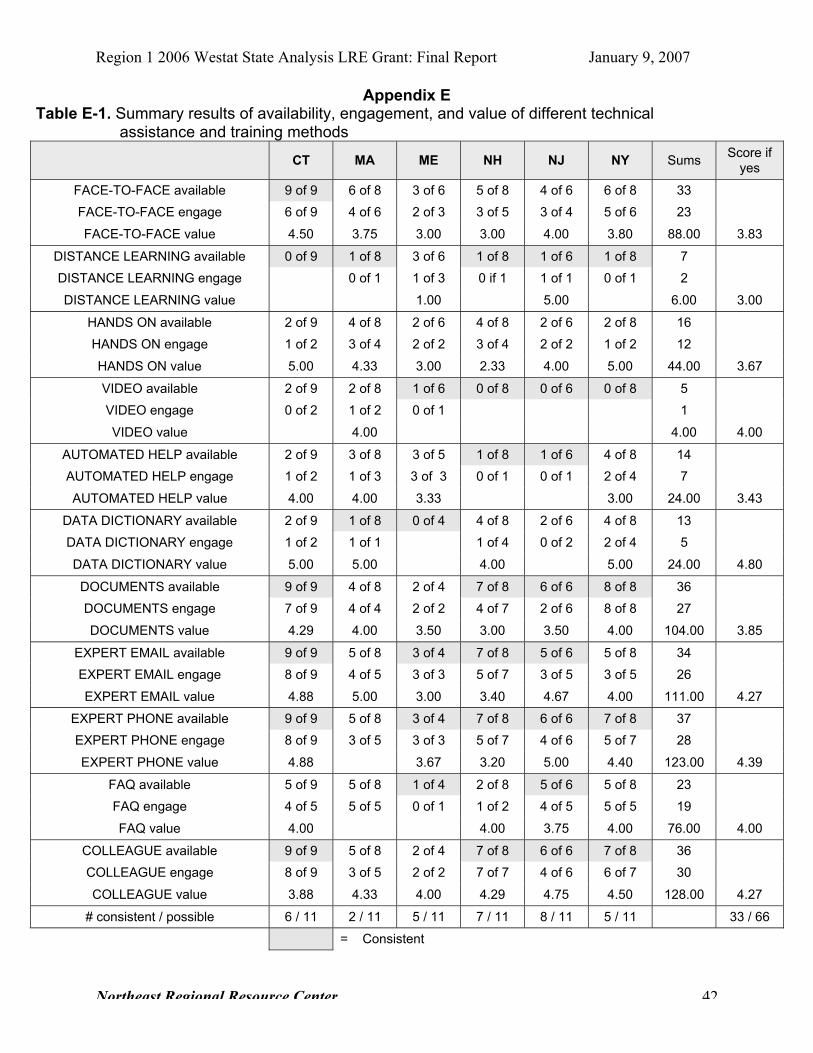
Region 1 2006 Westat State Analysis LRE Grant: Final Report January 9, 2007
Northeast Regional Resource Center 42
Appendix ETable E-1. Summary results of availability, engagement, and value of different technical
assistance and training methods
CT MA ME NH NJ NY SumsScore if
yes
FACE-TO-FACE available 9 of 9 6 of 8 3 of 6 5 of 8 4 of 6 6 of 8 33
FACE-TO-FACE engage 6 of 9 4 of 6 2 of 3 3 of 5 3 of 4 5 of 6 23
FACE-TO-FACE value 4.50 3.75 3.00 3.00 4.00 3.80 88.00 3.83
DISTANCE LEARNING available 0 of 9 1 of 8 3 of 6 1 of 8 1 of 6 1 of 8 7
DISTANCE LEARNING engage 0 of 1 1 of 3 0 if 1 1 of 1 0 of 1 2
DISTANCE LEARNING value 1.00 5.00 6.00 3.00
HANDS ON available 2 of 9 4 of 8 2 of 6 4 of 8 2 of 6 2 of 8 16
HANDS ON engage 1 of 2 3 of 4 2 of 2 3 of 4 2 of 2 1 of 2 12
HANDS ON value 5.00 4.33 3.00 2.33 4.00 5.00 44.00 3.67
VIDEO available 2 of 9 2 of 8 1 of 6 0 of 8 0 of 6 0 of 8 5
VIDEO engage 0 of 2 1 of 2 0 of 1 1
VIDEO value 4.00 4.00 4.00
AUTOMATED HELP available 2 of 9 3 of 8 3 of 5 1 of 8 1 of 6 4 of 8 14
AUTOMATED HELP engage 1 of 2 1 of 3 3 of 3 0 of 1 0 of 1 2 of 4 7
AUTOMATED HELP value 4.00 4.00 3.33 3.00 24.00 3.43
DATA DICTIONARY available 2 of 9 1 of 8 0 of 4 4 of 8 2 of 6 4 of 8 13
DATA DICTIONARY engage 1 of 2 1 of 1 1 of 4 0 of 2 2 of 4 5
DATA DICTIONARY value 5.00 5.00 4.00 5.00 24.00 4.80
DOCUMENTS available 9 of 9 4 of 8 2 of 4 7 of 8 6 of 6 8 of 8 36
DOCUMENTS engage 7 of 9 4 of 4 2 of 2 4 of 7 2 of 6 8 of 8 27
DOCUMENTS value 4.29 4.00 3.50 3.00 3.50 4.00 104.00 3.85
EXPERT EMAIL available 9 of 9 5 of 8 3 of 4 7 of 8 5 of 6 5 of 8 34
EXPERT EMAIL engage 8 of 9 4 of 5 3 of 3 5 of 7 3 of 5 3 of 5 26
EXPERT EMAIL value 4.88 5.00 3.00 3.40 4.67 4.00 111.00 4.27
EXPERT PHONE available 9 of 9 5 of 8 3 of 4 7 of 8 6 of 6 7 of 8 37
EXPERT PHONE engage 8 of 9 3 of 5 3 of 3 5 of 7 4 of 6 5 of 7 28
EXPERT PHONE value 4.88 3.67 3.20 5.00 4.40 123.00 4.39
FAQ available 5 of 9 5 of 8 1 of 4 2 of 8 5 of 6 5 of 8 23
FAQ engage 4 of 5 5 of 5 0 of 1 1 of 2 4 of 5 5 of 5 19
FAQ value 4.00 4.00 3.75 4.00 76.00 4.00
COLLEAGUE available 9 of 9 5 of 8 2 of 4 7 of 8 6 of 6 7 of 8 36
COLLEAGUE engage 8 of 9 3 of 5 2 of 2 7 of 7 4 of 6 6 of 7 30
COLLEAGUE value 3.88 4.33 4.00 4.29 4.75 4.50 128.00 4.27
# consistent / possible 6 / 11 2 / 11 5 / 11 7 / 11 8 / 11 5 / 11 33 / 66
= Consistent

Region 1 2006 Westat State Analysis LRE Grant: Final Report January 9, 2007
Northeast Regional Resource Center 43
Appendix FState School Age LRE Definitions
Rhode Island(Information secured from IEP document linked from RI DOE.)
Vermont(Information secured from state IEP form as Vermont was not involved with survey.
Information is reformatted here.)
The general characteristics of the student/child’s placement (check one, ages 6-21):
_ Inside regular class at least 80% of the time
_ Inside regular class 40% to 79% of the time
_ Inside regular class less than 40% of the time
_ Separate day school – public or private
_ Residential facility
_ Homebound/Hospital
31) SPECIAL EDUCATION AND RELATED SERVICES
32)
GOAL #
33) PROVIDERS/
SERVICES
34) LOCATION/
PLACEMENT
35) FREQUENCY/
DURATION
36) DATE 37) EXPLANATION
FOR PLACEMENTOUTSIDE OF
GENERAL
EDUCATIONSETTING
REG ED OTHER HRS/
DAY
DAYS
/WK
WK/
MO
FROM TO
38) DETERMINATION OF TIME IN REGULAR EDUCATION PROGRAM
a) _____ Total time in student’s school week
b) _____ Total time of Special Education Support/Services (33)
c) _____ Time in regular education without Special Education Support/Services
39) EXTENT OF PARTICIPATION IN REGULAR EDUCATION: This student will participate in regular grade
level program (for middle/junior high school/high school, attach schedule) except

Region 1 2006 Westat State Analysis LRE Grant: Final Report January 9, 2007
Northeast Regional Resource Center 44
New JerseyEducational Environments of Children with Disabilities Ages 6-21 (NJ)
To calculate the percentage of time inside the regular classroom, divide the number of hours the youthreceives special education and related services inside the regular classroom by the total number of hoursin the school day (including lunch, recess and study periods).
Home-schooled students who receive special education and related services provided by the localeducational agency should be counted in the first three listed placements below. For these students, thenumber of hours outside the regular classroom is the number of hours the youth spends in separatespecial education environments (e.g. resource rooms, self-contained special education classrooms,separate schools).
Educational time spent in age-appropriate community-based settings that include individuals with andwithout disabilities, such as college campuses or vocational sites, should be counted as time spent withnon-disabled peers.
Students with disabilities who are included in the general education setting at least 80% of theschool day. This may include children with disabilities placed in:
• regular class with special education/related services provided within regular classes;
• regular class with special education/related services provided outside regular classes; or
• regular class with special education services provided in resource rooms.
Students with disabilities in the presence of general education students between 40% and 80% ofthe entire school day. Students with disabilities who are included in the general education settingfrom 40% to 79% of the school day. Includes children with disabilities receiving special education andrelated services inside the regular classroom for at least 40% but no more than 79% of the school day.No more than 60% of their special education and related services are provided outside the generaleducation classroom. Do not include children who are reported as receiving education programs in publicor private separate school or residential facilities. This may include children placed in:
• resource rooms with special education/related services provided within the resource room; or
• resource rooms with part-time instruction in a regular class.
Students with disabilities who are included in the general education setting up to 39% of theschool day. At least 61% of their special education and related services are provided outside thegeneral education classroom. Includes children with disabilities receiving special education and relatedservices inside the regular classroom for less than 40 percent of the school day. Do not include childrenwho are reported as receiving education programs in public or private separate school or residentialfacilities. This category may include children placed in:
• self-contained special classrooms with part-time instruction in a regular class; or
• self-contained special classrooms with full-time special education instruction on a regular
school campus.
Public separate school. Students with disabilities who receive education programs in public separateday school facilities. This includes children with disabilities receiving special education and relatedservices for greater than 50 percent of the school day in public separate schools. This may includechildren placed in:
• public day schools for students with disabilities;
• public day schools for students with disabilities for a portion of the school day (greater than
50 percent) and in regular school buildings for the remainder of the school day; or
• public residential facilities if the student does not live at the facility.
Private separate school. Students with disabilities who receive education programs in private separateday school facilities. This includes children with disabilities receiving special education and relatedservices, at public expense, for greater than 50 percent of the school day in private separate schools.This may include children placed in:

Region 1 2006 Westat State Analysis LRE Grant: Final Report January 9, 2007
Northeast Regional Resource Center 45
• private day schools for students with disabilities;
• private day schools for students with disabilities for a portion of the school day (greater than
50 percent) and in regular school buildings for the remainder of the school day; or
• private residential facilities if the student does not live at the facility.
Public residential facility. Students with disabilities who receive education programs and live in publicresidential facilities during the school week. This includes children with disabilities receiving specialeducation and related services for greater than 50 percent of the school day in public residential facilities.This may include children placed in:
• public residential schools for students with disabilities; or
• public residential schools for students with disabilities for a portion of the school day (greater
than 50 percent) and in separate day schools or regular school buildings for the remainder of
the school day.Do not include students who received education programs at the facility, but do not live there.
Private residential facility. Students with disabilities who receive education programs and live in privateresidential facilities during the school week. This includes children with disabilities receiving specialeducation and related services, at public expense, for greater than 50 percent of the school day in privateresidential facilities. This may include children placed in:
• private residential schools for students with disabilities; or
• private residential schools for students with disabilities for a portion of the school day (greater
than 50 percent) and in separate day schools or regular school buildings for the remainder of
the school day.Do not include students who received education programs at the facility, but do not live there.
Homebound/Hospital. Students with disabilities who receive education programs inhomebound/hospital environment includes children with disabilities placed in and receiving specialeducation and related services in:
• hospital programs, or
• homebound programs.
Do not include children with disabilities whose parents have opted to home-school them and who receive
special education at the public expense.
Massachusetts
DOE034Educational Environment
3-5 Year Olds ONLY:
08-100% services in general education classroom
09-100% services in separate classroom
ALL AGES:
10-Full Inclusion, less than 21% outside general education
20- Partial Inclusion, 21%-60% outside general education
40- Substantially Separate, outside general education more than 60%
41-Public Separate Day
50-Private Separate Day
60-Residential School
70-Homebound/Hospital (Not home schooled)90-Public Residential Facility

Region 1 2006 Westat State Analysis LRE Grant: Final Report January 9, 2007
Northeast Regional Resource Center 46
New Hampshire, New York, Connecticut, Maine
Educational Environments of Children with Disabilities Ages 6-21
NY To calculate the percentage of time outside the regular classroom, divide the number of hours theyouth receives special education and related services outside the regular classroom by the total numberof hours in the school day (including lunch, recess and study periods).
ME Home-schooled students who receive special education and related services provided by the localeducational agency should be counted in the first three listed placements below. For these students, thenumber of hours outside the regular classroom is the number of hours the youth spends in separatespecial education environments (e.g. resource rooms, self-contained special education classrooms,separate schools).
ME Educational time spent in age-appropriate community-based settings that include individuals with andwithout disabilities, such as college campuses or vocational sites, should be counted as time spent withnon-disabled peers.
Special education outside regular class less than 21 percent of day. Unduplicated number ofchildren with disabilities receiving special education and related services outside the regular classroomfor less than 21 percent of the school day. This may include children with disabilities placed in:
• regular class with special education/related services provided within regular classes;
• regular class with special education/related services provided outside regular classes; or
• regular class with special education services provided in resource rooms.
Special education outside regular class at least 21 percent of day and no more than 60 percent ofday. Unduplicated total includes children with disabilities receiving special education and related servicesoutside the regular classroom for at least 21 percent but no more than 60 percent of the school day. Donot include children who are reported as receiving education programs in public or private separateschool or residential facilities. This may include children placed in:
• resource rooms with special education/related services provided within the resource room; or
• resource rooms with part-time instruction in a regular class.
Special education outside regular class more than 60 percent of day. Unduplicated total includeschildren with disabilities receiving special education and related services outside the regular classroomfor more than 60 percent of the school day. Do not include children who are reported as receivingeducation programs in public or private separate school or residential facilities. This category may includechildren placed in:
• self-contained special classrooms with part-time instruction in a regular class; or
• self-contained special classrooms with full-time special education instruction on a regular
school campus.
Public separate school. Unduplicated total who received education programs in public separate dayschool facilities. This includes children with disabilities receiving special education and related servicesfor greater than 50 percent of the school day in public separate schools. This may include childrenplaced in:
• public day schools for students with disabilities;
• public day schools for students with disabilities for a portion of the school day (greater than
50 percent) and in regular school buildings for the remainder of the school day; or
• public residential facilities if the student does not live at the facility.
Private separate school. Unduplicated total who received education programs in private separate dayschool facilities. This includes children with disabilities receiving special education and related services,

Region 1 2006 Westat State Analysis LRE Grant: Final Report January 9, 2007
Northeast Regional Resource Center 47
at public expense, for greater than 50 percent of the school day in private separate schools. This mayinclude children placed in:
• private day schools for students with disabilities;
• private day schools for students with disabilities for a portion of the school day (greater than
50 percent) and in regular school buildings for the remainder of the school day; or
• private residential facilities if the student does not live at the facility.
Public residential facility. Unduplicated total who received education programs and lived in publicresidential facilities during the school week. This includes children with disabilities receiving specialeducation and related services for greater than 50 percent of the school day in public residential facilities.This may include children placed in:
• public residential schools for students with disabilities; or
• public residential schools for students with disabilities for a portion of the school day (greater
than 50 percent) and in separate day schools or regular school buildings for the remainder of
the school day.Do not include students who received education programs at the facility, but do not live there.
Private residential facility. Unduplicated total who received education programs and lived in privateresidential facilities during the school week. This includes children with disabilities receiving specialeducation and related services, at public expense, for greater than 50 percent of the school day in privateresidential facilities. This may include children placed in:
• private residential schools for students with disabilities; or
• private residential schools for students with disabilities for a portion of the school day (greater
than 50 percent) and in separate day schools or regular school buildings for the remainder of
the school day.Do not include students who received education programs at the facility, but do not live there.
Homebound/Hospital. Unduplicated total who received education programs in homebound/hospitalenvironment includes children with disabilities placed in and receiving special education and relatedservices in:
• hospital programs, or
• homebound programs.
Do not include children with disabilities whose parents have opted to home-school them and who receive
special education at the public expense.

Region 1 2006 Westat State Analysis LRE Grant: Final Report January 9, 2007
Northeast Regional Resource Center 48
Appendix GAggregate and State Level Consensus on Coding LRE for School Age Scenarios
How to read this table:The table below provides the scenarios followed by a heading row with headings foraggregate data (AG1 and AG2) and state data (e.g., CT1 and CT2). AG1 and AG2 arethe first and second most common responses (modes) for that scenario across allrespondents from all states. State data headings indicate the first and second modesfor that scenario within that state. Note that secondary state modes (e.g., CT2, ME2,MA2) are only shown when the number of respondents is greater than or equal to 2.Below the aggregate and state headings, below each scenario, are the abbreviations asshown in Table 5 that denote the LRE modal responses. These are shown both inaggregate and by state. The number of state respondents that selected each modalresponse is in the n row. Below the n is the ratio of state respondents selecting themodal response to the total number of useable respondent answers from that state forthat scenario. In other words, the number of state respondents that chose thisclassification over the number of total state respondents for this scenario. The ratio canbe seen as a measure of agreement within a state. (Note that some respondentscategorized some scenarios as “don’t now” or provided no answer and are excludedfrom that scenario’s ratio.) Pink cells denote disagreement between the state score andaggregate score. Finally, when a state had the same number of respondents for bothstate scores 1 and 2 (bimodal) the number or responses are shown in bold italicized redtext in the n row.
Table G-1. Aggregate and State level coding consensus for LRE school age
scenarios1) Steve’s parents removed Steve, a 7th grader, from public school and placed him in a privateprep school in their district. Later Steve is found eligible for special education. Steve nowreceives 2 hours a day of pull-out services in the resource room at the private school.
AG1 AG2 CT1 CT2 ME1 ME2 MA1 MA2 NH1 NH2 NJ1 NJ2 NY1 NY2
PrS 21-60 PrS < 21 PrS PrS PrS21-
60
21-
60PrS
21-
60
n 4 4 3 4 5 2 2 2 7
Ratio 4:9 4:9 3:4 4:8 5:8 2:8 2:6 2:6 7:8
2) Jamie goes to the local high school in the morning for 15 hours a week. While there Jamiereceives 5 hours a week of special education in a co-taught program. (The co-taught classroomhas one special education teacher and one general education teacher. The general educationteacher is the teacher of record for this classroom.) In the afternoon Jamie goes to a work studyprogram at the local McDonald’s for a total of 15 hours a week.
AG1 AG2 CT1 CT2 ME1 ME2 MA1 MA2 NH1 NH2 NJ1 NJ2 NY1 NY2
< 21 21-60 < 21 < 21 < 2121-60
< 21 < 21 < 21
n 7 2 6 3 2 5 8
Ratio 7:9 2:4 6:8 3:6 2:6 5:6 8:8
3) A district places Holly at a residential school for students with sensory impairments. Holly livesclose to the school, so she takes the bus to and from school as a day student. Assume this is apublic residential school.
AG1 AG2 CT1 CT2 ME1 ME2 MA1 MA2 NH1 NH2 NJ1 NJ2 NY1 NY2PuS PuR PuS PuR PuS PuS PuS PuR PuS PuR PuS
n 7 2 3 6 5 3 4 2 4

Region 1 2006 Westat State Analysis LRE Grant: Final Report January 9, 2007
Northeast Regional Resource Center 49
Ratio 7:9 2:9 3:4 6:7 5:8 3:8 4:6 2:6 7:8
4) What is Holly's placement if the school is a private residential school?
AG1 AG2 CT1 CT2 ME1 ME2 MA1 MA2 NH1 NH2 NJ1 NJ2 NY1 NY2PrS PrR PrS PrR PrS PrS PuR PrS PrR PrS PuR PrS
n 4 2 3 5 3 4 4 4 2 8
Ratio 4:9 2:9 3:4 5:8 3:8 4:8 4:8 4:6 2:6 8:8
5) The district placed Pat at a private separate school for students on IEPs. Though still attendingthere part of the day, he is now transitioning back to his local high school. Currently his dailyroutine is to attend the private school from 9 - 12 then he is bussed to the public high school. Inthe afternoon he is in two general education classes with an instructional assistant who isresponsible for Pat and another student with disabilities. He also attends one special educationlife skills class at the public high school. Each high school class is an hour long
AG1 AG2 CT1 CT2 ME1 ME2 MA1 MA2 NH1 NH2 NJ1 NJ2 NY1 NY2
> 60 PrS > 6021-60
> 60 PrS > 60 > 60 > 60 > 60
n 6 2 3 4 2 5 5 5
Ratio 6:8 2:8 3:4 4:8 2:8 5:7 5:6 5:7
6) Jane is a parentally placed private school student with a Service Plan. During the first part ofthe year she received 1 hour of speech/week on a “pull-out” basis. The district decided to put heron an IEP in November but service levels and placement remain the same.
AG1 AG2 CT1 CT2 ME1 ME2 MA1 MA2 NH1 NH2 NJ1 NJ2 NY1 NY2< 21 PrS < 21 PrS < 21 < 21 PrS PrS na Na < 21
n 5 3 3 4 3 7 na Na 8
Ratio 5:8 3:8 3:4 4:7 3:7 7:8 Skipped 8:8
7) Matt has two periods in community job experience, two general education content courses withspecial education support as needed, one class in a resource room with a special educationteacher on study skills, and one general education elective class (without special ed support). Hehas no other classes and the frequency and duration of all classes is the same.
AG1 AG2 CT1 CT2 ME1 ME2 MA1 MA2 NH1 NH2 NJ1 NJ2 NY1 NY2
< 21 21-60 < 2121-60
21-60
21-60
< 2121-60
< 21 < 2121-60
n 3 3 3 5 4 4 5 5 3
Ratio 3:7 3:7 3:4 5:7 4:8 4:8 5:6 5:8 3:8