Embed Size (px)
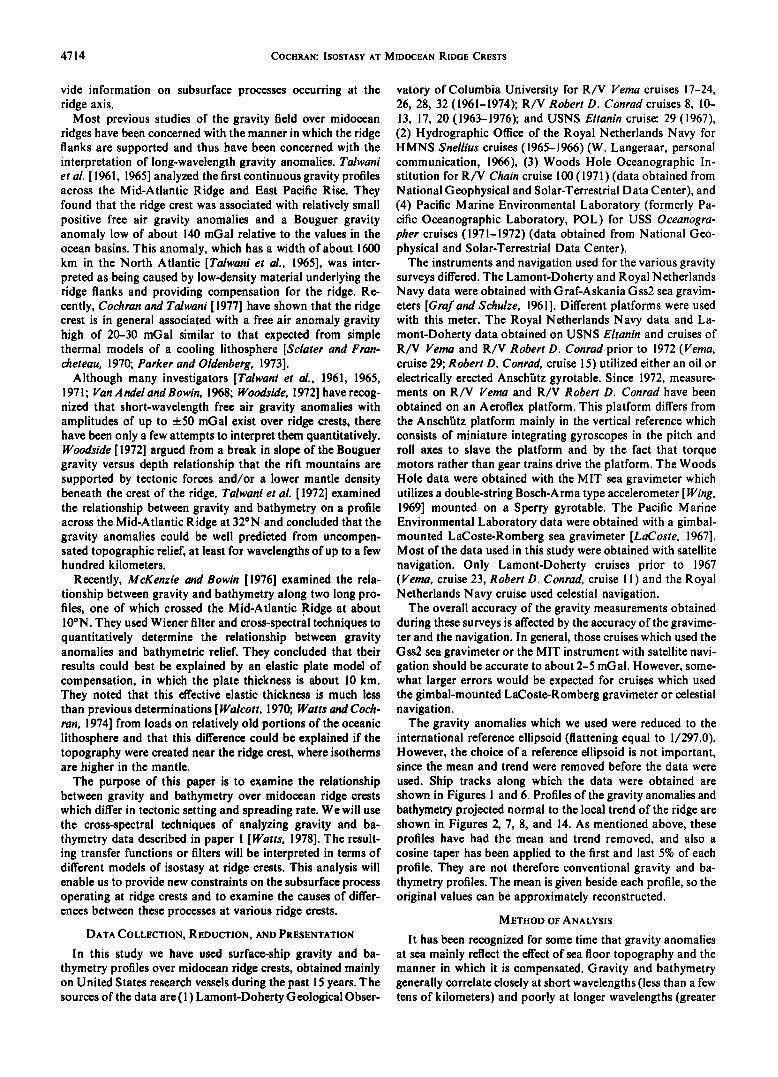
Citation preview

VOL. 84, NO. B9 JOURNAL OF GEOPHYSICAL RESEARCH AUGUST 10, 1979
An Analysis of Isostasy in the World's Oceans 2. MidoceanRidgeCrests
J. R. COCHRAN
Lamont-Doherty Geological Obseroatory of Columbia University, Palisades, New York 10964
Cross-spectral techniques are used to analyze the relationship between gravity and bathymetry at the Mid-Atlantic Ridge and the East Pacific Rise crests. The resulting transfer functions were used to study the nature of the isostatic mechanism operative at these ridge crests. The most satisfactory results were obtained for models in which the oceanic lithosphere is treated as a thin elastic plate overlying a weak fluid. The best fitting elastic thickness to explain gravity and bathymetry at the fast spreading (v > 5 cm/ yr) East Pacific Rise is in the range of 2-6 km and at the relatively slow spreading (v < 2 cm/yr) Mid- Atlantic Ridge is in the range 7-13 km. These estimates are significantly smaller than the elastic thickness of 20-30 km obtained from surface loads formed on old (> 80 m.y.) parts of the oceanic lithosphere. This difference is consistent with the fact that ridge topography is formed near the ridge axis, where isotherms are shallower and the lithosphere is thus weaker than in older regions. The difference between the elastic thickness of the East Pacific Rise and Mid-Atlantic Ridge is significant and may represent differing temperature structures at these ridges. Simple models in which it is assumed that the elastic thickness represents the depth to the 450øC isotherm show that these variations can be explained by differences in the spreading rate at these ridges. Thus the lower effective thickness at the East Pacific Rise can be attributed to higher average temperatures at shallow depths in a region surrounding the ridge crest. This is due to the faster spreading rate which results in isotherms having a shallower dip away from the axis than at the slower spreading Mid-Atlantic Ridge. This model cannot, however, explain gravity and bathymetry data over the Rekyjanes Ridge. The best fitting elastic thickness for this slow spreading ridge is similar to the thickness determined for the East Pacific Rise, suggesting an anomalous thermal regime at this ridge crest.
INTRODUCTION
Midocean ridges are recognized in plate tectonic theory as the site of creation of oceanic lithosphere which subsequently evolves through cooling and the solidification of hot mantle material. Simple models have been constructed for the cooling lithosphere which generally explain the regional topography, heat flow, and free air gravity anomalies over ridge crests [Sclater and Francheteau, 1970; Parker and Oldenburg, 1973; Lambeck, 1972]. These models have been mainly concerned with explaining the evolution of the lithosphere away from the ridge crest and therefore provide little information on sub- surface processes occurring at the ridge axis.
A number of models have now been constructed which
attempt to explain the character of sea floor topography at the ridge axis. One class of model considers the viscous interaction between the ascending hot mantle material and the adjoining lithosphere [Sleep, 1969, 1975; Sleep and Rosendahl, 1979;' Sleep and Biehler, 1970; Osmaston, 1971; Lachenbruch, 1973, 1976; Rea, 1975]. The other considers the imbalance between the width over which hot mantle material is intruded and the
distance which is required for newly erupted material to reach the mean half spreading rate [Defteyes, 1970; Anderson and Noltimier, 1973]. Both classes of models appear able to explain the general observation that slower spreading ridges (u is less than about 3 cm/yr) are characterized by an axial rift valley, while faster spreading ridges (u is greater than about 3 cm/yr) are characterized by an axial 'block' or 'horst.'
Two studies which have provided useful observational con- straints on midocean ridge crest processes are the French- American Mid-Ocean Undersea Study (Famous)project on the Mid-Atlantic Ridge and a series of ocean bottom seis- mometer (OBS) studies on the East Pacific Rise crest. Project Famous involved extensive surface ship and deep tow mea- surements as well as bottom sampling from submersibles [e.g.,
Copyright ̧ 1979 by the American Geophysical Union.
Needham and Francheteau, 1974; A rcyana, 1975; Heirtzler and Van Andel, 1977] and provided new information on the mor- phology and tectonics of the slow spreading Mid-Atlantic Ridge [e.g., Ballard and Van Andel, 1977; Ramberg and Van A ndel, 1977; Bryan and Moore, 1977; McDonald and Luyendyk, 1977]. The OBS studies [e.g., Orcutt et al., 1976; Rosendahl et al., 1976] have revealed a low-velocity zone at very shallow depths beneath the East Pacific Rise crest which may represent a zone of partial melt or a magma reservoir for the basaltic magmas erupted at the ridge axis [Rosendahl, 1976; Cann, 1974].
Although these studies have greatly increased the knowledge of subsurface processes occurring at the ridge axis, there are a number of problems which need to be resolved. These include the origin of ridge crest topography, the causes of variations in the type of axial topography between ridge crests, and whether or not a low-velocity zone underlies all ridge crests.
A useful approach to some of these problems can be made from studies of the relationship of gravity and bathymetry over ridge crests. The empirical age against depth curve [Scla- ter et al., 1971] describes the systematic increase in sea floor depth away from the ridge crest. However, on a local scale there are significant deviations from the empirical curve asso- ciated with topographic relief. These have dimensions of a few kilometers to a hundred or more kilometers and amplitudes of a few hundred meters to a few kilometers. The gravity anoma- lies associated with short-wavelength topographic irregulari- ties are greatly reduced when a Bouguer correction is made [Talwani et al., 1961, 1965], implying that they must be sup- ported by the strength of the lithosphere [Vening Meinesz, 1948]. A number of recent studies suggest that ridge flank topography is created at or near the ridge axis and is sub- sequently 'frozen in' and transported away as the lithosphere thickens and cools [e.g., Needham and Francheteau, 1974; McDonald and Luyendyk, 1977]. The relationship between gravity and bathymetry over ridge flanks may therefore pro-
Paper number 9B0063. 0148-0227/79/009B-0063 $01.00
4713
4714 COCHRAN: ISOSTASY AT MIDOCEAN RIDGE CRESTS
vide information on subsurface processes occurring at the ridge axis.
Most previous studies of the gravity field over midocean ridges have been concerned with the manner in which the ridge flanks are supported and thus have been concerned with the interpretation of long-wavelength gravity anomalies. Talwani et al. [ 1961, 1965] analyzed the first continuous gravity profiles across the Mid-Atlantic Ridge and East Pacific Rise. They found that the ridge crest was associated with relatively small positive free air gravity anomalies and a Bouguer gravity anomaly low of about 140 mGal relative to the values in the ocean basins. This anomaly, which has a width of about 1600 km in the North Atlantic [Talwani et al., 1965], was inter- preted as being caused by low-density material underlying the ridge flanks and providing compensation for the ridge. Re- cently, Cochran and Talwani [ 1977] have shown that the ridge crest is in general associated with a free air anomaly gravity high of 20-30 mGal similar to that expected from simple thermal models of a cooling lithosphere [Sclater and Fran- cheteau, 1970; Parker and Oldenberg, 1973].
Although many investigators [Talwani et al., 1961, 1965, 1971; Van Anclel and Bowin, 1968; Woodside, 1972] have recog- nized that short-wavelength free air gravity anomalies with amplitudes of up to ñ50 mGal exist over ridge crests, there have bee n only a few attempts to interpret them quantitatively. WoodSide[1972] argued from a break in slope of the Bouguer gravity versus depth relationship that the rift mountains are supported by tectonic forces and/or a lower mantle density beneath the crest of the ridge. Talwani et al. [1972] examined the relationship between gravity and bathymetry on a profile across the Mid-Atlantic Ridge at 320N and concluded that the g.ravity anomalies could be well predicted from uncompen- sated topographic relief, at least for wavelengths of up to a few hundred kilometers.
Recently, McKenzie and Bowin [1976] examined the rela- tionship between gravity and bathymetry along two long pro- files, one of which crossed the Mid'-Atlantic Ridge at about 10øN. They used Wiener filter and cross-spectral techniques to quantitatively determine the relationship between gravity anomalies and bathymetric relief. They concluded that their results could best be explained by an elastic plate model of compensation, in which the plate thickness is about l0 km. They noted that this effective elastic thickness is much less than previous determinations [ Walcott, 1970; Watts and Coch- ran, 1974] from loads on relatively old portions of the oceanic lithosphere and that this difference could be explained if the topography were created near the ridge crest, where isotherms are higher in the mantle.
The purpose of this paper is to examine the relationship between gravity and bathymetry over midocean ridge crests which differ in tectonic setting and spreading rate. We will use the cross-spectral techniques of analyzing gravity and ba- thymetry data described in paper 1 [Watts, 1978]. The result- ing transfer functions or filters will be interpreted in terms of different models of isostasy at ridge crests. This analysis will enable us to provide new constraints on the subsurface process operating at ridge crests and to examine the causes of differ- ences between these processes at various ridge crests.
DATA COLLECTION, REDUCTION, AND PRESENTATION
In this study we have used surface-ship gravity and ba- thymetry profiles over midocean ridge crests, obtained mainly on United States research vessels during the past 15 years. The sources of the data are (1) Lamont-Doherty Geological Obser-
vatory of Columbia University for R/V Verna cruises 17-24, 26, 28, 32 (1961-1974); R/V Robert D. Conrad cruises 8, 10- 13, 17, 20 (1963-1976); and USNS Eltanin cruise: 29 (1967), (2) Hydrographic Office of the Royal Netherlands Navy for HMNS $nellius cruises (1965-1966) (W. Langeraar, personal communication, 1966), (3) Woods Hole Oceanographic In- stitution for R/V Chain cruise 100 (1971) (data obtained from National Geophysical and Solar-Terrestrial Data Center), and (4) Pacific Marine Environmental Laboratory (formerly Pa- cific Oceanographic Laboratory, POL) for USS Oceanogra- pher cruises (1971-1972) (data obtained from National Geo- physical and Solar-Terrestrial Data Center).
The instruments and navigation used for the various gravity surveys differed. The Lamont-Doherty and Royal N etherlands Navy data were obtained with Graf-Askania Gss2 sea gravim- eters [Graf and $chulze, 1961]. Different platforms were used with this meter. The Royal Netherlands Navy data and La- mont-Doherty data obtained on USNS Eltanin and cruises of R/V Verna and R/V Robert D. Conrad prior to 1972 (Verna, cruise 29; Robert D. Conrad, cruise 15) utilized either an oil or electrically erected Anschi•tz gyrotable. Since 1972, measure- ments on R/V Verna and R/V Robert D. Conrad have been obtained on an Aeroflex platform. This platform differs from the Anschi•tz platform mainly in the vertical reference which consists of miniature integrating gyroscopes in the pitch and roll axes to slave the platform and by the fact that torque motors rather than gear trains drive the platform. The Woods Hole data were obtained with the MIT sea gravimeter which utilizes a double-string Bosch-Arma type accelerometer [ Wing, 1969] mounted on a Sperry gyrotable. The Pacific Marine Environmental Laboratory data were obtained with a gimbal- mounted LaCoste-Romberg sea gravimeter [LaCoste, 1967]. Most of the data used in this study were obtained with satellite navigation. Only Lamont-Doherty cruises prior to 1967 (Verna, cruise 23, Robert D. Conrad, cruise 11) and the Royal Netherlands Navy cruise used celestial navigation.
The overall accuracy of the gravity measurements obtained during these surveys is affected by the accuracy of the gravime- ter and the navigation. In general, those cruises which used the Gss2 sea gravimeter or the MIT instrument with satellite navi- gation should be accurate to about 2-5 mGal. However, some- what larger errors would be expected for cruises which used the gimbal-mounted LaCoste-Romberg gravimeter or celestial navigation.
The gravity anomalies which we used were reduced to the international reference ellipsoid (flattening equal to 1/297.0). However, the choice of a reference ellipsoid is not important, since the mean and trend were removed before the data were
used. Ship tracks along which the data were obtained are shown in Figures 1 and 6. Profiles of the gravity anomalies and bathymetry projected normal to the local trend of the ridge are shown in Figures 2, 7, 8, and 14. As mentioned above, these profiles have had the mean and trend removed, and also a cosine taper has been applied to the first and last 5% of each profile. They are not therefore conventional gravity and ba- thymetry profiles. The mean is given beside each profile, so the original values can be approximately reconstructed.
METHOD OF ANALYSIS
It has been recognized for some time that gravity anomalies at sea mainly reflect the effect of sea floor topography and the manner in which it is compensated. Gravity and bathymetry generally correlate closely at short wavelengths (less than a few tens of kilometers) and poorly at longer wavelengths (greater
COCHRAN: ISOSTASY AT MIDOCEAN RIDGE CRESTS 4715
-125 ø 20 ø
-120 -I 15 -I I0 -105 -I00 -95 ø -90 ø -85 ø -80 ø
Clotion FroCtur
15 ø
I0 ø
o
o
o
I0 ø
15 ø
20 ø
25 ø
30 ø
•k5 ø
FfeCtufe C•i•)•er tøn
Zo
Guatemala
Basin
Bauer Basin
o
•e•dC •c
F r BC'• U r e-' QuirOS
7•o•e Peru
Basin
ZooB
40 ø -125 ø -120 ø -115 ø -I I0 ø -105 ø -I00 ø -95 ø
-75 o 20 ø
15 ø
IO ø
o
o
o
I0 ø
15 ø
20"
25 ø
• •0 ø
EAST PACIFIC
RISE CREST 35 ø 7o•;•,,• Projected Free air anomaly and Bathyme•ry profile.
SCALE(approx.) 0 600 t I ' J
KM 400 _90 o -85 ø -80 ø -75 ø
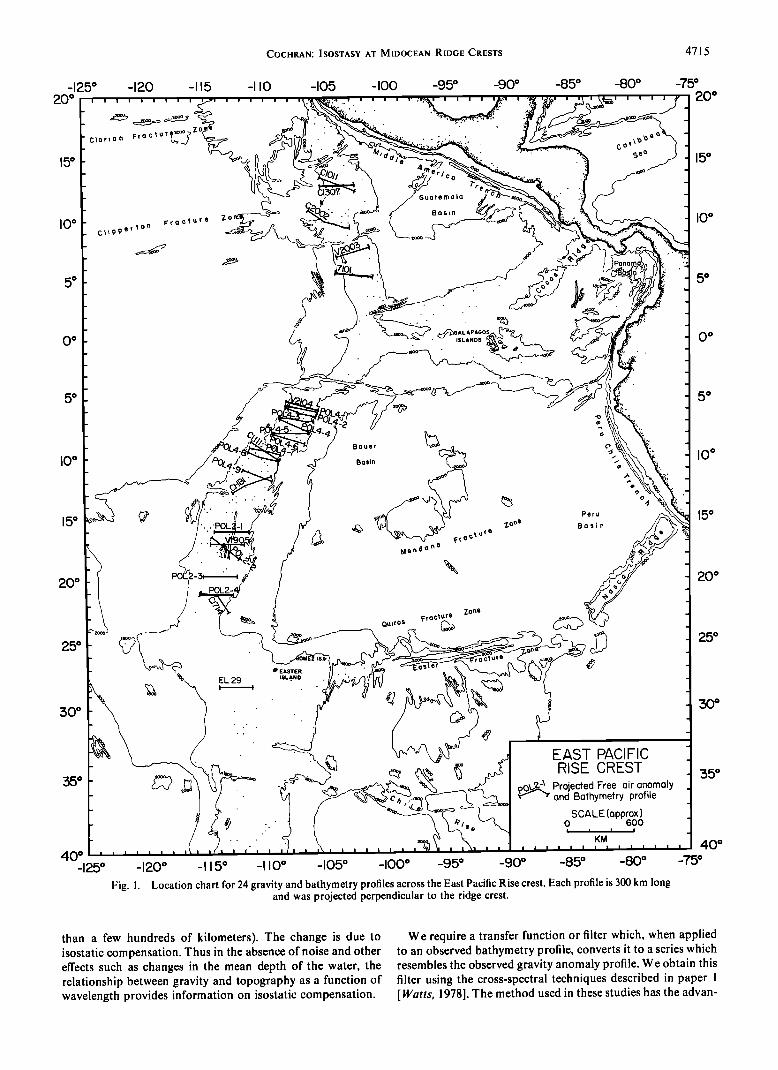
Fig. 1. Location chart for 24 gravity and bathymetry profiles across the East Pacific Rise crest. Each profile is 300 km long and was projected perpendicular to the ridge crest.
than a few hundreds of kilometers). The change is due to isostatic compensation. Thus in the absence of noise and other effects such as changes in the mean depth of the water, the relationship between gravity and topography as a function of wavelength provides information on isostatic compensation.
We require a transfer function or filter which, when applied to an observed bathymetry profile, converts it to a series which resembles the observed gravity anomaly profile. We obtain this filter using the cross-spectral techniques described in paper 1 [ Watts, 1978]. The method used in these studies has the advan-
rr I000
•: -I00 '
EAST
12 7øN -i 4
FILTERED TOPOGRAPHY
TOPOGRAPHY
-. . .--. -•.... ,.-.•••.•.•• 2990 8
CI307• 12 7øN - 0 7
••, .,•..."- ....... -'• 2982 9 C2002l /1 /• A
•A•%•• _+2 6 -;"-•..., .... ,..'.....'•• :50511
........... •••'.•• 5145 4 71Oll ^ .. . A . [
•---.._•-.-/• + 2 I ß . ,'••lSI .......
V21041,.., ,, A /,.. F
55øS I •"--,./k/ •L+6 5
.• 5125 8 POL4•-I' 1 ,, A r
+22 '-.-• :51199
POL4-2 • 6 IøS -0 6
%•••• +2 8 •• ::.'5107 .... I
PACIFIC RISE CREST
POL4-51 ;'1 ^ .,, F 6 8o s ]•½•*v•--• •--• • •[-, o
... ...... ;':.L•.-_.....,,... :..-,•.• ,.....• 50980
POL4-4 • 71øS +20
•/.•••,••+ 2o ß -. ,' .,•• ;51164
POL4-5 • 77øS - 13
, ,'½ ,...'..••• 3103 2 POL4-6 1 A ^ r
,,,.s
+28
POL4-7'I A r
9 2o S hv"V•'--•--'-• • +70
• •..... ,•, -........• 3008 9
-+23 ß .,.. "•. •• • , . ';• 29589
POL4-8 • 99øS +42
114øS +57
3034 .... 2
ii 8os +12 2
•v•••+l 9 .... ß - ......'...•...• 3037 2
POL2-1 •.•.• ••• 15os +149
+2• ........ :• 30513
Vl905 • 17'S +149
•• .,•, •• 2985 4
POL2-2 • 175•S +95
½52 '•* ß '•'••29985
POL2-31 • A . r
.......... •-•• 5112 9
61714• 20 I•S +74
, -• '•• • 067 I
POL2-4 • 21•S + I0 5
EL29 •• 28 2•S -I 4
'½•• 291• 2 o ioo i •
K•M
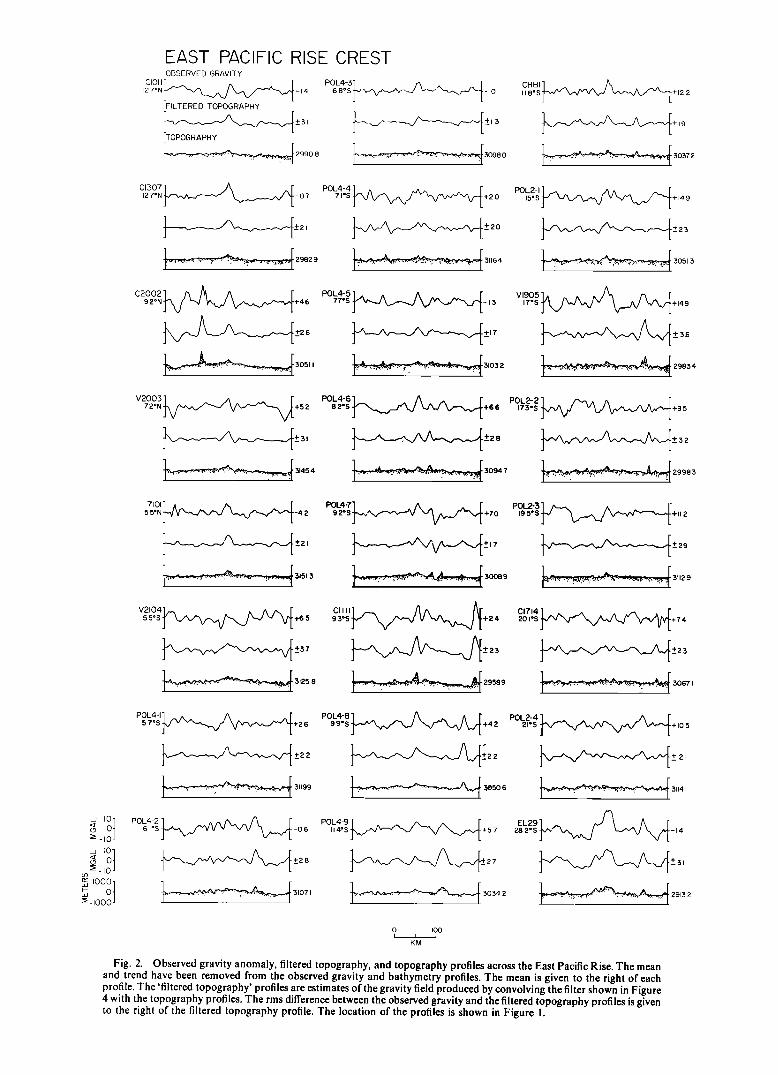
Fig. 2. Observed gravity anomaly, filtered topography, and topography profiles across the East Pacific Rise. The mean and trend have been removed from the observed gravity and bathymetry profiles. The mean is given to the right of each profile. The 'filtered topography' profiles are estimates of the gravity field produced by convolving the filter shown in Figure 4 with the topography profiles. The rms difference between the observed gravity and the filtered topography profiles is given to the right of the filtered topography profile. The location of the profiles is shown in Figure 1.
COCHRAN: ISOSTASY AT MIDOCEAN RIDGE CRESTS 4717
tage that the filter and complex admittance (Fourier transform of the filter) is obtained from many relatively short profiles centered on the ridge crest rather than by subdividing a few long profiles. Thus we are assured that the resulting filter is directly applicable to the ridge crest and is not an average filter influenced by data which cross a number of geologic features.
The result of the computations is a filter which, from bathy- metric data, reproduces the observed free air gravity anomaly over the region or feature which is being examined. This filter is based completely on the observed relationship between grav- ity and bathymetry and is not tied to any isostatic model. However, as pointed out by McKenzie and Bowin [1976], the observed filter or complex admittance can be easily compared with isostatic models based on different hypotheses for the manner in which sea floor topography is supported.
ISOSTASY AT MIDOCEAN RIDGE CRESTS
In this section we will use the cross-spectral techniques to investigate the isostatic mechanism at midocean ridge crests. We will concentrate on two ridges in this study. These are the fast spreading East Pacific Rise, which is characterized by smooth topography and an axial horst, and the slow spreading Mid-Atlantic Ridge, which is characterized by rough topogra- phy and an axial 'rift valley.' We will thus be able to examine what features arefiharacteristic of ridge crests in general and in what manner the differing tectonic and morphologic natures of the two ridges are expressed.
East Pacific Rise. The data for the East Pacific Rise consist of 24 free air gravity anomaly and bathymetry profiles across the ridge crest. Profiles between latitudes 13øN and 28øS were included, with a majority of them concentrated between 6øS and 21øS (Figure 1). Profiles near the Pacific/Nazca/Cocos triple junction were excluded. Each profile was projected nor- mal to the local trend of the ridge and extends 150 km on either side of the ridge axis. The half spreading rates for this portion of the East Pacific Rise vary from 5 to 8 cm/yr [Larson and Chase, 1972; Herron, 1972; Handschumacher, 1976], and the data are thus from regions less than about 3 m.y. old.
The gravity and bathymetry profiles of the rise crest are presented in Figure 2. The ridge crest in these profiles is characterized by a positive horstlike topographic feature about 20 km across and a few hundred meters high. The character- istic gravity anomaly associated with the central high is a relatively small amplitude (15-25 mGal)high which is 20-30 km wide and is flanked by smaller-amplitude gravity lows. The bathymetry away from the ridge crest is generally smooth, and in many cases the central high is the largest feature in both the bathymetry and gravity profiles.
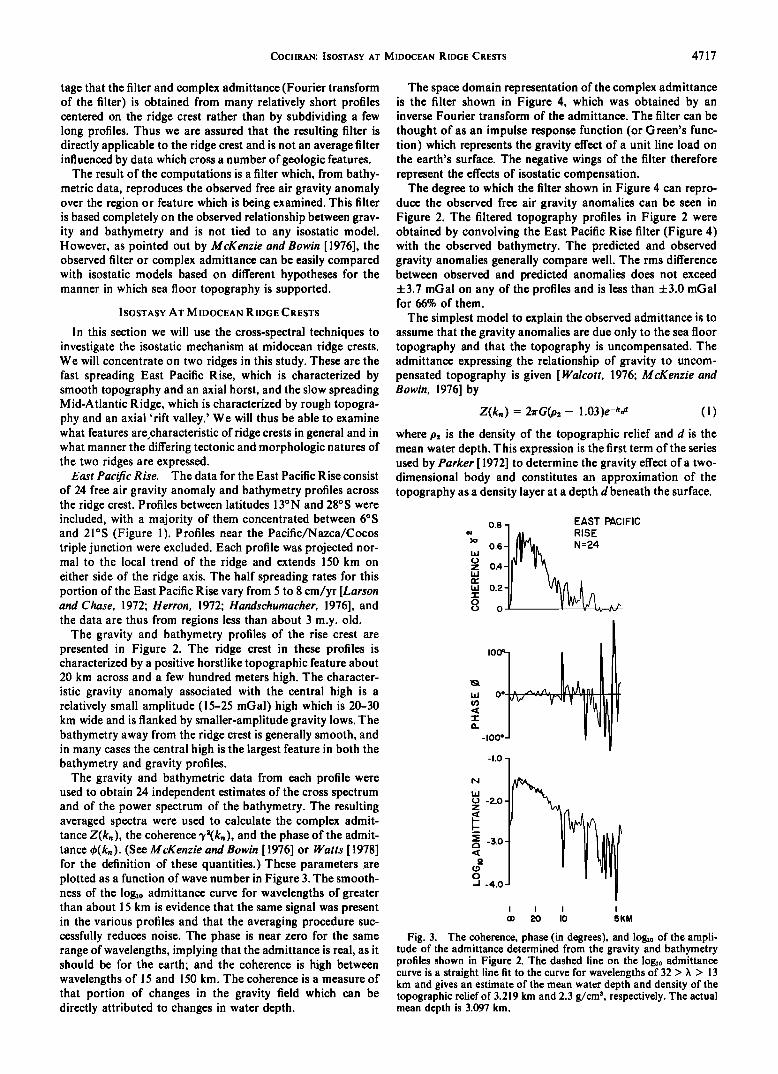
The gravity and bathymetric data from each profile were used to obtain 24 independent estimates of the cross spectrum and of the power spectrum of the bathymetry. The resulting averaged spectra were used to calculate the complex admit- tance Z(k,,), the coherence 3,•'(k,,), and the phase of the admit- tance ½(k,,). (See McKenzie and Bowin [1976] or Watts [1978] for the definition of these quantities.) These parameters are plotted as a function of wave number in Figure 3. The smooth- ness of the 1og•0 admittance curve for wavelengths of greater than about 15 km is evidence that the same signal was present in the various profiles and that the averaging procedure suc- cessfully reduces noise. The phase is near zero for the same range of wavelengths, implying that the admittance is real, as it should be for the earth; and the coherence is high between wavelengths of 15 and 150 km. The coherence is a measure of that portion of changes in the gravity field which can be directly attributed to changes in water depth.
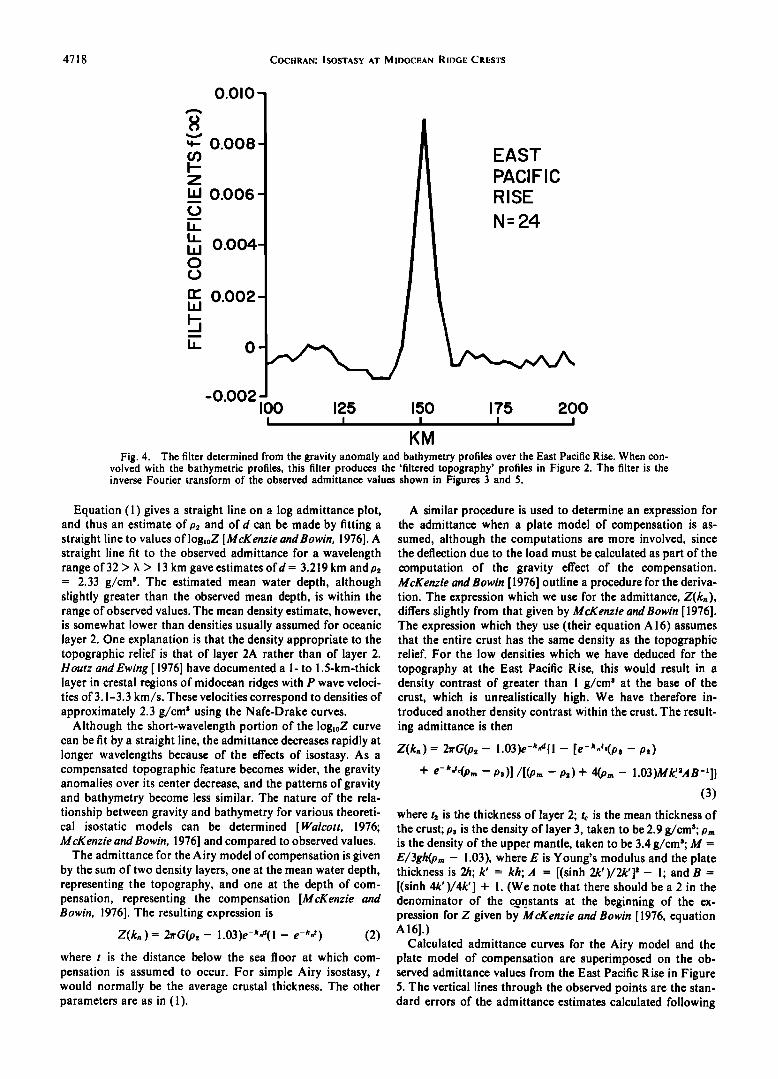
The space domain representation of the complex admittance is the filter shown in Figure 4, which was obtained by an inverse Fourier transform of the admittance. The filter can be
thought of as an impulse response function (or Green's func- tion) which represents the gravity effect of a unit line load on the earth's surface. The negative wings of the filter therefore represent the effects of isostatic compensation.
The degree to which the filter shown in Figure 4 can repro- duce the observed free air gravity anomalies can be seen in Figure 2. The filtered topography profiles in Figure 2 were obtained by convolving the East Pacific Rise filter (Figure 4) with the observed bathymetry. The predicted and observed gravity anomalies generally compare well. The rms difference between observed and predicted anomalies does not exceed -t-3.7 mGal on any of the profiles and is less than +3.0 mGal for 66% of them.
The simplest model to explain the observed admittance is to assume that the gravity anomalies are due only to the sea floor topography and that the topography is uncompensated. The admittance expressing the relationship of gravity to uncom- pensated topography is given [Walcott, 1976; McKenzie and Bowin, 1976] by
Z(k,•) = 2a'GLo: - 1.03)e-•', a (1)
where p: is the density of the topographic relief and d is the mean water depth. This expression is the first term of the series used by Parker [ 1972] to determine the gravity effect of a two- dimensional body and constitutes an approximation of the topography as a density layer at a depth d beneath the surface.
0.8
z 0.4
LU 0.2
0 r• 0
EAST PACIFIC
RISE N=24
$
o -2.o - z
I--
• -3.o -
o ._l -4.o -
I I I
o• 20 I0 5 K M
Fig. 3. The coherence, phase (in degrees), and 1og•0 of the ampli- tude of the admittance determined from the gravity and bathymetry profiles shown in Figure 2. The dashed line on the 1og•0 admittance curve is a straight line fit to the curve for wavelengths of 32 > 3, > 13 km and gives an estimate of the mean water depth and density of the topographic relief of 3.219 km and 2.3 g/cm 8, respectively. The actual mean depth is 3.097 km.
4718 COCHRAN: ISOSTASY AT MIDOCEAN RIDGE CRESTS
0.010-
"- 0.008-
z
IJ.I O.006-
laJ 0.004- 0
n,' 0.002-
EAST
PACIFIC RISE
N- 24
-0.002- I00
I 125 150 175 200
I I I I
KM Fig. 4. The filter determined from the gravity anomaly and bathymetry profiles over the East Pacific Rise. When con-
volved with the bathymetric profiles, this filter produces the 'filtered topography' profiles in Figure 2. The filter is the inverse Fourier transform of the observed admittance values shown in Figures 3 and 5.
Equation (1) gives a straight line on a log admittance plot, and thus an estimate of o: and of d can be made by fitting a straight line to values oflog•oZ [McKenzie andBowin, 1976]. A straight line fit to the observed admittance for a wavelength range of 32 > 3, > 13 km gave estimates ofd = 3.219 km andp: = 2.33 g/cm 8. The estimated mean water depth, although slightly greater than the observed mean depth, is within the range of observed values. The mean density estimate, however, is somewhat lower than densities usually assumed for oceanic layer 2. One explanation is that the density appropriate to the topographic relief is that of layer 2A rather than of layer 2. Houtz and Ewing [ 1976] have documented a l- to 1.5-km-thick layer in crestal regions of midocean ridges with P wave veloci- ties of 3.1-3.3 km?s. These velocities correspond to densities of approximately 2.3 g/cm 8 using the Nafe-Drake curves.
Although the short-wavelength portion of the logaoZ curve can be fit by a straight line, the admittance decreases rapidly at longer wavelengths because of the effects of isostasy. As a compensated topographic feature becomes wider, the gravity anomalies over its center decrease, and the patterns of gravity and bathymetry become less similar. The nature of the rela- tionship between gravity and bathymetry for various theoreti- cal isostatic models can be determined [Walcott, 1976; McKenzie and Bowin, 1976] and compared to observed values.
The admittance for the Airy model of compensation is given by the sum of two density layers, one at the mean water depth, representing the topography, and one at the depth of com- pensation, representing the compensation [McKenzie and Bowin, 1976]. The resulting expression is
Z(k,, ) = 2•rG(p: - 1.03)e-•',,a(l - e-•',, t) (2)
where t is the distance below the sea floor at which com-
pensation is assumed to occur. For simple Airy isostasy, t would normally be the average crustal thickness. The other parameters are as in (1).
A similar procedure is used to determine an expression for the admittance when a plate model of compensation is as- sumed, although the computations are more involved, since the deflection due to the load must be calculated as part of the computation of the gravity effect of the compensation. McKenzie and Bowin [ 1976] outline a procedure for the deriva- tion. The expression which we use for the admittance, Z(kn), differs slightly from that given by McKenzie and Bowin [ 1976]. The expression which they use (their equation A 16) assumes that the entire crust has the same density as the topographic relief. For the low densities which we have deduced for the
topography at the East Pacific Rise, this would result in a density contrast of greater than I g/cm • at the base of the crust, which is unrealistically high. We have therefore in- troduced another density contrast within the crust. The result- ing admittance is then
Z(k,,) = 2•rG(p:- 1.03)e-•-a{1- [e-•,,t,(•oa- •o:)
+ e-n"t4pm - Ps)]/[(P,n - p:) + 4(p,,, - 1.03)Mkt:AB-']} (3)
where t: is the thickness of layer 2; tc is the mean thickness of the crust; pa is the density of layer 3, taken to be 2.9 g/craB; is the density of the upper mantle, taken to be 3.4 g/cma; M = E/3gh(p,, - 1.03), where E is Young's modulus and the plate thickness is 2h; k' = kh; A = [(sinh 2k')/2k']: - 1; and B = [(sinh 4k')/4k'] + 1. (We note that there should be a 2 in the denominator of the c__on_stants at the beginning of the ex- pression for Z given by McKenzie and Bowin [1976, equation A16].)
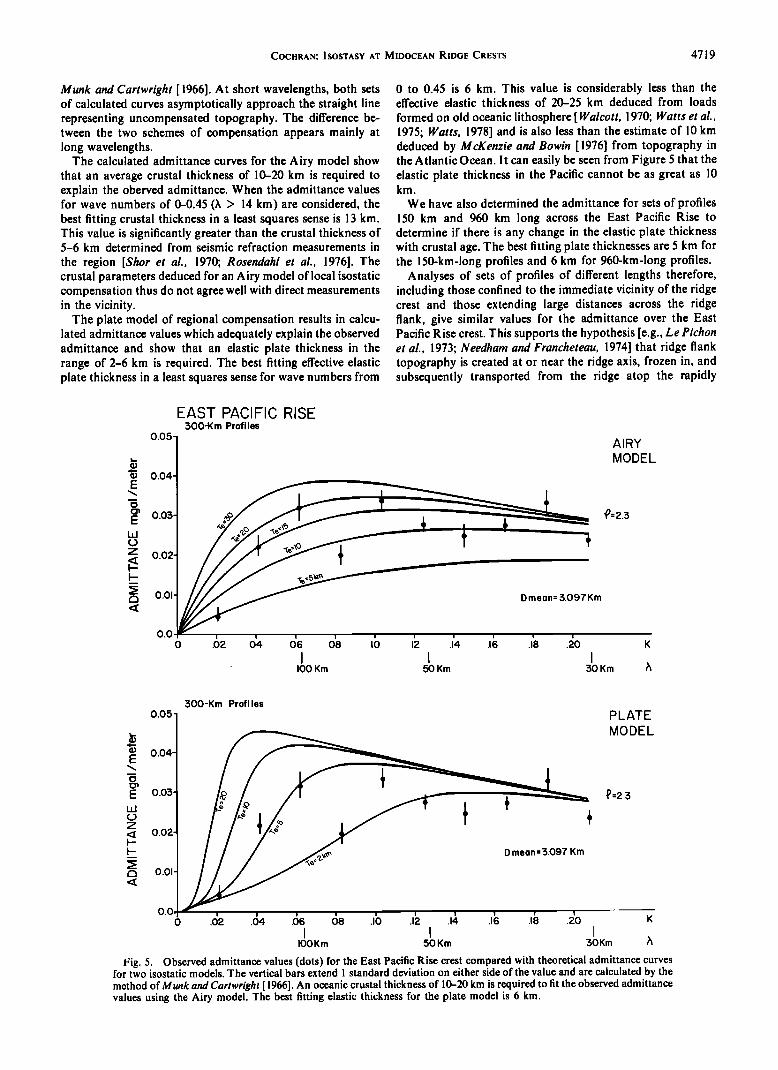
Calculated admittance curves for the Airy model and the plate model of compensation are superimposed on the ob- served admittance values from the East Pacific Rise in Figure 5. The vertical lines through the observed points are the stan- dard errors of the admittance estimates calculated following
COCHRAN: ISOSTASY AT MIDOCEAN RIDGE CRESTS 4719
Munk and Cartwright [1966]. At short wavelengths, both sets of calculated curves asymptotically approach the straight line representing uncompensated topography. The difference be- tween the two schemes of compensation appears mainly at long wavelengths.
The calculated admittance curves for the Airy model show that an average crustal thickness of 10-20 km is required to explain the oberved admittance. When the admittance values for wave numbers of 0-0.45 (3, > 14 km) are considered, the best fitting crustal thickness in a least squares sense is 13 km. This value is significantly greater than the crustal thickness of 5-6 km determined from seismic refraction measurements in
the region [Shor et al., 1970; Rosendahl et al., 1976]. The crustal parameters deduced for an Airy model of local isostatic compensation thus do not agree well with direct measurements in the vicinity.
The plate model of regional compensation results in calcu- lated admittance values which adequately explain the observed admittance and show that an elastic plate thickness in the range of 2-6 km is required. The best fitting effective elastic plate thickness in a least squares sense for wave numbers from
0 to 0.45 is 6 km. This value is considerably less than the effective elastic thickness of 20-25 km deduced from loads formed on old oceanic lithosphere [ Walcott, 1970; Watts et al., 1975; Watts, 1978] and is also less than the estimate of 10 km deduced by McKenzie and Bowin [1976] from topography in the Atlantic Ocean. It can easily be seen from Figure 5 that the elastic plate thickness in the Pacific cannot be as great as 10 km.
We have also determined the admittance for sets of profiles 150 km and 960 km long across the East Pacific Rise to determine if there is any change in the elastic plate thickness with crustal age. The best fitting plate thicknesses are 5 km for the 150-km-long profiles and 6 km for 960-km-long profiles.
Analyses of sets of profiles of different lengths therefore, including those confined to the immediate vicinity of the ridge crest and those extending large distances across the ridge flank, give similar values for the admittance over the East Pacific Rise crest. This supports the hypothesis [e.g., Le Pichon et al., 1973; Needham and Francheteau, 1974] that ridge flank topography is created at or near the ridge axis, frozen in, and subsequently transported from the ridge atop the rapidly
0.05,
a• O.04- E
E
z
r'• 0.01
EAST PACIFIC RISE 300-Krn Profiles
Dmeon= 3.097Km
AIRY MODEL
0.0 0 .62 0•4 d6 0•8 I• I• .1'4 .1• .1• .•0 K
I I I I00 Km 50 Km 30 Km t•
0.05
0.04-
300-Km Profiles
D mean =3.097 Km
PLATE
MODEL
•0 =2.3
o .& .68 .,b x i i
IOOKm 50Km 30Km )•
Fig. 5. Observed admittance values (dots) for the East Pacific Rise crest compared with theoretical admittance curves for two isostatic models. The vertical bars extend 1 standard deviation on either side of the value and are calculated by the method of Munk and Cartwright [ 1966]. An oceanic crustal thickness of 10-20 km is required to fit the observed admittance values using the Airy model. The best fitting elastic thickness for the plate model is 6 km.

4720 COCHRAN: ISOSTASY AT MIDOCEAN RIDGE CRESTS
50 ø 40 30 ø 20 ø I0 ø 0 ø 50 ø 50 ø
20 ø
IO o
.,.•SN05
• zor•e 0 o
I0 ø
•"'•000 20ø SOUTH ATLA NTI
..• OCEAN
30 o / .R,(9-•r•de (i. :::' :' .:: • , o .::::::'::::::::::: .• _.-R•se, oo •:::.:•r• ..... :1
M A A • ID- TL NTIC "• ,, '.Z':::' 4Oøh RIDGE CREST
/ •,o• Projected /I e" Free Air Anomaly
and . ' co ø ' q,; 2000 H Bathymetry profile II SCALE (opprox)
50øtt • • • • 50 ø 40 ø 30 ø 20 I0
40 ø
30 ø
20 ø
IO o
0 o
I0 o
20 ø
30 ø
40 ø
50 ø
Fig. 6. Location chart for 16 gravity and bathymetric profiles across the Mid-Atlantic Ridge. Each profile is 400 km long and was projected perpendicular to the ridge crest.
thickening lithosphere. Even though the lithosphere thickens with age, material is added in such a manner that it does not alter the original deformed configuration of the crust giving rise to the gravity anomalies.
Mid-Atlantic Ridge. The data for the Mid-Atlantic Ridge consist of 16 free air gravity anomaly and bathymetry profiles across the ridge crest between 45øN and 47øS. Each profile was projected perpendicular to the ridge and extends 200 km on either side of the ridge axis. The location of the profiles is shown in Figure 6. Profile V1713 was analyzed in detail by Talwani et al. [1965] and is also discussed by Talwani et al. [ 1972]. The SN05 profile at 22øN is close to the area studied by Van A ndel and Bowin [1968]. Since the half spreading rate in the Atlantic varies from about 1.2 to 2 cm/yr [Pitman and
Talwani, 1972; Ladd et al., 1975], the profiles extend out to crust of 10-17 m.y. in age.
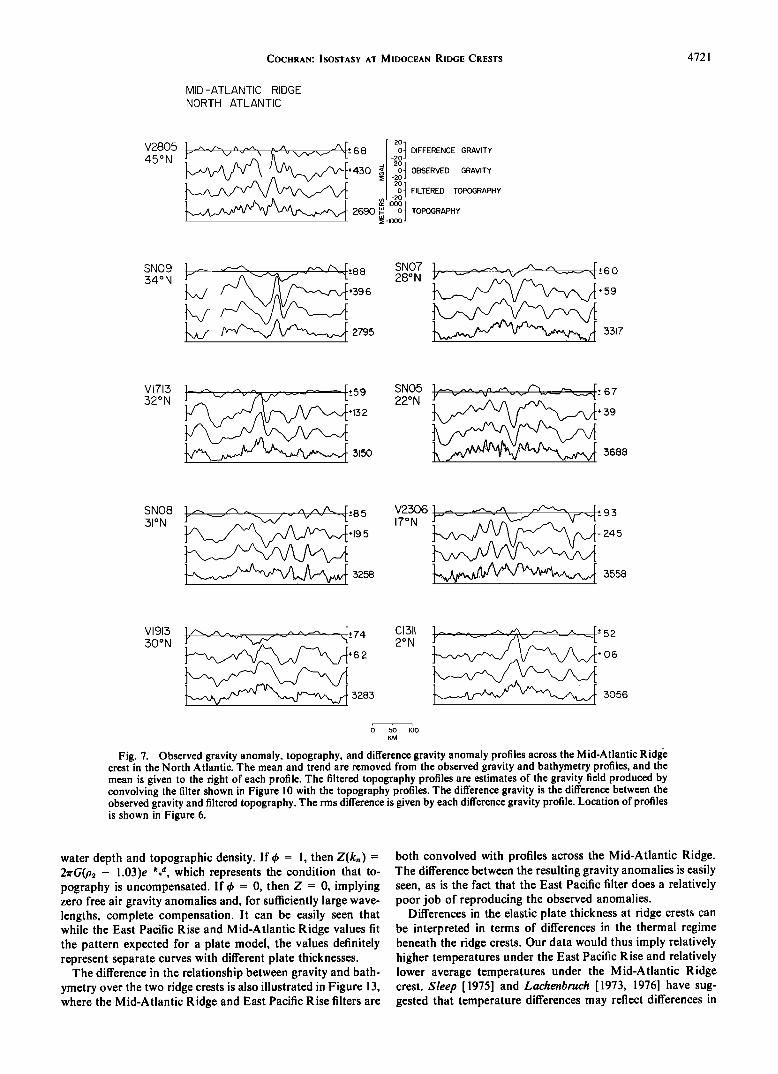
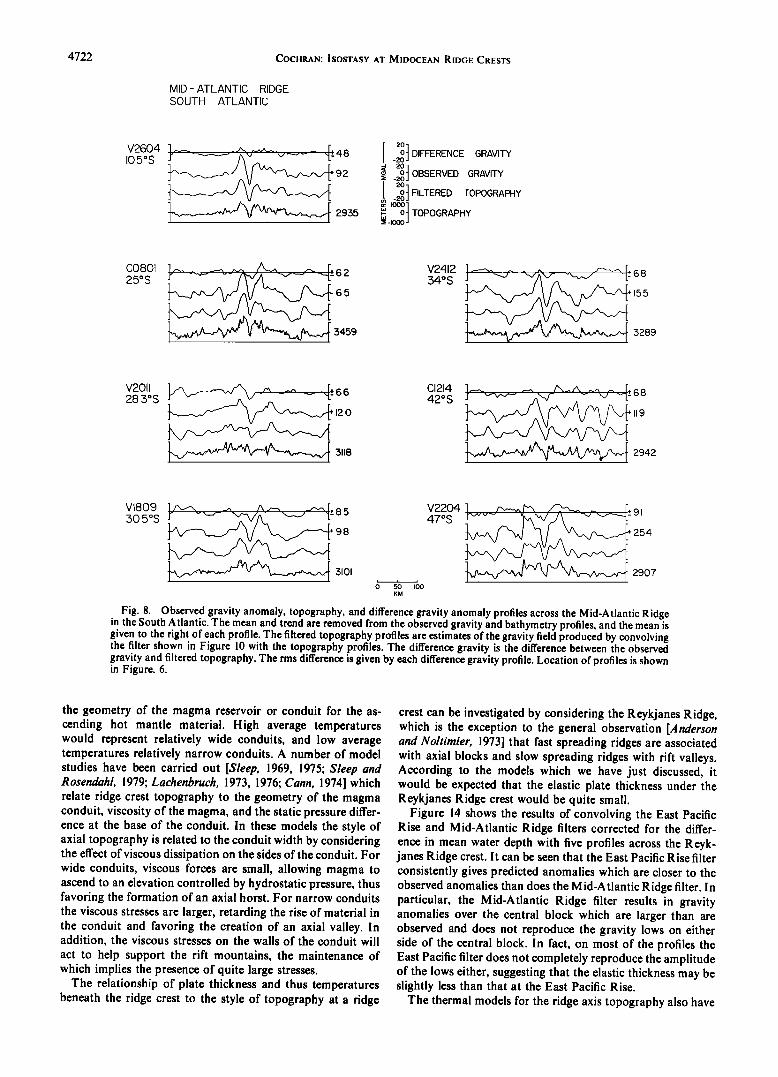
The gravity and bathymetry profiles in the North Atlantic are presented in Figure 7, and those in the South Atlantic in Figure 8. The ridge crest is associated with a rift valley in every profile across the Mid-Atlantic Ridge. The rift valley varies in depth from up to 1500 m in profiles such as V2805 and SN05 in the North Atlantic and V2604 and C0801 in the South Atlan-
tic, where it is quite distinct, to no more than a few hundred meters in profiles such as V1913 in the North Atlantic. It is, however, always associated with a very prominent free air gravity anomaly low and, where they are well developed, with large gravity highs over the rift mountains. The gravity anom- alies associated with the rift valley and rift mountains are generally the dominant feature on the free air gravity profiles.
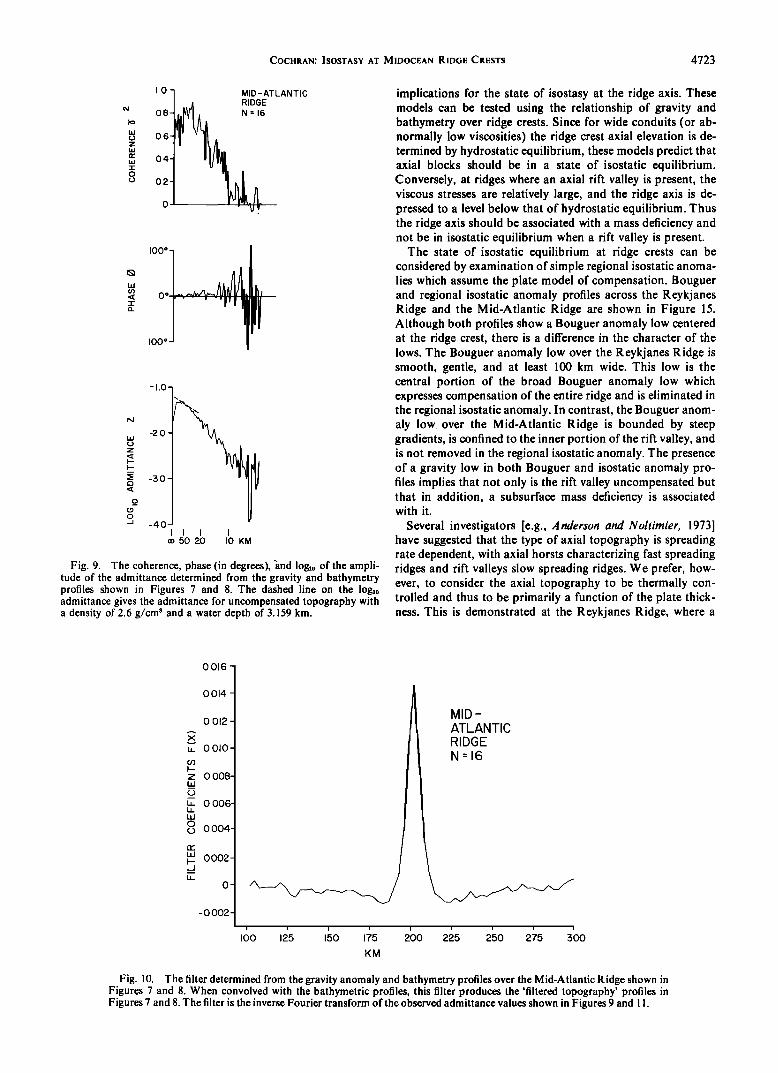
The complex admittance, coherence, and phase of the ad- mittance were calculated from the averaged spectra of the profiles as was done for the East Pacific Rise and are plotted as a function of wave number in Figure 9. As was the case with the East Pacific Rise, the 1og•0 admittance curve is smooth for wavelengths of greater than about 15 km. Also, in this range of wavelengths the phase is near zero, and the coherence is high, indicating that a definite signal is present in the group of profiles. The degree to which the Mid-Atlantic Ridge filter, shown in Figure 10, is capable of reproducing the gravity anomalies can be judged from the 'filtered topography' and 'difference gravity' profiles in Figures 7 and 8.
The observed admittance values with their standard errors
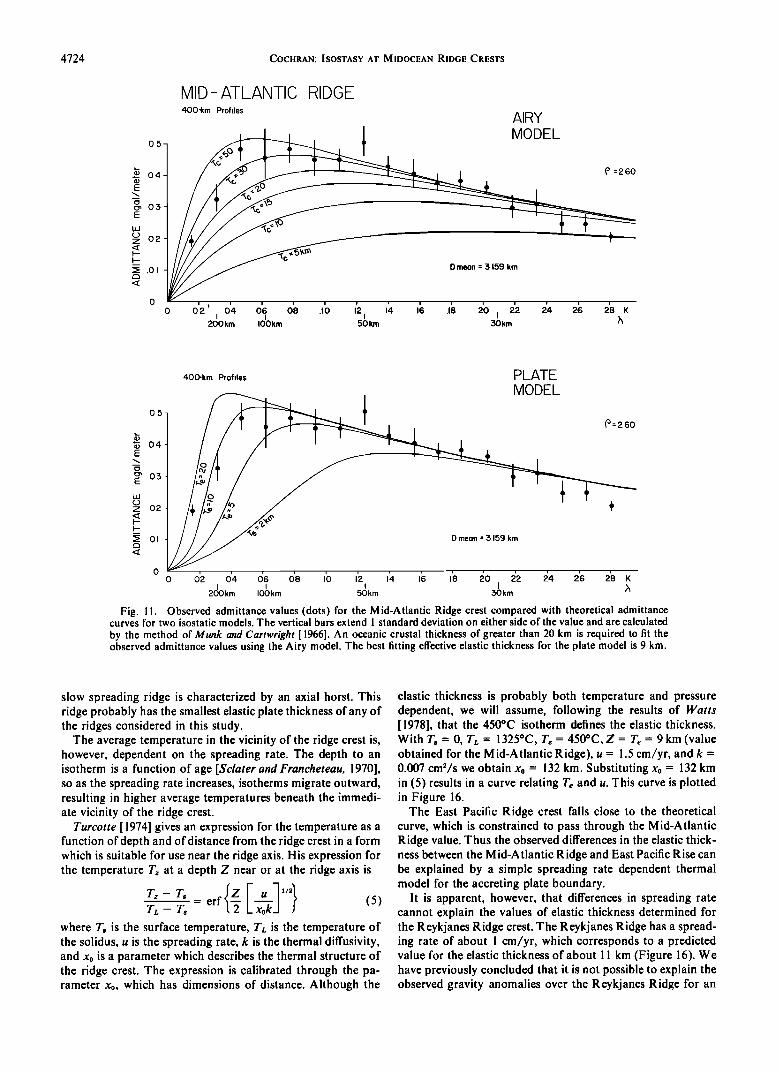
are plotted in Figure 11 along with calculated admittance curves for the Airy and plate models of compensation. It can easily be seen that an average crustal thickness of greater than 20 km is required to explain the relationship between gravity and bathymetry according to the Airy hypothesis. This is several times the observed oceanic crustal thickness. The effec-
tive plate thickness and density which best fit the observed admittance in a least squares sense are 9 km and 2.6 g/cm 3. This value for the elastic plate thickness is nearly the same as the value of 10 km determined by McKenzie and Bowin [1976] for the Atlantic. The Atlantic value is somewhat greater than that determined for the East Pacific Rise, and the difference appears to be real and significant. The difference can be easily seen by comparing the filters from the two ridges. Although the mean depth is nearly the same for the two sets of profiles (3159 m for the Atlantic and 3097 m for the Pacific), the Mid- Atlantic Ridge filter (Figure 11 ) has an amplitude nearly 50% greater than the East Pacific Rise filter (Figure 4). It is also somewhat wider than the East Pacific Rise filter.
TECTONIC IMPLICATIONS
A result of particular interest is that the effective elastic thickness determined from small-scale topography appears to differ between ridge systems. Low values of the elastic thick- ness (2-6 km) were determined for the East Pacific Rise crest, while higher values (7-13 km) were determined for the Mid- Atlantic Ridge. These differences appear to be real and signifi- cant.
The difference in the relationship between gravity and bath- ymetry over the two ridge crests is illustrated in Figure 12, in which the isostatic response function ½ is plotted against wave- length. The response function is obtained by writing the admit- tance in the form
Z(k,., ) = 2•rG(p, - 1.03)e-k.d½(k,) (4)
It thus serves to normalize the admittance for variations in
COCHRAN: ISOSTASY AT MIDOCEAN RIDGE CRESTS 4721
MID-ATLANTIC RIDGE
NORTH ATLANTIC
V2805 1 .•.• _^• ,,A. •L:o zø t ]'• - v '" \ 'h- "'• "L- "" • o DIFFERENCE GRAVITY -20
OBSERVED GRAVITY ,.... +430 • -zo o FILTERED TOPOGRAPHY
-20
2690 • o TOPOGRAPHY • -IOOO
SN09 •,• _,, .. +-88
_..]F,,,A_• 2795
SN07 ly-..-- •..•---•",.-%.•/"--•,...•v-•[ • e 0 28ON +59
3317
Vl713 52øN
SN05 .... ,--, _,.?, ,.-. r+ 67
22øN ,•••+ 39 .• . ,,1• d :.. . ..._•.• -• '•• 3688
SN08 31øN 85 195
:: ' :•"• 3258
V2306 1 •-.•.•__Av/• • _ r+_ 9 3
17øN • 245 ' :'• •'• 3558
Vl913 1/-• • .. •,.••___ r+74 Cl311 30ON Y v -"'•'•N.•?-• --'" - '-L- 2ON
1 .-_._ .._• A.X• • ^
+06
3056
KM
Fig. 7. Observed gravity anomaly, topography, and difference gravity anomaly profiles across the Mid-Atlantic Ridge crest in the North Atlantic. The mean and trend are removed from the observed gravity and bathymetry profiles, and the mean is given to the right of each profile. The filtered topography profiles are estimates of the gravity field produced by convolving the filter shown in Figure 10 with the topography profiles. The difference gravity is the difference between the observed gravity and filtered topography. The rms difference is given by each difference gravity profile. Location of profiles is shown in Figure 6.
water depth and topographic density. If 4• = 1, then Z(kr,) = 2•rGLo: - 1.03)e-k, a, which represents the condition that to- pography is uncompensated. If 4• = 0, then Z = 0, implying zero free air gravity anomalies and, for sufficiently large wave- lengths, complete compensation. It can be easily seen that while the East Pacific Rise and Mid-Atlantic Ridge values fit the pattern expected for a plate model, the values definitely represent separate curves with different plate thicknesses.
The difference in the relationship between gravity and bath- ymetry over the two ridge crests is also illustrated in Figure 13, where the Mid-Atlantic Ridge and East Pacific Rise filters are
both convolved with profiles across the Mid-Atlantic Ridge. The difference between the resulting gravity anomalies is easily seen, as is the fact that the East Pacific filter does a relatively poor job of reproducing the observed anomalies.
Differences in the elastic plate thickness at ridge crests can be interpreted in terms of differences in the thermal regime beneath the ridge crests. Our data would thus imply relatively higher temperatures under the East Pacific Rise and relatively lower average temperatures under the Mid-Atlantic Ridge crest. Sleep [1975] and Lachenbruch [1973, 1976] have sug- gested that temperature differences may reflect differences in
4722 COCHRAN: ISOSTASY AT MIDOCEAN RIDGE CRESTS
MID- ATLANTIC RIDGE SOUTH ATLANTIC
V2604 ].-.----- • • .... r, 48
105øS Y •'"'"'-""'"'•• 9 2 '?::•:• 2935
[ 2o] o DIFFERENCE GRAVITY -20
= -ao OBSERVED GRAVITY 20
[ F'LT"O '0%0 t •- TOPOGRAPHY
• -I000 J
C0801 25øS
65
3459
V2412 '1 • .... • L 34os J ""J "'/hv-- -"-,-'--/ -'1_- 68
155
3289
V2011 ] A •-•._/% •, __,-, _ r+ 6 6 28 3øs y • v v _ L/ .... '-I.-
120 •'-•••• 3118
CI214 42øS
0 50 I00 KM
V2204 91 47os
254
2907 _
Fig. 8. Observed gravity anomaly, topography, and difference gravity anomaly profiles across the Mid-Atlantic Ridge in the South Atlantic. The mean and trend are removed from the observed gravity and bathymetry profiles, and the mean is given to the right of each profile. The filtered topography profiles are estimates of the gravity field produced by convolving the filter shown in Figure 10 with the topography profiles. The difference gravity is the difference between the observed gravity and filtered topography. The rms difference is given by each difference gravity profile. Location of profiles is shown in Figure. 6.
the geometry of the magma reservoir or conduit for the as- cending hot mantle material. High average temperatures would represent relatively wide conduits, and low average temperatures relatively narrow conduits. A number of model studies have been carried out [Sleep, 1969, 1975; Sleep and Rosendahl, 1979; Lachenbruch, 1973, 1976; Cann, 1974] which relate ridge crest topography to the geometry of the magma conduit, viscosity of the magma, and the static pressure differ- ence at the base of the conduit. In these models the style of axial topography is related to the conduit width by considering the effect of viscous dissipation on the sides of the conduit. For wide conduits, viscous forces are small, allowing magma to ascend to an elevation controlled by hydrostatic pressure, thus favoring the formation of an axial horst. For narrow conduits the viscous stresses are larger, retarding the rise of material in the conduit and favoring the creation of an axial valley. In addition, the viscous stresses on the walls of the conduit will act to help support the rift mountains, the maintenance of which implies the presence of quite large stresses.
The relationship of plate thickness and thus temperatures beneath the ridge crest to the style of topography at a ridge
crest can be investigated by considering the Reykjanes Ridge, which is the exception to the general observation [Anderson and Noltimier, 1973] that fast spreading ridges are associated with axial blocks and slow spreading ridges with rift valleys. According to the models which we have just discussed, it would be expected that the elastic plate thickness under the Reykjanes Ridge crest would be quite small.
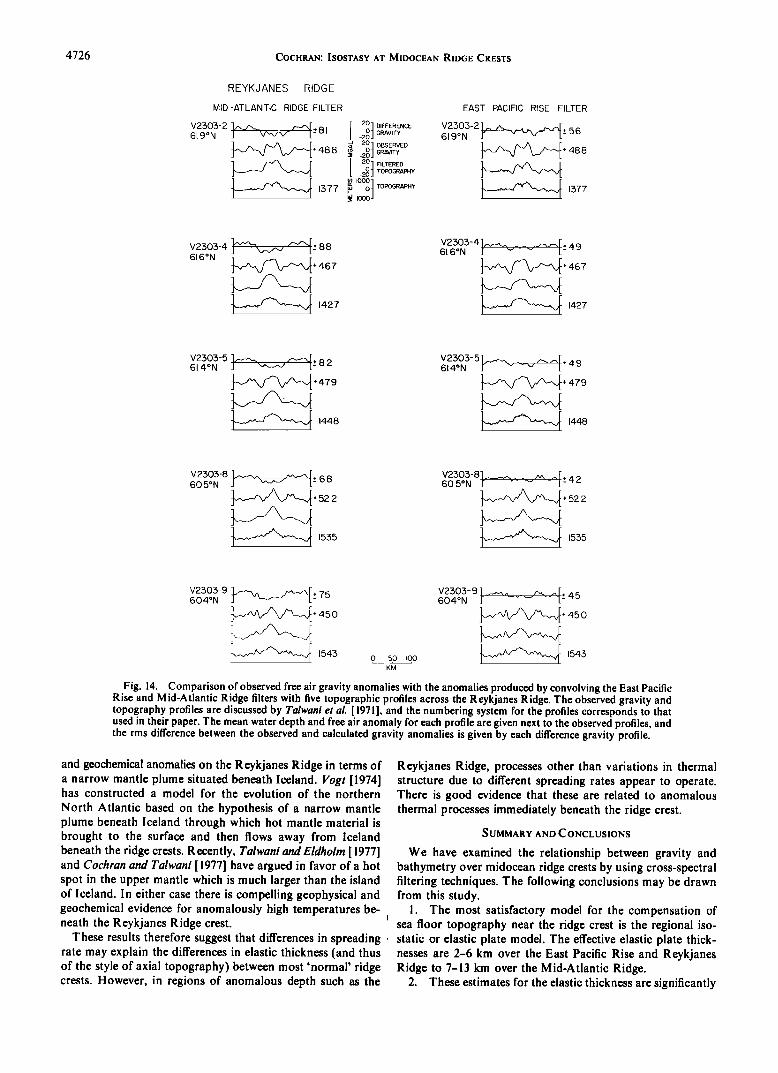
Figure 14 shows the results of convolving the East Pacific Rise and Mid-Atlantic Ridge filters corrected for the differ- ence in mean water depth with five profiles across the R eyk- janes Ridge crest. It can be seen that the East Pacific Rise filter consistently gives predicted anomalies which are closer to the observed anomalies than does the Mid-A tlantic Ridge filter. In particular, the Mid-Atlantic Ridge filter results in gravity anomalies over the central block which are larger than are observed and does not reproduce the gravity lows on either side of the central block. In fact, on most of the profiles the East Pacific filter does not completely reproduce the amplitude of the lows either, suggesting that the elastic thickness may be slightly less than that at the East Pacific Rise.
The thermal models for the ridge axis topography also have
COCHRAN: ISOSTASY AT MIDOCEAN RIDGE CRESTS 4723
I0 MID-ATLANTIC RIDGE
0.8 N= 16
0.6
0.4
0.2
-I.O
m -3.o
o
-J 40
•o 50 20 I0 KM
Fig. 9. The coherence, phase (in degrees), •nd log•0 of the ampli- tude of the admittance determined from the gravity and bathymetry profiles shown in Figures 7 and 8. The dashed line on the 1og•0 admittance gives the admittance for uncompensated topography with a density of 2.6 g/cm 8 and a water depth of 3.159 km.
implications for the state of isostasy at the ridge axis. These models can be tested using the relationship of gravity and bathymetry over ridge crests. Since for wide conduits (or ab- normally low viscosities) the ridge crest axial elevation is de- termined by hydrostatic equilibrium, these models predict that axial blocks should be in a state of isostatic equilibrium. Conversely, at ridges where an axial rift valley is present, the viscous stresses are relatively large, and the ridge axis is de- pressed to a level below that of hydrostatic equilibrium. Thus the ridge axis should be associated with a mass deficiency and not be in isostatic equilibrium when a rift valley is present.
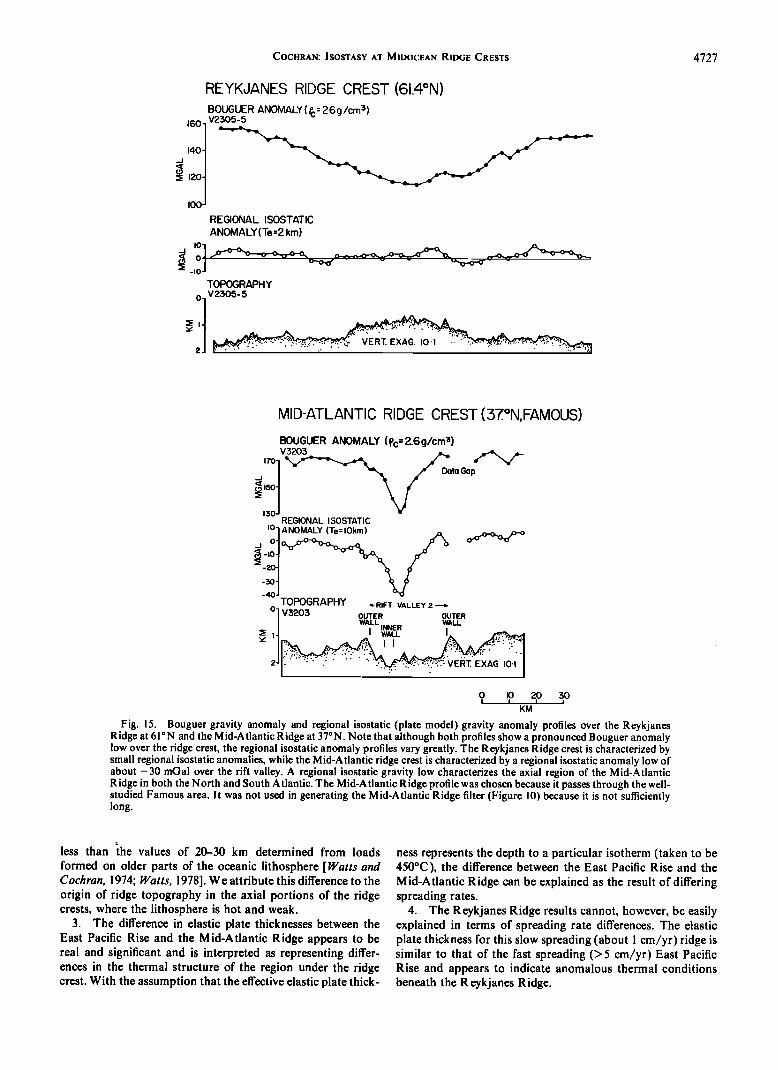
The state of isostatic equilibrium at ridge crests can be considered by examination of simple regional isostatic anoma- lies which assume the plate model of compensation. Bouguer and regional isostatic anomaly profiles across the R eykjanes Ridge and the Mid-Atlantic Ridge are shown in Figure 15. Although both profiles show a Bouguer anomaly low centered at the ridge crest, there is a difference in the character of the lows. The Bouguer anomaly low over the R eykjanes Ridge is smooth, gentle, and at least 100 km wide. This low is the central portion of the broad Bouguer anomaly low which expresses compensation of the entire ridge and is eliminated in the regional isostatic anomaly. In contrast, the Bouguer anom- aly low, over the Mid-Atlantic Ridge is bounded by steep gradients, is confined to the inner portion of the rift valley, and is not removed in the regional isostatic anomaly. The presence of a gravity low in both Bouguer and isostatic anomaly pro- files implies that not only is the rift valley uncompensated but that in addition, a subsurface mass deficiency is associated with it.
Several investigators [e.g., Anderson and Noltirnier, 1973] have suggested that the type of axial topography is spreading rate dependent, with axial horsts characterizing fast spreading ridges and rift valleys slow spreading ridges. We prefer, how- ever, to consider the axial topography to be thermally con- trolled and thus to be primarily a function of the plate thick- ness. This is demonstrated at the Reykjanes Ridge, where a
0.016 -
0.014
MID -
o.o•? 1 ATLANTIC RIDGE
o.olo 1 N =16 0'0081 0.004
o.oo -o.oo21
• I I I I i I i i I 0 125 150 175 200 225 250 275 300
KM
Fig. 10. The filter determined from the gravity anomaly and bathymetry profiles over the Mid-Atlantic Ridge shown in Figures 7 and 8. When convolved with the bathymetric profiles, this filter produces the 'filtered topography' profiles in Figures 7 and 8. The filter is the inverse Fourier transform of the observed admittance values shown in Figures 9 and 11.
4724 COCHRAN: ISOSTASY AT MIDOCEAN RIDGE CRESTS
MID- ATLANTIC RIDGE
400-km Prof,les AIRY
MODEL oõ
$ 04
, •
• .01 = '
0 o .&' .& .& .,k .do
200 km IOOkm 50 km 30km •
400-km Profiles PLATE MODEL
.0 5
• .04
• o3
ø• oa
• 01 Dmeon =3159km
0 , ,
I I I I 200km IOOkm 50km 30krn
Fig. 11. Observed admittance values (dots) for the Mid-Atlantic Ridge crest compared with theoretical admittance curves for two isostatic models. The vertical bars extend 1 standard deviation on either side of the value and are calculated by the method of Munk and Cartwright [ 1966]. An oceanic crustal thickness of greater than 20 km is required to fit the observed admittance values using the Airy model. The best fitting effective elastic thickness for the plate model is 9 km.
slow spreading ridge is characterized by an axial horst. This ridge probably has the smallest elastic plate thickness of any of the ridges considered in this study.
The average temperature in the vicinity of the ridge crest is, however, dependent on the spreading rate. The depth to an isotherm is a function of age [Sclater and Francheteau, 1970], so as the spreading rate increases, isotherms migrate outward, resulting in higher average temperatures beneath the immedi- ate vicinity of the ridge crest.
Turcotte [ 1974] gives an expression for the temperature as a function of depth and of distance from the ridge crest in a form which is suitable for use near the ridge axis. His expression for the temperature Tz at a depth Z near or at the ridge axis is
T: - Ts = erf{•[x_•l •/:} T,.-Z--ffT ' (5) where Ts is the surface temperature, T,. is the temperature of the solidus, u is the spreading rate, k is the thermal diffusivity, and Xo is a parameter which describes the thermal structure of the ridge crest. The expression is calibrated through the pa- rameter Xo, which has dimensions of distance. Although the
elastic thickness is probably both temperature and pressure dependent, we will assume, following the results of Watts [1978], that the 450øC isotherm defines the elastic thickness. With Ts = 0, T,• = 1325øC, T• = 450øC, Z = Te = 9 km (value obtained for the Mid-Atlantic Ridge), u = 1.5 cm/yr, and k = 0.007 cm•-/s we obtain x0 = 132 km. Substituting x0 = 132 km in (5) results in a curve relating Te and u. This curve is plotted in Figure 16.
The East Pacific Ridge crest falls close to the theoretical curve, which is constrained to pass through the Mid-Atlantic Ridge value. Thus the observed differences in the elastic thick- ness between the Mid-Atlantic Ridge and East Pacific Rise can be explained by a simple spreading rate dependent thermal model for the accreting plate boundary.
It is apparent, however, that differences in spreading rate cannot explain the values of elastic thickness determined for the Reykjanes Ridge crest. The Reykjanes Ridge has a spread- ing rate of about 1 cm/yr, which corresponds to a predicted value for the elastic thickness of about 11 km (Figure 16). We have previously concluded that it is not possible to explain the observed gravity anomalies over the R eykjanes Ridge for an

COCHRAN: ISOSTASY AT MIDOCEAN RIDGE CRESTS 4725
I0-
08-
z
•02-
o
0
East Pac,f,c Rise Crest
• M,d-Atlanhc R,dge Crest
COMPENSATED
.L
T [ T ,g UNCOMPENSATED
•o'oo ,•oo •$o 4;o •$o •bo ,$o •b WAVELENGTH (KM)
Fig. 12. Plot of the isostatic response function ½ as a function of wavelength on a log plot for the East Pacific Rise crest and Mid-Atlantic Ridge. The various curves represent expected response functions for various thickness elastic plates. The isostatic response function normalizes the admittance for differences in water depth and density.
elastic thickness greater than about 6 km. The differences between the Reykjanes Ridge crest value and the predicted curve which fits the East Pacific Rise and Mid-Atlantic Ridge can be explained if the thermal structure of the R eykjanes Ridge crest differs significantly from the other ridge crests. In
order to explain these differences, temperatures would be re- quired to be anomalously high beneath the R eykjanes Ridge.
The presence of unusually high temperatures beneath the Reykjanes Ridge has been suggested by several investigators. Schilling [1973] explained anomalously shallow topography
NORTH ATLANTIC
SN07 28øN
OBSERVED GRAVITY
M.AR FILTER
EPR FILTER "•/•%'•• T O PO G R A P H Y
SOUTH ATLANTIC
V2412 54øS SCALE
GRAVITY [ 2_02 ¸ o IOOO
TOPOGRAPHY 0 -I000
0 50
KM
MGAL
METERS
Fig. 13. Representative topography profiles from the North Atlantic and South Atlantic were convolved with the filters determined from the East Pacific Rise and the Mid-Atlantic Ridge to produce the curves labelled E.P.R. filter and M.A.R. filter. The observed gravity is shown at the top of each set of profiles. The difference in the relationship of gravity to bathymetry is shown by the fact that while the M.A.R. filter fits the data well, the E.P.R. filter produces anomalies which are much too small.
4726 COCHRAN: ISOSTASY AT MIDOCEAN RIDGE CRESTS
REYKJANES RIDGE
MID-ATLANTIC RIDGE FILTER EAST PACIFIC RISE FILTER
• •N[ I 2•] DIFFERENCE V2303-2 _"' 81 GRAVITY 619ON V"",J"V" -2
oOl + 48 8 •: -20J GRAVITY
-20 J TOPOGRAPHY
• I000t TOPOGRAPHY
V 2303- 2 ].,'-,J%,-•..•,•L/._,-•L .,- 5 6 619ON -
•,•2••+ 488
i•,••• 1577
V2303-4 ]'"""•,•/.•-'""•t 88 616øN •••/•+ 467
• 1427
V2303-4].,.,,...,• _ _ •[_i' 49 616øN .1' "" - '"' L
+467
ß. "},-,•J'•• 1427
v2303-5 ]"-'-'"•-,....._...•/"•_+ 8 2 614øN
• 1448
V2303- 5 ].._.-,• _ ..-...-.[ 614o N _[ v • L _+ 49
•.••/•• + 479
• 1448
60 5øN _'1' 6 8 ••••,•+ 52 2
• 1535
V2303-8] .__,.•_._.•.,•x___^[ + 4 2 60 5øN J' -
•%/'/•*• + 52 2
• 1535
V2303-9 •[i75 604øN
,•••½,,• + 45 0
• 1543 o 50 ioo
KM
V2303- 9 ] ......,•,,___.,._../-..,.._ _.,..,• + 4 5 604øN _F
], -,•/••,•'"' 45 0
• 1543 Fig. 14. Comparison of observed frcc air gravity anomalies with the anomalies produced by convolving the East Pacific
Risc and Mid-Atlantic Ridgc filtcrs with fivc topographic profiles across thc Reykjancs Ridgc. Thc obscrvcd gravity and topography profilcs arc discusscd by Talwani et al. [1971], and thc numbcring system for thc profilcs corrcsponds to that uscd in thcir papcr. Thc mcan watcr depth and frcc air anomaly for cach profilc arc givcn ncxt to thc obscrved profilcs, and the rms diffcrcncc bctwccn thc obscrvcd and calculated gravity anomalics is givcn by cach differcnce gravity profilc.
and geochemical anomalies on the Reykjanes Ridge in terms of a narrow mantle plume situated beneath Iceland. l/ogt [1974] has constructed a model for the evolution of the northern
North Atlantic based on the hypothesis of a narrow mantle plume beneath Iceland through which hot mantle material is brought to the surface and then flows away from Iceland beneath the ridge crests. Recently, Talwani and Eldholm [ 1977] and Cochran and Talwani [ 1977] have argued in favor of a hot spot in the upper mantle which is much larger than the island of Iceland. In either case there is compelling geophysical and geochemical evidence for anomalously high temperatures be- neath the Reykjanes Ridge crest.
R eykjanes Ridge, processes other than variations in thermal structure due to different spreading rates appear to operate. There is good evidence that these are related to anomalous thermal processes immediately beneath the ridge crest.
SUMMARY AND CONCLUSIONS
We have examined the relationship between gravity and bathymetry over midocean ridge crests by using cross-spectral filtering techniques. The following conclusions may be drawn from this study.
1. The most satisfactory model for the compensation of sea floor topography near the ridge crest is the regional iso-
These results therefore suggest that differences in spreading , static or elastic plate model. The effective elastic plate thick- rate may explain the differences in elastic thickness (and thus nesses are 2-6 km over the East Pacific Rise and Reykjanes of the style of axial topography) between most 'normal' ridge Ridge to 7-13 km over the Mid-Atlantic Ridge. crests. However, in regions of anomalous depth such as the 2. These estimates for the elastic thickness are significantly
COCHRAN: ISOSTASY AT MIDOCEAN RIDGE CRESTS 4727
REYKJANES RIDGE CREST (61.4øN)
,601 ...j 1401 :• 1201
I00 •
BOUGUER ANOMALY ( •c = 2.6g/cm 3) V2305-5
REGIONAL ISOSTATIC
ANOMALY(Te =2 km)
• ,o] • _ _•,.,,o.:o.• • TOPOGRAPHY
o V2505-5
MID-ATLANTIC RIDGE CREST(37.øN, FAMOUS)
BOUGUER ANOMALY (pc = 2.6g/cm •) v32o$
to Gap
1 130 J
REGIONAL ISOSTATIC
'ø t u o •
:• -201 TOPOGRAPHY ,.-RIFT VALLEY 2.•
o V$205 OUTER OUTER WALL INNER WALL
• 12 I WALL I• ,:,..:.../• 0 I0 20 30 I I I I
KM
Fig. 15. Bouguer gravity anomaly and regional isostatic (plate model) gravity anomaly profiles over the Reykjanes Ridge at 61øN and the Mid-Atlantic Ridge at 37øN. Note that although both profiles show a pronounced Bouguer anomaly low over the ridge crest, the regional isostatic anomaly profiles vary greatly. The Reykjanes Ridge crest is characterized by small regional isostatic anomalies, while the Mid-Atlantic ridge crest is characterized by a regional isostatic anomaly low of about -30 mGal over the rift valley. A regional isostatic gravity low characterizes the axial region of the Mid-Atlantic Ridge in both the North and South Atlantic. The Mid-Atlantic Ridge profile was chosen because it passes through the well- studied Famous area. It was not used in generating the Mid-Atlantic Ridge filter (Figure 10) because it is not sufficiently long.
less than •he values of 20-30 km determined from loads formed on older parts of the oceanic lithosphere [Watts and Cochran, 1974; Watts, 1978]. We attribute this difference to the origin of ridge topography in the axial portions of the ridge crests, where the lithosphere is hot and weak.
3. The difference in elastic plate thicknesses between the East Pacific Rise and the Mid-Atlantic Ridge appears to be real and significant and is interpreted as representing differ- ences in the thermal structure of the region under the ridge crest. With the assumption that the effective elastic plate thick-
ness represents the depth to a particular isotherm (taken to be 450øC), the difference between the East Pacific Rise and the Mid-Atlantic Ridge can be explained as the result of differing spreading rates.
4. The Reykjanes Ridge results cannot, however, be easily explained in terms of spreading rate differences. The elastic plate thickness for this slow spreading (about 1 cm/yr) ridge is similar to that of the fast spreading (> 5 cm/yr) East Pacific Rise and appears to indicate anomalous thermal conditions beneath the R eykjanes Ridge.

4728 COCHRAN: ISOSTASY AT MIDOCEAN RIDGE CRESTS
u.i io
,,,,, .
NTIC
EAST PACIFIC RISE
o
SPREADING RATE (cm/yr)
Fig. 16. Plot of the best fitting elastic thickness for the various ridge crests against the half spreading rate. The solid dots are the best fitting values, and the hatched boxes are subjective estimates of the possible range of the values based largely on the standard deviations of the admittance values (Figures 5 and 11). We also show a theoretical curve [Turcotte, 1974] calculated with the assumption that the base of the elastic lithosphere is the 450øC isotherm [Watts, 1978] and which is constrained to pass through the Mid-Atlantic Ridge value.
5. The presence of a positive (horst) or negative (rift val- ley) topographic feature at the ridge crest appears to be a function of the average temperature in the vicinity of the ridge crest. It is therefore a function of both the spreading rate and the temperature structure at the ridge crest.
6. Regional isostatic anomalies across ridge crests with axial highs are generally small, while those across ridge crests with axial rift valleys are larger and are characterized by a low over the axial rift valley. The isostatic gravity low over 'rifted' ridges can be as great as 20-30 mGal and is usually confined to the vicinity of the rift valley. This result is interpreted as supporting models such as those of Sleep [1975], Sleep and Rosendahl [1979], and Lachenbruch [1973, 1976], in which viscous forces resulting from the interaction of the ascending magma and the conduit walls are considered the mechanism for producing ridge crest topography.
Acknowledgments. We would like to thank R. N. Anderson, M. G. Langseth, and J. K. Weissel for valuable comments and dis- cussions. This research was supported by National Science Founda- tion grant OCE 77-07941. The data were gathered on cruises sup- ported by the National Science Foundation and Office of Naval Research. Lamont-Doherty Geological Observatory contribution 2812.
REFERENCE
Anderson, R. N., and H. C. Noltimier, A model for the horst and graben structure of mid-ocean ridge crests based upon spreading velocity and basalt delivery to the oceanic crust, Geophys. J. Roy. Astron. $oc., 34, 137-147, 1973.
Arcyana, Transform fault and rift valley by bathyscaph and diving saucer, Science, 190, 108-116, 1975.
Ballard, R. D., and T. H. Van Andel, Morphology and tectonics of the inner rift valley at lat. 36ø50'N on the Mid-Atlantic Ridge, Geol. Soc. Amer. Bull., 88, 507-530, 1977.
Bryan, W. B., and J. G. Moore, Compositional variations of young basalts in the Mid-Atlantic Ridge rift valley near 36ø49'N, Geol. Soc. Amer. Bull., 88, 556-570, 1977.
Cann, J. R., A model for oceanic crustal structure developed, Geophys. J. Roy. Astron. Soc., 39, 169-187, 1974.
Cochran, J. R., and M. Talwani, Free-air gravity anomalies in the world's oceans and their relationship to residual elevation, Geophys. J. Roy. Astron. Soc., 50, 495-552, 1977.
Defteyes, K. S., The Axial Valley: A steady-state feature of the terrain, in The Megatectonics of Continents and Oceans, edited by H. John- son and B. L. Smith, pp. 194-222, Rutgers University Press, New Brunswick, N.J., 1970.
Graf, A., and R. Schulze, Improvemerits on the sea gravimeter Gss2, J. Geophys. Res., 66, 1813-1821, 1961.
Handschumacher, D. W., Post-Eocene plate tectonics of the eastern Pacific, in The Geophysics of the Pacific Basin and Its Margin, Geophys. Monogr. Ser., vol. 19, edited by G. Sutton, M. Man- ghnani, and R. Moberly, pp. 177-202, AGU, Washington, D.C., 1976.
Heirtzler, J. R., and T. H. Van Andel, Project Famous: Its origin, programs and setting, Geol. Soc. Amer. Bull., 88, 48•-487, 1977.
Herron, E. M., Sea floor spreading and the Cenozoic history of the east central Pacific, Geol. Soc. Amer. Bull., 83, 1671-1692, 1972.
Houtz, R. E., and J. I. Ewing, Upper crustal structure as a function of plate age, J. Geophys. Res., 81, 2490-2498, 1976.
Lachenbruch, A. H., A simple mechanical model for oceanic spread- ing centers, J. Geophys. Res., 78, 3395-3417, 1973.
Lachenbruch, A. H., Dynamics of a passive spreading center, J. Geophys. Res., 81, 1883-1902, 1976.
LaCoste, L. J. B., Measurement of gravity at sea and in the air., Rev. Geophys. Space Phys., 5, 477-526, 1967.
Ladd, J. W., G. O. Dickson, and W. C. Pitman, III, The age of the South Atlantic, in The Ocean Basins and Margins, vol. 1, The South Atlantic, edited by A. E. M. Nairn and F. G. Stehli, pp. 555-573, Plenum, New York, 1975.
Lambeck, K., Gravity anomalies over ocean ridges, Geophys. J. Roy. Astron. Soc., 30, 37-53, 1972.
Larson, R. L., and C. G. Chase, Late Mesozoic evolution of the western Pacific Ocean, Geol. Soc. Amer. Bull., 83, 3627-3644, 1972.
Le Pichon, X., J. Bonin, and J. Francheteau, Plate Tectonics, 300 pp., Elsevier, New York, 1973.
McDonald, K. C., and B. P. Luyendyk, Deep-tow studies of the structure of the Mid-Atlantic Ridge crest near lat. 37øN, Geol. Soc. Amer. Bull., 88, 621-636, 1977.
M cK enzie, D. P., and C. Bowin, The relationship between bathymetry and gravity in the Atlantic Ocean, J. Geophys. Res., 81, 1903-1915, 1976.
Munk, W. H., and D. E. Cartwright, Tidal spectroscopy and predic- tion, Phil. Trans. Roy. Soc. London, Ser. A, 259, 533-581, 1966.
Needham, H. D., and J. Francheteau, Some characteristics of the rift valley in the Atlantic Ocean near 36048 ' north, Earth Planet. Sci. Lett., 22, 29-43, 1974.
Orcutt, J. A., B. L. N. Kennett, and L. M. Dorman, Structure of the East Pacific Rise from an ocean bottom seismometer survey, Geophys. J. Roy. Astron. Soc., 45, 305-320, 1976.
Osmaston, M. F., Genesis of ocean ridge median valleys and continen- tal rift valleys, Tectonophysics, II, 387-405, 1971.
Parker, R. L., The rapid calculation of potential anomalies, Geophys. J. Roy. Astron. Soc., 31, 447-455, 1972.
Parker, R. L., and D. W. Oldenburg, Thermal model of ocean ridges, Nature Phys. Sci., 242, 137-139, 1973.
Pitman, W. C., III, and M. Talwani, Sea-floor spreading in the North Atlantic, Geol. Soc. Amer. Bull., 83, 619-646, 1972.
Ramberg, I. B., and T. H. Van Andel, Morphology and tectonic evolution of the rift valley at lat 36ø30'N, Mid-Atlantic Ridge, Geol. Soc. Amer. Bull., 88, 577-586, 1977.
R ea, D. K., Model for the formation of topographic features of the East Pacific Rise Crest, Geology, 3, 77-80, 1975.
RosendaM, B. R., Evolution of oceanic crust, 2, Constraints, implica- tions, and inferences, J. Geophys. Res., 81, 5305-5314, 1976.
RosendaM, B. R., R. W. Raitt, L. M. Dorman, L. D. Bibee, D. M. Hussong, and G. H. Sutton, Evolution of oceanic crust, 1, A phys- ical model of the East Pacific rise crest derived from seismic refrac-
tion data, J. Geophys. Res., 81, 5294-5304, 1976. Schilling, J.-G., Iceland mantle plume: Geochemical study of the
Reykjanes Ridge, Nature, 242, 565-571, 1973. Sclater, J. G., and J. Francheteau, The implications of terrestrial heat
flow observations on current tectonic and geochemical models of the crust and upper mantle of the Earth, Geophys. J. Roy. Astron. $oc., 20, 509-542, 1970.
Sclater, J. G., R. N. Anderson, and M. L. Bell, Elevation of ridges and

COCHRAN: ISOSTASY AT MIDOCEAN RIDGE CRESTS 4729
evolution of the central eastern Pacific, J. Geophys. Res., 76, 7888- 7915, 1971.
Shor, G. G., H. W. Menard, and R. W. Raitt, Structure of the Pacific Basin, in The Sea, vol. 4, part 2, edited by A. E. Maxwell, pp. 3-28, Interscience, New York, 1970.
Sleep, N.H., Sensitivity of heat flow and gravity to the mechanism of sea-floor spreading, J. Geophys. Res., 74, 542-549, 1969.
Sleep, N.H., Formation of oceanic crust: Some thermal constraints, J. Geophys. Res., 80, 4037-4042, 1975.
Sleep, N.H., and S. Biehler, Topography and tectonics at the inter- sections of fracture zones with central rifts, J. Geophys. Res., 75, 2748-2752, 1970.
Sleep, N.H., and B. Rosendahl, Topography and tectonics of ridge axes, J. Geophys. Res., 84 in press, 1979.
Talwani, M., and O. Eldholm, Evolution of the Norwegian-Greenland Sea, Geol. Soc. Amer. Bull., 88, 969-999, 1977.
Talwani, M., B.C. Heezen, and J. L. Worzel, Gravity anomalies, physiography and crustal structure of the Mid-A tlantic Ridge, Publ. 22, pp. 81-111, Bur. Central Seismol. Int., Ser. A, Tray. Sci. Fasc., Int. Union of Geol. and Geophys., Paris, 1961.
Talwani, M., X. Le Pichon, and M. Ewing, Crustal structure of the mid-ocean ridges, 2, Computed model from gravity and seismic refraction data, J. Geophys. Res., 70, 341-352, 1965.
Talwani, M., C. C. Windisch, and M. G. Langseth, Reykjanes Ridge crest: A detailed geophysical study, J. Geophys. Res., 76, 473-517, 1971.
Talwani, M., H. R. Poppe, and P. D. Rabinowitz, Gravimetrically determined geoid in the western North Atlantic, Sea Surface Topog- raphy From Space, Tech. Rep. ERL-228-AOML 7-2, part 2, pp. 1- 34, Nat. Oceanic and Atmos. Admin., Rockville, Md., 1972.
Turcotte, D. L., Are transform faults thermal contraction cracks?, J. Geophys. Res., 79, 2573-2577, 1974.
Van Andel, T. H., and C. Bowin, Mid-Atlantic Ridge between 22 ø and
23øN latitude and the tectonics of mid-ocean rises, J. Geophys. R es., 73, 1279-1298, 1968.
Vening Meinesz, F. A., Gravity Expeditions at Sea, 1923-1938, vol. IV, 233 pp., Netherlands Geodetic Commission, Delft, 1948.
Vogt, P. R., The Iceland phenomenon: Imprints of a hot spot on the ocean crust, and implications for flow beneath the plates, in Geody- namics of Iceland and the North Atlantic Area, edited by L. Krist- jansson, pp. 105-126, D. Reidel, Hingham, Mass., 1974.
Walcott, R. I., Flexural rigidity, thickness and viscosity of the litho- sphere, J. Geophys. Res., 75, 3941-3954, 1970.
Walcott, R. I., Lithospheric flexure, analysis of gravity anomalies, and the propagation of seamount chains, in The Geophysics of the Pa- cific Ocean Basin and Its Margin, Geophys. Monogr. Ser., vol. 19, edited by G. Sutton, M. Manghnani, and R. Moberly, pp. 431-438, AGU, Washington, D.C., 1976.
Watts, A. B., An analysis of isostasy in the world's oceans, 1, Hawai- ian-Emperor Seamount Chain, J. Geophys. Res., 83, 5989-6004, 1978.
Watts, A. B., and J. R. Cochran, Gravity anomalies and flexure of the lithosphere along the Hawaiian-Emperor Seamount Chain, Geophys. J. Roy. Astron. Soc., 38, 119-141, 1974.
Watts, A. B., J. R. Cochran, and G. Seizer, Gravity anomalies and flexure of the lithosphere: A three-dimensional study of the Great Meteor Seamount, Northeast Atlantic, J. Geophys. Res., 80, 1391- 1398, 1975.
Wing, C. G., MIT vibrating string surface ship gravity meter, J. Geophys. Res., 74, 5882-5894, 1969.
Woodside, J. M., The Mid-Atlantic Ridge near 45øN, XX, The gravity field, Can. J. Earth Sci., 9, 942-959, 1972.
(Received February 24, 1978; revised May 18, 1978;
accepted January 8, 1979.)