Embed Size (px)
Citation preview

A SPATIAL ANALYSIS OF INDUSTRIAL GROWTH AND DECLINE IN KANO
METROPOLIS, NIGERIA
By
MUHAMMAD ABUBAKAR LIMAN
DEPARTMENT OF GEOGRAPHY
AHMADU BELLO UNIVERSITY, ZARIA
NIGERIA.
APRIL, 2015

A SPATIAL ANALYSIS OF INDUSTRIAL GROWTH AND DECLINE IN KANO
METROPOLIS, NIGERIA
By
Muhammad Abubakar LIMAN, M.A. (NOTTINGHAM) 1982
(PhD/SCIE/17708/2007-08)
A DISSERTATION SUBMITTED TO THE SCHOOL OF POSTGRADUATE
STUDIES, AHMADU BELLO UNIVERSITY, ZARIA
IN PARTIAL FULFILLMENT OF THE REQUIREMENTS FOR THE AWARD
OF THE
DOCTOR OF PHILOSOPHY DEGREE IN GEOGRAPHY
DEPARTMENT OF GEOGRAPHY,
FACULTY OF SCIENCE,
AHMADU BELLO UNIVERSITY, ZARIA
NIGERIA
APRIL, 2015

ii
DECLARATION
I declare that the work in this Dissertation entitled “A Spatial Analysis of Industrial Growth
and Decline in Kano Metropolis, Nigeria” has been carried out by me in the Department of
Geography. The information derived from the literature has been duly acknowledged in the
text and a list of references provided. No part of this dissertation was previously presented
for another degree or diploma at this or any other Institution.
Muhammad Abubakar LIMAN
Name of Student Signature Date

iii
CERTIFICATION
This dissertation titled “A SPATIAL ANALYSIS OF INDUSTRIAL GROWTH AND
DECLINE IN KANO METROPOLIS, NIGERIA”, by Muhammad Abubakar Liman, meets
the regulations governing the award of Doctorate Degree (PhD) in Geography of the
Ahmadu Bello University, Zaria and is approved for its contribution to knowledge and
literary presentation.
Prof. J. A. Ariyo _________________ _____________
Chairman, Supervisory Committee Signature Date
Dr. J. A. Ukoje _________________ _____________
Member, Supervisory Committee Signature Date
Dr. J. O. Adefila _________________ _____________
Member, Supervisory Committee Signature Date
Dr. I. J. Musa _________________ _____________
Head of Department Signature Date
Prof. A. Z. Hassan _________________ _____________ Dean, School of Postgraduate Studies Signature Date

iv
DEDICATION
To the memories of my late
father, Alhaji Abubakar Liman Umar OFR (Waziri of Koton-Karfe),
mother, Hajiya Hawwa Kulu Liman (Inna)
step mother, Hajiya Hawwa Kulu Liman (mama Kulu)
brothers, Abdurrahman Liman (baba tsoho) and Hashimu Liman

v
ACKNOWLEDGEMENT
In the name of Allah, the most merciful, the most beneficent. All praise to Him, the Lord of
the worlds; who made this and all other things possible. Alhamdu lil Lah.
My profound gratitude goes to Prof. J. A. Ariyo, my supervisor, for his unflinching
meticulous guidance, supervision, encouragement and concern in the course of this work. I
have no words enough to adequately describe my heartfelt thanks for the challenge, the
tutorial sessions, and the “bloody” pages carrying incisive remarks that came back to me. I
only hope I have squeezed out the best from him. My two other supervisors have, in
different ways, also contributed to this work. My thanks therefore goes to Dr. J. A. Ukoje
and Dr. J. O. Adefila. Other members of the department have also made contributions to
this work both within and outside the seminar hall. My thanks go to them especially, Dr. I.J.
Musa (the current H.O.D), Prof. E. O. Iguisi, Dr. A. I. Abdulhamid (the exam officer) and
Dr. R. O. Yusuf (Dr. ROY).
This work would not have been possible without the contributions of many other people,
too numerous to mention here. However, I must give special mention of the person of
Alhaji Sani Umar, the Chairman, Manufacturers‟ Association of Nigeria (MAN) Bompai
branch, without whose intervention no industry responded. My gratitude also goes to Hajiya
Rabi who introduced me to the Chairman. Alhaji Tijjani Ahmed, (the Executive Secretary,
MAN, Kano), made MAN materials available and organized the collection of filled
questionnaires despite the security challenges at the time. I am deeply grateful to them.
Colleagues in the departments of geography, BUK, and FCE Kumbotso have assisted
beyond measure. Special mention must be made of Dr. Umar Faruk Isa (Dr. IUF) who in
many possible ways contributed to this work. May Allah reward him; Amen. Many thanks
also to Prof. J. A. Falola, Mairo Haruna, Dr. Murtala M. Badamasi, Dr. I. Mallam and Dr.
T. R. Yalwa. I have also shared ideas with and received encouragements from Nura Ibrahim
Hassan, and many others, too numerous to mention here. My thanks go to them too. To
those other colleagues and friends who understood where I was heading and made

vi
contributions, I say thanks. I am also indebted to those other colleagues and friends, who
did not understand where I was heading and thank them for making me reconsider other
ways of putting my views across.
Members of my family, (my two wives, Children, and grand child) have all sacrificed their
time and contributed in many ways in the conduct of this study. My gratitude goes to them
all.
Muhammad Abubakar Liman

vii
LIST OF ABBREVIATIONS USED
AMR Abubakar Muhammadu Rimi
ANOM Analysis of Means
ANOVA Analysis of Variance
BIZ Bompai Industrial Zone
CIZ Challawa/Sharada Industrial Zone
EEG Export Expansion Grant
ENDC Eastern Nigeria Development Corporation
GDP Gross Domestic Product
ISI Import Substitution Industries
ISIC International Standard for Industrial Classification
KNUPDA Kano state Urban Planning and Development Agency
MAKIA Mallam Aminu Kano International Airport
NCEMA National Centre for Economic Management and Administration
NDIC Nigeria Deposit Insurance Corporation
NEXIM Nigeria Export and Import Bank
NNDC Northern Nigeria Development Corporation
R & D Research and Development
SAP Structural Adjustment Programme
SPF Stochastic Production Frontiers
WAFF West African Frontier Force
WAPA West African Pilgrims Agency
WNDC Western Nigeria Development Corporation

viii
ABSTRACT
Nigeria‟s poor industrial performance as compared to some developing countries‟ and the
eventual closure of industries by the end of the 1970s, especially in Kano, remains the
central problem addressed in this work. The aim of the study is to determine the factors that
affect the nature and pattern of industrial growth and decline in Kano metropolis, using the
Path Dependence theory. The objectives are to a) examine the growth of manufacturing
industries in Kano metropolis by types, b) examine the effects of macroeconomic policies,
operating in the country, on industrial performance in Kano metropolis, c) determine the
pattern of collapse and survival of manufacturing industries in Kano metropolis, d) examine
the factors underlying the observed pattern of collapse and survival of manufacturing
industries in the study area, and e) assess measures industries in the study area are taking to
stay in business. The study is a basic research rooted in the positivist approach employing
the survey method. The documented data used for this study is made up of 381 industries
while the stratified random sampling method was used in collecting the survey data with a
sample size of 25. General descriptive statistics was used to analyse the data while ANOM
was used to test hypotheses I and II and the three-way ANOVA was used to test hypothesis
III. The findings of the study show that industrial development in Kano metropolis is poor
in industrial mix. Although it is made of 20 out of the 24 ISIC Revision 4 divisions spread
in 59 out of 121 industrial classes it is not as comprehensive in coverage as it may at first
appear to be and only boasts of change in overall numbers of industries. Although the
industries mainly depend on local sources of raw materials only 12% have added new
product lines and more than 75% producing mainly for internal consumption. The
ownership structure is more foreign (45.4%) than Nigerian (33.9%) and more of individual
(79.3%) than joint ownership. The pre-SAP period produced slow but uncompetitive
growth while dramatic growth in the number of industries as well as closures was witnessed
during the SAP period. The ANOM reveals that while the proportion of industries that
closed is associated with their ISIC groupings, contrary to popular thinking it is
independent of SAP. The pattern of survival and collapse of industries in Kano metropolis
is best described as epileptic with industries declining, comatose or permanently closed.
The ANOVA test reveals that the three-way and two-way interactions were not significant
but endogenous, endowment, and macroeconomic policy factors were important in that
order. Thus, the impact of the combination of the different factors does not differ with
industry groups. In general, industrial production in Kano is an uphill task as about 80% of
industries self-provide basic infrastructure such as electricity and water. However,
industries differ in their perception of the factors affecting them and their Likert-type
rankings. Moreover their perceptions and their Likert-type rankings differ suggesting
industrialists‟ inability to objectively assess their situations. Endogenous factor scoring was
therefore used to assess industries individually and collectively and to place them on the
Path Dependence Model. Only 40% of industries are committed and fewer (20%) can be
said to be successful. The study recommends that industrialization should not be a hobby
but professionally-driven through „self-discovery‟ that is knowledge-driven. Rather than
leave industries loose without guidance, centralised coordination of industrialization
through policy and central provision of vital infrastructure is recommended. A policy of
industrial mergers and acquisition, as is currently being done in the banking sector, is also
recommended as closed industries tie down land and other resources.

ix
TABLE OF CONTENTS
TITLE PAGE
Title Page i
Declaration ii
Certification iii
Dedication iv
Acknowledgements v
List of Abbreviations vii
Abstract viii
Table of Contents ix
List of Figures xiv
List of Tables xv
List of Appendices xvii
CHAPTER ONE: INTRODUCTION
1.1 Background to the Study 1
1.2 Statement of the Research Problem 5
1.3 The Research Questions 6
1.4 Study Aim and Objectives 6
1.5 Justification of the Study 7
1.6 Significance of the Study 8
1.7 Research Hypotheses 9
x
TABLE OF CONTENTS CONT‟D
1.8 Scope of the Study 10
1.9 Organization and Presentation of the Study 10
CHAPTER TWO: CONCEPTUAL FRAMEWORK AND LITERATURE
REVIEW
2.1 Conceptual Framework 12
2.1.1 The Path Dependence Model 12
2.1.2 Factors of Industrial Location and Production 15
2.1.3 The Underlying Principles of Modern Industries and Industrialism 17
2.1.4 International Standard for Industrial Classifications (ISIC) 21
2.2 Crossing the “Modern” Divide 25
2.2.1 Introduction 25
2.2.2 The Developmental Approach 25
2.2.3 The Urban-bias Approach 26
2.3 Industrialization and Industrial Policy in Nigeria 28
2.3.1 Traditional Industries in Nigeria 28
2.3.2 Industrial Development in Nigeria 29
2.3.3 Industrial Development in Kano 30
2.3.4 Industrial Policy in Nigeria 31
2.4 Relevance of Review to the Study 35
CHAPTER THREE: RESEARCH METHODOLOGY
3.1 Study Area 37

xi
TABLE OF CONTENTS CONT‟D
3.1.1 Origin and Growth of Kano Metropolis 37
3.1.2 The Physical Environment of Kano Metropolis 40
3.1.3 Population and Economic Activities in Kano metropolis 43
3.2 Research Methods 54
3.2.1 Research Design 54
3.2.2 Types and sources of Data 55
3.2.3 Sampling and Administration of Research Instruments 58
3.2.4 Methods of Data Analysis 60
CHAPTER FOUR: INDUSTRIAL GROWTH IN KANO METROPOLIS AND
THEIR ISIC GROUPINGS
4.1 Introduction 65
4.2 Nature of Industries in Kano Metropolis and their ISIC Groupings 66
4.2.1 Establishment of Industries in Kano Metropolis 66
4.2.2 ISIC (revision 4) Classification of Industries in Kano Metropolis 67
4.2.3 Industrial Mix in Kano Metropolis 69
4.2.4 Ownership Pattern of Industries 70
4.3 Effect of Macroeconomic Policies on Industrial Performance in Kano
Metropolis
72
4.3.1 Births and Closures of Industries in Kano Metropolis 72
4.3.2 Industrial Mix in Kano Metropolis by Macroeconomic Periods 75
4.3.3 Industrial Ownership in Kano Metropolis 76
4.4 Test of Hypothesis I and II 77

xii
TABLE OF CONTENTS CONT‟D
4.4.1 Test of Hypothesis I 77
4.4.2 Test of Hypothesis II 79
4.5 Discussions 80
CHAPTER FIVE: FACTORS AFFECTING THE GROWTH OF INDUSTRIES
IN KANO METROPOLIS
5.1 Introduction 82
5.2 General characteristics of respondent industries 82
5.2.1 Industrial Plant and Ownership Structure 82
5.2.2 Raw material Inputs and their Sources 84
5.2.3 Labour Input 88
5.2.4 Production Costs 90
5.2.5 Industrial Outputs 90
5.2.6 Managing Infrastructure 95
5.3 Pattern of Industrial Decline and the Contributory Factorsin Kano
metropolis 97
5.3.1 Capacity Utilization of Respondent Industries in Kano metropolis 98
5.3.2 Perceived Reasons for the Decline 100
5.4 Relative importance of the factors identified and the Test of Hypothesis III 101
5.4.1 Relative importance of Macroeconomic, Endowment, and Endogenous Factors 102
5.4.2 Endogenous Factor Scoring 103
5.4.3 Test of Hypothesis III 105
5.4.4 Placement of Industries in Kano metropolis on the Path dependence Model 107
5.5 Discussions 109

xiii
TABLE OF CONTENTS CONT‟D
CHAPTER SIX: SUMMARY, CONCLUSIONS, AND RECOMMENDATIONS
6.1 Summary 112
6.2 Conclusions 115
6.3 Recommendations 117
REFERENCES 121
APPENDICES 127
xiv
LIST OF FIGURES
Figure Page
2.1 The Canonical Path Dependence Model of Spatial Industrial Evolution 13
2. 2 Towards an Alternative Path Dependence Model of Local Industrial
Evolution
14
3.1 Kano City Walls 38
3.2 Urban Kano (1967) 39
3.3 Present-day (2012) Kano metropolis 40
3.4 Hierarchy of markets in Kano metropolis 46
3.5 Industrial Estates in Kano metropolis 48
4.1 ANOM Display for Closed Industries by their ISIC Divisions in Kano 78
4.2 ANOM Display for Closed Industries by Period in Kano 79
5.1 The relative positions of the industries surveyed in Kano metropolis on the
Path Dependence Model
108

xv
LIST OF TABLES
Table Page
2.1 Comparisons of ISIC Codes (Revisions 2, 3, and 4) 22
2.2 Two-digit ISIC codes (Revision 4) for Manufacturing industries 24
3.1 Kano‟s Population from 16th Century to Date 43
3.2 Commercial Firms Operating in Kano by the End of 1913 45
3.3 Distribution of Industries in Kano Metropolis 59
4.1 Establishment of Industries in Kano Metropolis 66
4.2 ISIC (Revision 4) Codes for Industries in Kano Metropolis 68
4.3 Ownership of Industries in Kano Metropolis, 1940 - 2010 71
4.4 Establishment and Closures of Industries in Kano Metropolis, 1940 - 2010 73
4.5 Status of Industries in Kano Metropolis by their ISIC (Revision 4) 74
4.6 ISIC (Revision 4) Code Classes for Industries in Kano Metropolis 76
4.7 Ownership of Industries in Kano Metropolis 77
5.1 Industrial Plants of respondent industries from 1969 - 2010 83
5.2 Ownership Structure of respondent industries from 1969 - 2010 84
5.3 Raw Material Requirements of respondent industries as at 2012 85
5.4 Sources and Total Number of Raw Material Inputs of individual industries
surveyed as at 2012
87
5.5 Labour Force Distribution by Industries Surveyed as at 2012 89
5.6 Outputs of Industries Surveyed as at 2012 92
5.7 Market Outlets for the Products of Industries Surveyed as at 2012 93
5.8 Product Input-Output of Sampled Industries as at 2012 94

xvi
LIST OF TABLES CONT‟D
5.9 Industry Requirements and how they are Catered for at takeoff and in
2012
96
5.10 Capacity Utilization of Sampled Industries as at 2012 99
5.11 Likert-Type Scale for Endogenous Factor Scoring 103
5.12 Endogenous Factor Scores of Inputs by Industries as at 2012 105
5.13 Summary of the ANOVA test Result 106

xvii
LIST OF APPENDICES
Appendix Page
I Questionnaire for Industries in Kano Metropolis 127
II Table of Critical Values (Analysis of Means Constants) 134
III Summary of Industrial Classifications According to ISIC Revision 4 136
IV Details on Section C (Manufacturing): Divisions, Groups, and Classes 137

1
CHAPTER ONE
INTRODUCTION
1.1 BACKGROUND TO THE STUDY
Human existence on the surface of the earth is punctuated by what have generally been referred
to as “revolutions” in recognition of the profound impact of the successive technological
innovations of new tools and ideas that led to the inventions and innovations of new processes
and techniques of doing things and the distinct changes to life occasioned by them. Each of these
“revolutions” represents a turning point in the history of mankind. The Neolithic Revolution (or
Agricultural Revolution) was one of them. It marks the departure from hunting and gathering and
the beginning of sedentary complex community life based on agricultural production and the
domestication of animals leading to the rise of permanent settlements and, eventually, urban
civilizations. The Industrial Revolution which in turn ushered in the Industrial era is another. The
other is being referred to as the Digital Revolution which has brought the world to the current
post-industrial era (Bell, 1976; Short, 1996) or the Information era. None of these “revolutions”
happened overnight although the speed and the magnitude of the changes became progressively
overwhelming. The focus of this work is to do with the changes brought by the Industrial era.
The main thrust of the Industrial Revolution was getting machines to do the tasks hitherto
undertaken manually or hitherto impossible manually. Indeed, the fact that mechanical
contraptions could be put to human advantage was not new and was not the only defining point
of the Industrial Revolution as ever since the Renaissance (14th century to 17th century),
Europeans had been inventing and using ever more complex machinery (Microsoft Encarta,

2
2008). It was the progress achieved by running machines from fresh sources of power rather than
human and animal energy as well as the discovery of novel forms of organizing business and
labour around the machines that sparked off the revolution in Britain.
The advancement of using the steam engine meant that a factory could be located anywhere, not
just close to water. Similar achievements with respect to the use of coal in iron foundries also
helped bring about industrialization. In 1775 James Watt (a mechanical engineer) and Matthew
Boulton (a manufacturer) formed a partnership (Boulton and Watt) to pool and share resources.
By 1800 the firm was second to none in the construction of engines, pumps, blast furnaces, and
powering mill machinery. Similarly, the series of innovations in the textile industry not only
reduced and replaced the human labour required but also sharply divided labour between
spinning and weaving and therefore changed the nature of work in the textile industry
(Wikipedia, 2014).
These achievements applied to the field of manufacturing gave birth to modern industries which
produced goods in logarithmic scale in contrast to the traditional industry or “the cottage or
putting-out and collection system of pre-industrial Europe” (Mbagwu, 1983:277). The traditional
industry includes, at its lower stratum, giving different shapes and designs to materials without
any change in the original form of the basic raw material (traditional crafts) and, at its upper
stratum, it involves some form of processing or conversion of the primary raw materials into an
intermediate form different from its primary base (see Mbagwu, 1983:278). As the Industrial
Revolution progressed, machine-made and standardised machines with metal parts and frames
replaced pre-industrial machines which were labouriously hand-made by various craftsmen, with

3
variable quality and costly. In turn, the modern industry, in addition to being able to do what
traditional industry does, can convert basic raw materials to a form that bears no resemblance to
its primary base: its products are standardized, produced in a factory setting and often using
mechanized procedures.
France, Belgium, Holland, some of the German states and the USA set out to imitate Britain‟s
success. Setting up industrial manufacture, particularly based on the principles of centralisation,
concentration, maximisation, specialisation, standardisation, and synchronisation (see details in
Chapter 2), came to be known as industrialization. Industrial development, in turn, refers to the
enhancement and increase in manufacturing activities as well as the number of industries, from a
lower stage to a higher stage, producing different types of products. Altogether, how industrial
manufacture is organised and used, as well as its total effects on society came to be known as
“industrialism”.
The total impact of industrialization on the economy is such that industrialization became an
important pre-requisite of economic growth and national development (Teriba and Kayode 1977;
Onyemulekwe 1978; Hodder 1980; Onyemelukwe and Filani, 1980; Abdulkadir, 1981; Ciroma,
1981; Zayyad, 1981; Adekoya 1987; Ajayi, 1993, Isa and Ibrahim 2008) as it enables a country
to expand and diversify its economy as well as balance its economic growth and improve its
balance of payments (French, 1990; Egbon, 1995). The ability to develop industries as an
economic sector, particularly for a country monolithically dependent on agriculture, meant more
employment with the attendant increase in income and standard of living as well as diffusion of
technological and managerial skills. The additional income for the country, from both import
4
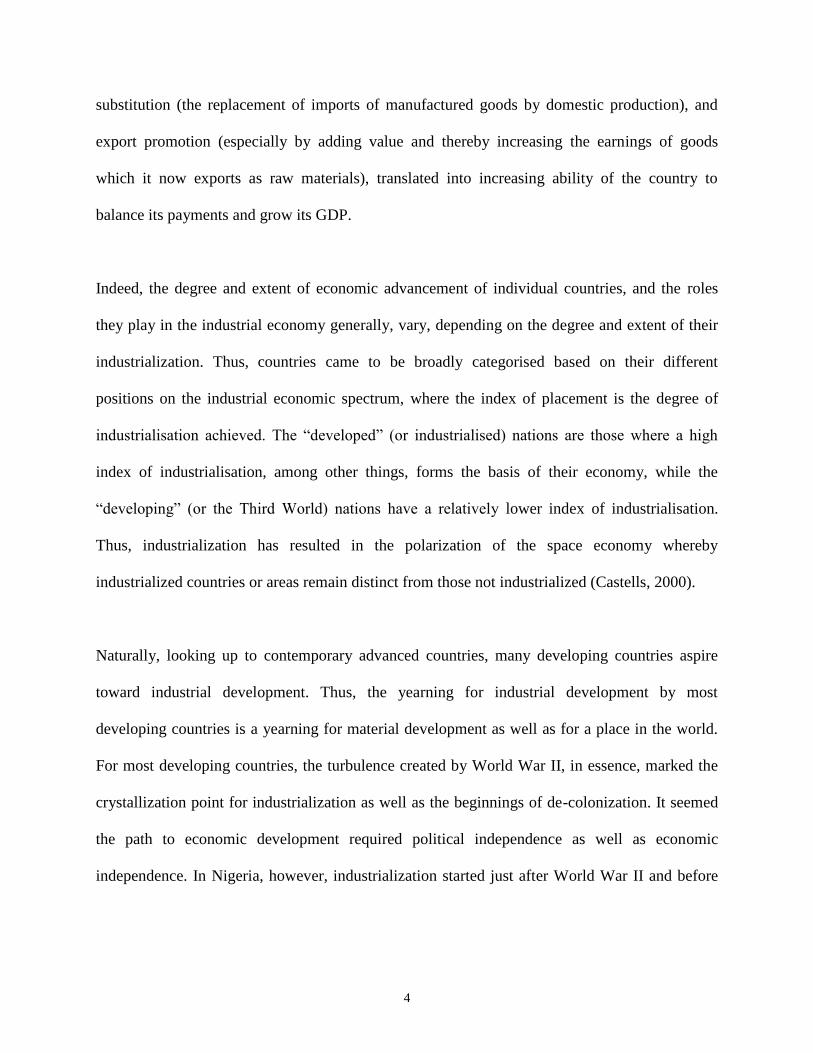
substitution (the replacement of imports of manufactured goods by domestic production), and
export promotion (especially by adding value and thereby increasing the earnings of goods
which it now exports as raw materials), translated into increasing ability of the country to
balance its payments and grow its GDP.
Indeed, the degree and extent of economic advancement of individual countries, and the roles
they play in the industrial economy generally, vary, depending on the degree and extent of their
industrialization. Thus, countries came to be broadly categorised based on their different
positions on the industrial economic spectrum, where the index of placement is the degree of
industrialisation achieved. The “developed” (or industrialised) nations are those where a high
index of industrialisation, among other things, forms the basis of their economy, while the
“developing” (or the Third World) nations have a relatively lower index of industrialisation.
Thus, industrialization has resulted in the polarization of the space economy whereby
industrialized countries or areas remain distinct from those not industrialized (Castells, 2000).
Naturally, looking up to contemporary advanced countries, many developing countries aspire
toward industrial development. Thus, the yearning for industrial development by most
developing countries is a yearning for material development as well as for a place in the world.
For most developing countries, the turbulence created by World War II, in essence, marked the
crystallization point for industrialization as well as the beginnings of de-colonization. It seemed
the path to economic development required political independence as well as economic
independence. In Nigeria, however, industrialization started just after World War II and before

5
political independence in about a dozen settlements across the country among which are Lagos,
Ibadan and Kano.
1.2 STATEMENT OF THE RESEARCH PROBLEM
Much as it is generally agreed that progress from a “traditional” rural society to a “modern”
industrial society is desirable, the question remains how the transition from one to the other is to
be achieved. No sooner had developing nations embarked on the drive to industrialize than they
realized that transformation to an industrial society is not a process to be taken for granted. For
instance, industrial performance in Nigeria, at any point in its history, has been behind other
developing countries such as Brazil, Mexico, South Korea, Argentina, and India (Phillips, 1986;
Sani, 1995). Secondly, by the end of the 1970s industries in Nigeria began to be distressed. Yet
historical accounts of Nigeria‟s economic development show how the country played a leading
role in supporting the industries of Britain. For instance, groundnut export to Britain rose from
less than 2,000 tons in 1911 to about 20,000 tons in 1913 (Mabogunje, 1968), a year after the
railway reached Kano. How is it that assembling industrial raw materials (such as cotton,
tobacco, groundnuts, cocoa, palm kernels, coal, tin and columbite, etc.) for industries in far away
Britain generated so much wealth in the past, but the actual industrial production (within the
country) now yields disappointing results?.
In Kano, for instance, even an industry which contributed immensely to the economy of the
metropolis and whose product (sweets) has been internalized in the Hausa culture has collapsed!
These un-intended industrial decline and eventual collapse, as opposed to de-industrialization,
are not addressed in the studies of transition from a “traditional” rural society to a “modern”

6
industrial society. What, therefore, is the nature of industrial development in Kano metropolis
and, how can the decline be stemmed so that the life of surviving industries can be extended
beyond what obtains now?
1.3 THE RESEARCH QUESTIONS
The research questions this work addresses are as follows:
1. What is the nature of industries in Kano metropolis?
2. What are the factors affecting industrial growth and decline in Kano metropolis?
3. What is the pattern of growth, decline and collapse of industries in Kano metropolis?
4. Why did some of the industries survive while others collapsed?
5. What are the lessons for industrial development in Kano metropolis?
1.4 STUDY AIM AND OBJECTIVES
The aim of this study is to determine the factors that affect the nature and pattern of industrial
growth and decline in Kano metropolis. The specific objectives of the study are to
i) examine the growth of manufacturing industries in Kano metropolis by types;
ii) examine the effects of macroeconomic policies, operating in the country, on industrial
performance in Kano metropolis;
iii) determine the pattern of collapse and survival of manufacturing industries in Kano
metropolis;
iv) Examine the factors underlying the observed pattern of collapse and survival of
manufacturing industries in the study area, and
v) assess measures industries in the study area are taking to stay in business.

7
1.5 JUSTIFICATION OF THE STUDY
Indeed, studies such as Teriba and Kayode, (1977), Onyemelukwe, (1983), Mabogunje, (1990),
Badri, (2007), and Isa, and Ibrahim, (2008) dwell on how to improve industrial production in the
country generally or in specific parts. However, their emphasis which was on the factor
endowments of the different parts of the country places their studies in the realm of regional
analysis. The Developmental Approach (as it came to be known) is therefore a regional approach
that hardly addresses individual industries let alone feels individual industry‟s pulse.
Other studies such as Lubeck, (1977), Onyemelukwe, (1978), Ayeni (1979), Adegbola, (1983),
Akpobasah, (1986), Eleazu, (1986), Eze, (1986), Olashore, (1986), and Sani, (1995) are more
specific to individual industries or groups of industries. Their treatment is neither regional nor
based on endowment factors. But these studies have no „barometer‟ for testing the health of the
industry. Although Phillips (1986) has come out with the input-output matrix (that could be used
as a „barometer‟), but the requirement of the technique for high quality quantitative industrial
data makes its use in Nigerian situation almost impossible. Thus, the Structuralist and
Dependency theorists (as these studies came to be known) failed to diagnose industrial problems
on industry-by-industry basis.
Although this study is fundamentally a structuralist approach, it is also rooted in Path
Dependence theory which holds that “the combination of historical contingency and the
emergence of self-reinforcing effects, steers a technology, industry or regional economy along
one „path‟ rather than another” (Martin, 2009:3). The in-depth study of the industries in the
tradition of the structuralist approach is used to derive the Endogenous Factor Scores of the

8
individual industries and this enables diagnosis of particular industries. Furthermore, the
Endogenous Factor Scores are used to determine the positions of the industries on the Path
Dependence model and to examine how well the industries in Kano metropolis are doing. This
allows one to estimate the resilience or vulnerability of the individual industries with a view to
discovering the point beyond which their chances of survival is high. It is hoped that this holistic
approach will result in a realistic assessment of industrial production in Kano metropolis and also
reveal the actual problems that have plagued them. How can one discern a problem before an
industry collapses? The present study is an attempt to answer this nagging question.
1.6 SIGNIFICANCE OF THE STUDY
In an era where industrialized nations are embarking on de-industrialization and are transferring
their manufacturing activities to developing countries, it is disheartening that industries in
Nigeria are collapsing. There is, therefore, the need to examine the problems associated with
industrial collapse in Kano metropolis in particular and other industrial axis in Nigeria in
general. At the moment, industrial capital in the form of machines as well as the money invested
is tied up and idle. In addition there is the loss of jobs as well as the loss of revenue due to no
production. On their part, consumers are forced to look elsewhere for the products they want and
the economy suffers.
It doesn‟t have to be so. The onset of the Industrial era rather than do away with agriculture
made it more efficient. It is therefore reasonable to expect that the Information era will not do
away with the industry but require it to be more effective and efficient. Indeed, as a
manifestation of cumulative, and sometimes sustained, malfunction in the industrial process,

9
industrial collapse can be delayed or, at best, avoided. Addressing industrial collapse is therefore
the necessary first step towards a more effective and efficient industries. It is hoped that the
findings, apart from contributing to available literature, will lead to realistic prescriptions that
will significantly reduce the problems of industrial collapse.
1.7 RESEARCH HYPOTHESES
The following hypotheses were tested in pursuit of the study objectives:
1. Some industry groups in Kano metropolis are more susceptible to declining performance
than others. Thus,
Ho : The proportion of industries that closed is independent of their ISIC grouping.
H1 : The proportion of industries that closed is associated with their ISIC grouping.
2. The Structural Adjustment Programme (SAP) has been responsible for declining industrial
performance in Kano metropolis. Thus,
Ho : The proportion of industries that closed is independent of SAP.
H1 : The proportion of industries that closed is associated with SAP.
3. The relative importance of macroeconomic policies and other identified factors on the
growth and decline of industries in Kano metropolis varies with industry groups. Corollary
hypotheses can be stated as follows:
a) Endogenous factors rather than Endowment factors are responsible for the declining
industrial performance in Kano metropolis.
b) Endowment factors rather than Macroeconomic factors are responsible for the declining
industrial performance in Kano metropolis.
c) Macroeconomic factors rather than endogenous factors are responsible for the declining
industrial performance in Kano metropolis.

10
1.8 SCOPE OF THE STUDY
The term metropolis refers to a large city or urban area and in the case of Kano metropolis
comprises of the area within the eight LGAs (Dala, Fagge, Gwale, Kumbotso, Municipal,
Nassarawa, Tarauni, and Ungogo) as in Figures 3.3 and 3.5. While the industry remains the unit
of investigation, the discussion in this work largely focuses on modern industrial set-ups, as
against traditional industries, that are located within Kano metropolis. Therefore small-scale
industries are excluded (as they contravene the principles of concentration and maximization).
1.9 ORGANIZATION AND PRESENTATION OF THE STUDY
Chapter One introduces the study, stating its background, the research problem which gives birth
to the research questions, aim and objectives of the study and the approach adopted. Chapter
Two presents the conceptual framework and literature review starts with the concept of Path
Dependence model and factors of industrial location and production. This is followed by the
underlying principles of modern industrialism and a review of International Standard for
Industrial Classification (ISIC). The second part of Chapter Two reviews available literature on
how to modernize as well as a review of industrialization and industrial policy in Nigeria. The
chapter ends with the relevance of the concepts and literature to the study.
The first part of Chapter Three - Research Methodology - gives an overview of the development
of Kano metropolis - the study area. Focus is placed on the spatial growth of the area of study as
well as the factors responsible for its growth. The section therefore dwells on a review of these
factors in the study area emphasizing the roles played by geology, relief, climate, river system,
vegetation resources (physical factors), population, commerce, manufacturing industries,

11
financial services and transport (population and economic activities). The second part, which
dwells on the method of study adopted, starts with the research design followed by the types and
sources of the data acquired. Stratified random sampling technique was used and questionnaires
distributed to industries. A description of the various methods used to gather the data and analyze
them and the test of the research hypotheses conclude this chapter. Chapters Four and Five dwell
on the presentation of results. Chapter Four focuses on the nature of industries in Kano
metropolis – their dynamics, industrial mix and ownership structure – and how they have been
affected by the macroeconomic policies in operation. The chapter concludes by testing
hypotheses I and II. Chapter Five starts with the characteristics of respondent industries,
followed by the pattern of industrial decline and the contributory factors in Kano metropolis. An
examination of the relative importance of the factors identified leads to developing the
Endogenous Factor Scoring system. The chapter then concludes with the test of Hypothesis III.
Chapter Six begins with a summary of the entire work. This is followed by the conclusions, and
recommendations.

12
CHAPTER TWO
CONCEPTUAL FRAMEWORK AND LITERATURE REVIEW
2.1 CONCEPTUAL FRAMEWORK
2.1.1 The Path Dependence Model
The Path Dependence Model, introduced by David (1985; 2000; 2007) and Arthur (1989) as a
way of explaining the evolution of technologies and technological standards, holds that given a
number of competing economic productions (say a, b, and c) each with its specific outcomes (say
x, y, and z), the choice made is a declaration of path an entrepreneur or society is willing to take.
A choice of a, for instance, not only commits the entrepreneur but gives the chosen technology a
foot-hold which, with Network Externalities (according to David) or Increasing Returns effects
(according to Arthur), steers the technology, industry or regional economy along one path rather
than another, obviated by the historical contingency necessitating the choice.
The idea has been adopted and applied in a variety of disciplines and is widely applied to local
and regional industrial evolution. It is essentially a combination of a) historical contingency and
b) economic growth. The latter is growth of technically interrelated production system
(according to David) or a system of large initial fixed setup costs (according to Arthur) that
enjoys economies of scale (according to David) or dynamic learning effects (according to
Arthur) and the attainment of quasi-irreversibility of investment (according to David) or
coordinating effects aided by self-reinforcing expectations (according to Arthur). The
combination of which „locks-in‟ the technology, industry or regional economy in a way that is
not deterministic. But it “may be said to be „pre-destined‟, in the sense of being governed from
the outset by a unique asymptotic probability distribution” (David, 2000:5) just as the historicity

13
of the Dependency theories claim. This time however, it is based on equilibrist thinking, in
stages, as illustrated in Figure 2.1.
The „Historical Accident‟ stage is where the „path‟ is selected. The „Early Path Creation‟ stage
emphasizes self-reinforcing effects of the industry resulting in growth. Once in the Path
Dependent „Lock-In‟ stage the industry continues in this stable state enjoying economies of scale
as well as quasi-irreversibility of investment until an exogenous shock is introduced.
Figure 2.1: The Canonical Path Dependence Model of Spatial Industrial Evolution
Source: Martin, 2009:6
The major attraction for this emerging paradigm of evolutionary economic geography is that
Path Dependence “explains current state of affairs from its history …” (Boschma and Frenken in
Martin, 2009:2). However, in this form, the model stresses continuity rather than change (Martin,
2009). Thus, a reformulated version is suggested as in Figure 2.2 where the Pre-Formation Phase
and Path Creation Phase are the same as the „Historical Accident‟ and Early Path Creation
Path „De-
locking‟
Destabilisation
and disturbance of
the industrial
locational pattern
as a result of an
unpredictable or
unexpected
„exogenous
shock‟; may
involve total
disappearance of
industry
Early Path
Creation
„Selection‟ of
location(s) by
geographical
variations in
emergence and
development of
self-reinforcing
autocatalytic
processes
(agglomeration
economies)
„Historical
Accident‟
Initial location(s)
of first firms in an
industry
determined by
„historical
accident‟,
contingent
circumstances or
random event, in
some instances by
„geographical
necessity‟
Path Dependent
„Lock-In‟
„Lock-In‟ by
increasing
returns
(agglomeration
economies) of
path to a long-
run stable
locational
pattern of fixed
shares of the
industry across
the „selected‟
locations

14
phases in Figure 2.1. However, whether the initial event of an industry was historically
determined, purposive, or occasioned by chance does not „lock-in‟ the industry to a pre-
determined end as in Figure 2.1.
Figure 2. 2: Towards an Alternative Path Dependence Model of Local Industrial Evolution
Source: Martin, 2009:32
Rather, the industry goes into the Path Development Phase where development is a function of
incentives, capabilities, and institutions as well as a mixture of local and external networks.
Therefore both success (as now generally acknowledged of the “Asian tigers‟” industrial
experience) and failure (as in the Nigerian case) are equal possibilities. A good (and probably a
Local
Industrial or
Technological
Stasis
Path as Movement
to Stable State
Reinforcement of
selected
technologies
and increasing
rigidification
of associated firm
structures,
networks and
knowledges
Adaptation
and Mutation
of Local
Industry or
Technology
Path as Dynamic
Process
„Conversion‟,
„layering‟, and
„recombinant‟
effects led to
incremental, path-
dependent
evolution and
renewal of local
industry or
technology
Path
Development
Phase
Emergence
and
development
of local
increasing
returns and
network
externalilties
assists
development
of path
Pre-
Formation
Phase
Pre-existing
local
economic
and
technological
structures,
knowledges
and
competences
Path Creation
Phase
Purposive or
intentional
experimentation
and competition
among agents,
leads to local
emergence of
new path
Constraining environment for
emergence of new technologies
and industries
Enabling environment
for creation and
emergence of new
technologies and
industries

15
sustainable) mixture leads to the Path as Dynamic Process resulting in adaptation and mutation
of local industry or technology while a conventional approach (or mixture) leads to a Stable State
and industrial or technological stasis. In both cases there is a loop back to the Pre-Formation
Phase. Whereas the loop back resulting from industrial or technological stasis creates a new set-
up (or industry) without a link to the past, the loop back resulting from adaptation and mutation
feeds from its past. Using the Path Dependence model therefore enables one to tell which stage
or stages an individual or group of industries are at.
2.1.2 Factors of Industrial Location and Production
Generally, economic and non-economic factors influence both industrial location and industrial
production. In terms of location Weber (in Friedrich, 1929) singles out three main factors -
transport costs, labor costs and agglomeration economies. Location thus implies an optimal
consideration of these factors by minimising their costs in order to maximize profit. Thus, in
general, activities having a high level of raw materials requirement tend to locate near supply
sources, while activities using ubiquitous raw materials, such as water tend to locate close to
markets. According to Weber (op. cit.) activities with a material index (weight of the inputs
divided by the weight of the final product or output) greater than 1.0 would tend to locate toward
sources of materials while those with material index of less than 1.0 tend to locate toward the
market. However, contemporary developments in manufacturing, the reduction of transport costs
and new economic sectors (high technology) have changed locational behavior substantially,
making industries foot-loose.
The plethora of factors affecting industrial production include climate, community, global
competition, government attitude, government regulation, labour, land (Industrial site), market,

16
political situation (stability), raw materials, tax structure, utilities (in one way or the other), and
transportation (Teriba and Kayode, 1977; Badri, 2007). These, directly or indirectly, affect
industrial production and can be reclassified as macroeconomic policy, Endowment, and
Endogenous factors. These are examined in further detail.
i) Macroeconomic policy factors, such as global competition (presence or absence of),
government attitude/regulation, and tax structure, are official government policies which act
more or less as rules and regulations defining the environment where industrial development
takes place. These can be at national and/or international levels. For instance, the “infant
industry” thesis which emphasizes the need to protect juvenile industry formations from world-
wide free-trade (Egbon, 1995; Sani, 1995) was accepted universally. The paradigm shift in
global thinking that crystallized in 1980s was in tune with Adam Smith‟s late 18th
century
political idea of liberalism as a rationalization for unfettered capitalism. Neo-liberalism of the
1980s, based on the works of Friedrich Hayek and Milton Friedman, was strongly advocated
globally to replace the “Keynesian” model of development which was introduced in the 1930s. It
encourages privatization (enhancing the role of the private sector in modern society) and
deregulation (economic liberalizations, free trade and open markets) with the view that
unregulated markets are the best way to increase economic growth that will benefit everyone
ultimately.
ii) Each area is, to some degree, endowed with factors such as capital (money needed to
invest in business), community, labour (workers needed to make the product), land (industrial
site), market (places to sell the product at home and abroad), political situation (stability), raw
materials (all natural resources used to produce a product), utilities (in one way or the other), and

17
transportation. How much of these is available remains how much endowed the area in question
is and therefore its endowment factors. These are usually at national or sub-national (regional)
levels like the often cited examples of the states of Texas and Nevada in the United States of
America (see Mabogunje, 2011:668). Like macroeconomic policy factors, endowment factors
can be improved upon.
iii) It is increasingly becoming clear that industries with the same endowment factors do not
necessarily perform equally. It is like, on the one hand, two football teams each endowed with
eleven players but with different success; and on the other hand, although with the same
endowment one team can decide to use five strikers while the other uses less. Thus, endogenous
factors include what individual industries do with the opportunities and constraints
(macroeconomic policy factors, microeconomic decisions, and endowment factors) before them -
in other words, entrepreneurship or enterprise. These are at industry level.
2.1.3 The Underlying Principles of Modern Industries and Industrialism
The six principles that underlie modern industrial development are standardisation,
specialisation, synchronisation centralisation, maximisation and concentration According to
Toffler (1981:46-47)
Every civilization has a hidden code - a set of rules or principles that run through
all its activities like a repeated design… Everyone knows that industrial societies
turn out millions of identical products. Fewer people have stopped to notice,
however, that … we did more than simply standardize Coca-Cola bottles, light
bulbs, and auto transmissions.
The machines were the “hardware” and the six principles are the “software” of the industrial era.
Like today‟s computer, the hardware would not function without the software.

18
i) Standardisation, (according to Toffler, 1981:46-48), is probably the hallmark of
industrialization. The idea is to standardise the machines, the raw materials and the processes in
order to have standardised products. Theodore Vail and Frederick Winslow Taylor (Toffler, op.
cit.) were first to grasp the importance of this principle. The former revolutionized the post office
by introducing standardized routing before the latter built the American Telephone & Telegram
Company (AT&T) into a giant by standardizing its business procedures and administration.
Taylor believed that work could be made scientific by standardizing the steps each worker
performed and became the world's leading management guru. In the end, as a result of the
industrial revolution and the industry, work came to be standardized (hiring procedures, work
environment, work schedules, pay scales and fringe benefits, grievance procedures etc.). The aim
is to produce millions of identical products for the market and in that way, more can be produced
within the shortest time possible.
ii) Specialisation: For standardisation to be efficient there must be specialisation. The machines
and the processes are not only standardised but they are also specialised. So also are the people
involved in production required to specialise in particular processes. Each industry specialised in
particular products and within the industry different sections specialised in different aspects of
the production process. Adam Smith and Henry Ford were not only first to grasp the importance
of this principle but exemplified it. The former, in 1776, exemplified the effects of division of
labour in a classic passage describing the manufacture of the office pin. Whereas a worker in the
old style turned out not more than twenty per day, ten specialized workers, each performing only
one or a few of the eighteen different operations required to make a pin, together produced more

19
than forty-eight thousand pins per day -- over four thousand, eight hundred pins per worker.
(Toffler, 1981).
On the production of Model T cars in 1908 Ford said 7,882 different operations were required,
and noted that:
of these 7,882 specialized jobs, 949 required „strong, able-bodied, and practically
physically „perfect men,‟ 3,338 needed men of merely „ordinary‟ physical
strength, most of the rest could be performed by „women or older children,‟ and,
he continued coolly, „we found that 670 could be filled by legless men, 2,637 by
one-legged men, two by armless men, 715 by one-armed men and 10 by blind
men.‟ In short, the specialized job required not a whole person, but only a part
(Toffler, 1981:51)
iii) Synchronisation: For specialisation to achieve the desired effect, synchronisation is
necessary. Expensive machines and people involved in the production process cannot be allowed
to sit idly; nor are the people to be left to produce at their whims. Each is required to synchronise
his activities with those of others for continuity and to achieve maximum effect. “Thus
punctuality, never very important in agricultural communities, became a social necessity, and
clocks and watches began to proliferate.” (Toffler, 1981:51). The industry and eventually the
society became clock-driven.
iv) Concentration: When agents of the production process are scattered energy is dissipated. The
idea is that capital is best pooled or concentrated in one place for better results. For the first time
manufacturing concerns are encouraged to come together rather than scattered as they were.
Thus, it was considered desirable for manufacturing activities in a settlement to come together to
achieve the benefits of agglomeration and economies of scale. This principle was applied in
almost all aspects of society – the factory, the school, the hospital, the asylum, the prison were

20
all products of this era. In effect, concentration of production came to be synonymous with
efficiency.
v) Maximisation: Toffler (1981) still holds that the principle of maximisation encourages
industries to grow and get bigger - the bigger, the better. Since industrialism, from the point of
view of capitalism, is for profit, whatever form the profit takes (monetary, or simply advantages),
the idea here is to maximise it. This can be interpreted as efficiency - getting the most from the
least. Following from the same argument, bigger settlements were regarded more desirable to
smaller settlements. The introduction of motorized transport gave credence to this line of
reasoning and the industrial era, therefore, marked the beginning of the phenomenal growth of
settlements. The city became the norm.
vi) Centralisation: The co-ordination necessary for both standardisation and specialisation to
achieve the desired effect is to be found in centralisation. Centralisation as a decision making
strategy was not entirely new but it became crucial in the new dispensation as it was necessary
not only to pass down instructions from top to bottom, but like in puppetry to continuously pull
the strings, to achieve the desired effect. Thus, the top-down command chain of the industrial era
(Toffler, 1981).
2.1.4 International Standard for Industrial Classification (ISIC)

21
The ISIC code developed by the UN (obtained at Unstats.un.org) as a standard way of
classifying economic activities is a typical example of standardization. It is now used widely by
governments and international bodies as a way of classifying data according to economic
activity. The codes group together enterprises by their products or by the processes (i.e. the same
raw materials, process of production, skills or technology) used to obtain the products. Thus,
economic activities would belong in the same section if they produce the same type of goods or
service or if they use similar processes. The original code was adopted in 1948 and the ISIC code
has since then been reviewed a number of times as new types of economic activities become
important and to harmonize with other classification systems. Revision 1 was issued in 1958
followed by Revision 2 in 1968. The idea has been to classify economic activities into Major
Divisions (one-digit codes), Divisions (two-digit codes), Major Groups (three-digit codes) and
Groups (four-digit codes). The Major Division for Manufacturing was 3.
Revision 3 was introduced in 1989. Instead of using numerical values for the Major Divisions
letters were adopted and so economic activities were classified from A to Q with manufacturing
in Major Division D. ISIC coding beyond 4-digits have been discontinued with the adoption of
Revision 4 (since 2000). Revision 4 therefore is the latest and is organized in Major Divisions (A
– U) as in Appendix III. (Table 2.1 compares Revisions 2, 3, and 4). Manufacturing, this time, is
in Major Division C.
Each Major Division is further organised into different levels containing increasing details in
three nested levels. The Division level (2-digit codes) for manufacturing, for instance, starts from

22
Table 2.1: Comparisons of ISIC Codes (Revisions 2, 3, and 4)
ISIC Revision 2 ISIC Revision 3 – Section D. Manufacturing ISIC Revision 4 – Section C.
Manufacturing
Code Industry classes Code Industry classes Code Industry classes 31 Manufacture of food products,
beverages and tobacco
15
Manufacture of food products and
beverages
10 Manufacture of food products
11 Manufacture of food beverages
16 Manufacture of tobacco products 12 Manufacture of tobacco products
32 Textiles, wearing apparel and
leather industries
17 Manufacture of textiles 13 Manufacture of textiles
18 Manufacture of wearing apparel; dressing
and dyeing of fur
14 Manufacture of wearing apparel
19 Tanning and dressing of leather;
manufacture of luggage, handbags,
saddlery, harness and footwear
15 Manufacture of leather and related
products
33 Manufacture of wood and
wood products ; including
furniture
20 Manufacture of wood and of products of
wood and cork, except furniture; articles of
straw and plaiting materials
16 Manufacture of wood and of products
of wood and cork, except furniture;
articles of straw and plaiting materials
34 Manufacture of paper and
paper products; printing and
publishing
21 Manufacture of paper and paper products 17 Manufacture of paper and paper
products
22 Publishing, printing and reproduction of
recorded media
18 Printing and reproduction of recorded
media
35 Manufacture of chemicals and
chemical products; petroleum,
coal, rubber and plastic
products
23 Manufacture of coke and refined petroleum
products and nuclear fuel
19 Manufacture of coke and refined
petroleum products
24 Manufacture of chemicals and chemical
products
20 Manufacture of chemicals and chemical
products
21 Manufacture of basic pharmaceutical
products and pharmaceutical
preparations
25 Manufacture of rubber and plastics products 22 Manufacture of rubber and plastics
products
36 Manufacture of other non-
metallic mineral products;
except products of petroleum
and coal
26 Manufacture of other non-metallic mineral
products
23 Manufacture of other non-metallic
mineral products

23
Table 2.1 Cont‟d: Comparisons of ISIC Codes (Revisions 2, 3, and 4)
ISIC Revision 2 ISIC Revision 3 – (Section D.
Manufacturing)
ISIC Revision 4 – (Section C.
Manufacturing)
Code Industry classes Code Industry classes Code Industry classes
37 Basic metal industries 27 Manufacture of basic metals 24 Manufacture of basic metals
38 Manufacture of fabricated
metal products, machinery
and equipment
28 Manufacture of fabricated metal
products; except machinery and
equipment
25 Manufacture of fabricated metal
products; except machinery and
equipment
30 Manufacture of office, accounting and
computing machinery
26 Manufacture of computer, electronic
and optical products
31 Manufacture of electrical machinery and
apparatus not elsewhere classified
27 Manufacture of electrical equipment
29 Manufacture of machinery and
equipment not elsewhere classified
28 Manufacture of machinery and
equipment not elsewhere classified
32 Manufacture of radio, television and
communication equipment and
apparatus
33 Manufacture of medical, precision and
optical instruments, watches and clocks
34 Manufacture of motor vehicles, trailers
and semi-trailers
29 Manufacture of motor vehicles,
trailers and semi-trailers
35 Manufacture of other transport
equipment
30 Manufacture of other transport
equipment
(furniture from code 33
above)
36 Manufacture of furniture;
manufacturing not elsewhere classified
31 Manufacture of furniture
39 Other Manufacturing
Industries
32 Other manufacturing
33 Repair and installation of machinery
and equipment
37 Recycling
Source: Compiled from publications obtained at Unstats.un.org (retrieved on 7th
July, 2012)

24
Table 2.2: Two-digit ISIC codes (Revision 4) for Manufacturing industries
Code Industry
10 Manufacture of food products
11 Manufacture of beverages
12 Manufacture of tobacco products
13 Manufacture of textiles
14 Manufacture of wearing apparel
15 Manufacture of leather and related products
16 Manufacture of wood and of products of wood and cork, except furniture;
manufacture of articles of straw and plaiting materials
17 Manufacture of paper and paper products
18 Printing and reproduction of recorded media
19 Manufacture of coke and refined petroleum products
20 Manufacture of chemicals and chemical products
21 Manufacture of basic pharmaceutical products and pharmaceutical preparations
22 Manufacture of rubber and plastics products
23 Manufacture of other non- metallic mineral products
24 Manufacture of basic metals
25 Manufacture of fabricated metal products, except machinery and equipment
26 Manufacture of computer, electronic and optical products
27 Manufacture of electrical equipment
28 Manufacture of machinery and equipment n.e.c.
29 Manufacture of motor vehicles, trailers and semi- trailers
30 Manufacture of other transport equipment
31 Manufacture of furniture
32 Other manufacturing
33 Repair and installation of machinery and equipment
Source: Compiled from publications obtained at Unstats.un.org (retrieved on 7th
July, 2012)
10 – 33 and the Group level for each Division would be 3-digit codes. The Class level for each
Division and Group (where available) would be 4-digit codes. Thus, manufacturing is subdivided
into a little more than 20 Divisions (see Table 2.2), 30 Groups and 81 Classes (see Appendix IV).
ISIC coding beyond 4 levels have been discontinued in the latest ISIC revision.

25
2.2 CROSSING THE “MODERN” DIVIDE
2.2.1 Introduction
The Modernization theories try to explain the passage to industrialization. This development
issue, particularly how to cross from being underdeveloped to being developed, has generated
many theories which can be explained by the Developmental Approach or the Urban-bias
Approach (Knox and McCarthy, 2005, Willis, 2005).
2.2.2 The Developmental Approach
At the centre of the Developmental Approach are Perroux‟s Growth Pole theory, Hirschman‟s
„trickle-down effects‟ theory, Myrdal‟s „circular-causation‟ model, of the 1950s and Rostow‟s
stages of economic growth and Friedmann‟s core-periphery model and its satellite-metropolis
variant of the 1960s. In essence, economic as well as industrial development is a regional affair
with different locations contributing their endowments for the emergence of one or more
industrial centres. Policy prescriptions are equally meant to encourage the development of a
core-periphery (or satellite-metropolis) relationship with a growth centre (the core) from where
benefits will trickle down to the periphery. In the end, focus is on the endowment factors
(location, raw materials, finance, infrastructure, etc.) of the country or different parts of the
country and the rationale (or lack of it) for industrial developments in the areas. In this category
falls the works by Teriba and Kayode (1977), Onyemelukwe (1983), Mabogunje (1990), and
Badri, (2007).
Still in this category and focused on Kaduna State, is the work by Isa and Ibrahim (2008) which
can be seen as specific to a smaller unit of Nigeria. In all of these studies, the tendency is to see

26
industrial development (or lack of it) as a function of the endowment factors. Thus, even the
disappointing industrial experience in the country has been explained in the light of endowment
factors as the Odama report of 1983, (as cited in Olukoshi, 1996:1, 5 and 17) attributed the
decline in manufacturing output to Nigeria‟s inability to finance the import needs of industries
following the collapse of the world oil market of the 1980s. In effect it reduces the whole matter
to that of capital and raw materials deficits.
2.2.3 The Urban-bias Approach
The Structuralist and Dependency theorists maintain that Third World societies differ
structurally from western societies and employ urban-bias approach which maintains that
“underdevelopment stemmed directly from the unequal nature of the relationships between the
developed and less developed parts of the worlds” (Knox and McCarthy, 2005:180). This is a
line towed by Bello (2011) who sees, in many ways, how British colonial administration
underdeveloped the Kano economy. Lower down the scale, proponents of this school of thought
maintain that at the national level underdevelopment was a result of the unequal nature of the
relationships between cities (core) and their hinterlands (peripheries). Thus for instance, Lubeck
(1977:289), notes that "the prior historical development of a city and the manner in which an
urban area is incorporated into the world system provide important sources of variation" which
therefore, explains Kano‟s failure in sustainable industrialization.
Therefore policy prescriptions recommend the promotion of state intervention and protectionist
policies by promoting import substitution industries (ISI) as necessary in order to build up
domestic manufacturing. However, despite the success of the “Asian Tigers”, the failure of the

27
ISI in promoting industries in developing countries was imminent as they require larger markets
than their domestic markets, and also needed to import technically advanced equipment.
To understand the variations between industries, the structuralists therefore recommend a more
in-depth analysis of the industries concerned. Such in-depth analysis of industrial development in
Nigeria include notable works by Ayeni (1979), Adegbola (1983), Akpobasah, (1986), Eleazu,
(1986), Eze, (1986), Phillips, (1986), and Olashore (1986), who maintain that in addition to
factor endowments, the nature of an industry (its structural characteristics), how it is run and the
various industrial linkages obtaining, determine its success or otherwise. Thus, with the aid of
some analytical techniques (Location Quotient, Coefficient of Localization, and Coefficient of
Total Net Shift), Adegbola (1983:301) concluded that Nigeria‟s industrialization, especially the
manufacturing sector, is still under-developed and “has a narrow base which cannot guarantee
self-sustaining growth”. On his part, Phillips (1986:21), using input-output structure matrix
which shows the origin and destination of the output of each industry (i.e. who produces what,
with what input and used by whom), concluded that Nigeria‟s industrialization is a superficial
development with no real manufacturing taking place. In varying degrees, these are views shared
by Onyemelukwe (1978), and Sani (1995). Ayeni (1979:85), using the shift-share method to
analyze industries in Lagos metropolitan area, showed that “it is a useful technique for
identifying the emerging strengths and weaknesses that exist in the structure of manufacturing
(or any other) activity”. Not a specific industry, though!

28
2.3 INDUSTRIALIZATION AND INDUSTRIAL POLICY IN NIGERIA
2.3.1 Traditional Industries in Nigeria
According to Mbagwu (1983:276) “that there are non-primary sectors in the occupational mix of
the countryside is hardly realized, nor is the place of these other sectors in the economy
adequately assessed or duly appreciated”. The author further adds that both traditional crafts and
traditional industries date back to prehistoric times and could also be urban based. These
industries are non-mechanised and produce small quantity of non-standardised goods at a time.
They can be classified as follows:
1. Processing and extraction of flour (from cassava, grains, plantain, and yam), oil (from oil
palm fruits and nuts), salt (from salt rocks and brine water), tanning of hides and skin, dyeing
of cloths, and alcoholic and non-alcoholic beverages.
2. Craft such as carvings (doors, stools, statutes, canoes from wood), pottery products and
organic fiber products from grass and plants (mats, calabashes).
3. Manufacturing activities such as ginning and carding of cotton, yarn from cotton, weaving
from cotton yarn, and leather works.
4. Smelting, foundering, casting and smithing of ferrous, non-ferrous ores and metals for the
productions of simple ornaments, weapons and tools, household utensils, and glass works
Mbagwu (1983:288) concludes by advocating “a speedy transformation of the traditional
industries and crafts into modern businesses”. It is obvious that Nigeria needs to industrialize by
internalizing and applying the new skills and techniques (machines or the Hardware and the
Software) to their traditional industries and crafts.
29
2.3.2 Industrial Development in Nigeria
Industrialization in Nigeria started just before political independence, after the World War II,
with the setting up of some industries in Lagos, Ibadan, Port Harcourt, Aba, Enugu, Ilorin,
Kaduna, Funtua, Jos, and Kano. These cities not only attracted more people but also remained
growth centres in reality. Indeed each separately, or in combination with others, acted as a
nucleus in the formation of the various industrial axes that firmly set the country within the ambit
of industrial capitalism. The Lagos/Ibadan/Ilorin industrial axis, the Aba/Nnewi/Port-Harcourt
industrial axis, the Kaduna/Jos industrial axis, and the Kano axis are some of the notable ones in
the country. By 1975, according to Olukoshi (1996:16), Lagos and its environs, on the one hand,
accounted for 50% of manufacturing output in Nigeria while on the other hand, Kano in second
place accounted for 14% of manufacturing output in Nigeria as well as 10% of total employment
in Nigeria‟s industrial sector.
From the outset the Production Development Board and the Development Loans Board handled
and guided industrial development in the country before the formation of the three regional
boards that catered for the needs of their regions. Thus the ENDC and the WNDC were
responsible for the eastern region and the western region respectively, while the NNDC operated
in the northern region. With the creation of states in 1967 these regional agencies were further
decimated to correspond with the states created. This notwithstanding, manufacturing which
accounted for 4% of the GDP in 1958 rose to 8.4% in 1967 (Onyemelukwe, 1983:266;
Adegbola, 1983:295). The number of industries in the country was estimated to be more than
700 by 1970 (Onyemelukwe, 1983:266) and their contribution to the GDP was only second to
the oil sector. However with the onset of the economic crisis in the country in 1980s the

30
contribution of the industrial sector to the GDP, like that of many other sectors of the economy,
declined from 8.2% in 1990 to as low as 4.2% in 2003 while industrial capacity utilization
dropped to between 37.1% and 48.8% in 2003 (Egbon, 1995; Charles, 2007). However Olukoshi
(1996:1) noted that “even before the onset of the current economic crisis, the industrial sector
suffered from serious structural imbalances … The intermediate goods sector is relatively
underdeveloped and the capital goods sector almost non-existent”.
2.3.3 Industrial Development in Kano
As in many Nigeria cities, Kano‟s industrial development is constituted by the state, indigenous
businessmen, foreign businessmen, and multi-national corporations. But each settlement in the
country has its unique industrial experiences. For instance, only soap, oil mill and groundnut
paste industries were the first to have been established in Kano before Nigeria attained
independence in 1960. Foreign businessmen (especially the Levantine group) were the trail
blazers. But unique to Kano is the Kano Citizen‟s Trading Company (formed by a group of
indigenous businessmen) which established the first textile mill in Kano in the second half of the
1950s (Olukoshi, 1996). Of course, they were aided by the NNDC which was established in
1956.
Later in the 1970s leather tanning, production of plastics and plastic goods, rubber processing,
soft drinks and mineral water, wooden and metal furniture, enamelware, sweets and
confectionery, and perfumes and cosmetics were added to Kano‟s industrial profile. “The
Levantines were, in several cases, the pioneers of the production of particular commodities in

31
Kano and their high profile in sub-sectors like plastics, soft drinks, sweets and confectionery, and
textiles, to cite a few, is unmistakable (Olukoshi, 1996:12). By 1985 Kano
also boasts one of the highest concentrations of textile mills, sweets and
confectionery factories, plastics and plastic product plants, perfumes and cosmetic
factories, and metal and wooden furniture factories in the country….although it
has far fewer intermediate goods firms and no capital goods producing plants
(Olukoshi, 1996:16).
Olukoshi further observes that for about half the Levantine and indigenous manufacturers,
manufacturing was only one of several spheres of business in which they were involved. This
notwithstanding, Kano‟s industrial achievement translated to 47% of the manufacturing output
and over 40% of total industrial sector employment of the northern states of Nigeria. However,
the impact of the economic crisis in the country in 1980s “on the Kano manufacturing sector, as
on the rest of the national economy, was immediate and drastic” (Olukoshi, 1996:17).
2.3.4 Industrial Policy in Nigeria
Nigeria‟s industrial policy can be seen in two phases – pre-SAP and during SAP. The first period
of the pre-SAP period began from 1900 – 1954. During this period the colonial government
established the NLDB and the DCI. The former was to promote and develop village crafts and
industries in the form of products from Nigeria and setting the modalities for research and
development in processing industries and other matters concerning industrial development. The
DCI was responsible for overseeing and promoting local trade and industrial development in the
country.
From 1954 – 1958 the regional governments began to take active roles in industrial and
commercial activities. During this period three major statutes were enacted namely:
a) the Industrial Development (Import Duty Relief) Act of 1957

32
b) the Industrial Development (Income Tax Relief) Act of 1958, and
c) the Customs Duties (Dumping and Subsidised Goods) Act of 1958
These were used to advance industrial development programmes in Nigeria and so are together
regarded as the corner stone that laid the foundation for import substitution programmes in the
country (Uzor, undated, p.5).
The period 1960 – 1970 saw the enactment of the Immigration Act of 1962 which specified the
ratio of Nigerians to non-Nigerians employed in foreign firms, the Companies Decree of 1968
which sought to bring local subsidiaries of foreign firms under the control of the Federal
government and later to secure the participation of Nigerians in such businesses. In addition,
industrial development featured in the National Development Plan of 1962-1968 with about 14%
of public investment allocated to it. This policy period emphasized the desire to encourage “a
shift from commerce into processing and manufacturing industries” (Egbon, 1995:2) and the ISI
was adopted as the policy that will effectively accomplish the objective. The first stage of ISI
was limited to the replacement of imports of non-durable consumer goods, or what is referred to
by Ajayi (2007:142) as the assembly-type pattern of import substitution. This includes the
extractive (oil mills and flour mills), additive (soft drinks etc.), and assembly types of industries
(bicycle assemblies). The second stage of ISI in Nigeria was to focus on the replacement of
imported intermediate inputs and producer and consumer durables.
The period 1970 – 1985 is the last period of the pre-SAP phase. It began with the decree
establishing ITF, promulgated in 1971, with the aim to encourage skills acquisition in industries
and the Nigerian Enterprises Promotion Decree of 1971. Again industrial development featured

33
in the second National Development Plan 1970-1974. This period also witnessed the
promulgation of the Nigerian Enterprises Promotion Decree of 1972 (popularly known as the
Indigenization decree) which was later modified in 1978.
From 1978 onwards industrial policy in Nigeria was subsumed in the economic policy packages
articulated to engender recovery from the economic crisis of the time. In addition to all other
economic woes the industrial sector was inefficient. For instance, at this time, it was noted that at
least 45% of raw material inputs were imported (Phillips, 1986; Onyemelukwe, 1983:265;
Olukoshi, 1996). The UNIDO‟s survey of the 1980s showed that Nigeria imported 60 percent of
the raw materials consumed in the manufacturing sector (Egbon, 1995:5). Indeed, the ISI in
Nigeria was described as import-dependent ISI. Thus, the Indigenization Decree of 1978, the
Economic Stabilization Acts of 1982 and 1983 as well the Counter-trade policy of 1983-85 were
all “geared towards rationalizing overall expenditure pattern so as to restore both fiscal balance
and equilibrium on the domestic front and in the external sector” (Egbon, 1995:4; NCEMA, not
dated, p. 5).
The Economic Stabilization Act (1982) as well as its modification in 1983, in particular,
comprised a package of stringent policies and measures that include a severe tightening of import
controls, the imposition of exchange restrictions, increases in customs tariffs, an increase in
petroleum product prices and utility tariffs. However, the Bretton Woods institutions, better
known as the World Bank and the International Monetary Fund (IMF) agencies - known for
imposing Neo-Liberal economic doctrines around the world - wanted tougher measures. In an
attempt to avoid IMF‟s deregulation policies the counter trade policy was implemented to

34
provide raw materials that were needed in industries, and thereby stem further closure of
industries, and halt the unemployment problems as well as the spiraling inflation. It only
succeeded in delaying the introduction of SAP until 1986.
SAP marks the beginning of the second phase of Nigeria‟s Industrial Policy. In essence the
policy advocated for the decentralization and privatization of state-owned enterprises (Anyanwu,
1992:6; NCEMA, not dated, p. 7; Tackie, and Abhulimen, 2001:3). The specific objectives of the
SAP were:
to restructure and diversify the productive base of the economy in order to reduce
dependency on the oil sector and on imports
to achieve fiscal and balance of payments viability over the period
to lay the basis for a sustainable non-inflationary growth
to reduce the dominance of unproductive investment in the public sector, improve that
sector's efficiency and enhance the growth potential of the private sector through
liberalized trade and privatization of public sector enterprises.
to allow the Naira find its true value vis-à-vis other currencies,
The New Industrial Policy of 1989, the Nigerian Investment Promotion Decree No. 16 and the
Foreign Exchange (Monitoring and Miscellaneous Provision) Decree N0. 17 of 1995 as well as
the Commercialisation and Privatisation Decree No. 25, are all to entrench the SAP. Thus, SAP
signaled the end of protectionism for industries in Nigeria and another side of the ISI coin.
There are claims of the Neo-Liberal economic doctrine‟s success elsewhere (though largely
contentious but this is not the place for the debate) but in Nigeria, where it was introduced as the

35
SAP, it is only associated with monumental hardships and its devastating impact on the
industries in Kano metropolis (Olukoshi, 1996).
2.4 RELEVANCE OF REVIEW TO THE STUDY
The ease with which other western European nations and the USA industrialized on the one
hand, and the catalogues of failures from the developing countries (Nigeria especially) on the
other, suggests something missing as Ali Mazrui (in Klitgaard, 1994:80) succinctly puts it:
Africa as a whole has borrowed the wrong things from the West, even the wrong
components of capitalism. We borrowed the profit motive but not the
entrepreneurial spirit. We borrowed the acquisitive appetites of capitalism, but not
the creative risk taking. We are at home with western gadgets but bewildered by
western workshops. We wear the wristwatch but refuse to watch it for the culture
of punctuality. We have learnt to parade in display, but not to drill in discipline.
The west‟s consumption patterns have arrived but not necessarily the West‟s
techniques of production.
With the recent industrial successes of the “Asian Tigers” it could be said that the
entrepreneurial spirit exemplified by the Industrial Revolution in Britain, Western Europe, and
the USA, had been one of the missing links In addition, it is apparent that many Nigerian
industrialists are unaware of the unwritten codes or principles of industrialization. For long, the
conventional belief is that land, labour and capital are all that was needed, and hence the
establishment of development and financial agencies to help willing industrialists have access to
capital. As a result, many industries in Nigeria only depend on the incentives and waivers to
make profit!
The performance of industries is not uniform. While some industries are sliding down the scale
others seem to be doing well. Looking at industrial growth from the perspectives of the Path

36
Dependence model not only allows one to determine what stages specific individual industries
are at, but also gives anticipatory knowledge of what stages they are likely to pass through.
Above all it offers the possibility of treating industries at the level of individual manufacturing
unit and at the different stages of growth.

37
CHAPTER THREE
RESEARCH METHODOLOGY
3.1 STUDY AREA
3.1.1 Origin and Growth of Kano Metropolis
Believed to have originated in the 7th century, Kano can be said to have been in existence
for over 1,000 years and therefore among the oldest settlements in Nigeria. It remained
much unknown and unstable until the 12th century when the first wall was built round the
settlement. Kano experienced incremental organic growth. The initial wall was extended
in the 15th century, the 16th century, and the 17th
century (see Figure 3.1). The wall
around a pre-industrial settlement guaranteed a sense of security, corporate identity, a
central place, and the “Birni” or a central place for the surrounding settlements (Liman &
Yusuf, 2002; Liman & Adamu, 2003). Kano city was so firmly entrenched that not even
an upheaval like the Sokoto Jihad, which shook and uprooted many settlements in
northern Nigeria, could unsettle it. Instead, Kano city not only became an important node
of the Sokoto caliphate but continued to be an important terminus of the trans-Saharan
trade for the next 100 years.
By the beginning of the 20th
century Kano city was the largest urban settlement in
Hausaland (Liman & Adamu, 2003:146). It comprised of the space within the wall and
the adjoining Fagge settlement just outside it. With its subjugation by the British in 1903,
the colonial administration and economy translated in space as Nassarawa, and Bompai
(for the Europeans), and Sabon Gari (for non-Europeans and non-natives). Later, Tudun

38
Figure 3.1: Kano City walls
Source: Liman, and Adamu (2003:149)
Wada. Gwagwarwa and Brigade (for natives) came into existence. All together these
residential units were known as Kano township – an addition to Kano City but larger.
These two units formed what came to be referred to as urban Kano. (See Fig. 3.2)
Although with political independence in 1960 Urban Kano‟s political influence and
economic attraction was unrivaled by any other settlement in northern Nigeria, it did not
register spatially until the end of the civil war in 1970. The Oil boom era developments
have incorporated adjoining villages such as Gama, Dawakin Dakata, Hotoro, Kawo,

39
Giginyu, Unguwa Uku, Na‟ibawa, Sharada, and Dorayi into the urban Kano and
transformed it into a metropolis.
I
Nassarawa
GRA
Gov't
Gwawarwa
Com
merc
ial A
rea
Sabon Gari
Bompai
GRA
Air Port
Agric
Station.
S
Army
Fagge
N. A.School
StPolice
GRA
Market
G
Hospital
Groundnut
Pyramid
N.A.
Hosp.
Tudun
Wada
Race Course
Pol.Prison
Dala Hill
BUK
Old Site
Roa ds Rail Roa dKa no City W all
Bu ilt-upArea
Palace
KANO
CITYKurmiMarket
Bo mp ai Ind &its e xten sion
E8.48o
o8.48 E o8.50 E
o8.50 E
o8.57 E
o8.57 E
o12.00 N
o12.00 N
o12.04N
o12.04 N
o11.97N
o11.97N
L E G E N D
Figure 3.2: Urban Kano (1967)
Source: Urquhart, (1977:67)

40
Dan Bare
MAD OBI LG A
W AR AW A LGA
TOF A
LG A
DAW AKIN
TOF A
LG A
BIRN IN KUD U LGA
GEZAW A LGA
MIN JIBIR LGA
Dorayi
Yan M ata
Fanis au
Ungogo
TokarawaBom pai
ChallawaMega Projects
Bui lt-up
Kano M etropol is
Markets
Rail L ines
Main R oads
LEG EN D
Amana
Kwankw asiyya
Bandar iyo
Kano
Ci ty
Pans hekara
Mar ir i
BUK
New site
12.17o
N
E8.39o
E8.39o
E8.67o
E8.67o
12.17o
N
11.85o
N 11.85o
N
Urban K ano
1960s
AKTH
Hotoro
G.R.A .
Figure 3.3: Present-day (2012) Kano metropolis
Source: Extracted from Quickbird Satellite image 2011 of Kano environment
3.1.2 The Physical Environment of Kano metropolis
3.1.2.1 Location and Extent of Kano metropolis
As a rule, pre-colonial walled settlements reserved half of the walled space un-built to be
used for cultivation during times of siege. This kind of leap-frog development was also
characteristic of the British colonial period but was complemented by in-filling of the

41
interstices in lull period of the civil war (1967 – 1970). With the oil boom came another
leap-frog period which was followed by in-filling during the SAP period. From all
indication, with the creation of Amana city and Kwankwasiyya Kano metropolis has
taken another leap-frog jump only for the interstitial spaces to be filled in later. Thus,
while the extent of Kano city kept expanding, so did that of urban Kano and Kano
metropolis. Today Kano metropolis covers the whole of Dala, Fagge, Gwale, Kano
Municipal, Nassarawa, Tarauni, and parts of Kumbotso and Ungogo Local Government
Areas (LGA). As a result, Kano metropolis lies between latitudes 11.85o N and 12.17
o N
and longitudes 8.39o E and 8.67
o E. (encompassing eight LGAs).
3.1.2.2 Geology, Relief and Climate of Kano Environment
Kano State lies on three geological formations, namely the Basement complex, Younger
granites, and the Chad sediments (Ahmed, 2006). The basement complex covers over
70% of the State while the Younger granite is found mainly in the southern part of the
state and the Chad sediments occur mostly in the north-eastern part of the state. Thus, the
area of study lies on the basement complex of the state, an area known as the High Plains
of Hausaland (Olofin, 2014). The study area is therefore a plain with occasional outcrops
that rise up to 100m above the plains (such as the residual hills of Dala and Gwauron
Dutse) .
According to Liman and Idris and Mohammed (2014) the climate affecting the Kano
environment is closely associated with the movements of the ITD resulting in the
following seasons a) Hot and dry season (“rani” in Hausa), b) Warm and wet season

42
(“damina” in Hausa), c) Warm and dry season (“kaka” in Hausa) and d) the Cool and dry
season (“bazara” in Hausa). The geology and soils of Kano state combined with the
climate have given rise to a flourishing agricultural area with immense potential for
manufacturing industries
3.1.2.3 River System and Vegetation Resources of Kano Environment
The Challawa, Jakara, Kano, and Watari river systems together provide the drainage
pattern of the area of study. With the exception of the Jakara, the other river systems are
tributaries of the Hadejia river system and contribute about 80% of the latter‟s flow at
Wudil (Abdulhamid, 2014). The Challawa, Jakara, Kano, and Watari river systems
therefore provide water for human consumption, irrigation and industrial activities in
Kano metropolis.
Derived Savanna is the dominant vegetation in Kano state with about 75% of the land
cultivated (Badamasi, 2014). Except along river courses and low-lying Fadama areas tree
density is less than 25 per hectare. Forestry, Forest Reserves, and Afforestation projects
are the major efforts going on in order to improve the vegetation landscape. Although
Kano state lies in the savanna, the river systems ensure availability of water which has
been tapped for irrigation purposes. The additional agriculture from irrigation activities
increases the potentials of the study area as a manufacturing region.

43
3.1.3 Population and Economic Activities in Kano metropolis
3.1.3.1 Population of Kano metropolis
No settlement in Nigeria can boast of readily available and accurate population figures
and Kano is no exception. As a result, one has to rely on population estimates from
European travellers‟ accounts such as Clapperton (1824), Barth (1857), Staudinger
(1885), Montev (1891) and Robinson (1894). Thus, a look at Table 3.1 shows that while
Kano city was thought to have had a population of about 75,000 inhabitants or more in
the 16th
century, after the city had recovered from a Songhai invasion, it is estimated to
be between 30,000 to 40,000 inhabitants in 1824. Similarly when Henry Barth came to
Kano in 1857 he estimated the population at 30,000 and much later with the visit of C.H.
Robinson in 1894, the estimated population of Kano was given at 100,000.
Table 3.1: Kano‟s population from 16th century to date
Year Source Estimate Spatial Unit
16th century About 75,000 Kano City
1824 Clapperton 30,000 - 40,000 Kano City
1857 Barth About 30,000 Kano City
1894 Robinson About 100,000 Kano City & Fagge
1911 Frishman 1977 39,368 Kano City & Fagge
1933 Frishman 1977 88,458 Urban Kano
1963 Frishman 1977 250,000 Urban Kano
1973 Frishman 1977 322,000 Urban Kano
1991 1991 Census 1,579,721 Kano metropolis
2006 2006 Census About 3 million Kano metropolis
Source: Author‟s compilation from various sources
By the most liberal estimate, urban Kano was not more than half a million in population
in the early 1980s. The dramatic growth not only attracted more population but confirmed

44
Kano as a growth centre in reality as it became firmly set within the ambit of industrial
capitalism. From the 1991 census figures Kano metropolis had a population of at least 1.6
million inhabitants. Today, Kano metropolis has a projected population of about 3 million
inhabitants. Only Lagos can boast of such a population.
3.1.3.2 Commerce
Kano city has always been in the limelight and known to both Arab and European
civilizations. Its fame is usually tied to commerce. Just as the ward (“unguwa” in Hausa)
is the lowest viable spatial unit comprising of several smaller units (“loko” in Hausa) and
with a designated ward head so is the market (“Kasuwa” in Hausa) is a commercial unit
in space with a designated chief (“Sarkin kasuwa) with smaller trading posts under it.
These markets were neatly arranged in space in a fashion Christaller would have been
proud of. The Kurmi market stood at the apex of this arrangement for centuries. Below it
stood markets like the Rimi market and so on down the ladder.
No sooner had Kano been subjugated by the British than colonial trading area was
declared which eventually became the Central Business District (CBD) of urban Kano. It
equaled the Kurmi market in importance, as the go-between in the new colonial
economy, and within ten years the firms in Table 3.2 were located in the CBD. These
were Nigerian, British, German, Levantine, Italian, and French companies.

45
Table 3.2: Commercial firms operating in Kano by the end of 1913
S/No. Names of Establishments
1. The Lagos Stores Limited
2. The Niger Company
3. Tin Areas of Nigeria
4. Paterson-Zochinis Ltd
5. G. L. Gaiser
6. Campagne Francaise Afrique Occidentale (CFAO)
7. John Holt
8. W. B. Maclever
9. John Walker
10. G. B. Olivant
11. John D. Fairley Ltd
12. Ferris George & Brothers
13. Ambrosini and Co.
14. St. Thomas and Co.
15. The Niger Trading Syndicate
16. J. H. Doherty
17. The Nigerian Foodstuff Syndicate
18. London and Kano Trading Company
Source: Bako, (1990:65)
Of course, with the creation of Kano Township other markets sprang up, in addition to
the CBD, especially in non-European units, catering for the needs of their respective
areas. The Sabon Gari market, now officially Abubakar Muhammad Rimi market (AMR
market) was created in 1918 (Bako, 1990:263) much after the CBD was created. The
AMR market, because of its size and the variety of goods it offers, immediately rivals the
Kurmi market and therefore stood at the top of markets in Kano Township as shown in
Figure 3.4.
A lot of restructuring is still going on as observed in Liman & Adamu (2003, pp. 166-
167). One expects the expansion of the CBD by its swallowing up the AMR market.

46
Kurmi market
CBD
AMR market
Specialized markets All-purpose markets
Dawanau market
Kwari market
„Yan Kaba market
„Yan Lemo market
Kofar Ruwa market
Wapa
Gama market
Rimi market
Sharada market
Sheka market
Tarauni market
Tudun wada market
Kofar Wambai market
Ward level
markets
“Loko” level
markets
Figure 3.4: Hierarchy of markets in Kano metropolis
Source: Author‟s compilation
3.1.3.3 Manufacturing industries and industrial estates in Kano metropolis
Very little, if anything, is mentioned of pre-colonial Kano industries. But much of the
commodities taken away from Kano city included leather (the renowned Moroccan
leather), dyed cloths („yan Kura) and plain woven cloths (see Shea, 1974/77; Shea, 1975;
Olukoshi, 1996) and are sufficient proof of the traditional industries that existed
particularly in leather, textiles and dyeing.
Modern industrial activities came with colonial administration. Just as the traditional
dyeing industry was harmful in many ways and so the activity was concentrated in one
place and usually at the outskirts of the city or the ward (“Karofi” in Hausa) so is the

47
modern industrial set-up of the time polluting to the environment by way of its discharge
or noise and so had to be secluded in estates. Economic reasons, in the form of benefits of
agglomeration and economies of scale, also dictate the formation of industrial estates.
Although industries don‟t have to be concentrated in one place any more, Kano
metropolis already has the Bompai, Challawa, Sharada, and Tokarawa industrial estates
which in design could be home to 1,200 industries.
In terms of organization, the Manufacturers‟ Association of Nigeria (MAN) is, so far, the
voice of industrialists in Nigeria. In Kano MAN has an Executive Secretary and two
chairmen managing the two industrial zones. The Bompai Industrial Zone (BIZ) is made
up of the Bompai and Tokarawa (Gunduwawa) industrial estates, including all industries
located outside the estates in the northern parts of Kano metropolis (Dala, Fagge,
Nassarawa, and Tarauni LGAs). The Challawa/Sharada Industrial Zone (CIZ) comprises
the Challawa and Sharada industrial estates, including all industries located outside the
estates in the southern parts of Kano metropolis (Gwale, Kumbotso and Municipal
LGAs). These are shown in Figure 3.5.
The Bompai industrial estate was created in the 1950s (see Bako, 1990; Olukoshi, 1996).
Being the oldest industrial estate in Kano metropolis, it is home to some of the oldest
industries in Kano. The estate is bordered in the south by the northern edge of the CBD,
in the west by Sabon Gari and the Bompai G.R.A in the east. It was so successful that the
Dakata industrial area was planned. However, Dakata industrial estate was only partially
implemented. Thus the newly established industries were considered extensions of the
Bompai industrial area.

48
Kano
Ci ty
Bandar iyo
Kwankw asiyya
Amana
LEG EN D
Main R oads
Rail L ines
Indus tra l E states
Markets
Densely Settled
Mega Projects
7-U p
Challawa
Bom paiTokarawa
Ungogo
Fanis au
Yan M ata
Dorayi
MIN JIBIR LGA
GEZAW A LGA
B/KUD U LGA
D/T OFA
LG A
TOF A
LG A
W AR AW A LGA
MAD OBI LG A
Dan Bare
Ind. Z ones
Pans hekara
Mar ir i
BUK
New site
11.85o
N11.85o
N
12.17o
N
E8.67o
E8.67o
E8.39o
E8.39o
12.17o
N
Figure 3.5: Industrial Estates in Kano metropolis
Source: Extracted from Quickbird Satellite image 2011 of Kano environment
By the second half of the 1970s Kano‟s population and spatial extent was beyond
expectations. There was need for additional industrial estates to provide employment for
the teeming population. The Sharada industrial estates were created then. Phase 1 of the
estate was quickly taken up and there was need for the second phase.

49
The idea of dispersing industrial employments made Kano more vibrant and there was
the need to separate the industries especially those that produced wet effluents. The
Challawa industrial estate (in the south) and Tokarawa industrial estate (in the north)
were created to fulfill these needs. Altogether, the estates add up to 1,200 industrial plots
meaning they could be home to 1,200 industries.
3.1.3.4 Financial services
It is a fact of history that people traded by barter. This worked well when the two parties are
interested in each others‟ goods. Although currency was introduced to solve the problem
arising when only one party is interested in the other‟s goods, it was not without its problems.
How does one come to grips with the different currencies from different clients? Kano‟s
increasing involvement in commercial activities eventually gave birth to the development of
financial services with a currency exchange market registered in space.
Three events are significant in the creation of a currency exchange market in Kano. The first is
to be found in the creation of colonies which segmented the area served by the short- and
long-distance trade zones into different colonies. Thus, for instance, the area served by the
trans-Saharan trade zone became distinctly British and French. Although this event
standardized money it also created formal and informal cross-border trading. But owing to
historical and economic reasons Nigeria, in general, and Kano specifically have operated as
epicenters of extensive market integration from cross-border trade flows in West Africa
(Hashim and Meagher, 1999). Not only did people continue both (especially the informal
cross-border trading), currency exchange outside the bank also boomed.

50
The second event is related to the Annual pilgrimage to Mecca (the Hajj) which became a
feature of West Africa since the introduction of Islam in the region. However with
colonization and the subsequent introduction of motorized transport, Hajj operation took a
new turn especially with the formation in 1948 of the West African Pilgrims Agency (WAPA)
operating in Kano to make provision for Muslim pilgrims‟ financial arrangement (Hanga,
1999; Hashim and Meagher, 1999). It was not by accident that WAPA was located in Fagge,
an area that has been historically and intimately linked with the development of informal
cross-border trading networks (in this case, the trans-Saharan trade). Even though WAPA now
ceases to exist, the area of Fagge where financial exchange services take place is known as
Wapa.
The third event is the extensive and comprehensive financial sector reforms as a result of
the introduction of SAP in the country. It started with the establishment of a two-tier
foreign exchange market in 1986. Government controlled the first-tier while the second-
tier was market-determined. The former was eliminated in 1987 leaving single-tier
market determined foreign exchange market. To enlarge the formal foreign exchange
market the three players (Banks, Government, and the Informal financial operators) were
merged as Bureau de Change in 1989. Banks were also allowed to open foreign currency
denominated accounts (domiciliary accounts) for individuals and institutions. Also, The
People‟s Bank with branches across the country was introduced in 1989.
In 1991 the Nigeria Deposit Insurance Corporation (NDIC), and Community Banks were
established while the Nigeria Export Import Bank (NEXIM) began operations the same

51
year. “Finance companies which predated the reforms but existed in the informal
financial market gained recognition” (Hashim and Meagher, 1999:9) the same year and
were licensed. Although “the main thrust of the foreign exchange markets and institutions
created under SAP reforms is the elimination of the informal currency markets such as
Wapa” (Hashim and Meagre, 1999:10) the reverse happened. Wapa today remains visibly
transformed as a result of growth in the volume of transactions as well as increase in the
diversity of currencies traded.
3.1.3.5 Transport
The complex travel demands of Kano in the various stages of its growth have been
catered for in different ways. Throughout its pre-colonial days travel within Kano or
between Kano and other settlements was either on foot or animals (horses and camels).
The European trading companies that came before British colonial administration
introduced steam ships on the Niger and Benue waterways but this did not affect Kano
much. It was the link between Kano and Baro by rail in 1911 and subsequently between
Kano and Lagos in 1912 that dramatically affected Kano. The rail extension from Kano
to Nguru in 1930 only further consolidated Kano as an economic centre of the former
Northern Region. Within Kano metropolis, however, railway sidings were developed,
first to service the fledgling CBD and the groundnut evacuation centre around Kofar
Mazugal and later, to service the new industrial area in Bompai. Indeed, it is not by
accident that later industrial developments (Sharada and Challawa) were located along
the railway transport spine that traversed Kano.

52
A Royal Air Force airfield created in 1936 to cater for the West Africa Frontier Force
(WAFF) eventually grew to a full-fledge airport and later renamed Mallam Aminu Kano
International Airport (MAKIA) making it the oldest airport in Nigeria. After the 2nd
world war it became the centre for the airlift of Muslim pilgrims from all over West
Africa. It is now used for military purposes as well as for international and domestic
flights.
Although modern road development was introduced much later than rail and air
transports it is more comprehensive in its coverage. Road transport linkage between Kano
and other settlements in Nigeria and Niger also contributed to Kano‟s position as an
economic centre. Although the present-day Kano state no longer shares borders with
Niger Republic it has direct road link (not through another state capital) to that country
through at least two routes. Notable among these are Dambatta–Kazaure–Daura, and
Minjibir–Babura routes.
Kano is similarly directly connected by road (without passing through another state
capital) to Bauchi, Gombe, Jigawa, Kaduna, Katsina, Plateau, Yobe, and Zamfara states.
Notable routes include:
Wudil-Birnin Kudu-Ningi-Bauchi,
Wudil-Birnin Kudu-Darazo-Gombe,
Wudil-Birnin Kudu- Darazo-Damaturu,
Wudil-Gaya-Dutse.
Bichi-Kankiya-Katsina,
Gwarzo-Malumfashi-Funtua-Gusau,
53
Kura-Kwanan Dangora-Zaria-Kaduna, and
Kura-Bagauda-Tudun Wada-Saminaka-Jos.
Together, these connections make Kano very accessible and a focal point in Nigeria.
Of equal importance is the available transport within the Kano region (Kano and Jigawa
states), Kano State, and Kano metropolis. There are road links to all Local Government
Area (LGA) headquarters in the Kano region with only a very few LGAs connected by
rail courtesy of the Kano-Nguru rail extension (Isa and Liman, 2014). As a result of the
road links commercial transport services, on a daily basis, have evolved catering for the
transportation of people and goods within the region. Thus, commercial transport services
are also available to all LGA headquarters in Kano State. Rail service within the region is
still erratic.
Commercial transport service within Kano metropolis also evolved gradually and, in part,
as a complement to other transport modes linking Kano with the wider world. As a result
of the introduction of the rail and air services came the need for transport from the spatial
receptacles created by them (railway station and airport) to destinations in Kano
metropolis. Taxi services began in response to these demands and later evolved to cover
wider areas of the metropolis. Bus services began as a link with the AMR market and the
Bompai industrial area and later evolved to cover wider areas of the metropolis (for
details see Isa and Liman, 2014). The need for door-to-door transport service coupled
with the inaccessibility of many areas in the metropolis due to rapid and uncontrolled
development gave birth to the “Achaba” (two-wheel motor cycle service) but is currently

54
stopped due to security reasons. In its place came the safer and more acceptable “a
daidaita sahu” (three-wheel motor cycle service).
A radical transport development is going on introducing over-head bridges and under-
passes at strategic places in the metropolis in addition to the dualised roads and the
introduction of formal bus system and light rails in the metropolis. These would make the
metropolis more vibrant as activities would flow faster to create a new urban rhythm.
3.2 RESEARCH METHODS
3.2.1 Research Design
This research is an attempt at advancing fundamental knowledge of industrial
development in a metropolis situated in a largely agrarian region. It is a basic research
and explanatory in nature (Neuman, 2003:23 & 29) rooted in the positivist approach that
sees social science as “an organized method for combining deductive logic with precise
empirical observations of individual behaviour in order to discover and confirm a set of
probabilistic causal laws that can be used to predict general patterns of human activity”
(Neuman, 2003:71). The research employs the survey approach (Bryman, 2004) and the
industrial establishment is the unit of analysis.
The first stage involved data collection about industries at two levels. The first level
involved data collected from national and state sources. Such general data collected at
this level form the baseline data for this study. The second level involved data collected
at individual industry level from documented sources to determine the industry groupings

55
using the ISIC codes (in line with Table 2.1). One key purpose of the codes is to
standardize data collection and promote international comparability.
The second stage was devoted to the conduct of the survey proper which involved the
collection and collation of data for subsequent analysis to achieve the remaining
objectives of the study. Descriptive statistics were used to summarize the data and some
of the results were illustrated with maps and diagrams.
3.2.2 Types and Sources of Data
In order to achieve the stated objectives of this study data were derived from secondary
or documentary and primary sources. This study is interested in both functioning and
closed manufacturing industries in Kano metropolis.
3.2.2.1 Documentary Sources
Data from this secondary source formed the baseline information from which subsequent
primary data collection and analyses were derived. Documented data remain useful as
available records on surviving and closed industries which complement primary data.
Such documented data was collected from three broad sources. The first is the Industrial
Directory of the Federal Republic of Nigeria (2005) which contains a listing of industries
in all states of the federation. From the listing for Kano state 118 industries were
supposed to be located in Kano metropolis. The second source is from records kept by the
Manufacturers Association of Nigeria (MAN), as well as its publications (at the national
and state levels). Information from these sources (such as year of establishment, year

56
industry closed, products manufactured, ownership etc) was used to update the data so
collected from the first secondary source. Although membership of MAN is voluntary the
association has 337 industries registered. Some industries have registered with MAN and
so are captured in MAN‟s publications and at the same time have registered with the
Industrial Directory. Other industries only registered with either MAN or the Industrial
Directory. Thus, out of the 118 industries picked out from the Industrial Directory, 75 are
also captured in MAN‟s publications leaving out 44.
The third secondary sources included data acquired from libraries, the Internet, as well as
any other spatial and attribute data on industrial estates (cadastral maps & satellite images
of study area) in Kano metropolis. In particular, the Internet remains an important source
on the ISIC codes. MAN uses divisions from ISIC revision 2 codes (first published 1968)
while the Industrial Directory of Nigeria (2005) uses classes from ISIC revision 3 Codes
(first published 1989). This study adopts ISIC revision 4, which is the most current
classification scheme. Collectively data from these sources provided the background
information on industries in Nigeria generally and Kano metropolis in particular. In
addition, they state the condition of the industries (whether closed, comatose, or
surviving) and enabled the determination of the industry groups.
3.2.1.2 Primary Data Source
The primary data used in this study were derived through the administration of structured
questionnaire on owners of industrial plants (or their appointed representatives) and the
conduct of personal interviews. Data sought through this medium included additional

57
background information on the firm, data on the input-output structure, ownership
structure, and product structure of the firms (see Appendix I). Some of the data derived
directly from industries in the study area such as line of activity, location, year of
establishment and status of establishments (single plant, branch plant, or subsidiary plant)
only served to complement information already collected from documented sources
earlier mentioned.
Data on raw material source (within Kano, within Nigeria, Outside Nigeria), types of raw
materials (primary, processed, and manufactured), labour force (management, skilled,
unskilled, foreign, indigenous, male, female), operating cost, raw material cost, labour
cost, land costs, as well as input costs (as a % of total cost of production), and line of
activity form the basis of an examination of the input-output structure of industries in
Kano metropolis. While the product type (consumer, intermediate, capital goods) forms
the basis of an examination of the product structure, ownership types (foreign,
indigenous, government, joint) form the basis of an examination of the ownership
structure of industries in Kano metropolis.
Location (which estate an establishment is found), access to land (direct government
allocation, leased from someone), and available infrastructure (water, electricity, banking,
health, telephone, postal) together form the basis of an examination of the spatial
structure of industries in Kano metropolis.

58
3.2.3 Sampling and Administration of Research Instruments
Conventionally, industrial development in Kano metropolis had been carried out in
industrial estates. Now there is growing freedom for industries such as the Seven-up
Bottling Company along Zaria Road, and at one time on the outskirts of Kano metropolis,
to locate where they so choose. The industrial estates did not come about at the same time
and so some are as a result of the pressure of demand for industrial plots at the height of
the industrial developments in Kano metropolis. The industries located in the industrial
estates and those outside but in Kano metropolis (whether surviving or closed) together
make up the sampling frame.
Looking at Kano Urban Planning and Development Agency (KNUPDA) layout plans of
industrial estates in Kano metropolis it is easy to conclude that there are 1,200 industries
in Kano metropolis (Liman, 2011, Table 2, p.16). For some reasons, most industries
occupy more than one industrial plot! Then again, a few industries had located there
(bought farmlands and registered their holdings) before the entire area was regularized as
an industrial estate. At any rate, industrial landmarks of Kano in 1994 indicate 216
industries (Ajayi, 2007:147). As a result, rather than accommodate 1,200 industries, the
industrial estates accommodate only 337 industries. Together with the 44 industries
located outside the estates there are 381 industries (whether closed or working) in Kano
metropolis (Table 3.3).
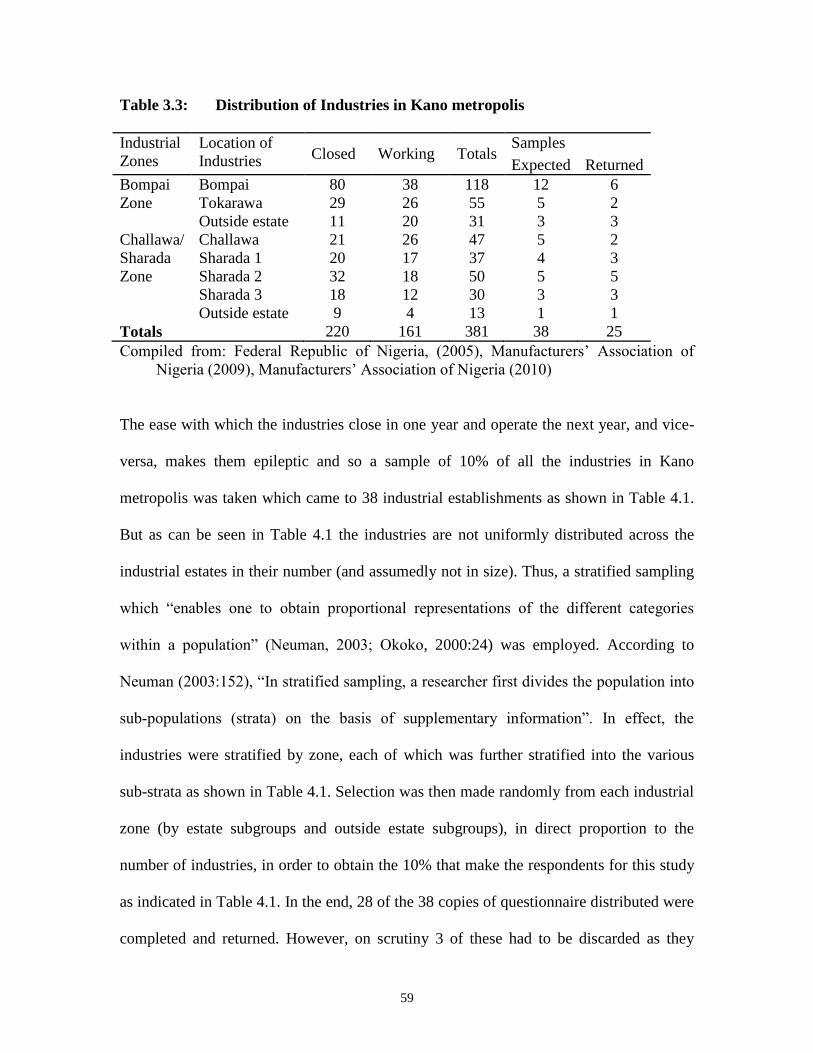
59
Table 3.3: Distribution of Industries in Kano metropolis
Industrial
Zones
Location of
Industries Closed Working Totals
Samples
Expected Returned
Bompai
Zone
Bompai
Tokarawa
Outside estate
80
29
11
38
26
20
118
55
31
12
5
3
6
2
3
Challawa/
Sharada
Zone
Challawa
Sharada 1
Sharada 2
Sharada 3
Outside estate
21
20
32
18
9
26
17
18
12
4
47
37
50
30
13
5
4
5
3
1
2
3
5
3
1
Totals 220 161 381 38 25
Compiled from: Federal Republic of Nigeria, (2005), Manufacturers‟ Association of
Nigeria (2009), Manufacturers‟ Association of Nigeria (2010)
The ease with which the industries close in one year and operate the next year, and vice-
versa, makes them epileptic and so a sample of 10% of all the industries in Kano
metropolis was taken which came to 38 industrial establishments as shown in Table 4.1.
But as can be seen in Table 4.1 the industries are not uniformly distributed across the
industrial estates in their number (and assumedly not in size). Thus, a stratified sampling
which “enables one to obtain proportional representations of the different categories
within a population” (Neuman, 2003; Okoko, 2000:24) was employed. According to
Neuman (2003:152), “In stratified sampling, a researcher first divides the population into
subpopulations (strata) on the basis of supplementary information”. In effect, the
industries were stratified by zone, each of which was further stratified into the various
sub-strata as shown in Table 4.1. Selection was then made randomly from each industrial
zone (by estate subgroups and outside estate subgroups), in direct proportion to the
number of industries, in order to obtain the 10% that make the respondents for this study
as indicated in Table 4.1. In the end, 28 of the 38 copies of questionnaire distributed were
completed and returned. However, on scrutiny 3 of these had to be discarded as they
60
contained little or no data and therefore impossible to use them. The 25 completed copies
of questionnaire received (10 from BIZ and 15 from CIZ) changed the confidence level to
19% and represent an acceptable success rate of 65.8%.
The data gathered generally focus on
1. background and general information on industries that tell how well they are doing.
2. input factors such as raw materials, labour, costs, and infrastructure
3. output of industries that enable a categorization of the industries into industry groups
(using a 4-digit ISIC code), their production capacity as well as product linkages
4. perceptions of the industries regarding the relative importance of the three factors to
their activities
5. industries‟ self-assessment on steps being taken to survive
3.2.4 Methods of Data Analysis
3.2.4.1 General Descriptive Statistics
The data collected from the survey was analysed using a number of statistical techniques
while recognizing the different levels of analyses at the same time. The analyses at the
metropolitan level was sectoral and aggregative. In other words, both existing and closed
industries were grouped according to the ISIC code (objective 1) and analyzed according
to industry groups. The Minitab 15 statistical package was used for the analysis of means
(ANOM) while the SPSS package was used for all other calculations and statistical
analysis throughout this work.
61
This is followed by an examination of the macroeconomic policies operating in Kano
metropolis and specific policy instruments affecting individual industries. Together, they
give an indication of the contributions of macroeconomic factors to industrial
development in Kano metropolis or otherwise. Subjecting the above to the Analysis of
Means (ANOM) indicates whether the introduction of SAP has effect on industrial
performance in Kano metropolis (objective 2).
The analysis at the individual industry group level mainly involved descriptive statistics
that focused on the characteristics of the industries, analysis of the input factors, analysis
of the outputs (the capacity to produce and the actual production) and perception analysis
(of the relative importance of endowment factors and infrastructure to the industries).
These reveal the structure of the industries as well as the linkages between existing
industries in Kano metropolis. Together with the number of collapsed industries an
analysis of the outputs and production capacity, establish the fact of poor industrial
performance in Kano metropolis.
Further analysis of the production capacity and the actual industrial production over the
years an industry has been in production tell a story of how the industry has been faring.
At this stage the input-output structure matrix showing the origin and destination of the
output of each industry (i.e. who produces what, with what input and used by whom)
reveal the linkages between existing industries in Kano metropolis and outside. The
input-output structure matrix assumes that the product of an industry is either consumed
by it, another industry or to the final consumers (government, households, or export).

62
This is complemented by an analysis of the capacity utilization of respondent industries
in Kano metropolis.
In effect, this analysis reveals
a) the nature, strength and direction of inter-industry linkages by showing the extent to
which the industries in Kano metropolis depend on each other, or other industries in
the country and sources outside the country.
b) How industries are struggling to re-invent themselves in the face of the various
factors affecting them.
3.2.4.2 Likert-type Scale
A Likert-type scale was employed to measure perceptions of industrist to a number of
factor items. The average of the scores on a particular factor item divided by the total
possible scores indicates the strength of the factor item in question. Similarly, the Likert-
type scale was used in Endogenous Factor Scoring to determine the entrepreneurship of
the individual industries.
3.2.4.3 Test of Hypotheses I and II
Hypotheses one and two were tested using ANOM. The ANOM provides a “confidence
interval type of approach” and is “more sensitive than a chi-square test in detecting a few
extreme deviations from the average” (Ryan, 2011:594). It allows one to determine
which, if any, of the identified groups has a mean significantly different from the overall
average of all the group means combined. Although initially used for means, target

63
values, and Factorial designs it is now applied to proportions and count data (Ryan,
2011). Thus, the main advantages of ANOM are that if any of the treatments are
statistically different it indicates exactly which ones are different and in a graphical form
(Balakrishnan, 2013): as a matter of fact, both the magnitude and the direction of the
effects are easily discernible from the plots. For count data the decision lines are obtained
from
c h ,k, ck
k 1
Where
c is the average of k “counts” (e.g. number of closures)
For a given value of (0.05 in this study), h ,k, is obtained with the use of
Nelson’s h statistic which is a table of critical values (see Appendix II)
3.2.4.4 Test of Hypothesis III
The third hypothesis was tested using a 3-way Analysis of Variance (ANOVA), a
technique useful in situations where there are more than two arithmetic means to compare
in order to assess the contribution made by each separate factor to the total variability of a
set of data. Generally, this is symbolically represented as follows:
N
XX i
S
2_
2
This, in a 3-way ANOVA (factorial analysis of variance) is decomposed to
SST = SSR + SSC + SSL + SSRC + SSRL + SSCL + SSRCL + SSW (Sambo, 2008, pp.
474 -502).

64
Thus, the row sum of squares plus the column sum of squares plus the layer sum of
squares plus the interaction effect (row-col, row-lay, col-lay, and row, column and layer)
plus the sum of squares within together make up the total sum of squares. The approach
involves deriving the F-ratio to compare the mean values from the three different factors
by testing the following hypotheses:
H0rc : µ.rc. – µ.r.. - µ.c. + µ = 0 --- for Endogenous factors
H0rl : µ.r.l – µ.r.. - µ..l + µ = 0 --- for Endowment factors
H0cl : µ.cl – µ.c. - µ..l + µ = 0 --- for Macroeconomic factors
H0rcl : µ.rcl. – µ.rc. - µ.rl - µ.cl + µ.r.. + µ.c. + µ..l - µ = 0
Labour costs; managerial costs; raw materials costs; generating set & fuel costs; costs of
water supply; security costs; installed capacity of industry; current production capacity;
transport for employees are the variables to be used as endogenous factors in this
analysis.
The variables to be used as endowment factors in this analysis include quantity of
material inputs from industries located in Kano; quantity of material inputs from
elsewhere in Nigeria; water; and labour while electricity; taxes; foreign exchange costs;
interest rates; and import duty are the variables to be used as macroeconomic factors in
this analysis.

65
CHAPTER FOUR
INDUSTRIAL GROWTH IN KANO METROPOLIS AND
THEIR ISIC GROUPINGS
4.1 INTRODUCTION
This chapter, and the next, is about processes known as layering (industrial mix, or mix of
firms or firm population dynamics), conversion, and recombination in Path Dependence.
Layering refers to the changing mix whereby additional industries are created or added to
the existing pool either as spin-offs of the existing industries or as new ventures.
Conversion refers to the ongoing innovation by firms - in terms of new products,
techniques, business organisation and the like – in response to market opportunities,
competitive pressures, knowledge spillovers and similar stimuli (such as macroeconomic
policy provisions). Layering and conversion processes frequently co-exist and interact. In
Recombination the idea is that any structure is in effect a system of resources and
properties that can be recombined and redefined, in conjunction with new resources and
properties, to produce a new structure. In effect, options not taken become „paths not taken‟
that can serve as resources of knowledge, experience and competences that, under certain
circumstances, can be redeployed or rejuvenated to support alternative developments (see
Martin, 2009:21-25).
The analysis in terms of the industrial mix reveals the dynamics and is focused on
establishment of industries, distribution of the industries, their ownership as well as their
nature by ISIC code divisions and classes. These distributions in pre-SAP and SAP periods

66
show how industries in Kano metropolis in particular are affected by the macroeconomic
policies operating in the country.
4.2 NATURE OF INDUSTRIES IN KANO METROPOLIS
4.2.1 Establishment of Industries in Kano metropolis
The establishment of industries in Kano metropolis dated back to the 1940s with P. S.
Mandrides as the only industry on ground. W. J. Bush & Co. Ltd. and Northern
Enamelware Co. Ltd. were later established in the 1950s. By the end of the Nigerian Civil
War 4.5% of the industries had been established.
Table 4.1: Establishment of Industries in Kano metropolis
Location of
Industries
1940s
1950s
1960s
1970s
1980s
1990s
2000s
2010s
ni Totals
Bompai
Tokarawa
Outside estate
1
0
0
2
0
0
11
0
0
30
8
4
30
17
8
30
18
12
12
10
6
0
0
0
2
2
0
118
55
30
Challawa
Sharada 1
Sharada 2
Sharada 3
Outside estate
0
0
0
0
0
0
0
0
0
0
1
1
1
0
0
4
9
9
3
4
12
5
7
11
1
15
10
13
10
6
11
3
4
2
2
0
0
1
0
0
4
9
16
4
0
47
37
51
30
13
Totals 1 2 14 71 91 114 50 1 37 381
Key: ni = not indicated
Source: Fieldwork, 2012
The oil boom of the 1970s marks the beginning of the period of dramatic growth as can be
seen in Table 4.1. This started with the establishment of additional 18.6% of the industries
which was followed by another 23.8% in the 1980s. The peak was reached in the 1990s
with the addition of 29.9% of the industries which brought the number of industries

67
established in Kano metropolis then to 293. In the 2000s 13.1% of the industries were
established and another 0.3% was added in the 2010s. The years when 9.7% of the
industries were established could not be ascertained by this writer.
4.2.2 ISIC (revision 4) Classification of Industries in Kano metropolis
Classification of the industries in Kano metropolis into the ISIC (revision 4) codes was
done based on their outputs. On this basis, 0.5% of the establishments located on the estates
do not belong to category C and therefore are not manufacturing industries (see Appendix
III). An additional 6.3% of the industries could not be properly classified because of
incomplete information to enable a determination of their divisions and/or classes. The
remaining 93.2% of the industries are classified into 20 out of the 24 divisions of ISIC
(Revision 4) as in Table 4.2
Division 22 (Manufacture of rubber and plastics products), ranks highest, accounting for
20.7% of industries in Kano, followed by division 10 (Manufacture of food products)
accounting for 11.3% and division 15 (Manufacture of leather and related products)
accounting for 10.2%.
The divisions not found in Kano metropolis include manufacture of tobacco products
(division 11); wearing apparels (division 14); wood and products of wood and cork (except
furniture), straw and plaiting materials (division 16); and repair and installation of
machinery and equipment (division 33). (See details of the various ISIC (revision 4)
divisions, groups, and classes in Appendix IV).

68
Table 4.2: ISIC (Revision 4) Codes for Industries in Kano Metropolis
D
ivis
ions
Bompai Zone Challawa/Sharada Zone
Tota
ls
Industrial Mix
Bom
pai
Tokar
awa
Not
on
Est
ate
Chal
law
a
Shar
ada
1
Shar
ada
2
Shar
ada
3
Not
on
Est
ate ISIC Code
(Revision 4)
Classes Ratio
10 17 6 2 2 4 7 4 1 43
1010; 1040; 1061;
1071; 1072; 1073;
1079, 1080; 10xx
9:14
11 1 0 0 3 2 1 0 2 9 1103; 1104 2:4
13 16 1 2 2 0 3 1 0 25 1311; 1312; 1391;
1392; 1393; 1399 6:8
15 4 5 0 18 5 3 5 0 40 1511; 1520 2:3
17 6 1 2 1 1 2 1 1 15 1701; 1702; 1709 3:3
18 5 1 5 0 2 0 0 1 14 1811 1:3
19 2 0 0 1 0 0 1 0 4 1920 1:2
20 11 3 5 2 3 0 2 0 26 2012; 2013; 2021;
2022; 2023; 2029 6:8
21 4 2 1 0 0 0 0 2 9 2100 1:1
22 22 13 4 8 11 12 8 1 79 2211; 2219; 2220 3:3
23 2 0 0 2 0 4 1 0 9 2310; 2391; 2393;
2395 4:8
24 4 4 0 1 0 2 1 0 12 2410; 2420; 24xx 3:4
25 4 3 0 2 3 4 1 0 17 2511; 2512; 2592;
2599 4:8
26 0 0 0 0 0 1 0 0 1 2610 1:9
27 0 1 0 2 0 1 1 0 5 2720; 2732 2:8
28 0 1 1 2 1 2 0 2 9 2817; 2821; 2829;
28xx 4:16
29 6 1 1 0 2 0 0 1 11 2910; 2920; 2930 3:3
30 1 3 4 0 0 0 0 0 8 3091; 3092 2:8
31 5 3 1 1 3 2 2 0 17 3100; 1:1
32 0 0 1 0 0 0 0 1 2 3250 1:7
Totals 110 48 27 47 36 44 28 12 355
Source: Fieldwork, 2012

69
Some industries produce more than one product such as in the manufacture of vegetable
and animal oils and fats (class 1040) and at the same time animal feeds (class 1080). There
are others whose products do not belong in the same division and these, (6 industries) are,
all the same, classified into the first of the two divisions they belong to as shown in Table
4.2 and distributed according to the zones and estates they are found.
4.2.3 Industrial Mix in Kano metropolis
There are, in addition, other industries accounting for 1.0% (2 in Div 10, 1 in Div 24, and
another 1 in Div 28) that could not be classified beyond the division level due to
insufficient data on them. These are denoted by “xx” as the last two digits in Table 4.2.
Nonetheless, a picture of the industrial mix emerges showing areas of strengths and
weaknesses. The column labeled “Ratio” shows the number of classes found in Kano
metropolis on the left against the total number of classes in the division. Thus, for instance,
although manufacture of food products ranks second in numbers it is weak in product mix
with only 64.3% of the classes established. Other more glaring cases include manufacture
of other non-metallic mineral products (Division 23), manufacture of electrical equipment
(Division 27), manufacture of machinery and equipment – not covered elsewhere (Division
28), manufacture of other transport equipment (Division 30), and other manufacturing
(Division 32).
Some of the principles of industrialism could not be applied to the data in hand due to
insufficient details. However, the weakness of the industrial mix in Kano metropolis is
better seen in terms of the principles of concentration and maximization which together
require fewer but larger industrial formations. Looking at Table 4.2 still, one finds that, on

70
the one hand all the industry classes of divisions 17, 21, 22, 29, and 31 are found in Kano
metropolis. On the other hand, there is only 1 industry class for Divisions 21 and 31 with
17 industries in the latter competing with each other. Divisions 17, 22 and 29 have 3
classes each and 15, 79, and 11 industries respectively. Each of these five divisions (17, 21,
22, 29, 31) could have been more efficient with far less number of industries.
Indeed, some of the industry classes for the remaining divisions are not to be found in
Kano metropolis. Despite this lack of spread, with the exception of divisions 19, 26 and 32,
all the others suffer from the kind of over-capacity mentioned above. Although
competition is a necessary feature of capitalism, unnecessary or needless competition is
counter-productive.
In Kano metropolis only 4 industry divisions (manufacture of food products, leather and
related products, rubber and plastic products, and furniture) can be said to be about
normally distributed spatially. In fact, on the one hand, there is over capacity for
manufacture of food products and therefore a need to cut down the number of industries or
diversify them. On the other hand, the distribution of manufacture of leather and related
products, and rubber and plastic products is skewed in favour of Challawa/Sharada zone.
While it is a deliberate policy in terms of leather and related products, there is no such
policy on rubber and plastic.
4.2.4 Ownership pattern of Industries
The industries in Kano metropolis can be classified by ownership as can be seen in Table
4.3. The majority of industries - 79.3% – are owned by individuals. However, while 33.9%

71
of the industries belong to individual Nigerians 45.4% belong to individual foreigners. The
latter is dominated by Lebanese who account for 33.3% followed by the Chinese (5.5%),
Indians (4.2%), the Sudanese (1.6%) while British, Italian, and Pakistani ownership
accounts for 0.3% each.
Table 4.3: Ownership of Industries in Kano Metropolis 1940 to 2010
Location of
Industries
Kan
o
Sta
te
Indiv
idu
al
Nig
eria
ns
Indiv
idu
al
Fore
igner
s
Nig
eria
ns/
Nig
eria
ns
Mult
i-
Nat
ional
s
Nig
eria
ns/
Fore
igner
s
ni Tota
ls
Bompai
Tokarawa
Outside estate
0
0
0
32
15
19
67
29
4
1
0
0
1
0
0
3
2
1
14
9
7
118
55
31
Challawa
Sharada 1
Sharada 2
Sharada 3
Outside estate
0
0
1
1
0
16
17
11
11
8
22
11
26
13
1
0
0
1
0
0
1
0
0
0
1
1
1
2
4
1
7
8
9
1
2
47
37
50
30
13
Totals 2 129 173 2 3 15 57 381
Source: Fieldwork, 2012
Industries that are jointly owned - 5.2% – are made up of 0.5% industries jointly owned by
groups of Nigerians, 0.8% of industries owned by multinational organizations, and 3.9%
industries jointly owned by a group of Nigerians and foreigners. The latter is again
dominated by the 2.6% industries in Nigerians/Lebanese ownership followed by 0.5%
industries in Nigerians/Indians ownership, and 1 0.3% industry each in Nigerians/German,
Nigerians/Ghanaian, and Nigerians/USA ownership.

72
Only 0.5% of the industries are in Government ownership although ownerships of 15% of
the industries were not indicated. Therefore, the industrial manufacturing sector in Kano
metropolis is dominated by foreign-owned firms and not necessarily transnational firms as
held by Egbon (1995:vi).
4.3 EFFECT OF MACROECONOMIC POLICIES ON INDUSTRIAL
PERFORMANCE IN KANO METROPOLIS
The effects of Nigeria‟s macroeconomic policies on industrial development in Kano
metropolis can best be seen in terms of what happened in pre-SAP and SAP periods. These
are viewed in terms of establishments and closures of industries, industrial mix, and
ownership.
4.3.1 Establishments and closures of industries in Kano metropolis
The SAP period remains unique as can be seen in Table 4.4 which shows the paradox of
Establishments and Closures of industries in Kano metropolis where 34.6% of the
industries were established in pre-SAP days and 55.6% were established during the SAP
period. Similarly, only 0.3% experienced closure in pre-SAP days while 57.5%
experienced closure during SAP! That SAP accounts for the highest births and closure
remains unique to Nigeria and suggests other equally, if not more, important factors at play.
For instance, there are claims that with the introduction of SAP establishing manufacturing
industries was one of the few ways of getting foreign exchange and some industries were
established to get foreign currency at government rate which were sold in the parallel
market at profit rates (see Olukoshi, 1996). Thus, many Nigerian entrepreneurs only take

73
advantage of government policies that make access to resources (land, foreign exchange, or
inputs) easier, which they divert to uses other than what they were approved to be used for.
Table 4.4: Establishments and closures of industries in Kano metropolis 1940 to
2010
Industries
Established Bom
pai
Tokar
awa
Not
on
Est
ate
Chal
law
a
Shar
ada
1
Shar
ada
2
Shar
ada
3
Not
on
Est
ate
Tota
l
1940 – 1969 14 0 0 1 1 1 0 0 17
1970 – 1984 48 14 4 12 11 12 9 5 115
1985 – 2010 54 39 26 30 16 22 17 8 212
Not indicated 2 2 0 4 9 16 4 0 37
TOTAL 118 55 30 47 37 51 30 13 381
Closures
1970 – 1984 0 0 0 0 0 1 0 0 1
1985 – 2010 80 29 11 19 16 19 12 9 195
Not indicated 0 0 0 2 4 12 6 0 24
TOTAL 80 29 11 21 20 32 18 9 220
Source: Fieldwork, 2012
Table 4.5 presents industry closures and survivals in terms of the ISIC code divisions of the
industries. A cursory look through the table reveals that 65% of the industries have higher
number of closed industries than functioning ones. Secondly, the number of closed rubber
and plastics industries is greater than the totals (closed and working) of the other industries
except Food products (division 10) and Leather and leather products (division 15). Thirdly,
of all the industry groups with a total of 19 or greater only division 22 (manufacture of
rubber and plastics) has more industries functioning than those closed. All these either
suggest the use of industries for acquiring foreign exchange at government rate as
suggested above and/or over-capacity and unnecessary competition.

74
Table 4.5: Status of Industries in Kano Metropolis by their ISIC Codes (Revision 4)
Source: Fieldwork, 2012
ISIC
Divisions
Industry Classes Closed Industry Classes Working Totals
Classes No. Classes No.
10 1010; 1050; 1061; 1071
1072; 1073; 10xx 31
1040; 1061; 1073;
1079; 12 43
11 1103; 1104 6 1104; 3 9
13 1311;
15
1311; 1312; 1391; 1392;
1393; 1399 10 25
15 1511; 1520 21 1511; 1520; 19 40
17 1701; 1709 8 1701; 1702; 1709; 7 15
18 1811 4 1811; 10 14
19 1920; 1 1920; 3 4
20 2012; 2013; 2021;
2022; 2023; 2029 15
2012; 2013; 2021;
2023; 11 26
21 2100 3 2100; 6 9
22 2211; 2220 37 2219; 2220; 42 79
23 2310; 2391; 2393;
2395 6
2395; 3 9
24 2410; 2420; 24xx 7 2410; 2420; 5 12
25 2512; 2599; 13 2511; 2512; 2592; 4 17
26 - 0 2610 1 1
27 2720; 2732 3 2710; 2732; 2 5
28 2817; 2821; 2829;
28xx 6
2821; 2822; 3 9
29 2910; 2930 6 2910; 2920; 2930; 5 11
30 3092 2 3091; 3092; 6 8
31 3100; 12 3100; 5 17
32 3250 2 - 0 2
Sub-Totals 198 157 355
Unclassified 99xx 22 99xx 2 24
Not
Industries - 0 2 2
Totals 220 161 381

75
4.3.2 Industrial mix in Kano metropolis by Macroeconomic Policy Periods
One other important thing about the distribution of manufacturing industries in Kano
metropolis is the period when the different classes of the same group of industries emerged
thereby giving an idea of the progress made in those categories of industries. Indeed,
Industrial mix in Kano metropolis is also governed by pre-SAP policies and SAP policies.
Thus, Table 4.6 reveals that 5 divisions (13, 17, 23, 24, and 26) have benefited more from
the pre-SAP policies (i.e 1970 – 1984), while 13 divisions (10, 15, 18, 19, 20, 21, 22, 25,
27, 28, 30, 31, and 32) have benefited more from the SAP policies (i.e 1985 – 2010). The
new industrial classes added are underlined and in bold while the column “pre-SAP/SAP
ratio” shows that except for Food products (division 10) where two additional classes
emerged all the others can only boast of an increase of one class, if at all. Thus, the SAP
period is slightly better than the preceding period as it has added no less than 10 new
industrial classes.
However, on comparison between Tables 4.5 and 4.6 only 5 divisions have higher number
of industries working than closed and 7 out of 10 of the new industrial classes have closed.
In addition to confirming (as Table 4.4 shows) that there is more change in overall numbers
than in the addition of classes the fact that all the class “xx” emerged during SAP period
lends credence to the thinking that much of the growth in this period is unrelated to
manufacturing activities as suggested earlier.
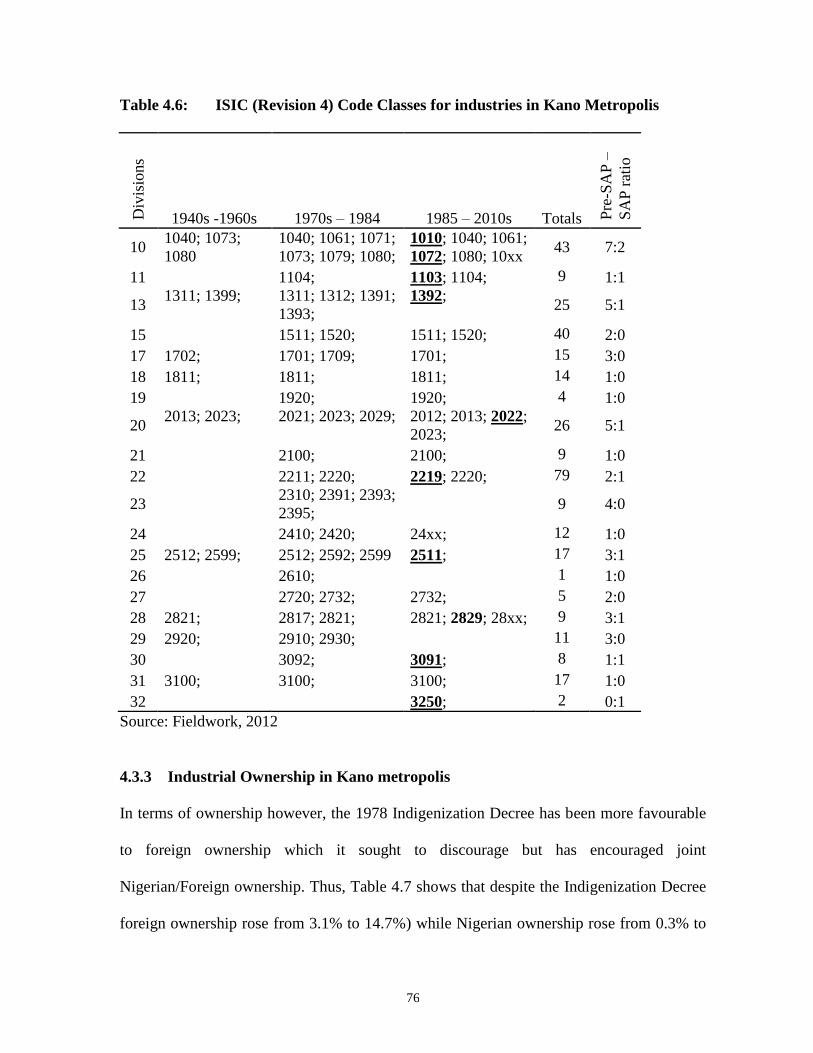
76
Table 4.6: ISIC (Revision 4) Code Classes for industries in Kano Metropolis
D
ivis
ions
1940s -1960s 1970s – 1984 1985 – 2010s Totals Pre
-SA
P –
SA
P r
atio
10 1040; 1073;
1080
1040; 1061; 1071;
1073; 1079; 1080;
1010; 1040; 1061;
1072; 1080; 10xx 43 7:2
11 1104; 1103; 1104; 9 1:1
13 1311; 1399;
1311; 1312; 1391;
1393;
1392;
25 5:1
15 1511; 1520; 1511; 1520; 40 2:0
17 1702; 1701; 1709; 1701; 15 3:0
18 1811; 1811; 1811; 14 1:0
19 1920; 1920; 4 1:0
20 2013; 2023;
2021; 2023; 2029;
2012; 2013; 2022;
2023; 26 5:1
21 2100; 2100; 9 1:0
22 2211; 2220; 2219; 2220; 79 2:1
23
2310; 2391; 2393;
2395; 9 4:0
24 2410; 2420; 24xx; 12 1:0
25 2512; 2599; 2512; 2592; 2599 2511; 17 3:1
26 2610; 1 1:0
27 2720; 2732; 2732; 5 2:0
28 2821; 2817; 2821; 2821; 2829; 28xx; 9 3:1
29 2920; 2910; 2930; 11 3:0
30 3092; 3091; 8 1:1
31 3100; 3100; 3100; 17 1:0
32 3250; 2 0:1
Source: Fieldwork, 2012
4.3.3 Industrial Ownership in Kano metropolis
In terms of ownership however, the 1978 Indigenization Decree has been more favourable
to foreign ownership which it sought to discourage but has encouraged joint
Nigerian/Foreign ownership. Thus, Table 4.7 shows that despite the Indigenization Decree
foreign ownership rose from 3.1% to 14.7%) while Nigerian ownership rose from 0.3% to

77
8.4%. However, despite SAP foreign ownership rose to 24.1% and Nigerian ownership
rose to 21.8%.
Table 4.7: Ownership of Industries in Kano metropolis
Industries
Established Kan
o
Sta
te
Indiv
idual
Nig
eria
ns
Indiv
idual
Fore
igner
s
Nig
eria
ns/
Nig
eria
ns
Mult
i-
Nat
ional
s
Nig
eria
ns/
Fore
igner
s
ni Tota
ls
1940s – 1960s 0 1 12 0 0 0 4 17
1970s - 1984 1 32 56 2 2 9 13 115
1985 – 2000s 0 83 92 0 1 5 31 212
Not indicated 1 13 13 0 0 1 9 37
Totals 2 129 173 2 3 15 57 381
Source: Fieldwork, 2012
4.4 TEST OF HYPOTHESES I AND II
4.4.1 Test of Hypothesis I
What has been revealed so far is the disturbing fact of a substantial number of industries
that experienced closure since the shift in macroeconomic policy which led to the
introduction of SAP. Indeed, a look back at Table 4.5 which shows the distribution of the
industries in Kano metropolis according to ISIC (revision 4) classifications and also
according to whether they are closed or working reveals that there is hardly any industry
group that has not experienced closure to date and so a test of hypothesis I is done which
states that some industry groups in Kano metropolis are more susceptible to declining
performance or collapse than others. This is tested using ANOM.

78
The number of closures for the 20 divisions identified in Table 5.5 was fed into a Minitab
15 worksheet and the graph (Figure 4.1) is generated. The centre line is fixed at 9.9
representing the overall mean. While the upper decision limit (UDL) is at 19.17 the lower
decision limit (LDL) is at 0.63
3231302928272625242322212019181715131110
40
30
20
10
0
ISIC Divisions
Closed
9.9
0.63
19.17
Alpha = 0.05
Figure 4.1: ANOM Display for Closed Industries by their ISIC Divisions in Kano
The graphic representation of the industry groups relative to the overall mean reveals that
four divisions fall outside the UDL & LDL region. Therefore the Ho hypothesis is rejected
meaning that some industries are more susceptible to collapse than others. Specifically, this
implies that Divisions 10 (manufacture of food products), 15 (leather and related products),
22 (rubber & plastics products), and 26 (computer, electronic & optical products), despite
their appeal, require more planning and skill to manage.

79
4.4.2 Test of Hypothesis II
The general opinion of industrialists is that SAP has been responsible for many of their
woes including the declining performance of their industries. Indeed, Olukoshi (1996:17)
says the result of the SAP was “immediate and drastic”. Could the poor industrial
performance be statistically associated to SAP? To resolve this nagging question the status
of industries (whether closed or working) was tabulated by pre-SAP and during SAP as in
Figure 4.2.
SAPpre-SAP
115
110
105
100
95
90
85
80
Period
Closed
97.5
83.82
111.18
Alpha = 0.05
Figure 4.2: ANOM Display for Closed Industries by Period in Kano
The number of closures, this time, is 195 (51.2%) as 6.6% of the industries (25) did not
indicate when they closed. Again, the data of closures by the period of closure was fed into
a Minitab 15 worksheet and the graph (Figure 4.2) is generated. The centre line is fixed at
80
97.5 representing the overall mean. While the upper decision limit (UDL) is at 111.18 the
lower decision limit (LDL) is at 83.82. The graphic representation of the closures relative
to the overall mean reveals that no industry falls outside the UDL & LDL region. Therefore
the Ho hypothesis that the proportion of industries that closed is independent of SAP is
accepted meaning that, contrary to popular view, the closures are not statistically due to
SAP!
4.5 DISCUSSIONS
The presentation in this chapter shows that there has been both industrial growth and
decline in Kano metropolis. What remains unique is that both industrial growth and decline
seem to be overwhelming in the same period. Comparing Tables 4.2, 4.5 and 4.6 gives a
complete picture. Except for the two extremities – division 26 which is unaffected and
division 32 which lost all, the rest is either a story of loss in number of industries, that of
industry classes or both. This implies that something else is needed to retain the positive
and reduce or eliminate the negative.
The Industrial mix in Kano metropolis, with only 5 divisions complete (4 divisions absent
and 15 divisions incomplete), is less than satisfactory giving credence to the fact that
Nigeria‟s industrialization is a superficial development with no real manufacturing taking
place (Phillips, 1986). The impact of growth and decline on industrial mix in Kano
metropolis also seem to be as a result of the SAP policies. The test of hypotheses however
reveal that while different industry divisions may require skill and “dexterity” in handling,
the closure is not necessarily due to SAP policies. This is in line with the finding that

81
whether in pre-SAP or during SAP macroeconomic policies have been largely abused and
therefore ineffective in producing the desired results. Nature of ownership structure has not
changed and industrial formations were used for other reasons other than to increase
productions.
In general, only about half the industries in Kano metropolis can be considered committed
industrialists giving credence to Adegbola‟s (1983:301) view that Nigeria‟s
industrialization, especially the manufacturing sector, is still under-developed and “has a
narrow base which cannot guarantee self-sustaining growth”. The finding here is also in
line with Soludo‟s, (2006:10) assertion that “While manufactures as percentage of total
exports is about 40% in Indonesia, it is less than one percent in Nigeria”.

82
CHAPTER FIVE
FACTORS AFFECTING THE GROWTH OF INDUSTRIES
IN KANO METROPOLIS
5.1 INTRODUCTION
While the factors of industrial decline have been established in Chapter Four, this
chapter looks at the pattern of industrial decline in Kano metropolis. In addition, it
examines the implications of these on industrial growth in Kano metropolis in particular
and Nigeria in general. The data in this chapter mainly comes from the questionnaire
administered to the industries.
5.2 GENERAL CHARACTERISTICS OF RESPONDENT INDUSTRIES
5.2.1 Industrial plant and ownership structure
A total of 80% of the industries began with single plants which, as Table 5.1 shows, fell
to 52.0%. Only 8.0% of the industries began their operations with two or more plants but
this number rose to 44.0%. This in itself gives the impression that industries in Kano
metropolis are progressing. In contrast however, industries that have R & D units
declined from 68.0% initially to 56.0% at the time of this survey. Most of the industries
indicated that they had Research and Development units when they took off but never
made efforts to sustain them even though “today, knowledge and skills now stand alone
as the only source of comparative advantage” (Thurow quoted in Soludo, 2006:26).
Industrial research and general record keeping is one weak point of many establishments
in Nigeria, generally and Kano specifically.

83
Table 5.1: Industrial plants of respondent industries from 1969 to 2010
At take-off
Location
of
Industries
Plants R & D
Single
Two or
more
Not
indicated
Total
(Plants) Yes No
Total
(R & D)
Bompai 5 0 1 6 5 1 6
Tokarawa 2 0 0 2 2 0 2
Not on Estate 1 1 1 3 2 0 3
Challawa 2 0 0 2 1 1 2
Sharada 1 3 0 0 3 2 1 3
Sharada 2 4 1 0 5 3 2 5
Sharada 3 2 0 1 3 1 2 3
Not on Estate 1 0 0 1 1 0 1
Totals 20 2 3 25 17 7 25
At time of survey (2012)
Bompai 5 1 0 6 5 1 6
Tokarawa 1 1 0 2 1 1 2
Not on Estate 0 3 0 3 2 1 3
Challawa 1 1 0 2 1 1 2
Sharada 1 2 1 0 3 2 1 3
Sharada 2 2 3 0 5 1 4 5
Sharada 3 1 1 1 3 1 2 3
Not on Estate 1 0 0 1 1 0 1
Totals 13 11 1 25 14 11 25
Source: Fieldwork, 2012
The ownership structure of industries shown in Table 5.2 can be said to be encouraging.
The industries owned by individual Nigerians marginally rose from 44.0% to 48.0%
while ownership by individual foreigners remained unchanged at 20%. However there is
an interesting development in joint ownership of industries worthy of note. On the one
hand, joint ownership by Nigerian/Nigerian industrialists declined from 4.0% to 0%. On
the other hand, joint ownership by Nigerians/foreign industrialists rose from the initial
16.0% to 28.0% within the same period.

84
Table 5.2: Ownership structure of respondent industries from 1969 to 2010
At take-off
Location
of
Industries
Individual Owners Joint Ownership
Tota
l
Nig
eria
n
Fore
ign
Foreign
Owners Nig
eria
n/
Nig
eria
n
Fore
ign/
Fore
ign
Nig
eria
n/
Fore
ign
Not
indic
ated
Foreign
Owners
Bompai 3 1 Lebanese 0 0 2 0 Lebanese 6
Tokarawa 1 0 - 0 0 0 1 - 2
Not on Estate 0 0 - 1 1 0 1 3
Challawa 0 2 Lebanese 0 0 0 0 - 2
Sharada 1 2 1 Indians 0 0 0 0 - 3
Sharada 2 3 0 - 1 1 Lebanese 5
Sharada 3 2 0 - 0 0 1 0 Lebanese 3
Not on Estate 0 1 Lebanese 0 0 0 0 - 1
Totals 11 5 1 1 4 3 25
At time of survey (2012)
Bompai 3 1 Lebanese 0 0 2 0 Lebanese 6
Tokarawa 0 0 - 0 0 1 1 Chinese 2
Not on Estate 2 1 ni 0 0 0 0 - 3
Challawa 0 1 Lebanese 0 0 1 0 Lebanese 2
Sharada 1 2 1 Indians 0 0 0 0 - 3
Sharada 2 3 0 - 0 0
1
1 0
Chinese
Lebanese 5
Sharada 3 2 0 - 0 0 1 0 Lebanese 3
Not on Estate 0 1 Lebanese 0 0 0 0 - 1
Totals 12 5 0 0 7 1 25
Key: ni = not indicated
Source: Fieldwork, 2012
5.2.2 Raw material inputs and their sources
There are no significant changes in the type of raw materials respondent industries
require and their total number, as shown in Table 5.3, except for 8.0% of industries. As
for the first (Industry 1), it has added another product line while the second (Industry 10)
now only takes hides instead of taking the various animal hides spelt out in Table 5.3.

85
Table 5.3: Raw material requirements of respondent industries as at 2012
In
du
stry
Raw material input requirements
At take-off At time of
survey (2012)
Tota
l
1 Packaging materials; Raw tea Millet; Tamarind;
Spices 2/5
2 IPA; LDPE; Master Batch; PP Rafia No change 4/4
3 LLDPE; Printing Ink; PVC Resins No change 3/3
4 Cartons; Granulated Sugar; Hot melt glue; shrink wrap; Skillets
(pkts); Starch glue
No change 6/6
5 Cotton oil No change 1/1
6 Iron & steel; Metal scraps No change 2/2
7 Metal scraps No change 1/1
8 Raw materials & others No change ni
9 Calcium; CAP; Carbon; dCp; Recycled rubber No change 5/5
10 Cow hides; Goat skin; Sheep skin Cow hides 3/1
11 Cotton No change 1/1
12 Master Batch (colour); Polyproplene (PP); Recycle PP (black) No change 3/3
13 Chili pepper; Ginger; Gum Arabic; Hibiscus flower; Sesame seeds No change 5/5
14 ni No change ni
15 caustic soda; Diesel; LPFD; Oil & fats No change 4/4
16 DAP; LSG; MOP; UREA No change 4/4
17 Groundnuts; Soya bean seeds No change 2/2
18 Glucose; Sugar; Wrapping materials, Flavours & colours; Packing
materials
No change 5/5
19 Paper reels (KLB, white top); SCF paper Ink; Starch; Borax No change 5/5
20 Cotton waste; Polyester; Acrylic waste; Yarn No change 4/4
21 ni No change ni
22 Raw skins; Chemicals; Water No change 3/3
23 Cotton; Chemicals No change 2/2
24 Chemicals; Agro-chemicals No change 2/2
25 Agro-chemicals No change 1/1
Key: ni = not indicated
Source: Fieldwork, 2012

86
The source of the raw material inputs determines their cost and therefore the cost of
production. In general, raw material inputs secured locally are cheaper than those secured
from sources overseas. Thus, three sources are considered in this study – Kano State, the
rest of Nigeria, and overseas. In addition, assuming all raw material inputs are of equal
importance, a weight of 1 is attached to each raw material input required by individual
industries, and each industry would have a total weight equal to the total number of the
raw material inputs it requires to be in production (columns labeled Total_1 and Total_2
in Table 5.4).
The quantities of the raw material inputs got from the three different sources were then
converted to percentages and reflected in Table 5.4. The total of the individual sources
(Kano, Nigeria, and Overseas) is each divided by the number of industries that responded
(22 in this case). An industry dependent on overseas sources will have a higher
dependency ratio and therefore a higher production cost than one dependent on Nigerian
sources. Industries dependent on Kano state sources have the least dependency ratio and
by implication lower production cost. Of particular interest is the fact that raw material
inputs from overseas dropped from 25.9% to 20.2% in favour of Kano State which rose
to 31.1% and other Nigerian sources which rose to 48.7%. Thus, although most of the
industries could not cut down their raw material input requirements they have looked
inward for their supplies.

87
Table 5.4: Sources and total number of raw material inputs of individual
industries surveyed as at 2012
Industries At takeoff At time of survey (2012)
Total_1
Kano
(%)
Nigeria
(%)
Overseas
(%) Total_2
Kano
(%)
Nigeria
(%)
Overseas
(%)
1 2 20 40 40 5 35 45 20
2 4 0 100 0 4 0 100 0
3 3 0 33 67 3 0 67 33
4 6 82 9 9 6 82 9 9
5 1 0 100 0 1 0 100 0
6 2 25 75 0 2 25 75 0
7 1 50 50 0 1 50 50 0
8 1 100 0 0 1 100 0 0
9 5 0 10 90 5 0 10 90
10 3 50 50 0 1 50 50 0
11 1 33 33 33 1 34 33 33
12 3 27 60 10 3 30 60 10
13 5 0 0 0 5 0 0 0
14 ni 0 0 0 ni 0 0 0
15 4 50 50 0 4 50 50 0
16 4 14 86 0 4 13 87 0
17 2 50 50 0 2 50 50 0
18 5 0 0 100 5 20 30 50
19 5 0 60 40 5 20 60 20
20 4 50 50 0 4 50 50 0
21 ni 0 0 0 ni 0 0 0
22 3 50 20 30 3 50 20 30
23 2 0 50 50 2 25 25 50
24 2 0 50 50 2 0 50 50
25 1 0 50 50 1 0 50 50
Totals 69 601 1026 569 70 684 1071 445
Key: ni = not indicated
Source: Fieldwork, 2012
By examining Table 5.4, it is possible to say whether an industry is more dependent on
overseas, Nigerian, or Kano state sources. For the purpose of this study, any industry that
relies on a particular source for at least 60% of its raw materials is dependent on that

88
source (bold values). Table 5.4 further shows the dependency ratio for the respondent
industries. While 12.0% were initially dependent on overseas sources only 4.0% are now
dependent on this source. These industries now source from within the country for their
raw materials. This is evident in the fact that while there is no change in the percentage of
industries dependent on sources from within Kano, the percentage of industries
dependent on other Nigerian sources has changed from 24% at take-off to 28% at time of
study (2012).
5.2.3 Labour input
Generally, the total number of people working in the industries has marginally increased
over time as revealed in Table 5.5 which gives the distribution of the labour force in the
respondent industries. Females and foreigners constitute an insignificant proportion of the
labour force while Nigerian male workers are dominant.
By itself, labour force data are, generally, not a reliable index for deciding on the health
of industries but for a Third world country it is indicative of the spread effect of the
industries in question. Looking at it this way, it is worth noting that the labour force in
40.0% of the respondent industries has increased. Thus, industries 1, 3, 6, 7, 10, 12, 14,
19, 23, and 25 belong in this category. For 28.0% of the respondent industries the labour
force has decreased. Industries 2, 4, 5, 8, 11, 18, 21, and 24 belong in this category. For
the remaining 28.0% of the respondent industries the position has virtually remained the
same. (This excludes the respondent industry 13 that is not a manufacturing industry).

89
Table 5.5: Labour force distribution of industries surveyed as at 2012
Indust
ry
Nigerians Foreigners
On takeoff In 2012 On takeoff In 2012
Mal
es
Fem
ales
Sub
-Tota
l
Mal
es
Fem
ales
Sub
-Tota
l
Mal
es
Fem
ales
Sub
-Tota
l
Mal
es
Fem
ales
Sub
-Tota
l
1 26 8 34 70 87 157 1 0 1 0 0 0
2 199 2 201 189 2 191 1 0 1 1 0 1
3 20 0 20 50 0 50 14 0 14 30 0 30
4 170 1 171 71 1 72 0 0 0 0 0 0
5 48 0 48 26 0 26 0 0 0 0 0 0
6 27 0 27 32 0 32 0 0 0 0 0 0
7 254 0 254 304 0 304 6 0 6 6 0 6
8 143 57 200 122 28 150 0 0 0 0 0 0
9 92 2 94 92 2 94 2 0 2 2 0 2
10 0 0 0 32 3 35 0 0 0 1 0 1
11 197 41 238 160 20 180 4 0 4 2 0 2
12 216 57 273 289 67 356 2 0 2 5 0 5
13 101 251 352 101 251 352 3 0 3 3 0 3
14 117 2 119 197 2 199 3 0 3 2 0 2
15 116 30 146 116 30 146 8 2 10 8 2 10
16 10 0 10 10 0 10 0 0 0 0 0 0
17 64 8 72 64 8 72 0 0 0 0 0 0
18 238 200 438 0 0 0 4 0 4 0 0 0
19 174 2 176 210 5 215 9 0 9 8 0 8
20 274 0 274 274 0 274 0 0 0 0 0 0
21 695 89 784 20 0 20 48 0 48 25 0 25
22 400 100 500 400 100 500 6 0 6 6 0 6
23 1535 0 1535 1746 0 1746 26 0 26 42 0 42
24 7080 15 7095 3090 12 3102 70 0 70 70 0 70
25 4090 3 4093 10100 6 10106 85 0 85 90 0 90
Totals 16,286 868 17,154 17,765 624 18,389 292 2 294 301 2 303
Source: Fieldwork, 2012
This notwithstanding, it is important to note that only 16.0% industries have labour force
above average. Thus, the labour force in 80.0% of the industries is less than the average

90
(698 at take-off and 748 at the time of study – 2012) and some consistently so. Thus,
industries in Kano metropolis are yet to be a major employer of labour as to reduce
unemployment that has plagued urban centres in Nigeria.
5.2.4 Production Costs
A reliable production costs data would enable an observer feel the „pulse‟ of the industry.
Unfortunately this is one data that was poorly provided by the respondents. While some
of the respondent industries gave percentages of the production cost items others ranked
them. Less than 50% of the respondent industries gave near-meaningful breakdown of
their production cost. The saving grace is that while availability of production costs
breakdown tells a story, lack of it also does. The assumption is that, in most cases,
attempts have been made to lower their production cost with or without success.
Industries that did not provide their production costs may not have been keeping records.
Others may well have the records but fear suffering information externalities. Others,
still, probably do not want to share their records because they now realize the bizarre
pattern and are ashamed of it.
5.2.5 Industrial Outputs
It is interesting to note that one of the respondents does not fit into any of the ISIC
revision 4 codes for manufacturing and cannot therefore be considered as a
manufacturing industry! One other industry did not indicate what its outputs are. Again
industries in ISIC divisions 10 (manufacture of food products), 13 (manufacture of
textiles), 20 (manufacture of chemicals and chemical products), and 22 (manufacture of

91
rubber and plastic products) constitute 72.0% of the respondent industries. There are one
each of the remaining and these include divisions 15 (manufacture of leather and leather
products), 17 (manufacture of paper and paper products), 24 (manufacture of basic
metals), and 25 (manufacture of fabricated metal products). See Table 5.6 for details.
Only 12.0% of the industries have added new products to what they are used to produce
at take-off. However, the real progress is in the innovations that their new products
entailed. Thus, for instance, going from the production of tea bags to the production of a
local beverage (“kunun tsamiya” in Hausa) or expanding from the production of
chemicals and agrochemicals to the production of medicated soap are not only worthy of
note but highly commendable. Similarly, the progress from production of mosquito coils
and other insecticides to the production of aerosols or transforming from ordinary
packaging materials to blister packaging represent a commendable technological leap.
It is also noteworthy that 60.0% of the respondent industries classified their products as
consumer goods while 32.0% classified their products as intermediate goods. The
remaining 8.0% classified their products as both. Whereas 44.0% respondents claim to
use their own products others do not. The way these industries classified their products
and whether they use their products or not remains the same at the time of the survey as it
was when the industries took off.

92
Table 5.6: Outputs of industries surveyed as at 2012
Key: A = Consumer goods B = Intermediate goods
N = No Y = Yes ni – not indicated
Source: Fieldwork, 2012
Indust
ry
Products – At Take-off Products – At time of
survey (2012)
Product
type
Use
by
self
ISIC R4
Class
1 Tea bags Tea bags +
(Kunun Tsamiya) A N 1079
2 Woven sacks & threads No Change A/B N 2220
3 Packaging Materials No Change B N 2220
4 Sugar Cubes No Change A N 1073
5 Vegetable oil & cake No Change A Y 1040/1080
6 Underground Fuel Tanks No Change A N 2512
7 Iron rods No Change A N 2410
8 ni No Change B Y ni
9 Plastic & Rubber products No Change B Y 2220
10 Finished leather No Change B Y 1511/2220
11 Cotton lint/seed No Change B Y 1311
12 Plastic Mats No Change A N 2220
13 Agric products Export No Change A Y -
14 Textile materials No Change A Y 1312
15 Soap & Beauty care products No Change A Y 2023
16 Fertilizer No Change A N 2012
17 Vegetable oil & cake No Change A/B Y 1040/1080
18 Sweets/confectionery No Change A N 1073
19 Packaging Materials No Change B Y 1702
20 Textile materials No Change A N 1392
21 Textile materials No Change A Y 1311
22 Finished leather No Change B N 1511
23 Wrappers No Change A N 1311
24 Chemicals/Agrochemicals
Chemicals/
Agrochemicals +
medicated soaps
A N 2023
25 Insecticides Aerosols/Insecticides A N 2021
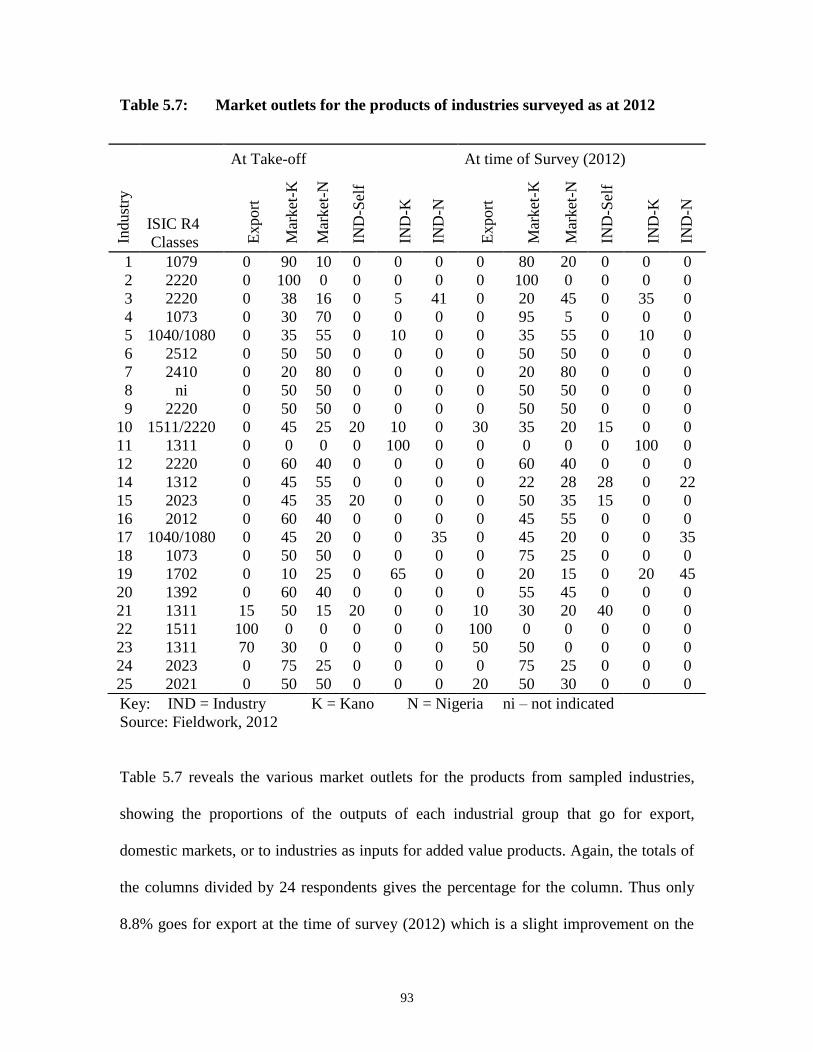
93
Table 5.7: Market outlets for the products of industries surveyed as at 2012
Key: IND = Industry K = Kano N = Nigeria ni – not indicated
Source: Fieldwork, 2012
Table 5.7 reveals the various market outlets for the products from sampled industries,
showing the proportions of the outputs of each industrial group that go for export,
domestic markets, or to industries as inputs for added value products. Again, the totals of
the columns divided by 24 respondents gives the percentage for the column. Thus only
8.8% goes for export at the time of survey (2012) which is a slight improvement on the
Indust
ry
ISIC R4
Classes
At Take-off At time of Survey (2012)
Export
Mar
ket
-K
Mar
ket
-N
IND
-Sel
f
IND
-K
IND
-N
Export
Mar
ket
-K
Mar
ket
-N
IND
-Sel
f
IND
-K
IND
-N
1 1079 0 90 10 0 0 0 0 80 20 0 0 0
2 2220 0 100 0 0 0 0 0 100 0 0 0 0
3 2220 0 38 16 0 5 41 0 20 45 0 35 0
4 1073 0 30 70 0 0 0 0 95 5 0 0 0
5 1040/1080 0 35 55 0 10 0 0 35 55 0 10 0
6 2512 0 50 50 0 0 0 0 50 50 0 0 0
7 2410 0 20 80 0 0 0 0 20 80 0 0 0
8 ni 0 50 50 0 0 0 0 50 50 0 0 0
9 2220 0 50 50 0 0 0 0 50 50 0 0 0
10 1511/2220 0 45 25 20 10 0 30 35 20 15 0 0
11 1311 0 0 0 0 100 0 0 0 0 0 100 0
12 2220 0 60 40 0 0 0 0 60 40 0 0 0
14 1312 0 45 55 0 0 0 0 22 28 28 0 22
15 2023 0 45 35 20 0 0 0 50 35 15 0 0
16 2012 0 60 40 0 0 0 0 45 55 0 0 0
17 1040/1080 0 45 20 0 0 35 0 45 20 0 0 35
18 1073 0 50 50 0 0 0 0 75 25 0 0 0
19 1702 0 10 25 0 65 0 0 20 15 0 20 45
20 1392 0 60 40 0 0 0 0 55 45 0 0 0
21 1311 15 50 15 20 0 0 10 30 20 40 0 0
22 1511 100 0 0 0 0 0 100 0 0 0 0 0
23 1311 70 30 0 0 0 0 50 50 0 0 0 0
24 2023 0 75 25 0 0 0 0 75 25 0 0 0
25 2021 0 50 50 0 0 0 20 50 30 0 0 0

94
7.7% when the industries took off (excluding industry 13). Therefore 78.7% of industrial
products (at take off) and 76.0% (at time of survey) go to the domestic markets. It is
interesting to note that the bulk of it (about two-thirds) is consumed within Kano while
the balance goes to other parts of Nigeria. In the end, only 13.6% (at take-off) and 15.3%
(in 2012) gets fed into the industries for added value. Of course this means a very weak
linkage from the input-output structure as can be seen in Table 5.8
Table 5.8: Product input-output of sampled industries as at 2012
At take-off
Industries
Sel
f Industries in Kano Industries in Nigeria Total %
sales to
industries % Name % Name
3 0 5 Gongoni; W J Bush 41 Hoechst; May & Baker 46
5 0 10 not indicated 0 - 10
10 20 10 Local shoe industries 0 - 30
11 0 100 AS & D Ltd 0 - 100
14 0 0 - 0 - 0
15 20 0 Shamartaka Ind. Ltd 0 - 20
17 0 0 - 35 Grand Cereals, Jos 35
19 0 65 Gongoni; W J Bush 0 - 65
21 20 0 African Textiles Ltd 0 - 20
At time of Survey (2012)
3 0 35 Gongoni; W J Bush 0 - 35
5 0 10 not indicated 0 - 10
10 15 0 Loquart Classic Ltd 0 - 15
11 0 100 AS & D Ltd 0 - 100
14 28 0 Terytex Nig. Ltd 22 Zaria Ind. Ltd 50
15 15 0 Shamartaka Ind. Ltd 0 - 15
17 0 0 - 35 Grand Cereals, Jos 35
19 0 20
Gongoni;
W J Bush 45
Nigeria Bottling Co. Lagos;
W A Ceramic, Ajaokuta
65
21 40 0 African Textiles Ltd 0 - 40
Source: Fieldwork, 2012

95
A more critical look at Table 5.8 reveals that respondent industries using their own
products for further processing have risen from 2.7% to 4.1%. Similarly, the percentage
of industries selling their products to industries outside Kano (but within Nigeria) has
also risen from 3.2% to 4.3%. However the percentage of industries in Kano selling to
industries in Kano has declined from 8.1% to 6.8%.
5.2.6 Managing Infrastructure
The focus here is on some industry requirements (such as land, electricity, and water) and
how they are catered for. A total of 32.0% of industries got the plots of land for the
industry directly from government while 12.0% leased the land from someone else.
Those who purchased the land constitute 28.0% while the remaining 24.0% did not
indicate how they got their land.
Next comes the ideal requirements of the industries with respect to electricity and water
supplies, what they provide for themselves as well as what government provides. Their
response is shown in Table 5.9. In terms of electricity 16.0% of industries did not indicate
their requirements – at take-off and at time of survey. Only 4.0% of the industries at take-
off required less than 12 hours of electricity daily and this has increased to 8.0% at the
time of the study in 2012. But the industries requiring 12 hours of electricity daily has
reduced from the 28.0% at take-off to 16.0% in 2012 whereas those requiring 24 hours of
electricity daily has risen from 48.0% to 56.0%) in 2012. As a result 80.0% of the
industries now cater for most of their electricity needs from the 56.0% at take-off because

96
government supply has deteriorated from being regular but inadequate (44.0%) initially
to unpredictable (52.0%) at the time of survey.
Table 5.9: Industry requirements and how they are catered for at takeoff and in
2012
Facility/
Infrastructure
At takeoff At time of Survey (2012)
Idea
l Provided
for Self
Provided by
Government
Idea
l Provided
for Self
Provided by
Government
No Yes a b c d ni No Yes a b c d ni
Electricity
<12 hours
12 hours
24 hours
ni
Sub-Total
1
7
12
4
24
0
4
4
2
10
1
3
8
2
14
0
1
2
1
4
0
3
6
2
11
0
3
3
0
6
1
0
0
0
1
0
0
1
1
2
2
4
14
4
24
0
0
4
0
4
2
4
10
4
20
0
0
0
0
0
0
0
5
1
6
1
3
6
3
13
1
0
0
0
1
0
1
3
0
4
Water Supply
<12 hours
12 hours
24 hours
ni
Sub-Total
0
4
14
6
24
0
2
6
5
13
0
2
8
1
11
0
0
5
1
6
0
2
5
1
8
0
2
1
1
4
0
0
1
2
3
0
0
2
1
3
0
4
15
5
24
0
1
3
2
6
0
3
12
3
18
0
0
1
0
1
0
1
3
1
5
0
2
5
1
8
0
0
1
3
4
0
1
5
0
6
Health Services
<12 hours
Sub-Total
-
-
10
10
14
14
-
-
-
-
-
-
-
-
-
-
-
-
5
5
19
19
-
-
-
-
-
-
-
-
-
-
Transport for
employees
Sub-Total
-
-
11
11
13
13
2
2
2
2
2
2
10
10
8
8
-
-
10
10
14
14
0
0
2
2
2
2
11
11
9
9
Key: a = regular & adequate b = regular but inadequate c = unpredictable
d = not at all ni = not indicated
Source: Fieldwork, 2012
As for water, 24.0% of industries did not indicate their requirements when they took off
and this has fallen to 20.0% now (2012). The industries with 12 hours‟ daily requirement
has remained 16.0% but those requiring water for 24 hours daily has changed from 56.0%
at take-off to 60.0% now (2012). As a result, 72.0% of the industries now cater for their
water needs from the 44.0% when they took off because government supply has

97
deteriorated from being regular and adequate (24.0%) through to being regular but
inadequate (32.0%) and now unpredictable (32.0%).
It is the same story with respect to health services and transport for employees. In terms
of the former, 56.0% of industries, at take-off, and 76.0% now (2012) cater for their
health service needs. In terms of transport for employees however, 52.0% of industries, at
take-off, and 56.0% now (2012) cater for their staff‟s transport needs mostly because
alternative transport facility is either not initially provided (40.0%), and not indicated
(32.0%) or now not provided (44.0%), and not indicated (36.0%).
5.3 PATTERN OF INDUSTRIAL DECLINE AND THE CONTRIBUTORY
FACTORS IN KANO METROPOLIS
The concept of capacity utilization can be tricky and difficult to measure, especially in
Third World countries where access to the relevant data can be near-impossible or
downright impossible. Nonetheless, in the absence of a reliable data on cost of production
a review of the capacity utilization gives a good picture of how industries struggle to
keep afloat and also gives an insight into what should be done for better results. Capacity
utilization refers to the actual output an industrial plant turns out using the installed
machinery and infrastructure. In other words, the actual output of an industrial plant
against the potential achievable with the installed machinery and infrastructure (installed
capacity). The potential capacity or installed capacity is therefore a target. Each industry,
in this study, was asked what its target was and whether it has achieved it and when.
Whether the target is realized or not the industry is asked if it has ever experienced a

98
decline in its capacity utilization, and to what level and when. In addition the industry
was asked the most recent (current) capacity utilization as at the time of this study.
In terms of methodology therefore this approach can be referred to as surveys and expert
opinion method (expert opinion provided by the industry itself), as against Rapid
appraisal, Peak-to-peak analysis, or the SPF methods.
5.3.1 Capacity utilization of respondent industries in Kano metropolis
With a very weak product input-output relationship amongst manufacturing industries in
Kano that reveals very little, nothing illustrates the epileptic nature of industries in Kano
metropolis better than an examination of their capacity utilization. The first noticeable
group from Table 5.10 is the 20.0% of industries that either provided partial data or have
not indicated their installed capacities at all. In this category is the respondent that is not a
manufacturing industry. Of the remaining 16.0% there is insufficient information on
8.0% of the industries to bring out a pattern (except that the current capacity of one of
them is 25%). The other 8.0% claim to have produced at full capacities (but did not
indicate when) and later at below capacity (25% and 35%) both in 2010 and now (at time
survey) have current capacities of 70% and 55% respectively. One can only assume their
installed capacities to be 70% and 55% respectively or higher.

99
Table 5.10 Capacity utilization of Sampled Industries as at 2012
In
dust
ry
ISIC
R4
Cla
ss
Tak
e-off
Yea
r
Inst
alle
d
Cap
acit
y
Full
Cap
acit
y
When
Full
Cap
acit
y
Uti
liza
tion
OK
?
Dec
line?
When
Dec
line
Fel
l to
Reasons for Decline Prospect
1 1079 1979 70 N na 60 Y Y 1998 40 Spare parts not adequately available increase
2 2220 2010 70 N na 50 N Y 2010 30 Cost of materials / power failure increase
3 2220 1988 65 Y 1990 65 N Y 1997 50 Low demand ni
4 1073 1979 60 Y 1993 10 N Y 2000 45 Working capital decline
5 1040/1080 2006 45 Y 2006 15 N Y 2010 35 Power failure / government failure decline
6 2512 1970 ni ni ni ni ni ni na ni ni ni
7 2410 1978 ni Y ni 70 Y Y 2010 25 Power failure increase
8 ni 1974 40 N na 25 N Y 1998 35 ni decline
9 2220 2009 ni Y ni 55 Y Y 2010 35 Problems of machines decline
10 1511/2220 2007 ni N na 25 N ni na ni ni ni
11 1311 1998 65 N na 65 N Y 1999 50 Power failure decline
12 2220 1979 80 Y 2011 80 Y Y 2009 70 Power failure increase
14 1312 1979 50 N na 50 Y Y 2002 30 ni increase
15 2023 2009 45 N na 45 N ni na ni na increase
16 2012 1999 60 Y 2002 45 N Y 2007 45 Government policies decline
17 1040/1080 2005 70 Y ni 30 N Y 2009 30 Importation / smuggling of the product decline
18 1073 1969 10 Y 1979 0 N Y 1982 0 Infrastructure / power failure / SAP decline
19 1702 1969 40 Y 2001 25 N Y 2004 20 Lack of working capital increase
20 1392 2006 60 N na 60 N ni na ni na ni
21 1311 1990 95 N na 25 N Y 2003 30 Smuggling / government policies decline
22 1511 1994 80 Y 1999 80 N Y 2005 45 Working capital / raw materials increase
23 1311 1983 100 ni ni ni ni Y 2010 45 Economic factors increase
24 2023 1952 100 Y 1985 100 Y N na na na increase
25 2021 1982 100 Y 1985 100 Y N na na na increase
Source: Fieldwork, 2012

100
The remaining 20 industries (80.0%) have installed capacities of between 10% and 100%. Out of
these, 6 industries (24.0%) have installed capacities of 10% – 50%. Half of these (12.0%) have
operated at full capacity (4.0% in pre-SAP period and 8.0% during SAP). The remaining 12.0%
could not operate at full capacity. As a matter of fact, 5 of these industries (20.0%) experienced
declines in their production, all but one of them during SAP. The current capacity utilization of 3
of them (12.0%), as at the time of this study, is less than their installed capacities while 1 (4.0%)
is operating at full capacity (current capacity utilization = installed capacity). The sweets
industry has never recovered since 1982 and therefore remains closed..
The other 14 industries (52.0%) have installed capacities of 51% – 100%. Out of these 8
industries (32.0%) have operated at full capacity (7 during SAP; I did not indicate when) while 5
(20.0%) could not. The remaining industry did not indicate whether or not it has operated at full
capacity. As many as 11 of these industries, (44.0%), have experienced declines in their
production all of them during SAP. The current capacity utilization of 6 industries (24.0%) is
less than their installed capacities while 7 industries (28.0%) are operating at full capacity as at
the time of this study (2 of the latter have consistently operated at full capacity without
experiencing drop in production). The remaining 1 industry did not disclose its current capacity
utilization.
5.3.2 Perceived reasons for the decline
Except the 4 industries (16.0%), who did not indicate whether they had suffered a decline only 2
(8.0%) did not have a decline in their capacity utilization. Indeed, 18 industries (72.0%) have
had a decline in their capacity unitization and all but 1 (4.0%) during SAP period. The purpose

101
of this sub-section, therefore, is to capture respondent industries‟ perception of the reasons for
the decline in their industrial production.
Though the reasons given by the respondent industries vary, only 5 (20.0%) think it was all due
to something to do with them - endogenous factors (i.e lack of working capital, raw materials and
spare parts for machinery maintenance not being readily available). Thus 10 of the industries
(40.0%) attribute the decline in production capacity to macroeconomic factors (cost of materials,
economic factors, government policies/government failure, importation/smuggling of the
product, power failure, and SAP). Only 1 respondent (4.0%) thinks endowment factor is to blame
(low demand) for its declining production.
5.4 RELATIVE IMPORTANCE OF THE FACTORS IDENTIFIED AND THE TEST
OF HYPOTHESIS III
This section concentrates on the relative importance of the factors at play (macroeconomic,
endowment, and endogenous). It starts with the perception of the respondents. This is followed
by a more objective assessment based on how individual industries handle such factors as
ownership, source of raw materials, labour, outlets, capacity utilization, electricity and water to
advantage given that macroeconomic policy factors affect all the industries more or less equally.
This is used to test hypothesis 2, and to decide individual industry‟s placement on the Path
Dependence model.

102
5.4.1 Relative importance of macroeconomic, endowment, and endogenous factors
Here the aim is to capture industries‟ perception of the relative importance of the factors at play
in the industries. Asked to rank the importance of a range of factors on a Likert-type scale of 5 to
1 (5 = very important; 1 = not important). None of the factors was rated 5 (very important) by the
industries. All the other macroeconomic policy factors are weighted 2 by the respondents except
for “Economic factors” with an average weight of 3. The overall average of macroeconomic
policy factors (“economic factors”, “excise duties”, “foreign exchange rate”, “foreign policy &
influence”, “global competition”, “government regulation”, “government attitude”, “import
duties”, “interest rates”, “smuggled goods”, and “tax structure”) by the respondent industries
came to 2. In effect, although macroeconomic policy factors are blamed most, in reality, they are
considered (are ranked) only slightly important.
The endowment factors include climate, nature of the community, communications, fuel (diesel
& engine oil), electricity, health facilities, labour, land, location, market, raw materials,
transportation, water supply. Whereas the respondent industries gave raw materials and
electricity an average weighting of 4 (highly important) climate and community were given an
average weighting of 2 each. The rest of the endowment factors (communications, diesel &
engine oil, health facilities, labour, land, location, market, road, transportation, water supplies)
were given an average weighting of 3 each. Therefore on average, endowment factors weighed 3.
Altogether, endowment factors are least blamed and considered (are ranked) important with a
weight of 3.

103
5.4.2 Endogenous Factor scoring
The factors considered here include ownership, inputs, labour, outlets, capacity utilization, land,
electricity, and water. Each variable is graded on a Likert-type scale of 5 (summarized in Table
5.11) and individual industries are graded accordingly and the result is shown in Table 5.12.
Table 5.11: Likert-Type Scale for Endogenous Factor Scoring
Variables
S C A L E
1 2 3 4 5
- Labour
Employees < 100 101 – 299 301 – 500 501 – 2,000 > 2,000
- Land
Access to Land Purchase Lease Government
- Ownership
Individual N or F
Joint N/N or F/F N/F
- RM Sources
Foreign 81% – 100% 61% - 80% 41% - 60% 21% - 40% 0 – 20%
Local 0 – 20% 21% - 40% 41% - 60% 61% - 80% 81% – 100%
- Capacity Util.
Installed I known;
I attained
Utilization I = C or C = I
Decline No Decline
- Electricity
Self Help Ideal (known),
Self-provides
Ideal & self-
provides
Government Unpredictable Reg/inadequate Reg/adequate
- Outlets
Exports Export
Markets Kano or Nigeria
Industries Self, Kano, Nig. Combination
- Water
Self Help Ideal (known)
Self-provides
Ideal & self-
provides
Government Unpredictable Reg/inadequate Reg/adequate
Key: N = Nigerian F = Foreign RM = Raw Materials
I = Installed capacity C = Current capacity Nig. = Nigeria
Util = Utilization Reg = Regular
Source: Derived from Fieldwork, 2012

104
The Likert-type scale used (Table 5.11) is a scale of five without a neutral point. Labour, land,
ownership, and raw material sources scores each is a unique score up to, but not more than, 5.
Capacity utilization, electricity, outlets, and water scores each is a sum of likert items scores that
make the variable (some two, some three) that would add up to, but not more than, 5.
Given 24 respondent industries, as in Table 5.12, the maximum score possible on each factor is
120 (24 x 5). Ownership gives a total endogenous factor scoring of 42 for the 24 respondents. As
for raw materials the more raw materials are sourced from overseas the more the industry is
weighed down. However the total endogenous factor scoring for sources of raw materials is 93
for the 24 respondents. Outlets gives a total endogenous factor scoring of 42 for 24 respondents
while that of labour, for 24 respondents, is 49. Capacity utilization has a total endogenous factor
scoring of 62 for the 24 respondents while land gives a total of 63 for the 24 respondents. As for
electricity and water the total endogenous factor scoring is 71 and 68 respectively for the 24
respondents.
It is worth noting that contrary to the held view that electricity (with endogenous factor scoring
of 71) is the major problem of industries in Kano, ownership, labour and outlets, with total
endogenous factor scorings of less than 60 each should be the priority areas of concern. Of
course an industry may choose to raise its factor scoring in electricity but doing so without doing
anything to labour, for instance, will do very little to the industry. Conversely, raising the factor
scoring in labour, ownership, or outlets will add more to total earnings as well as the endogenous
factor scoring of the industry.

105
Table 5.12: Endogenous Factor scoring of inputs by industries as at 2012
Indust
ries
Ow
ner
ship
Raw
Mat
eria
l
Sourc
e
Lab
our
Outl
ets
Cap
acit
y
Uti
liza
tion
Lan
d
Ele
ctri
city
Wat
er
Tota
l
Per
centa
ge
Remarks
1 1 5 2 1 2 3 2 2 18 45 Weak
2 1 5 2 1 2 1 3 2 17 43 Weak
3 1 3 1 2 4 0 3 4 18 45 Weak
4 1 5 1 1 3 5 3 4 23 58 Strong
5 1 5 1 2 3 5 3 2 22 55 Strong
6 1 5 1 1 2 0 2 0 12 30 Very Weak
7 1 5 3 1 1 5 3 1 20 50 Weak
8 1 5 2 1 2 0 3 3 17 43 Weak
9 3 1 1 1 1 1 3 4 15 38 Very Weak
10 1 5 1 4 0 0 2 2 15 38 Very Weak
11 1 4 2 1 3 1 3 3 18 45 Weak
12 1 5 3 1 4 3 4 4 25 63 Strong
14 3 0 2 3 3 5 3 3 22 55 Strong
15 0 5 2 2 3 0 4 3 19 48 Weak
16 1 5 1 1 3 1 4 4 20 50 Weak
17 1 5 1 2 3 1 4 5 22 55 Strong
18 4 2 0 1 1 5 0 0 13 33 Very Weak
19 1 5 2 3 3 3 3 3 23 58 Strong
20 1 5 2 1 3 1 3 4 20 50 Weak
21 1 0 1 3 2 5 4 3 19 48 Weak
22 1 4 4 2 4 3 4 4 26 65 Very Strong
23 5 3 4 3 0 5 3 2 25 63 Strong
24 5 3 5 1 5 5 3 4 31 78 Very Strong
25 5 3 5 3 5 5 2 2 30 75 Very Strong
42 93 49 42 62 63 71 68
Source: Fieldwork, 2012
5.4.3 Test of Hypothesis III
Hypothesis three states that the relative importance of macroeconomic policies and other
identified factors on the growth and decline of industries in Kano metropolis varies with industry

106
groups. In other words, each combination of factors is of variable importance to different groups
of industries. This will be true, for instance, if any two combination (Endogenous and
Endowment; Endogenous and Macroeconomic; Endowment and Macroeconomic) is true. In
other words, proving any of these corollary hypotheses proves the main hypothesis. The data in
Table 5.12 was subjected to a 3-way analysis of variance the result of which is shown in Table
5.13.
Table 5.13: Summary of the ANOVA test Result
Source
Type III Sum
of Squares df
Mean
Square F Sig.
Corrected Model 431.417a 15 28.761 5.403 .011
Intercept 6577.208 1 6577.208 1235.640 .000
Endogenous 134.306 2 67.153 12.616 .003
Endowment 88.985 3 29.662 5.572 .023
Macroeconomic 8.560 2 4.280 .804 .481
Endogenous and Endowment .250 1 .250 .047 .834
Endogenous and Macroeconomic .133 1 .133 .025 .878
Endowment and Macroeconomic 5.476 2 2.738 .514 .616
Endogenous and Endowment and Macroeconomic .000 0 . . .
Error 42.583 8 5.323
Total 10560.000 24
Corrected Total 474.000 23
a. R Squared = .910 (Adjusted R Squared = .742)
Following the top-down convention of factorial ANOVA interpretation, the three-way
interaction or second-order interaction (Endogenous and Endowment and Macroeconomic in this
table) is distinctly not significant. Similarly, the two-way interactions or first-order interactions

107
are not significant with F-ratio values greater than the significant (sig.). Therefore the impact of
the different factors does not differ with industry groups.
In fact, based on the F-values being greater than the significant (sig.) values one can say that
Endogenous, Endowment, and macroeconomic policy factors, individually, are important in that
order. Again, being the last of the three, this goes against the popularly held view that SAP
(macroeconomic policy factors) is responsible for industrial woes in Nigeria. This, means that
efforts should be directed at improving endogenous factors in order to either stem the declining
performance or improve the performance of industries in Kano metropolis.
5.4.4 Placement of industries in Kano metropolis on the Path Dependence Model
The manufacturing industries surveyed in Kano metropolis have been fitted into the Path
Dependence Model using the classifications in Table 5.12. This is illustrated in Figure 5.1. The
industries classified as very weak (in Table 5.12) are struggling at the Path Formation Phase with
scores of less than 40%. The 4 industries in this category include Industry 6 (with a total score of
30), 18 (with a score of 33) and 9, and 10, (each with a score of 38). Ironically, industry 6
involved in fabricating underground tanks with a score of 30% is still in operation while industry
18 (a sweets manufacturing industry), with a score of 33, has shut down completely. Such is the
strength of endogenous factors that while industry 6 is still at the primitive production stage with
nothing going for it except that its raw materials are sourced locally the relatively more favoured
industry 18 cannot continue production depending on foreign sources for its raw materials.
Industries 9 and 10 though very weak, for now, can make progress to the next class by easily
improving their ownership structure, for instance.
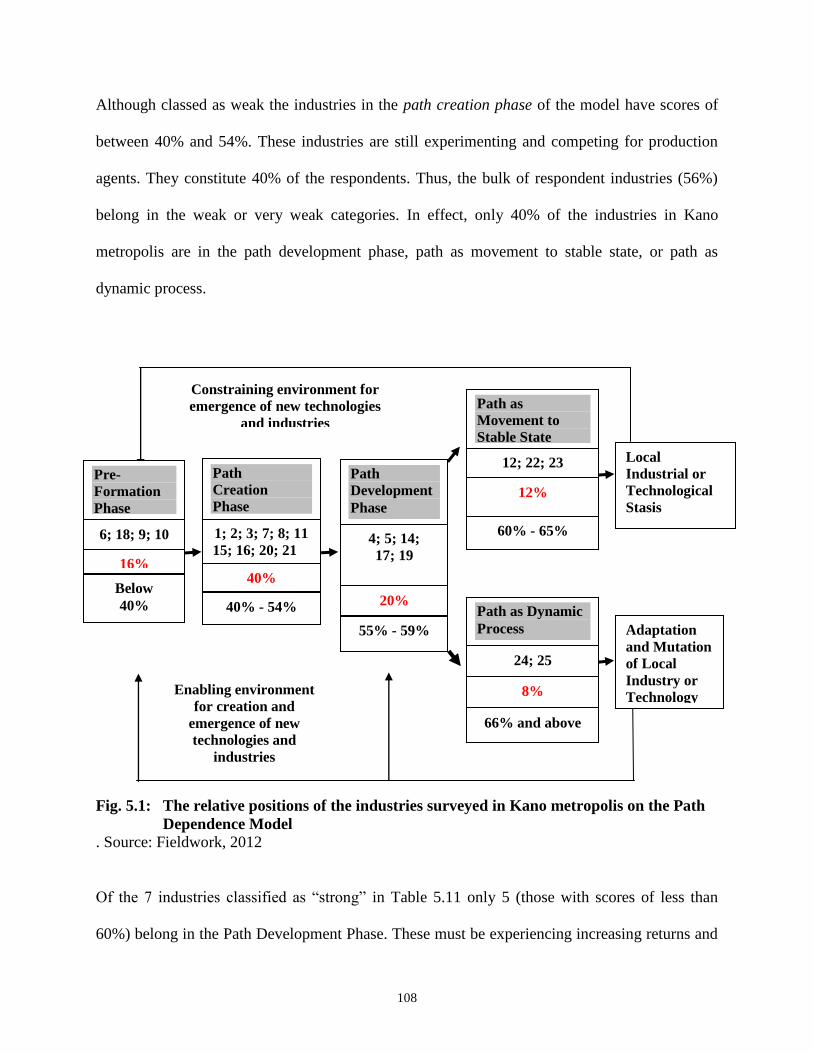
108
Although classed as weak the industries in the path creation phase of the model have scores of
between 40% and 54%. These industries are still experimenting and competing for production
agents. They constitute 40% of the respondents. Thus, the bulk of respondent industries (56%)
belong in the weak or very weak categories. In effect, only 40% of the industries in Kano
metropolis are in the path development phase, path as movement to stable state, or path as
dynamic process.
Fig. 5.1: The relative positions of the industries surveyed in Kano metropolis on the Path
Dependence Model
. Source: Fieldwork, 2012
Of the 7 industries classified as “strong” in Table 5.11 only 5 (those with scores of less than
60%) belong in the Path Development Phase. These must be experiencing increasing returns and
Constraining environment for
emergence of new technologies
and industries
Enabling environment
for creation and
emergence of new
technologies and
industries
Pre-
Formation
Phase
6; 18; 9; 10
16%
Below
40%
Path
Creation
Phase
1; 2; 3; 7; 8; 11
15; 16; 20; 21
40%
40% - 54%
Path
Development
Phase
4; 5; 14;
17; 19
20%
55% - 59%
Local
Industrial or
Technological
Stasis
Path as
Movement to
Stable State
12; 22; 23
12%
60% - 65%
Adaptation
and Mutation
of Local
Industry or
Technology
Path as Dynamic
Process
24; 25
8%
66% and above

109
network externalities. The remaining 2 (with scores of 60% or more) have been grouped in the
Path as Movement to Stable State. Together with the one other industry classed as very strong
(but with a score of less than 70%), they have a choice to continue reinforcing selected
technologies and associated firm structure and remain where they are (Path as Movement to
Stable State) until an unexpected policy, event, etc. tips them over. Industries 12, 22, and 23
constituting 12.0% belong in this category with scores ranging between 60% and 70%.
Alternatively, they can demonstrate their understanding of the factors at play and employ
“conversion”, “layering”, and “recombinants” for incremental path-dependent evolution and
renewal of local industry or technology to engage in a dynamic process as industries 24 and 25
have done. Each of the latter has a score of more than 70%, placing them on the dynamic process
path.
5.5 DISCUSSION
The industrialists owned single or more plants, some with Research and Development units but
with no evidence of industrial research. Their ownership structure is largely individual Nigerian
or foreign ownership with evidence of change towards joint Nigerian/Foreign ownership
particularly. There are no significant changes in the type of raw materials and the total number
respondent industries require but industries now look inwards for their raw materials. In terms of
labour, industries in Kano metropolis contribute little to employment. The industries in Kano
metropolis produce mostly consumer goods for domestic market with very little linkages to other
industries. Only very few of them have added product lines.

110
Industrial production in Kano is really an uphill task. While some industries get land from
government some have to purchase land. About 80% of industries cater for most of their
electricity needs because government supply has deteriorated from being regular but inadequate
to unpredictable. Also, 72.0% of the industries now cater for their water needs because
government supply has deteriorated from being regular and adequate and now unpredictable. It is
the same story with respect to health services and transport for employees.
Not only is industrial production in Kano metropolis epileptic, a large proportion of respondent
industries can be classified as exploratory (16% that are not aware of their installed capacity and
24% with installed capacities of 10% – 50%) leaving only 56% that can be said to be committed
industrialists. Indeed only 12% of industries have installed capacity of 100% and only 52% have
realized their installed capacities.
At least 72% have experienced decline in production at one time or the other. It is interesting to
note that 40% attribute this to macroeconomic policy factors while 20% attribute it to
endogenous factors and 4% to endowment factors. However, asked to rank the factors as they
affect their production (so as to establish the relative importance of these factors), macroeconomic
policy factors were ranked only slightly important behind endowment factors which were ranked
important. Thus, endogenous factor scoring was conducted to determine the relative importance of the
factors and to feel the pulse of the individual industries. The respondent industries scored highest
in source of raw materials, followed by electricity, water, land, capacity utilization, ownership
and outlets, and then labour in that order. This only says endogenous factors (how far individual
industries take advantage of both endowment and macroeconomic policy factors) are most

111
important. This is in line with the 3-way ANOVA which reveals that the three-way interaction or
second-order interaction as well as the two-way interactions or first-order interactions are not
significant. Rather, endogenous, endowment, and macroeconomic policy factors, individually, is
important in that order.
Translating the factor scores for placement on the Path Dependence Model 16% of industries
(with scores of less than 40%) are in the Path Formation Phase, 40% (with scores of between
40% and 54%) are in the Path Creation phase, 20% (with scores of just less than 60%) are in the
Path Development phase. Only 8% (with scores of 60% or more) are in the Path as movement to
stable state, and 12% (with scores approaching 65% -70%) are in the Path as dynamic process.

112
CHAPTER SIX
SUMMARY, CONCLUSIONS, AND RECOMMENDATIONS
7.1 SUMMARY
Although there are evidences of flourishing traditional industrial development in Kano
and its surrounding region these did not evolve into modern industrial setups. Indeed,
whatever modern industrial setup there is came after the introduction of colonial
administration. Thus, modern industrial development in today‟s Kano metropolis only
dates back to the 1940s and predominantly located in industrial estates. The number of
industrial establishments in Kano metropolis peaked in 1990s and at the time of this study
(2012) reached 381. Not many settlements in Nigeria can boast of such achievements but
modern industrial development in Kano metropolis, like elsewhere in Nigeria, is yet to hit
the desired production level.
The classification of 355 (93.2%) of these industries into 20 out of the 24 ISIC (revision
4) divisions not only, to some extent, shows how comprehensive the distribution of
industries in Kano metropolis is, but also reveals the nature of the industries in question.
The four divisions of industries not found include ISIC divisions 11, 14, 16, and 33.
Although the three leading industries (divisions 22, 10, and 15) account for 42.2% of
industries in Kano metropolis they are however weak in product mix. In fact for division
10, for instance, it may be advisable to either cut down their number or diversify them.
This kind of lopsidedness is also found in terms of ownership. Nearly 80% of the
industries in Kano metropolis are individually owned! Although joint Nigerians/foreign

113
ownership is replacing joint Nigerian/Nigerian ownership it is still on the low side and
yet to make the desired impact. On a similar note, while there are no significant changes
in the raw material requirements of the respondent industries they have looked inward for
their supplies. However, only 12% of respondent industries have added new product lines
and more than 75% produce mostly consumer goods for domestic markets within Kano
or the rest of Nigeria with very little linkages to other industries. Not even one-quarter of
industrial products goes for export or fed back to industries. In terms of labour, more than
80% of respondent industries are below average with poor record of production costs.
In terms of the effects of macroeconomic policies on industries in Kano metropolis, the
introduction of SAP accounts for both the highest births and highest closures of
manufacturing industries in Kano metropolis. This suggests other equally, if not more,
important factors at play. It is possible, on the one hand, that the non-committed
industrialists abused SAP policies (such as guaranteed and controlled foreign exchange),
and used them other than for industrial production as has been suggested. On the other
hand the growth resultant from the SAP policies was overwhelming and could not be
accommodated. The latter only emphasizes the importance of endogenous factors. Thus,
growth in terms of number of industries or industrial plants of respondent industries gives
the impression that industries in Kano metropolis are progressing. In contrast the number
of industrial closures and loss of industrial classes as well as declining number of
Research and Development units with the attendant lack of industrial research and
general record keeping in industrial establishments only point to the poor industrial
development in, Nigeria generally and, Kano specifically.

114
The pattern of collapse and survival of industries in Kano metropolis is best described as
epileptic with industries declining, comatose or permanently closed. Only the industries
in the Path as movement to Stable State and those in Path as Dynamic Process on the
Path Dependence Model can be said to be stable. Thus, about 25% of industries in Kano
metropolis are producing at less-than-fifty to 50% installed capacity and only 12% at
100% installed capacity. Three-quarters of respondent industries have experienced
decline in production!
There was divergence in industries‟ perception of the factors responsible for their decline
and their Likert-type rankings of the factors affecting them. Only 40% of industries
blamed macroeconomic policy factors (economic factors, government policies,
government failure, importation/smuggling of the product, power failure, and SAP) for
their declining production with 20% blaming endogenous factors (lack of working
capital, raw materials and spare parts for machinery maintenance not being readily
available). Only 4% blamed endowment factors. However they ranked endowment
above macroeconomic policy factors. Thus, endowment factors that were least blamed
were ranked higher than macroeconomic policy factors. There is therefore a need for a
more objective method of assessment – endogenous factor scoring.
The results of the endogenous factor scoring for industries in Kano metropolis suggest
they have overcome their raw materials and infrastructure (electricity and water)
problems to advantage. More than anything else, the idea of endogenous factor scoring

115
emphasizes entrepreneurship as the major dividing line between industries. Thus, not
only can it be used to feel the pulse of the industries, it can also be used to place the
industries on the Path Dependence Model. In other words, it can be used to diagnose
industries individually or collectively.
Industrial production in Kano is really an uphill task and industries are taking various
measures to stay in business. Some of the measures taken by industries in Kano
metropolis include purchase of land, provision of electricity, water, health services and
transport. Thus some industries have to purchase land and about 80% cater for most of
their electricity and water needs because government supply has deteriorated to being
unpredictable. It is the same story with respect to health services and transport for
employees. Indeed, the more industries, at individual level, are able to cater for these
needs the more they are successful in their production.
7.2 CONCLUSIONS
In terms of industries Kano stands out unique. It boasts of well over 300 industries that
span across 20 out of the 24 divisions of ISIC (revision 4) codes. However, most of these
industries are yet to produce the desired results. Viewed from Path Dependence model,
these industries are weak in product mix and ownership as revealed in Chapter Five. A
further examination revealed that the 20 divisions only cover 59 out of the 121 classes
(48.8%) while most industries are individually owned with very few joint ownership.

116
Although the majority of industries depend largely on raw materials found in the country
they are hardly innovative. Most industries have not added new product lines and mainly
produce for the domestic markets with very little aimed for export.
For the obvious reason that they affect industries uniformly, macroeconomic policy
factors (such as foreign exchange regulation) have always come to the forefront. In this
respect, SAP stands out as being the policy that resulted in a dramatic growth in the
number of industries. However, it was growth that could not be sustained and therefore
“deceptive”. The fact that no industry can survive without raw materials, makes
endowment factors (such as electricity, labour, land, location, market) important also.
The place of endogenous factors in the equation is hardly taken into account.
In pre-SAP period industries enjoyed protectionist policies that resulted in slow,
uncompetitive growth. With the introduction of SAP one does not expect any or much
dramatic growth! It is ironical that when such protection was removed during SAP it
resulted in dramatic growth in the number of industries that sprang up. It has been
suggested that uncommitted industrialists cashed in on the policies for other reasons
(such as collecting foreign currency at controlled exchange rate to sell at profit rates in
the currency market). The corresponding closure of industries that followed was simply
because the growth could only be sustained by employing endogenous factors and
therefore industries remain epileptic – closed one day and operating the next one. Thus,
the natural pattern was the dramatic slide down the scale, comatose, and finally closure.

117
Some of the estates, particularly Sharada Phase 1, are desolate as the industries are
overgrown with weeds.
In comparing the two periods, it is fair to say industrialists know when they are doing
well (in pre-SAP) just as they know when they are not doing well (during SAP). What
they do not know is why they are not doing well (absence of endogenous factors). Self-
provision of infrastructure that should have been provided centrally, is hardly the best
way to run industries. But industries that provided their own infrastructure survived.
7.3 RECOMMENDATIONS
There is a need for industrialization through self-discovery: True industrialization,
anywhere in the world, begins with what Rodrik (2004) terms “self-discovery”. This
involves “discovering” that certain goods, already well-established in a culture (such as
“kunun tsamiya” in Hausa), or in the world markets, can be produced at lower cost at
home by adopting or adapting foreign technology to domestic conditions. Of all the
myriads of things waiting to be industrialized one wonders why the industrialists in Kano
(or even elsewhere in Nigeria) are still lamenting and waiting for favourable conditions to
resume production. There is a need for an agency to fulfill this role.
Industries should be knowledge-driven: Industries should be knowledge-driven rather
than capital-driven as it is at the moment. Although 68.0% of the industries could boast
of a research and development unit but this is hardly anything to write home about where
knowledge and skills now remain the only difference between two similar industries.

118
Each industry in Kano metropolis needs a functional research and development unit. As a
rule, industries should adopt endogenous factor scoring in order to appropriate resources
and capital wisely. It is interesting to note that the ANOM was first designed for use in
industries. There should be no industry without a functional research and development
unit.
Need for centralised coordination of industrialization through Policy and Central
provision of vital Infrastructure: The issue of ailing industries in Kano metropolis is a
serious one that must be addressed by all the stakeholders – Government (i.e. the
authority), the industrialists and MAN, the academia, and society in general. There is a
need for realistic and effective policies. Government must design a policy package to
revive and sustain manufacturing industries not only in Kano metropolis but Nigeria
generally. Such a package should include the following:
i) Ownership: The ownership pattern of industries in Kano needs to be addressed. The
rationale of the various Indigenization decrees referred to in chapter 2 hinges on the
assumption that foreign investment in industrial production will not be used to produce
what Nigerians need; indigenous industrialists are more apt to be responsive to what
Nigerians need. Already the cry in Kano is that the Chinese are colonizing the “Kwari”
market in Kano metropolis and the industries will be next, if care is not taken, as, to some
extent, foreign invasion of the manufacturing sector is inevitable. There is a need to
encourage joint Nigerian/Foreign ownership to cross-fertilize ideas and capital.

119
ii) Infrastructure: Not only should government continue providing easy access to land to
manufacturers as an incentive but it should also endeavour to provide electricity and
water, for instance. It should be possible to provide such essentials centrally rather than
individually, if government, for any reason, fails in this regard. It is for this reason that
the idea of industrial estates remain appealing because it is easier to provide
infrastructure that are best provided centrally (such as sewage, access roads, electricity
and water) whether by government or otherwise, to an estate.
iii) Industrial mergers: As it is, if industries collapse they tie down such a vital state
resource as land. As a policy therefore, industries must not be allowed to collapse.
Rather, following the principles of concentration and maximization, as is done in the
developed world and now in our banking sector, the more vibrant industry should take
over the ailing one. In this way, the committed industrialists will dominate while the non-
committed ones will concentrate in other economic sectors.
Need for professionalism: On the part of the industrialists and MAN the relationship
should be more professional. One of the findings from this study is that having the
financial capital alone is not enough to run an industry. Someone (the universities, MAN,
government, or all of these) has to be charged with the responsibility for directing these
willing rich men. MAN should ensure, among other things, that
i) it is mandatory on industries to have functional research and development units.
ii) it has a monitoring and evaluation unit that should be in direct link and collaboration
with the research and development units of each industry.

120
iii) non-manufacturers are not accommodated on the estates
iv) it adopts endogenous factor scoring in order to monitor performance of industries
regularly.
v) tertiary institutions in the country and the ITF relate more with these industries for
collaborative research in the manufacturing sector.
Finally, there is a definite need for more incisive studies of industries. For instance, there
is a need to assess the impacts of policies, such as the EEG, on industrial production in
the country in general and Kano specifically.

121
REFERENCES
Abdulhamid, A. (2014), “Drainage, Hydrology and Water Resources”, in Tanko, A. I. and S. B.
Momale, (Eds) Kano Environment, Society and Development, (pp. 21 – 34), London and
Abuja, Adonis & Abbey Publishers.
Abdulkadir, A. (1981), “Financing Industrial Development in Nigeria”, Bullion, 6, N(3
July/Sept.), pp.16 – 22
Abimbola O., “Development and the African Culture”, www.academia.edu/1034930/
Development, (18, November, 2012), p.1
Adegbola, K. (1983), “Manufacturing Industries”, in Oguntoyinbo, J. S. & O. O. Areola, & M.
Filani (Eds) A Geography of Nigerian Development, 2nd Edition, (pp. 291 – 304),
Heinemann Educational Books (Nig.) Ltd.
Adekoya, A. (1987), The role of Government in Promoting Increased Productivity in Nigerian
firms, Proceedings of the First National Conference on Productivity, (p.56), National
Productivity Centre.
Ahmed, K. (2006), The Kano Physical Environment, www.kanoonline.com. Downloaded 25th
April, 2015
Ahmed, L. (2007 July 14), The Dying Factories of Kano, New Nigerian Weekly, p.10.
Ajayi, D. D. (1993), “Enterpreneurship and the Industrialization of Peripheral Areas of Nigeria”,
a PhD Research Proposal, Staff/Graduate Seminar, Department of geography, University of
Ibadan.
Ajayi, D. D. (2007), “Recent Trends and Patterns in Nigeria‟s Industrial Development”, Africa
Development, vol. XXXII, (2) : 139-155
Akintola, R. A. (1967) Industrial Location in Nigeria, Geographical Association paper, Dec. 19th
– 22nd
Akpobasah, M. A. B. (1986), “Forum on Restructuring Nigeria‟s Industrial Sector: Random
Comments”, in National Institute Kuru, (1986), Restructuring of Nigeria’s Industrial
Sector, (pp. 51 – 55), Kuru, The National Institute for Policy and Strategic Studies.
Aremu, I. (2007 February 1), The Problems Facing our Industries, New Nigerian Newspapers, p.
28
Arthur, W. B. (1989) Competing Technologies, Increasing Returns, and „lock-in‟ by Historical
Events, Economic Journal, 99, : 116-131.
Ayeni, B. (1979), Concepts and Techniques inn Urban Analysis, Croom Helm, London

122
Badamasi, M. M. (2014), “Vegetation and Forestry”, in Tanko, A. I. and S. B. Momale, (Eds)
Kano Environment, Society and Development, (pp. 43 – 64), London and Abuja, Adonis &
Abbey Publishers.
Badri, M. A. (2007), Dimensions of Industrial Location Factors: Review and Exploration,
Journal of Business and Public Affairs, 1 (Issue 2) : 1-26
Bako, A. (1990), “A Socio-economic History of Sabon-gari, Kano, 1913 – 1989”, Unpublished
Ph.D. Thesis, Department of History, Bayero University, Kano,
Balakrishnan, R. (2013), Analysis of Means (ANOM) – A Statistical Method for Better
Visualization of Results of Multi-environment Trial Data of Varieties, Journal of
Sugarcane Research, 3(1) : 71-77
Bell, D. (1976), The Coming of Post-Industrial Society, Dialogue, 11, N(2) : 3-11
Bello, S. (2011), State and Economy in Kano, C.1894 to 1960: A Study of Colonial Domination,
Zaria, Ahmadu Bello University Press Limited
Bryman, A. (2004), Social Research Methods, 2nd
Edition, New York, Oxford University Press
Inc.
Castells, M. (2000); “European Cities, the Informational Society, and the Global Economy”, in
LeGates, R. T. and F. Stouts (Eds), The City Reader; 2nd
Edition, (pp. 557-567), London
and New York, Routledge. (originally appeared [1993], Journal of Economic and social
Geography)
Charles, U. (2007 May 30), Problems of Nigerian Industries, The Guardian Newspapers, p.54
Ciroma, A. (1981), Problems and Prospects of Industrial Development in Nigeria, Bullion, 6,
N(3) : 9 – 15
David, P.A. (1985) Clio and the Economics of QWERTY, American Economic Review, 75:332-
337.
David, P. A. (2000), “Path Dependence, its Critics and the Quest for „Historical Economics”, in
P. Garrouste and S. Ioannides, (Ed) Evolution and Path Dependence in Economic Ideas:
Past and Present, Cheltenham, England, Edward: Elgar Publishing.
David, P. A. (2007), Path Dependence – A Foundational Concept for Historical Social Science,
Cliometrica - The Journal of Historical Economics and Econometric History, 1, N(2),
Summer 2007

123
Egbon, P. C. (1995), “Industrial Policy and Manufacturing Performance in Nigeria”,
(Monograph Series: No. 7), Ibadan, Nigeria, National Centre for Economic Management
and Administration, (NCEMA).
Eleazu, U. O. (1986), “Restructuring Nigerian Industries: Thinkpiece”, in National Institute
Kuru, (1986), Restructuring of Nigeria’s Industrial Sector, (pp. 42 – 48), Kuru, The
National Institute for Policy and Strategic Studies.
Eze, O. (1986), “Proposals on Restructuring Nigeria‟s Industrial Sector: Random Reactions”, in
National Institute Kuru, (1986), Restructuring of Nigeria’s Industrial Sector, (pp. 49 – 50)
Kuru, The National Institute for Policy and Strategic Studies.
Federal Republic of Nigeria, (2005), Industrial Directory 2005, 11th
Edition, Abuja, Federal
Ministry of Industry, Planning, Research and Statistics Department
French, H. F. (1990), Clearing the Air: A Global Agenda, Cambridge, University Press, pp. 14-
44
Friedrich, C. J. (1929), Ed. Alfred Weber’s Theory of Location of Industries, English Edition,
Illinois, The University of Chicago Press, Chicago
Hanga, K. S. (1999), “The Hajj Exercise in Nigeria: Challenges, Constraints, and Drawbacks”,
Downloaded 25th July, 2014
Hashim, Y. and K. Meagher (1999), “Cross-Border Trade and the Parallel Currency Market –
Trade and Finance in the Context of Structural Adjustment: A Case Study from Kano,
Nigeria”, Research Report No. 113, Nordic Africa Institute, (Nordiska Afrikaintitutet),
Uppsala. Downloaded 25th July, 2014
Hodder, B. W. (1980), Economic Development in the Tropics: the Nigerian handbook, London,
Methuen
Isa, U. F. and J. M. Ibrahim (2008), Determinants of the Location of Manufacturing Industries in
Kaduna state, Nigeria, Journal of Development Studies, 3 N(4) : 38-40
Isaac, E. (1970), Geography of Domestication, Foundation of Cultural Geography Series,
Prentice Hall, Inc., Englewood Cliffs, N.J.
Klitgaard, R. (1994), “Taking Culture into Account: From „Let's‟ to „How‟" in Serageldin, I and
J. Taboroff, (Eds), Culture and Development in Africa, Environmentally sustainable
Development Proceedings Series No. 1
Knox P. L. and L. McCarthy (2005), Urbanization: An introduction to Urban Geography,
Second edition, Pearson Education Inc., Upper Saddle River, New Jersey

124
Liman, M. and H. A. Idris, and U. K. Mohammed (2014), “Weather and Climate”, in Tanko, A.
I. and S. B. Momale, (Eds) Kano Environment, Society and Development, (pp. 13 – 19),
London and Abuja, Adonis & Abbey Publishers.
Liman, M. A. and M. A. Yusuf (2002), “The Socio-Spatial Development of Kano City”,
ALGAITA: Journal of Current Research in Hausa Studies, Department of Nigerian
Languages, Kano, BUK Publication.
Liman, M. A. and Y. M. Adamu (2003), “Kano in Time and Space: From a City to a Metropolis”
in Hambolu, M. O. (Ed) Perspectives on Kano-British Relations, Kano, Gidan Makama
Museum Kano Publication.
Liman, M. A. and Y. M. Adamu (2005), “Urbanization and the Spatial Development of Urban
Centres”, in Yakubu, A. M.; I. M. Jumare; and A. G. Saeed. (2005) Northern Nigeria: a
century of transformation, 1903-2003, Arewa House
Lubeck, P. M. (1977), “Contrasts and Continuity in a Dependent City: Kano, Nigeria” in Abu-
Lughod, J and R. Hay Jr. (Eds), Third World Urbanization, (pp. 281-289), Methuen.
Mabogunje, A. L. (1968), Urbanisation in Nigeria, London, University of London Press Ltd..
Mabogunje, A. L. (1990), “Industrialization Within an Existing System of Cities in Nigeria”, in
Ayeni, B. & A. Faniran (Eds), Geographical Perspectives on Nigeria’s Development: A
collection of Presidential addresses of the Nigerian Geographical Association, (pp.64 –
79), Ibadan, The Nigerian Geographical Association.
Mabogunje, A. L. (2011), A Measure of Grace: The Autobiography of Akinlawon Ladipo
Mabogunje, Ibadan, BookBuilders Editions Africa.
Manufacturers‟ Association of Nigeria (2009), Annual Report & Accounts, M.A.N. Kano State
Manufacturers‟ Association of Nigeria (2010), Annual Report & Accounts, M.A.N. Kano State
Martin, R. (2009), “Rethinking Regional Path Dependence: Beyond Lock-in to Evolution”, The
2009 Roepke Lecture in Economic Geography, Papers in Evolutionary Economic
geography No. 9.10, Utrecht University
Mbagwu, T. C. (1983), “Traditional Industry”, in Oguntoyinbo, J. S. & O. O. Areola, & M.
Filani (Eds) A Geography of Nigerian Development, 2nd Edition, (pp. 276 – 290),
Heinemann Educational Books (Nig.) Ltd.
Microsoft Encarta, (2008), Industrial Revolution, Microsoft Corporation
Neuman, W. L. (2003), Social Research Method: Qualitative and Quantitative Approaches,
U.S.A., Pearson Education Inc.

125
Odutola, A., (2011, Feb 18). Killing Nigeria's Industrial Base. Tell, .
Okoko, E. (2000), Quantitative Techniques in Urban Analysis, Kraft Books Ltd
Olashore, O. (1986), “Restructuring of Nigeria‟s Industrial Sector: A Blueprint for Action”, in
National Institute Kuru, (1986), Restructuring of Nigeria’s Industrial Sector, (pp. 35 – 41),
Kuru, The National Institute for Policy and Strategic Studies.
Olofin, E. A. (2014), “Location, Relief, and Landforms”, in Tanko, A. I. and S. B. Momale,
(Eds) Kano Environment, Society and Development, (pp. 1 – 11), London and Abuja,
Adonis & Abbey Publishers.
Olukoshi, A. (1996), “Economic Crisis, Structural Adjustment and the Coping Strategies of
Manufacturers in Kano, Nigeria”, United Nations Research Institute for Social
Development (UNRISD) Discussion Paper No. 77
Onyemelukwe, J. O. C. (1978) Problems of Industrial Planning and Management in Nigeria,
London, Longman
Onyemelukwe, J. O. C. and M. O. Filani (1980) Economic Geogrphy of West Africa, London,
Longman
Onyemelukwe, J. O. C. (1983), “Structural and Locational Characteristics of Manufacturing”, in
Oguntoyinbo, J. S. & O. O. Areola, & M. Filani (1983) A Geography of Nigerian
Development, 2nd Edition, (pp. 261 – 275), Heinemann Educational Books (Nig.) Ltd.
Phillips, A. (1986), “Restructuring of Nigeria‟s Industrial Sector: A Profile of Possibilities”, in
National Institute Kuru, (1986), Restructuring of Nigeria’s Industrial Sector, (pp. 20 – 34),
Kuru, The National Institute for Policy and Strategic Studies.
Ryan, T. P. (2011), Statistical Methods for Quality Improvement, Third Edition., Ch. 16 (pp. 587
– 614), John Wiley & Sons, Inc.
Sambo, A. B. (2008), Statistical Principles for Research in Education and Social Sciences,
Samaru Zaria, Nigeria, S. Asekome & Co.
Sani, B. M. (1995), A Comparative Analysis of Industrialization Effort by Nigeria and South
Korea, Journal of Social and Management Studies (JOSAMS), Kano, Bayero University,
vol. 2, pp. 109-122
Senan, M. (2007 July 14), The Dying Factories of Kano, New Nigerian Weekly, p.10.
Shea, P. J. (1974/77), “Economies of Scale and the Dyeing Industry of Pre-Colonial Kano”,
Kano Studies, NS 1, N(2) : 55-61

126
Shea, P. J. (1975), “The Development of an Export Oriented Dyed Cloth Industry in Kano
Emirate in the Nineteenth Century”, PhD thesis, University of Wisconsin, Madison
Short, J. R. (1996), The Urban Order: An introduction to Cities, Culture, and Power; Oxford,
Backwell Publishers Ltd.,
Soludo, C. C. (2006 November 23), “Can Nigeria be the China of Africa?”, Lecture delivered at
the University of Benin, Benin City, Nigeria.
Teriba, O. and M. O. Kayode, (Eds) (1977), Industrial Development in Nigeria: Pattern,
Problems and Prospects, Ibadan – Nigeria, Ibadan University Press
Toffler, A. (1981), The Third Wave, London, The Brodley head
Urquhart, A.W. (1977) Planned Urban Landscapes of Northern Nigeria, Zaria, A.B.U. Press,
Uzor, O. O. (undated) “The Global Financial Crisis (GFC) and Industrialization in Nigeria: The
Implications of Policy Reversal and the Prospects for Growth”. Downloaded 10 February,
2014.
Willis, K. (2005), “Theories of Development”, in Cloke, P., P. Grang, M. Godwin (Eds) (2005),
Introducing Human Geographies, 2nd
Edition, (Part 2, Section 2, Chapter 13, pp. 187 –
222), Hodder Arnold.
Wikipedia, (2014), Industrial Revolution, Wikipedia, the Free Encyclopedia, Downloaded 10
February, 2014.
Zayyad, H. R. (1981), “Industrial Development in Nigeria”, Bullion, 6 N(3) : 2 – 8

127
APPENDICES
APPENDIX I
Appendix 1: Questionnaire for Industries in Kano metropolis
Section A: General
A1. Name of Industry:___________________________________________________________
A2. The Industry is located in: (circle the appropriate answer)
a) Bompai b) Challawa c) Dakata d) Sharada e) Tokarawa
A3. Year Industry was established: _____________
A4. This industrial plant is:
INITIALLY NOW
1 A single plant 1 A single plant
2 Two plants or more 2 Two plants or more
3 A branch plant 3 A branch plant
4 A subsidiary plant 4 A subsidiary plant
A5. Does the industry have a Research & Development section?
Initially: Now: a) Yes a) Yes
b) No b) No
Answer either A6a or A6b below
A6a. The Industry is Solely owned by:
Initially Now
a) Nigerian individuals
b) Federal Government
c) Kano State Government
d) Other Nigerian State Government (state which)
e) Foreigners (State country below)
f) Others (please specify)

128
Appendix 1: Questionnaire for Industries in Kano metropolis Cont‟d
A6b. The Industry is Jointly owned by: (you can check more than one)
Initially Now
a) Nigerian individuals
b) Federal Government
c) Kano State Government
d) Other Nigerian State Government (state which)
e) Foreigners (State country below)
f) Others (please specify)
Section B: Inputs
B1. Please indicate below the sources and quantities of the material inputs used by your industry
INITIALLY
Material Inputs
Quantity obtained from
Industries
Located
in Kano
Industries
elsewhere
in Nigeria
Overseas
NOW
Material Inputs
Quantity obtained from
Industries
Located
in Kano
Industries
elsewhere
in Nigeria
Overseas
Appendix 1: Questionnaire for Industries in Kano metropolis Cont‟d

129
B2. Please indicate below the number of different categories of employees in your industry
I N I T I A L L Y
Totals
MALES FEMALES
Management Skilled Unskilled Management Skilled Unskilled
Nigerians
Foreigners
TOTALS
N O W
MALES FEMALES
Totals Management Skilled Unskilled Management Skilled Unskilled
Nigerians
Foreigners
TOTALS
B3. Please indicate the following costs as a % of your production costs
Types of Costs Initially Now
a) Labour costs
b) Managerial costs
c) Raw material costs
d) Electricity (NEPA or PHCN)
e) Generating set & fuel
f) Diesel & engine oil
g) Water supply
h) Security
i) Foreign Exchange costs
j) Interest rates
k) Import duties
l) Excise duties
m) Tax
n) Transport for employees
o) Other Costs (please specify)
i)
ii)
iii)
Appendix 1: Questionnaire for Industries in Kano metropolis Cont‟d

130
Section C: Outputs
C1. Please indicate the final product of your industry below and the quantity produced
Name of Product Quantity
Initially
Quantity
Now
C2. Which of these best describes the product from your industry?
Initially Now
a) Consumer good
b) Intermediate good
c) Capital goods
d) Others (please Specify)
C3. Do you use any of your products as inputs for other products?
Initially: Now: a) Yes a) Yes
b) No b) No
C4. Please indicate how your product is consumed (in %)
%
Initially
%
Now
Export (to other countries)
Domestic market (Kano)
Domestic market (rest of Nigeria)
Used as an input by your (this) industry
Used as an input by other industries in Kano (name industry)
Used as an input by other industries outside Kano (name industry)
Appendix 1: Questionnaire for Industries in Kano metropolis Cont‟d

131
C5. Which Industries use your product(s) in the production of their products?
%
Initially
%
Now
C6. What was your installed capacity when you started the industry (in % please) ____________
C7 Was there a time when you operated at full production capacity? (If Yes state year) _______
C8a. What is the current production capacity? _______________
C8b. Is the current production capacity satisfactory to the industry? a) Yes b) No
C9a. Was there a time when your capacity utilization started declining? a) Yes b) No
C9b. If Yes above state year: ________ and C9c. To what level? _______________
C9d. What do you think was responsible _____________________________________________
C9e. Judging from the industrial climate in Kano and the country do you think your production level
would increase or decline? a) Increase b) Decline
Section D: Land & Infrastructure
D1. Ideally, how much of the following was your industry‟s need on a daily basis and how much is your
industry‟s need now, on a daily basis?
Initially Now
24 hrs/day 12 hrs/day 24 hrs/day 12 hrs/day
Electricity
Water supply
Others (please specify)
i)
ii)
iii)
Appendix 1: Questionnaire for Industries in Kano metropolis Cont‟d

132
D2. Indicate which of these your industry provides for itself
Initially Now
a) Electricity (own a generator for use)
b) Water supply
c) Health facilities
d) Transport for employees
e) Others (please Specify)
D3a. Indicate the status of the following as provided to the industry by the government when the industry
started
Regular &
Adequate
(24/7)
Regular &
inadequate
(12 hrs/day)
Irregular &
Erratic
(unpredictable)
Not
Provided
At all
Electricity
Water supply
Public Transport Service
Others (please specify)
i)
ii)
iii)
D3b. Indicate the present status of the following as provided to the industry by the government
Regular &
Adequate
(24/7)
Regular &
inadequate
(12 hrs/day)
Irregular &
Erratic
(unpredictable)
Not
Provided
At all
Electricity
Water supply
Transport Service
Others (please specify)
i)
ii)
iii)
D4. Indicate how you got the plot of land for the industry
a) Government allocation b) Leased from someone
c) Others (please specify) _______________________________________________________
Appendix 1: Questionnaire for Industries in Kano metropolis Cont‟d

133
Section E: Perceptions of relative importance of factors
E. Please rank the following factors (E1 on the left) and infrastructure (E2 on the right) according to their
importance to your industry (5 = Very Important; 4 = Highly Important; 3 = Important;
2 = Slightly Important; 1 = Not Important)
E1 E2
Fators Ranking Infrastructure Ranking
Transportation Communications
Labour Electricity
Location (industrial site) Health facilities
Economic factors (e.g Management or Entrepreneurship etc.) Land
Raw materials Roads
Markets Water supply
Interest rates
Foreign Exchange rates
Utilities
Government attitude
Smuggled goods
Tax structure
Import duties
Excise duty
Diesel & Engine oil
Climate
Community
Foreign politics/influence
Global competition
Government regulations
Thank you.

134
Appendix II Analysis of Means Constants
a
Number of Means, k
d,f,b (ν) 3 4 5 6 7 8 9 10 11 12 13 14 15 16 17 18 19 20
a,h 0.05
3 4.18
4 3.56 3.89
5 3.25 3.53 3.72
6 3.07 3.31 3.49 3.62
7 2.94 3.17 3.33 3.45 3.56
8 2.86 3.07 3.21 3.33 3.43 3.51
9 2.79 2.99 3.13 3.24 3.33 3.41 3.48
10 2.74 2.93 3.07 3.17 3.26 3.33 3.40 3.45
11 2.70 2.88 3.01 3.12 3.20 3.27 3.33 3.39 3.44
12 2.67 2.85 2.97 3.07 3.15 3.22 3.28 3.33 3.38 3.42
13 2.64 2.81 2.94 3.03 3.11 3.18 3.24 3.29 3.34 3.38 3.42
14 2.62 2.79 2.91 3.00 3.08 3.14 3.20 3.25 3.30 3.34 3.37 3.41
15 2.60 2.76 2.88 2.97 3.05 3.11 3.17 3.22 3.26 3.30 3.34 3.37 3.40
16 2.58 2.74 2.86 2.95 3.02 3.09 3.14 3.19 3.23 3.27 3.31 3.34 3.37 3.40
17 2.57 2.73 2.84 2.93 3.00 3.06 3.12 3.16 3.21 3.25 3.28 3.31 3.34 3.37 3.40
18 2.55 2.71 2.82 2.91 2.98 3.04 3.10 3.14 3.18 3.22 3.26 3.29 3.32 3.35 3.37 3.40
19 2.54 2.70 2.81 2.89 2.96 3.02 3.08 3.12 3.16 3.20 5.24 3.27 3.30 3.32 3.35 3.37 3.40
20 2.53 2.68 2.79 2.88 2.95 3.01 3.06 3.11 3.15 3.18 3.22 3.25 3.28 3.30 3.33 3.35 3.37 3.40
24 2.50 2.65 2.75 2.83 2.90 2.96 3.01 3.05 3.09 3.13 3.16 3.19 3.22 3.24 3.27 3.29 3.31 3.33
30 2.47 2.61 2.71 2.79 2.85 2.91 2.96 3.00 3.04 3.07 3.10 3.13 3.16 3.18 3.20 3.22 3.25 3.27
40 2.43 2.57 2.67 2.75 2.81 2.86 2.91 2.95 2.98 3.01 3.04 3.07 3.10 3.12 3.14 3.16 3.18 3.20
60 2.40 2.54 2.63 2,70 2.76 2.81 2.86 2.90 2.93 2.96 2.99 3.02 3.04 3.06 3.08 3.10 3.12 3.14
120 2.37 2.50 2.59 2.66 2.72 2.77 2.81 2.84 2.88 2.91 2.93 2.96 2.98 3.00 3.02 3.04 3.06 3.08
Infinity 2.34 2.47 2.56 2.62 2.68 2.72 2.76 2.80 2.83 2.86 2.88 2.90 2.93 2.95 2.97 2.98 3.00 3.0

135
Analysis of Means Constants (Continued)
Number of Means, k
d,f,b (ν) 3 4 5 6 7 8 9 10 11 12 13 14 15 16 17 18 19 20
b. h 0.01
3 7.51
4 5.74 6.21
5 4.93 5.29 5.55
6 4.48 4.77 4.98 5.16
7 4.18 4.44 4.63 4.78 4.90
8 3.98 4.21 4.38 4.52 4.63 4.72
9 3.84 4.05 4.20 4.33 4.43 4.51 4.59
10 3.73 3.92 4.07 4.18 4.28 4.36 4.43 4.49
11 3.64 3.82 3.96 4.07 4.16 4.23 4.30 4.36 4.41
12 3.57 3.74 3.87 3.98 4.06 4.13 4.20 4.25 4.31 4.35
13 3.51 3.68 3.80 3.90 3.98 4.05 4.11 4.17 4.22 4.26 4.30
14 3.46 3.63 3.74 3.84 3.92 3.98 4.04 4.09 4.14 4.18 4.22 4.26
15 3.42 3.58 3.69 3.79 3.86 3.92 3.98 4.03 4.08 4.12 4.16 4.19 4.22
16 3.38 3.54 3.65 3.74 3.81 3.87 3.93 3.98 4.02 4.06 4.10 4.14 4.17 4.20
17 3.35 3.50 3.61 3.70 3.77 3.83 3.85 3.93 3.98 4.02 4.05 4.09 4.12 4.14 4.17
18 3.33 3.47 3.58 3.66 3.73 3.79 3.85 3.89 3.94 3.97 4.01 4.04 4.07 4.10 4.12 4.15
19 3.30 3.45 3.55 3.63 3.70 3.76 3.81 3.86 3.90 3.94 3.97 4.00 4.03 4.06 4.08 4.11 4.13
20 3.28 3.42 3.53 3.61 3.67 3.73 3.78 3.83 3.87 3.90 3.94 3.97 4.00 4.02 4.05 4.07 4.09 4.12
24 3.21 3.35 3.45 3.52 3.58 3.64 3.69 3.73 3.77 3.80 3.83 3.86 3.89 3.91 3.94 3.96 3.98 4.00
30 3.15 3.28 3.37 3.44 3.50 3.55 3.59 3.63 3.67 3.70 3.73 3.76 3.78 3.81 3.83 3.85 3.87 3.89
40 3.09 3.21 3.29 3.36 3.42 3.46 3.50 3.54 3.58 3.60 3.63 3.66 3.68 3.70 3.72 3.74 3.76 3.78
60 3.03 3.14 3.22 3.29 3.34 3.38 3.42 3.46 3.49 3.51 3.54 3.56 3.59 3.61 3.63 3.64 3.66 3.68
120 2.97 3.07 3.15 3.21 3.26 3.30 3.34 3.37 3.40 3.42 3.45 3.47 3.49 3.51 3.55 3.55 3.56 3.58
Infinity 2.91 3.01 3.08 3.14 3.18 3.22 3.26 3.29 3.32 3.34 3.36 3.38 3.40 3.42 3.44 3.45 3.47 3.48 a From Tables 2 and 3 of L. S. Nelson, Exact critical values for use with the analysis of means, Journal of Quality Technology 15(1), January 1983. Reprinted
with permission of the American Society for Quality control. b Degrees of freedom for s

136
APPENDIX III
Summary of Industrial Classifications According to ISIC Revision 4
Major
Division
Economic Activities
Divisions
A Agriculture, forestry and fishing 01 - 03
B Mining and quarrying 05 – 09
C Manufacturing 10 - 33
D Electricity, gas, steam and air conditioning supply 35 - 35
E Water supply; sewerage, waste management and remediation activities 36 - 39
F Construction 41 - 43
G Wholesale and retail trade; repair of motor vehicles and motorcycles 45 - 47
H Transportation and storage 49 - 53
I Accommodation and food service activities 55 - 56
J Information and communication 58 - 63
K Financial and insurance activities 64 - 66
L Real estate activities 68 - 68
M Professional, scientific and technical activities 69 - 75
N Administrative and support service activities 77 - 82
O Public administration and defence; compulsory social security 84 - 84
P Education 85 - 85
Q Human health and social work activities 86 - 88
R Arts, entertainment and recreation 90 - 93
S Other service activities 94 - 96
T Activities of households as employers; undifferentiated goods- and
services-producing activities of households for own use
97 - 98
U Activities of extraterritorial organizations and bodies 99 - 99
Source: Compiled from publications obtained at Unstats.un.org (retrieved on 7th
July, 2012)

137
APPENDIX IV
Details On Section C (Manufacturing):
Divisions, Groups, and Classes
Division: 10 - Manufacture of food products
Class: 1010 - Processing and preserving of meat
Class: 1020 - Processing and preserving of fish, crustaceans and molluscs
Class: 1030 - Processing and preserving of fruit and vegetables
Class: 1040 - Manufacture of vegetable and animal oils and fats
Class: 1050 - Manufacture of dairy products
Group 106: Manufacture of grain mill products, starches and starch products
Class: 1061 - Manufacture of grain mill products
Class: 1062 - Manufacture of starches and starch products
Group 107: Manufacture of other food products
Class: 1071 - Manufacture of bakery products
Class: 1072 - Manufacture of sugar
Class: 1073 - Manufacture of cocoa, chocolate and sugar confectionery
Class: 1074 - Manufacture of macaroni, noodles, couscous and similar farinaceous products
Class: 1075 - Manufacture of prepared meals and dishes
Class: 1079 - Manufacture of other food products n.e.c.
Class: 1080 - Manufacture of prepared animal feeds
Division: 11 - Manufacture of beverages
Class: 1101 - Distilling, rectifying and blending of spirits
Class: 1102 - Manufacture of wines
Class: 1103 - Manufacture of malt liquors and malt
Class: 1104 - Manufacture of soft drinks; production of mineral waters and other bottled waters
Division: 12 - Manufacture of tobacco products
Class: 1200 - Manufacture of tobacco products
Division: 13 - Manufacture of textiles
Group 131 Spinning, weaving and finishing of textiles
Class: 1311 - Preparation and spinning of textile fibres
Class: 1312 - Weaving of textiles
Class: 1313 - Finishing of textiles
Group 139: Manufacture of other textiles
Class: 1391 - Manufacture of knitted and crocheted fabrics
Class: 1392 - Manufacture of made-up textile articles, except apparel
Class: 1393 - Manufacture of carpets and rugs
Class: 1394 - Manufacture of cordage, rope, twine and netting
Class: 1399 - Manufacture of other textiles n.e.c.
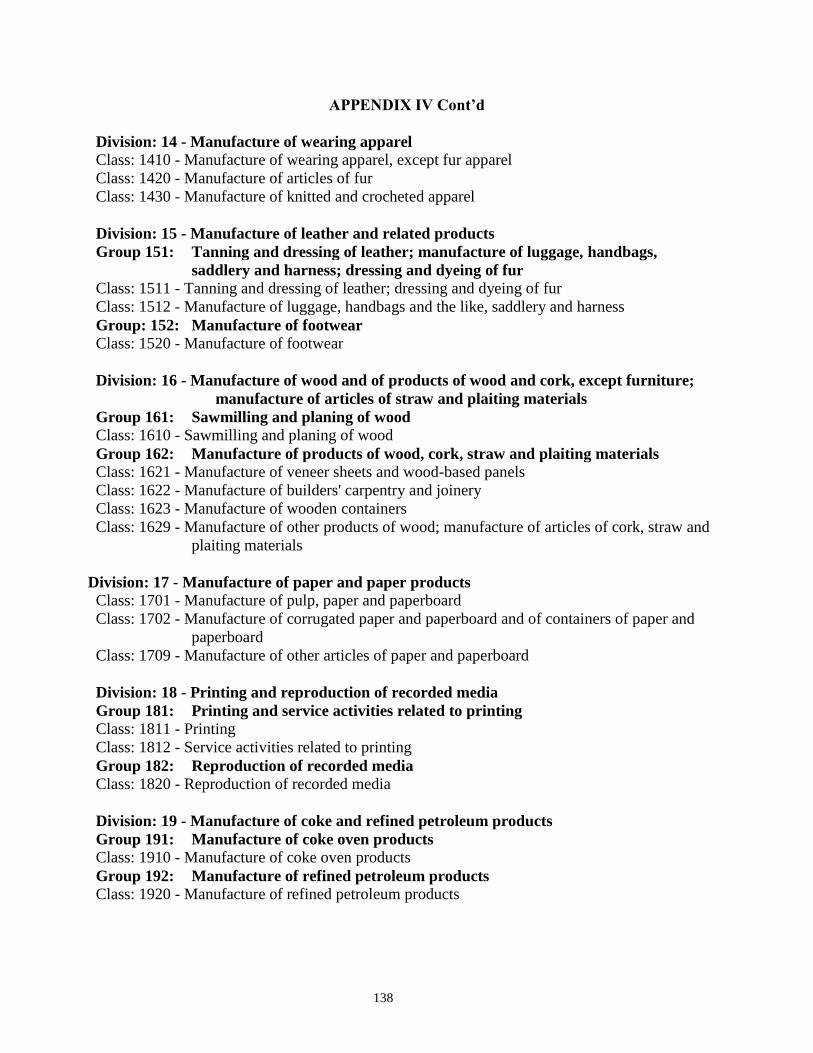
138
APPENDIX IV Cont‟d
Division: 14 - Manufacture of wearing apparel
Class: 1410 - Manufacture of wearing apparel, except fur apparel
Class: 1420 - Manufacture of articles of fur
Class: 1430 - Manufacture of knitted and crocheted apparel
Division: 15 - Manufacture of leather and related products
Group 151: Tanning and dressing of leather; manufacture of luggage, handbags,
saddlery and harness; dressing and dyeing of fur
Class: 1511 - Tanning and dressing of leather; dressing and dyeing of fur
Class: 1512 - Manufacture of luggage, handbags and the like, saddlery and harness
Group: 152: Manufacture of footwear
Class: 1520 - Manufacture of footwear
Division: 16 - Manufacture of wood and of products of wood and cork, except furniture;
manufacture of articles of straw and plaiting materials
Group 161: Sawmilling and planing of wood
Class: 1610 - Sawmilling and planing of wood
Group 162: Manufacture of products of wood, cork, straw and plaiting materials
Class: 1621 - Manufacture of veneer sheets and wood-based panels
Class: 1622 - Manufacture of builders' carpentry and joinery
Class: 1623 - Manufacture of wooden containers
Class: 1629 - Manufacture of other products of wood; manufacture of articles of cork, straw and
plaiting materials
Division: 17 - Manufacture of paper and paper products
Class: 1701 - Manufacture of pulp, paper and paperboard
Class: 1702 - Manufacture of corrugated paper and paperboard and of containers of paper and
paperboard
Class: 1709 - Manufacture of other articles of paper and paperboard
Division: 18 - Printing and reproduction of recorded media
Group 181: Printing and service activities related to printing
Class: 1811 - Printing
Class: 1812 - Service activities related to printing
Group 182: Reproduction of recorded media
Class: 1820 - Reproduction of recorded media
Division: 19 - Manufacture of coke and refined petroleum products
Group 191: Manufacture of coke oven products
Class: 1910 - Manufacture of coke oven products
Group 192: Manufacture of refined petroleum products
Class: 1920 - Manufacture of refined petroleum products

139
APPENDIX IV Cont‟d
Division: 20 - Manufacture of chemicals and chemical products
Group 201: Manufacture of basic chemicals, fertilizers and nitrogen compounds, plastics
and synthetic rubber in primary forms
Class: 2011 - Manufacture of basic chemicals
Class: 2012 - Manufacture of fertilizers and nitrogen compounds
Class: 2013 - Manufacture of plastics and synthetic rubber in primary forms
Group 202: Manufacture of other chemical products
Class: 2021 - Manufacture of pesticides and other agrochemical products
Class: 2022 - Manufacture of paints, varnishes and similar coatings, printing ink and mastics
Class: 2023 - Manufacture of soap and detergents, cleaning and polishing preparations, perfumes
and toilet preparations
Class: 2029 - Manufacture of other chemical products n.e.c.
Group 203: Manufacture of man-made fibres
Class: 2030 - Manufacture of man-made fibres
Division: 21 - Manufacture of basic pharmaceutical products and pharmaceutical
preparations
Group: 210 - Manufacture of pharmaceuticals, medicinal chemical and botanical products
Class: 2100 - Manufacture of pharmaceuticals, medicinal chemical and botanical products
Division: 22 - Manufacture of rubber and plastics products
Group: 221 - Manufacture of rubber products
Class: 2211 - Manufacture of rubber tyres and tubes; retreading and rebuilding of rubber tyres
Class: 2219 - Manufacture of other rubber products
Group: 222 - Manufacture of plastics products
Class: 2220 - Manufacture of plastics products
Division: 23 - Manufacture of other non-metallic mineral products
Group: 231 - Manufacture of glass and glass products
Class: 2310 - Manufacture of glass and glass products
Group: 239 - Manufacture of non-metallic mineral products n.e.c.
Class: 2391 - Manufacture of refractory products
Class: 2392 - Manufacture of clay building materials
Class: 2393 - Manufacture of other porcelain and ceramic products
Class: 2394 - Manufacture of cement, lime and plaster
Class: 2395 - Manufacture of articles of concrete, cement and plaster
Class: 2396 - Cutting, shaping and finishing of stone
Class: 2399 - Manufacture of other non-metallic mineral products n.e.c.
Division: 24 - Manufacture of basic metals
Group: 241 - Manufacture of basic iron and steel
Class: 2410 - Manufacture of basic iron and steel
Group: 242 - Manufacture of basic precious and other non-ferrous metals
Class: 2420 - Manufacture of basic precious and other non-ferrous metals

140
APPENDIX IV Cont‟d
Group: 243 - Casting of metals
Class: 2431 - Casting of iron and steel
Class: 2432 - Casting of non-ferrous metals
Division: 25 - Manufacture of fabricated metal products, except machinery and equipment
Group: 251 - Manufacture of structural metal products, tanks, reservoirs and steam generators
Class: 2511 - Manufacture of structural metal products
Class: 2512 - Manufacture of tanks, reservoirs and containers of metal
Class: 2513 - Manufacture of steam generators, except central heating hot water boilers
Group: 252 - Manufacture of weapons and ammunition
Class: 2520 - Manufacture of weapons and ammunition
Group: 259 - Manufacture of other fabricated metal products; metalworking service activities
Class: 2591 - Forging, pressing, stamping and roll-forming of metal; powder metallurgy
Class: 2592 - Treatment and coating of metals; machining
Class: 2593 - Manufacture of cutlery, hand tools and general hardware
Class: 2599 - Manufacture of other fabricated metal products n.e.c.
Division: 26 - Manufacture of computer, electronic and optical products
Group: 261 - Manufacture of electronic components and boards
Class: 2610 - Manufacture of electronic components and boards
Group: 262 - Manufacture of computers and peripheral equipment
Class: 2620 - Manufacture of computers and peripheral equipment
Group: 263 - Manufacture of communication equipment
Class: 2630 - Manufacture of communication equipment
Group: 264 - Manufacture of consumer electronics
Class: 2640 - Manufacture of consumer electronics
Group: 265 - Manufacture of measuring, testing, navigating and control equipment; watches and
clocks
Class: 2651 - Manufacture of measuring, testing, navigating and control equipment
Class: 2652 - Manufacture of watches and clocks
Group: 266 - Manufacture of irradiation, electromedical and electrotherapeutic equipment
Class: 2660 - Manufacture of irradiation, electromedical and electrotherapeutic equipment
Group: 267 - Manufacture of optical instruments and photographic equipment
Class: 2670 - Manufacture of optical instruments and photographic equipment
Group: 268 - Manufacture of magnetic and optical media
Class: 2680 - Manufacture of magnetic and optical media
Division: 27 - Manufacture of electrical equipment
Group: 271 - Manufacture of electric motors, generators, transformers and electricity distribution
and control apparatus
Class: 2710 - Manufacture of electric motors, generators, transformers and electricity distribution
and control apparatus

141
APPENDIX IV Cont‟d
Group: 272 - Manufacture of batteries and accumulators
Class: 2720 - Manufacture of batteries and accumulators
Group: 273 - Manufacture of wiring and wiring devices
Class: 2731 - Manufacture of fibre optic cables
Class: 2732 - Manufacture of other electronic and electric wires and cables
Class: 2733 - Manufacture of wiring devices
Group: 274 - Manufacture of electric lighting equipment
Class: 2740 - Manufacture of electric lighting equipment
Group: 275 - Manufacture of domestic appliances
Class: 2750 - Manufacture of domestic appliances
Group: 279 - Manufacture of other electrical equipment
Class: 2790 - Manufacture of other electrical equipment
Division: 28 - Manufacture of machinery and equipment n.e.c.
Group: 281 - Manufacture of general-purpose machinery
Class: 2811 - Manufacture of engines and turbines, except aircraft, vehicle and cycle engines
Class: 2812 - Manufacture of fluid power equipment
Class: 2813 - Manufacture of other pumps, compressors, taps and valves
Class: 2814 - Manufacture of bearings, gears, gearing and driving elements
Class: 2815 - Manufacture of ovens, furnaces and furnace burners
Class: 2816 - Manufacture of lifting and handling equipment
Class: 2817 - Manufacture of office machinery and equipment (except computers and peripheral
equipment)
Class: 2818 - Manufacture of power-driven hand tools
Class: 2819 - Manufacture of other general-purpose machinery
Group: 282 - Manufacture of special-purpose machinery
Class: 2821 - Manufacture of agricultural and forestry machinery
Class: 2822 - Manufacture of metal-forming machinery and machine tools
Class: 2823 - Manufacture of machinery for metallurgy
Class: 2824 - Manufacture of machinery for mining, quarrying and construction
Class: 2825 - Manufacture of machinery for food, beverage and tobacco processing
Class: 2826 - Manufacture of machinery for textile, apparel and leather production
Class: 2829 - Manufacture of other special-purpose machinery
Division: 29 - Manufacture of motor vehicles, trailers and semi-trailers
Group: 291 - Manufacture of motor vehicles
Class: 2910 - Manufacture of motor vehicles
Group: 292 - Manufacture of bodies (coachwork) for motor vehicles; manufacture of trailers and
semi-trailers
Class: 2920 - Manufacture of bodies (coachwork) for motor vehicles; manufacture of trailers and
semi-trailers
Group: 293 - Manufacture of parts and accessories for motor vehicles
Class: 2930 - Manufacture of parts and accessories for motor vehicles

142
APPENDIX IV Cont‟d
Division: 30 - Manufacture of other transport equipment
Group: 301 - Building of ships and boats
Class: 3011 - Building of ships and floating structures
Class: 3012 - Building of pleasure and sporting boats
Class: 3020 - Manufacture of railway locomotives and rolling stock
Class: 3030 - Manufacture of air and spacecraft and related machinery
Class: 3040 - Manufacture of military fighting vehicles
Group: 309 - Manufacture of transport equipment n.e.c.
Class: 3091 - Manufacture of motorcycles
Class: 3092 - Manufacture of bicycles and invalid carriages
Class: 3099 - Manufacture of other transport equipment n.e.c.
Division: 31 - Manufacture of furniture
Class: 3100 - Manufacture of furniture
Division: 32 - Other manufacturing
Group: 321 - Manufacture of jewellery, bijouterie and related articles
Class: 3211 - Manufacture of jewellery and related articles
Class: 3212 - Manufacture of imitation jewellery and related articles
Class: 3220 - Manufacture of musical instruments
Class: 3230 - Manufacture of sports goods
Class: 3240 - Manufacture of games and toys
Class: 3250 - Manufacture of medical and dental instruments and supplies
Class: 3290 - Other manufacturing n.e.c.
Division: 33 - Repair and installation of machinery and equipment
Group: 331 - Repair of fabricated metal products, machinery and equipment
Class: 3311 - Repair of fabricated metal products
Class: 3312 - Repair of machinery
Class: 3313 - Repair of electronic and optical equipment
Class: 3314 - Repair of electrical equipment
Class: 3315 - Repair of transport equipment, except motor vehicles
Class: 3319 - Repair of other equipment
Class: 3320 - Installation of industrial machinery and equipment