Embed Size (px)
Citation preview
1
An Analysis of Hydrate Conditions and Property Predictions in Acid Gas
Injection Systems
Cory Hendrick
Vicente Hernandez
Michael Hlavinka
Gavin McIntyre
Bryan Research & Engineering, Inc,
Bryan, TX
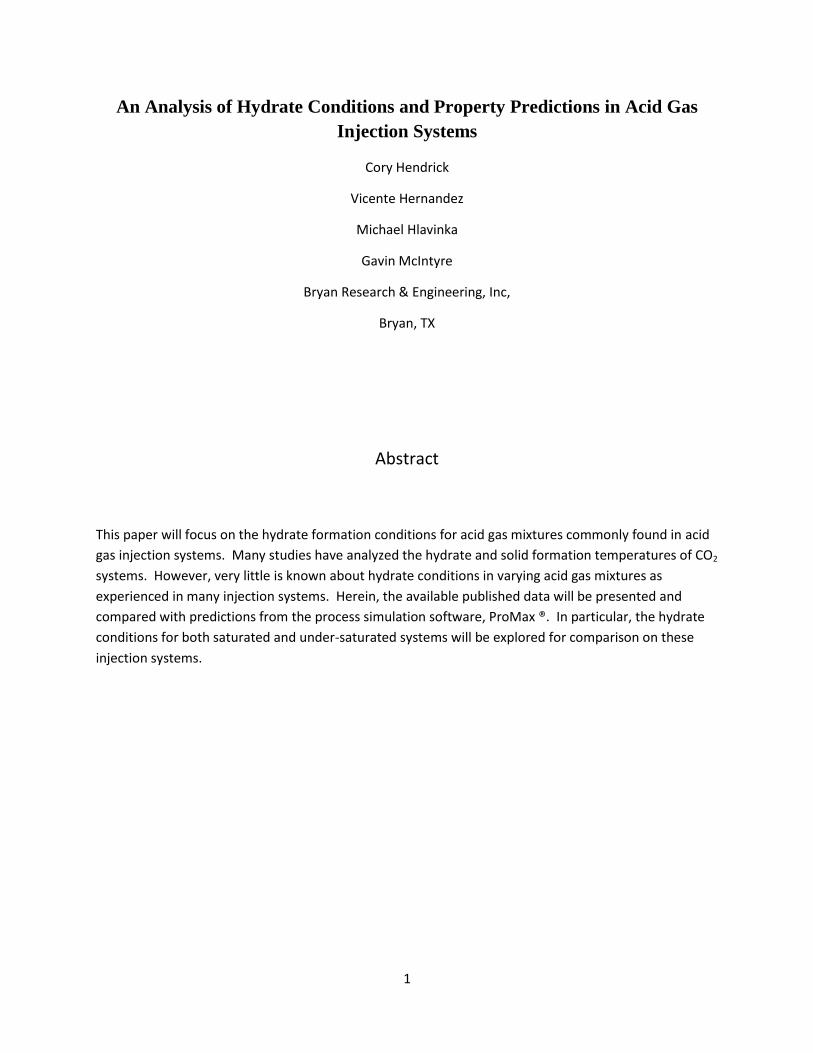
Abstract
This paper will focus on the hydrate formation conditions for acid gas mixtures commonly found in acid
gas injection systems. Many studies have analyzed the hydrate and solid formation temperatures of CO2
systems. However, very little is known about hydrate conditions in varying acid gas mixtures as
experienced in many injection systems. Herein, the available published data will be presented and
compared with predictions from the process simulation software, ProMax ®. In particular, the hydrate
conditions for both saturated and under-saturated systems will be explored for comparison on these
injection systems.
2
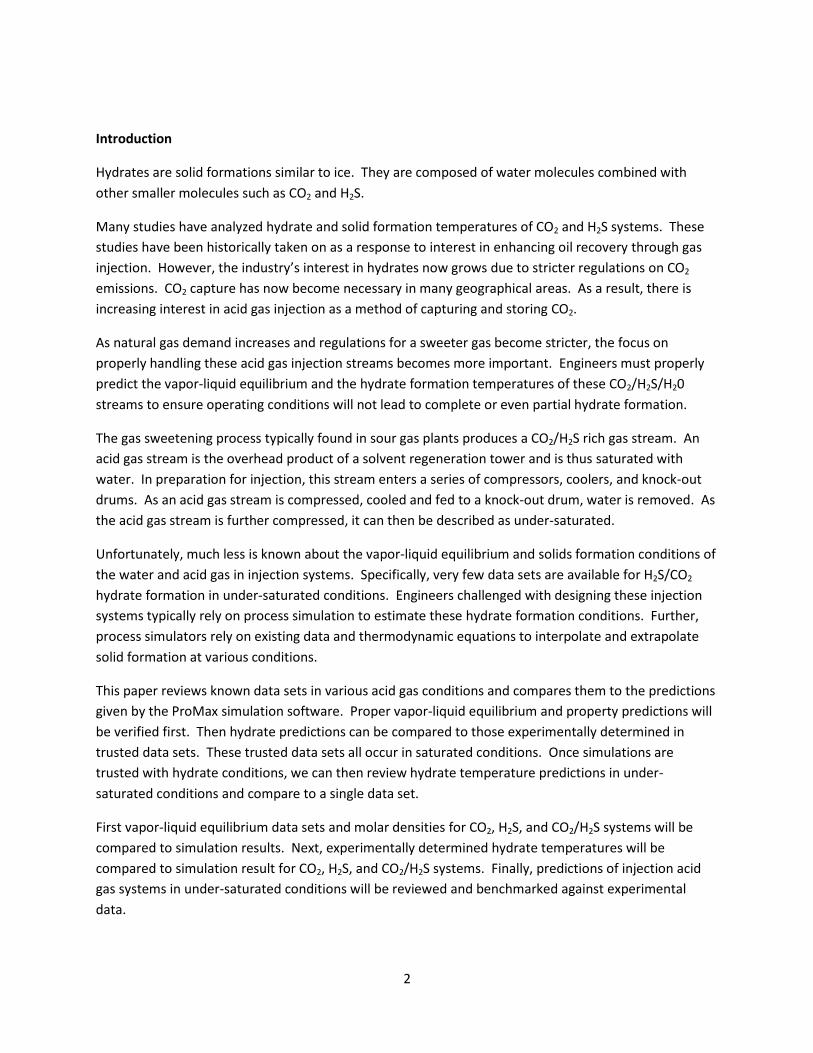
Introduction
Hydrates are solid formations similar to ice. They are composed of water molecules combined with
other smaller molecules such as CO2 and H2S.
Many studies have analyzed hydrate and solid formation temperatures of CO2 and H2S systems. These
studies have been historically taken on as a response to interest in enhancing oil recovery through gas
injection. However, the industry’s interest in hydrates now grows due to stricter regulations on CO2
emissions. CO2 capture has now become necessary in many geographical areas. As a result, there is
increasing interest in acid gas injection as a method of capturing and storing CO2.
As natural gas demand increases and regulations for a sweeter gas become stricter, the focus on
properly handling these acid gas injection streams becomes more important. Engineers must properly
predict the vapor-liquid equilibrium and the hydrate formation temperatures of these CO2/H2S/H20
streams to ensure operating conditions will not lead to complete or even partial hydrate formation.
The gas sweetening process typically found in sour gas plants produces a CO2/H2S rich gas stream. An
acid gas stream is the overhead product of a solvent regeneration tower and is thus saturated with
water. In preparation for injection, this stream enters a series of compressors, coolers, and knock-out
drums. As an acid gas stream is compressed, cooled and fed to a knock-out drum, water is removed. As
the acid gas stream is further compressed, it can then be described as under-saturated.
Unfortunately, much less is known about the vapor-liquid equilibrium and solids formation conditions of
the water and acid gas in injection systems. Specifically, very few data sets are available for H2S/CO2
hydrate formation in under-saturated conditions. Engineers challenged with designing these injection
systems typically rely on process simulation to estimate these hydrate formation conditions. Further,
process simulators rely on existing data and thermodynamic equations to interpolate and extrapolate
solid formation at various conditions.
This paper reviews known data sets in various acid gas conditions and compares them to the predictions
given by the ProMax simulation software. Proper vapor-liquid equilibrium and property predictions will
be verified first. Then hydrate predictions can be compared to those experimentally determined in
trusted data sets. These trusted data sets all occur in saturated conditions. Once simulations are
trusted with hydrate conditions, we can then review hydrate temperature predictions in under-
saturated conditions and compare to a single data set.
First vapor-liquid equilibrium data sets and molar densities for CO2, H2S, and CO2/H2S systems will be
compared to simulation results. Next, experimentally determined hydrate temperatures will be
compared to simulation result for CO2, H2S, and CO2/H2S systems. Finally, predictions of injection acid
gas systems in under-saturated conditions will be reviewed and benchmarked against experimental
data.

3
Vapor-Liquid-Equilibrium
Proper determination and interpretation of hydrate formation boundaries requires understanding of the
vapor-liquid equilibrium and the variables which can affect their boundaries. Certainly, composition,
temperature, and pressure of a system play an important role in vapor-liquid equilibrium and hydrate
formation. Moreover, the effect of composition on hydrate potential is magnified as the operating
pressure increases. At pressures found in acid gas injection systems, simple gas gravity correlations to
determine water content must be abandoned for experimental data or more rigorous VLE calculations.
Therefore, any simulation predictions must be compared to trusted data sets of vapor-liquid equilibrium
for general agreement.
Presented in Figure 1 is a graph displaying the water content, in grams of H20 per m3, of a CO2 system at
varying temperatures as a function of pressure. Data from GPA report RR-99[1] at 25o C are plotted
along with simulation predications at various temperatures. This graph is similar in design to that
provided by Strickland [2] and includes the minimum water content line at 43o C condition. The purpose
of this graph is to verify that composition predictions agree with published and trusted data.
Obviously, pressure and temperature both influence the composition of a gas stream. The 43o C line
contains a trough near70 bar. The bottom of this trough represents the minimum amount of water the
CO2 gas can hold at 43o C at that corresponding pressure. As Strickland pointed out, much of the water
can be removed at the trough of the curve during the first or second compression stage of injection
systems through a knock-out drum. Once the water is dropped out in a knock-out drum, any increase in
pressure will result in under-saturated conditions at that same temperature.
0
1
2
3
4
5
6
0 100 200 300
Wat
er
con
ten
t, g
-H2
O/m
3 g
as
Pressure, bar
Fig. 1. Water Content of CO2-Rich Phase vs Pressure
43 ºC
25 ºC
18 ºC
Min H2OContent
25 ºC (RR-99)

4
Figure 2 is an equivalent graph considering an H2S and H2O only system. Again, ProMax results at
varying temperatures are plotted along with results from GPA RR-48[3] at 37.8o C. A minimum water
content line is also included for the system at 43o C.
Figure 2 shows that water content of H2S gas systems is more sensitive to pressure in the range of 0 to
50 bar than that of the CO2 gas systems. The H2S system in this case does not show a smooth trough but
rather a “cliff.” This “cliff” signifies a phase change.
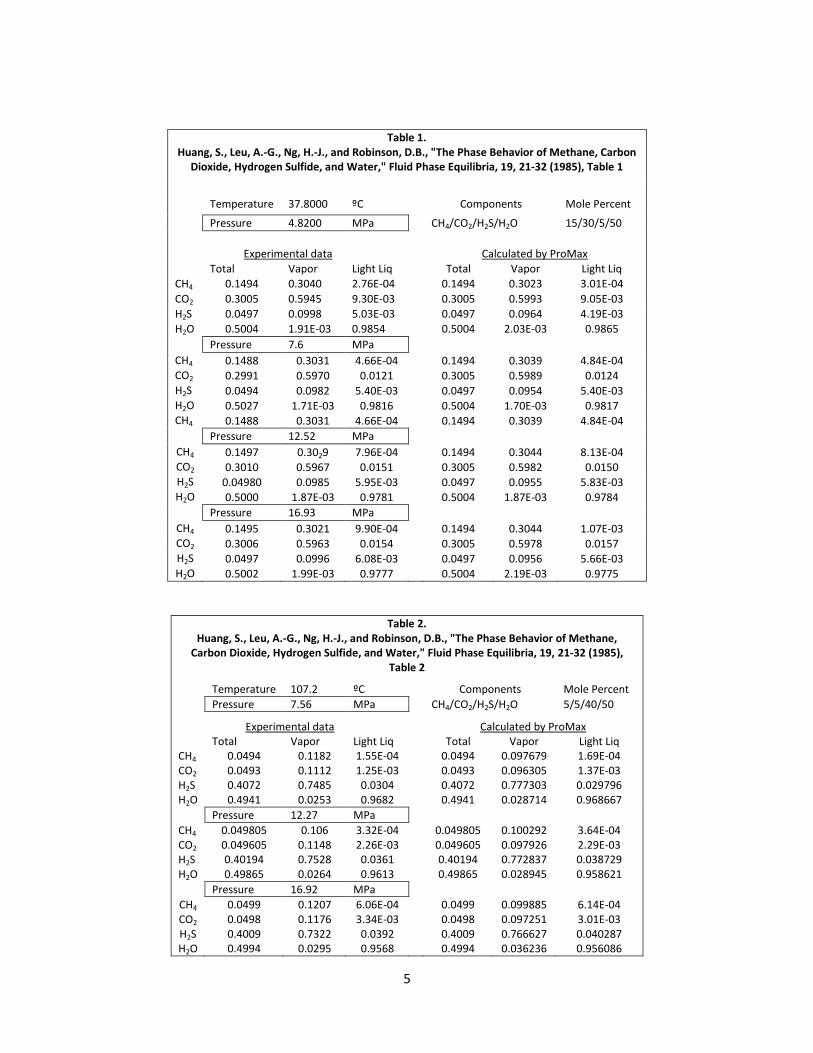
In further consideration of vapor-liquid equilibrium, the interplay of various H2S and CO2 gas
compositions must be reviewed and data should be diligently compared to simulation results. Huang[4]
presented VLE of two different compositions under various temperatures and pressures. Tables 1 and 2
contain portions of the data presented by Huang. Table 1 displays the phase behavior in a stream of
15% CH4, 30% CO2, 5% H2S, and 50% water on a molar basis. Phase data were collected at 37.8o C and at
varying pressures. Table 2 displays the same data at a composition of 5% CH4, 5% CO2, 40% H2S, and
50% water on a molar basis. The simulation results are listed beside for comparison.
0
2
4
6
8
10
12
14
16
18
0 50 100 150 200 250 300
Wat
er
con
ten
t, g
H2
O/m
3 g
as
Pressure, bar
Fig. 2. Water Content for H2S-Rich Phase vs Pressure
37.8 ºC(RR-48)43 ºC
37.8 ºC
25 ºC
18 ºC
Min H2OContent
5
Table 1. Huang, S., Leu, A.-G., Ng, H.-J., and Robinson, D.B., "The Phase Behavior of Methane, Carbon
Dioxide, Hydrogen Sulfide, and Water," Fluid Phase Equilibria, 19, 21-32 (1985), Table 1
Temperature 37.8000 ºC Components Mole Percent
Pressure 4.8200 MPa CH4/CO2/H2S/H2O 15/30/5/50
Experimental data Calculated by ProMax
Total Vapor Light Liq Total Vapor Light Liq
CH4 0.1494 0.3040 2.76E-04 0.1494 0.3023 3.01E-04
CO2 0.3005 0.5945 9.30E-03 0.3005 0.5993 9.05E-03
H2S 0.0497 0.0998 5.03E-03 0.0497 0.0964 4.19E-03
H2O 0.5004 1.91E-03 0.9854 0.5004 2.03E-03 0.9865
Pressure 7.6 MPa
CH4 0.1488 0.3031 4.66E-04
0.1494 0.3039 4.84E-04 CO2 0.2991 0.5970 0.0121
0.3005 0.5989 0.0124
H2S 0.0494 0.0982 5.40E-03
0.0497 0.0954 5.40E-03 H2O 0.5027 1.71E-03 0.9816
0.5004 1.70E-03 0.9817
CH4 0.1488 0.3031 4.66E-04
0.1494 0.3039 4.84E-04
Pressure 12.52 MPa
CH4 0.1497 0.3029 7.96E-04
0.1494 0.3044 8.13E-04 CO2 0.3010 0.5967 0.0151
0.3005 0.5982 0.0150
H2S 0.04980 0.0985 5.95E-03
0.0497 0.0955 5.83E-03 H2O 0.5000 1.87E-03 0.9781
0.5004 1.87E-03 0.9784
Pressure 16.93 MPa
CH4 0.1495 0.3021 9.90E-04
0.1494 0.3044 1.07E-03 CO2 0.3006 0.5963 0.0154
0.3005 0.5978 0.0157
H2S 0.0497 0.0996 6.08E-03
0.0497 0.0956 5.66E-03 H2O 0.5002 1.99E-03 0.9777
0.5004 2.19E-03 0.9775
Table 2. Huang, S., Leu, A.-G., Ng, H.-J., and Robinson, D.B., "The Phase Behavior of Methane,
Carbon Dioxide, Hydrogen Sulfide, and Water," Fluid Phase Equilibria, 19, 21-32 (1985), Table 2
Temperature 107.2 ºC Components Mole Percent
Pressure 7.56 MPa CH4/CO2/H2S/H2O 5/5/40/50
Experimental data Calculated by ProMax
Total Vapor Light Liq Total Vapor Light Liq CH4 0.0494 0.1182 1.55E-04
0.0494 0.097679 1.69E-04
CO2 0.0493 0.1112 1.25E-03
0.0493 0.096305 1.37E-03 H2S 0.4072 0.7485 0.0304
0.4072 0.777303 0.029796
H2O 0.4941 0.0253 0.9682
0.4941 0.028714 0.968667
Pressure 12.27 MPa
CH4 0.049805 0.106 3.32E-04
0.049805 0.100292 3.64E-04 CO2 0.049605 0.1148 2.26E-03
0.049605 0.097926 2.29E-03
H2S 0.40194 0.7528 0.0361
0.40194 0.772837 0.038729 H2O 0.49865 0.0264 0.9613
0.49865 0.028945 0.958621
Pressure 16.92 MPa
CH4 0.0499 0.1207 6.06E-04
0.0499 0.099885 6.14E-04 CO2 0.0498 0.1176 3.34E-03
0.0498 0.097251 3.01E-03
H2S 0.4009 0.7322 0.0392
0.4009 0.766627 0.040287 H2O 0.4994 0.0295 0.9568
0.4994 0.036236 0.956086

6
From a sampling of these VLE data, water content is calculated on a lbm H2O/MMSCF basis, and plotted
along with simulation results in Figures 3 and 4. Note the dramatic roles temperature, pressure, and
composition play on vapor-liquid equilibrium. It should be noted that simulation results closely match
experimental data.
10.00
100.00
1000.00
10000.00
0 5 10 15 20
lbm
-H2
O/M
MSC
F
Pressure, MPa
Fig. 3. Water Content vs Pressure for a Mixture of CH4/CO2/H2S/H2O with 15/30/5/50 % mol
37.8 ºC Expt
37.8 ºC ProMax
107.2 ºC Expt
107.2 ºC ProMax
176.7 ºC Expt
176.7 ºC ProMax

7
While the data sets represented in Figures 3 and 4 may not reflect the realistic compositions of an acid
gas injection stream, it is important that simulations thermodynamically match trusted data sets. It has
now been shown that ProMax is accurately simulating the known VLE data sets. The same
thermodynamic principles utilized thus far will be relied upon to simulate in regions where little data
have been published.
Property Predictions - Molar Densities
In consideration of equipment design, thermodynamic property predictions from simulation should be
considered also. The varying densities and static head may have tremendous influence on compressor
sizing calculations. Experimental data of the molar density of a H2S/CO2 rich stream will be analyzed and
compared to simulation predictions.
Table 3 represents data from GPA RR-174[9] and reports experimental densities at varying pressures
and H2S/CO2 molar ratios. These compositions combined with 5% methane mirror many injection
system conditions. ProMax results are inserted next to the experimental results for comparison.
100.00
1000.00
10000.00
0 5 10 15 20
lbm
-H2
O/M
MSC
F
Pressure, MPa
Fig. 4. Water Content vs Pressure for a Mixture of CH4/CO2/H2S/H2O with 5/5/40/50 % mol
37.8 ºC Expt
37.8 ºC ProMax
107.2 ºC Expt
107.2 ºC ProMax
176.7 ºC Expt
176.7 ºC ProMax

8
Table 3 GPA RR-174 Tables 5 & 11
Temperature = 120 ºF Density H2S/CO2
rich phase
H2S/CO2 RR-174 ProMax
P /psia mole ratio g/cm3 g/cm3
200 1:3 0.023 0.0220
1500 1:3 *0.178* 0.3561
4000 1:3 0.776 0.7964
10000 1:3 0.920 0.9883
200 1:1 0.021 0.0210
1500 1:1 0.581 0.5679
3000 1:1 0.720 0.7418
5000 1:1 0.787 0.8350
Simulation utilized a modified Peng-Robinson equation of state for calculation of density. This equation
of state produces very good approximations for near and above critical conditions. The Peng-Robinson
method therefore proves to be of value when approaching critical conditions. The data point for
1500psia at the 1:3 molar ratio is of suspect quality as several different calculation methods agreed on
the calculated density of reported at 0.3561 g/cm3. Figures 5 and 6 graphically represent the
information in Table 3.
0
2000
4000
6000
8000
10000
12000
0.000 0.200 0.400 0.600 0.800 1.000 1.200
Pre
ssu
re, p
sia
Density, g/cm^3
Fig. 5. Molar Density vs. Pressure for a 1:3 H2S/CO2 Ratio
RR-175 (1:3)
ProMax (1:3)
9
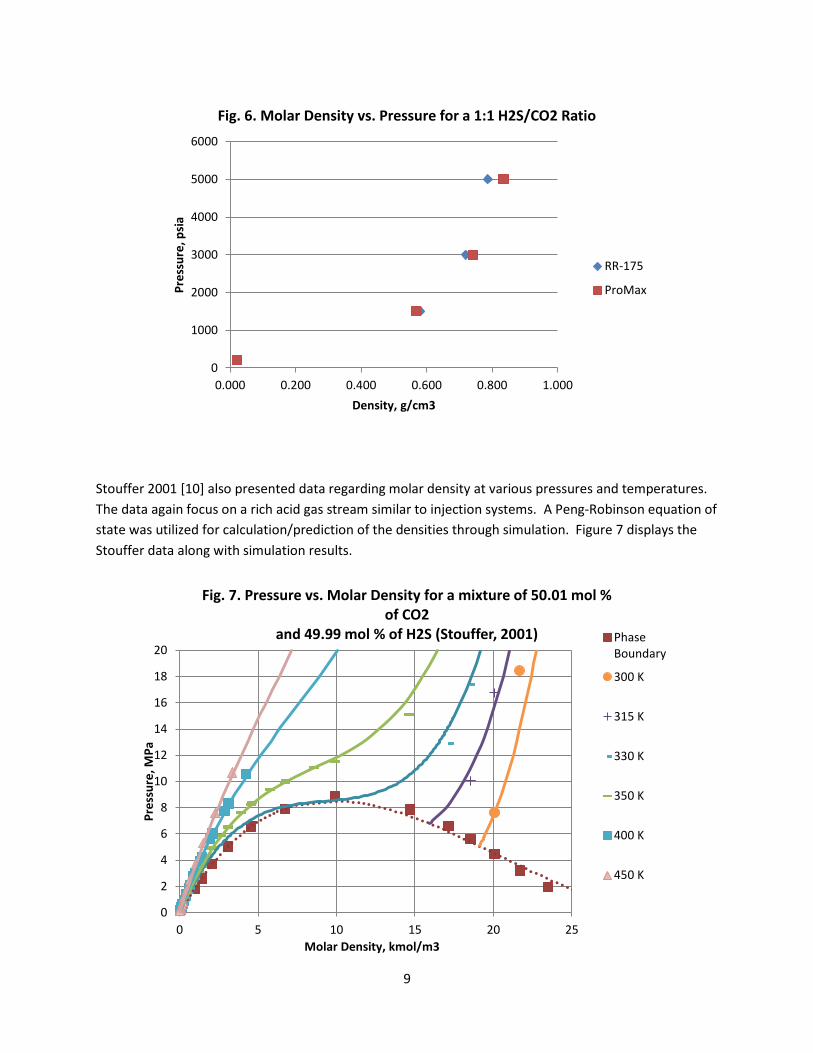
Stouffer 2001 [10] also presented data regarding molar density at various pressures and temperatures.
The data again focus on a rich acid gas stream similar to injection systems. A Peng-Robinson equation of
state was utilized for calculation/prediction of the densities through simulation. Figure 7 displays the
Stouffer data along with simulation results.
0
1000
2000
3000
4000
5000
6000
0.000 0.200 0.400 0.600 0.800 1.000
Pre
ssu
re, p
sia
Density, g/cm3
Fig. 6. Molar Density vs. Pressure for a 1:1 H2S/CO2 Ratio
RR-175
ProMax
0
2
4
6
8
10
12
14
16
18
20
0 5 10 15 20 25
Pre
ssu
re, M
Pa
Molar Density, kmol/m3
Fig. 7. Pressure vs. Molar Density for a mixture of 50.01 mol % of CO2
and 49.99 mol % of H2S (Stouffer, 2001) PhaseBoundary
300 K
315 K
330 K
350 K
400 K
450 K

10
Simulation results utilizing the Peng-Robinson equations of state for density calculations follow very
closely to experimental results up to pressures of 18MPa.
Saturated CO2 Hydrates
With confidence that simulation VLE and density calculations matches trusted experimental data sets,
the hydrate formation points should subsequently be reviewed for general agreement between
published datasets and simulation or calculation methods.
Figure 8 displays the data points of several different sources which experimentally measured hydrate
points in the three phase region of CO2/H2O systems [5]. Simulation results of those same conditions
are also plotted for comparison. Notice the general agreement.
At a given pressure, as temperature is dropped from the right side of the graph to the left, there are two
potential hydrate formation temperatures in the pressure range of 1000 to 4000 kPa. Also note high
pressures of approximately 5000 kPa to 10000 kPa have little influence on the hydrate formation
temperatures. This is due to the relative incompressibility of liquids and can be seen by reviewing the
Lw-H-LCO2 curve above on Figure 5. This curve is verified by the Ng[9] data points, also plotted on
Figure 8.
100
1000
10000
250 260 270 280 290
Pre
ssu
re, k
Pa
Temperature, K
Fig. 8. Three Phase Hydrate Data for CO2 Hydrates
Deaton and Frost(1946)Unruh and Katz(1949)Larson (1955)
Robinson and Metha(1971)Ng and Robinson(1985)Adisasmito (1991)
ProMax Ice Locus
ProMax I-H-V
ProMax Lw-H-V
ProMax LCO2-V-H
ProMax Lw-H-LCO2

11
The potential effect of a light hydrocarbon such as methane should also be considered. Table 4 lists
results as presented by Fan[6] for a CH4/CO2/H2O system along with simulation results. The table is then
plotted for easier comparison in Figure 6.
Table 4. Fan and Guo (1999) Lw-H-V
Components Mole Percent
CH4/CO2 3.46/96.54
Experimental ProMax
p /kPa
T exp / K Tcal /K
1100 273.5 272.0
1160 273.6 272.5
1200 273.7 272.8
1950 277.2 277.2
1940 277.6 277.1
2050 277.9 277.6
3000 280.4 280.8
3730 281.7 282.4
4800 282.3 284.0
Table 4 and Figure 9 represent only the Lw-H-V hydrate points. There are many more data sets of
similar type and of different loci which will not be analyzed or compared in this paper.
It has now been shown the ProMax simulation results closely mirror experimental hydrate data for CO2
three phase systems at varying temperatures, pressures, and compositions.
270
272
274
276
278
280
282
284
286
1000 10000
Tem
pe
ratu
re, K
Pressure, kPa
Fig. 9. Hydrate Temperature for Mixture of 3.46 % mol of CH4 in 96.54 % mol CO2
Fan and Guo (1999)
ProMax Lw-H-V

12
Saturated H2S Hydrates
Just as was done with the CO2 system, known and trusted H2S hydrate data sets must be analyzed and
compared to simulation results.
Figure 10 is a plot of H2S hydrate points for a H2S/H2O three phase system. Again, several sources are
plotted along with simulation results[5]. The Lw-H-LH2S locus and Selleck data demonstrate pressure’s
minor influence on hydrate temperatures at above 2000 kPa, again due to the relative incompressibility
of liquids
Table 5 is data as presented by Selleck[7] and considers the specific region of 50-250 bar of a saturated
H2S stream. The simulation results are presented for comparison.
10
1000
100000
240 260 280 300 320
Pre
ssu
re, k
Pa
Temperature, K
Fig 10. Three Phase Hydrate for H2S
Selleck (1952)
Carroll and Mather(1991)
ProMax Lw-H-LH2S
ProMax Ice Locus
ProMax I-H-V
ProMax Lw-H-V
ProMax LH2S-V-H

13
Table 5. Selleck, F.T., Carmichael L. T., Sage B. H., Ind.
Eng. Chem., 44, 2219(1952) Experimental ProMax
P /bar T exp / C Tcal /C
34.47 29.65 29.48
68.95 29.95 29.75
78.26 30.05 29.83
103.42 30.25 30.01
137.9 30.55 30.24
141.9 30.55 30.27
172.37 30.85 30.47
206.85 31.15 30.71
209.54 31.15 30.74
241.32 31.45 30.93
With the presentation of Table 5 and Figure 11, it is shown that simulation results follow closely to that
of trusted data sets for H2S systems hydrate temperatures.
Thus far, vapor-liquid equilibrium data, pure component three phase hydrates, and hydrate formation of
two and three component systems have been analyzed and compared to simulation results. Simulation
results follow those data sets closely.
25
26
27
28
29
30
31
32
33
34
35
0 100 200 300
Hyd
rati
on
fo
rmat
ion
te
mp
era
ture
, ºC
Pressure, bar
Fig. 11. Hydrate Temperature for Saturated H2S System
ProMax
Selleck, 1952
14
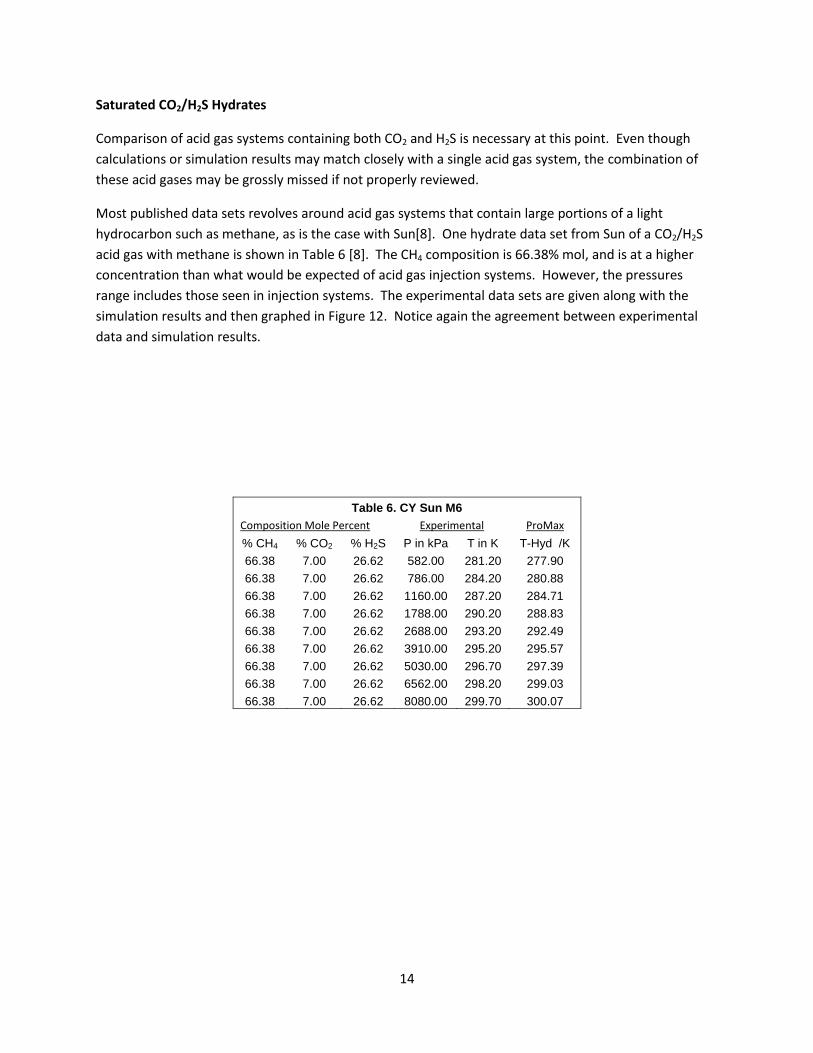
Saturated CO2/H2S Hydrates
Comparison of acid gas systems containing both CO2 and H2S is necessary at this point. Even though
calculations or simulation results may match closely with a single acid gas system, the combination of
these acid gases may be grossly missed if not properly reviewed.
Most published data sets revolves around acid gas systems that contain large portions of a light
hydrocarbon such as methane, as is the case with Sun[8]. One hydrate data set from Sun of a CO2/H2S
acid gas with methane is shown in Table 6 [8]. The CH4 composition is 66.38% mol, and is at a higher
concentration than what would be expected of acid gas injection systems. However, the pressures
range includes those seen in injection systems. The experimental data sets are given along with the
simulation results and then graphed in Figure 12. Notice again the agreement between experimental
data and simulation results.
Table 6. CY Sun M6
Composition Mole Percent Experimental ProMax
% CH4 % CO2 % H2S P in kPa T in K T-Hyd /K
66.38 7.00 26.62 582.00 281.20 277.90
66.38 7.00 26.62 786.00 284.20 280.88
66.38 7.00 26.62 1160.00 287.20 284.71
66.38 7.00 26.62 1788.00 290.20 288.83
66.38 7.00 26.62 2688.00 293.20 292.49
66.38 7.00 26.62 3910.00 295.20 295.57
66.38 7.00 26.62 5030.00 296.70 297.39
66.38 7.00 26.62 6562.00 298.20 299.03
66.38 7.00 26.62 8080.00 299.70 300.07

15
It has now been shown that simulation results closely agree with experimental data for hydrate
temperatures of CO2/H2S/CH4 systems. Further, this data set is at pressures comparable to acid gas
injection systems.
Under-saturated Systems
As stated in the introduction, several operating conditions of acid gas injection systems are in under-
saturated conditions. However, very little experimental data have been published and presented for
these conditions. What little data that are published are of suspect quality as will be shown. ProMax
VLE and hydrate calculation methods are not adjusted in these operating regions to fit data. Rather, the
methodology used in the previous saturated conditions are continued here.
275.00
280.00
285.00
290.00
295.00
300.00
305.00
100.00 1000.00 10000.00
Tem
pe
ratu
re, K
Pressure, kPa
Fig.12. Hydrate Formation Temperature (Sun M6) 66.38% CH4 + 7.00% CO2 + 26.62% H2S
Sun M6
ProMax

16
Below in Tables 7 and 8 are data sets presented by Song[9] for hydrate formation temperatures of CO2
systems at varying pressures. These tables also contains ProMax simulation results. Figures 13 and 14
represent Tables 7 and 8 respectively.
Table. 7 Song, K. Y. and Kobayashi, R., "Water Content of CO2 in Equilibrium with Liquid Water and/or Hydrates, SPE Formation Evaluation, 2(4), 500-
508 (1987)
Pressure y-H2O Experimental ProMax
P /psia * 1000 THyd /F THyd /F
100 0.1800 -6.52 -2.04
100 0.2190 -2.20 1.52
100 0.5570 17.60 20.05
200 0.1142 -0.40 2.06
200 0.1471 4.67 6.81
200 0.2201 12.20 14.58
200 0.4885 28.40 30.73
300 0.2775 32.00 26.37
300 0.4368 36.50 36.04
300 0.2321 24.25 22.66
300 0.1194 9.50 9.34
300 0.0890 3.20 3.67
300 0.2013 -4.90 -1.05
300 0.1361 -18.40 -1.05
17
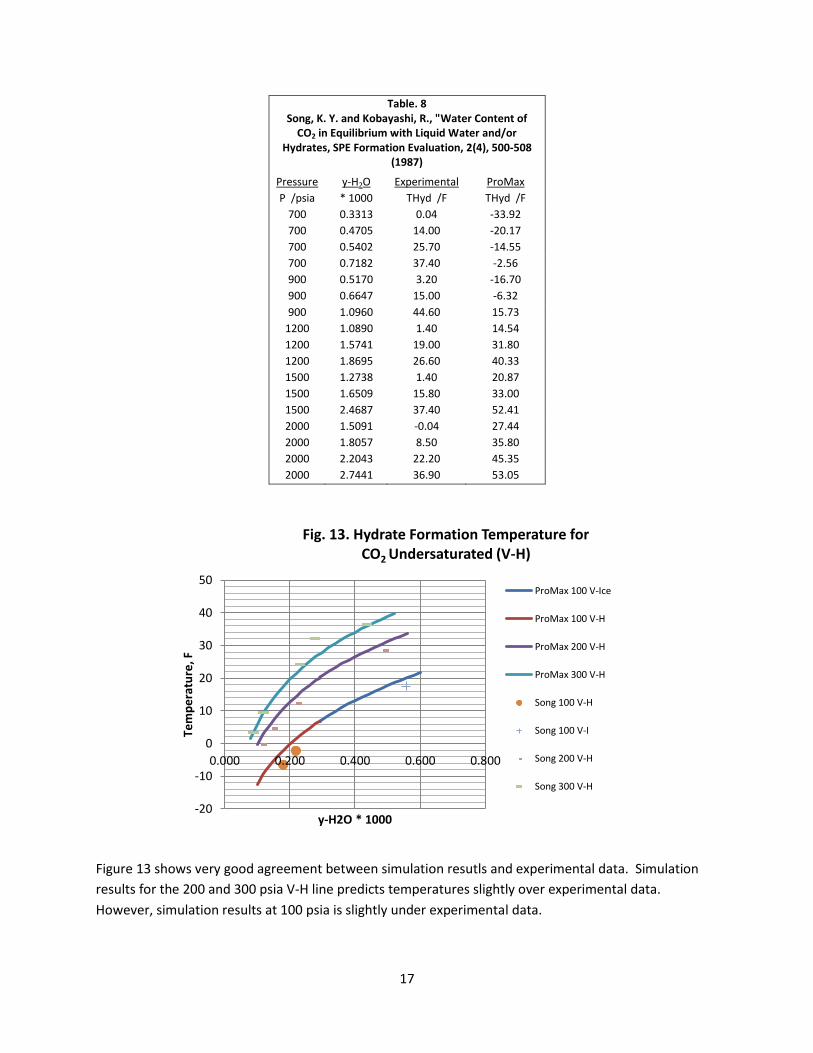
Table. 8 Song, K. Y. and Kobayashi, R., "Water Content of
CO2 in Equilibrium with Liquid Water and/or Hydrates, SPE Formation Evaluation, 2(4), 500-508
(1987)
Pressure y-H2O Experimental ProMax
P /psia * 1000 THyd /F THyd /F
700 0.3313 0.04 -33.92
700 0.4705 14.00 -20.17
700 0.5402 25.70 -14.55
700 0.7182 37.40 -2.56
900 0.5170 3.20 -16.70
900 0.6647 15.00 -6.32
900 1.0960 44.60 15.73
1200 1.0890 1.40 14.54
1200 1.5741 19.00 31.80
1200 1.8695 26.60 40.33
1500 1.2738 1.40 20.87
1500 1.6509 15.80 33.00
1500 2.4687 37.40 52.41
2000 1.5091 -0.04 27.44
2000 1.8057 8.50 35.80
2000 2.2043 22.20 45.35
2000 2.7441 36.90 53.05
Figure 13 shows very good agreement between simulation resutls and experimental data. Simulation
results for the 200 and 300 psia V-H line predicts temperatures slightly over experimental data.
However, simulation results at 100 psia is slightly under experimental data.
-20
-10
0
10
20
30
40
50
0.000 0.200 0.400 0.600 0.800
Tem
pe
ratu
re, F
y-H2O * 1000
Fig. 13. Hydrate Formation Temperature for CO2 Undersaturated (V-H)
ProMax 100 V-Ice
ProMax 100 V-H
ProMax 200 V-H
ProMax 300 V-H
Song 100 V-H
Song 100 V-I
Song 200 V-H
Song 300 V-H

18
In Figure 14, ProMax results grossly disagree with experimental data. However, the pressure influence
on hydrate temperatures as shown by the experimental data is very interesting. Experimental data
suggest that pressure greatly impacts hydrate temperatures in this LCO2-H region. However, Figures 5
and 7 both demonstrated that pressure has very little influence on the hydrate temperatures in the
LCO2-H and LH2S-H region. As a result, ProMax predictions show hydrate lines very close to each other
for the different pressures. Unquestionably, more experimental data is required in this region.
While no reliable data exists, the results from ProMax should be extendable into the under-saturated
region since the results are based on sound thermodynamic principles.
Conclusions
This paper has reviewed a wide array of conditions to ensure the ProMax simulation software’s ability to
determine hydrate points is built from solid foundations. By comparison to experimental data, the
vapor-liquid equilibrium was shown to be accurately predicted under varying conditions by simulation as
well as important property predictions. Then hydrate predictions in a variety of saturated systems were
shown to agree with known and trusted published data sets.
Under-saturated experimental data sets of hydrate predictions were critically analyzed against
simulation results. The critical analysis concluded the data must be supplemented with additional
experimental results. However, holding to sound thermodynamic principles, ProMax should extend into
these regions for hydrate calculations.
Engineers are increasing relying on simulation software for hydrate predictions in acid gas injection
systems. This paper sufficiently proves that ProMax can be trusted to provide accurate results for these
CO2/H2S under-saturated systems.
-100
-80
-60
-40
-20
0
20
40
60
0.000 1.000 2.000 3.000
Tem
pe
ratu
re, F
y-H2O * 1000
Fig. 14. Hydrate Formation Temperature for CO2 Undersaturated (LCO2-H)
ProMax 700 LCO2-H
ProMax 700 Dry Ice
ProMax 900 LCO2-H
ProMax 1200 LCO2-H
ProMax 1500 LCO2-H
ProMax 2000 LCO2-H
ProMax 2000 Dry Ice
Song 700 LCO2-H
Song 900 LCO2-H
Song 1200 LCO2-H
Song 1500 LCO2-H
Song 2000 LCO2-H

19
References
1. Research Report RR-99 The Water Content of CO2-rich Fluids in Equilibrium with Liquid Water
and/or Hydrates, Gas Processors Association, June 1986
2. Ariyapadi, S., Strickland, J., and Rios J., “Study evaluates design of high-capacity CO2 injection
plants,” Oil and Gas Journal, pp 74-84 (Sept. 4, 2006)
3. Research Report RR-48 Vapor-Liquid and Liquid-Liquid Equilibria: Water-Methane, Water-
Carbon Dioxide, Water-Hydrogen Sulfide, Water-n-Pentane, Water-Methane-n-Pentane, Gas
Processors Association, April 1982
4. Huang, S., Leu, A.-G., Ng, H.-J., and Robinson, D.B., "The Phase Behavior of Methane, Carbon
Dioxide, Hydrogen Sulfide, and Water," Fluid Phase Equilibria, 19, 21-32 (1985)
5. Sloan, D. and Koh, C., Clathrate Hydrates of Natural Gases, CRC Press 3rd Edition (2008)
6. Fan, S. –S., and Guo, T. –M., “Hydrate Formation of CO2-Rich Binary and Quaternary Gas
Mixtures in Aqueous Sodium Chloride Solutions,” J. Chem. Eng. Data, 44, 829-832 (1999)
7. Selleck, F. T., Carmichael, L. T., and Sage, B. H., “Phase Behavior in the Hydrogen Sulfide-Water
System,” Ind. Eng. Chem., 44(9), 2219-2226 (1952)
8. Sun, C. –Y., Chen, G. –J., Lin, W., and Guo, T. –M., J. Chem. Eng. Data, 48, 600-602 (2003)
9. Song, K. Y. and Kobayashi, R., "Water Content of CO2 in Equilibrium with Liquid Water and/or
Hydrates, SPE Formation Evaluation, 2(4), 500-508 (1987)
10. Research Report RR-174 Water Content of Natural Gas Systems Containing Acid Gas, Gas
Processors Association, January 2001
11. Souffer, Carl E., Kellerman, Scott J., Hall, Kenneth R., and Holste, James C., “Densities of Carbon
Dioxide + Hydrogen Sulfide Mixtures from 220K to 450K at Pressures up to 25 MPa,” J.Chem.
Eng. Data, 46, 1309-1318 (2001)