Embed Size (px)
Citation preview
An Analysis of Historical Aviation Accident Data
Presented By:Nastaran Coleman Ph.D.
FAA Investment Analysis and Operations Research
Outline
Safety’s Role in the FAAUses of Historical Data
AssumptionsAccident Rates Trends
Accidents by CategoriesWeather Accidents
Accidents by Phase of FlightDay/Night Accidents
Preventative Safety Programs
Safety
• Safety is the FAA’s primary mission
• FAA’s GOAL - Achieve the lowest possible accident rate and constantly improve safety.
• Set the bar for aviation safety around the world- Have done for almost a half century.
Safety- (Continued)
• Develop new technology to increase safety
• Improve FAA’s risk management practices – collecting and analyzing data to identify
problems and prevent accidents from occurring
• Improve runway safety• Continue to partner with industry to
reduce the commercial accident rate
Use Historical Accident Statistics To help FAA Achieve its Goal…
Claim
Historical Data
• Historical accident statistics can be used – to predict future accident rates for various
alternatives– to evaluate the effect of a safety program by
comparing data before and after program implementation
– to identify safety risks so that the return on investment is maximized
Historical Data (continued)
• Historical accident data – Can help derive the pool of safety benefits – Can help establish the effectiveness of new
programs
Inputs and Assumptions
• Used the NTSB data base and included– All accidents in or before 2001– “Airplanes” and “helicopters” – FAR Parts 91, 135 and 121
• Built categories of accidents using a combination of NTSB “Cause-Factor” codes, “Subject Modifiers,” and selected keywords in brief reports
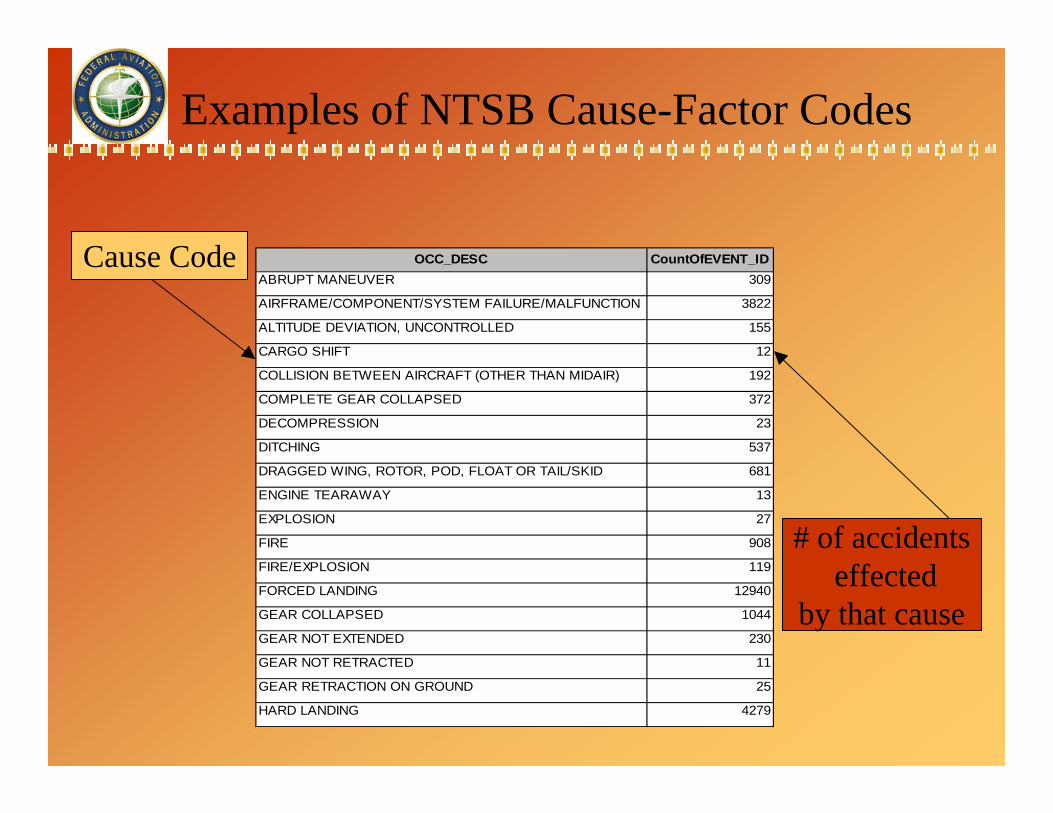
Examples of NTSB Cause-Factor Codes
OCC_DESC CountOfEVENT_IDABRUPT MANEUVER 309
AIRFRAME/COMPONENT/SYSTEM FAILURE/MALFUNCTION 3822
ALTITUDE DEVIATION, UNCONTROLLED 155
CARGO SHIFT 12
COLLISION BETWEEN AIRCRAFT (OTHER THAN MIDAIR) 192
COMPLETE GEAR COLLAPSED 372
DECOMPRESSION 23
DITCHING 537
DRAGGED WING, ROTOR, POD, FLOAT OR TAIL/SKID 681
ENGINE TEARAWAY 13
EXPLOSION 27
FIRE 908
FIRE/EXPLOSION 119
FORCED LANDING 12940
GEAR COLLAPSED 1044
GEAR NOT EXTENDED 230
GEAR NOT RETRACTED 11
GEAR RETRACTION ON GROUND 25
HARD LANDING 4279
Cause Code
# of accidentseffected
by that cause
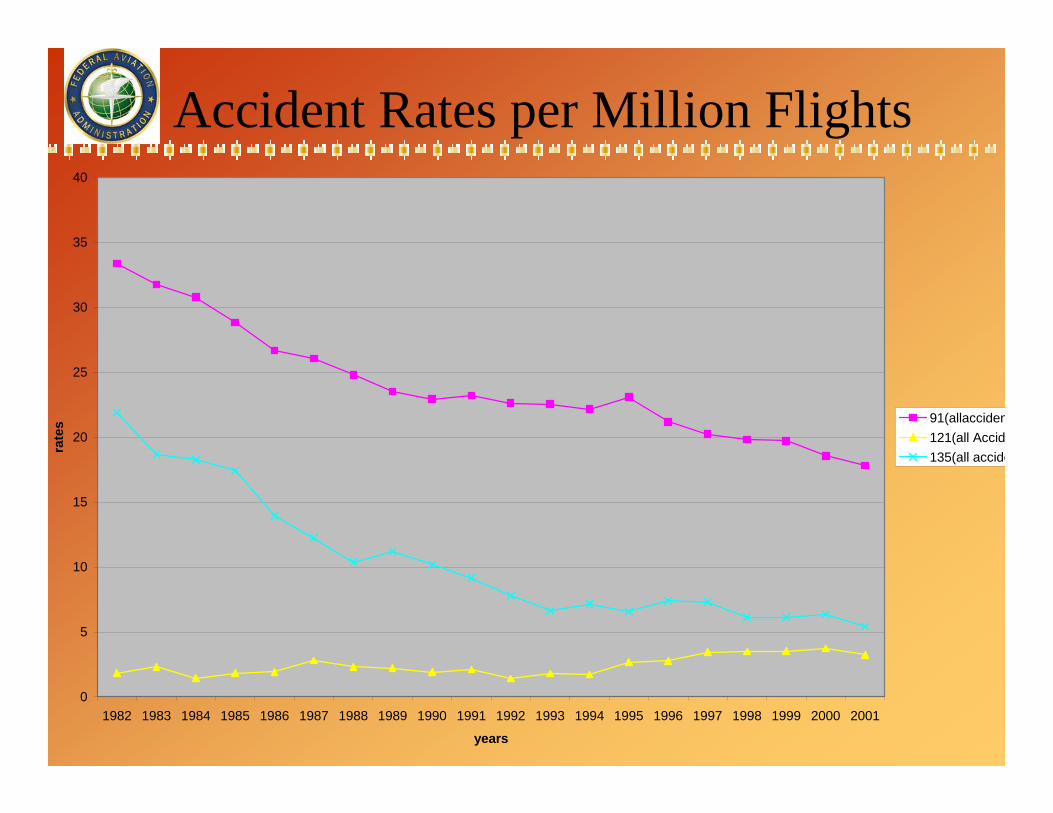
Accident Rates per Million Flights
0
5
10
15
20
25
30
35
40
1982 1983 1984 1985 1986 1987 1988 1989 1990 1991 1992 1993 1994 1995 1996 1997 1998 1999 2000 2001
years
rate
s 91(allacciden121(all Accid135(all accide
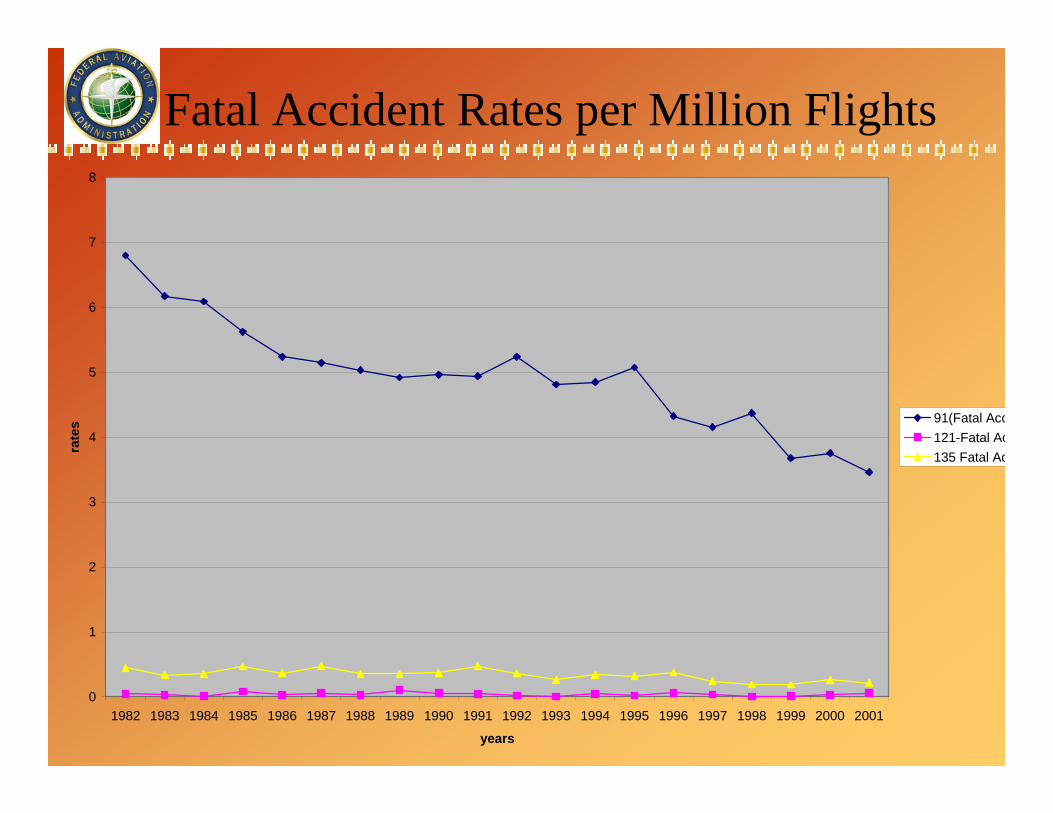
Fatal Accident Rates per Million Flights
0
1
2
3
4
5
6
7
8
1982 1983 1984 1985 1986 1987 1988 1989 1990 1991 1992 1993 1994 1995 1996 1997 1998 1999 2000 2001
years
rate
s 91(Fatal Acc121-Fatal Ac135 Fatal Ac
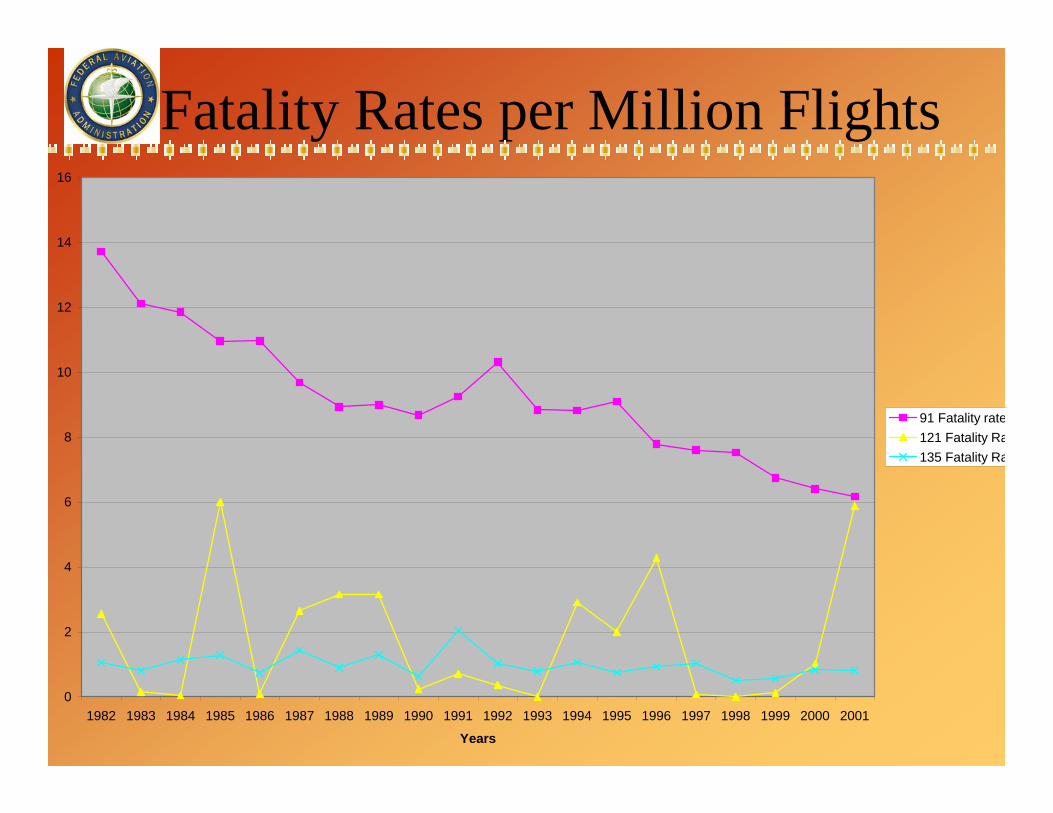
Fatality Rates per Million Flights
0
2
4
6
8
10
12
14
16
1982 1983 1984 1985 1986 1987 1988 1989 1990 1991 1992 1993 1994 1995 1996 1997 1998 1999 2000 2001
Years
91 Fatality rate121 Fatality Ra135 Fatality Ra
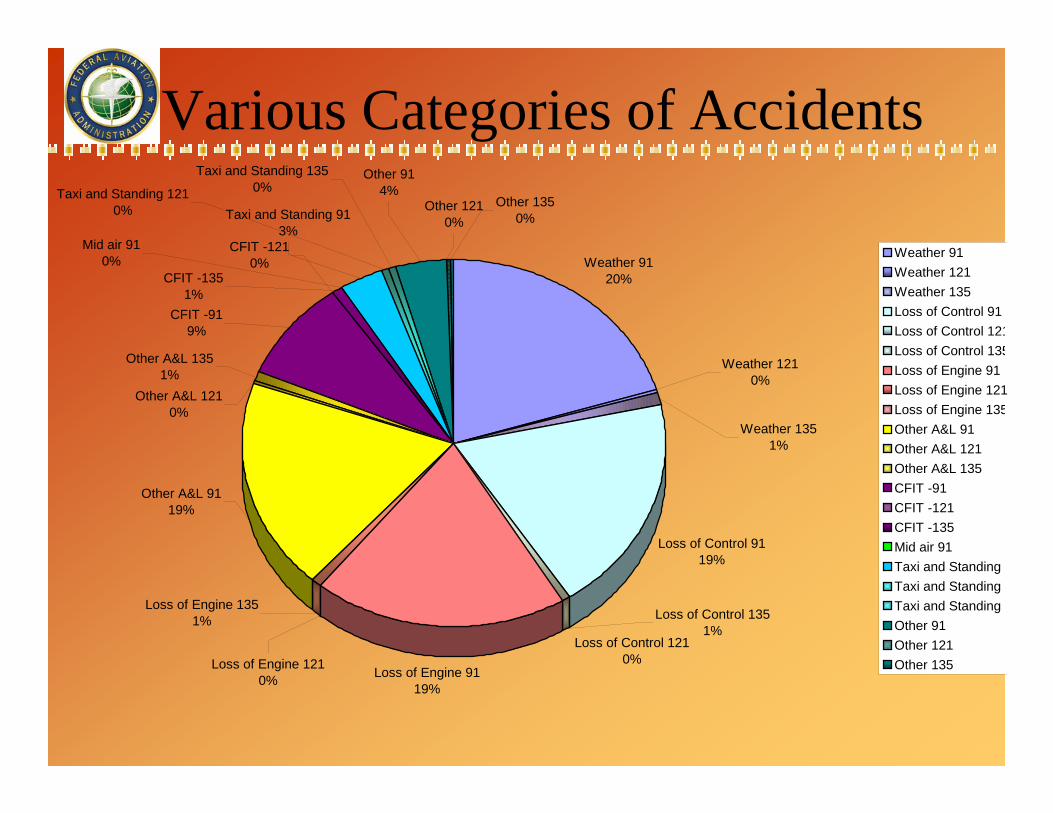
Various Categories of Accidents
Weather 9120%
Loss of Control 9119%
Loss of Control 1210%
Loss of Engine 9119%
CFIT -1210%
Taxi and Standing 913%
Taxi and Standing 1210%
CFIT -919%
CFIT -1351%
Mid air 910%
Taxi and Standing 1350%
Other 914%
Other 1210%
Other 1350%
Other A&L 9119%
Other A&L 1210%
Other A&L 1351%
Loss of Engine 1210%
Loss of Engine 1351% Loss of Control 135
1%
Weather 1210%
Weather 1351%
Weather 91Weather 121Weather 135Loss of Control 91Loss of Control 121Loss of Control 135Loss of Engine 91Loss of Engine 121Loss of Engine 135Other A&L 91Other A&L 121Other A&L 135CFIT -91CFIT -121CFIT -135Mid air 91Taxi and Standing 9Taxi and Standing Taxi and Standing Other 91Other 121Other 135
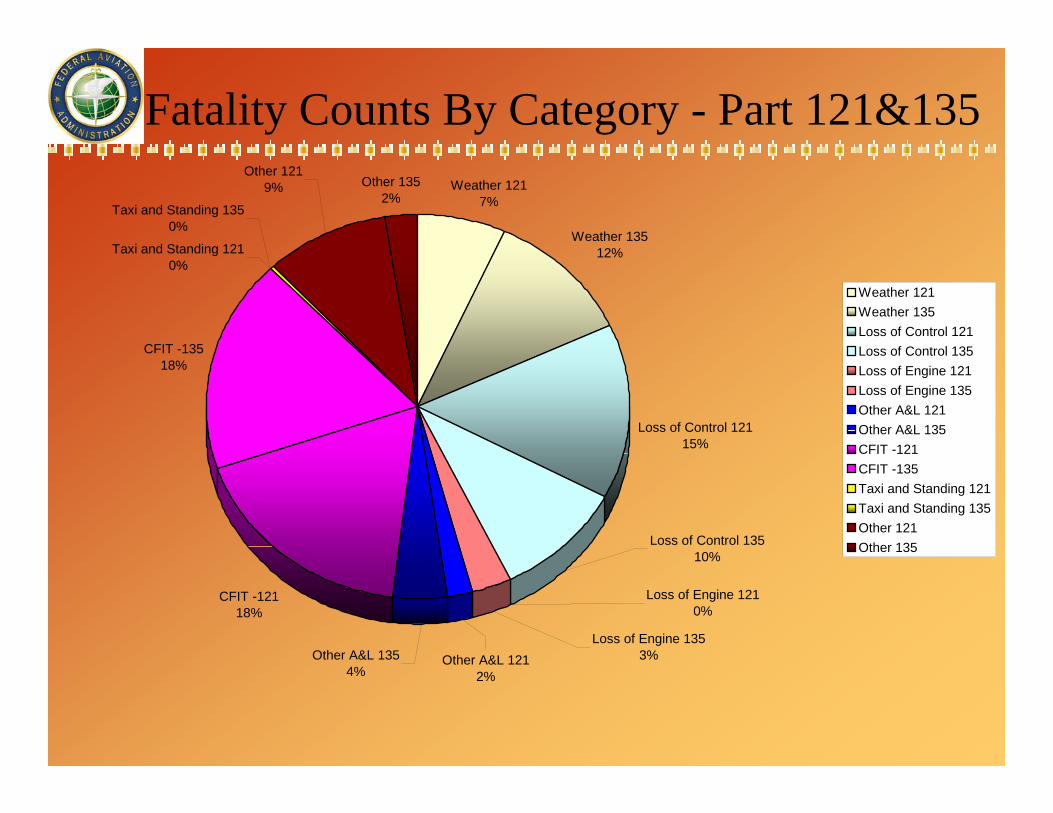
Fatality Counts By Category - Part 121&135Weather 121
7%
Weather 13512%
Loss of Control 12115%
CFIT -12118%
CFIT -13518%
Taxi and Standing 1210%
Taxi and Standing 1350%
Other 1219% Other 135
2%
Other A&L 1212%
Other A&L 1354%
Loss of Engine 1210%
Loss of Engine 1353%
Loss of Control 13510%
Weather 121Weather 135Loss of Control 121Loss of Control 135Loss of Engine 121Loss of Engine 135Other A&L 121Other A&L 135CFIT -121CFIT -135Taxi and Standing 121Taxi and Standing 135Other 121Other 135
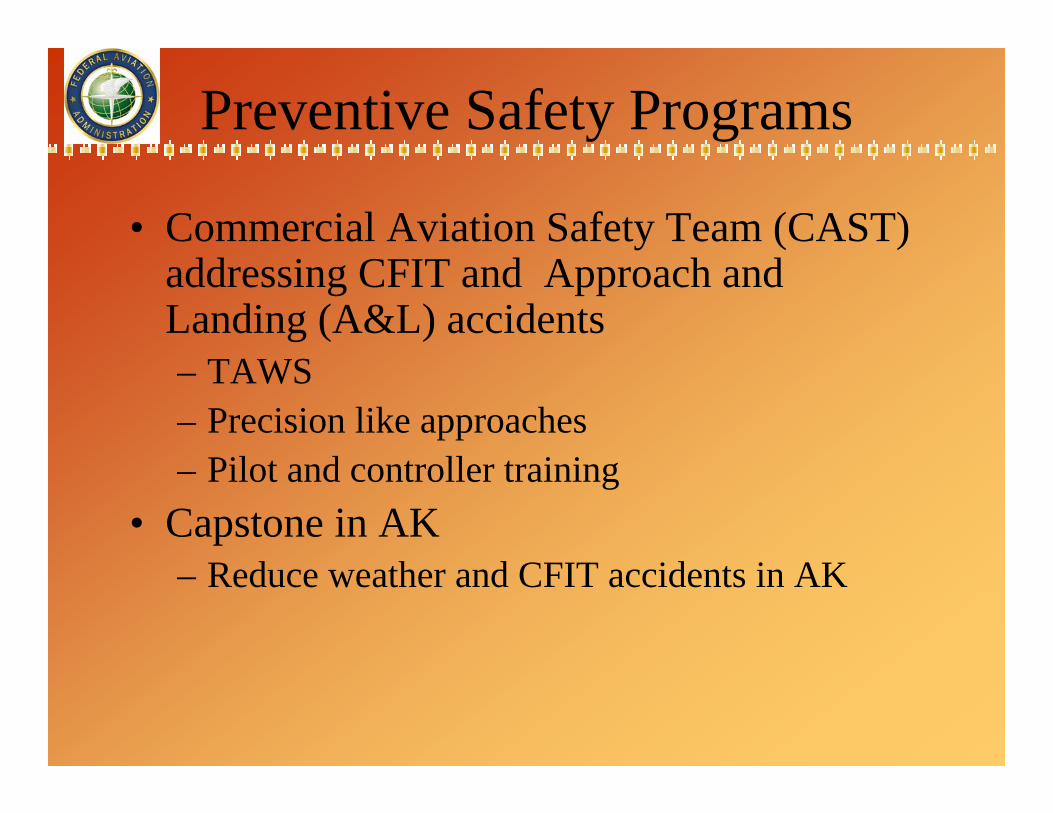
Preventive Safety Programs
• Commercial Aviation Safety Team (CAST) addressing CFIT and Approach and Landing (A&L) accidents – TAWS– Precision like approaches– Pilot and controller training
• Capstone in AK– Reduce weather and CFIT accidents in AK
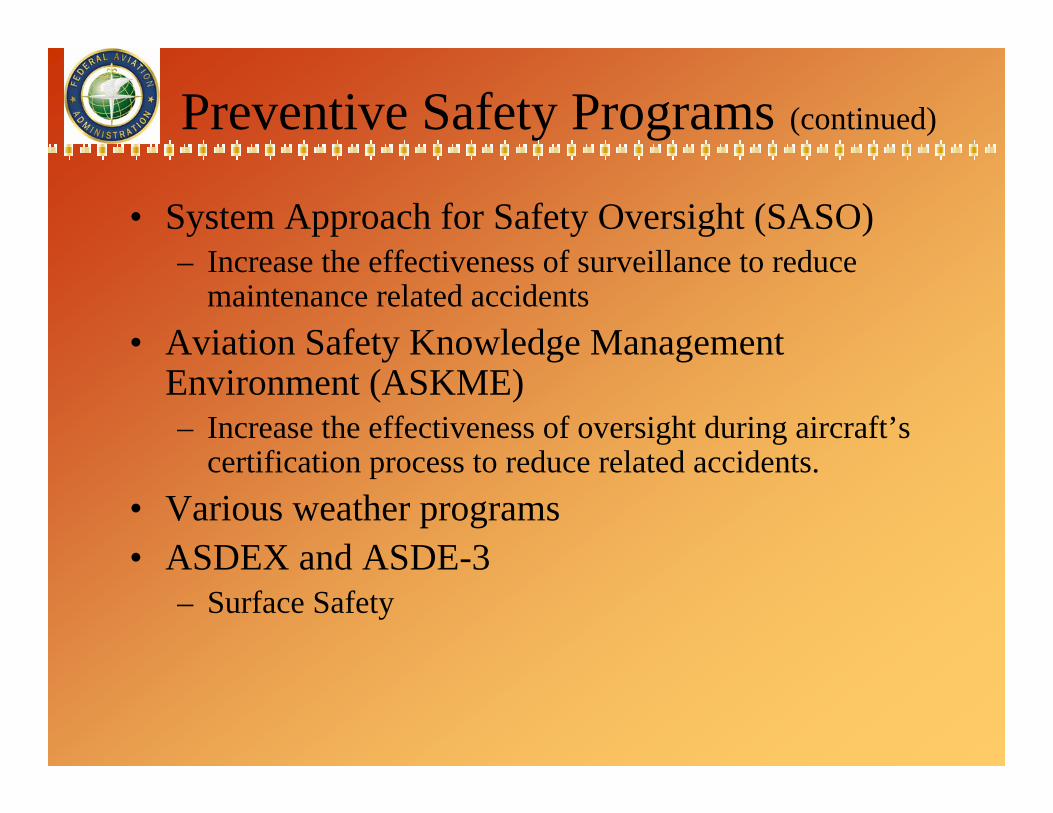
Preventive Safety Programs (continued)
• System Approach for Safety Oversight (SASO)– Increase the effectiveness of surveillance to reduce
maintenance related accidents• Aviation Safety Knowledge Management
Environment (ASKME)– Increase the effectiveness of oversight during aircraft’s
certification process to reduce related accidents.• Various weather programs• ASDEX and ASDE-3
– Surface Safety
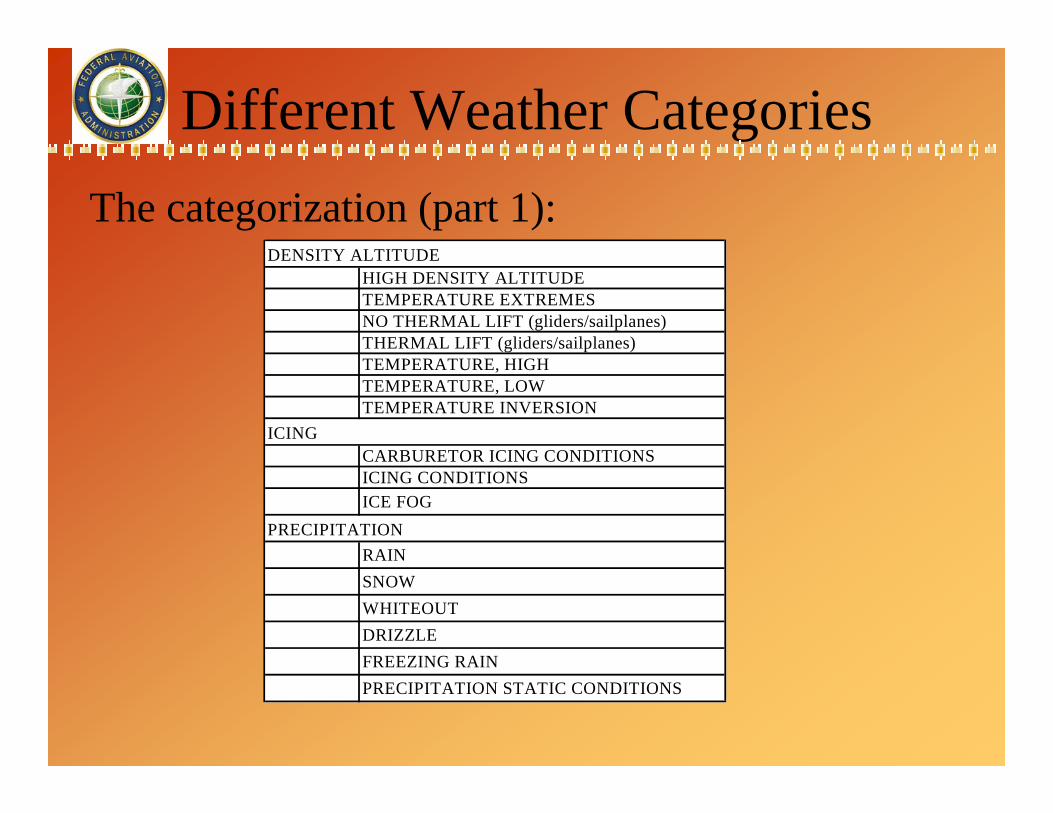
Different Weather Categories
HIGH DENSITY ALTITUDETEMPERATURE EXTREMESNO THERMAL LIFT (gliders/sailplanes)THERMAL LIFT (gliders/sailplanes)TEMPERATURE, HIGHTEMPERATURE, LOWTEMPERATURE INVERSION
CARBURETOR ICING CONDITIONSICING CONDITIONSICE FOG
RAINSNOWWHITEOUTDRIZZLEFREEZING RAINPRECIPITATION STATIC CONDITIONS
DENSITY ALTITUDE
ICING
PRECIPITATION
The categorization (part 1):
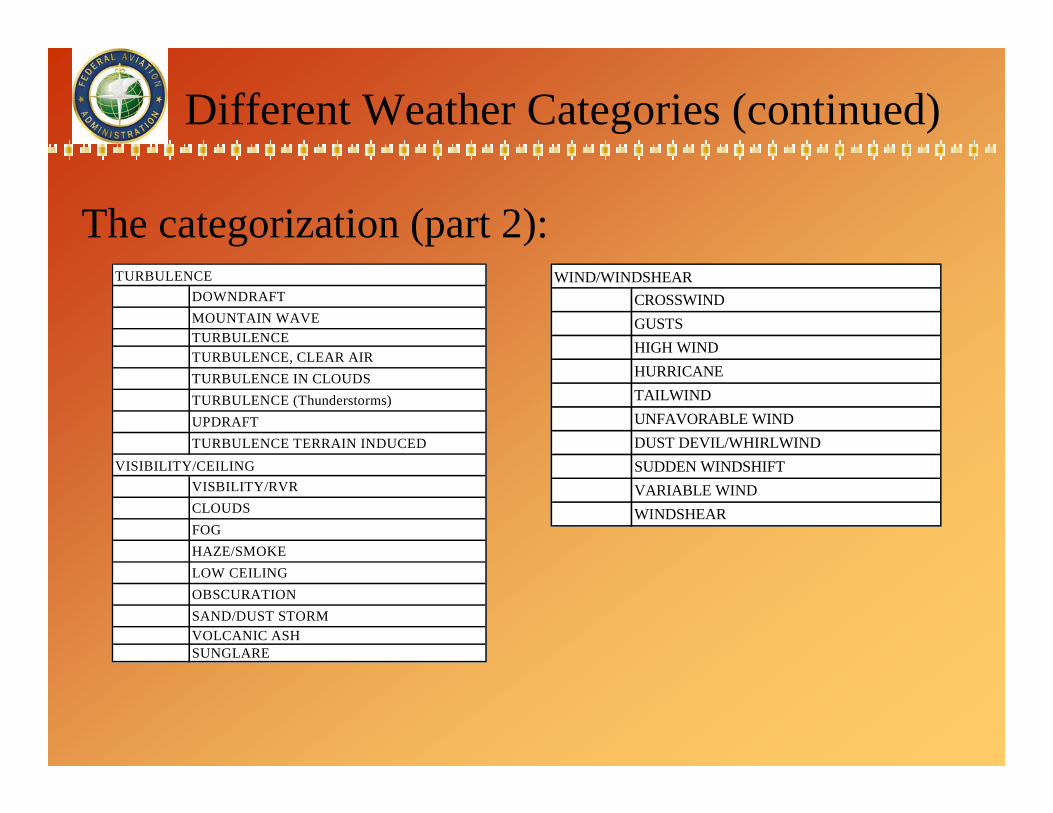
Different Weather Categories (continued)
DOWNDRAFTMOUNTAIN WAVETURBULENCETURBULENCE, CLEAR AIRTURBULENCE IN CLOUDSTURBULENCE (Thunderstorms)UPDRAFTTURBULENCE TERRAIN INDUCED
VISBILITY/RVRCLOUDSFOGHAZE/SMOKELOW CEILINGOBSCURATIONSAND/DUST STORMVOLCANIC ASHSUNGLARE
TURBULENCE
VISIBILITY/CEILING
CROSSWINDGUSTSHIGH WINDHURRICANETAILWINDUNFAVORABLE WINDDUST DEVIL/WHIRLWINDSUDDEN WINDSHIFTVARIABLE WINDWINDSHEAR
WIND/WINDSHEAR
The categorization (part 2):
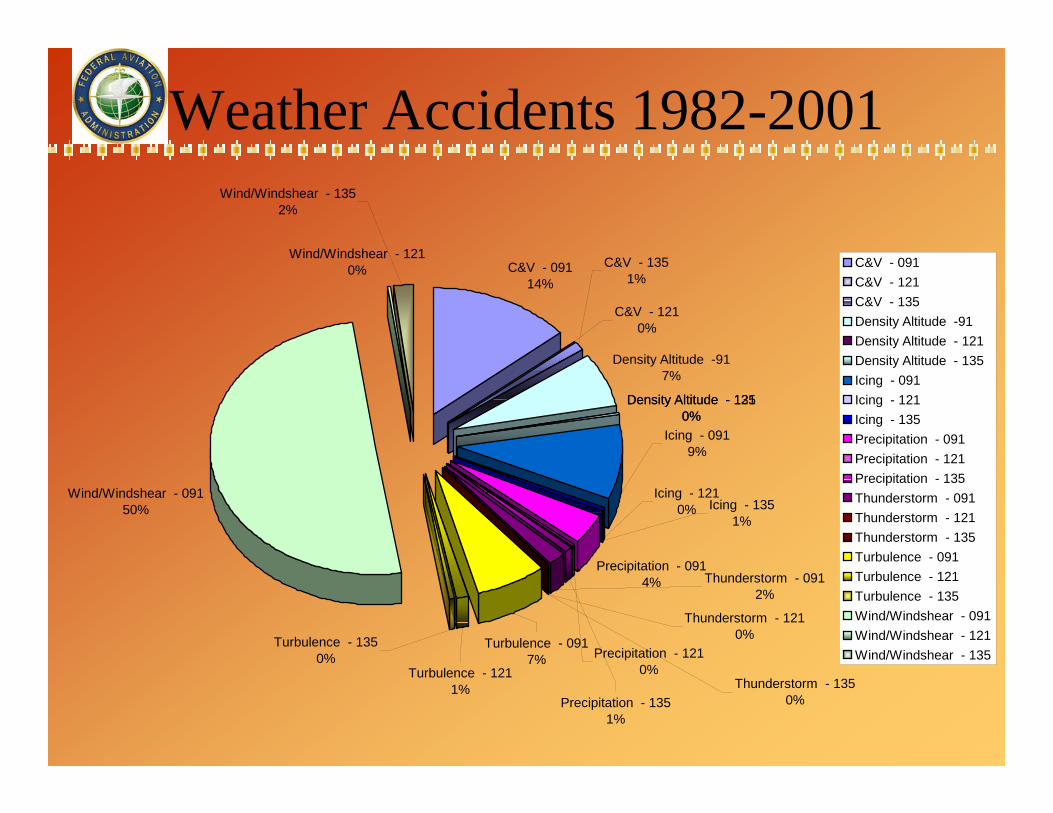
Weather Accidents 1982-2001
C&V - 09114%
Density Altitude -917%
Density Altitude - 1210%
Density Altitude - 1350%
Precipitation - 0914%
Wind/Windshear - 09150%
Wind/Windshear - 1210%
Precipitation - 1210%
Precipitation - 1351%
Turbulence - 0917%
Icing - 1210%
Icing - 0919%
Thunderstorm - 0912%
Thunderstorm - 1210%
Thunderstorm - 1350%
Turbulence - 1211%
Turbulence - 1350%
Icing - 1351%
C&V - 1210%
C&V - 1351%
Wind/Windshear - 1352%
C&V - 091C&V - 121C&V - 135Density Altitude -91Density Altitude - 121Density Altitude - 135Icing - 091Icing - 121Icing - 135Precipitation - 091Precipitation - 121Precipitation - 135Thunderstorm - 091Thunderstorm - 121Thunderstorm - 135Turbulence - 091Turbulence - 121Turbulence - 135Wind/Windshear - 091Wind/Windshear - 121Wind/Windshear - 135
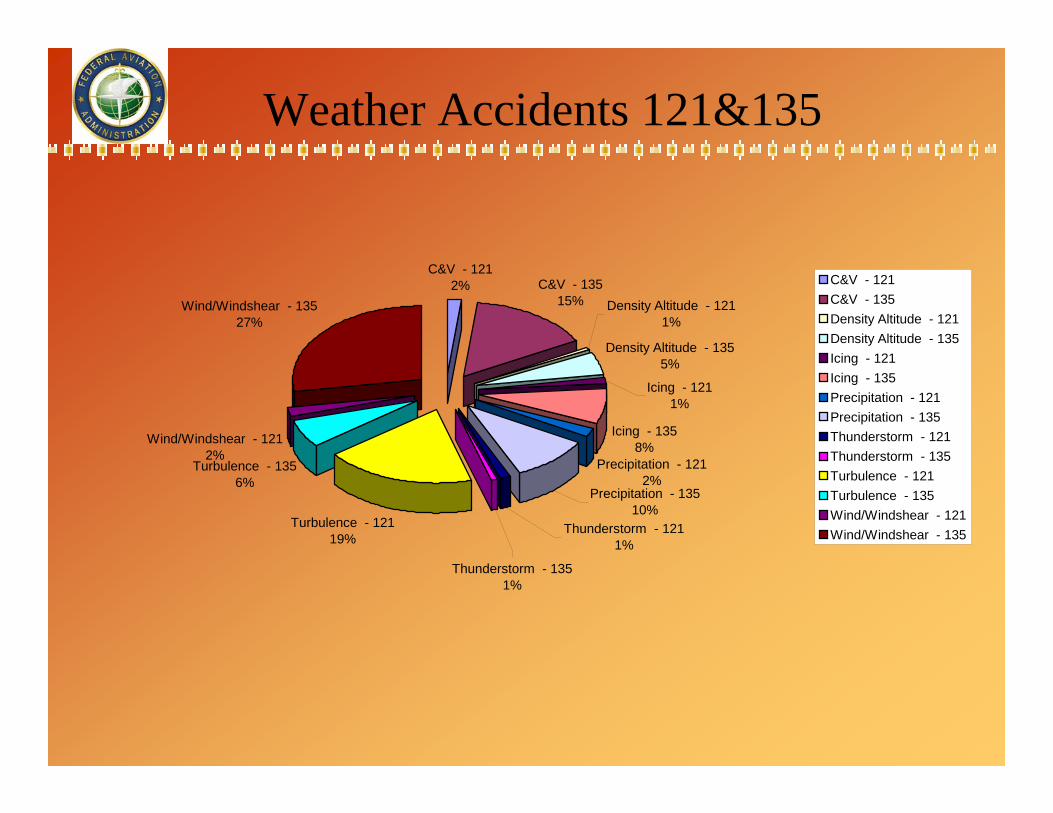
Weather Accidents 121&135
C&V - 1212% C&V - 135
15%
Density Altitude - 1355%
Icing - 1358%
Precipitation - 1212%
Turbulence - 12119%
Turbulence - 1356%
Wind/Windshear - 1212%
Wind/Windshear - 13527%
Precipitation - 13510%
Thunderstorm - 1211%
Thunderstorm - 1351%
Icing - 1211%
Density Altitude - 1211%
C&V - 121C&V - 135Density Altitude - 121Density Altitude - 135Icing - 121Icing - 135Precipitation - 121Precipitation - 135Thunderstorm - 121Thunderstorm - 135Turbulence - 121Turbulence - 135Wind/Windshear - 121Wind/Windshear - 135
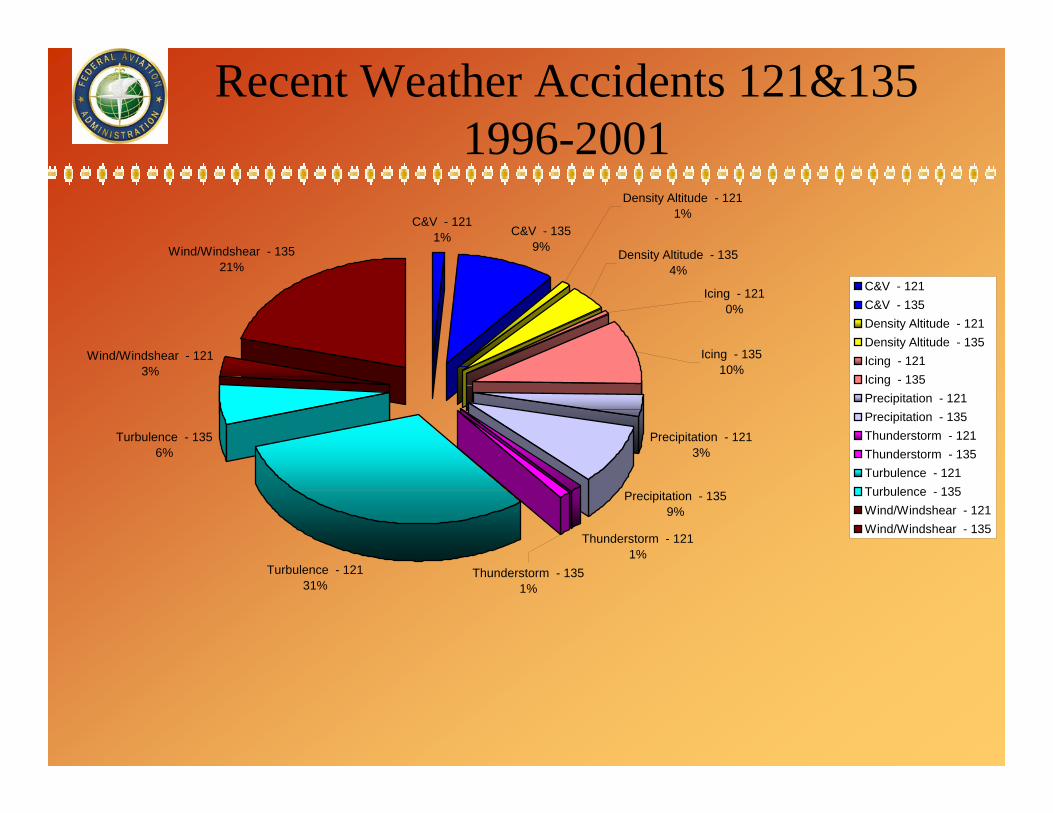
C&V - 1211% C&V - 135
9%
Precipitation - 1213%
Precipitation - 1359%
Thunderstorm - 1211%
Turbulence - 12131%
Turbulence - 1356%
Wind/Windshear - 1213%
Wind/Windshear - 13521%
Density Altitude - 1211%
Icing - 1210%
Icing - 13510%
Density Altitude - 1354%
Thunderstorm - 1351%
C&V - 121C&V - 135Density Altitude - 121Density Altitude - 135Icing - 121Icing - 135Precipitation - 121Precipitation - 135Thunderstorm - 121Thunderstorm - 135Turbulence - 121Turbulence - 135Wind/Windshear - 121Wind/Windshear - 135
Recent Weather Accidents 121&135 1996-2001
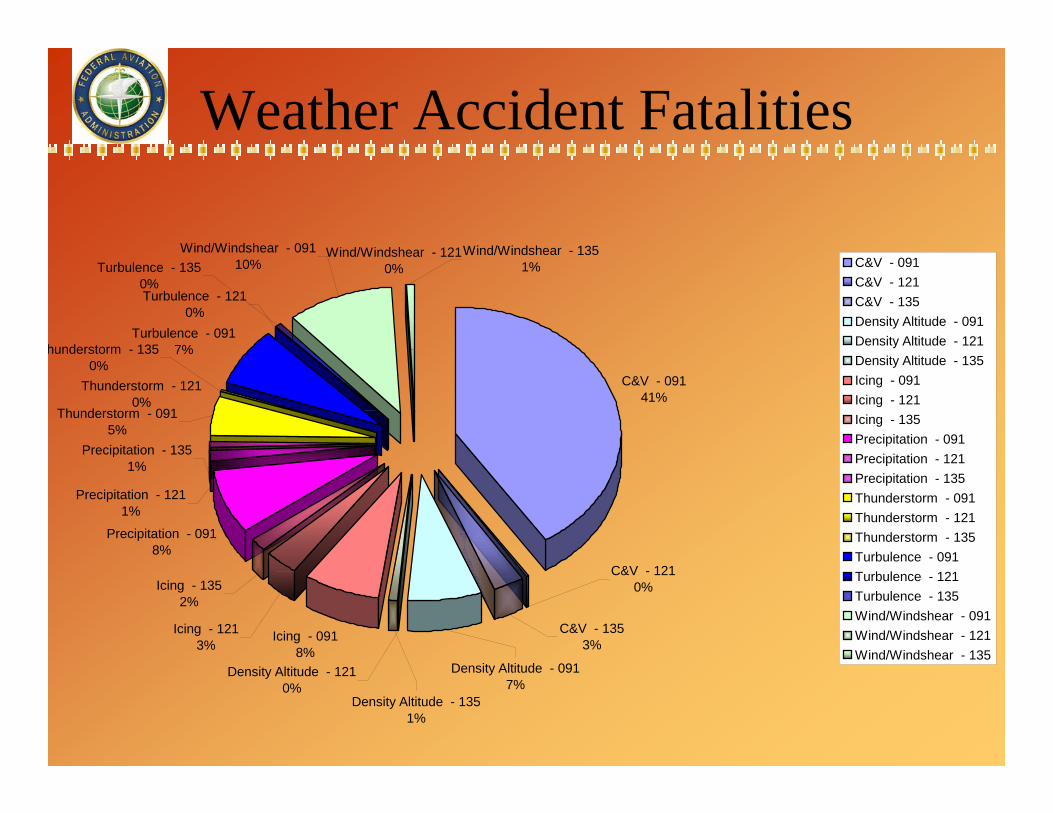
Weather Accident Fatalities
C&V - 09141%
Icing - 0918%
Precipitation - 0918%
Turbulence - 0917%
Wind/Windshear - 1210%
Thunderstorm - 0915%
Thunderstorm - 1210%
hunderstorm - 1350%
Turbulence - 1210%
Precipitation - 1211%
Precipitation - 1351%
Icing - 1213%
Icing - 1352%
Density Altitude - 1210%
Density Altitude - 1351%
Density Altitude - 0917%
C&V - 1210%
C&V - 1353%
Turbulence - 1350%
Wind/Windshear - 09110%
Wind/Windshear - 1351% C&V - 091
C&V - 121C&V - 135Density Altitude - 091Density Altitude - 121Density Altitude - 135Icing - 091Icing - 121Icing - 135Precipitation - 091Precipitation - 121Precipitation - 135Thunderstorm - 091Thunderstorm - 121Thunderstorm - 135Turbulence - 091Turbulence - 121Turbulence - 135Wind/Windshear - 091Wind/Windshear - 121Wind/Windshear - 135
Weather Accidents
• Accidents with more than 1 causal factor are divided up equally among all causal factors.
• Observations– For part 121, turbulence has caused the most
number of accidents, but very few fatal injuries.– A larger percentage of Ceiling and Visibility
accidents are fatal compared to other categories
Some Preventive Measures for Weather Accidents
• Ground Based– Low-Level Windshear Alert System (LLWAS), Terminal
Doppler Weather Radar (TDWR) and Weather Surveillance Radar (WSR)
– Integrated Terminal Weather System (ITWS) – Medium Intensity Airport Weather System (MIAWS)– Weather and Radar Processors (WARP)– Corridor Integrated Weather System (CIWS)
• Training Programs • Airborne Systems
– Low-Altitude Windshear System Equipment Requirements.
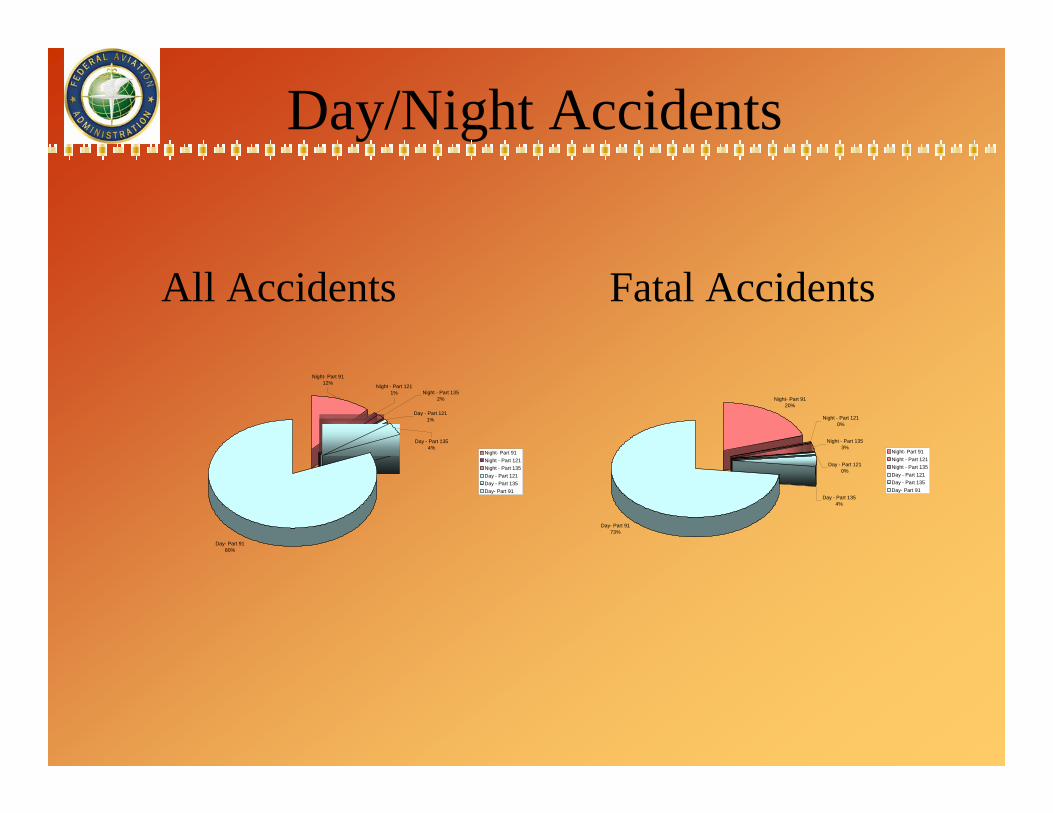
Day/Night Accidents
Day- Part 9180%
Night - Part 1352%
Day - Part 1211%
Day - Part 1354%
Night - Part 1211%
Night- Part 9112%
Night- Part 91Night - Part 121Night - Part 135Day - Part 121Day - Part 135Day- Part 91
Night- Part 9120%
Day- Part 9173%
Night - Part 1353%
Day - Part 1210%
Day - Part 1354%
Night - Part 1210%
Night- Part 91Night - Part 121Night - Part 135Day - Part 121Day - Part 135Day- Part 91
All Accidents Fatal Accidents
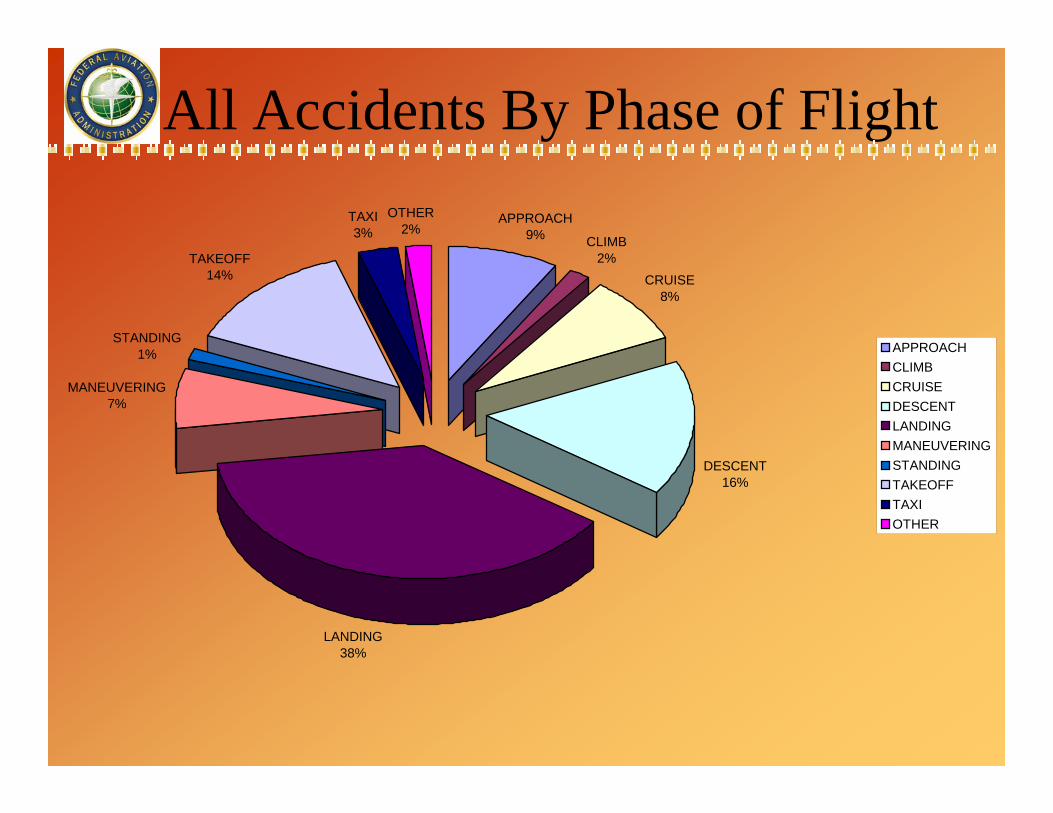
All Accidents By Phase of FlightAPPROACH
9% CLIMB2%
CRUISE8%
DESCENT16%
LANDING38%
MANEUVERING7%
STANDING1%
TAKEOFF14%
TAXI3%
OTHER2%
APPROACHCLIMBCRUISEDESCENTLANDINGMANEUVERINGSTANDINGTAKEOFFTAXIOTHER
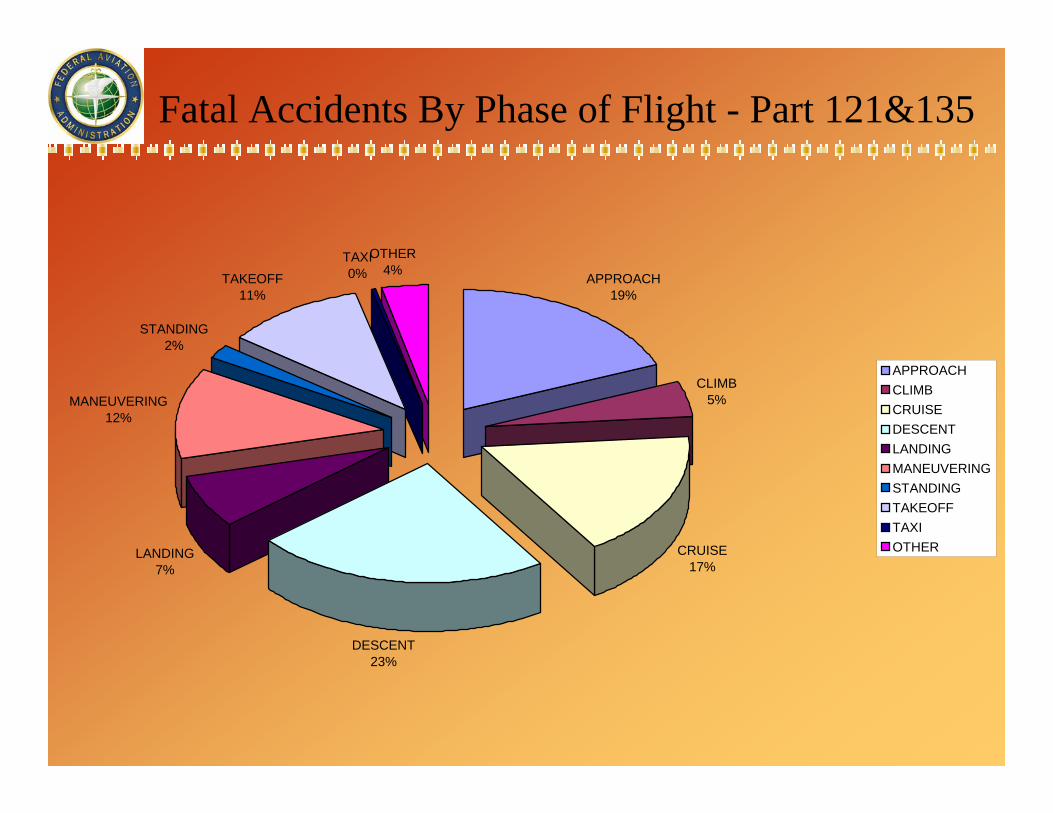
Fatal Accidents By Phase of Flight - Part 121&135
APPROACH19%
CLIMB5%
CRUISE17%
DESCENT23%
LANDING7%
MANEUVERING12%
STANDING2%
TAKEOFF11%
TAXI0%
OTHER4%
APPROACHCLIMBCRUISEDESCENTLANDINGMANEUVERINGSTANDINGTAKEOFFTAXIOTHER
Observations
– Most accidents happen during daylight however, the rate of fatal accidents is greater in the absence of daylight.
– Approach, Landing, and Descent are the most dangerous phases of flight.
Summary
Through the analyses of historical accident data, such
findings can contribute to efforts in preventive safety in
order to reduce aviation accidents.

BACK UP SLIDES
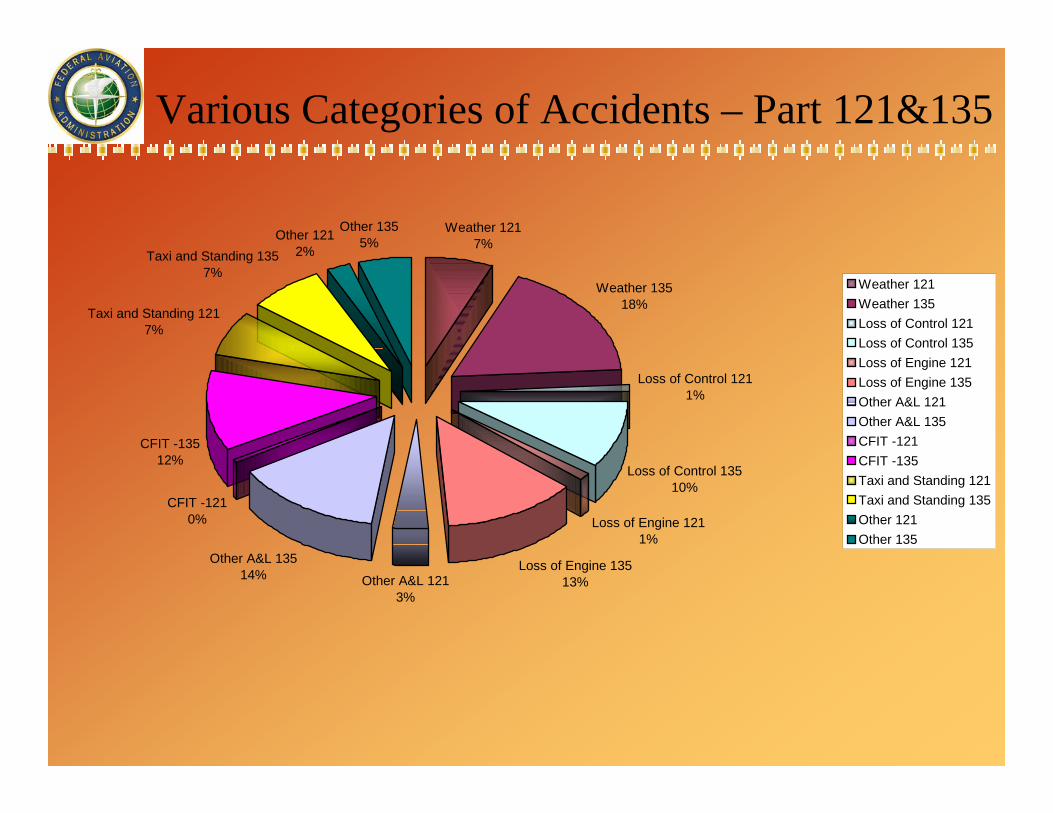
Weather 1217%
Weather 13518%
Loss of Control 1211%
Loss of Control 13510%
Loss of Engine 1211%
Loss of Engine 13513%Other A&L 121
3%
Other A&L 13514%
CFIT -1210%
CFIT -13512%
Taxi and Standing 1217%
Taxi and Standing 1357%
Other 1212%
Other 1355%
Weather 121Weather 135Loss of Control 121Loss of Control 135Loss of Engine 121Loss of Engine 135Other A&L 121Other A&L 135CFIT -121CFIT -135Taxi and Standing 121Taxi and Standing 135Other 121Other 135
Various Categories of Accidents – Part 121&135
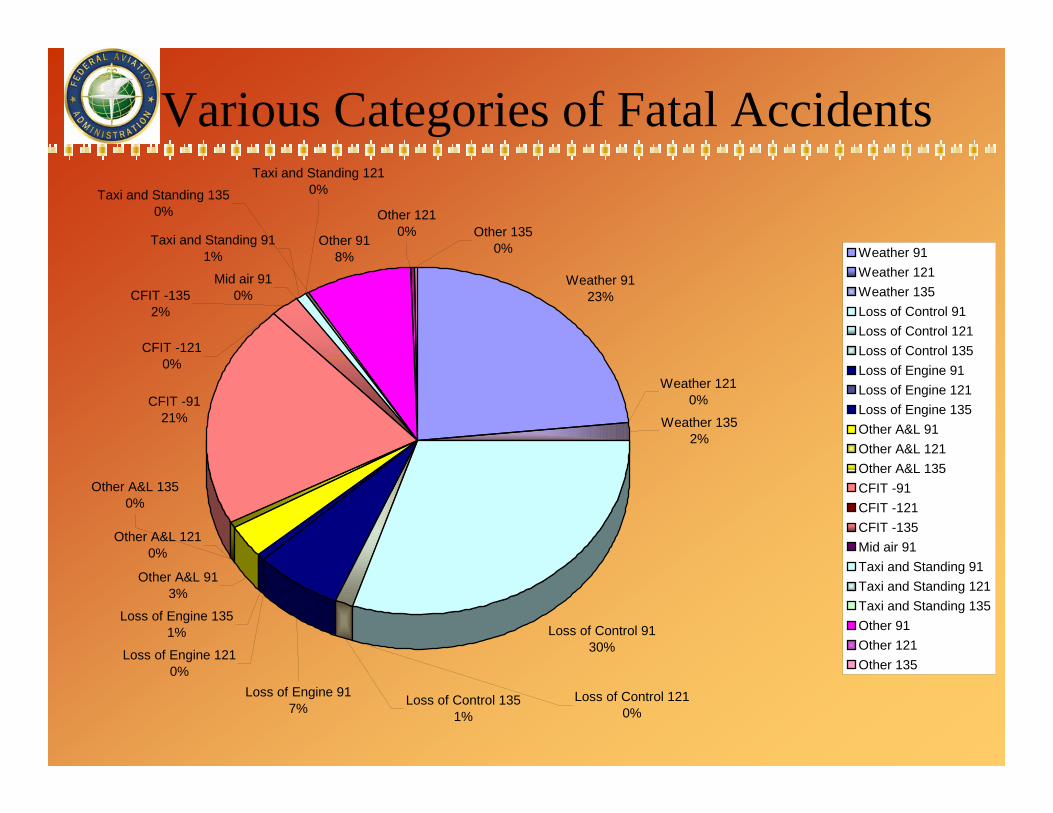
Various Categories of Fatal Accidents
Weather 9123%
Weather 1210%
Weather 1352%
Loss of Control 9130%Loss of Engine 121
0%
Loss of Engine 1351%
Other A&L 913%
Mid air 910%
Taxi and Standing 911%
Other 918%
Other 1210% Other 135
0%
CFIT -1352%
CFIT -1210%
Taxi and Standing 1210%Taxi and Standing 135
0%
Loss of Engine 917%
Loss of Control 1210%
Other A&L 1210%
Other A&L 1350%
Loss of Control 1351%
CFIT -9121%
Weather 91Weather 121Weather 135Loss of Control 91Loss of Control 121Loss of Control 135Loss of Engine 91Loss of Engine 121Loss of Engine 135Other A&L 91Other A&L 121Other A&L 135CFIT -91CFIT -121CFIT -135Mid air 91Taxi and Standing 91Taxi and Standing 121Taxi and Standing 135Other 91Other 121Other 135
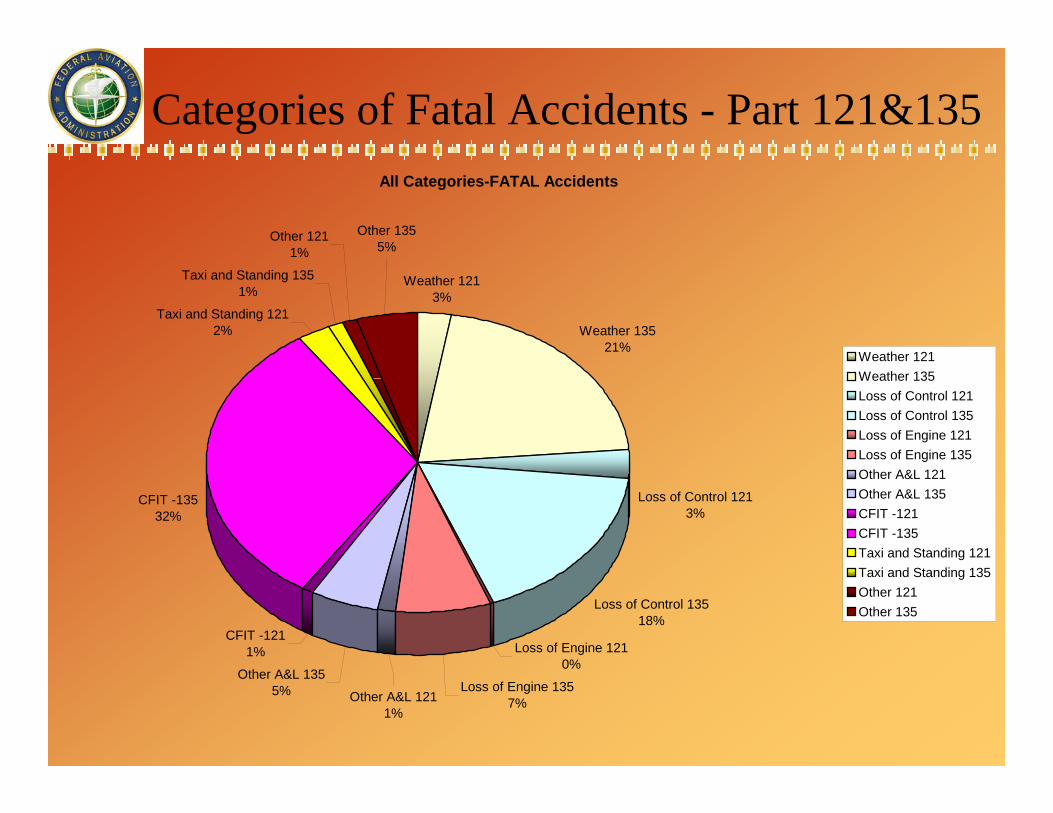
Categories of Fatal Accidents - Part 121&135 All Categories-FATAL Accidents
Weather 1213%
Weather 13521%
Loss of Control 1213%
Loss of Control 13518%
Loss of Engine 1210%
Loss of Engine 1357%
Other A&L 1355%
CFIT -1211%
CFIT -13532%
Taxi and Standing 1212%
Taxi and Standing 1351%
Other 1211%
Other A&L 1211%
Other 1355%
Weather 121Weather 135Loss of Control 121Loss of Control 135Loss of Engine 121Loss of Engine 135Other A&L 121Other A&L 135CFIT -121CFIT -135Taxi and Standing 121Taxi and Standing 135Other 121Other 135
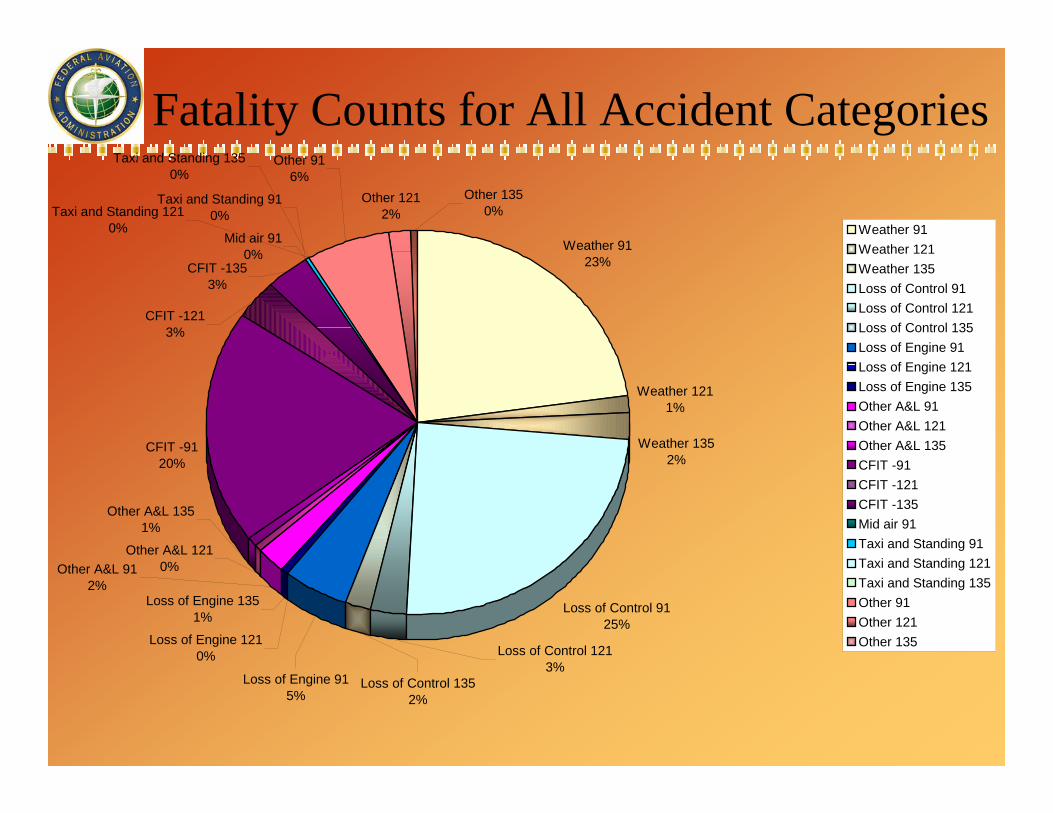
Fatality Counts for All Accident Categories
Weather 9123%
Weather 1211%
Weather 1352%
Loss of Control 9125%
Loss of Engine 1210%
Loss of Engine 1351%
CFIT -9120%
Mid air 910%
Taxi and Standing 910%
Other 916%
Other 1212%Taxi and Standing 121
0%
CFIT -1353%
CFIT -1213%
Taxi and Standing 1350%
Other 1350%
Loss of Engine 915%
Other A&L 912%
Loss of Control 1352%
Loss of Control 1213%
Other A&L 1210%
Other A&L 1351%
Weather 91Weather 121Weather 135Loss of Control 91Loss of Control 121Loss of Control 135Loss of Engine 91Loss of Engine 121Loss of Engine 135Other A&L 91Other A&L 121Other A&L 135CFIT -91CFIT -121CFIT -135Mid air 91Taxi and Standing 91Taxi and Standing 121Taxi and Standing 135Other 91Other 121Other 135
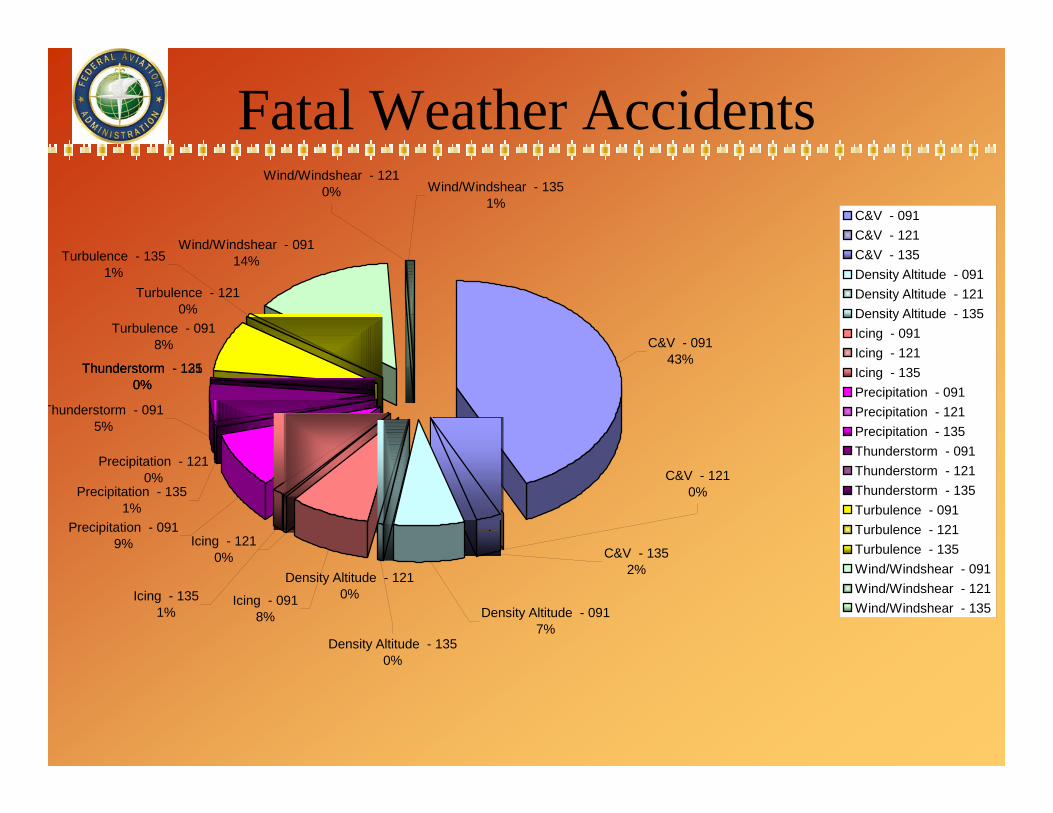
Fatal Weather Accidents
Precipitation - 1210%
Thunderstorm - 1210%
Thunderstorm - 1350%
Turbulence - 0918%
Turbulence - 1210%
Wind/Windshear - 09114%
C&V - 1210%
C&V - 1352%Density Altitude - 121
0%Density Altitude - 091
7%Density Altitude - 135
0%
Icing - 0918%
Icing - 1210%
Icing - 1351%
Precipitation - 0919%
Precipitation - 1351%
Thunderstorm - 0915%
Turbulence - 1351%
Wind/Windshear - 1210% Wind/Windshear - 135
1%
C&V - 09143%
C&V - 091C&V - 121C&V - 135Density Altitude - 091Density Altitude - 121Density Altitude - 135Icing - 091Icing - 121Icing - 135Precipitation - 091Precipitation - 121Precipitation - 135Thunderstorm - 091Thunderstorm - 121Thunderstorm - 135Turbulence - 091Turbulence - 121Turbulence - 135Wind/Windshear - 091Wind/Windshear - 121Wind/Windshear - 135
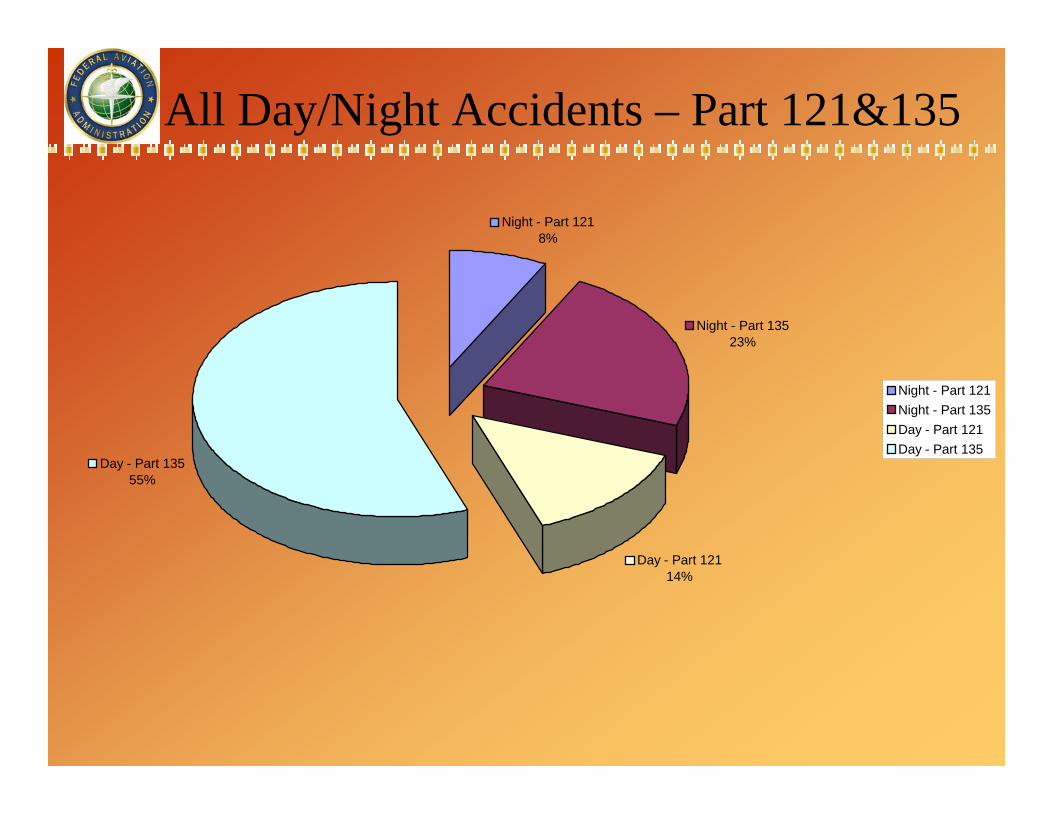
All Day/Night Accidents – Part 121&135
Night - Part 1218%
Night - Part 13523%
Day - Part 12114%
Day - Part 13555%
Night - Part 121Night - Part 135Day - Part 121Day - Part 135
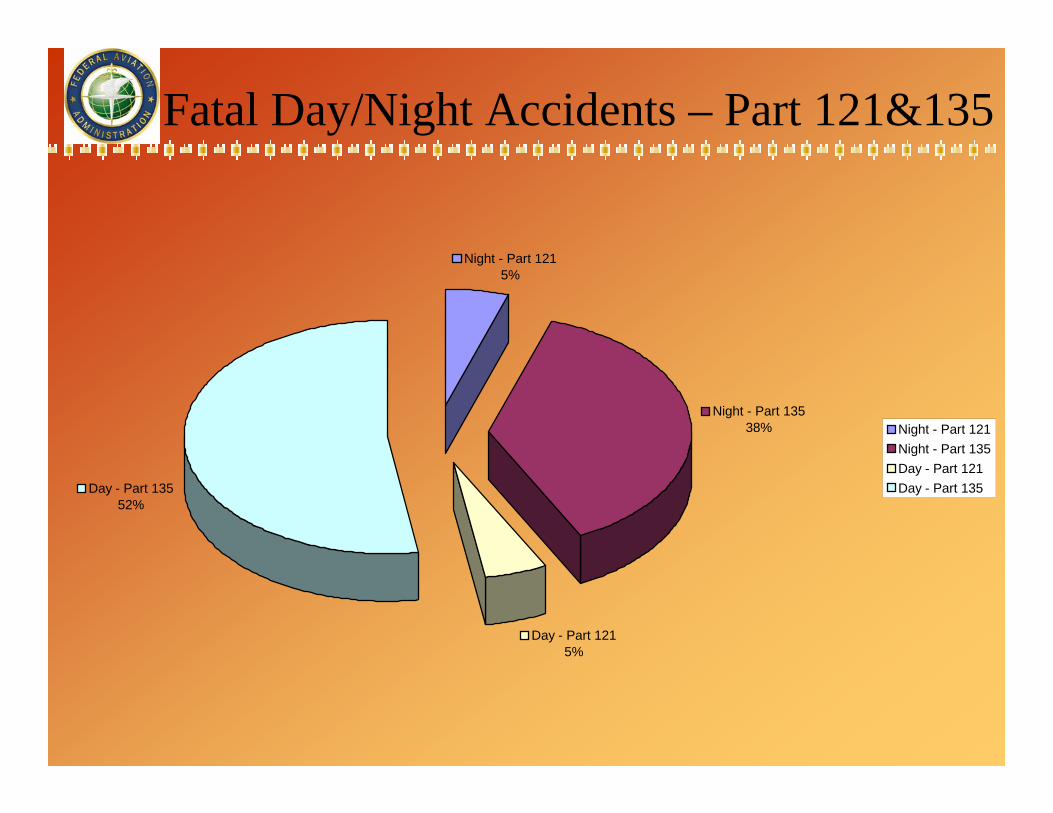
Fatal Day/Night Accidents – Part 121&135
Night - Part 1215%
Night - Part 13538%
Day - Part 1215%
Day - Part 13552%
Night - Part 121Night - Part 135Day - Part 121Day - Part 135
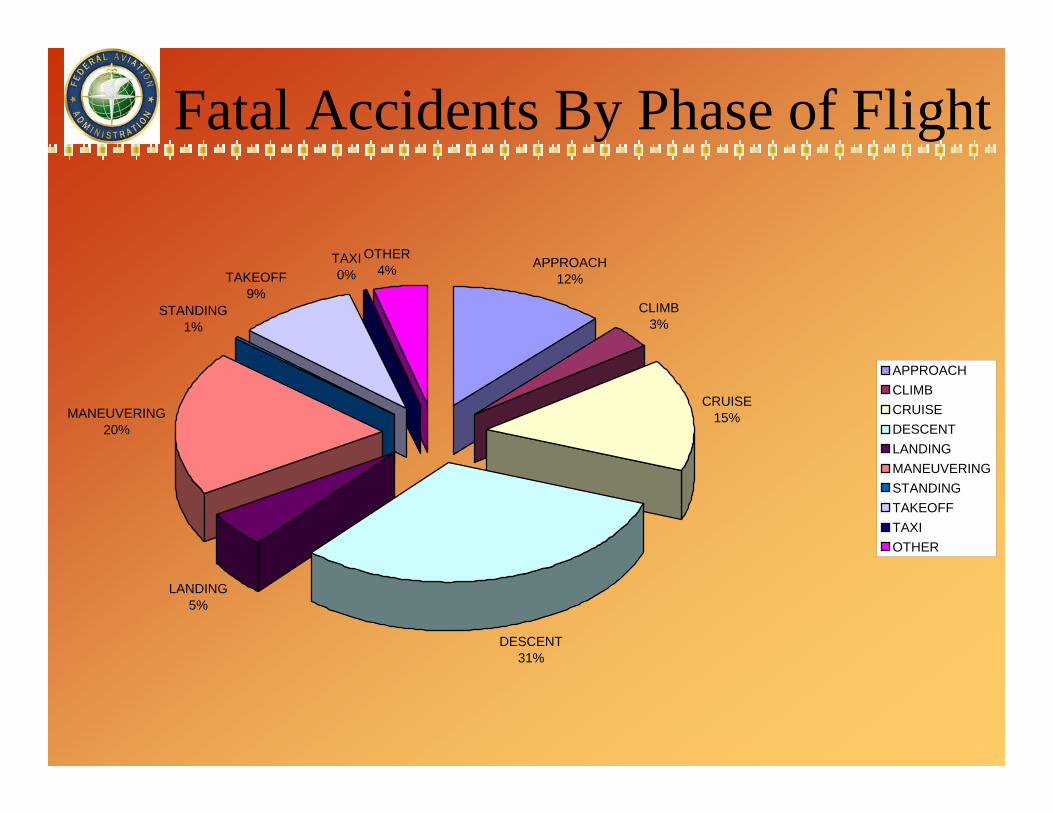
Fatal Accidents By Phase of Flight
APPROACH12%
CLIMB3%
CRUISE15%
DESCENT31%
LANDING5%
MANEUVERING20%
STANDING1%
TAKEOFF9%
TAXI0%
OTHER4%
APPROACHCLIMBCRUISEDESCENTLANDINGMANEUVERINGSTANDINGTAKEOFFTAXIOTHER
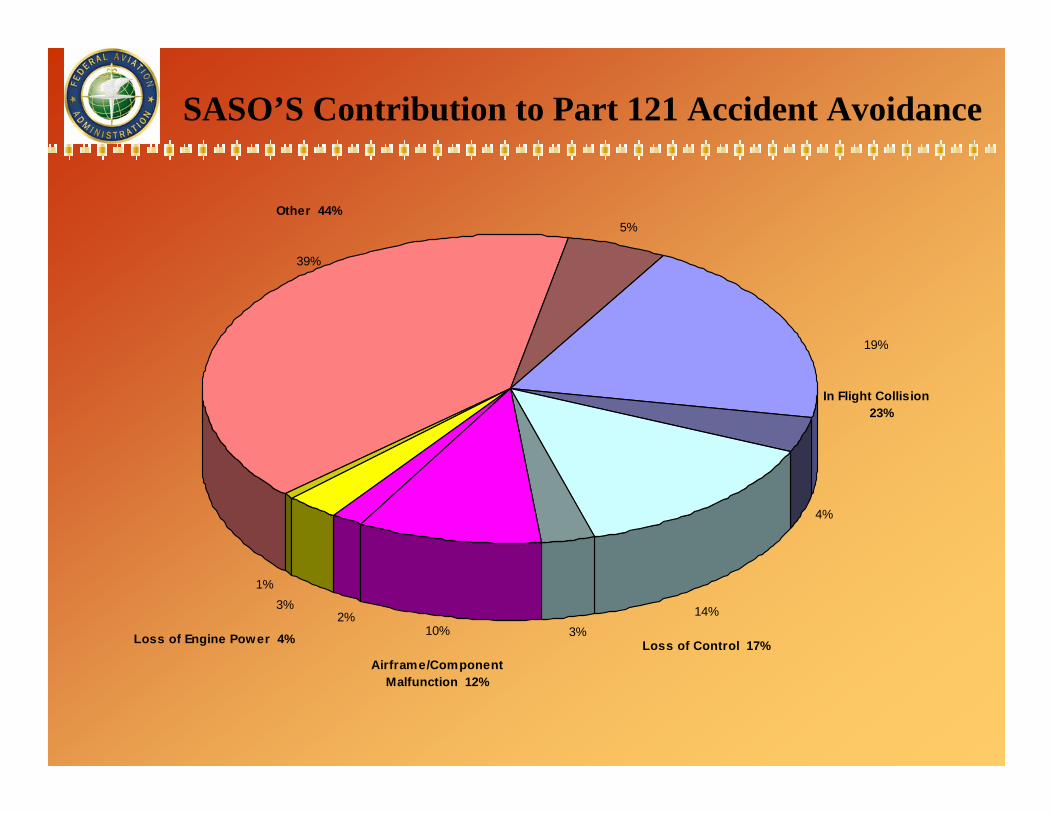
SASO’S Contribution to Part 121 Accident Avoidance
Other 44%
39%
5%
4%
3%2%
1%3%
Loss of Engine Power 4% 10%
Airframe/Component Malfunction 12%
14%
Loss of Control 17%
19%
In Flight Collision 23%
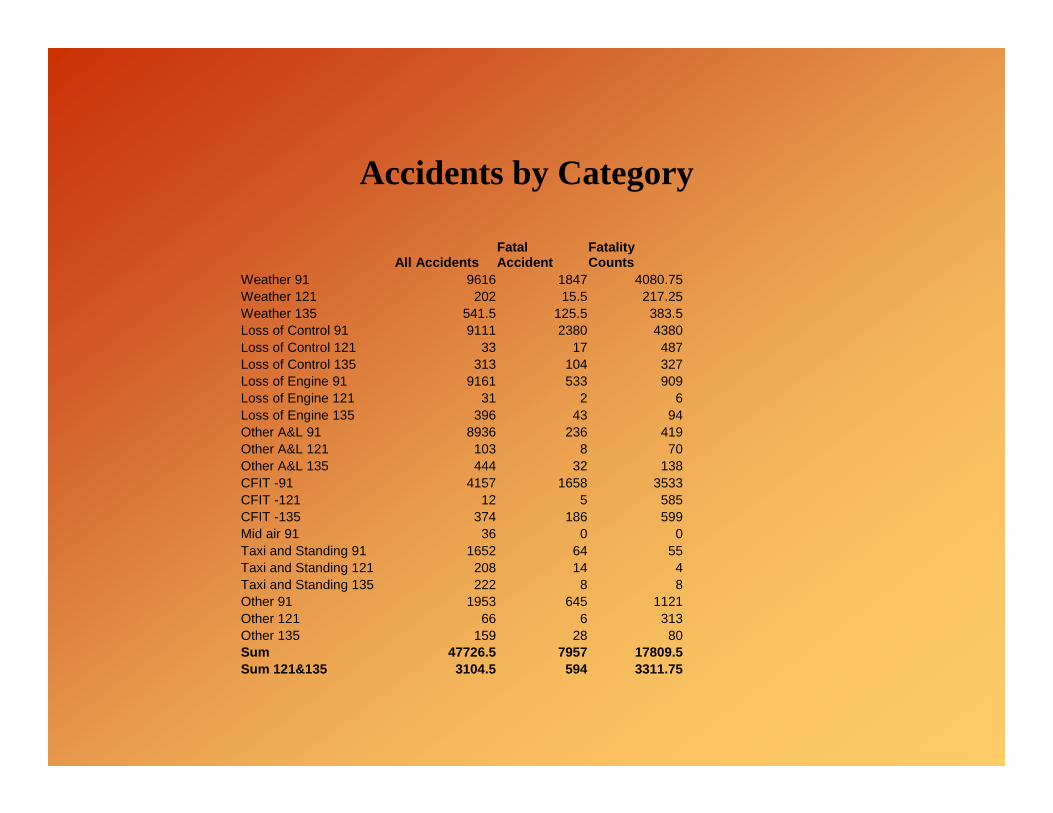
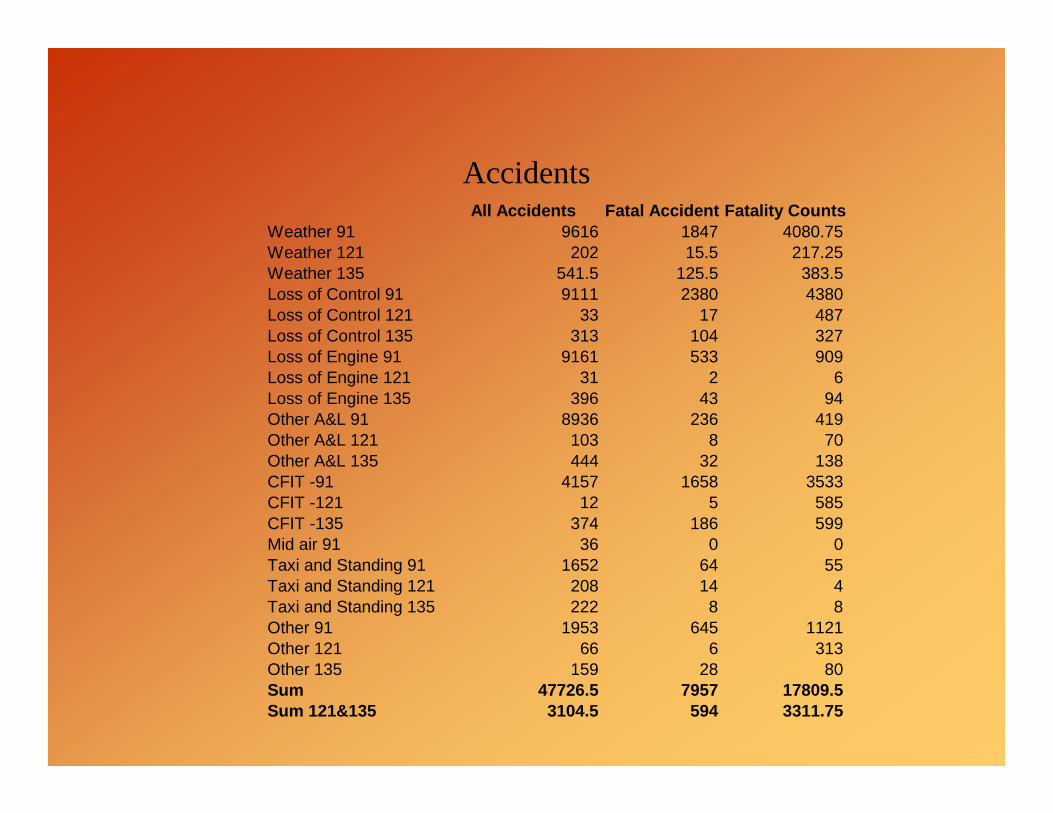
Accidents by Category
All Accidents Fatal Accident
Fatality Counts
Weather 91 9616 1847 4080.75Weather 121 202 15.5 217.25Weather 135 541.5 125.5 383.5Loss of Control 91 9111 2380 4380Loss of Control 121 33 17 487Loss of Control 135 313 104 327Loss of Engine 91 9161 533 909Loss of Engine 121 31 2 6Loss of Engine 135 396 43 94Other A&L 91 8936 236 419Other A&L 121 103 8 70Other A&L 135 444 32 138CFIT -91 4157 1658 3533CFIT -121 12 5 585CFIT -135 374 186 599Mid air 91 36 0 0Taxi and Standing 91 1652 64 55Taxi and Standing 121 208 14 4Taxi and Standing 135 222 8 8Other 91 1953 645 1121Other 121 66 6 313Other 135 159 28 80Sum 47726.5 7957 17809.5Sum 121&135 3104.5 594 3311.75
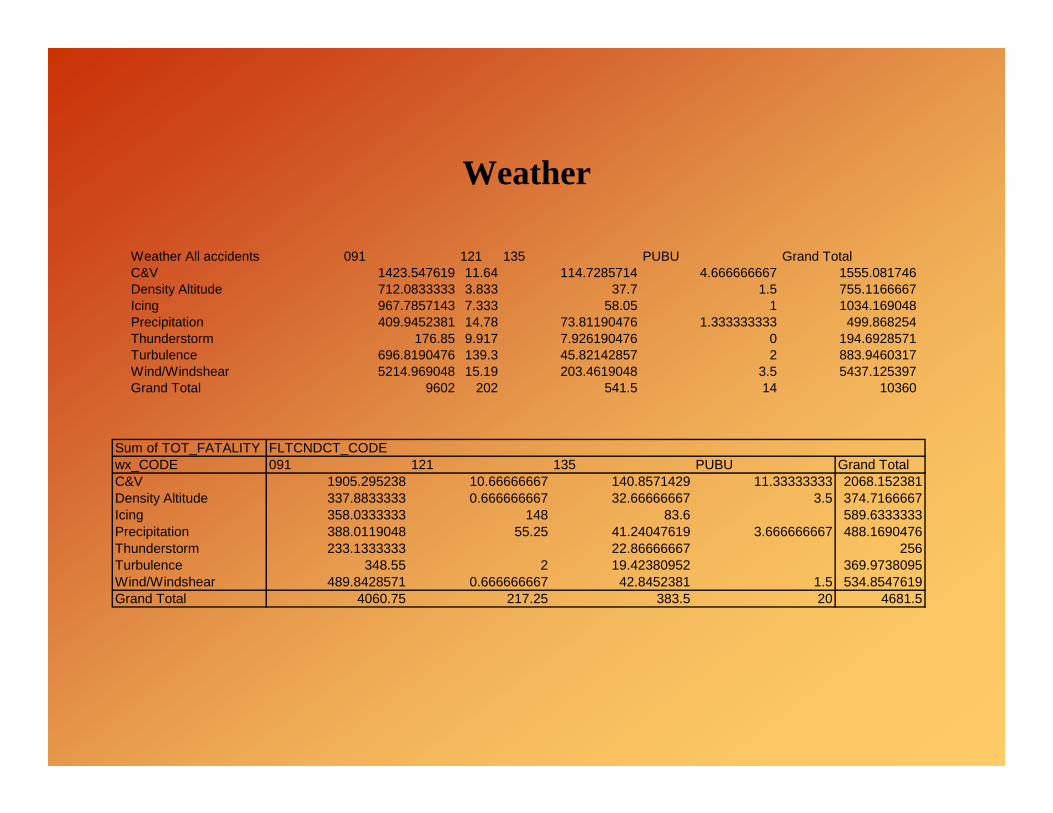
Weather
Sum of TOT_FATALITY FLTCNDCT_CODEwx_CODE 091 121 135 PUBU Grand TotalC&V 1905.295238 10.66666667 140.8571429 11.33333333 2068.152381Density Altitude 337.8833333 0.666666667 32.66666667 3.5 374.7166667Icing 358.0333333 148 83.6 589.6333333Precipitation 388.0119048 55.25 41.24047619 3.666666667 488.1690476Thunderstorm 233.1333333 22.86666667 256Turbulence 348.55 2 19.42380952 369.9738095Wind/Windshear 489.8428571 0.666666667 42.8452381 1.5 534.8547619Grand Total 4060.75 217.25 383.5 20 4681.5
Weather All accidents 091 121 135 PUBU Grand TotalC&V 1423.547619 11.64 114.7285714 4.666666667 1555.081746Density Altitude 712.0833333 3.833 37.7 1.5 755.1166667Icing 967.7857143 7.333 58.05 1 1034.169048Precipitation 409.9452381 14.78 73.81190476 1.333333333 499.868254Thunderstorm 176.85 9.917 7.926190476 0 194.6928571Turbulence 696.8190476 139.3 45.82142857 2 883.9460317Wind/Windshear 5214.969048 15.19 203.4619048 3.5 5437.125397Grand Total 9602 202 541.5 14 10360
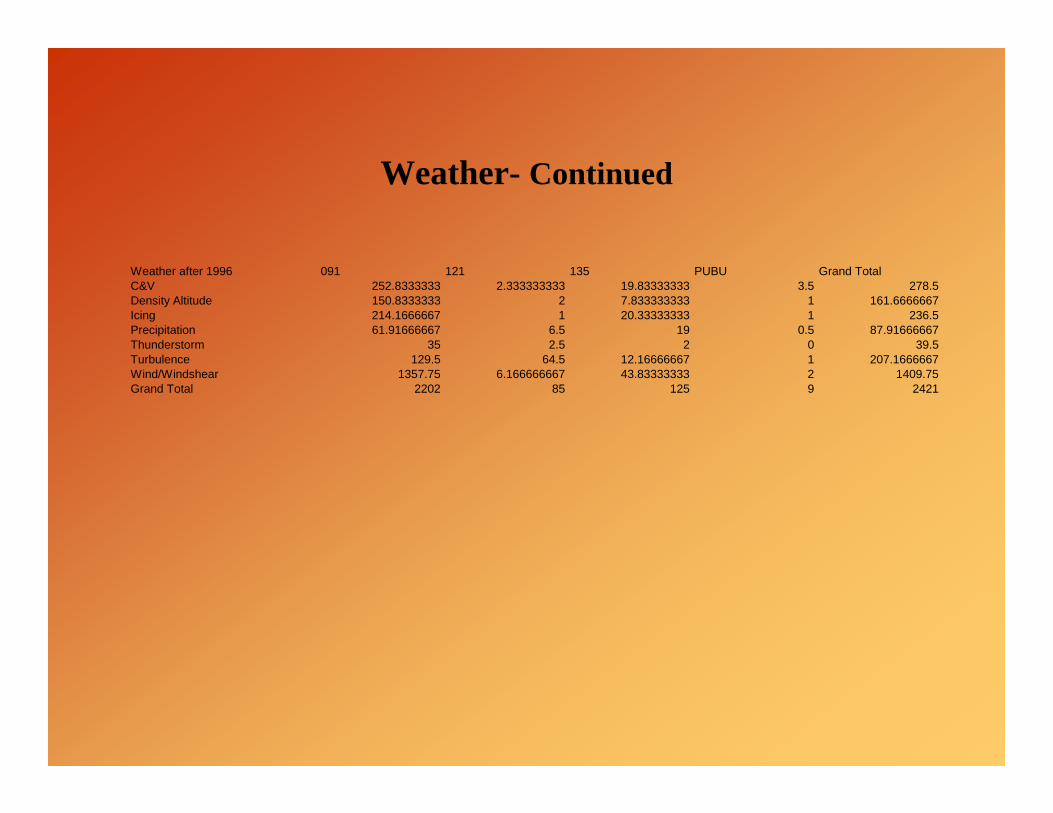
Weather- Continued
Weather after 1996 091 121 135 PUBU Grand TotalC&V 252.8333333 2.333333333 19.83333333 3.5 278.5Density Altitude 150.8333333 2 7.833333333 1 161.6666667Icing 214.1666667 1 20.33333333 1 236.5Precipitation 61.91666667 6.5 19 0.5 87.91666667Thunderstorm 35 2.5 2 0 39.5Turbulence 129.5 64.5 12.16666667 1 207.1666667Wind/Windshear 1357.75 6.166666667 43.83333333 2 1409.75Grand Total 2202 85 125 9 2421
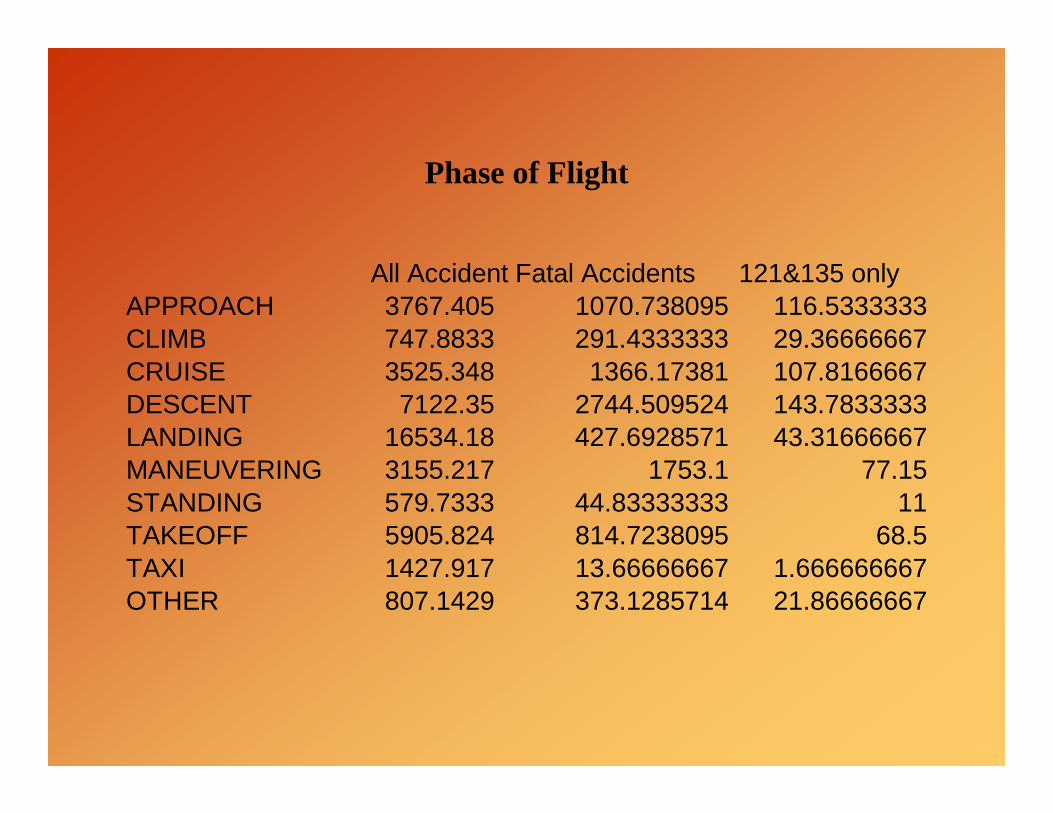
Phase of Flight
All Accident Fatal Accidents 121&135 onlyAPPROACH 3767.405 1070.738095 116.5333333CLIMB 747.8833 291.4333333 29.36666667CRUISE 3525.348 1366.17381 107.8166667DESCENT 7122.35 2744.509524 143.7833333LANDING 16534.18 427.6928571 43.31666667MANEUVERING 3155.217 1753.1 77.15STANDING 579.7333 44.83333333 11TAKEOFF 5905.824 814.7238095 68.5TAXI 1427.917 13.66666667 1.666666667OTHER 807.1429 373.1285714 21.86666667
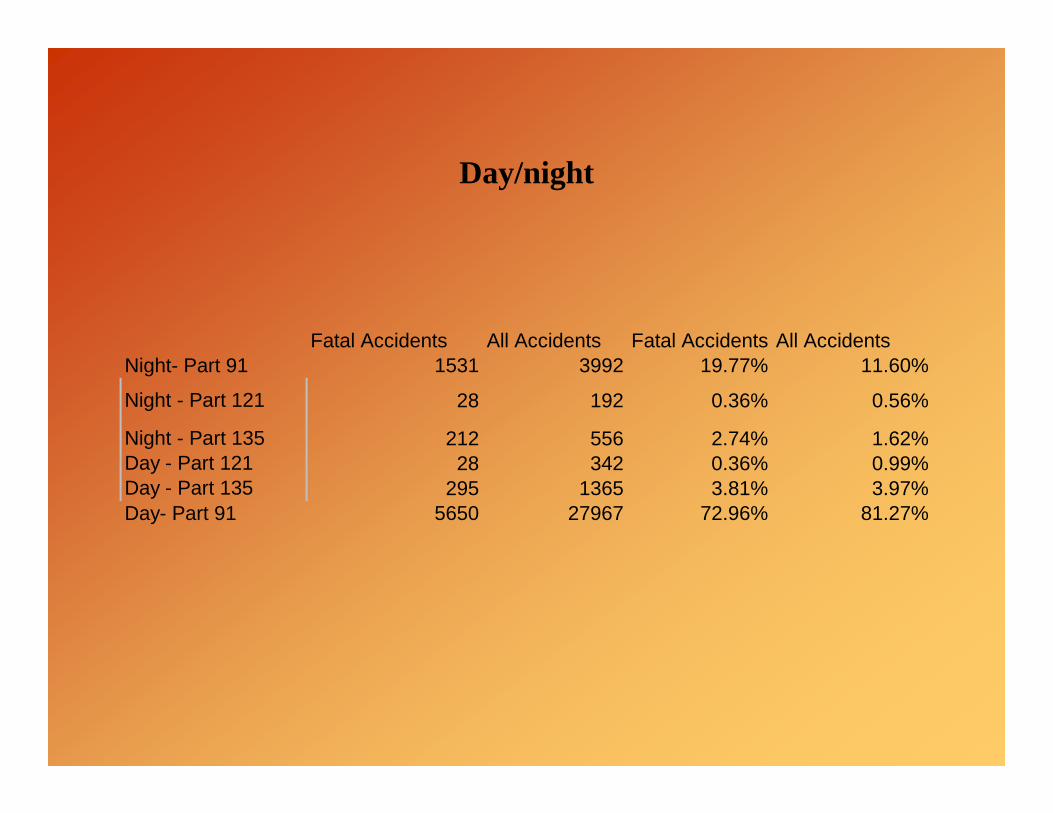
Day/night
Fatal Accidents All Accidents Fatal Accidents All AccidentsNight- Part 91 1531 3992 19.77% 11.60%
Night - Part 121 28 192 0.36% 0.56%
Night - Part 135 212 556 2.74% 1.62%Day - Part 121 28 342 0.36% 0.99%Day - Part 135 295 1365 3.81% 3.97%Day- Part 91 5650 27967 72.96% 81.27%
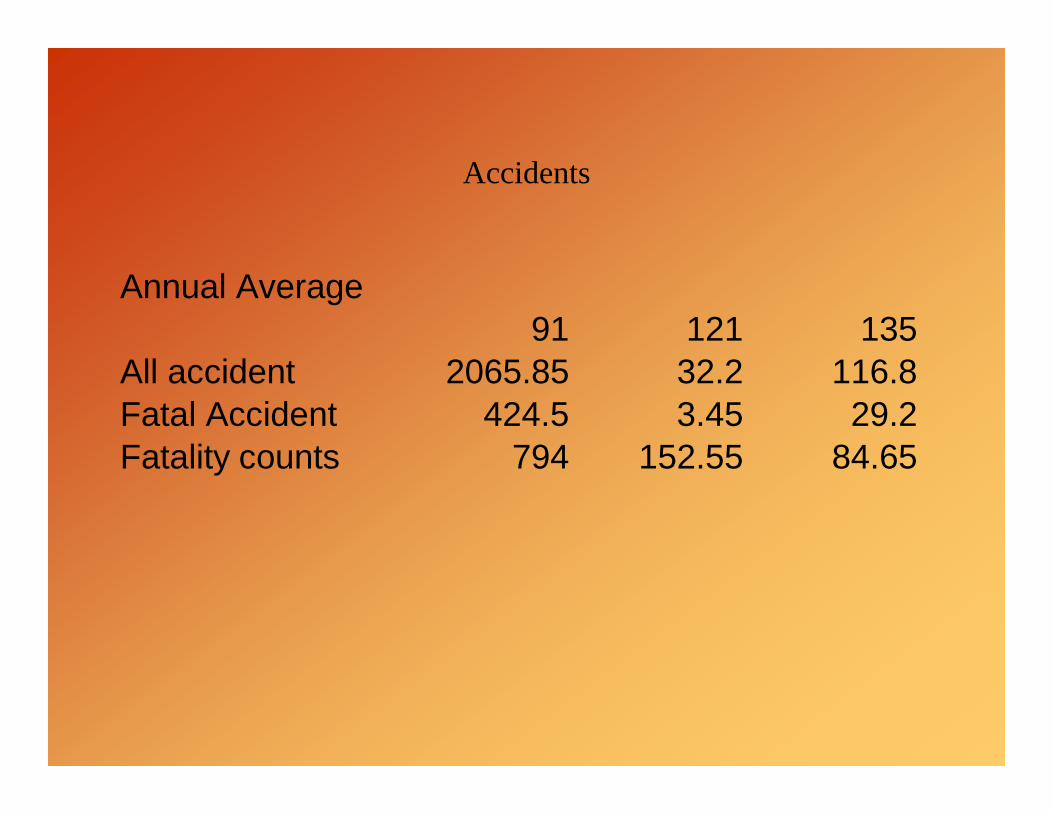
Accidents
Annual Average91 121 135
All accident 2065.85 32.2 116.8Fatal Accident 424.5 3.45 29.2Fatality counts 794 152.55 84.65
AccidentsAll Accidents Fatal Accident Fatality Counts
Weather 91 9616 1847 4080.75Weather 121 202 15.5 217.25Weather 135 541.5 125.5 383.5Loss of Control 91 9111 2380 4380Loss of Control 121 33 17 487Loss of Control 135 313 104 327Loss of Engine 91 9161 533 909Loss of Engine 121 31 2 6Loss of Engine 135 396 43 94Other A&L 91 8936 236 419Other A&L 121 103 8 70Other A&L 135 444 32 138CFIT -91 4157 1658 3533CFIT -121 12 5 585CFIT -135 374 186 599Mid air 91 36 0 0Taxi and Standing 91 1652 64 55Taxi and Standing 121 208 14 4Taxi and Standing 135 222 8 8Other 91 1953 645 1121Other 121 66 6 313Other 135 159 28 80Sum 47726.5 7957 17809.5Sum 121&135 3104.5 594 3311.75