Embed Size (px)
Citation preview

International Journal of Applied Research & Studies ISSN 2278 – 9480
iJARS/ Vol. II/ Issue 3/Mar, 2013/377 1
http://www.ijars.in
Research Article
An Analysis of Financial Performance in Tourism Industry (A Case Study OF ITDC)
Authors:
Dr. Asha Sharma*
Address For correspondence:
Assistant Professor, Department of Management, Aravali Institute of Management, Jodhpur, India
Abstract:
The tourism industry in India is substantial and vibrant, and the country is fast becoming a major
global destination. India‘s travel and tourism industry is one of them most profitable industries in
the country, and also credited with contributing a substantial amount of foreign exchange. This is
illustrated by the fact that during 2006, four million tourists visited India and spent US $8.9 billion.
Several reasons are cited for the growth and prosperity of India‘s travel and tourism industry.
Economic growth has added millions annually to the ranks of India‘s middle class, a group that is
driving domestic tourism growth. Disposable income in India has grown by 10.11% annually from
2001-2006, and much of that is being spent on travel. The purpose of this study is to study of
financial performance, of Indian tourism industry. The most common tool of financial analysis
various ratios as used. It is concluded that the overall performance of Indian Tourism Development
Corporation Limited found satisfactory in term of short term liquidity position, efficiency level and
solvency capacity but not so good in term of profitability level and investment analysis basis
.Keywords: Tourism industry, profitability Ratios, Activity Ratios, working capital management,
Testing of financial position ratios
INTRODUCTION:
Tourism in India is the largest service industry, with a contribution of 6.23%
to the national GDP and 8.78% of the total employment in India. In 2010, 25.8 million foreign
tourists visited India. India generated about 200 billion US dollars in 2008 and that is expected to
increase to US$375.5 billion by 2018 at a 9.4% annual growth rate. The majority of foreign tourists
come from USA and UK. Kerala, Tamil Nadu, Delhi, Uttar Pradesh and Rajasthan are the top five
states to receive inbound tourists. Domestic tourism in the same year was 740 million. Andhra
Pradesh, Uttar Pradesh, Tamil Nadu and Maharashtra received the big share of these visitors.
Ministry of Tourism is the nodal agency to formulate national policies and programs for the
development and promotion of tourism. In the process, the Ministry consults and collaborates with
other stakeholders in the sector including various Central Ministries/agencies, the state
governments and union territories and the representatives of the private sector. Concerted efforts
are being made to promote new forms of tourism such as rural, cruise, medical and eco-tourism.
The Ministry of Tourism also maintains the Incredible India campaign.
[email protected] * Corresponding Author Email-Id

International Journal of Applied Research & Studies ISSN 2278 – 9480
iJARS/ Vol. II/ Issue 3/Mar, 2013/377 2
http://www.ijars.in
According to World Travel and Tourism Council, India will be a tourism hot-spot from 2009–2018,
having the highest 10-year growth potential. Thanks in part to its booming IT and outsourcing
industry a growing number of business trips are made by foreigners to India, who will often add a
weekend break or longer holiday to their trip. Foreign tourists spend more in India than almost any
other country worldwide. Tourist arrivals are projected to increase by over 22% per year through
till 2010, with a 33% increase in foreign exchange earnings recorded in 2004.
The Tourism Ministry has also played an important role in the development of the industry,
initiating advertising campaigns such as the 'Incredible India' campaign, which promoted India‘s
culture and tourist attractions in a fresh and memorable way. The campaign helped create a colorful
image of India in the minds of consumers all over the world, and has directly led to an increase in
the interest among tourists. The tourism industry has helped growth in other sectors as diverse as
horticulture, handicrafts, agriculture, construction and even poultry. Both directly and indirectly,
increased tourism in India has created jobs in a variety of related sectors. The numbers tell the
story: almost 20 million people are now working in the India‘s tourism industry. India‘s
governmental bodies have also made a significant impact in tourism by requiring that each and
every state of India have a corporation to administer support issues related to tourism. A new
growth sector is medical tourism. It is currently growing at around 30% per annum. Medical tourist
arrivals are expected to reach one million soon.
COMPANY PROFILE
The India Tourism Development Corporation Limited (ITDC) is a Hospitality retail and
Education company owned by Government of India under Ministry of Tourism, Established in
1966. ITDC came into existence in October 1966 and has been the prime mover in the progressive
development, promotion and expansion of tourism in the country.
The Organizing Committee of Commonwealth Games 2010 Delhi made the India Tourism
Development Corporation Ltd. (ITDC) as a Hospitality partner. All three properties i.e. Hotel
Ashok, Samrat and The Janpath –as the Games Family Hotels .The Ashok being the flagship hotel
was the host of all VIP movements .―The Ashok Group of Hotels in totality offered a combined
inventory of 680 rooms/suites with Hotel Ashok offering 500 rooms, Samrat offering 60 rooms and
Janpath offering 120 rooms.‖ The flagship Family Hotel Ashoka hosted members of
Commonwealth Games Associations (CGAs), the Commonwealth Games Federation (CGF),
International Sports Federations, Technical Delegates and the International Olympic Committee
(IOC). The hotels will be the nerve centre of the Games and bear facilitation offices of CGF and
OC CWG Delhi 2010. All events and meetings of different constituent groups held at these Games
family hotels. Hotel Samrat and Hotel Janpath provided the accommodation to the athletes‘
families.
The Corporation is running hotels, restaurants at various places for tourists, besides providing
transport facilities. In addition, the Corporation is engaged in production, distribution and sale of
tourist publicity literature and providing entertainment and duty free shopping facilities to the
tourists. The Corporation has diversified into new avenues/innovative services like Full-Fledged
Money Changer (FFMC) services, engineering related consultancy services etc. The Ashok
Institute of Hospitality & Tourism Management of the Corporation imparts training and education
in the field of tourism and hospitality. Presently, ITDC has a network of eight Ashok Group of
Hotels, six Joint Venture Hotels, 2 Restaurants (including one Airport Restaurant), 12 Transport
Units, one Tourist Service Station, 37 Duty Free Shops at International as well as Domestic

International Journal of Applied Research & Studies ISSN 2278 – 9480
iJARS/ Vol. II/ Issue 3/Mar, 2013/377 3
http://www.ijars.in
Customs Airports, one Tax Free outlet and two Sound & Light Shows. Besides, ITDC is also
managing a hotel at Bharatpur and a restaurant at Kosi on behalf of the Department of Tourism. In
addition, it is also managing catering services at Western Court, Vigyan Bhawan, Hyderabad House
and National Media Press Centre at Shastri Bhawan, New Delhi.
REVIEW OF LITERATURE
Brian Carver, Christy He, Jonah Hister (2004), has made an attempt study of historical aspect of
Oil and Petroleum industry. They analyzed that Oil and Petroleums have historically formed an
important component of India's exports. There is archaeological evidence from Mohenjo-Daro,
which establishes that the complex technology of mordant dyeing was being used in the
subcontinent from at least the second millennium B.C. It is believed that the use of printing blocks
in India started in 3000 B.C., and some historians have concluded that India may have given birth
to Oil and Petroleum printing. Marco Polo‘s records show that Indian Oil and Petroleums used to
be exported to China and South East Asia from Andhra and Tamil ports in the "largest ships" then
known. Buddhist era scripts reveal that woollen carpets were known in India as early as 500 B.C.
and the technical skill that went into Indian carpets of the Mughal period is still hailed today.
Maurice Landes, Stephen MacDonald, Santosh K. Singh, and Thomas Vollrat (2005) emphasized
that growth of Oil and Petroleum industry in India is depend upon execution of reforms to policies,
including taxes that discriminate against the use of manmade fibers and regulations affecting the
scale, technology use, and export competitiveness of the textile and apparel industries. Imports of
raw cotton have increased in concert with rising demand in recent years, but future growth will
depend on the extent to which India can boost chronically low cotton yields and improve cotton
quality.
Bhandari & Maiti (2007), in his study on Efficiency of Indian Manufacturing Oil and Petroleum
industry, has analyzed the Technical Efficiency (TE) varies between 68% to 84% across these year
and that individual TEs vary with firm-specific characteristics such as size and age. Further public
sector firms are found to be relatively less efficient.
OBJECTIVES OF THE STUDY
To analyze the profitability, solvency position and liquidity position of IRDC.
To identify the net profit and EPS growth rate performance of IRDC.
To find its market share in the tourism industry
To understand role of tourism industry in Indian economy
METHODOLOGY
The researcher, being an external analyst, had to depend mainly upon secondary data for the
purpose of studying the financing performance of IRDC in tourism Industry in India which is
highly performed in overall growth in terms of finance and total economic value. The exploratory
research techniques have been used for this study and also the study is restricted only to Indian
based tourism organizations.

International Journal of Applied Research & Studies ISSN 2278 – 9480
iJARS/ Vol. II/ Issue 3/Mar, 2013/377 4
http://www.ijars.in
SOURCES OF DATA
DATA COLLECTION:
The present study is mainly based on secondary data which were collected from the corporate
annual audited reports, company database, published research reports by various industries, related
websites and research organization.
SELECTION OF COMPANY AND PERIOD:
The present study is mainly intended to examine the comparative financial performance of tourism
industry particularly for IRDC for five years in the period of 2007 to 2011.
TOOLS USED FOR ANALYSIS
The present study has analyzed the financial performance of IRDC. In order to evaluate and
compare the financial performance of selected industries Ratio Analysis technique and average
mean has been used.
VARIABLES
Choice of the variables is influenced by the previous research and studies on the working capital
management. All the variable stated below have been used to test the hypotheses of our study. They
include dependent, independent variables. Current assets to Total Assets Ratio: This method is
based on operating cycle period. Here, the working capital requirement can be compare with its
total assets. Ratio to sales method: The working capital requirements are estimated as a ratio of
sales for each component of working capital. Ratio of fixed assets and working capital: The
working capital is estimated as a percentage of fixed investment
HYPOTHESIS TESTING
Since the objective of this study is to examine co-relevancy between gross working capital to other
variables like fixed assets, total assets and sales. For this a set of testable hypotheses (the null
hypothesis H0 versus the Alternatives ones H1) is decided and proved by correlation analysis
RESEARCH HYPOTHESES
Hypothesis 1
H01: There is significant relationship among the gross working capital, fixed assets, total assets and
sales
H11: There is negative relationship among the gross working capital, fixed assets, total assets and
sales
Hypothesis 2
H01: There is significant relationship among the liquidity ratios, management efficiency ratios and
assets turnover ratio
H11: There is negative relationship among the liquidity ratios, management efficiency ratios and
assets turnover ratio

International Journal of Applied Research & Studies ISSN 2278 – 9480
iJARS/ Vol. II/ Issue 3/Mar, 2013/377 5
http://www.ijars.in
RESULT & DISCUSSIONS
[A] COMPANY ANALYSIS- INTER ANALYSIS
1. Liquidity Ratio
Particulars Mar '11 Mar '10 Mar '09 Mar '08 Mar '07
Current Ratio 1.76 1.68 2 1.71 1.4
Quick Ratio 1.6 1.52 1.88 1.63 1.3
Cash Profit Margin (%) -- -1.17 5.83 10.97 8.6
In the 2011 company has very high current ratio which has been reached up to 1: 1.76, a high
current ratio in comparison to last years other than 2009 showing a very good liquidity in the
company and blockage of the money as well.
A quick ratio of 1:1 is usually considered satisfactory but in case of this company, it is 1.6. It
indicates a very high liquidity which can be easily converted into the cash whenever company
requires.
Solvency / Capital Structure Ratio
2. Solvency Ratio
Particulars Mar '11 Mar '10 Mar '09 Mar '08 Mar '07
Debt -Equity Ratio 0 0 0 0 0
Total Debt to Owners Fund 0 0 -- -- 0
Financial Charges Coverage Ratio --
-
25,821.57 1,707.90 4,940.70 16,235.13
Debt-Equity ratio is zero from staring. This implies that the company is more on owner‘s equity
rather than borrowed fund. It is not enjoying leverage advantages like any other industries in Indian
market.
-2
0
2
4
6
8
10
12
Mar '10 Mar '09 Mar '08 Mar '07
Current Ratio 1.76
Quick Ratio 1.6
Cash Profit
Margin(%) --

International Journal of Applied Research & Studies ISSN 2278 – 9480
iJARS/ Vol. II/ Issue 3/Mar, 2013/377 6
http://www.ijars.in
This ratio indicates relationship between total assets and total liabilities. High solvency ratio
indicates poor position of the company. Here this ratio is continuously increasing
Profitability Ratio
3. Profitability ratio
Particulars Mar '11 Mar '10 Mar '09 Mar '08 Mar '07
Net Profit Margin (%) -- -4.78 6.18 9.4 8.15
Adjusted Net Profit Margin (%) -- -4.78 6.18 9.4 8.15
Operating Profit Margin (%) -- -13.44 -0.81 10.27 7.89
Cash Profit Margin (%) -- -1.17 5.83 10.97 8.6
The gross margin ratio of the company shows a mixed trend. As the company is related to tourism
so company has very less gross margin. Still it had little bit of net profit in last three year but now it
is going in losses from last two years.
The net margin ratio of the company shows a mixed trend. The high net profit margin implies
higher returns to share holders in the form of dividend and stock price appreciation.
As above all profitability ratios are showing a mixed and equal trend here it is also showing an
equality of the all years.
-30000
-20000
-10000
0
10000
20000
Mar
'10
Mar
'09
Mar
'08
Mar
'07
Debt -Equity Ratio
0
Total Debt to
Owners Fund 0
Financial Charges
Coverage Ratio --
-15
-10
-5
0
5
10
15
Mar '10 Mar '09 Mar '08 Mar '07
Net Profit
Margin(%) --
Adjusted Net
Profit Margin(%) --
Operating Profit
Margin(%) --

International Journal of Applied Research & Studies ISSN 2278 – 9480
iJARS/ Vol. II/ Issue 3/Mar, 2013/377 7
http://www.ijars.in
Profitability Ratio based on Capital Employed
4. Profitability ratio (based on capital employed)
Particulars Mar '11 Mar '10 Mar '09 Mar '08 Mar '07
Adjusted Return on Net Worth (%) -3.06 -2.42 7.76 19.72 20.91
Return on Assets Excluding
Revaluations 35.58 36.59 37.49 35.16 30.88
Return on Long Term Funds(%) -4.09 -4.12 12.91 30 31.94
The return on assets ratio of the company shows a mixed trend. The high net profit implies higher
returns on the total invested assets. It is quite improving, means best utilization of assets is being
done.
Return on Long Term Funds ratio measures how well the long-term funds of owners and creditors
are used. The higher the ratio, the more efficient the utilization of capital employed. In this case, the
company has a mixed trend. Return is decreasing from last two years i.e.2010 onwards.
Return on Net Worth ratio shows the rate of return for the equity share holder. High ratio shows
strong position of the company. In this case the PAT is increasing so company share holder is also
getting much benefit and as a result the company is showing strong position. Return is decreasing
from last two years i.e.2010 onwards. As company is not using dabt capital, it may one of the
reasons for not earning appropriate return.
Activity / Efficiency Ratio
5. Activity/Efficiency Ratio
Particulars Mar '11 Mar '10 Mar '09 Mar '08 Mar '07
Inventory Turnover Ratio -- 31.37 49.54 208.59 310.99
Debtors Turnover Ratio 4.34 3.49 3.61 3.53 6.41
Investments Turnover Ratio 31.89 31.37 49.54 208.59 310.99
Fixed Assets Turnover Ratio -- 2.11 3.08 3.83 4.72
Total Assets Turnover Ratio -- 0.87 1.13 1.4 2.5
Asset Turnover Ratio 2.62 2.11 3.08 3.83 4.72
-10
0
10
20
30
40
Mar
'11
Mar
'10
Mar
'09
Mar
'08
Mar
'07
Adjusted Return
on Net Worth(%)
Return on Assets
Excluding
Revaluations
Return on Long
Term Funds(%)

International Journal of Applied Research & Studies ISSN 2278 – 9480
iJARS/ Vol. II/ Issue 3/Mar, 2013/377 8
http://www.ijars.in
The stock turnover ratio of the company shows a mixed trend. Generally, a high stock turnover
ratio is considered better than a low turnover ratio. But it is reducing the ratio from 2010 onwards.
As far as debtor‘s turnover ratio is concerned it is more or less is same in all the year, it indicates
the credit policy of the company. After 2007, Creditors turnover ratio is increasing which shows
that the liability of the company is increasing. A marketing department is regarded as an efficient
department when its assets turnover is high.
This ratio shows the return on fixed assets. High ratio shows good position of the company. Here
there is a very good position of the company it is growing. This ratio shows the relationship
between sales and current assets. Here there is mixed trend between the years and the company has
enough assets.
The investment turnover ratio measures the relationship between the value of production and
average total assets. This ratio measures the assets utilization efficiency of a firm. In this case, the
investment turnover ratio is increasing after 2007 which shows the proper utilization of the
investment.
Investment Analysis
6. Investment Analysis
Earning Per Share (Rs) -1 -1.67 3.76 6.53 6.75
Dividend Per Share -- -- 1 2 2
Dividend Payout Ratio Cash Profit -- -- 33.77 32.45 31.56
Earning Retention Ratio -- -- 49.06 66.26 63.77
This ratio is showing an equality trend of the dividend policy.
EPS as a measure of the profitability of a company from the owner‘s point of view, In this case the
EPS is regularly increasing which is showing strong position of the company.
This ratio is also known as the earnings price ratio; In this case the company is maintaining this
ratio equally as previous years.
050
100150200250300350
Invento
ry
Turn
over
Investm
ents
Turn
over
Tota
l
Assets
5.
Activity/Efficiency
Ratio Mar '11
5.
Activity/Efficiency
Ratio Mar '10
5.
Activity/Efficiency
Ratio Mar '09
5.
Activity/Efficiency
Ratio Mar '08
5.
Activity/Efficiency
Ratio Mar '07
International Journal of Applied Research & Studies ISSN 2278 – 9480
iJARS/ Vol. II/ Issue 3/Mar, 2013/377 9
http://www.ijars.in
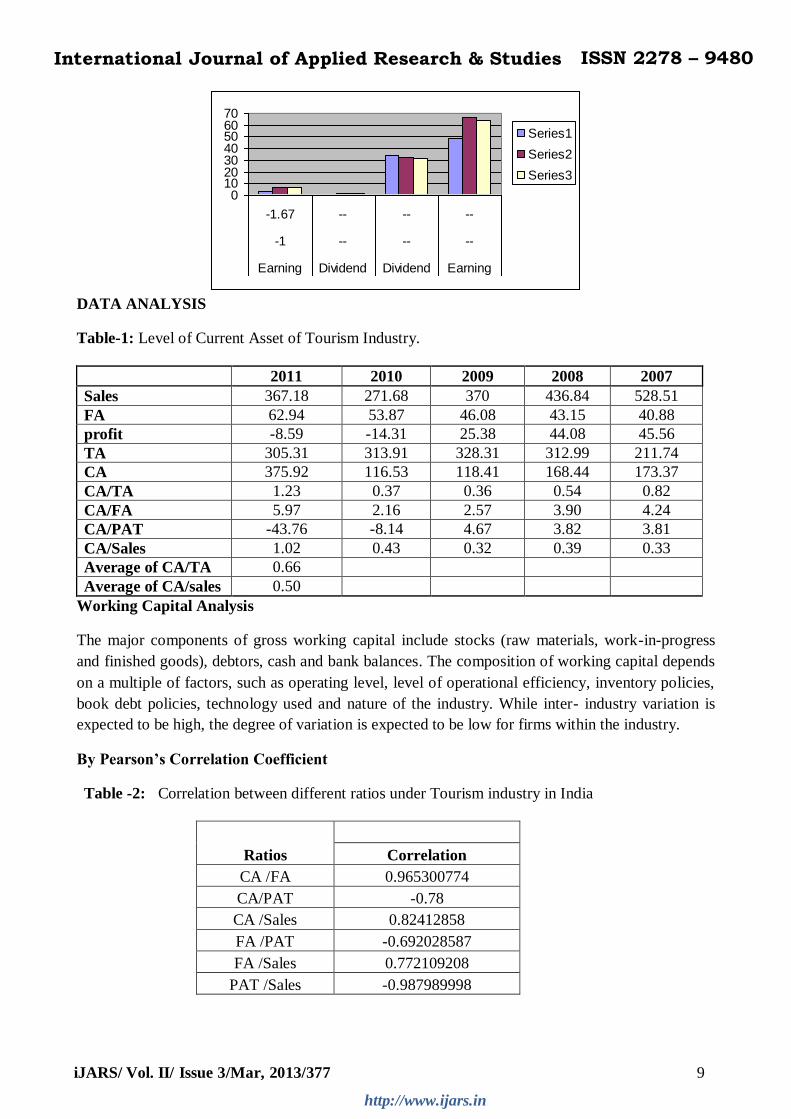
DATA ANALYSIS
Table-1: Level of Current Asset of Tourism Industry.
2011 2010 2009 2008 2007
Sales 367.18 271.68 370 436.84 528.51
FA 62.94 53.87 46.08 43.15 40.88
profit -8.59 -14.31 25.38 44.08 45.56
TA 305.31 313.91 328.31 312.99 211.74
CA 375.92 116.53 118.41 168.44 173.37
CA/TA 1.23 0.37 0.36 0.54 0.82
CA/FA 5.97 2.16 2.57 3.90 4.24
CA/PAT -43.76 -8.14 4.67 3.82 3.81
CA/Sales 1.02 0.43 0.32 0.39 0.33
Average of CA/TA 0.66
Average of CA/sales 0.50
Working Capital Analysis
The major components of gross working capital include stocks (raw materials, work-in-progress
and finished goods), debtors, cash and bank balances. The composition of working capital depends
on a multiple of factors, such as operating level, level of operational efficiency, inventory policies,
book debt policies, technology used and nature of the industry. While inter- industry variation is
expected to be high, the degree of variation is expected to be low for firms within the industry.
By Pearson’s Correlation Coefficient
Table -2: Correlation between different ratios under Tourism industry in India
Ratios Correlation
CA /FA 0.965300774
CA/PAT -0.78
CA /Sales 0.82412858
FA /PAT -0.692028587
FA /Sales 0.772109208
PAT /Sales -0.987989998
010203040506070
-1.67 -- -- --
-1 -- -- --
Earning Dividend Dividend Earning
Series1
Series2
Series3

International Journal of Applied Research & Studies ISSN 2278 – 9480
iJARS/ Vol. II/ Issue 3/Mar, 2013/377 10
http://www.ijars.in
Pearson’s Correlation Coefficient Analysis
Pearson‘s Correlation analysis is used to find the relation between two variables i.e. Current ratio to
fixed ratio, Gross working capital and Total assets, Gross working capital and Fixed Assets, Gross
working capital and sales, gross working capital and EBIT. One variable cause, is an independent
and another variable result, will be a dependent variable. By using first ratio assets mix ratio, next
four ratios efficiency can be measured and last one is for profitability.
Presents Pearson correlation coefficients for the variables used to assess the impact of working
capital management on profitability, measured by gross profit, net profit and operating profit.
Profitability ratio is significantly positively correlated with OPM and capital-turnover ratio, but
negatively correlated with the measures of WCM. This positive relation for CCC is consistent with
the view that resources are blocked at the different stage of the supply chain, thus prolonging the
operating cycle. This might increase profits due to increase sales, especially where the costs of tied
up capital is lower than the benefits of holding more inventories and granting more trade credit to
customers. Also the tourism industry may be able to obtain trade credit from the suppliers and this
is supported by the higher proportion of current liabilities to total assets.
If less working capital is used in total assets, means more efficient utilization of working capital is
done. It is same with the fixed assets and sales. Working capital and EBIT has negative
relationship. Positive correlation is showing highly significant relationship between the company‘s
liquidity and effectively.
Results are showing the positive impact or positive correlation between two factors in Tourism
industry. First correlation shows that there is huge percentages of assets is contributed current
assets rather than fixed assets. Negative CA/PAT shows that more investment in current assets
effects profitability adversely. CA/Sales ratio shows more current assets create more sales. Other
negative ratios shows reverse relationship between liquidity and profitability. So it can be said
working capital management need more emphasis.
INTRA ANALYSIS
INDIAN TRAVEL AND TOURISM INDUSTRY
Indian tourism offers most diverse products globally. The country‘s rich history, cultural heritage,
beauty, diversity of religion and medicine fascinate budget and luxury travelers. Tourism in India
has registered significant growth over the years. This has been led by growth in both leisure and
business tourism. Rising incomes, increasing affordability, growing aspirations, increasing
globalization, and a growing airline industry along with improvement in travel-related
infrastructure have supported industry growth. Tourism holds immense potential for the Indian
economy. It can provide impetus to other industries through backward and forward linkages and
can contribute significantly to GDP.

International Journal of Applied Research & Studies ISSN 2278 – 9480
iJARS/ Vol. II/ Issue 3/Mar, 2013/377 11
http://www.ijars.in
India‘s travel and tourism industry is expected to generate revenue of Rs. 1,970 bn (US$ 42 bn) in
2010, according to the World Travel & Tourism Council (WTTC). This would be around 3.1% of
total GDP. However, since travel and tourism touches all sectors of the economy, its real impact is
greater and the travel and tourism economy directly and indirectly accounts for ` 5,533 bn (US$
118 bn), equivalent to 8.6% of total GDP.
Personal travel and tourism is the most significant contributor, accounting for 55% of the total
market, while business travel forms only 9%. Capital investment is also significant with a share of
24%. Hotels, air transport, surface transport, basic infrastructure, and facilitation systems
environment are some of the related sectors.
The share of the Indian travel and tourism industry globally is very less. However the industry
holds immense potential. In fact, India has been ranked among the leaders by the WTTC for long-
term (10-year) growth prospects. Further, a globally renowned travel magazine, Conde Nast
Traveler, ranked India among the top 10 tourist destinations of the world. JBIC has also ranked
India as the fifth most attractive investment destination. India is probably the only country that
offers various categories of tourism with its geographical diversity and rich cultural heritage.
Structure of the tourism industry

International Journal of Applied Research & Studies ISSN 2278 – 9480
iJARS/ Vol. II/ Issue 3/Mar, 2013/377 12
http://www.ijars.in
Tourism comprises activities of people travelling to and staying in places outside their usual
environment for not more than one consecutive year for leisure, business and social, recreational,
and knowledge seeking purposes.
The tourism industry is primarily service and people oriented; it is made up of businesses and
organisations belonging to various other industries and sectors. It is an interplay among these
businesses and organisations/persons which offer ―travel experience‖ to tourists. The tourism
industry comprises hospitality (related to accommodation and dining), travel (transportation
services through different modes), and various other businesses which offer services and products
to tourists.
Most of the players in the tourism industry are SMEs. The unorganised sector dominates the
industry in India. Hotels, airline companies, and tour operators form the organised sector.
Specialist travel service providers assist tourists with travel arrangements. These providers include
travel agencies who are involved in retailing of travel products directly to the tourists (individuals
or groups). They provide information on different travel destinations and advise customers on
travel plans. They also sell associated products such as insurance, car hire, and currency exchange.
Performance of the Indian travel and tourism industry
The tourism business in India can be broadly classified into: inbound tourism, domestic tourism,
and outbound tourism. Inbound tourism foreign tourist arrivals in the country increased steadily
from 2.4 million in 2002 to 5.3 million in 2008. It, however, fell to 5.1 million in 2009, recording a
decline of 3.3%. The slowdown in India‘s core markets, the US, Europe and UK, travel advisories
issued by countries against travel to India following the terror attacks in Mumbai, and
postponement of holidays by travelers affected tourist inflow into the country in 2009; nevertheless,
the impact on the Indian industry was much lesser compared with other countries.
Foreign tourist arrivals are expected to increase in 2010. International events to be held in India and
the government‘s sincere efforts to promote the country as a tourist destination are likely to drive
foreign tourist arrivals. International events to be held during the year — Commonwealth Games,
ICC World Cup Cricket and Formula 1 —are expected to attract a number of sports fans across the
world to India. Improving infrastructure, low-cost airlines, and improved road connectivity are
expected to aid the increase in tourist inflow.

International Journal of Applied Research & Studies ISSN 2278 – 9480
iJARS/ Vol. II/ Issue 3/Mar, 2013/377 13
http://www.ijars.in
The top 10 countries accounted for around 64% of total tourist arrivals in the country during 2009.
The US and the UK together accounted for around 30% of tourist arrivals. Around 14% of the total
tourist arrivals in 2009 were from India‘s neighboring countries, Bangladesh and Sri Lanka.
Emerging trends
With changing times and global business conditions, significant changes have been observed in the
Indian travel and tourism industry.
Demand for niche and customized tourism products
Lifestyle changes and higher disposable incomes have resulted in shifting travel preferences and
travelers are looking for ‗out-of-the-box‘ experiences. Consequently, travel service providers are
offering niche, customized tourism products. This has led to emergence of niche segments such as
wine tourism, pop-culture tourism, cruise tourism, wellness tourism, monsoon tourism etc.
Tour companies are also willing to customize products as per travelers‘ choices/preferences.
Findings
The major findings from the present study are:
Profitability – reduced 2010 onwards.
Financial Strength – not satisfactory.
Fixed Assets-Financed mainly through owners fund
Working Capital - efficiently and effectively managed.
On the basis of the analysis of profitability, Activity, earning per share, fixed assets and inventory
turnover, it can be concluded that the performance of the company. EPS is low, Current Assets is
above standard, Proprietary fund also found satisfactory. The position of the IRDCL can be ranked
on top among the selected unit and based on the analysis of data, although last two years are curse
for the industry and was not able to grow properly on financial aspects. Still now trend is changed
and boom in the tourism industry so it is expected that company will become sound on fiiancial
parameters.

International Journal of Applied Research & Studies ISSN 2278 – 9480
iJARS/ Vol. II/ Issue 3/Mar, 2013/377 14
http://www.ijars.in
CONCLUSION
Tourism Industry is a very dynamic industry and so are its challenges and strategies, therefore a
learning approach towards ‗best-practices‘ would yield better results in enhancing competitiveness
of this industry. Also, the need for sound perspective in planning and ―private-public-community‖
participation is imperative for this purpose. This paper was an attempt to illuminate the area
through simple yet effective examples and cases collected from states around India, based on their
contribution in making their respective Tourism Industry more competitive. It leaves a background
for further research, as assessing the implications of using the above mentioned ‗best-practices‘ in
Indian Tourism Industry can be another rewarding study.
The study has analyzed the short term and profitability position of leading company in India in
tourism industry; some of the important ratios were used to measure the financial performance the
company. Based on the above analysis, ITDC is one of the largest traded companies by market
capitalization in India and the largest India-based company measured by. The result of financial
analysis also shows that the company is financial strong and efficiently managed. Its financial
position is found to be low satisfactory level in net profit growth on the profitability level, short
term liquidity position, efficiency level, solvency capacity and investment analysis basis. Still the
company will have to strengthen its shareholders funds and working capital to compete and
enhancing its current performances in growing global business environment.
The study has analyzed the liquidity, efficiency and profitability in tourism industry in India; some
of the important ratios were used to measure the financial performance of these companies. Based
on the above analysis the significant positive relationship is found between two variables. In total
assets, if working capital is decreased still sales and operating profit is increasing means these
assets are utilized in an effective manner that will increase profitability.
On basis of the above analysis we may further conclude that these results can be further
strengthened if firm is managed its working capital management with more effective ways. It can
be managed properly by taking care to maintain appropriate ratio of working capital to fixed assets,
total assets and sales. So that efficiency and profitability can be enhanced but liquidity can be
controlled.
This is an attempt identify and study the movement of key financial parameters and their
relationship with profitability of tourism industry. It is an attempt to and the study whether the key
identified parameters move in a synchronous way going up and coming down with basic
profitability parameters. Profit-making company has been taken for study for the period of 2006 to
2010. The data have been taken from the figures supplied by prowess database. On the basis of this
data a trend parameter is calculated for the year 2011. So, on the base of the analysis, the broad
conclusion is that the parameters are consistent within a wide horizon and with the growth that
companies have achieved, the parameters have also responded in a synchronous manner.

International Journal of Applied Research & Studies ISSN 2278 – 9480
iJARS/ Vol. II/ Issue 3/Mar, 2013/377 15
http://www.ijars.in
References:
1. McFetridge, Donald. 1995. ―Competitiveness: Concepts and Measures,‖ in ―Productivity and
Competitiveness Challenges Facing Canadian Industries‖. 2003. Rao S and Tang J.
2. Hillman Chartrand H. 1992. ―The Competitiveness of Nations - Some Assembled Thoughts‖.
3. Porter M. ―From Competitive Advantage to Corporate Strategy‖
4. OECD conference on innovation and growth in Tourism, Lugano, Switzerland September 2003
5. Nishaal G; Guntur S. ―Competitiveness indicators in the travel and tourism industry‖. Tourism
Economics, Volume 11, Number 1, March 2005, pp. 25-43(19)
6. ―Image of ―tour operators‖‖. Available - http://www.tourismresearch.govt.nz/
7. G. Anand. ―Addressing a Shortage of Hotel Rooms, Not People‖. Available -
http://www.nytimes.com/2006/12/26/business/worldbusiness/26hotel.html
8. ‗Tourism to be No.1 forex earner‘. Available - www.rediff.com/money/2005/nov/16tour.htm
9. White paper on ―An Integrated Approach for Indian Tourism‖. Available -
www.consultavalon.com/perspe/tourism.pdf
10. http://www.joburg.org.za/images/tourism_structure.jpg
11. ―Hotel Majors Relook at Strategies to benefit from IT exemptions‖. March 3, 2007. The
Economic Times
12. Uemura C. 2005. ―Determinants of competitiveness in the tourism industry‖. JECR Researcher
Report no. 51
13. World Economic Forum. ―Travel and Tourism Competitiveness: Highlights‖. Available -
www.weforum.org/en/initiatives/gcp/TravelandTourismReport/Highlights/index.htm
14. ―Domestic travelers too going places‖. April 15, 2007. The Economic Times
15. ―Air Traffic flies 43% in Metros‖. April 16, 2007. The Economic Times
16. ―Multiple Helpings‖. April 12, 2007. Hindustan Times - Horizons17.
17. ―Survey of outgoing tourists 2000‖. Available -
http://www.gov.mu/portal/site/tourists/menuitem
18. Adolphusj. Toby (2008), Liquidity performance Relationship in Nigerian Manufacturing
Companies, Finance India, pp.117-131
19. Agarwal, N.K. (1978), ‗‗Cash management in Indian industries‘‘, The Chartered Accountant,
Vol.27. No.1, pp.21-27.
Websites:
1. www.indialawoffices.com
2. www.moneycontrol.com
3. www. en.wikipedia.org
4. www.texmin.nic.in
5. www.indianOil and Petroleumjournal.com
6. www.indian-Oil and Petroleum.com