Embed Size (px)
Citation preview
An Analysis of Financial Literacy Among Italian Students
www.gflec.org
May 2018
Authors: Hallie Davis Andrea Hasler Annamaria LusardiGlobal Financial Literacy Excellence Center, The George Washington University School of Business
Research support was provided by the Global Thinking Foundation.
An Analysis of Financial Literacy Among Italian Students | 2
Introduction 3
The Programme for International Student Assessment (PISA) 3
The Financial Literacy Assessment 4
Methodology of the Assessment 5
Global Financial Literacy Levels 6
Gender Gap 10
In Focus: Italy 12
Factors Influencing Financial Literacy Performance 13
Influencing Factor: Family and Socioeconomic Background 14
Influencing Factor: Financial Access 15
Influencing Factor: Parents 18
Influencing Factor: Teachers and Schools 21
Conclusion 24
Contents
An Analysis of Financial Literacy Among Italian Students | 3
Introduction
Today’s youth live on an economic landscape that requires them to shoulder greater savings
and investing responsibilities than past generations while systemic changes in retirement
savings, volatile financial markets, and higher costs of education are forcing them to make
important financial decisions at early ages. Life expectancy is longer—and continues to
increase—meaning young people face the prospect of supporting themselves for many
years more than their parents. Thanks to globalization and digital technologies, financial
services and products are more widely available but also more complex. As younger
generations tackle financial decisions that carry a long-lasting impact, their understanding of
the concepts involved in these decisions will be critical.
Growing research shows that financial literacy is an essential skill if young people are to make
sound financial decisions for their future. The financially literate among them are more likely
to have precautionary savings, plan for retirement, make financial investments, and be
current on credit card and loan payments (Lusardi et al., 2017, Lusardi and Tufano, 2015).
The first international study of financial literacy and education, published in 2005 by the
Organization for Economic Cooperation and Development (OECD), noted both the critical
role of financial literacy as well as its paucity across the globe (OECD, 2005).
In 2008, the OECD created the International Network on Financial Education (INFE) to
promote awareness of effective financial education, collect data, and facilitate the
collaboration of policymakers. The OECD and INFE underscored the importance of financial
education for the young and the need for international measurements of financial literacy.
This in turn led to the development of an assessment for measuring levels of financial literacy
among the young on an international scale. The assessment was folded into the OECD’s
Programme for International Student Assessment (PISA) in 2012. The assessment provides
a unique opportunity to understand the level of financial literacy of the young on an
international scale. Results from this assessment showed Italy, in particular, experienced a
significant increase in their average financial literacy, since 2012. Further analysis of
Italy provides a greater understanding of the factors that influence the financial skills
and knowledge of the young.
The Programme for International Student Assessment (PISA)
PISA is a triennial global survey that evaluates education systems worldwide by testing the
skills and knowledge of 15-year-old students. The first assessment, conducted in 2000,
covered 43 countries and economies. The most recent wave, in 2015, encompasses 72
An Analysis of Financial Literacy Among Italian Students | 4
countries and economies. In the 2015 survey, approximately 540,000 students—
representing 29 million 15-year-olds—completed a two-hour test (OECD, 2017). PISA
measures the ability of students through three core domains of reading, mathematics, and
science. In each wave, one of the core domains is tested in detail using a majority of the
testing time. Minor assessments are also made in the remaining domains (reading,
mathematics, science or collaborative problem solving) to allow for performance analyses
on a three-year frequency. Since 2012, countries have also been given the opportunity to
participate in an optional financial literacy assessment.
PISA’s objective is to measure how prepared students are to face the challenges of modern
society. The forward-looking assessment is timed near completion of mandatory schooling,
just before students enter the adult world, and examines how they apply their knowledge to
real world situations. This is distinctive from other standardized testing that measures
proficiency of specific concepts taught and learned in school. Fifteen-year-olds were singled
out for the assessment because while students across countries vary in age when they
complete mandatory schooling, 15-year-olds are usually still in school. In addition to
collecting student performance data, PISA asks the students and their principals to complete
questionnaires about socio-demographic and family background, learning environment,
attitudes toward education, and school-specific characteristics. Countries can also choose to
survey parents about their participation in their child’s learning and schooling activities. This
information helps identify factors that may influence student performance.
The Financial Literacy Assessment
The optional financial literacy assessment, which can be added to the assessment of core
skills, involves an additional one-hour test for a randomly chosen subset of students in the
participating countries and economies. The financial literacy assessment was conducted in
18 countries and economies in 2012. The second wave in 2015 assessed students in 15
countries and economies, 10 of which are OECD members: Australia, Flemish Community of
Belgium, Canadian provinces, Chile, Italy, the Netherlands, Poland, Slovak Republic, Spain
and the United States. Another five are partner countries and economies: Brazil, the Chinese
provinces of Beijing-Shanghai-Jiangsu-Guangdong (B-S-J-G [China]), Lithuania, Peru, and
Russia. Seven OECD members participated in both waves—Australia, Belgium (Flemish), Italy,
Poland, the Slovak Republic, Spain and the United States—but the only partner country to
take part in both was Russia (OECD, 2015).
The financial literacy assessment is based on a framework developed in 2012. It uses a
comprehensive definition of financial literacy that takes into consideration both knowledge
An Analysis of Financial Literacy Among Italian Students | 5
of financial concepts and the ability to apply the knowledge to everyday situations relevant
for the young:
“Financial literacy is knowledge and understanding of financial concepts and risks, and the skills,
motivation and confidence to apply such knowledge and understanding in order to make effective
decisions across a range of financial contexts, to improve the financial well-being of individuals
and society, and to enable participation in economic life.” (OECD, 2014)
The assessment’s operational measures cover three dimensions of financial literacy: content,
process, and context. Content refers to knowledge, what students know about financial
products and concepts. This includes an understanding of financial products such as bank
cards; the planning and managing of income and wealth over both the short-term and long-
term; and students’ interaction with the larger financial marketplace. The second dimension,
process, aims to assess how student apply their knowledge and analyze and evaluate
solutions. In particular, it looks at how students identify and assess financial information and
how they evaluate and take effective actions in a financial setting. The context dimension
applies financial knowledge and skills to specific settings, describing general life situations in
which students must make financial decisions. A context example would be the post-
graduation decision of whether to continue one’s education or enter the labor market.
The financial literacy assessment embeds these three dimensions in various questions that
test students’ proficiency. Answering the questions requires a basic level of numeracy,
although the questions are framed so as to avoid the need for substantial calculation. The
level of difficulty for each question and the student performance are evaluated on a
proficiency scale.
Methodology of the Assessment
The individual tests that students take contain only a subset of the overall pool of items in
the assessment. They are kept brief to minimize survey fatigue and improve response rates.
This setup provides accurate estimations of the student population when results are
interpreted at the aggregate level. Comparisons across individual students are difficult,
however, as not all students take the same assessment (OECD, 2017b). Students’ proficiency
is estimated with a probabilistic model using a distribution based on the level of difficulty of
the question and the underlying student trait characteristics that are captured from the
student questionnaire. A question’s difficulty is based on the percentage of students who
answer the question correctly. The estimated proficiency of students and the level of
difficulty of the questions are then placed on a continuous scale (OECD, 2017b). The single
An Analysis of Financial Literacy Among Italian Students | 6
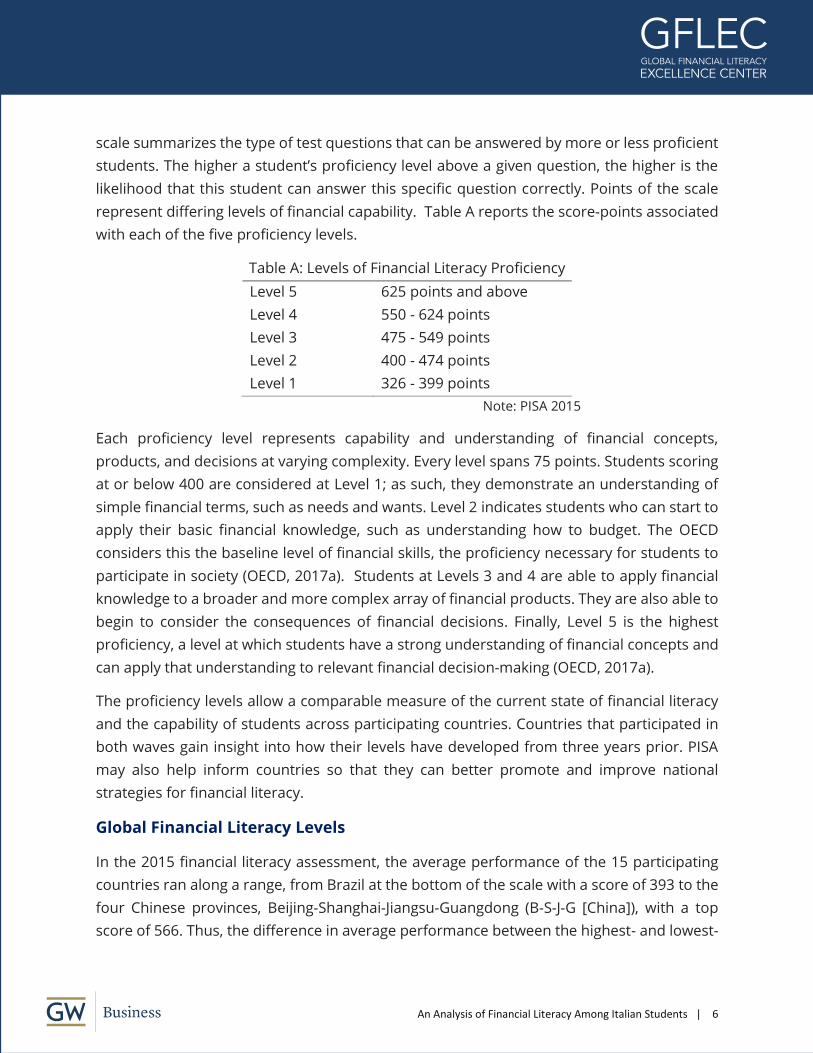
scale summarizes the type of test questions that can be answered by more or less proficient
students. The higher a student’s proficiency level above a given question, the higher is the
likelihood that this student can answer this specific question correctly. Points of the scale
represent differing levels of financial capability. Table A reports the score-points associated
with each of the five proficiency levels.
Table A: Levels of Financial Literacy Proficiency
Level 5 625 points and above
Level 4 550 - 624 points
Level 3 475 - 549 points
Level 2 400 - 474 points
Level 1 326 - 399 points
Note: PISA 2015
Each proficiency level represents capability and understanding of financial concepts,
products, and decisions at varying complexity. Every level spans 75 points. Students scoring
at or below 400 are considered at Level 1; as such, they demonstrate an understanding of
simple financial terms, such as needs and wants. Level 2 indicates students who can start to
apply their basic financial knowledge, such as understanding how to budget. The OECD
considers this the baseline level of financial skills, the proficiency necessary for students to
participate in society (OECD, 2017a). Students at Levels 3 and 4 are able to apply financial
knowledge to a broader and more complex array of financial products. They are also able to
begin to consider the consequences of financial decisions. Finally, Level 5 is the highest
proficiency, a level at which students have a strong understanding of financial concepts and
can apply that understanding to relevant financial decision-making (OECD, 2017a).
The proficiency levels allow a comparable measure of the current state of financial literacy
and the capability of students across participating countries. Countries that participated in
both waves gain insight into how their levels have developed from three years prior. PISA
may also help inform countries so that they can better promote and improve national
strategies for financial literacy.
Global Financial Literacy Levels
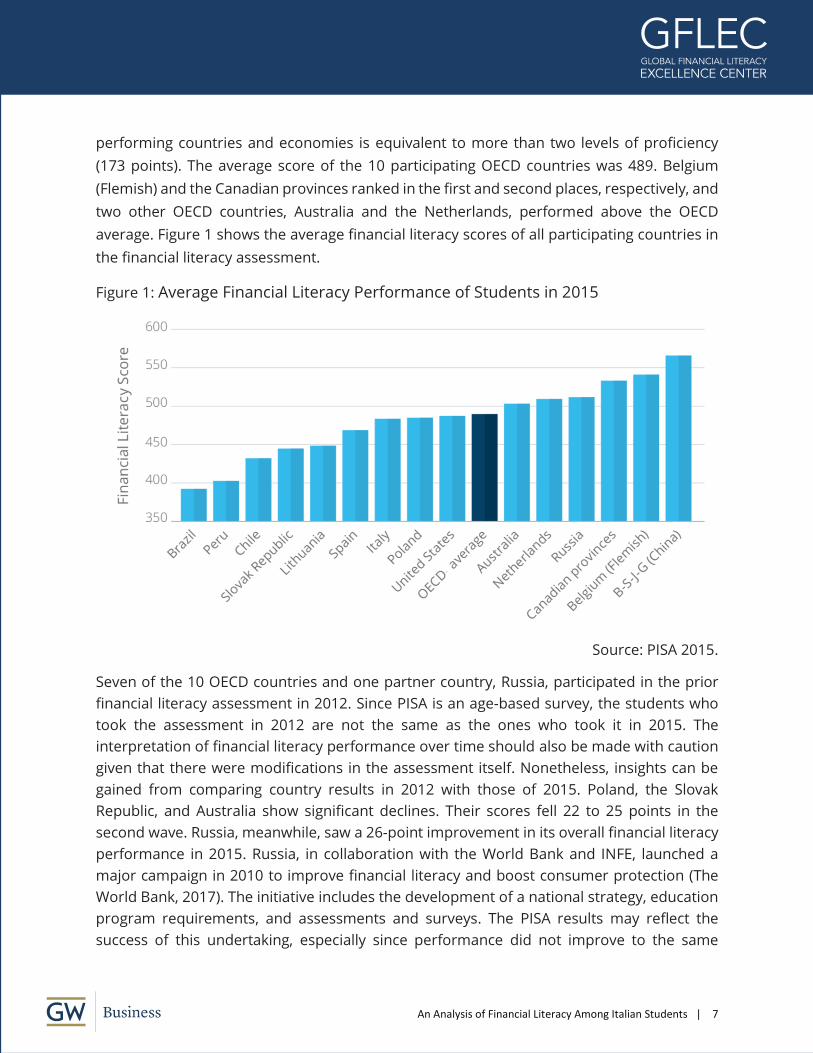
In the 2015 financial literacy assessment, the average performance of the 15 participating
countries ran along a range, from Brazil at the bottom of the scale with a score of 393 to the
four Chinese provinces, Beijing-Shanghai-Jiangsu-Guangdong (B-S-J-G [China]), with a top
score of 566. Thus, the difference in average performance between the highest- and lowest-
An Analysis of Financial Literacy Among Italian Students | 7
performing countries and economies is equivalent to more than two levels of proficiency
(173 points). The average score of the 10 participating OECD countries was 489. Belgium
(Flemish) and the Canadian provinces ranked in the first and second places, respectively, and
two other OECD countries, Australia and the Netherlands, performed above the OECD
average. Figure 1 shows the average financial literacy scores of all participating countries in
the financial literacy assessment.
Figure 1: Average Financial Literacy Performance of Students in 2015
Source: PISA 2015.
Seven of the 10 OECD countries and one partner country, Russia, participated in the prior
financial literacy assessment in 2012. Since PISA is an age-based survey, the students who
took the assessment in 2012 are not the same as the ones who took it in 2015. The
interpretation of financial literacy performance over time should also be made with caution
given that there were modifications in the assessment itself. Nonetheless, insights can be
gained from comparing country results in 2012 with those of 2015. Poland, the Slovak
Republic, and Australia show significant declines. Their scores fell 22 to 25 points in the
second wave. Russia, meanwhile, saw a 26-point improvement in its overall financial literacy
performance in 2015. Russia, in collaboration with the World Bank and INFE, launched a
major campaign in 2010 to improve financial literacy and boost consumer protection (The
World Bank, 2017). The initiative includes the development of a national strategy, education
program requirements, and assessments and surveys. The PISA results may reflect the
success of this undertaking, especially since performance did not improve to the same

An Analysis of Financial Literacy Among Italian Students | 8
magnitude in the other core domains, mathematics, reading, and science. Belgium (Flemish)
and the United States show no significant change in mean performance between 2012 and
2015. Overall, ground was lost for the seven OECD countries that participated in both the
2012 and 2015 waves. In 2012, 15.4% of their students performed below the baseline of
financial knowledge. That increased to 21.8% in 2015.
Global trends emerge from the distribution across proficiency levels among the participating
countries in 2015. Among the 10 OECD countries, 22% of 15-year-olds lack a basic
understanding of financial literacy, performing at Level 1 or below. In other words, these
students on average, score below the baseline level of financial literacy proficiency (Level 2).
Over all participating countries, the share of low-performing students differs widely. Among
the highest shares are 53% of students in Brazil, 48% in Peru, and 38% in Chile. In high-
performing countries, just more than one-in-10 students in B-S-J-G (China), Russia, and
Belgium (Flemish) perform at or below Level 1. It is important to note that even in high-
performing countries, only 12% of students are highly proficient in financial matters,
meaning they are able to answer the Level 5 questions correctly. This high-proficiency
shortfall persists across all participating countries. The incidence of students at Level 5
ranges from one in three students in B-S-J-G (China) to one in 10 in Peru.
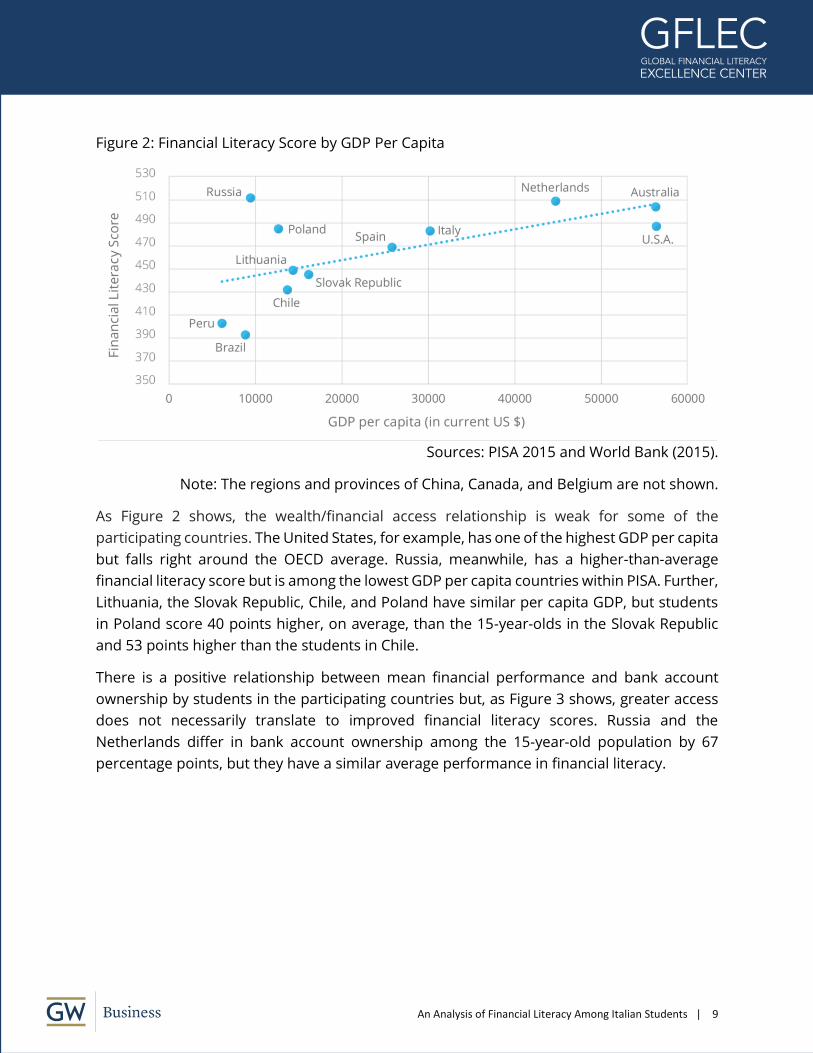
The variability in average financial literacy performance across countries is linked to several
factors, including wealth and financial access. Economies with greater wealth, as measured
by GDP per capita, generally have more complex financial systems. Figure 2 shows a positive
relationship between wealth and financial literacy scores. The graph uses the 2015 GDP per
capita, shown in current U.S. dollars. The three participating economies—Belgium (Flemish),
B-S-J-G (China), and the Canadian provinces—are excluded from this analysis since they
represent sub-regions of their respective countries.
An Analysis of Financial Literacy Among Italian Students | 9
Figure 2: Financial Literacy Score by GDP Per Capita
Sources: PISA 2015 and World Bank (2015).
Note: The regions and provinces of China, Canada, and Belgium are not shown.
As Figure 2 shows, the wealth/financial access relationship is weak for some of the
participating countries. The United States, for example, has one of the highest GDP per capita
but falls right around the OECD average. Russia, meanwhile, has a higher-than-average
financial literacy score but is among the lowest GDP per capita countries within PISA. Further,
Lithuania, the Slovak Republic, Chile, and Poland have similar per capita GDP, but students
in Poland score 40 points higher, on average, than the 15-year-olds in the Slovak Republic
and 53 points higher than the students in Chile.
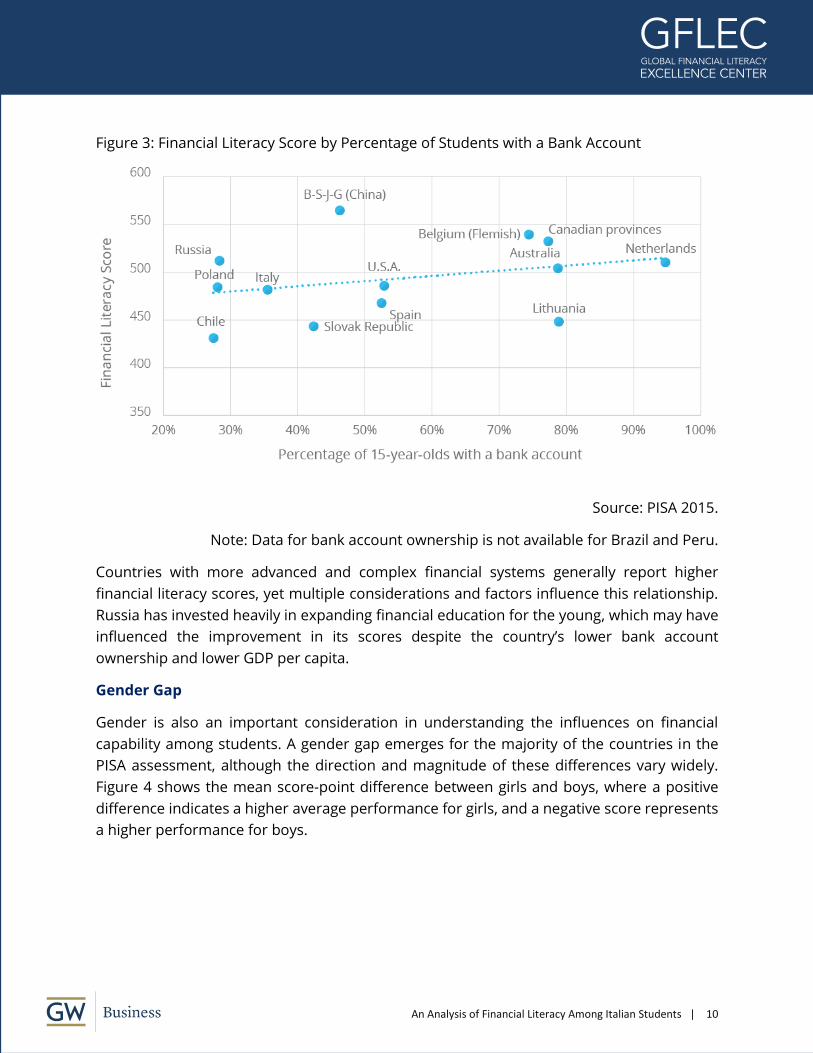
There is a positive relationship between mean financial performance and bank account
ownership by students in the participating countries but, as Figure 3 shows, greater access
does not necessarily translate to improved financial literacy scores. Russia and the
Netherlands differ in bank account ownership among the 15-year-old population by 67
percentage points, but they have a similar average performance in financial literacy.
An Analysis of Financial Literacy Among Italian Students | 10
Figure 3: Financial Literacy Score by Percentage of Students with a Bank Account
Source: PISA 2015.
Note: Data for bank account ownership is not available for Brazil and Peru.
Countries with more advanced and complex financial systems generally report higher
financial literacy scores, yet multiple considerations and factors influence this relationship.
Russia has invested heavily in expanding financial education for the young, which may have
influenced the improvement in its scores despite the country’s lower bank account
ownership and lower GDP per capita.
Gender Gap
Gender is also an important consideration in understanding the influences on financial
capability among students. A gender gap emerges for the majority of the countries in the
PISA assessment, although the direction and magnitude of these differences vary widely.
Figure 4 shows the mean score-point difference between girls and boys, where a positive
difference indicates a higher average performance for girls, and a negative score represents
a higher performance for boys.
An Analysis of Financial Literacy Among Italian Students | 11
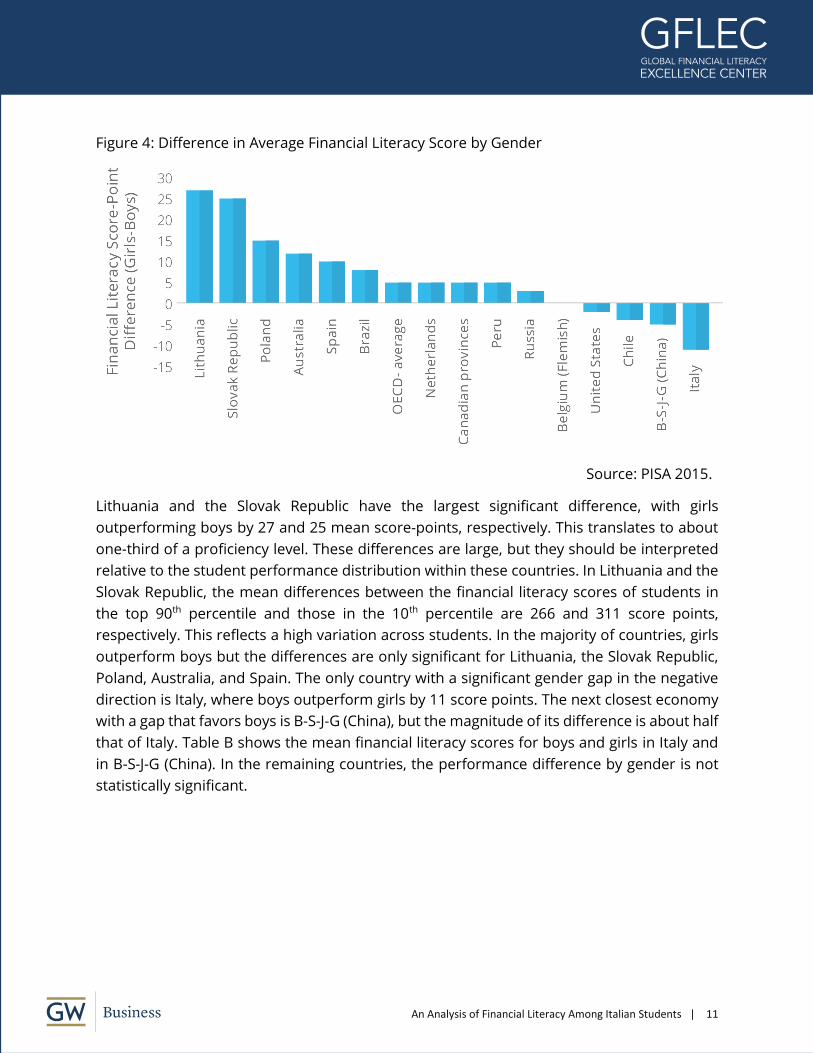
Figure 4: Difference in Average Financial Literacy Score by Gender
Source: PISA 2015.
Lithuania and the Slovak Republic have the largest significant difference, with girls
outperforming boys by 27 and 25 mean score-points, respectively. This translates to about
one-third of a proficiency level. These differences are large, but they should be interpreted
relative to the student performance distribution within these countries. In Lithuania and the
Slovak Republic, the mean differences between the financial literacy scores of students in
the top 90th percentile and those in the 10th percentile are 266 and 311 score points,
respectively. This reflects a high variation across students. In the majority of countries, girls
outperform boys but the differences are only significant for Lithuania, the Slovak Republic,
Poland, Australia, and Spain. The only country with a significant gender gap in the negative
direction is Italy, where boys outperform girls by 11 score points. The next closest economy
with a gap that favors boys is B-S-J-G (China), but the magnitude of its difference is about half
that of Italy. Table B shows the mean financial literacy scores for boys and girls in Italy and
in B-S-J-G (China). In the remaining countries, the performance difference by gender is not
statistically significant.
An Analysis of Financial Literacy Among Italian Students | 12
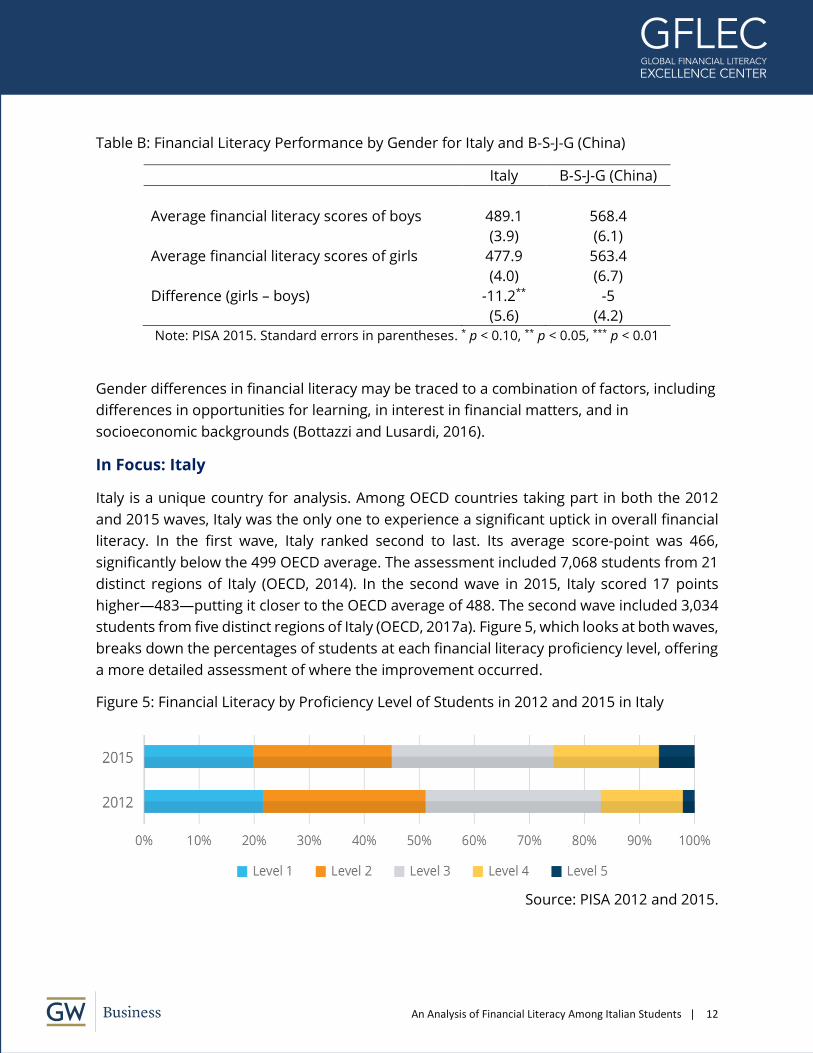
Table B: Financial Literacy Performance by Gender for Italy and B-S-J-G (China)
Italy B-S-J-G (China)
Average financial literacy scores of boys 489.1 568.4
(3.9) (6.1)
Average financial literacy scores of girls 477.9 563.4
(4.0) (6.7)
Difference (girls – boys) -11.2** -5
(5.6) (4.2)
Note: PISA 2015. Standard errors in parentheses. * p < 0.10, ** p < 0.05, *** p < 0.01
Gender differences in financial literacy may be traced to a combination of factors, including
differences in opportunities for learning, in interest in financial matters, and in
socioeconomic backgrounds (Bottazzi and Lusardi, 2016).
In Focus: Italy
Italy is a unique country for analysis. Among OECD countries taking part in both the 2012
and 2015 waves, Italy was the only one to experience a significant uptick in overall financial
literacy. In the first wave, Italy ranked second to last. Its average score-point was 466,
significantly below the 499 OECD average. The assessment included 7,068 students from 21
distinct regions of Italy (OECD, 2014). In the second wave in 2015, Italy scored 17 points
higher—483—putting it closer to the OECD average of 488. The second wave included 3,034
students from five distinct regions of Italy (OECD, 2017a). Figure 5, which looks at both waves,
breaks down the percentages of students at each financial literacy proficiency level, offering
a more detailed assessment of where the improvement occurred.
Figure 5: Financial Literacy by Proficiency Level of Students in 2012 and 2015 in Italy
Source: PISA 2012 and 2015.
An Analysis of Financial Literacy Among Italian Students | 13
There is a marginal decrease, less than 1.9 percentage points, in the percentage of Italian
students at Level 1 or below. The percentage of students performing below the baseline level
of proficiency remains around the OECD average: about one-in-five students. However, there
is a statistically significant decline of 4.4 percentage points among students scoring at Level
2, the baseline level of proficiency. Further, the higher financial literacy score is driven by a
significant jump in the percentage of students performing at Levels 4 and 5, or 4.3 and 4.4
percentage points, respectively. The decline of students scoring at Level 3 was not
statistically significant. These changes indicate that, overall, the percentage of Italian
students lacking basic financial literacy skills remains constant, although greater numbers of
students at higher levels of proficiency are able to grasp the more challenging questions.
The performance variation observed within each participating country or economy is wider
than the variation observed between countries and economies. Student characteristics,
socioeconomic status, immigration background, and experience with money may influence
financial literacy and contribute to the observed heterogeneity between students from the
same country or economy. The financial literacy score point difference between students
performing at the 90th percentile and those at the 10th percentile is 285 points on average
for the OECD countries and economies. Interestingly, the performance gap in Italy is 249
score-points, the smallest along with Russia (232 score-points). The largest gap—312 score-
points—occurred with B-S-J-G (China) and the Netherlands. These differences reflect the
proficiency disparity between the lowest and the highest achievers within a country which,
in Italy, exceeds three proficiency levels. A comparison of Italy’s results from 2012 to 2015
shows an upward shift in the upper part of the performance distribution (at the median and
above), reaffirming that the average improvement in financial literacy is due to better
performance among high-performing students.
Factors Influencing Financial Literacy Performance
Multiple factors may help explain financial literacy performance, among them, social
environment, home and family background, and interaction with the financial market.
Schools and teachers can also exert an influence. The social and economic environments in
which students grow up may affect their perception of education and their educational
achievement. Family background provides insight into what educational resources are
available to students. Answers to questions about home possessions are taken as proxies
for material wealth. Parents, too, may have an effect on students’ school performance
beyond their economic status. The ways in which parents address money matters and
discuss financial decision-making at home can have an influence, as can parents’
involvement in their child’s education. Financial literacy competency and skill may also
depend on a student’s learning environment, school resources, and teachers.
An Analysis of Financial Literacy Among Italian Students | 14
Influencing Factor: Family and Socioeconomic Background
Research shows that factors such as parents’ education, demographics, and socioeconomic
background are strongly related to financial literacy (Lusardi, Mitchell and Curto, 2010). The
breadth and depth of the questions included in PISA allow for the development of various
indices to measure the impact of wealth and socioeconomic background on student
performance, largely through the resources and learning opportunities available to the
students.
The family wealth index is a composite within PISA that employs several questions about
home possession and access to technology in order to indicate the wealth of the family.
Variables within this index include whether the student has a room of his or her own or a
link to the internet. The number of smartphones, televisions, electronic tablets, computers,
cars, and the number of rooms in a home with a bath or shower are also counted. In Italy,
three country-specific possessions were included as proxies for wealth: antique furniture, a
security-alarm system, and air conditioning. Since the PISA data do not include a direct
income measure, the possession of household items has been used as a proxy for family
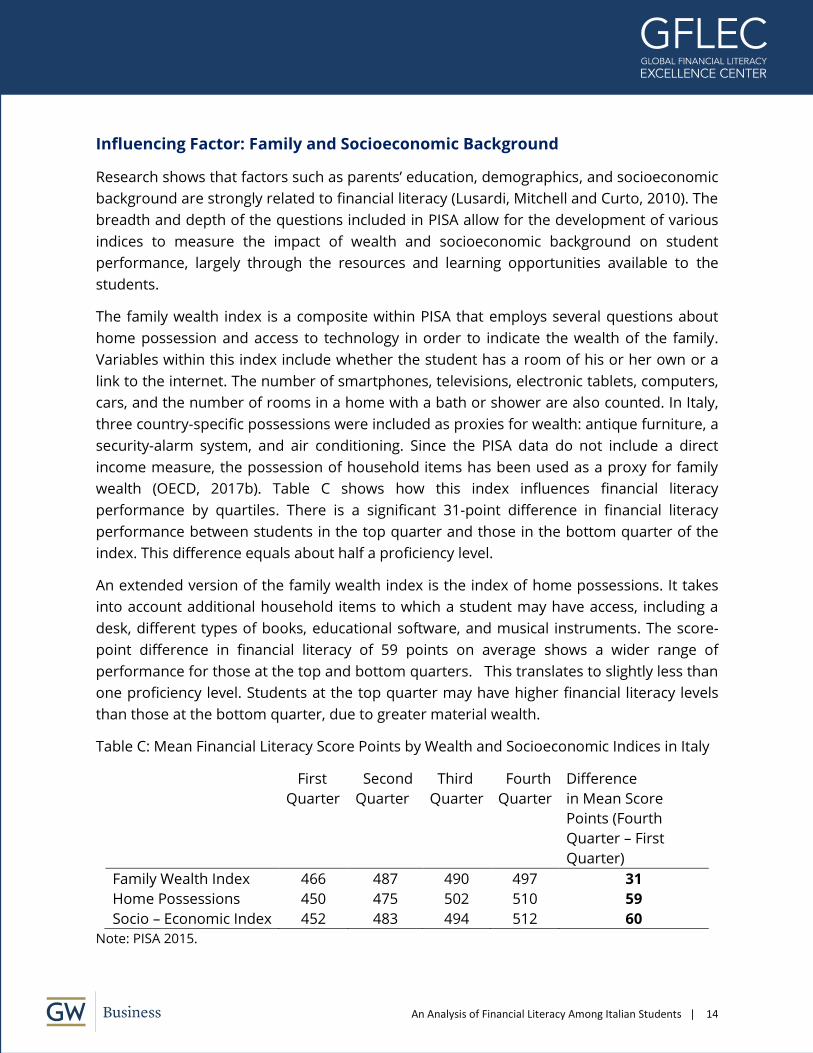
wealth (OECD, 2017b). Table C shows how this index influences financial literacy
performance by quartiles. There is a significant 31-point difference in financial literacy
performance between students in the top quarter and those in the bottom quarter of the
index. This difference equals about half a proficiency level.
An extended version of the family wealth index is the index of home possessions. It takes
into account additional household items to which a student may have access, including a
desk, different types of books, educational software, and musical instruments. The score-
point difference in financial literacy of 59 points on average shows a wider range of
performance for those at the top and bottom quarters. This translates to slightly less than
one proficiency level. Students at the top quarter may have higher financial literacy levels
than those at the bottom quarter, due to greater material wealth.
Table C: Mean Financial Literacy Score Points by Wealth and Socioeconomic Indices in Italy
First
Quarter
Second
Quarter
Third
Quarter
Fourth
Quarter
Difference
in Mean Score
Points (Fourth
Quarter – First
Quarter)
Family Wealth Index 466 487 490 497 31
Home Possessions 450 475 502 510 59
Socio – Economic Index 452 483 494 512 60
Note: PISA 2015.
An Analysis of Financial Literacy Among Italian Students | 15
The variation in performance is more pronounced when additional variables are taken into
account. The index of economic, social, and cultural status (socioeconomic index) is a
compilation of three indicators: the parents’ education, the highest parental occupation, and
the home possession index discussed previously. The rationale for using these three
components was that socioeconomic status has been seen as based on education,
occupational status, and income (OECD, 2017b). There is a significant difference—60 score
points—between students considered economically disadvantaged by the OECD (bottom
quarter) and those considered economically advantaged (top quarter). The average score of
students from the bottom quarter fall into the first proficiency level, reflecting a lack of basic
financial skills. Those in the top quarter, the economically advantaged students, perform
around the third proficiency level.
While this score-point difference in financial literacy performance is significant, it falls below
the OECD average of 89 score points, the smallest difference among all 10 OECD countries.
Thus, the percentage of the variation in financial literacy performance explained by the
socioeconomic index is 5.5%, the lowest among the OECD participating members. On
average across the 10 OECD countries and economies, 10% of the variation in student
performance within each country and economy is associated with socioeconomic status.
Students are generally born into their family background, and their households’
socioeconomic status has a significant influence on their financial literacy performance.
Besides these factors, students may also choose to interact with the financial market and
learn through work, owning a bank account, or other avenues.
Influencing Factor: Financial Access
A basic understanding of financial concepts is essential for students. Many 15-year-olds
already make financial decisions related to saving and spending, and these decisions require
their understanding of the value of money. Students gain experience by receiving money
through an allowance or a gift from friends or family, by selling thing at a local market or
online, or by working in a formal or informal job. Informal jobs include occasional tasks such
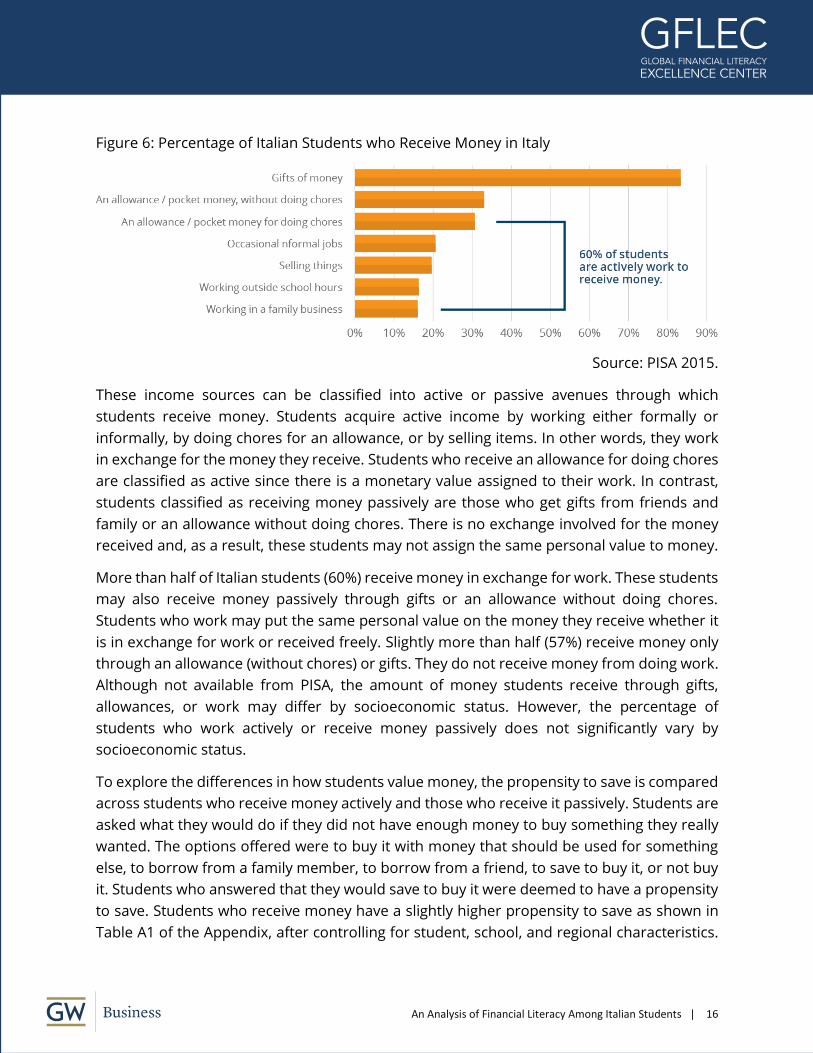
as babysitting or yard work. Figure 6 details the percentage of Italian students who report
receiving money from such sources. The majority receive some form of money through gifts
(83%). More than a third (35%) of students receive an allowance, which may or may not be
tied to chores. In addition to receiving money from their parents and family, every other 15-
year-old student earns income from some form of work activity. Specifically, 53% report
receiving money from working outside school hours, and/or from working in a family
business, and/or from occasional informal jobs.
An Analysis of Financial Literacy Among Italian Students | 16
Figure 6: Percentage of Italian Students who Receive Money in Italy
Source: PISA 2015.
These income sources can be classified into active or passive avenues through which
students receive money. Students acquire active income by working either formally or
informally, by doing chores for an allowance, or by selling items. In other words, they work
in exchange for the money they receive. Students who receive an allowance for doing chores
are classified as active since there is a monetary value assigned to their work. In contrast,
students classified as receiving money passively are those who get gifts from friends and
family or an allowance without doing chores. There is no exchange involved for the money
received and, as a result, these students may not assign the same personal value to money.
More than half of Italian students (60%) receive money in exchange for work. These students
may also receive money passively through gifts or an allowance without doing chores.
Students who work may put the same personal value on the money they receive whether it
is in exchange for work or received freely. Slightly more than half (57%) receive money only
through an allowance (without chores) or gifts. They do not receive money from doing work.
Although not available from PISA, the amount of money students receive through gifts,
allowances, or work may differ by socioeconomic status. However, the percentage of
students who work actively or receive money passively does not significantly vary by
socioeconomic status.
To explore the differences in how students value money, the propensity to save is compared
across students who receive money actively and those who receive it passively. Students are
asked what they would do if they did not have enough money to buy something they really
wanted. The options offered were to buy it with money that should be used for something
else, to borrow from a family member, to borrow from a friend, to save to buy it, or not buy
it. Students who answered that they would save to buy it were deemed to have a propensity
to save. Students who receive money have a slightly higher propensity to save as shown in
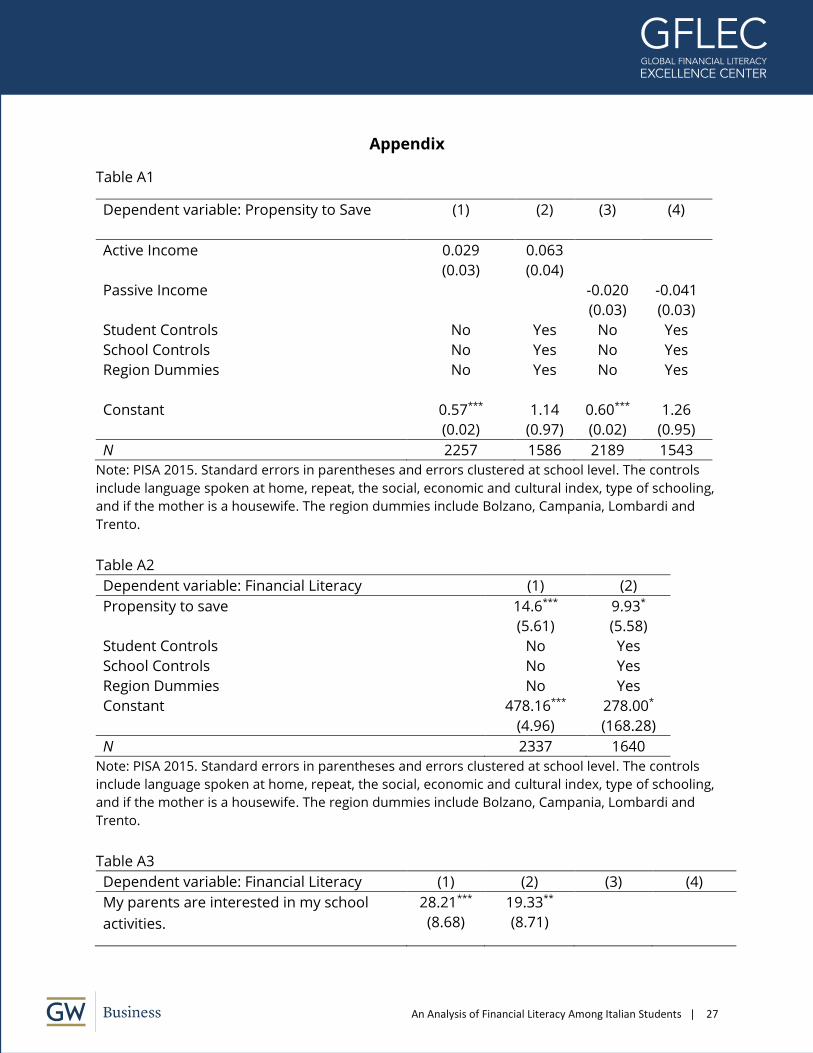
Table A1 of the Appendix, after controlling for student, school, and regional characteristics.
An Analysis of Financial Literacy Among Italian Students | 17
However, the propensity to save for students who work does not diverge greatly from that
of students who receive gifts or pocket money. Students who work may assign a greater
value to the money they receive, but this does not translate into increased savings behavior.
A stronger relationship is found between savings behavior and the level of financial literacy.
The scores for students who self-report that they would save money if there was something
they wanted were, on average, 10 points higher in the financial literacy assessment than
students who do not save, after accounting for regional differences and school and student
characteristics. This is reported in Table A2 of the Appendix.
While much of the 15-year-old student population receives and earns money, there are
differences among students in terms of access to financial products such as bank accounts
and prepaid debit cards. Just more than half the Italian students (57%) have a bank account
and/or a prepaid debit card. This aligns with the OECD average of 60%. Students in Italy who
use financial products also show higher financial literacy levels. A student with a bank
account scores, on average, 26 points higher than a student without a bank account. For a
student with a prepaid debit card, the gap is 30 points. Both differences are statistically
significant and remain significant even after accounting for socioeconomic differences.
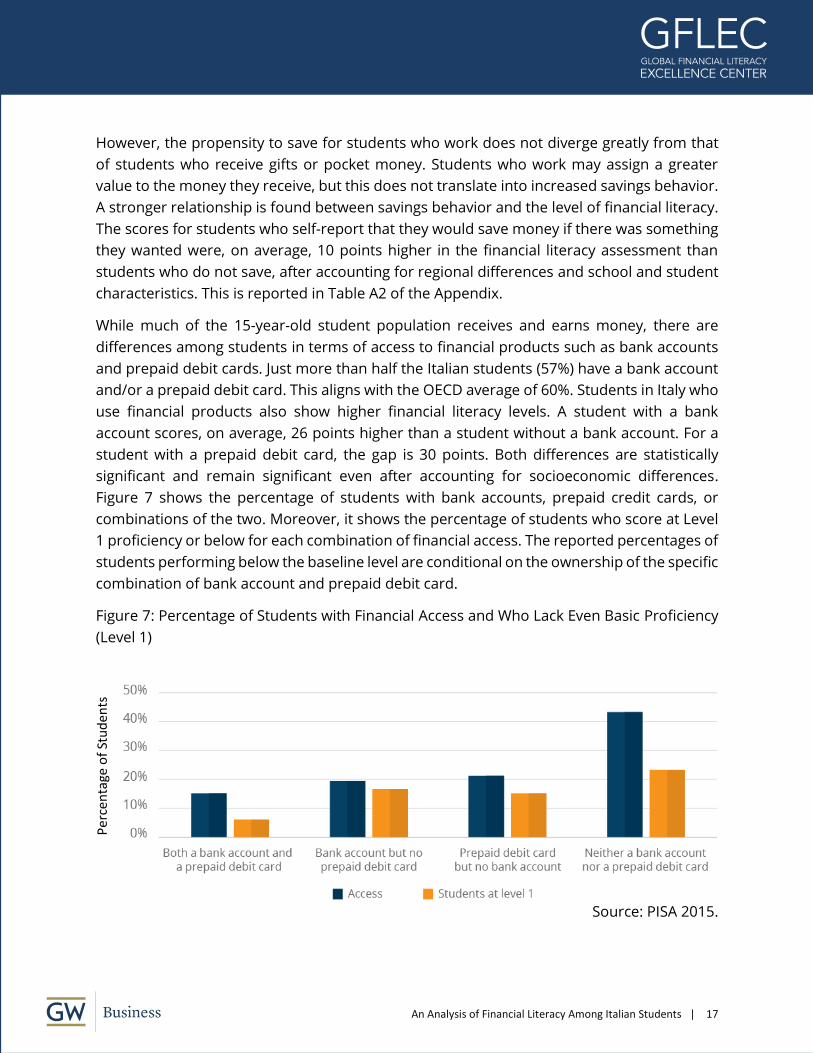
Figure 7 shows the percentage of students with bank accounts, prepaid credit cards, or
combinations of the two. Moreover, it shows the percentage of students who score at Level
1 proficiency or below for each combination of financial access. The reported percentages of
students performing below the baseline level are conditional on the ownership of the specific
combination of bank account and prepaid debit card.
Figure 7: Percentage of Students with Financial Access and Who Lack Even Basic Proficiency
(Level 1)
Source: PISA 2015.
Per
cen
tage
of
Stu
den
ts
An Analysis of Financial Literacy Among Italian Students | 18
Overall, 20% of students in Italy score at Level 1 proficiency or below, indicating that they
lack the baseline financial skills for successful participation in economic life. Among students
without access to a bank account or a prepaid debit card, 24% fall below the baseline of
financial literacy capability. The percentage of low performers—students lacking basic
financial knowledge—decreases as financial access rises. Among students who own both a
bank account and a prepaid debit card, only 6% fall below the baseline of proficiency.
Although there is a strong relationship, these findings need to be interpreted with caution
as they only show a correlation, not a causal relationship. Moreover, students below or even
at the baseline level are using financial products without the knowledge and skills needed to
make sound financial decisions associated with these products.
An important consideration for financial access is the role of parents. In Italy, 15-year-old
students can only open a bank account and/or use many financial products, such as a
prepaid debit card, with their parents’ permission (OECD, 2017c). Beyond extending this
permission, parents also play an important role in the financial behavior, knowledge, and
capability of students.
Influencing Factor: Parents
There are many avenues through which students learn to make financial decisions. Formal
education and experiences in their home lives are part of that. Parents can have a deep
influence on their child’s success in school through their engagement in school activities,
through their support of the student, and through their teaching at home. Further, parents
can transmit financial knowledge and decision-making skills through example, serving as role
models, as well as through talking with their children about money matters.
Children who feel supported academically and emotionally by their parents tend to have
higher financial literacy scores. Students were asked several questions to gauge their
parents’ involvement in their education and emotional support. These included questions
focused on whether parents were interested in school activities. The students responded by
choosing an answer on a four-point scale ranging from “strongly agree” to “strongly
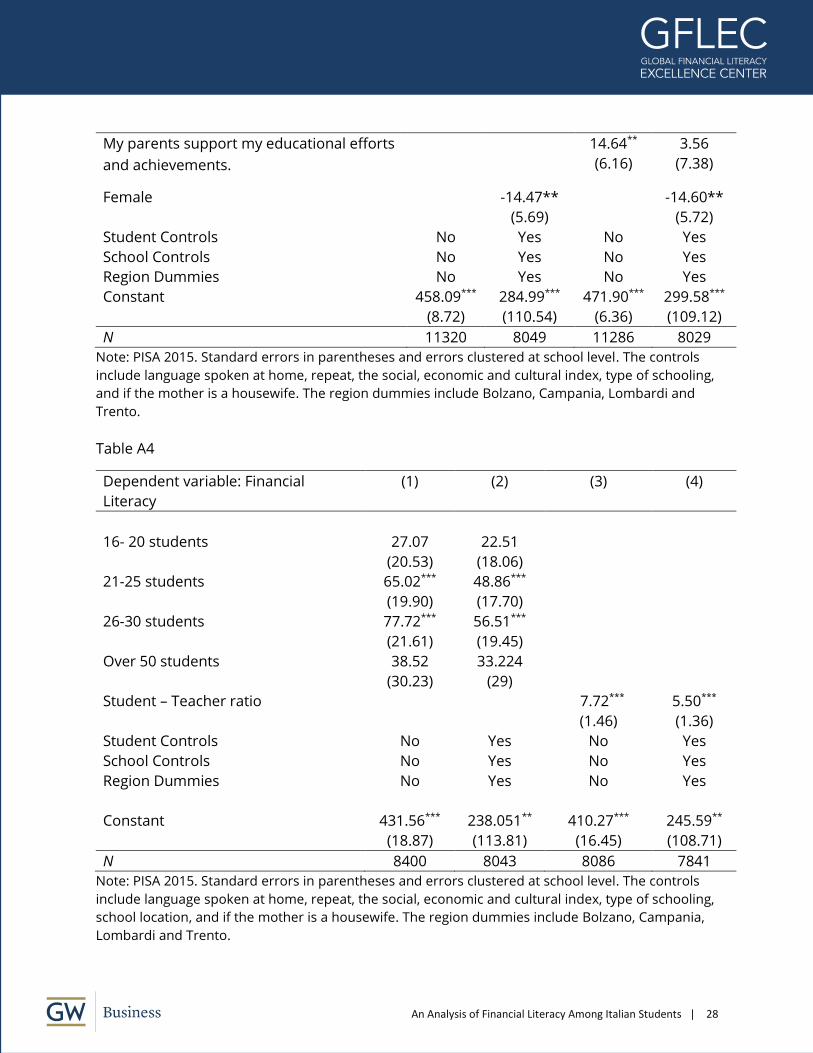
disagree.” Students who answered “agree” or “strongly agree” performed 28 score points
higher on the financial literacy scale than those who answered “disagree” or “strongly
disagree” (Table A3 of the Appendix). This difference is significant even after accounting for
differences in region and school and student characteristics.
Students who feel that their parents support their educational efforts and achievements also
have slightly higher financial literacy outcomes, although the score-point increase is not
significant when controlling for student, school, and region characteristics (Tables A3 of the
Appendix). Included within the controls for student characteristics is a variable for gender.
An Analysis of Financial Literacy Among Italian Students | 19
Consistent with previous findings of a gender gap in Italy, girls score significantly lower than
boys in both previously mentioned regressions testing the relationship between parental
involvement and financial literacy performance.
Another way parents influence their students’ financial capability is by talking directly with
them about spending, saving, banking, investment, and other money matters. The majority
of students (60%) report speaking with their parents either once or twice a month or once or
twice a week. Within this group, the percentage of students who discuss money matters with
their parents more frequently (once or twice a week) is larger with 35%, compared to 25%
who speak only once or twice a month. This is comparable to the participating OECD
countries and economies, which average 34% (once or twice a week) and 32% (once or twice
a month). In looking at gender, the frequency with which parents speak with their children is
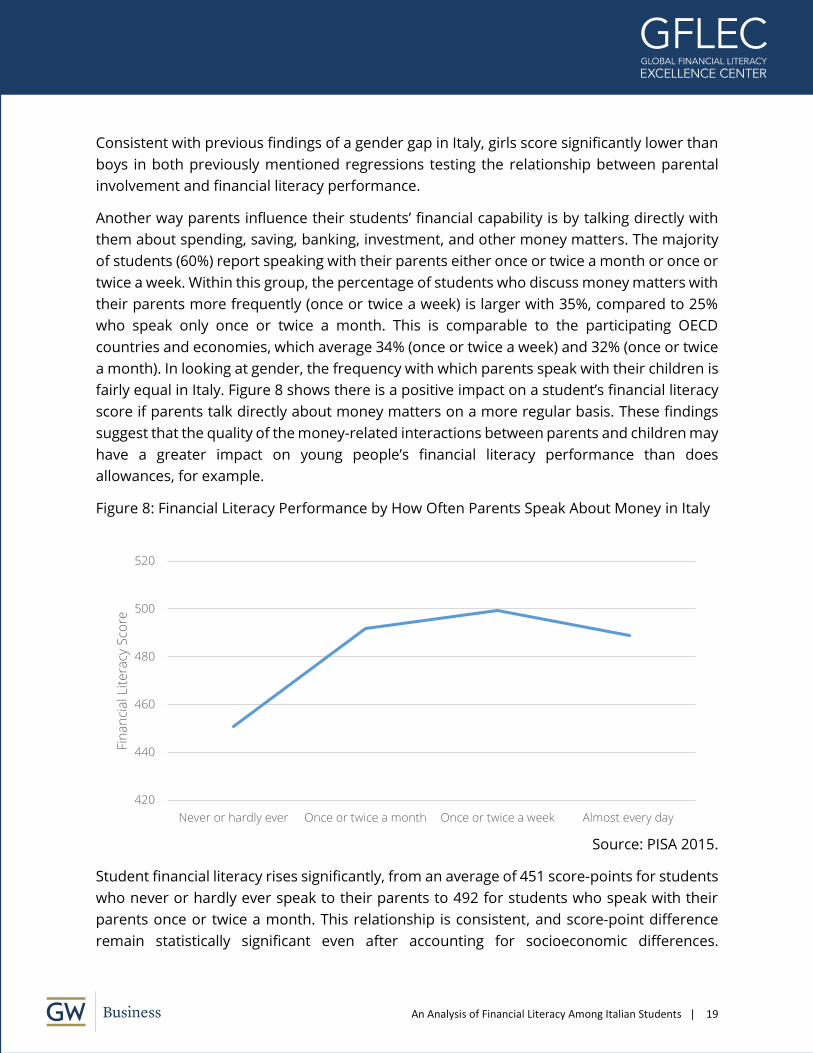
fairly equal in Italy. Figure 8 shows there is a positive impact on a student’s financial literacy
score if parents talk directly about money matters on a more regular basis. These findings
suggest that the quality of the money-related interactions between parents and children may
have a greater impact on young people’s financial literacy performance than does
allowances, for example.
Figure 8: Financial Literacy Performance by How Often Parents Speak About Money in Italy
Source: PISA 2015.
Student financial literacy rises significantly, from an average of 451 score-points for students
who never or hardly ever speak to their parents to 492 for students who speak with their
parents once or twice a month. This relationship is consistent, and score-point difference
remain statistically significant even after accounting for socioeconomic differences.
420
440
460
480
500
520
Never or hardly ever Once or twice a month Once or twice a week Almost every day
Fin
an
cia
l Lit
era
cy S
core
An Analysis of Financial Literacy Among Italian Students | 20
Additional gains in financial literacy performance, pushing scores up to an average of 500
points, occur when the frequency of those discussions increases to once or twice a week.
Overall, students who speak with their parents about money matters once or twice a month,
once or twice a week, or nearly every day score 44 points higher. Even when taking
socioeconomic status into consideration, that increase is still 40 points above that of
students who never or hardly ever speak with their parents about money matters. This
provides evidence that parents can help increase the financial knowledge and skills of their
children. However, the data do not allow for determining causality. The positive correlation
can be interpreted as students acquiring financial skills by discussing the subject with their
parents, or it may be that financially literate students ask questions and seek advice from
their parents more often.
Although, the positive relationship is strong, it is not linear. There is an observed decline in
financial literacy performance at the “almost every day” frequency, which is consistent across
the participating OECD countries and for students at similar levels of socioeconomic status.
A possible explanation for this decline is that students of lower financial proficiency may lack
confidence and make poor financial decisions more frequently and, as a result, seek advice
from their parents more often. Moreover, weekly and monthly discussions might also be of
a different nature and importance than daily discussions (e.g., worrying about money versus
asking for money).
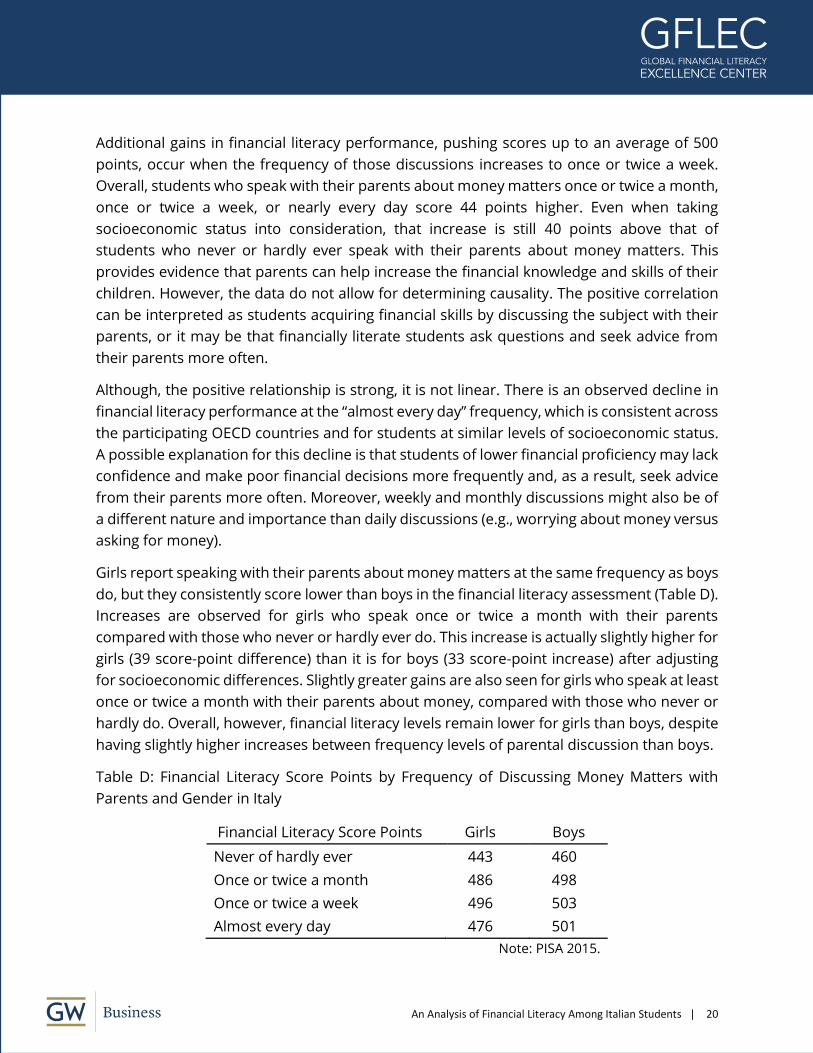
Girls report speaking with their parents about money matters at the same frequency as boys
do, but they consistently score lower than boys in the financial literacy assessment (Table D).
Increases are observed for girls who speak once or twice a month with their parents
compared with those who never or hardly ever do. This increase is actually slightly higher for
girls (39 score-point difference) than it is for boys (33 score-point increase) after adjusting
for socioeconomic differences. Slightly greater gains are also seen for girls who speak at least
once or twice a month with their parents about money, compared with those who never or
hardly do. Overall, however, financial literacy levels remain lower for girls than boys, despite
having slightly higher increases between frequency levels of parental discussion than boys.
Table D: Financial Literacy Score Points by Frequency of Discussing Money Matters with
Parents and Gender in Italy
Financial Literacy Score Points Girls Boys
Never of hardly ever 443 460
Once or twice a month 486 498
Once or twice a week 496 503
Almost every day 476 501
Note: PISA 2015.
An Analysis of Financial Literacy Among Italian Students | 21
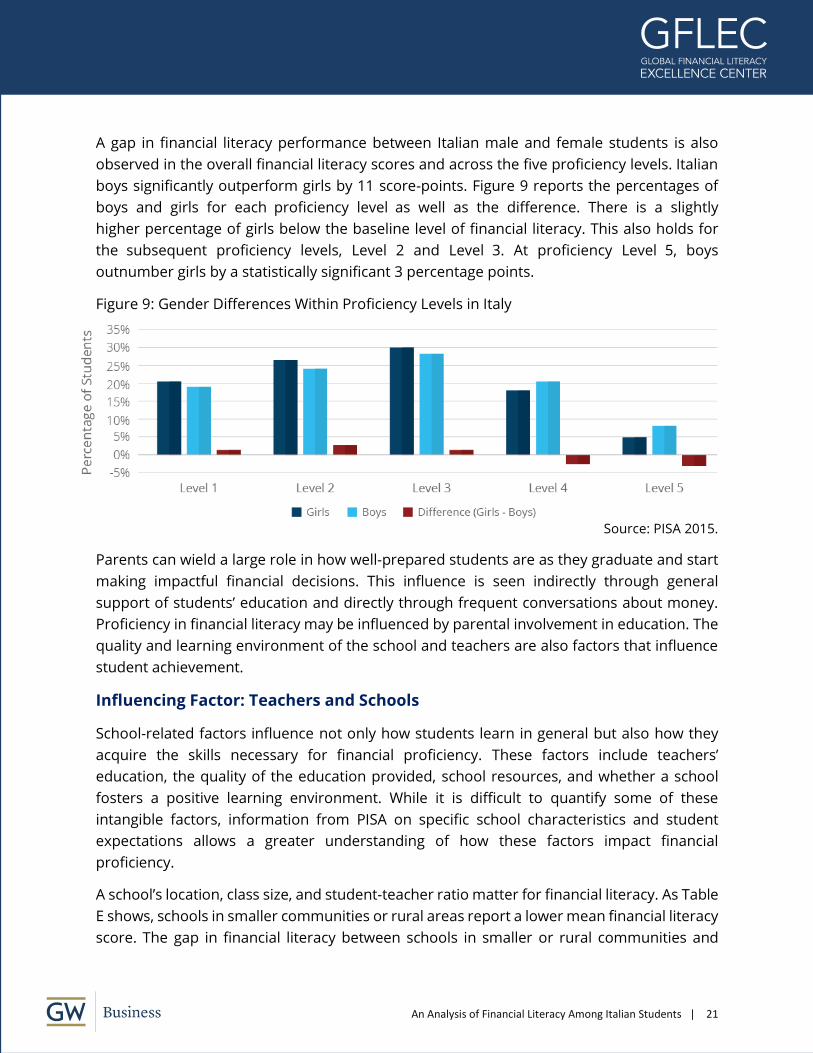
A gap in financial literacy performance between Italian male and female students is also
observed in the overall financial literacy scores and across the five proficiency levels. Italian
boys significantly outperform girls by 11 score-points. Figure 9 reports the percentages of
boys and girls for each proficiency level as well as the difference. There is a slightly
higher percentage of girls below the baseline level of financial literacy. This also holds for
the subsequent proficiency levels, Level 2 and Level 3. At proficiency Level 5, boys
outnumber girls by a statistically significant 3 percentage points.
Figure 9: Gender Differences Within Proficiency Levels in Italy
Source: PISA 2015.
Parents can wield a large role in how well-prepared students are as they graduate and start
making impactful financial decisions. This influence is seen indirectly through general
support of students’ education and directly through frequent conversations about money.
Proficiency in financial literacy may be influenced by parental involvement in education. The
quality and learning environment of the school and teachers are also factors that influence
student achievement.
Influencing Factor: Teachers and Schools
School-related factors influence not only how students learn in general but also how they
acquire the skills necessary for financial proficiency. These factors include teachers’
education, the quality of the education provided, school resources, and whether a school
fosters a positive learning environment. While it is difficult to quantify some of these
intangible factors, information from PISA on specific school characteristics and student
expectations allows a greater understanding of how these factors impact financial
proficiency.
A school’s location, class size, and student-teacher ratio matter for financial literacy. As Table
E shows, schools in smaller communities or rural areas report a lower mean financial literacy
score. The gap in financial literacy between schools in smaller or rural communities and
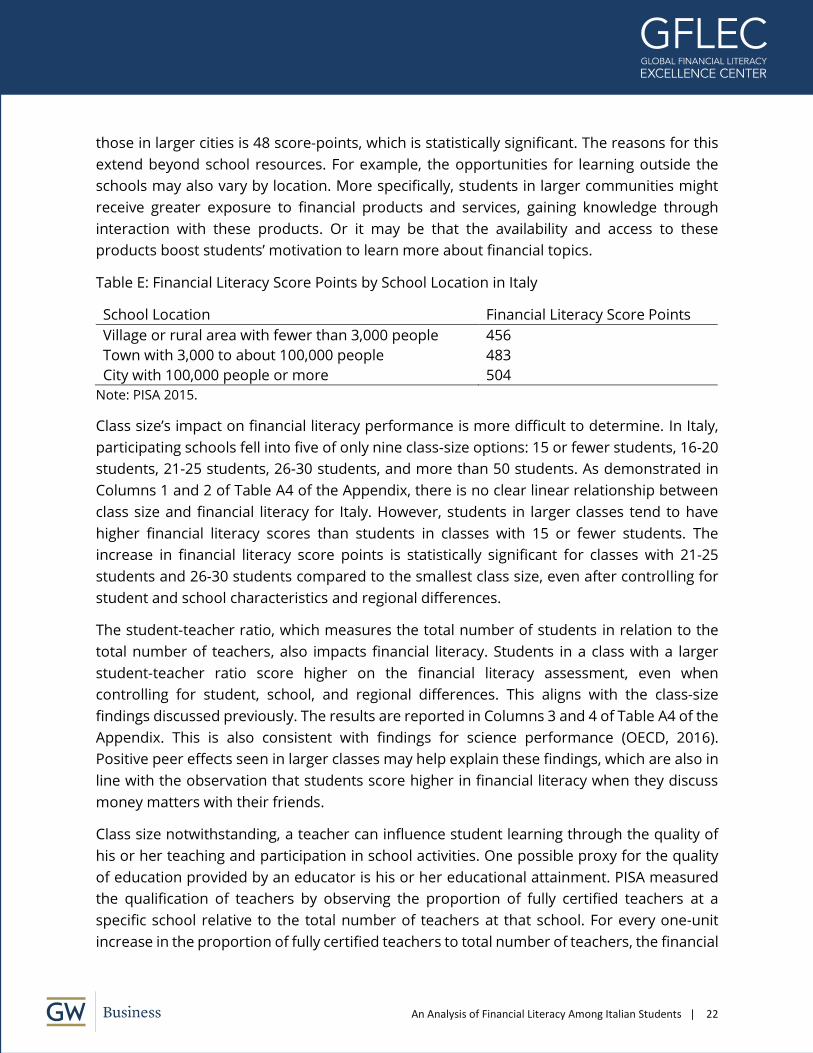
An Analysis of Financial Literacy Among Italian Students | 22
those in larger cities is 48 score-points, which is statistically significant. The reasons for this
extend beyond school resources. For example, the opportunities for learning outside the
schools may also vary by location. More specifically, students in larger communities might
receive greater exposure to financial products and services, gaining knowledge through
interaction with these products. Or it may be that the availability and access to these
products boost students’ motivation to learn more about financial topics.
Table E: Financial Literacy Score Points by School Location in Italy
School Location Financial Literacy Score Points
Village or rural area with fewer than 3,000 people 456
Town with 3,000 to about 100,000 people 483
City with 100,000 people or more 504
Note: PISA 2015.
Class size’s impact on financial literacy performance is more difficult to determine. In Italy,
participating schools fell into five of only nine class-size options: 15 or fewer students, 16-20
students, 21-25 students, 26-30 students, and more than 50 students. As demonstrated in
Columns 1 and 2 of Table A4 of the Appendix, there is no clear linear relationship between
class size and financial literacy for Italy. However, students in larger classes tend to have
higher financial literacy scores than students in classes with 15 or fewer students. The
increase in financial literacy score points is statistically significant for classes with 21-25
students and 26-30 students compared to the smallest class size, even after controlling for
student and school characteristics and regional differences.
The student-teacher ratio, which measures the total number of students in relation to the
total number of teachers, also impacts financial literacy. Students in a class with a larger
student-teacher ratio score higher on the financial literacy assessment, even when
controlling for student, school, and regional differences. This aligns with the class-size
findings discussed previously. The results are reported in Columns 3 and 4 of Table A4 of the
Appendix. This is also consistent with findings for science performance (OECD, 2016).
Positive peer effects seen in larger classes may help explain these findings, which are also in
line with the observation that students score higher in financial literacy when they discuss
money matters with their friends.
Class size notwithstanding, a teacher can influence student learning through the quality of
his or her teaching and participation in school activities. One possible proxy for the quality
of education provided by an educator is his or her educational attainment. PISA measured
the qualification of teachers by observing the proportion of fully certified teachers at a
specific school relative to the total number of teachers at that school. For every one-unit
increase in the proportion of fully certified teachers to total number of teachers, the financial
An Analysis of Financial Literacy Among Italian Students | 23
literacy score for students at the school rises an average of 95 score-points, which is more
than one proficiency level. The increase remains at 90 score-points, still significant, even
when controlling for student, school, and regional characteristics. Teachers may also
influence the quality of the school and curriculum through their participation in decision-
making within the school. Teachers engaged in the school may feel a greater sense of
responsibility to improving or maintaining a high standard of quality education.
PISA’s school questionnaire includes an index of teacher participation based on three
questions asked of a school principal. These index questions address whether teachers are
offered opportunities to participate in decision-making, whether teachers help work toward
continuous improvement of the school, and whether teachers take part in reviewing school
management practices. The assumption is that teachers involved with the school and school
policy will have a greater commitment to the school and to the overall quality of education.
However, the data from Italy find no significant relationship between increased teacher
participation and student financial proficiency. Similar results emerge when the quality of
education is assessed from a student’s perspective. Specifically, students were asked how
frequently they felt their teacher showed interest in student learning. The possible answers
ranged from every lesson to never or hardly ever. In 2015, this question was focused on
science-related lessons but it still provides information on the relationship between teacher
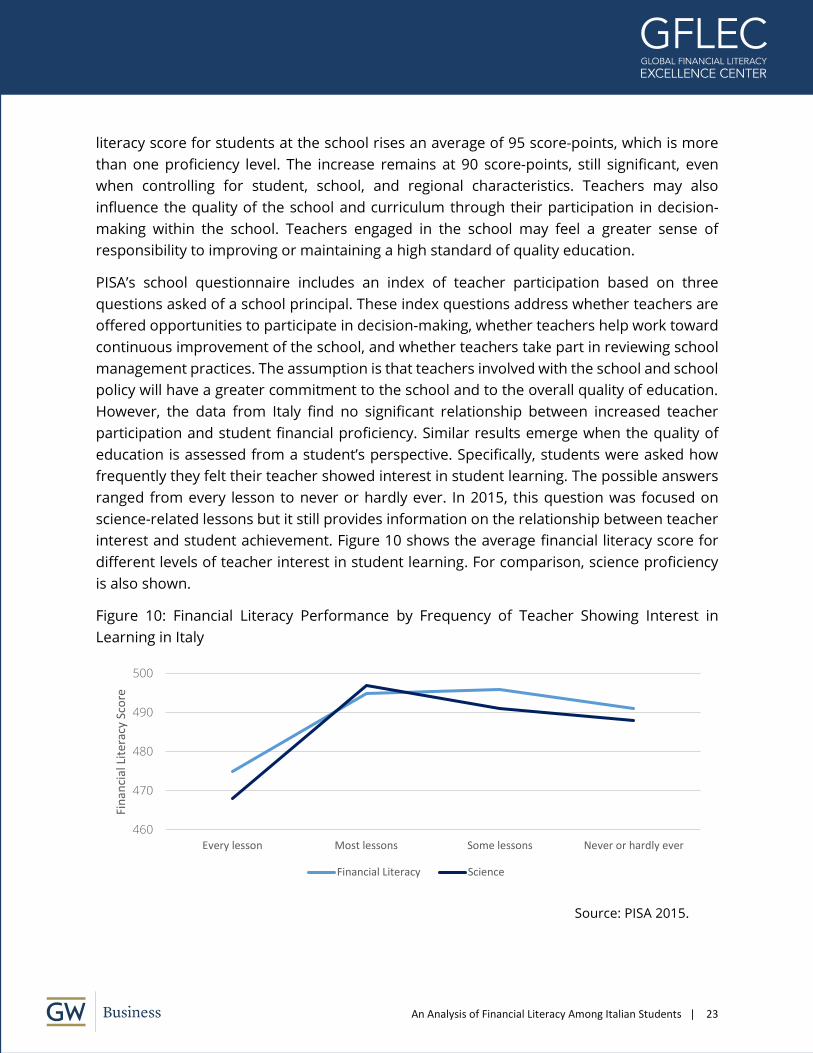
interest and student achievement. Figure 10 shows the average financial literacy score for
different levels of teacher interest in student learning. For comparison, science proficiency
is also shown.
Figure 10: Financial Literacy Performance by Frequency of Teacher Showing Interest in
Learning in Italy
Source: PISA 2015.
460
470
480
490
500
Every lesson Most lessons Some lessons Never or hardly ever
Fin
anci
al L
iter
acy
Sco
re
Financial Literacy Science
An Analysis of Financial Literacy Among Italian Students | 24
Both financial literacy and science proficiency follow a similar pattern. Surprisingly, the more
students perceive that teachers are engaged in their learning, the lower the financial literacy
scores. A possible explanation might be that classes with selected students are homogenous.
Therefore, there is less need for a teacher to spend time or “show interest” to individual
students as the majority of students are at similar levels of proficiency.
Schools are meant to prepare students to be active members of society once they graduate.
However, the relationship between financial literacy performance and school characteristics
is not always straightforward, as the case of Italy demonstrates. Larger class size brings a
positive relationship with student proficiency, yet increased teacher involvement and
participation have negligible effects. More research is needed to understand how teacher
behavior may positively influence student achievement in financial literacy.
Conclusion
Youth today confront an economic climate that imposes individual financial responsibility at
levels greater than in the past. The financial literacy assessment within the Programme for
International Student Assessment (PISA) provides an international measure of students’
preparedness for the financial decisions they will face on a daily basis. This assessment,
which includes background questionnaires covering students’ characteristics, home lives,
and school environments, was launched in 2012 with 18 participating countries and
economies. The most recent wave, in 2015, covers 15 countries and provides an
unprecedented opportunity to explore changes in and influences on the financial literacy of
young people. The data reveal a persistent lack of financial literacy among 15-year-olds in
most of the participating countries and economies. Italy is the only OECD country to show
a jump in financial literacy performance between the 2012 assessment and the 2015 wave. Italy’s score of 483 points in 2015 is close to the OECD average of 488.
Many factors influence students’ financial skills and knowledge, among them financial
access, family background, the support and participation of parents, and the educational
environment of schools. This study shows that in Italy, wealth and socioeconomic
background have a significant influence on students’ financial literacy proficiency. Financial
literacy performance improves as students have more resources available to them, including
the internet, books, and technology. Access to these resources and material wealth in the
home serves as a proxy for family wealth. The financial literacy proficiency of students from
families with less wealth, with parents who have lower education attainments, and with
homes with fewer educational resources is generally lower than students from more affluent
families. Additionally, students may choose to interact with the financial marketplace
through working to receive money and ownership of financial products; such as a bank
account and/or a prepaid debit card. Students who own these financial products score
An Analysis of Financial Literacy Among Italian Students | 25
higher on the financial literacy assessment. While students may learn financial skills through
experience, it does not equate to proficiency in financial matters, as some students who own
a bank account still fall below the baseline financial literacy proficiency level.
The influence that parents wield is not insignificant. Their support of their children’s
education and their willingness to discuss money matters with their children can have a
significant impact on financial literacy. Students who speak regularly with their parents about
money issues and who feel supported by their parents in educational activities tend to have
higher financial literacy scores. This indicates that even when parents do not have
opportunities to improve their socioeconomic status, they still can play an important role in
improving their children’s financial literacy.
Girls in Italy consistently underperform on the financial literacy assessment when compared
to boys. Interestingly, among all participating countries and economies, Italy is the only
country where boys score notably higher than girls. There is a higher percentage of girls at
the lower end of proficiency and a higher percentage of boys at the higher end of proficiency.
This difference in performance is significant in Italy, and initiatives to improve financial
literacy levels of the student population might want to take this gender gap into
consideration.
School characteristics, too, impact student’s financial literacy. Schools in more populated
areas and those with larger class sizes tend to have students with higher levels of proficiency.
While fully certified teachers have a positive impact on the financial proficiency of their
students, greater exploration is needed on how teacher quality impacts financial literacy.
Within this study, one question explored students’ perception of their teachers’ interest in
student learning. The answers did not demonstrate a significant impact on student financial
literacy performance, but there are additional questions within PISA on student expectations
and perception of teacher quality that can be explored.
Student socioeconomic background, parents, school environment, and teachers all
contribute to student financial literacy performance. Today’s students face important
financial decisions early in life. Actions taken by parents, schools, and teachers can help
improve the financial literacy of the student population in Italy, equipping the next
generation the knowledge and skills it needs to independently navigate the financial
landscape toward a financially sound future.
An Analysis of Financial Literacy Among Italian Students | 26
References
Bottazzi, L. and Lusardi, A., 2016. “Gender differences in financial literacy: Evidence from
PISA data in Italy.” Working Paper. Global Financial Literacy Excellence Center, Washington,
DC.
Lusardi, A., Michaud, P.C. and Mitchell, O.S., 2017. “Optimal financial knowledge and wealth
inequality.” Journal of Political Economy, 125(2), pp.431-477.
Lusardi, A. and Tufano, P., 2015. “Debt literacy, financial experiences, and
overindebtedness.” Journal of Pension Economics & Finance, 14(4), pp.332-368.
Lusardi, Annamaria, Olivia S. Mitchell, and Vilsa Curto. “Financial literacy among the
young.” Journal of consumer affairs 44.2 (2010): 358-380.
OECD. 2005. Improving Financial Literacy: Analysis of Issues and Policies, Paris, OECD
Publishing.
OECD. 2014. PISA 2012 Results: Students and Money (Volume VI): Financial Literacy Skills for the
21st Century, PISA, Paris, OECD Publishing.
OECD. 2016. PISA 2015 Results (Volume II): Policies and Practices for Successful Schools, PISA,
Paris, OECD Publishing.
OECD. 2017a. PISA 2015 Results (Volume IV): Students’ Financial Literacy, PISA, Paris, OECD
Publishing.
OECD. 2017b. PISA 2015: Technical Report, Paris, OECD Publishing.
OECD. 2017c. ITALY – Country Note – Results from PISA 2015 Financial Literacy, PISA, OECD
Publishing.
The World Bank. 2015. World Bank National Accounts Data, and OECD National Account
Data Files.
The World Bank. 2017. Disclosable Version of the ISR – Financial Education and Financial
literacy - P120338 -Sequence No: 14 (English).
An Analysis of Financial Literacy Among Italian Students | 27
Appendix
Table A1
Dependent variable: Propensity to Save (1) (2) (3) (4)
Active Income 0.029 0.063
(0.03) (0.04)
Passive Income -0.020 -0.041
(0.03) (0.03)
Student Controls No Yes No Yes
School Controls No Yes No Yes
Region Dummies No Yes No Yes
Constant 0.57*** 1.14 0.60*** 1.26
(0.02) (0.97) (0.02) (0.95)
N 2257 1586 2189 1543
Note: PISA 2015. Standard errors in parentheses and errors clustered at school level. The controls
include language spoken at home, repeat, the social, economic and cultural index, type of schooling,
and if the mother is a housewife. The region dummies include Bolzano, Campania, Lombardi and
Trento.
Table A2
Dependent variable: Financial Literacy (1) (2)
Propensity to save 14.6*** 9.93*
(5.61) (5.58)
Student Controls No Yes
School Controls No Yes
Region Dummies No Yes
Constant 478.16*** 278.00*
(4.96) (168.28)
N 2337 1640
Note: PISA 2015. Standard errors in parentheses and errors clustered at school level. The controls
include language spoken at home, repeat, the social, economic and cultural index, type of schooling,
and if the mother is a housewife. The region dummies include Bolzano, Campania, Lombardi and
Trento.
Table A3
Dependent variable: Financial Literacy (1) (2) (3) (4)
My parents are interested in my school
activities.
28.21***
(8.68)
19.33**
(8.71)
An Analysis of Financial Literacy Among Italian Students | 28
My parents support my educational efforts
and achievements.
14.64**
(6.16)
3.56
(7.38)
Female -14.47**
(5.69)
-14.60**
(5.72)
Student Controls No Yes No Yes
School Controls No Yes No Yes
Region Dummies No Yes No Yes
Constant 458.09*** 284.99*** 471.90*** 299.58***
(8.72) (110.54) (6.36) (109.12)
N 11320 8049 11286 8029
Note: PISA 2015. Standard errors in parentheses and errors clustered at school level. The controls
include language spoken at home, repeat, the social, economic and cultural index, type of schooling,
and if the mother is a housewife. The region dummies include Bolzano, Campania, Lombardi and
Trento.
Table A4
Dependent variable: Financial
Literacy
(1) (2) (3) (4)
16- 20 students 27.07 22.51
(20.53) (18.06)
21-25 students 65.02*** 48.86***
(19.90) (17.70)
26-30 students 77.72*** 56.51***
(21.61) (19.45)
Over 50 students 38.52 33.224
(30.23) (29)
Student – Teacher ratio 7.72*** 5.50***
(1.46) (1.36)
Student Controls No Yes No Yes
School Controls No Yes No Yes
Region Dummies No Yes No Yes
Constant 431.56*** 238.051** 410.27*** 245.59**
(18.87) (113.81) (16.45) (108.71)
N 8400 8043 8086 7841
Note: PISA 2015. Standard errors in parentheses and errors clustered at school level. The controls
include language spoken at home, repeat, the social, economic and cultural index, type of schooling,
school location, and if the mother is a housewife. The region dummies include Bolzano, Campania,
Lombardi and Trento.
This and other Global Financial Literacy Excellence Center working papers and publications are available online at www.gflec.org
Global Financial Literacy Excellence CenterThe George Washington University School of Business
Duquès Hall, Suite 4502201 G Street NW
Washington, DC 20052
T: 202-994-7148 | E: [email protected]