Embed Size (px)
Citation preview


DUDLEY KNOX LIBRARYNAVAL POSTGRADUATE SCHOOLMONTEREY CA 93943-5101


REPORT DOCUMENTATION PAGE Form Approved OMB No. 0704-01 i
Public reporting burden for this collection of information is estimated to average 1 hour per response, including the time for reviewing instruction, searching
existing data sources, gathering and maintaining the data needed, and completing and reviewing the collection of information. Send comments regarding this
burden estimate or any other aspect of this collection of information, including suggestions for reducing this burden, to Washington Headquarters Services,
Directorate for Information Operations and Reports, 1215 Jefferson Davis Highway, Suite 1204, Arlington, VA 22202-4302, and to the Office of Management
and Budget, Paperwork Reduction Project (0704-0188) Washington DC 20503.
1. AGENCY USE ONLY (Leave blank) 2. REPORT DATEDECEMBER 1994
REPORT TYPE AND DATES COVEREDMaster's Thesis
4. TITLE AND SUBTITLE AN ANALYSIS OF ECONOMIC VALUEADDED (EVA)™ AS A MEASURE OF FINANCIALPERFORMANCE AND RISK ASSESSMENT
6. AUTHOR(S)William E. Bailey II
FUNDING NUMBERS
7. PERFORMING ORGANIZATION NAME(S) AND ADDRESS(ES)
Naval Postgraduate School
Monterey CA 93943-5000
PERFORMINGORGANIZATIONREPORT NUMBER
SPONSORING/MONITORING AGENCY NAME(S) AND ADDRESS(ES) 10. SPONSORING/MONITORINGAGENCY REPORT NUMBER
ll. SUPPLEMENTARY NOTES The views expressed in this thesis are those of the author and do not reflect
the official policy or position of the Department of Defense or the U.S. Government.
12a. DISTRTBUTION/AVAILABILrrY STATEMENT
Approved for public release; distribution is unlimited.
12b. DISTRIBUTION CODE
13. ABSTRACT (maximum 200 words)
In the fiscal years 1992 through 1994 over 100 million dollars in contracts were terminated for default by the Department
of the Navy (DON) alone. There is a need for the Department of Defense (DOD) and the DON to develop or use an accurate
and dependable means for assessing which contractors will be able to remain financially capable of fulfilling the terms of their
contracts. Currently the Navy uses standard accounting measures and other financial accounting ratios to determine the financial
capability of prospective contractors. While the standard accounting ratios and measures have performed adequately, it is
possible that improved measures,such as Economic Value Added (EVA™), may exist.
This thesis provides some evidence, based on statistical tests using EVA™ data and financial ratio data for the years 1983
through 1992, on the potential value of EVA™ as an information item. Specifically, this study determined that EVA™ was
unique and distinct from traditional accounting ratios and that past EVA™ is an effective predictor of future EVA™.
14. SUBJECT TERMS Economic Value Added (EVA)™; Financial Performance; Risk
Assessment.
15. NUMBER OF
PAGES 9 4
16. PRICE CODE
17. SECURITY CLASSIFI-
CATION OF REPORTUnclassified
18. SECURITY CLASSIFI-
CATION OF THIS PAGEUnclassified
19. SECURITY CLASSIFI-
CATION OF ABSTRACTUnclassified
20. LIMITATION OFABSTRACTUL
NSN 7540-01-280-5500 Standard Form 298 (Rev. 2-89)
Prescribed by ANSI Std. 239-18 298-102

11

Approved for public release; distribution is unlimited.
AN ANALYSIS OF ECONOMIC VALUE ADDED(EVA™) AS A MEASURE OF FINANCIAL
PERFORMANCE AND RISK ASSESSMENT
by
William E. Bailey II
//
Lieutenant, Supply Corps, United States Navy
B.A., Marshall University, 1986
Submitted in partial fulfillment
of the requirements for the degree of
MASTER OF SCIENCE IN MANAGEMENT
from the
NAVAL POSTGRADUATE SCHOOLDecember 1994

3/i
r,
ABSTRACT
In the fiscal years 1992 through 1994 over 100 million dollars worth of
contracts were terminated for default by the Department of the Navy (DON) alone.
There is a need for the Department of Defense (DOD) and the DON to develop or
use an accurate and dependable means for assessing which contractors will be able
to remain financially capable of fulfilling the terms of their contracts. Currently
the Navy uses standard accounting measures and other financial accounting ratios
to determine the financial capability of prospective contractors. While the standard
accounting ratios and measures have performed adequately, it is possible that
improved measures,such as Economic Value Added (EVA™), may exist.
This thesis provides some evidence, based on statistical tests using EVA™ data and
financial ratio data for the years 1983 through 1992, on the potential value of
EVA™ as an information item. Specifically, this study determined that EVA™ was
unique and distinct from traditional accounting ratios and that past EVA™ is an
effective predictor of future EVA™.
IV

JOB' £V KNOX LIBRARY
TABLE OF CONTENTS
II
INTRODUCTION 1
A. BACKGROUND 1
B. OBJECTIVES 2
C. RESEARCH QUESTIONS 3
1. Primary Question 3
2
.
Secondary Questions 3
D. SCOPE, LIMITATIONS, AND ASSUMPTIONS 3
E. THESIS ORGANIZATION 4
THE BACKGROUND AND EXPLANATION OF EVA™ 5
A. INTRODUCTION 5
B. GENESIS 5
C. WHAT EVA™ IS 5
1. The EVA™ Concept 5
2. The Relationship Between EVA™ and NPV . . 6
3
.
The Relationship Between EVA™ and Market
Value 6
4. The Relationship Between EVA™ and Residual
Income 7
D. CALCULATING EVA™ 7
1. The Rate of Return Calculation 8
a. The Financing Perspective 8
b. The Operating Perspective 10
2. The Cost of Capital Calculation 11
a. The Financing Approach 11
b. The Operating Approach 13
3
.
Defining Capital 13
4
.
Summary 14
E. LITERATURE REVIEW 14
1. EVA™ as an Internal Performance Measure . 14
2
.
EVA™ As An External Performance Measure . 17

III. METHODOLOGY 21
A. INTRODUCTION 21
B. SAMPLE AND DATA 21
1. Selection of Sample Firms 21
2. Data and Time Period Studied 24
C. MEASURES 2 6
1. The Comprehensive Method 27
a. Solvency Ratios 28
b. Working Capital Ratios . 30
c. Leverage Ratios ..... 32
d. Coverage Ratios ..... 33
e. Profitability Ratios 35
2. The Conceptual Method 3 9
a. The Factor Approach 3 9
b. The Performance Approach 41
D. TESTS OF ASSOCIATION 42
E. TESTS USED TO ANSWER THE RESEARCH QUESTIONS . 43
1. The Primary Research Question 43
2 . The First and Second Secondary Research
Questions 44
3 . The Third and Fourth Secondary Research
Questions 44
4. The Fifth Secondary Research Question . . 45
IV. ANALYSIS 47
A. TESTS TO ANSWER THE PRIMARY RESEARCH QUESTION 47
1. The Comprehensive Method 47
2 . The Conceptual Method 53
a. The Factor Approach 53
b. The Performance Approach 57
B. TESTS TO ANSWER THE SECONDARY RESEARCH
QUESTIONS 60
1 . The First and Second Secondary Research
Questions 60
VI

2 . The Third and Fourth Secondary Research
Questions 62
3. The Fifth Secondary Research Question . . 65
C. SUMMARY 65
V. CONCLUSIONS 67
A. THE PRIMARY RESEARCH QUESTION 67
B. SECONDARY RESEARCH QUESTIONS ONE AND TWO ... 69
C. SECONDARY RESEARCH QUESTIONS THREE AND FOUR . 72
D. SECONDARY RESEARCH QUESTION FIVE 73
E. RECOMMENDATION FOR FURTHER RESEARCH 7 4
F. SUMMARY 7 5
APPENDIX A. GURSOY'S SAMPLE AND DATA METHODOLOGY ... 77
APPENDIX B. ACCOUNTING FORMULAE AND RATIO ASSUMPTIONS . 7 9
LIST OF REFERENCES 81
INITIAL DISTRIBUTION LIST 85
Vll


I . INTRODUCTION
A . BACKGROUND
This thesis is an analysis of Economic Value Added™ 1
,
hereafter referred to as EVA™, as a financial measurement
tool. The primary focus is to evaluate the information value
of EVA™ to entities external to the companies being evaluated
(using EVA™) . The external users of this information, for the
purpose of this study, will be the Department of the Navy
(DON) and to a lesser extent the Department of Defense (DOD)
.
The majority of prior research in the area of EVA™ has dealt
with EVA™ as an internal performance measurement tool, making
this thesis one of the first studies to analyze the external
applications of EVA™.
There is a need for the Department of Defense (DOD) and
the Department of the Navy (DON) to develop or use an accurate
and dependable means for assessing which contractors will be
able to remain financially capable of fulfilling the terms of
their contracts. In the fiscal years 1992 through 1994 over
100 million dollars worth of contracts were terminated for
default by the DON alone[Ref. 23].
The U. S. Navy is evolving into a smaller more
streamlined organization due to the rapidly changing geo-
political shape and climate of the world and tightening fiscal
constraints imposed by Congress, the President and the
Department of Defense. Consequently, the number and dollar
size of Navy contracts are growing smaller, as well.
Optimizing the use of the Navy's financial resources is one of
the key factors essential to maintaining the desired level of
readiness, in light of the current budgetary environment.
Toward this end, it is essential that the Navy make sound
Economic Value Added and EVA are trademarks of SternStewart & Company.

decisions when contracting for goods and services. The Navy
cannot afford to waste scarce procurement funds on contractors
who cannot fulfill the terms of their contract due to
financial or financing difficulties. In order to determine
if a prospective contractor is financially capable of
fulfilling the terms of the contract, the Navy requires a set
of accurate and dependable tools.
Currently the Navy uses standard accounting measures such
as earnings, earnings per share, earnings growth, retained
earnings, rate of return, dividends, cash flow and many other
financial and accounting ratios to determine if a prospective
contractor is financially capable of fulfilling the terms of
the contract, or what the Navy defines as responsible. The
Competition in Contracting Act of 1984 defines responsible as
". . .a prospective contractor who:
1 . has adequate financial resources to perform thecontract or the ability to obtain suchresources ; . .
.
"
While the standard accounting ratios and measures have
performed adequately, it is possible that improved measures
may exist. EVA™ is one measure that has become increasingly
visible in recent years. This thesis provides some evidence
on the potential value of EVA™ as an information item.
If EVA™ is found to be a more accurate predictor or more
efficient measure of financial performance, then application
of the EVA™ measure by the U.S. Navy in assessing prospective
contractor responsibility or risk could provide substantial
cost savings through a lower contract default rate due to
financial insolvency.
B . OBJECTIVES
The objective of this thesis is to analyze and evaluate
Economic Value Added (EVA™) as a financial performance

measurement tool. The specific area of investigation is:
The value of EVA™ as an information source to those external
to the firm, in particular the Department of Defense (DOD) and
Department of the Navy (DON)
.
C. RESEARCH QUESTIONS
1. Primary Question
Does the EVA™ measure provide information beyond what is
currently available in traditional accounting measures?
2. Secondary Questions
a. Can EVA™ be surrogated by a simple combination of
traditional accounting measures?
b. Is EVA™ statistically distinct from traditional
accounting measures or does it show some degree of correlation
to one or more of the traditional accounting measures?
c. Assuming EVA™ does measure some ultimate success
criterion, thus making it a plausible objective of any firm to
maximize EVA™, are past EVA™ ratings an effective predictor of
future performance/EVA™ ratings?
d. Assuming EVA™ does measure some ultimate success
criterion, thus making it a plausible objective of any firm to
maximize EVA™, do past accounting ratios/measures predict
future EVA™ ratings?
e. Are there benefits to the U.S. Navy in using EVA™
ratings, in lieu of the traditional accounting measures now
used, to evaluate potential contractors in Pre-Award Surveys?
D. SCOPE, LIMITATIONS, AND ASSUMPTIONS
This thesis is an analysis of Economic Value Added™
(EVA™) as a source of financial information for the Department
of Defense (DOD) and the Department of the Navy (DON) in their
assessment of prospective contractors. The thesis involves an
in depth analysis of 45 top defense contractors for the years
1983 through 1992 using EVA™ and comparing the results to

traditional accounting measures of the same 45 defense
contractors over the same time period.
It was assumed from the start that the Navy does
financial analyses of potential contractors and that the tools
currently used are adequate. This thesis will attempt to
determine if the Navy can do better using EVA™. This thesis
will :
1) Statistically compare EVA™ to commonly used
traditional accounting measures to determine if there is
incremental information content provided by EVA™, and
2) determine if EVA™ can be surrogated by existing
accounting measures.
This thesis will not :
1) Provide a definitive answer to the question of
EVA™ as a guide to prospective contractor evaluation, and
2) compare EVA™ and commonly used "traditional
accounting measures" as competing predictors of contractor
default /bankruptcy
.
E. THESIS ORGANIZATION
This chapter covered the background of this research
effort and identified the primary and secondary research
questions addressed in this study. In the next chapter,
Chapter II, the background, genesis, and literature review of
EVA™ will be reviewed. Chapter III will describe the research
methodology employed in the study, including: the sample
selection, data, measures, and the structure of tests. The
analysis and findings of the tests conducted on the data
collected from the 45 defense contractors will be presented in
Chapter IV. Conclusions, recommendations, suggestions for
further research, and the answers to the research questions
will be offered in Chapter V.

II. THE BACKGROUND AND EXPLANATION OF EVA™
A . INTRODUCTION
This chapter will discuss the origins and the concepts of
Economic Value Added (EVA™) . It begins with the theories and
foundations that lead to the development of EVA™. The next
section, What EVA™ Is, explores the basic concept of EVA™, the
relationship of EVA™ to Net Present Value (NPV) , Market Value,
and Residual Income. Section C reveals how EVA™ is
calculated. The final section is a review of literature
published about EVA™.
B. GENESIS
"It is the practical development of the concept of free
cash flow (FCF), which is the very foundation upon which
corporate values stand. "[Ref. l,p.xvii] EVA™ and Market Value
Added (MVA™) are logical extensions of the concept of free
cash flow, a theory first introduced in 1961 by Professors
Franco Modigliani and Merton Miller [Ref. 2] . Free cash flow
has been further refined, studied and applied as a means of
measuring corporate performance over the last 3 years by Joel
M. Stern, Managing Partner, Stern Stewart & Company. But it
was Bennett Stewart (the other half of Stern Stewart) that put
together the latest and most widely used version of the free
cash flow concept - EVA™.
C. WHAT EVA™ IS
1. The EVA™ Concept
EVA™ is operating profits less the cost of all of the
capital employed to produce those earnings. EVA™ increases
if operating profits can be made to grow without tying up more
capital. EVA™ will also increase if new capital can be
invested in projects that will earn more than the full cost of
the capital or if capital can be diverted or liquidated from

business activities that do not provide returns beyond the
full cost of the capital invested in them.[Ref. 1]
EVA™ will be reduced if management invests money on
projects that earn less than the cost of capital. EVA™ will
be reduced if management forgoes new business projects that
are likely to earn more than the cost of capital. [Ref. 1]
2. The Relationship Between EVA™ and NPV
EVA™ is a measure of performance for a specific period of
time (i.e. one year) and is conceptually related to Net
Present Value (NPV) . Discounting the annual EVA™ to be
generated by an individual capital project automatically
yields its net present value (NPV) . The cost of new capital
used to finance the new project is subtracted in the
calculation of EVA™. Capital budgeting using NPV recommends
that all positive NPV projects should not be rejected. Using
the same logic, all positive EVA™ projects should be accepted
because for a single project NPV and EVA™ are conceptually the
same . [Ref . 1]
3. The Relationship Between EVA™ and Market Value
Applying the theoretical relationship between EVA™ and
NPV to the next higher level, projecting and discounting EVA™
for an entire company will automatically sum the net present
value of all of the company's past and future capital
investment projects. The sum of the net present values is the
company's market value premium to capital employed (which is
the total of all investments the company has made to date)
.
The market value premium can also be called Market Value Added
(MVA) . For example, if a company has a discounted projected
EVA™ of $1 billion and is currently using $10 billion of
capital, then the company has an intrinsic market value of $11
billion. [Ref. 1]
When EVA™ is expected to be positive, the company has
added value (i.e. earned $1.10 for every $1.00 employed) and
their stock should sell at a premium. If EVA™ is expected to
be negative the company the company has lost value (i.e. $.90
for every $1.00 employed) and their stock should sell at a
discount .[Ref . 1]
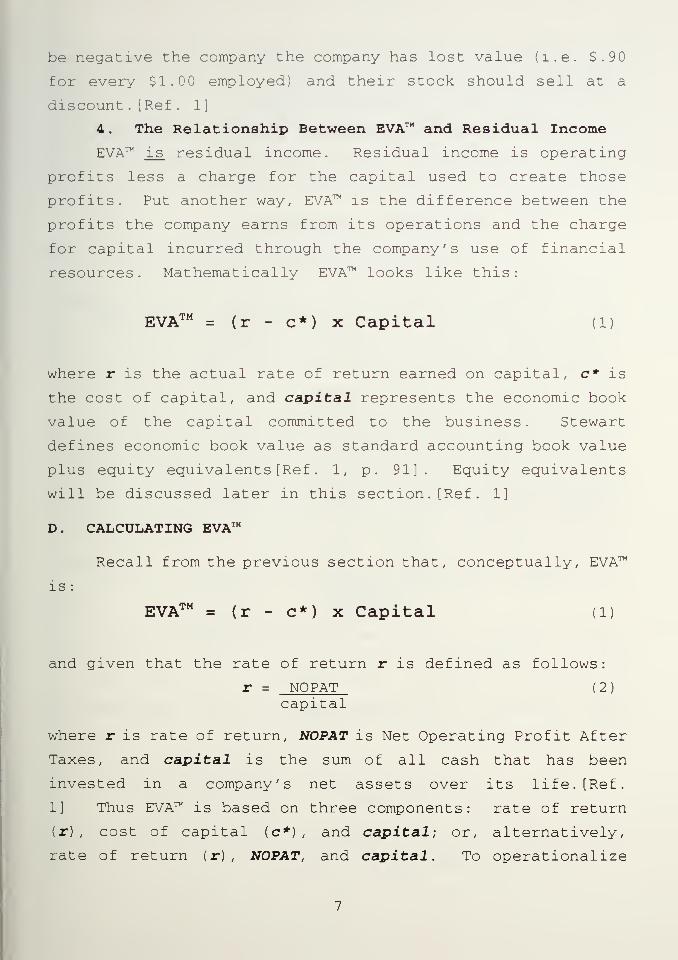
4. The Relationship Between EVA™ and Residual Income
EVA™ i_s residual income. Residual income is operating
profits less a charge for the capital used to create those
profits. Put another way, EVA™ is the difference between the
profits the company earns from its operations and the charge
for capital incurred through the company's use of financial
resources. Mathematically EVA™ looks like this:
EVA™ = (r - c*) x Capital (1)
where r is the actual rate of return earned on capital, c* is
the cost of capital, and capital represents the economic book
value of the capital committed to the business. Stewart
defines economic book value as standard accounting book value
plus equity equivalents [Ref . 1, p. 91] . Equity equivalents
will be discussed later in this section.[Ref . 1]
D. CALCULATING EVA™
Recall from the previous section that, conceptually, EVA™
is :
EVA™ = (r - c*) x Capital (1)
and given that the rate of return r is defined as follows:
r = NOPAT (2)
capital
where r is rate of return, NOPAT is Net Operating Profit After
Taxes, and capital is the sum of all cash that has been
invested in a company's net assets over its life. [Ref.
1] Thus EVA™ is based on three components: rate of return
(r) , cost of capital (c*) , and capital; or, alternatively,
rate of return (r) , NOPAT, and capital. To operationalize

these components several transformations of traditional
accounting information are required.
1. The Rate of Return Calculation
One of the more unique aspects of EVA™ is how the rate of
return is computed. Stewart [Ref. 1] computes it two
different ways: 1) from a Financing Perspective, and 2) from
an Operating Perspective.
a. The Financing Perspective
The Financing Perspective has three steps. The
first step is to Deleverage the Rate of Return. In
deleveraging, the idea is that most rate of return measures
rely on traditional accounting measures of net income and
stockholders equity. Those measures, however, are
fundamentally affected by the mixture of debt and equity in a
firm's capital structure (leverage) . The intent here is to
create a return measure unaffected by capital structure - one
that is "deleveraged. " The rate of return is deleveraged by
adding all interest-bearing debt (and the present value of
noncapitalized leases) to common equity and the interest
expense on the debt (including the yet to be realized interest
m rents) to the "bottom-line accounting prof its" [Ref . 1] .
Recalling the rate of return equation (Equation 2) from above:
r = NOPATcapital (2)
where r is rate of return, NOPAT is Net Operating Profit After
Taxes, and capital is the sum of all cash that has been
invested in a company's net assets over its life. [Ref. 1]
NOPAT and capital defined mathematically, for this particular
step, are as follows:
NOPAT = Income available to common share holders (3)
+ Interest expense after taxes
and
CAPITAL = Common equity + Debt (4)
8

The second step in the Financing Perspective is toimprove the "accuracy" of the rate of return by eliminatingwhat Stewart refers to as "other financing distortions " [Ref
.
l,p.90] . This is done by adding the equity provided bypreferred stockholders and minority investors to capital andby returning the income siphoned off by these sources ofequity back into NOPAT [Ref. 1] . Mathematically the rate ofreturn equation remains the same (see Equation 2 above),however, NOPAT and capital have more added to their equations:
NOPAT = Income available to common share holders (5)
+ Preferred dividend+ Minority interest provision+ Interest expense after taxes
andCapital = Common equity (6)
+ Preferred stock+ Minority interest+ All debt
The third and final step in the Financing
Perspective is to "eliminate accounting distortions " [Ref . 1]
from the rate of return by adding equity equivalent reserves
to capital and the change (from period based accounting) in
the reserves to NOPAT. [Ref. 1] Mathematically the changes
look like this
:
NOPAT = Income available to common share holders (7)
+ Increase in equity equivalents+ Preferred dividend+ Minority interest+ Interest expense after tax
and
Capital = Equity equivalents (8)+ Common equity+ Preferred stock+ Minority interest+ All debt
Stewart [Ref. l,pp. 91&112] defines equity
equivalents as items like deferred income tax reserve, the

LIFO inventory valuation reserve, the cumulative amortization
of goodwill, unrecorded goodwill, a capitalization of R&D and
other market-building outlays, (Net) capitalized intangibles,
full-cost reserve, bad debt reserve, inventory obsolescence
reserve, warranty reserve, deferred income reserve, cumulative
unusual write-offs (less gains) after taxes. [Ref. 1]
b. The Operating Perspective
To obtain an equivalent to the deleveraged rate of
return from the Operating Perspective start with sales as the
major source of cash (where in the Financing Perspective
common share holders were the major source of cash) in the
calculation of NOPAT , then subtract recurring (operating)
expenses and taxes. To arrive at a figure for capital simply
add net working capital to net fixed assets. Where net
working capital is current assets less non-interest-bearing
current liabilities (accounts payable, accrued expenses, etc.)
and fixed assets consist on net property, plant and equipment,
goodwill, and other long-term capital necessary in the
operation of the business.[Ref . 1] Mathematically, the rate
of return equation from an Operating Perspective looks no
different than before:
r = NOPAT (2)
capital
However, NOPAT and Capital are calculated quite differently.
NOPAT and capital defined mathematically, for this particular
step, are as follows:
NOPAT = Sales- Operating expenses- Taxes
and
Capital = Net working capital (10+ Net fixed assets
10

2. The Cost of Capital Calculation
Looking back at the EVA™ equation, EVA™ = (r - c*) x
Capital [Equation 1] [Ref . 1] , the next variable we must tackle
is c* , the cost of capital. Once again, Stewart [Ref. 1 , pp
.
280-285] computes it two different ways: 1) from a Financing
Perspective, and 2) from an Operating Perspective. Both
perspectives are best illustrated by example.
Suppose we have a hypothetical company, I'll call it
BAILEYCORP (has a nice ring to it) . BAILEYCORP has 500 shares
of common stock outstanding. Its investor's required rate of
return for the risk in the business (regardless of how the
business is financed) is 10%. BAILEYCORP can borrow capital
at 6%. The corporate tax rate for our hypothetical company is
40%. The management of BAILEYCORP has decided that it will
have a Debt to Equity ratio of 1 to 1 (i.e. a capital
structure of 50% debt and 50% equity) . Using this
information, let's compute BAILEYCORP' s cost of capital, both
with the Financing Approach and the Operational Approach.
a. The Financing Approach
In order to compute the cost of capital using the
Financing Approach, we must first calculate the after-tax cost
of both debt and equity. The after-tax cost of debt uses the
following equation:
After-tax cost of Debt = (1 - t)b (11)
Where t is the corporate tax rate, and b is the
interest rate charged to borrow capital. For BAILEYCORP the
computation looks like this:
After-tax cost of Debt = (1 - t)b
After-tax cost of Debt = (1 - 40%) 6%
After-tax cost of Debt = 3.6%
11

The after-tax cost of equity requires two
computations, one to determine the Financial Risk Premium
(FRP) and another to add FRP and required investor return to
arrive at the after-tax cost of equity. Stewart [Ref. 1, p.
274] defines Financial Risk Premium as the compensation to
"investors for suffering the additional variability over the
business cycle in bottom-line earnings and hence in stock
price." The equation to determine FRP is as follows:
FRP = (1 - t)(c - b) (Debt /Equity) (12)
Where t is the corporate tax rate, c is the required
return for the risk in the business (regardless of how the
business is financed) , and b is the interest rate charged to
borrow capital. For BAILEYCORP the numbers fall out like
this :
FRP = (1 - t) (c - b) (Debt /Equity)
FRP = (1 - 40%) (10% - 6%) (1/1)
FRP = 2.4%
The final step in the after-tax cost of equity is
the addition of FRP and the investor's required base rate of
return, this is done with the following equation:
y = c + FRP (13)
Where y is the after-tax cost of equity, c is the
investor's required base rate of return, and FRP is the
Financial Risk Premium. BAILEYCORP 's after-tax cost of equity
calculation looks like this:
y = c + FRP
y = 10% + 2 .4%
y = 12 .4%
12

Using a table to compute the weighted average cost
of capital, BAILEYCORP's weighted average cost of capital is:
(3)=(l)x(2)Weighted
Cost
(1) (2)
After-'TaxCost Weight
Debt 3 .6% 50%Equity 12 .4% 50%
c*
(14)
1.80%6.20%8.00%
b. The Operating Approach
The Operating Approach is exceedingly simple in
comparison to the algebra exercise that the Financial Approach
utilizes. There is but one relatively simple formula, as
shown below:
C* = c[l-t(D/TC)] (15)
Where c* is the cost of capital, c is the required
return for the risk in the business (regardless of how the
business is financed) , t represents the tax rate, D is the
debt of the company, and TC is the total capital invested in
the company.[Ref . 1] Using the Operating Approach
BAILEYCORP's cost of capital stacks up as follows:
c* = c[l-t (D/TC)
]
c* = 10%[l-40%(50%)
]
c* = 8%
3. Defining Capital
Recalling the EVA™ equation, EVA™ = (r - c*) x Capital
[Equation 1] [Ref. 1], the last variable requiring some
explanation is Capital. Capital in the EVA™ equation refers
to the economic book value of the capital committed to the
business. Stewart [Ref. 1, p. 91] defines economic book value
as equity equivalents plus standard accounting book value.
Equity equivalents and the make up of capital were described
13

in some detail in the rate of return section and nothing
further would be gained by reviewing them at this point.
4 . Summary
EVA™ is the residual income left over from operating
profits after the cost of capital has been earned. [Ref. 1]
Residual income as a financial management measurement tool is
not a new or unique concept. However, the specific methods
used by Stern Stewart & Company to arrive at rates of return
and capital employed do appear to be unique. In the next
chapter the methodology to test and determine if the
information conveyed by the EVA™ measure is indeed unique will
be laid out. The chapter that follows (Chapter IV) will
contain the actual tests and analysis. Prior to getting into
the methodology and analysis, however, a review of the
literature about EVA™ is in order.
E. LITERATURE REVIEW
1 . EVA™ as an Internal Performance Measure
The majority, if not nearly all, of the prior research
and literature in the area of EVA™ deals with EVA™ as an
internal performance measurement tool. As mentioned in
chapter I, this thesis attempts to analyze the value of EVA™
as an information source to those external to the firm (in
particular DOD and DON)
.
Prior to 1990 the EVA™ term did not exist. It was in
1990 that Bennett Stewart published his book The Quest for
Value [Ref. 1] and in early 1991 that Stern Stewart &
Company's Sarah Smith published The Best and Worst Performers
in Corporate America [Ref. 3] in Corporate Finance magazine,
both of which introduced the term of EVA™. To say that the
EVA™ concept did not exist prior to the publications mentioned
above is somewhat misleading. Obviously the basis and
framework for EVA™ had been in the formulating stages for a
long time prior to 1990 and related concepts such as residual
14

income and free cash flow existed.
Professor Michael Jensen (Harvard Business School) has
examined the EVA™ concept (or its early predecessors) in his
studies of corporate takeovers: THE MARKET FOR CORPORATE
CONTROL The Scientific Evidence (Journal of Economic Finance
1983) [Ref. 4], Takeovers: folklore and science (Harvard
Business Review 1984) [Ref. 5], The Takeover Controversy:
Analysis and Evidence (Midland Corporate Finance Journal 1986,
revised 1988) [Ref. 6], Eclipse of the Public Corporation
(Harvard Business Review 1989) [Ref. 7], and Agency Costs of
Free Cash Flow, Corporate Finance, and Takeovers (American
Economic Review 1986, revised 1991) [Ref. 8] . Most recently
Professor Jensen referred to the EVA™ concept in an article
concerning internal control systems, The Modern Industrial
Revolution, Exit, and the Failure of Internal Control Systems
(Journal of Finance 1993) [Ref. 9] . However, it is not until
his most recent article [Ref. 9, p. 32] that EVA™ is mentioned
by name and then only as an internal control measure for R&D
and capital expenditures.
Brian McWilliams, in an article for Enterprise magazine
in April of 1993 titled CREATING VALUE [Ref. 10] and Stephen
F. 0' Byrne, in an article for Directorship magazine in
September of 1994 titled EVA™, Management Compensation, and
Shareholder Return [Ref. 11] discussed EVA™. However, Both
McWilliams and 0' Byrne treated EVA™ as a "management
philosophy" and examined only its applications to internal
controls such as executive compensation and capital budgeting.
An article written by Daniel J. McConville for Industry
Week magazine in April of 1984 ALL ABOUT EVA [Ref. 12] hinted
at EVA™ as an external information source, calling it a
"yardstick" to "determine whether or not a company should be
in business at all." The McConville article went on to say
that "Stock prices seem to move in tandem with EVA
calculations." However, the vast majority of the article
15

deals with EVA™ as a "management philosophy" and its basic
internal financial control functions of capital budgeting and
executive compensation. Mr. McConville's article appears to
be based solely on interviews and contains no empirical data
or reference to any type of study, [Ref . 12]
A September 1993 article in FORTUNE magazine, THE REAL
KEY TO CREATING WEALTH [Ref. 13] , by Shawn Tully touts EVA™ as
"today's hottest financial idea and getting hotter." Mr.
Tully asserts that businesses that use "the precepts of EVA
...have hugely increased the value of their companies." He
makes this conclusion based on stock appreciation rates over
a 10 year period for selected companies that adopted the EVA™
concept (six companies were listed by name, there was no other
information on the sample size) and interviews with CEO's and
CFO's whose companies have adopted EVA™. [Ref. 13]
Laura Walbert followed up the Tully article [Ref. 13] for
FORTUNE magazine in December of 1993 with AMERICA'S BEST
WEALTH CREATORS [Ref. 14]. The Walbert article concentrates
on MVA™ and only discusses EVA™ as it is related to MVA™. The
data and information listed in the article was all provided by
Stern Stewart & Company. Ms. Walbert appears to have taken
all of the Stern Stewart data at face value and apparently did
not perform any independent calculations or comparisons.
In two yet to be published articles, EVA™: FACT AND
FANTASY for the JOURNAL OF APPLIED CORPORATE FINANCE [Ref. 15]
and REFORM YOUR GOVERNANCE FROM WITHIN for Directors & Boards
[Ref. 16], G. Bennett Stewart III, himself, discusses EVA™.
The articles are simply updated and very condensed versions of
the key points found in his book The Quest for Value [Ref. 1] .
The data, information, and studies used in the articles are
the same as those found in the book. The updates consist, for
the most part, of new anecdotes and analogies that back up his
previous work.
16

2 . EVA™ As An External Performance Measure
Perhaps the most significant examination of EVA™, for the
purposes of this study, was done by Patrick T. Finegan (a
partner at Stern Stewart & Company) in MAXIMIZING SHAREHOLDER
VALUE AT THE PRIVATE COMPANY for the JOURNAL OF APPLIED
CORPORATE FINANCE in the summer issue of 1991 [Ref . 17] . The
title may, at first, seem incongruent with the subject of this
study, as this study is examining the information value of
EVA™ to those external to the business entity and in a private
company there are few, if any (creditors perhaps?),
interested outside parties. What the article deals with is
maximizing the value of a private company just prior to taking
it public. When a company goes public there are many people
external to the firm that are very interested in the company's
value. Mr. Finegan used plots (EVA versus MVA and Change in
EVA versus Change in MVA) and regression (MVA versus EVA,
Return on Capital, Return on Equity, Growth in Cash Flow, Bond
Rating Score, Growth in Sales, Growth in Dividends, Growth in
Assets, Growth in Capital, and Growth in Earnings Per Share)
.
Mr. Finegan describes the methodology as follows:
...The survey also recasts traditional accountingstatements into economically meaningful cash-basedmeasures like EVA, enabling us to test how wellmarkets measure performance.
To filter out company-specific noise, SternStewart grouped 900 industrial companies intoclusters of 25 arranged in order of MVA. We thenplotted the MVA of these clusters against theaverage EVA of each grouping ...The consistency ofrelationship was startling. The same strongcorrelation was apparent when we analyzedchanges [italics theirs] in MVA in relation tochanges in EVA... For any diversified portfolio, EVAturned out to be an extremely powerful indicator ofMVA, or the portfolio's premium or discount toeconomic book value.
17

I recently extended the analysis to othermeasures. Returning to the sample of 900industrials, I focused on the middle 450, where theMVAs were tightly clustered, and compared theexplanatory power of EVA to more conventionalperformance measures like earnings per share,growth in capital, the return on capital, and evengrowth in cash flow... EVA outperformed the returnon capital, return on equity, growth in cash flow,growth in dividends, and growth in assets - andexhibited six times [italics theirs] the explanatorypower of earnings-per-share growth in determiningMVA. I then repeated the analysis on changes inMVA and found EVA again the winner. . . [Ref . 18]
Based on his studies Mr. Finegan declared, "The single best
periodic measure of performance is EVA" [Ref. 18] . He further
elaborated:
...That markets conform to the EVA model of firmvaluation is borne out by cross-sectional researchof stock price performance over the last decade.Stern Stewart & Co. recently completed its secondannual survey of America's top-performing companiesranked by total market value created or destroyed,net of capital retained or invested (Market ValueAdded, or "MVA"). Unlike conventional, size-basedsurveys MVA controls for both growth andprofitability, providing a better glimpse of whohas, and has not, created value for theirshareholders. . .Whether they acknowledge it or not -
and indeed they may not even be conscious thattheir methods collectively promote this result -
sophisticated price-setting investors creditcompanies with the level and growth in EVA, andonly coincidentally with the growth in EPS....[Ref. 18]
As just discussed, Mr. Finegan concludes that EVA™ is the
"single best periodic measure of performance." However, I
believe that additional research will be necessary to
determine if that conclusion is valid. A related question, on
the other hand, is whether performance needs to be measured by
a single measure. One issue addressed in this thesis is the
18

hypothesis that EVA™ can be surrogated by (a combination of)
existing accounting measures. The next chapter outlines the
methodology directed toward that and other thesis questions.
19

20
III. METHODOLOGY
A. INTRODUCTION
The research presented in this thesis is almost entirely-
empirical. The Economic Value Added (EVA™) measurement is
analyzed to determine if the financial components, ratios, and
assumptions that are used to construct EVA™ make it unique
from commonly used accounting measures and ratios.
To determine if EVA™ is unique, both EVA™ and standard
accounting measures from a sample of defense contractors are
compared statistically. This process involves three steps.
The first step is identifying an appropriate sample of firms
and collecting financial and EVA™ data for the firms covering
a specific period of time. The second step is selecting
specific financial ratios to be included in the analysis. The
third step is designing specific statistical tests of
association between EVA™ and the selected financial ratios
which would provide findings relevant to the thesis' research
questions. Each of these steps is discussed in this chapter.
B. SAMPLE AND DATA
1. Selection of Sample Firms
The contractors analyzed were chosen utilizing the
following criteria. First, the sample was limited to U.S.
based companies and contractors only. Many large DON and DOD
contractors are foreign owned and foreign based companies.
Most foreign companies do not have the same financial
reporting requirements as U.S. companies, making it difficult
to obtain, analyze, and compare their financial statements
with their U.S. counterparts; therefore, they were eliminated
from the sample. Second, only contractors that do a large
amount of business with DON/DOD were considered. The
contractors were determined to be large contractors based on
dollar size of contracts, number of contracts awarded, and
21

percentage of the DON/DOD procurement budget for Fiscal Year
1986. Fifty large contractors were identified by name in a
graduate thesis, Financial Ratio Patterns in the United States
Defense Industry, by CAPT G. Gursoy, TURKISH ARMY [Ref. 18].
The sections of Gursoy 's methodology that are relevant to
sample and data selection are included as Appendix A. Third,
the number of contractors was further narrowed by finding the
overlap between Gursoy 's list [Ref. 18] and the Stern Stewart
Performance 1000 database, the source for the EVA™ data.
There were 45 companies that met these criteria, they are
listed on the following page.
22

List of POD/DON Contractors included in study
1. Allied-Signal, Inc.
2 .. A . T . & T
.
3. Black & Decker Corp.
4
.
The Boeing Co.
5. Chrysler Corp.
6. The Coastal Corp.
7
.
Computer Science Corp
8. CSX Corp.
9. E - Systems, Inc.
10 .E.G. & G. , Inc.
11 . Eaton Corp
.
12. Eastman Kodak
13 .FMC Corp.
14 .Ford Motor Co.
15 .GTE Corp.
16 .Gencorp Inc
.
17. General Dynamics Corp
18. General Electric Co.
19. General Motors Corp.
2 0. Grumman Corp.
21. Harris Corp.
22 .Harsco Corp
.
23. Hercules Inc.
24. Hewlett-Packard Co.
25. Honeywell, Inc.
2 6
.
IBM Corp.
27
.
ITT Corp.
28. Johnson Controls Inc.
29. Lockheed Corp.
3 . Loral Corp
.
31. Martin Marietta Corp.
32. McDonnell Douglas Corp.
33. Morrison Knudsen Corp.
34. Motorola, Inc.
35. Northrop Corp.
36. Olin Corp.
37
.
Raytheon Co
.
38. Rockwell International
3 9
.
TRW Inc.
40. Teledyne, Inc.
41. Texas Instruments Inc.
42. Trinity Industries, Inc.
43
.
United Technologies Corp
44. Unisys Corp.
45. Westinghouse Electric Corp.
23
2 . Data and Time Period Studied
The ten year time period between 1983 and 1992 was chosen
because it provided the most advantageous combination of both
timeliness (recent enough to be useful) and comprehensiveness
(long enough to include periods of both economic growth and
contraction) . Both EVA™ and traditional accounting data was
collected for the sample firms covering the 10 year period.
The EVA™ data was obtained from Stern Stewart Management
Services, in the form of The Stern Stewart PERFORMANCE 1000
The Definitive Guide to MVA and EVA™ (Stern Stewart Management
Services, 1993) [Ref . 21] . The accounting data was obtained
from the information gathered by CAPT G. Gursoy (TURKISH
ARMY) for use in a graduate thesis, Financial Ratio Patterns in
the United States Defense Industry, [Ref. 18] . The financial
information of the defense firms in Gursoy 's study were
collected from company annual financial reports , company 10K
reports filed with the Securities and Exchange Commission, or
Moody's industrial manuals. Gursoy concluded that these three
sources provided a sufficient amount of financial data for the
study.
In Gursoy 's study 30 specific financial information items
were collected to calculate financial ratios. The financial
information items were chosen by considering the ratios that
would be calculated. These raw data items are listed on the
following page.
24

RAW DATA LIST
Balance Sheet Items
1. Cash and marketable securities
2
.
Receivables
3
.
Inventory
4
.
Total current assets
5. Net plant, property, and equipment (fixed assets
6
.
Total assets
7. Accounts payable and accrued expenses
8. Total current liabilities
9
.
Long term debt
10. Other long term liabilities
11. Total liabilities
12
.
Preferred stock
13
.
Retained earnings
14. Total stockholder's equity
Income Statement Items
15
.
Net sales
16. Cost of goods sold (COGS)
17. Total operating expenses
18. Net operating income
19. Interest expense
20. Income tax expense
21. "Total" income from continuing operations
22
.
Net Income
23
.
Earnings per share from continuing operations
24. Earnings per share from discontinuing operations
Cash Flow Statement
25. Cash flow from operations
26. Working capital from operations
27. Net capital expenditures
28. Depreciation, amortization, and depletion
Additional Data Items
29. Total revenue from government
30. Year
25
The financial information for each firms came from three
primary sources
:
• Balance sheet (statement of financial condition)
• The income statement (profit and loss statement)
• Cash flows statement (statement of changes in financialposition)
C . MEASURES
There were two basic methods used to select the specific
ratios to be included in the analysis, a "Comprehensive"
method and the "Conceptual" method. The Comprehensive Method
selects a wide set of ratios designed to comprehensively
represent all possible accounting ratios. The comprehensive
method assumes that ratios which might be relevant in
explaining EVA™ cannot be identified in advance. Thus, a
wide range of ratios should be included in the analysis and
purely empirical techniques used to identify which specific
ratios are most useful.
In contrast, the Conceptual Method assumes that a small
set of ratios, likely to be most useful in explaining EVA™,
can (and perhaps should) be identified in advance of testing.
The empirical testing is then limited only to those ratios.
This begs the question, what concepts might guide the
selection of those ratios? Two conceptual approaches were
used to facilitate ratio selection in this thesis. The first
is the factor ratio classification approach, hereafter
referred to as the factor approach, identified in Chen and
Shimerda's, An Empirical Analysis of Useful Financial Ratios
(Financial Management, Spring 1981) [Ref. 20], and THE
STABILITY OF FINANCIAL PATTERNS IN INDUSTRIAL ORGANIZATIONS by
Pinches, Mingo, and Caruthers (The Journal of Finance, May
1973) [Ref. 22]. These studies claim that there are seven
26

fundamental dimensions of financial condition reflected by
existing and generally accepted financial ratios. The studies
further claim that one specific ratio can be chosen to
represent each dimension.
The second conceptual approach, referred to hereafter as
the performance approach, rests on the concept that underlies
EVA™. EVA™ is designed as a single summary measure of overall
firm performance. Traditional accounting ratios which are
typically seen as overall summary performance measures were
selected to be compared to EVA™. Each of these approaches is
more fully addressed in the Conceptual Method section.
Certain assumptions were necessary in computing the
ratios given the limitations of the databases used in this
study. The assumptions made in computing certain accounting
formulas and ratios are included as Appendix B.
1. The Comprehensive Method
As stated previously, the Comprehensive Method selects
ratios to represent all possible accounting ratios.
Obviously, this could include an infinite number of ratios.
Therefore, the ratios were limited to those currently in use
by DOD contracting personnel. Those particular ratios are
found in Appendix C of the Guide to Analysis of Financial
Capabilities for Preaward and Postaward Reviews [Ref. 19].
This guide is used by the Defense Contract Management Command
in the Contract Management Financial Services division. The
guide contains 50 financial ratios, however the number of
ratios used in the study was reduced to include only those
whose components were in the databases provided by Gursoy
[Ref. 18] . In the end, only 35 of the 50 ratios were used.
The 3 5 financial ratios chosen by the Comprehensive
Method to be included in the analysis fall into five broad
categories 1) Solvency Ratios, 2) Working Capital Ratios,
3) Leverage Ratios, 4) Coverage Ratios, and 5) Profitability
Ratios. A complete list of the ratios selected for use in the
27
Comprehensive Method is contained on page 38. The ratios
included in the analysis were as follows:
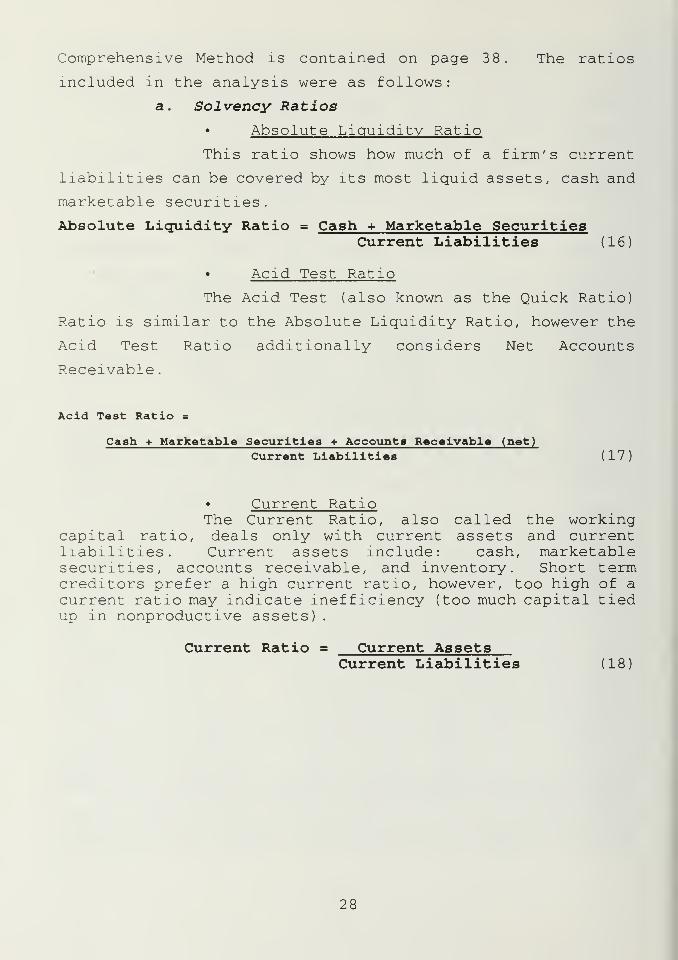
a. Solvency Ratios
• Absolute Liquidity Ratio
This ratio shows how much of a firm's current
liabilities can be covered by its most liquid assets, cash and
marketable securities.
Absolute Liquidity Ratio = Cash + Marketable SecuritiesCurrent Liabilities (16)
• Acid Test Ratio
The Acid Test (also known as the Quick Ratio)
Ratio is similar to the Absolute Liquidity Ratio, however the
Acid Test Ratio additionally considers Net Accounts
Receivable
.
Acid Test Ratio =
Cash + Marketable Securities + Accounts Receivable (net)
Current Liabilities (17)
• Current RatioThe Current Ratio, also called the working
capital ratio, deals only with current assets and currentliabilities. Current assets include: cash, marketablesecurities, accounts receivable, and inventory. Short termcreditors prefer a high current ratio, however, too high of acurrent ratio may indicate inefficiency (too much capital tiedup in nonproductive assets)
.
Current Ratio = Current AssetsCurrent Liabilities (18
28

• Accounts Payable to Sales Ratio
This ratio measures how a firm pays its
creditors in relation to its sales volume. A low percentage
is considered good.
Accounts Payable to Sales Ratio = Accounts PayableNet Sales (19)
Assets to Sales Ratio
This ratio measures the percentage of
investment in assets that is required to generate the current
annual sales level. A high percentage is a possible indicator
that a firm is not being aggressive enough in its marketing or
it is not fully employing its assets. A low percentage may
indicate that the firm is selling more than can safely be
covered by its assets.
Assets to Sales Ratio = Total AssetsNet Sales (20)
• Basic Defense Interval
This provides the period of time a firm can
cover its cash expenses without additional financing should
all revenues cease.
Basic Defense Interval =
365 (Cash + Receivables + Marketable Securities)Operating Expenses + Interest + Income Taxes (21)
29

• Inventory Turnover Ratio
This ratio provides an indication of the
liquidity of inventories. A low ratio is a possible
indication that too much cash is tied up in inventories.
Inventory Turnover Ratio = Cost of Goods SoldAverage Inventory (22)
• Net Sales to Inventory Ratio
An annual increase in this ratio is often
considered good, while a decline may indicate problems. A
high ratio may indicate a loss of sales with customers buying
somewhere else, or even a collection problem. A low ratio may
indicate obsolete inventory, poor purchasing policies, or
contingency stockpiling.
Sales to Inventory Ratio = Net SalesInventory (23)
b. Working1 Capital Ratios
• Cash available to Finance Operations
Ratio
This ratio yields a rough indication of whether
there is sufficient cash to finance current operations. It is
similar to the basic defense ratio, except that depreciation
is omitted from the denominator, as it is not a cash drain.
Cash Available to Finance Operations Ratio =
365 (Cash + Receivables + Marketable Securities)Operating Expenses - Depreciation + Interest + Income Taxes (24)
30

• Current Asset Turnover Ratio
This ratio is used to identify trends in the
turnover and profitability of current assets.
Current Asset Turnover Ratio =
Cost of Goods Sold + Expenses + Interest + Taxes - DepreciationAverage Current Assets (25)
• Current Liabilities to Net Worth Ratio
This ratio provides a measure of the proportion
of capital current creditors contribute to operations. It is
also a measure of the amounts due to short term creditors as
a percentage of the shareholders' investment. An increasing
ratio indicates decreasing security for creditors.
Current Liabilities to Net Worth Ratio = Current LiabilitiesTangible Net Worth (26)
• Current liabilities to Inventory Ratio
This ratio measures the extent to which a firm
relies on sales to generate funds to pay current liabilities.
Current Liabilities to Inventory Ratio = Current LiabilitiesInventory ( 2 7
• Long Term Liabilities to Working Capital
Ratio
Normally this ratio should not exceed 100%.
Long Term Liabilities to Working Capital Ratio =
Long Term DebtNet Working Capital (28)
31

• Inventory to Net Working Capital Ratio
This ratio compares working capital to
inventory value. Overstocking can lead to bankruptcy.
Normally this ratio should not exceed 80%, however, it should
always be compared to the industry average.
Inventory to Net Working Capital = InventoryNet Working Capital (29)
• Working Capital Turnover Ratio
This ratio indicates whether a firm is over
invested in fixed, or slow, assets. It should always be
compared to the industry average.
Working Capital Turnover = Net SalesNet Working Capital (30)
c. Leverage Ratios
Debt and Preferred RatioThis ratio measures the extent of financing
contributed by creditors and preferred owners.
Debt and Preferred Ratio = Long Term Debt + Preferred FundsTotal Capital Employed (31)
Debt Ratio
This ratio measures the percentage of total
funds supplied by creditors. Creditors normally prefer a
lower ratio, but management may use leverage to produce a
higher ratio.
Debt Ratio = Current + Long Term DebtTotal Assets (32
32

• Debt to Equity Ratio
This ratio provides the relative positions of
creditors and owners.
Debt to Equity Ratio = Long Term Debt + PreferredCommon Stockholders' Equity (33)
• Equity Ratio
This ratio shows the share of the firm's
capital provided by equity holders.
Equity Ratio = Common Shareholders ' EquityTotal Capital Employed (34
d. Coverage Ratios
• Cash Flow to Liabilities Ratio
This ratio is used to compare statements with
a firm rather than industry, because of varying depreciation
practices. Ideally , liquidity would increase as due dates
for debt maturity approach.
Cash Flow to Liabilities Ratio = Net Income + DepreciationTotal Liabilities (35)
Current Assets to Total Liabilities Ratio
This ratio measures protection for both short
and long term liabilities. A ratio in excess of 100%
indicates that long term creditors may be paid out of working
capital if the firm is liquidated.
Current Assets to Total Liabilities Ratio =
Current AssetsCurrent + Long Term Debt ( 3 6
33

Fixed Assets to Net Worth Ratio
Disproportionate investment in illiquid fixed
assets decreases the amount of funds available for daily
operations and can leave a firm vulnerable to unexpected
hazards and adverse changes in the business climate.
Fixed Assets to Net Worth Ratio =
Fixed Assets (net) - IntangiblesTangible Net Worth (37)
• Shareholders' Equity Ratio
A low ratio of equity to assets may precede
difficulty in meeting interest charges and debt obligations.
Equity Ratio = Shareholders' EquityTotal Assets (38
Tangible Net Worth to Total Debt Ratio
This ratio measures the proportion between the
shareholders' capital and that contributed by creditors. It
is the inverse of the debt ratio.
Tangible Net Worth to Total Debt Ratio = Tangible Net WorthTotal Debt (39
Times Interest Earned Ratio
The margin between income and interest payments
is considered a good indication of a firm's ability to meet
interest payments
.
Times Interest Earned Ratio = Earnings Before Interest and TaxesInterest Expense (40
34

e. Profitability Ratios
• Capital Turnover Ratio
This ratio indicates whether investment is
adequately proportionate to sales and whether a potential
credit problem or management problem exists. A high ratio may
indicate overtrading or undercapitalization, while a low ratio
may indicate overcapitalization.
Capital Turnover Ratio = Net SalesTangible Net Worth (41)
Gross Profit on Net Sales Ratio
This ratio provides the average mark up, or
margin, on goods sold. It can help identify trends in a
firm's credit policy, markups, purchasing, and general
merchandising. It may vary widely among firms in the same
industry, according to sales, location, size, and competition.
Gross Margin Ratio = Gross MarginNet Sales (42
• Management Rate of Return
This rate quantifies the efficient use of
assets compared with a target rate of return.
Rate of Return = Operating IncomeFixed Assets + Net Working Capital (43
35

• Net Operating Profit Ratio
When there are significant financial charges,
this ratio is preferable to the return on assets ratio. Net
profit to net worth is influenced by the method of financing.
Net Operating Profit Ratio =
Earnings Before Interest and TaxesTangible Net Worth (44)
Net Profit to Tangible Net Worth Ratio
This ratio measures management's ability to
realize an adequate return on the capital invested. It is
often compared to and industry average.
Net Profit Rate = Earnings After TaxesTangible Net Worth (45
• Net Profit to Net Working Capital Ratio
Working capital provides the cushion to carry
inventories and receivables and finance ordinary business
operations
.
Net Profits to Net Working Capital = Earnings After TaxesNet Working Capital (46
• Operating Expenses Ratio
This ratio shows management's ability to adjust
expense items to changing sales. Trend analysis identifies any
problem category. The higher this ratio the more sales are
being absorbed by expenses. In this equation total operating
expenses include cost of goods sold, selling, administrative,
and general expenses
.
Operating Expenses Ratio = Total Operating ExpensesNet Sales (47
36

• Operating Ratio
This ratio measures the profitability of normal
business operations. It is usually compared with industry
averages
.
Operating Ratio = Operating IncomeNet Sales (48)
• Rate of Return on Total Assets
This measures management's ability to earn a
return on the firm's assets without regard to variations in
the method of financing.
Rate of Return on Total Assets =
Earnings After Taxes + Interest ExpenseAverage Total Assets during the Year (49)
• Return on Sales
This rate is usually compared with the industry
average. The higher the rate, the better the firm is able to
survive a downturn. If the rate is low, a high turnover of
inventory is required to obtain an adequate return of
investment. This rate is normally fairly constant over time.
Rate of Return on Sales = Earnings After TaxesNet Sales (50
37

Ratios Included in The Comprehensive Method (Full Set
Solvency Ratios1. Absolute Liquidity Ratio2
.
Acid Test Ratio3
.
Current Ratio4. Accounts Payable to Sales Ratio5. Assets to Sales Ratio6
.
Basic Defense Interval7
.
Inventory Turnover Ratio8. Net Sales to Inventory Ratio
Working Capital Ratios9
.
Cash Available to Finance Operations10. Current Asset Turnover Ratio11. Current Liabilities to Net Worth Ratio12
.
Current Liabilities to Inventory Ratio13
.
Long Term Liabilities to Working Capital Ratio14. Inventory to Net Working Capital Ratio15. Working Capital Turnover Ratio
Leverage Ratios16. Debt and Preferred Ratio17. Debt Ratio18. Debt to Equity Ratio19
.
Equity Ratio
Coverage Ratios20. Cash Flow to Liabilities Ratio21. Current Assets to Total Liabilities Ratio22. Fixed Assets to Net Worth Ratio23. Shareholders' Equity Ratio24. Tangible Net Worth to Total Debt Ratio25. Times Interest Earned Ratio
Profitability Ratios26. Capital Turnover Ratio27. Gross Profit on Net Sales Ratio28. Management Rate of Return29. Net Operating Profit Ratio30. Net Profit to Tangible Net Worth31. Net Profit to Net Working Capital32
.
Operating Expenses Ratio33
.
Operating Ratio34. Rate of Return of Total Assets35. Return on Sales
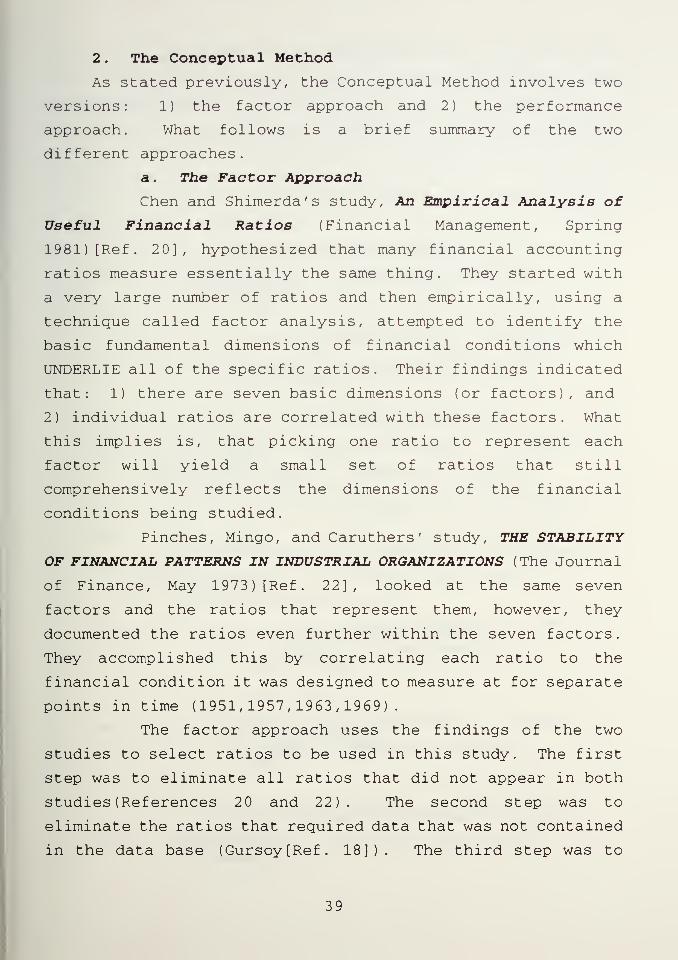
2 . The Conceptual Method
As stated previously, the Conceptual Method involves two
versions: 1) the factor approach and 2) the performance
approach. What follows is a brief summary of the two
different approaches.
a. The Factor Approach
Chen and Shimerda's study, An Empirical Analysis of
Useful Financial Ratios (Financial Management, Spring
1981) [Ref. 20], hypothesized that many financial accounting
ratios measure essentially the same thing. They started with
a very large number of ratios and then empirically, using a
technique called factor analysis, attempted to identify the
basic fundamental dimensions of financial conditions which
UNDERLIE all of the specific ratios. Their findings indicated
that: 1) there are seven basic dimensions (or factors), and
2) individual ratios are correlated with these factors. What
this implies is, that picking one ratio to represent each
factor will yield a small set of ratios that still
comprehensively reflects the dimensions of the financial
conditions being studied.
Pinches, Mingo, and Caruthers ' study, THE STABILITY
OF FINANCIAL PATTERNS IN INDUSTRIAL ORGANIZATIONS (The Journal
of Finance, May 1973) [Ref. 22], looked at the same seven
factors and the ratios that represent them, however, they
documented the ratios even further within the seven factors.
They accomplished this by correlating each ratio to the
financial condition it was designed to measure at for separate
points in time (1951,1957,1963,1969).
The factor approach uses the findings of the two
studies to select ratios to be used in this study. The first
step was to eliminate all ratios that did not appear in both
studies (References 20 and 22) . The second step was to
eliminate the ratios that required data that was not contained
in the data base (Gursoy[Ref. 18]) . The third step was to
39

select the ratio with the highest mean factor load (the sum of
the four different factor loads for each of the years in the
study divided by four) as identified in The Stability of
Financial Patterns in Industrial Organizations [Ref . 22] from
the ratios that remained. The ratios that were left are then
the seven ratios that best reflect the seven dimensions of
financial condition. Those ratios are as follows:
Factor 1 - Return on Investment Ratio
Return on Investment = Net IncomeNet Worth (51
Factor 2 - Capital Turnover Ratio
Capital Turnover = SalesTotal Assets (52)
Factor 3 - Financial Leverage Ratio
Financial Leverage = Total LiabilitiesTotal Assets (53
Factor 4 - Short-Term Liquidity Ratio
Short-Term Liquidity = Current AssetsCurrent Liabilities (54
Factor 5 - Cash Position Ratio
Cash Position = CashTotal Assets (55
Factor 6 - Inventory Turnover Ratio
Inventory Turnover = InventorySales (56
Factor 7 - Receivables Turnover Ratio
Receivables Turnover = Quick AssetsSales (57
40

b. The Performance Approach
The second version of the Conceptual Method is the
performance approach. EVA™ is a variation of residual income
and residual income is essentially a summary performance
measure. Therefore a direct comparison of EVA™ to some of the
more common and widely used summary performance measures or
ratios that can be calculated from traditional accounting data
could prove to be valuable to this study. Five of the most
widely used and generally accepted accounting measures of
performance were identified. The performance measures chosen
were: 1) Return on Total Assets (ROTA), 2) Return on
Shareholders' Equity (ROE), 3) Operating Income Ratio, 4) Net
Income Ratio, and 5) Return on Total Capital. Mathematically
the measures are defined as follows:
Return on Total Assets Ratio (ROTA)
ROTA = Net IncomeTotal Assets (58)
• Return on Shareholders' Equity Ratio (ROE)
ROE = Net IncomeCommon Equity (59)
• Operating Income Ratio
Operating Income Ratio = Operating IncomeNet Sales (60
Net Income Ratio
Net Income Ratio = Net IncomeNet Sales (61
Return on Total Capital Ratio (ROTC)
ROTC = Net IncomeTotal Assets (62
41
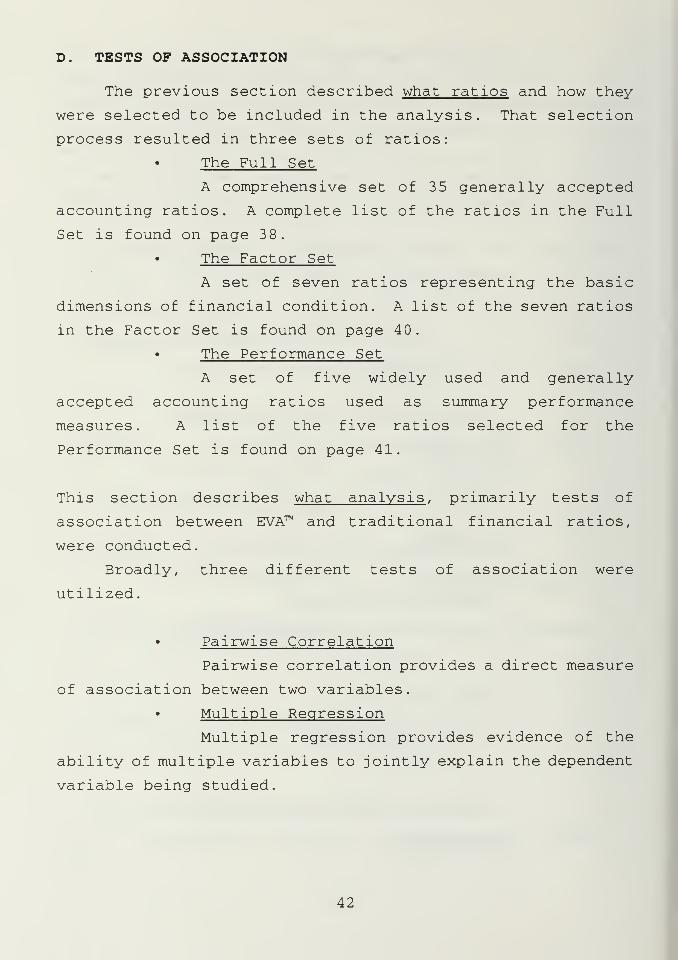
D. TESTS OF ASSOCIATION
The previous section described what ratios and how they
were selected to be included in the analysis. That selection
process resulted in three sets of ratios:
The Full Set
A comprehensive set of 35 generally accepted
accounting ratios. A complete list of the ratios in the Full
Set is found on page 38.
The Factor Set
A set of seven ratios representing the basic
dimensions of financial condition. A list of the seven ratios
in the Factor Set is found on page 40.
• The Performance Set
A set of five widely used and generally
accepted accounting ratios used as summary performance
measures. A list of the five ratios selected for the
Performance Set is found on page 41.
This section describes what analysis , primarily tests of
association between EVA™ and traditional financial ratios,
were conducted.
Broadly, three different tests of association were
utilized.
• Pairwise Correlation
Pairwise correlation provides a direct measure
of association between two variables.
• Multiple Regression
Multiple regression provides evidence of the
ability of multiple variables to jointly explain the dependent
variable being studied.
42

• Stepwise Regression
Stepwise regression empirically selects, from
a larger set, the smaller subset of variables which best
explain the dependent variable being studied.
The three types of tests described above were conducted
using the three different sets of ratios (Full, Factor, and
Performance), as described in the following sections.
E. TESTS USED TO ANSWER THE RESEARCH QUESTIONS
1. The Primary Research Question
The purpose for doing tests of association, or any tests
involving the research data, is to answer the research
questions posed back in Chapter I. Those research questions
are repeated here along with a description of the test used to
provide findings relevant to the questions. The primary
question was, "does the EVA™ measure provide information
beyond what is currently available in traditional accounting
measures?" The primary research question implies that
traditional accounting ratios, from data taken a particular
point in time should be able to explain EVA™ at the same
particular point in time. Statistically this means that
variance across firms in EVA™ can be explained by variance
across firms in traditional accounting ratios. This
relationship (or association) was tested using correlation,
regression, and stepwise regression.
To test this relationship we first used the comprehensive
method, correlating EVA™ with the Full Set of 3 5 different
traditional financial accounting ratios, described previously
in the Choice of Measures section. Simple regression,
multiple regression, and stepwise regression were also used to
compare EVA™ and the 35 traditional accounting ratios.
The next step in attempting to answer the primary
research question narrowed the focus of the study to the
43
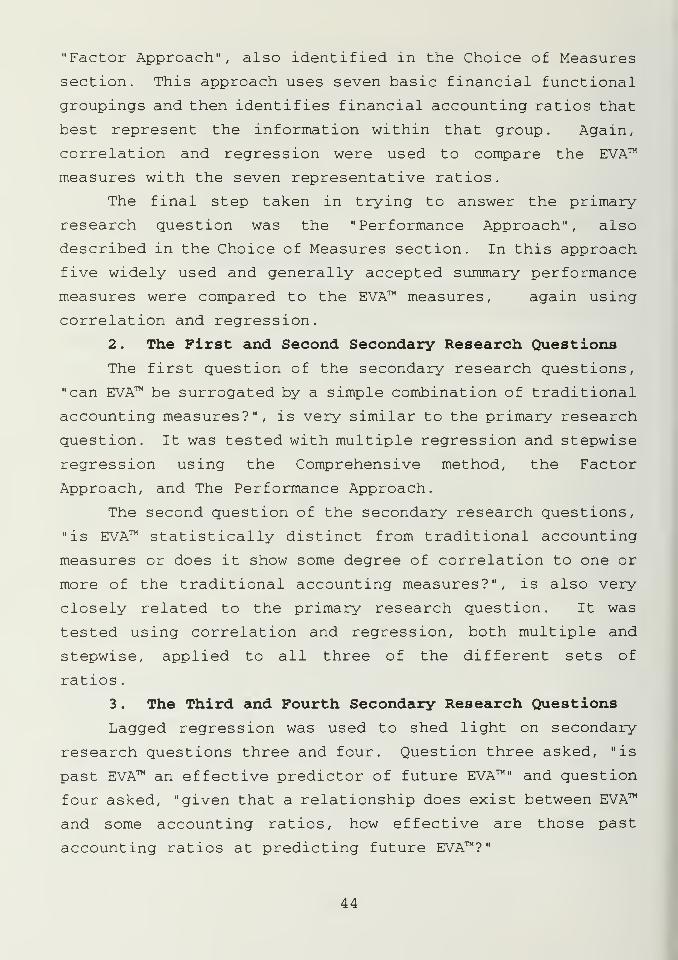
"Factor Approach", also identified in the Choice of Measures
section. This approach uses seven basic financial functional
groupings and then identifies financial accounting ratios that
best represent the information within that group. Again,
correlation and regression were used to compare the EVA™
measures with the seven representative ratios.
The final step taken in trying to answer the primary
research question was the "Performance Approach", also
described in the Choice of Measures section. In this approach
five widely used and generally accepted summary performance
measures were compared to the EVA™ measures, again using
correlation and regression.
2. The First and Second Secondary Research Questions
The first question of the secondary research questions,
"can EVA™ be surrogated by a simple combination of traditional
accounting measures?", is very similar to the primary research
question. It was tested with multiple regression and stepwise
regression using the Comprehensive method, the Factor
Approach, and The Performance Approach.
The second question of the secondary research questions,
"is EVA™ statistically distinct from traditional accounting
measures or does it show some degree of correlation to one or
more of the traditional accounting measures?", is also very
closely related to the primary research question. It was
tested using correlation and regression, both multiple and
stepwise, applied to all three of the different sets of
ratios
.
3. The Third and Fourth Secondary Research Questions
Lagged regression was used to shed light on secondary
research questions three and four. Question three asked, "is
past EVA™ an effective predictor of future EVA™" and question
four asked, "given that a relationship does exist between EVA™
and some accounting ratios, how effective are those past
accounting ratios at predicting future EVA™?"
44

4. The Fifth Secondary Research Question
The fifth, and final, secondary research question asked,
"are there benefits to the U.S. Navy in using EVA™ ratings, in
lieu of the traditional accounting measures now used, to
evaluate potential contractors in Pre-Award Surveys?" This
question was studied using all of the data and answers to the
primary research question and all four of the previous
secondary research questions. There is no one single
definitive test that could answer this question. It is a
subjective conclusion, supported by the data gathered in
answering the previous questions.
The next chapter will contain the results of all the
tests described in this section, as well as the descriptive
statistics for the data involved. Following that will be the
final chapter (Chapter V) . Chapter V will contain conclusions
and recommendations for further study in this area.
45

46

IV. ANALYSIS
The last chapter outlined the analysis, primarily tests
of association, that were conducted in this study. This
chapter will further elaborate on each test performed and
discuss the results obtained from each of the tests. As
stated in Chapter III, the purpose for performing these tests
was to answer the research questions posed in the first
chapter. Again, as in Chapter III, the research questions are
repeated here with a description of the test and the relevant
findings
.
A. TESTS TO ANSWER THE PRIMARY RESEARCH QUESTION
The primary research question was, does the EVA™ measure
provide information beyond what is currently available in
traditional accounting measures? In attempting to answer the
primary research question, the three methods described in the
previous chapter were used. The Comprehensive Method was used
first, then the Factor Approach (Conceptual Method), and then
finally the Performance Approach (Conceptual Method) . Within
each method or approach, several different tests were actually
run including pairwise correlation, regression (simple and
multiple), and stepwise regression.
1. The Comprehensive Method
The first test performed was a pairwise correlation
between the Full Set Ratios and EVA™ for the years 1983
through 1992. A complete list of the Full Set Ratios is found
on page 38. In doing a correlation between the Full Set
ratios and EVA™ it was expected that if EVA™ and one or more
of the Full Set ratios were similar measures they would have
a high correlation, and conversely, if EVA™ were unique none
of the ratios would correlate to EVA™ to any significant
degree. Table 1 lists the ratios and their correlation to
EVA™. (Table 2 on pages 50 and 51 provides a key to the ratio
47

coefficient above 0.34. The highest correlations are for
three profitability ratios (Net Operating Profit Ratio, Rate
of Return on Total Assets, and Rate of Return on Sales), this
is not surprising as EVA™ is itself a variation of a
profitability measure. The only other ratio with a
correlation of any significance was a cash flow ratio, the
Cash Flow to Liabilities Ratio. This comes as something of a
surprise because, as you may recall, EVA™ factors out the
influence of leverage and the Cash Flow to Liabilities Ratio
is heavily influenced by leverage (debt)
.
48
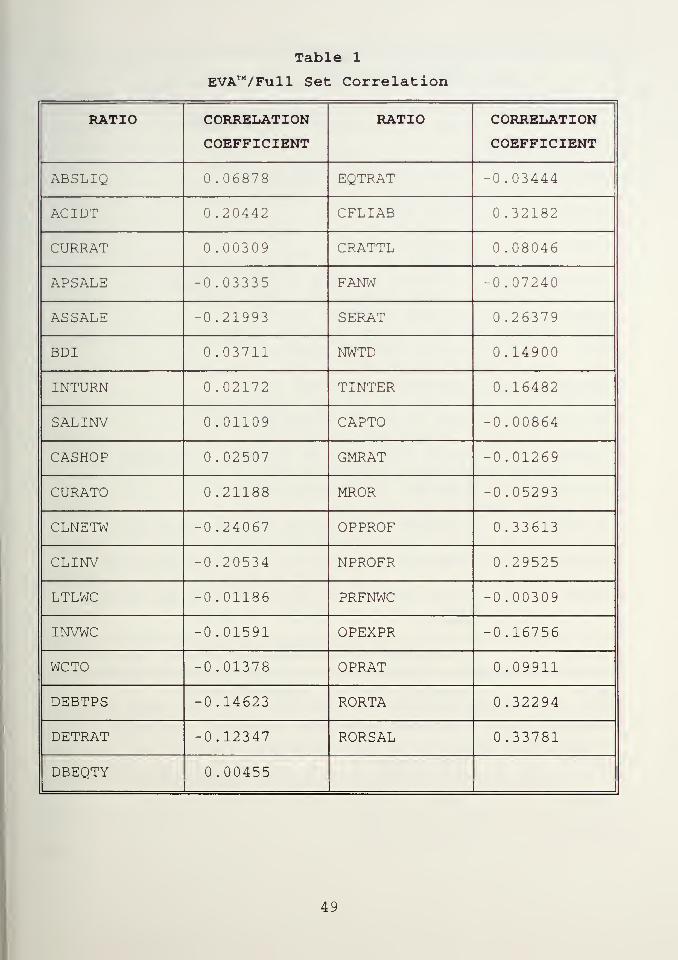
Table 1
EVA™/Full Set Correlation
RATIO CORRELATION
COEFFICIENT
RATIO CORRELATION
COEFFICIENT
ABSLIQ 0.06878 EQTRAT -0.03444
AC IDT 0.20442 CFLIAB 0.32182
CURRAT 0.00309 CRATTL 0.08046
APSALE -0.03335 FANW -0.07240
ASSALE -0.21993 SERAT 0.26379
BDI 0.03711 NWTD 0.14900
INTURN 0.02172 TINTER 0.16482
SALINV 0.01109 CAPTO -0.00864
CASHOP 0.02507 GMRAT -0.01269
CURATO 0.21188 MROR -0.05293
CLNETW -0.24067 OPPROF 0.33613
CLINV -0.20534 NPROFR 0.29525
LTLWC -0.01186 PRFNWC -0.00309
INVWC -0.01591 OPEXPR -0.16756
WCTO -0.01378 OPRAT 0.09911
DEBTPS -0.14623 RORTA 0.32294
DETRAT -0.12347 RORSAL 0.33781
DBEQTY 0.00455
49

Table 2
Full Set Ratio Abbreviation Definitions
RATIO
ABBREVIATION
FULL RATIO NAME
ABSLIQ ABSOLUTE LIQUIDITY RATIO
AC IDT ACID TEST RATIO
CURRAT CURRENT RATIO
APSALE ACCOUNTS PAYABLE TO SALES RATIO
ASSALE ASSETS TO SALES RATIO
BDI BASIC DEFENSE INTERVAL
INTURN INVENTORY TURNOVER RATIO
SALINV NET SALES TO INVENTORY RATIO
CASHOP CASH AVAILABLE TO FINANCE OPERATIONS RATIO
CURATO CURRENT ASSET TURNOVER RATIO
CLNETW CURRENT LIABILITIES TO NET WORTH RATIO
CLINV CURRENT LIABILITIES TO INVENTORY RATIO
LTLWC LONG TERM LIABILITIES TO WORKING CAPITAL
RATIO
INVWC INVENTORY TO NET WORKING CAPITAL RATIO
WCTO WORKING CAPITAL TURNOVER RATIO
DEBTPS DEBT AND PREFERRED RATIO
DETRAT DEBT RATIO
DBEQTY DEBT TO EQUITY RATIO
EQTRAT EQUITY RATIO
50

RATIO
ABBREVIATION
FULL RATIO NAME
CFLIAB CASH FLOW TO LIABILITIES RATIO
CRATTL CURRENT ASSETS TO TOTAL LIABILITIES RATIO
FANW FIXED ASSETS TO NET WORTH RATIO
SERAT SHAREHOLDERS' EQUITY RATIO
NWTD TANGIBLE NET WORTH TO TOTAL DEBT RATIO
TINTER TIMES INTEREST EARNED RATIO
CAPTO CAPITAL TURNOVER RATIO
GMRAT GROSS PROFIT ON NET SALES RATIO
MROR MANAGEMENT RATE OF RETURN
OPPROF NET OPERATING PROFIT RATIO
NPROFR NET PROFIT TO TANGIBLE NET WORTH RATIO
PRFNWC NET PROFIT TO NET WORKING CAPITAL RATIO
OPEXPR OPERATING EXPENSE RATIO
OPRAT OPERATING RATIO
RORTA RATE OF RETURN ON TOTAL ASSETS
RORSAL RATE OF RETURN ON SALES
The next test utilized multiple regression setting EVA™
as the dependent variable to be explained by a combination of
the Full Set ratios. The model had an adjusted R-squared of
0.4589 with a probability of error of 0.0001.
51

The last set of tests that were run, using the Full Set
ratios in attempting to answer the primary research question,
involved the use of stepwise regression. In this procedure
the Statistical Analysis System (SAS) program was permitted to
empirically add or remove ratios from the Full Set in order to
most effectively explain the dependent variable EVA™.
Statistically, the stepwise procedure continued to run as long
as the additional variables were a significant addition to the
model used to explain EVA™. (the cut off for significance was
p<=0.15.). Table 3 on the following page summarizes the
results of the stepwise regression procedure. The variable
names are in abbreviated form; Table 2 on pages 50 and 51
provides the full names of the abbreviated ratios. The final
model provided an R-squared of only 0.4836, using 12 of the 35
ratios. It is interesting to note that the ratios most highly
correlated to EVA™ did not necessarily contribute
significantly to the stepwise regression model. Specifically,
the Net Operating Profit Ratio (corr. coeff. 0.33613) and the
Cash Flow to Liabilities Ratio (corr. coeff. 0.332182) were
not even included in the stepwise regression model.
In the next section the Conceptual Method will be
evaluated, running the same tests again, this time using the
Factor Set and the Performance Set ratios.
52

Table 3
Stepwise Regression: EVA™/Full Set Ratios
STEP VARIABLE PARTIAL R2 MODEL R 2 PROBABILITY
> F
1 RORSAL 0.1643 0.1643 0.0001
2 CURATO 0.0939 0.2581 0.0001
3 RORTA 0.0321 0.2902 0.0013
4 ASSALE 0.0506 0.3408 0.0001
5 BDI 0.0386 0.3794 0.0002
6 CURRAT 0.0182 0.3976 0.0085
7 CLINV 0.0195 0.4172 0.0057
8 AC IDT 0.0176 0.4347 0.0079
9 INTURN 0.0253 0.4600 0.0012
10 OPEXPR 0.0055 0.4655 0.1279
11 DEBTPS 0.0052 0.4707 0.1364
12 SERAT 0.0129 0.4836 0.0180
2 . The Conceptual Method
a. The Factor Approach
Although the Factor Approach uses the same tests as
the Comprehensive Method, the number of variables has been
significantly reduced. The Factor Approach uses only seven
ratios. A complete description of the Factor Approach is
found on pages 39 and 40, and a list of the seven ratios can
also be found on page 40.
The first test performed was a pairwise correlation
between the Factor Set Ratios and EVA™ for the years 1983
through 1992. In doing a correlation between the Factor Set
53
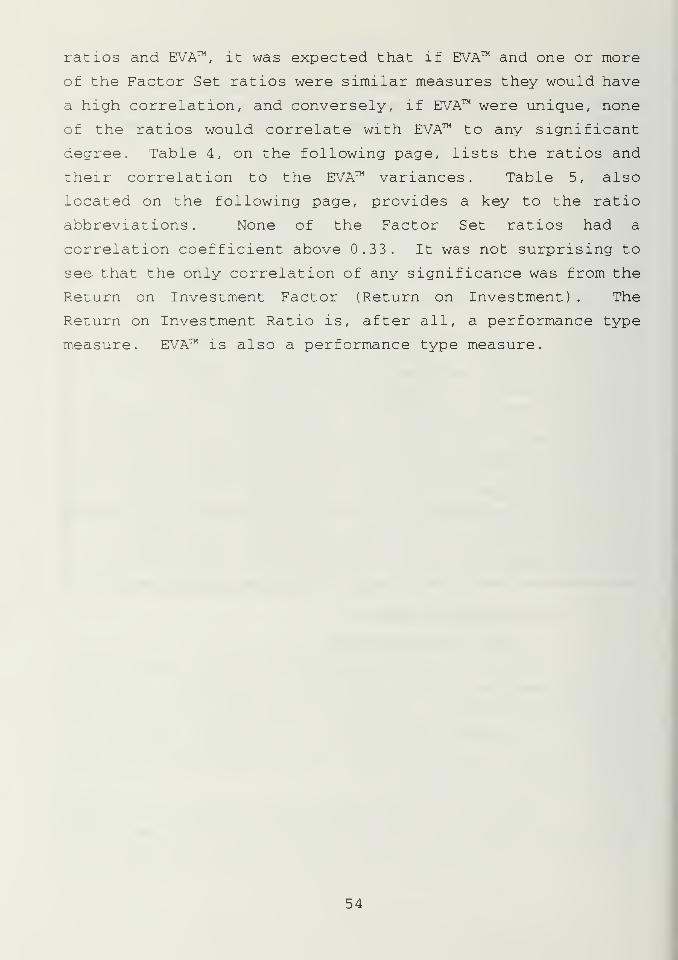
ratios and EVA™, it was expected that if EVA™ and one or more
of the Factor Set ratios were similar measures they would have
a high correlation, and conversely, if EVA™ were unique, none
of the ratios would correlate with EVA™ to any significant
degree. Table 4, on the following page, lists the ratios and
their correlation to the EVA™ variances. Table 5, also
located on the following page, provides a key to the ratio
abbreviations. None of the Factor Set ratios had a
correlation coefficient above 0.33. It was not surprising to
see that the only correlation of any significance was from the
Return on Investment Factor (Return on Investment) . The
Return on Investment Ratio is, after all, a performance type
measure. EVA™ is also a performance type measure.
54

Table 4
EVA™/Factor Set Correlation
RATIO CORRELATION COEFFICIENT
ROI 0.32319
C PTURN 0.13996
FLEVER -0.09689
CURRAT 0.00309
CSHPOS 0.08072
INVTRN 0.05600
RCVTRN 0.00023
Table 5
Factor Set Ratio Abbreviation Definitions
RATIO
ABBREVIATION
RATIO FULL NAME
ROI RETURN ON INVESTMENT RATIO
CPTURN CAPITAL TURNOVER RATIO
FLEVER FINANCIAL LEVERAGE RATIO
CURRAT SHORT-TERM LIQUIDITY RATIO
CSHPOS CASH POSITION RATIO
INVTRN INVENTORY TURNOVER RATIO
RCVTRN RECEIVABLES TURNOVER RATIO
55

The next test used multiple regression in trying to
explain EVA™ with a combination of the Factor Set ratios. The
model had an adjusted R-squared of 0.1762 with a probability
of error of 0.0001. This was the expected result, as only one
of the seven factors measures the same general area of
financial performance, specifically, overall company financial
performance
.
The last set of tests that were run, using the
Factor Set ratios in attempting to answer the primary research
question, involved the use of stepwise regression. In this
procedure the Statistical Analysis System (SAS) program was
permitted to empirically add or remove ratios from the Full
Set in order to most effectively explain the dependent
variable EVA™. Statistically, the stepwise procedure
continued to run as long as the additional variables were a
significant addition to the model used to explain EVA™. (the
cut off for significance was p< = 0.15.) . Table 6 on the
following page summarizes the results of the stepwise
regression procedure. The variable names are in abbreviated
form, Table 5, on the previous page, provides the full names
of the abbreviated ratios. Again, the results come as no
surprise. The Return on Investment Ratio provided the most to
the stepwise regression model, but not enough to bring the
model R-squared any higher than 0.1881.
56
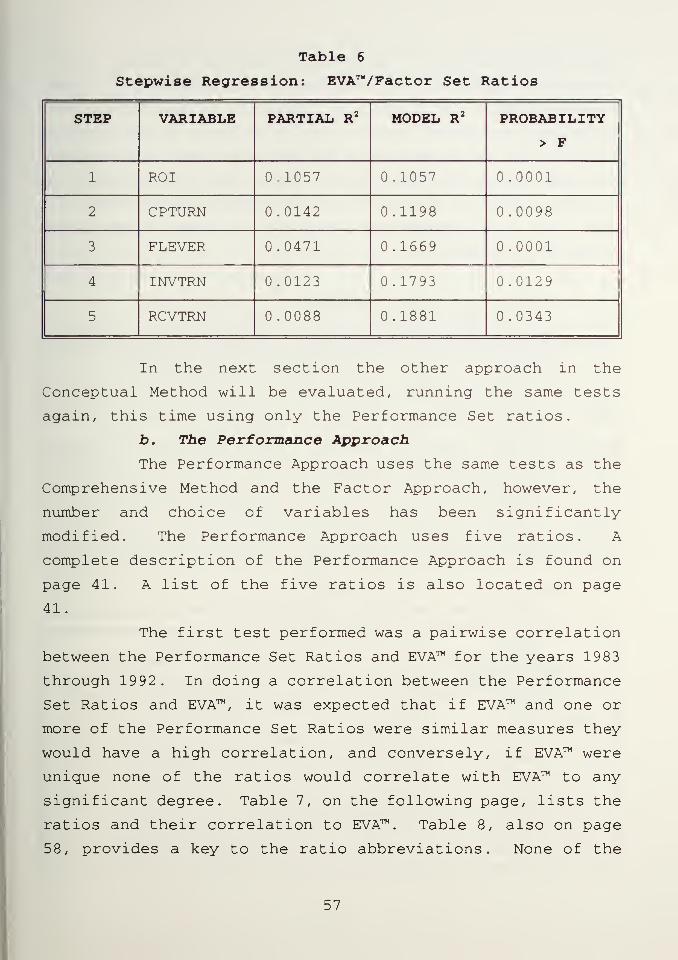
Table 6
Stepwise Regression: EVA™/Factor Set Ratios
STEP VARIABLE PARTIAL R2 MODEL R 2 PROBABILITY
> F
1 ROI 0,1057 0.1057 0.0001
2 CPTURN 0.0142 0.1198 0.0098
3 FLEVER 0.0471 0.1669 0.0001
4 INVTRN 0.0123 0.1793 0.0129
5 RCVTRN 0.0088 0.1881 0.0343
In the next section the other approach in the
Conceptual Method will be evaluated, running the same tests
again, this time using only the Performance Set ratios.
b. The Performance Approach
The Performance Approach uses the same tests as the
Comprehensive Method and the Factor Approach, however, the
number and choice of variables has been significantly
modified. The Performance Approach uses five ratios. A
complete description of the Performance Approach is found on
page 41. A list of the five ratios is also located on page
41.
The first test performed was a pairwise correlation
between the Performance Set Ratios and EVA™ for the years 1983
through 1992. In doing a correlation between the Performance
Set Ratios and EVA™, it was expected that if EVA™ and one or
more of the Performance Set Ratios were similar measures they
would have a high correlation, and conversely, if EVA™ were
unique none of the ratios would correlate with EVA™ to any
significant degree. Table 7, on the following page, lists the
ratios and their correlation to EVA™. Table 8, also on page
58, provides a key to the ratio abbreviations. None of the
57

Performance Set ratios had a correlation coefficient above
0.52. As expected, the Performance Set produced the highest
correlations in the study. The Return on Total Capital Ratio
produced the highest correlation coefficient in the study at
0.52195, the Net Income Ratio the second highest with 0.38687,
and the Return on Total Assets Ratio the third highest at
0.35056. EVA™ is essentially a performance measurement, the
fact that it correlates best with the Performance Set Ratios
comes as no surprise.
Table 7
EVA™/Performance Set Correlation
RATIO CORRELATION COEFFICIENT
ROTA 0.35056
ROE 0.01606
OPRAT 0.09911
NINCR 0.38687
ROTC 0.52195
Table 8
Performance Set Ratio Abbreviation Definitions
RATIO
ABBREVIATION
RATIO FULL NAME
ROTA RETURN ON TOTAL ASSETS RATIO
ROE RETURN ON COMMON EQUITY RATIO
OPRAT OPERATING INCOME RATIO
NINCR NET INCOME RATIO
ROTC RETURN ON TOTAL CAPITAL RATIO
58
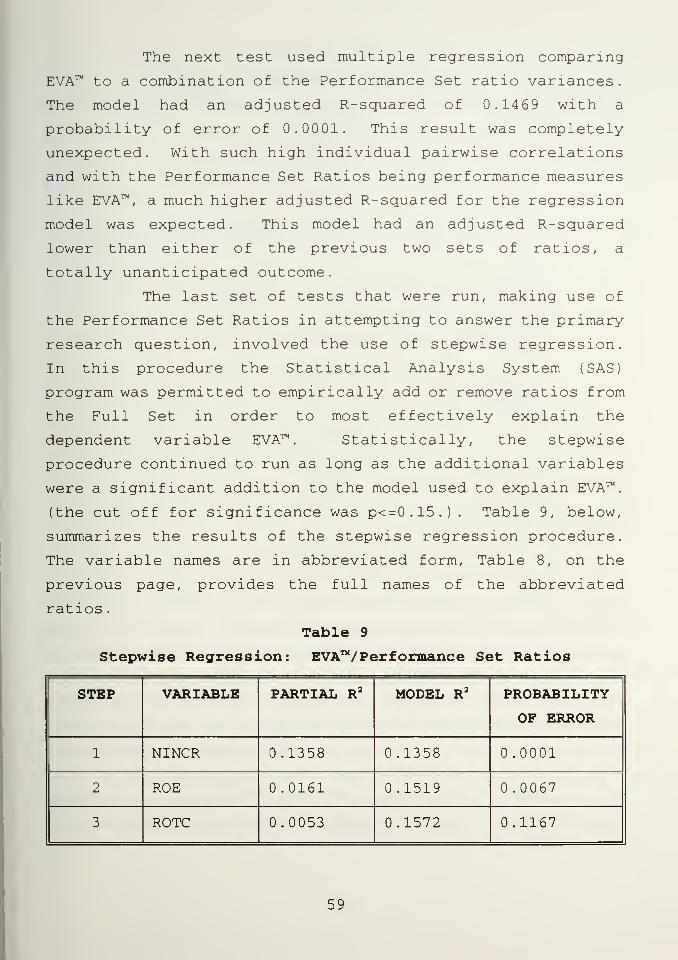
The next test used multiple regression comparing
EVA™ to a combination of the Performance Set ratio variances.
The model had an adjusted R-squared of 0.1469 with a
probability of error of 0.0001. This result was completely
unexpected. With such high individual pairwise correlations
and with the Performance Set Ratios being performance measures
like EVA™, a much higher adjusted R-squared for the regression
model was expected. This model had an adjusted R-squared
lower than either of the previous two sets of ratios, a
totally unanticipated outcome.
The last set of tests that were run, making use of
the Performance Set Ratios in attempting to answer the primary
research question, involved the use of stepwise regression.
In this procedure the Statistical Analysis System (SAS)
program was permitted to empirically add or remove ratios from
the Full Set in order to most effectively explain the
dependent variable EVA™. Statistically, the stepwise
procedure continued to run as long as the additional variables
were a significant addition to the model used to explain EVA™,
(the cut off for significance was p<=0.15.). Table 9, below,
summarizes the results of the stepwise regression procedure.
The variable names are in abbreviated form, Table 8, on the
previous page, provides the full names of the abbreviated
ratios
.
Table 9
Stepwise Regression: EVA™/Performance Set Ratios
STEP VARIABLE PARTIAL R2 MODEL R3 PROBABILITY
OF ERROR
1 NINCR 0.1358 0.1358 0.0001
2 ROE 0.0161 0.1519 0.0067
3 ROTC 0.0053 0.1572 0.1167
59

This outcome came as something of a surprise, as
well. The results from the multiple regression procedure
indicated something like this may occur. However, the
stepwise regression's model R-squared of only 0.1572 was even
lower than the revised (and lowered) expectations.
The next section will examine the findings from the
analysis of the secondary research questions.
B. TESTS TO ANSWER THE SECONDARY RESEARCH QUESTIONS
In this section the five secondary research questions
will be re-examined along with the test results and tests that
were conducted in attempting to answer them.
1. The First and Second Secondary Research Questions
The first of the secondary research questions, "can EVA™
be surrogated by a simple combination of traditional
accounting measures?", is very similar to the primary research
question. It was tested with multiple regression and stepwise
regression using the Comprehensive method, the Factor
Approach, and The Performance Approach. The results of these
tests were described in the preceding sections concerning the
primary research question.
It would be expected that if EVA™ could be surrogated by
a simple combination of traditional accounting measures, then
the multiple or stepwise regression would produce a model with
a high (nearing 1.00) R-squared adjusted. Table 10, on the
following page, summarizes the results. It is interesting to
note that in both stepwise and multiple regression the
Performance Set of ratios was least effective in explaining
EVA™ and the Full Set, with its mixed bag of ratios, was best
in explaining EVA™. Although no combination was particularly
good in explaining EVA™, these results are opposite of what
was expected at the outset of this study, but not totally
surprising; the Full Set sample contains a larger number of
ratios with which to explain EVA™.
60

Table 10
Multiple/Stepwise Regression Summary
MULTIPLE
REGRESSION
VARIABLE SET
ADJUSTED
MODEL R 2 PROB. > F
COMPREHENSIVE SET 0.4589 0.0001
FACTOR SET 0.1762 0.0001
PERFORMANCE SET 0.1469 0.0001
STEPWISE
REGRESSION
VARIABLE SET MODEL R2 PROB. > F
COMPREHENSIVE SET 0.4836 0.0180
FACTOR SET 0.1881 0.0343
PERFORMANCE SET 0.1572 0.1167
The second question of the secondary research questions,
"is EVA™ statistically distinct from traditional accounting
measures or does it show some degree of correlation to one or
more of the traditional accounting measures?", is also very
closely related to the primary research question. It was
examined using correlation and regression results from all
three of the different approaches. As before, the results of
these tests are described in the preceding sections concerning
the primary research question.
If EVA™ were not unique nor statistically distinct from
traditional accounting measures, then one or more of the
accounting measures would correlate very highly (nearing 1.00)
with EVA™. The highest correlation achieved among the Full
61

Set Ratios was 0.33781, the highest correlation found among
the Factor Set Ratios was 0.32319, and the highest correlation
achieved among the Performance Set Ratios was 0.52195. As
stated before, these results were expected. It was further
evidence of the power of EVA™ as a performance measurement
tool. Additionally, if EVA™ were not unique nor statistically
distinct from traditional accounting measures, then the
multiple or stepwise regression would show a model with an R-
squared near 1.00. The stepwise and multiple regression
results are summarized on the previous page. The fact that
none of the three sets of ratios in any combination provided
much of an explanation of EVA™ was not a surprise. However,
the superiority of the Full Set Ratios over the Performance
Set Ratios was unexpected.
2 . The Third and Fourth Secondary Research Questions
Question three asked, "is past EVA™ an effective
predictor of future EVA™?" Question four asked, "given that
a relationship does exist between EVA™ and some accounting
ratios, how effective are those past accounting ratios at
predicting future EVA™?" Lagged correlation and regression,
both multiple and stepwise, were used to examine and evaluate
secondary research question four.
The first step was to correlate current EVA™ measures
with the previous years' EVA™ measures for question three and
with the previous years' traditional accounting measures for
question four. The latter was done for all three ratio sets
(Full, Factor, and Performance). The results of those
correlations are listed in Table 11. The abbreviations are
essentially the same, except that "TM1" has replaced the last
three letters to signify that the ratio is lagged one year.
(The full ratio names for the Full Set Ratios can be found on
pages 50 and 51. Full names for the Factor Set Ratio
abbreviations are located on page 55. Page 58 contains the
Performance Set Ratio abbreviation definitions.)
62

Table 11
Lagged Correlation: All Ratio Sets
RATIO CORRELATION
COEFFICIENT
RATIO CORRELATION
COEFFICIENT
ABSTM1 0.07095 FANTM1 -0.05520
ACTM1 0.18972 SERTM1 0.24600
CURTM1 -0.04095 NWTM1 0.16617
APSTM1 -0.02090 TINTM1 0.15900
ASSATMl -0.26069 CAPTM1 0.02570
BDITM1 0.01326 GMTM1 -0.05393
INTTM1 0.02474 MRORTM1 -0.13171
SALTM1 0.01254 OPPTM1 0.22228
CASTM1 0.00227 NPRTM1 0.19611
CURATM1 0.25388 PRFTM1 0.02220
CLNTM1 -0.25359 OPETM1 -0.06727
CLINTM1 -0.24735 OPRTM1 0.01600
LTLTM1 0.00626 RORATM1 0.24182
INVTM1 0.00761 RORSTM1 0.19593
WCTM1 0.00657 EQTTM1 -0.00273
DEBTM1 -0.11124 ROITM1 0.21073
DETRTM1 -0.12726 CPTTM1 0.15420
DBEQTM1 -0.03819 FLEVTM1 -0.08030
CFLTM1 0.27745 CSHTM1 0.10548
CRATM1 0.09985 INVTRTM1 0.06582
63

RATIO CORRELATION
COEFFICIENT
RATIO CORRELATION
COEFFICIENT
RCVTMl -0.01088 ROTCTM1 0.27050
ROTATM1 0.25456 EVATM1 0.81782
ROETM1 0.00162
NINCTM1 0.20896
Of particular interest is the EVATM1 correlation, as this
gets directly to secondary research question number three.
"Is past EVA™ an effective predictor of future EVA™?" In
order to answer yes to that question the EVA™/EVATM1
correlation should be high. The correlation between current
EVA™ and the EVA™ lagged one year is 0.81782. This is by far
the most statistically significant correlation in the study.
Simple regression revealed similar results. It yielded
a model with an R-squared adjusted of 0.7513 and a probability
of error of 0.0001. This is by far the highest and most
significant R-squared adjusted in the study.
Referring to question four, "given that a relationship
does exist between EVA™ and some accounting ratios, how
effective are those past accounting ratios at predicting
future EVA™?", all other lagged ratios had correlation
coefficients of 0.27745 or less. Given the results from the
previous research questions, showing little correlation
between traditional accounting ratios and EVA™, it came as no
surprise that there was little correlation between past
traditional accounting ratios and current EVA™.
Multiple and stepwise regression rounded out the testing
for question four. Using the Full Set Lagged Ratios, multiple
regression yielded an R-squared adjusted of 0.5009 with a
probability of error of 0.0001 and stepwise regression
64
provided a model with an R-squared of 0.5359 and a probability
of error of 0.0951. Using the Factor Set Lagged Ratios,
multiple regression yielded an R-squared adjusted of 0.1686
with a probability of error of 0.0001 and stepwise regression
provided a model with an R-squared of 0.1975 and a probability
of error of 0.1012. Using the Performance Set Lagged Ratios,
multiple regression yielded an R-squared adjusted of 0.0708
with a probability of error of 0.0001 and stepwise regression
yielded a model with an R-squared of 0.0795 and a probability
of error of 0.0001. These results are consistent with the
findings comparing the current ratio sets (Full, Factor, and
Performance) with current EVA™.
3. The Fifth Secondary Research Question
The fifth, and final, secondary research question asked,
"are there benefits to the U.S. Navy in using EVA™ ratings, in
lieu of the traditional accounting measures now used, to
evaluate potential contractors in Pre-Award Surveys?" This
question was evaluated using all of the data and answers to
the primary research question and all four of the previous
secondary research questions. There is no one single
definitive test that could answer this question. It is a
subjective conclusion, and is supported by the data gathered
in answering the previous questions.
C. SUMMARY
This entire chapter has in itself been a summary.
Specifically, it has been a summary of findings. It has
summarized the primary and secondary research questions, the
tests that were conducted in attempting to answer them along
with their corresponding test results.
The next, and final, chapter (Chapter V) will contain
conclusions drawn from this research and recommendations for
further study in this area.
65

66
V. CONCLUSIONS
In the previous chapters the Background of the EVA™
measure has been discussed and explained, the research
questions that this study addresses have been posed, the
methodology used to administer the tests that were run was
carefully laid out, and in the last chapter (Chapter IV) the
results of the testing were presented. In this chapter the
research questions will be answered based on the findings
presented in Chapter IV, recommendations for further study in
this area will also be presented.
A. THE PRIMARY RESEARCH QUESTION
Is EVA™ unique? The primary research question asked,
"does the EVA™ measure provide information beyond what is
currently available in traditional accounting measures?"
In attempting to answer this question, three approaches, the
Comprehensive Method, the Factor Approach (Conceptual Method),
and the Performance Approach (Conceptual Method), were used.
All three approaches were described in the previous chapter.
The first test performed was a pairwise correlation
between the Full Set Ratios and EVA™ for the years 1983
through 1992. It was expected that if EVA™ and one or more of
the Full Set ratios were similar measures they would have a
high (approaching 1.00) correlation, and conversely, if EVA™
were unique none of the ratios would correlate with EVA™ to
any significant degree. None of the Full Set Ratios had a
correlation coefficient above 0.34. Table 1, on page 49,
lists the ratios and their correlation to EVA™.
The next test performed was a pairwise correlation
between the Factor Set Ratios and EVA™ for the years 1983
through 1992. None of the Factor Set ratios had a correlation
coefficient above 0.33. Table 4, page 55, lists the ratios
and their correlation to EVA™.
67
The last correlation performed was a pairwise correlation
between the Performance Set Ratios and EVA™ for the same
years. None of the Performance Set ratios had a correlation
coefficient above 0.52. Table 7, on page 58, lists the ratios
and their correlation to EVA™.
Based on the pairwise correlation test results it is my
preliminary conclusion that EVA™ is unique and does provide
information beyond the accounting ratios to which it was
compared. None of the ratios tested had a correlation
coefficient higher than 0.52. This indicates that the best
comparable ratio could explain only 27% of EVA™ (i.e.
providing the same or similar information) . Simply put, EVA™
supplies 73% different information than the best comparable
traditional accounting ratio.
To test if some combination of the sample accounting
ratios could collectively explain EVA™, a series of slightly
more aggressive tests were run. Again, the same set of ratios
were utilized and the tests conducted in the same order
(Comprehensive, Factor, then Performance) . The first test
performed was multiple regression, attempting to explain EVA™
with a combination of the Full Set ratios. The model had an
adjusted R-squared of 0.4589 with a probability of error of
0.0001. The next test used multiple regression attempting to
explain EVA™ with a combination of the Factor Set ratios. The
model had an adjusted R-squared of 0.1762 with a probability
of error of 0.0001. The final test using multiple regression
to explain EVA™ used a combination of the Performance Set
ratios. The model had an adjusted R-squared of 0.1469 with a
probability of error of 0.0001.
The last set of tests that were run attempting to answer
the primary research question, involved the use of stepwise
regression. In this procedure the regression program was
permitted to empirically add or remove ratios from the Full
Set in order to most effectively explain the dependent
68
variable EVA™. Statistically, the stepwise procedure
continued to run as long as the additional variables were a
significant addition to the model used to explain EVA™. (the
cut off for significance was p< = 0.15.) . Table 3 on page 53
summarizes the results of the stepwise regression procedure
for the Full Set Ratios. The model produced using stepwise
regression and the Full Set Ratios had 12 variables, an R-
squared of 0.4836 and a probability of error of 0.0180. The
next tests that were run, used the Factor Set ratios and
stepwise regression. Table 6 on page 57 summarizes the
results of the stepwise regression procedure for the Factor
Set. The model produced using stepwise regression and the
Factor Set Ratios had 5 variables, an R-squared of 0.1881 and
a probability of error of 0.0343. The last tests that were
run, used the Performance Set ratios and stepwise regression.
Table 9, page 59, summarizes the results of the procedure.
The model produced using stepwise regression and the
Performance Set Ratios had 3 variables, an R-squared of 0.1572
and a probability of error of 0.1167.
Given the low R-squared values and the increased
probability of errors, it appears that no combination of
traditional accounting ratios can adequately explain EVA™.
This evidence, coupled with the correlation findings, leads to
the conclusion that EVA™ is unique and does provide
information that is different from what is currently available
in traditional accounting measures.
B. SECONDARY RESEARCH QUESTIONS ONE AND TWO
The first question of the secondary research questions,
"can EVA™ be surrogated by a simple combination of traditional
accounting measures?", is very similar to the primary research
question. It was tested with multiple regression and stepwise
69
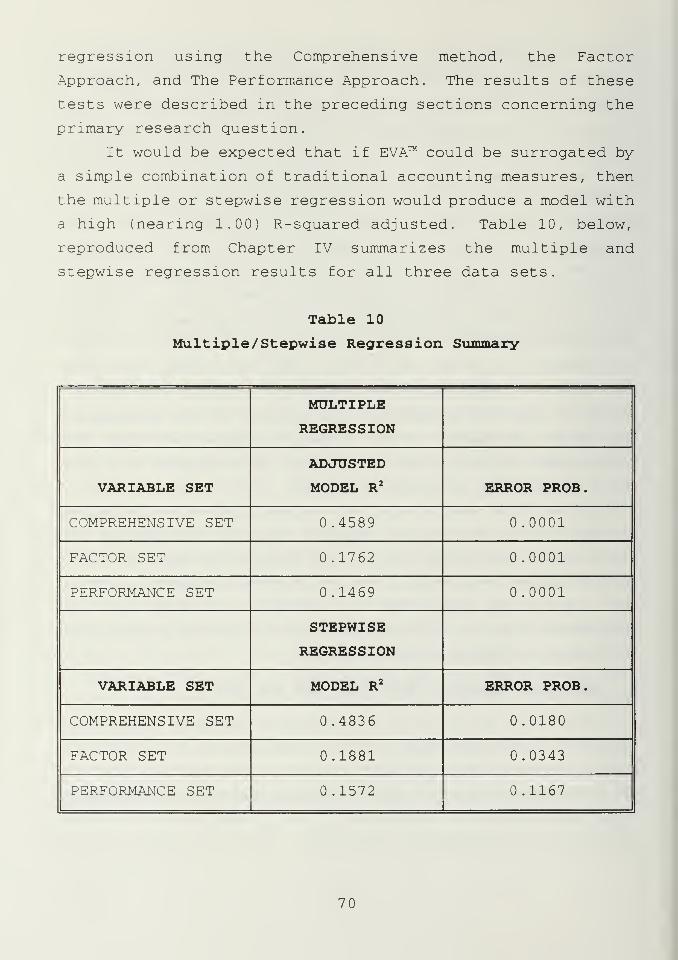
regression using the Comprehensive method, the Factor
Approach, and The Performance Approach. The results of these
tests were described in the preceding sections concerning the
primary research question.
It would be expected that if EVA™ could be surrogated by
a simple combination of traditional accounting measures, then
the multiple or stepwise regression would produce a model with
a high (nearing 1.00) R-squared adjusted. Table 10, below,
reproduced from Chapter IV summarizes the multiple and
stepwise regression results for all three data sets.
Table 10
Multiple/Stepwise Regression Summary
MULTIPLE
REGRESSION
VARIABLE SET
ADJUSTED
MODEL R2 ERROR PROB.
COMPREHENSIVE SET 0.4589 0.0001
FACTOR SET .1762 0.0001
PERFORMANCE SET 0.1469 0.0001
STEPWISE
REGRESSION
VARIABLE SET MODEL R2 ERROR PROB.
COMPREHENSIVE SET 0.4836 0.0180
FACTOR SET 0.1881 0.0343
PERFORMANCE SET 0.1572 0.1167
70

Clearly, no combination of traditional accounting
measures can explain the year to year EVA™ variances. The
best Combination of Variables yields an R-squared of only
0.4836 and that model has a relatively high probability of
error at 0.0180.
The second question of the secondary research questions,
"is EVA™ statistically distinct from traditional accounting
measures or does it show some degree of correlation to one or
more of the traditional accounting measures?", is also very
closely related to the primary research question. It was
examined using correlation and regression results using all
three of the ratio sets. As before, the results of these
tests were described in the preceding sections concerning the
primary research question.
If EVA™ were not unique nor statistically distinct from
traditional accounting measures, then one or more of the
accounting measures' variances would correlate very highly
(nearing 1.00) with the variances of EVA™. They did not. The
highest correlation achieved among the Full Set Ratios was
0.33781, the highest correlation found among the Factor Set
Ratios was 0.32319, and the highest correlation achieved among
the Performance Set Ratios (and not surprisingly the highest
in the study - as EVA™ i_s a performance measure) was 0.52195.
Furthermore, if EVA™ were not unique nor statistically
distinct from traditional accounting measures, then the
multiple or stepwise regression would show a model with an R-
squared near 1.00. Again, they were not even close. The
stepwise and multiple regression results were summarized on
the previous page.
Given the evidence, it is my conclusion that EVA™ cannot
be surrogated by a simple combination of traditional
accounting measures. Additionally, I believe the evidence
supports the conclusion that EVA™ is statistically distinct
from traditional accounting measures.
71

C. SECONDARY RESEARCH QUESTIONS THREE AND FOUR
Secondary research question three asked, "is past EVA™ an
effective predictor of future EVA™?" Question four asked,
"given that a relationship does exist between EVA™ and some
accounting ratios, how effective are those past accounting
ratios at predicting future EVA™?" Lagged regression was used
to answer question three and lagged correlation and
regression, both multiple and stepwise, were used to examine
and evaluate question four.
The first step was to correlate current EVA™ measures
with the previous years' EVA™ measures for question three.
Current EVA™ measures were also correlated with the previous
years' traditional accounting measures for question four, for
all three ratio sets (Full, Factor, and Performance). The
results of that correlation are listed in Table 11, pages 63
and 64.
The most revealing statistic was the EVATM1 correlation,
as this gets directly to the answer for secondary research
question number three. "Is past EVA™ an effective predictor
of future EVA™?" In order to answer yes to that question the
EVA™/EVATM1 correlation should be high (near 1.00). The
between current EVA™ and EVA™ lagged one year yielded a
correlation coefficient of 0.81782. This was by far the
highest and most statistically significant correlation in the
study.
Simple regression revealed similar results. It yielded
a model with an R-squared adjusted of 0.7513 and a probability
of error of 0.0001. This was also the highest R-squared
adjusted in the study. Given the high correlation combined
with the regression procedure findings, my conclusion is that,
yes, past EVA™ exhibits some value in predicting future EVA™.
Looking back, question four was, "given that a
relationship does exist between EVA™ and some accounting
72
ratios, how effective are those past accounting ratios at
predicting future EVA™?". The results of the pairwise
correlation tests showed that all lagged ratios had
correlation coefficients of 0.27745 or less. Multiple and
stepwise regression were used to complete the testing for
question four. Using the Full Set Lagged Ratios, multiple
regression yielded an R-squared adjusted of 0.5009 with a
probability of error of 0.0001 and stepwise regression
provided a model with an R-squared of 0.5359 and a probability
of error of 0.0951. Using the Factor Set Lagged Ratios,
multiple regression provided an R-squared adjusted of 0.1686
with a probability of error of 0.0001 and stepwise regression
provided a model with an R-squared of 0.1975 and a probability
of error of 0.1012. Using the Performance Set Lagged Ratios,
multiple regression yielded an R-squared adjusted of 0.0708
with a probability of error of 0.0001 and stepwise regression
yielded a model with an R-squared of 0.0795 and a probability
of error of 0.0001. The low correlation values in conjunction
with the regression findings indicate that little relationship
exists between past account ratios and EVA™. Therefore, it is
my conclusion that past accounting ratios are ineffective in
attempting to predict future EVA™.
D. SECONDARY RESEARCH QUESTION FIVE
The fifth, and final, secondary research question asked,
"are there benefits to the U.S. Navy in using EVA™ ratings, in
lieu of the traditional accounting measures now used, to
evaluate potential contractors in Pre-Award Surveys?" This
question was evaluated using all of the data and answers to
the primary research question and all four of the previous
secondary research questions. There is no one single
definitive test that could answer this question. It is a
subjective conclusion, and is supported by the data gathered
73
in answering the previous questions.
My conclusion is a qualified maybe. The research
conducted in this study does not lend itself to a direct
answer to this question. EVA™ appears to be a unique and
statistically distinct measure. However, this study did not
address how well EVA™ measures what it is intended to measure.
Had traditional accounting ratios adequately explained EVA™,
then it could be concluded that EVA™ has little added value.
However, traditional accounting ratios did not adequately
explain EVA™. Therefore it is safe to conclude that EVA™ may
be of potential value to the Navy. The findings in this study
were sufficient to establish that EVA™ is a unique and
statistically distinct measure, but were not sufficient to
conclude that EVA™ is valuable in any specific decision
context
.
E. RECOMMENDATION FOR FURTHER RESEARCH
This thesis broke the ground for Navy research in the
area of EVA™. It was, however, not a comprehensive evaluation
of EVA™. Areas in the EVA™ field that I feel would benefit
from further research are as follows:
An evaluation of EVA™ in predicting corporate
performance, both as a predictor of success and of
failure
.
• A further comparison of EVA™ with a greater number of
traditional accounting ratios (including Earnings Per
Share)
.
• An evaluation of MVA™ in predicting corporate
performance, both as a predictor of success and of
failure
.
74

F. SUMMARY
In this thesis one primary research question and five
secondary research questions were posed and answered. In
Chapter II an in depth background and thorough explanation of
EVA™ was given. A review of the current literature about the
EVA™ measure was presented. The methodology and tests of
association designed to answer the six research questions were
laid out in Chapter III. The tests were conducted and the
results and analysis were presented in Chapter IV. This
chapter (Chapter V) presented the conclusions drawn from this
study. A summary of the research questions and conclusions
follows
:
• The primary research question. Does the EVA™ measure
provide information beyond what is currently available in
traditional accounting measures? Answer: Yes, EVA™
appears to provide information not found in traditional
accounting ratios.
• The first secondary research question. Can EVA™ be
surrogated by a simple combination of traditional
accounting measures. Answer: No. EVA™ cannot be
surrogated by a simple combination of traditional
accounting measures.
• The second secondary research question. Is EVA™
statistically distinct from traditional accounting
measures or does it show some degree of correlation to
one or more of the traditional accounting measures?
Answer: Yes. It is statistically distinct. No, it does
not show a significant degree of correlation to any
traditional accounting measures.
75

The third secondary research question. Assuming EVA™
does measure some ultimate success criterion, thus making
it a plausible objective of any firm to maximize EVA™,
are past EVA™ ratings an effective predictor of future
performance/EVA™ ratings. Answer: Yes. Past EVA™
ratings appear to be an effective predictor of future
EVA™ ratings.
The fourth secondary research question. Assuming EVA™
does measure some ultimate success criterion, thus making
it a plausible objective of any firm to maximize EVA™, do
past accounting ratios/measures predict future EVA™
ratings. Answer: No. There is very little correlation
between any accounting measure, past or current, and
EVA™.
The fifth, and final, secondary research question. Are
there benefits to the U.S. Navy in using EVA™ ratings, in
lieu of the traditional accounting measures now used, to
evaluate potential contractors in Pre-Award Surveys?
Answer: Maybe. The research in this thesis did not
address the effectiveness of the EVA™ measure directly.
However, the finding that EVA™ contains information not
found in traditional accounting ratios is a necessary
condition for EVA™ to have potential value in DOD
financial analysis applications.
76

APPENDIX A. GURSOY'S SAMPLE AND DATA METHODOLOGY
SAMPLE FIRMS This study focused on the years from 1983
to 1992. This time span was chosen to assess whether the
financial characteristics of the defense industry ratios
changed during a period when the environment of the industry
clearly did change. Since the defense industry experienced
both economic stress and defense budget reductions during that
time span, it seemed reasonable to use financial data for that
ten year time period.
Data for 50 defense related firms was collected in order
to represent the overall industry. In order to identify
members of the defense industry, DOD contractors were
examined. Companies were selected from among the top 100
defense contractors to U.S. government listed in the "Top 100
Prime Defense Department Contractors for FY 1990." (Source:
Directorate for Information Operations and Reports, Department
of Defense, Released 1991) Two criteria were considered in
choosing a representative sample: size and diversity. The
largest DoD contractors were selected, as measured by total
assets and net contract value. And firms were selected to
represent diverse industry sectors (or subindustries) within
the broad area of defense contracting.
77

78

APPENDIX B. ACCOUNTING FORMULAE AND RATIO ASSUMPTIONS
Certain assumptions were necessary in computing the
ratios given the limitations of the databases used in this
study. The assumptions made in computing certain accounting
formulas and ratios are as follows:
1 . Year end inventory was used for both inventory andaverage inventory.
2
.
Total capital was defined to equal the sum of long termdebt and total shareholders' equity.
3
.
Total current debt was defined as total currentliabilities less the sum of accounts payable and accruedexpenses
.
4. Common equity was defined to equal total shareholders'equity less the sum of retained earnings and preferredshares
.
5. Tangible net worth was defined as the sum of total assetsless total liabilities and retained earnings lesspreferred shares
.
6. Gross margin was defined to be net sales less cost ofgoods sold.
7
.
Operating income was defined as gross margin lessoperating expenses.
8. Net working capital was defined as current assets lesscurrent liabilities.
9. Earnings before taxes (EBT) was assumed to be the same asearnings before interest and taxes (EBIT)
.
10. Year end total assets were used for both total assets andaverage total assets.
11. Quick assets was defined as the sum of cash, marketablesecurities, and receivables.
79

80

LIST OF REFERENCES
1. Stewart, G. Bennett III, The Quest for Value: A Guide
for Senior Managers, HarperCollins , Publishers Inc . , 1990.
2. Modigliani , F . & Miller, M., Dividend Policy, Growth and
the Valuation of Shares, Journal of Business, October
1961.
3
.
Smith, Sarah, The Best and Worst Performers in Corporate
America, Corporate Finance magazine, March 1991.
4. Jensen, Michael C, THE MARKET FOR CORPORATE CONTROL The
Scientific Evidence, Journal of Financial Economics,
April 1983.
5. Jensen, Michael C, Takeovers: folklore and science,
Harvard Business Review, November - December 1984.
6. Jensen, Michael C., The Takeover Controversy: Analysis
and Evidence, Midland Corporate Finance Journal, Summer
1986 (Revised April 1988)
.
7. Jensen, Michael C., Eclipse of the Public Corporation,
Harvard Business Review, September - October 1989.
8. Jensen, Michael C, Agency Costs of Free Cash Flow,
Corporate Finance, and Takeovers, American Economic
Review, May 1986 (Revised 6/5/91) .
9. Jensen, Michael C., The Modern Industrial Revolution,
Exit, and the Failure of Internal Control Systems, The
Journal of Finance, July 1993 (Revised 6/16/94)
.

10. McWilliams, Brian, CREATING VALUE, Enterprise
magazine, April 1993.
11. O'Byrne, Stephen F,, EVA™, Management Compensation, and
Shareholder Return, Directorship magazine, September
1994.
12. McConville, Daniel J., ALL ABOUT EVA, Industry Week,
April 18, 1994.
13. Tully, Shawn, The Real Key to CREATING WEALTH, Fortune
magazine, September 20, 1993.
14. Walbert, Laura R., AMERICA'S BEST WEALTH CREATORS,
Fortune magazine, December 27, 1993.
15. Stewart, G. Bennett III, EVA™ : FACT AND FANTASY, Journal
of Applied Corporate Finance, Summer 1994.
16. Stewart, G. Bennett III, REFORM YOUR GOVERNANCE FROM
WITHIN, forthcoming in Directors & Boards, No Date.
17. Finegan, Patrick T., MAXIMIZING SHAREHOLDER VALUE AT THE
PRIVATE COMPANY, Journal of Applied Corporate Finance,
Summer, 19 91.
18. Gursoy, G ., CAPT, TURKISH ARMY, Financial Ratio Patterns in
the United States Defense Industry, Graduate Paper ,
December 1994.
19. Defense Contract Management Command, Contract Management
Financial Services, Guide to Analysis of Financial
Capabilities for Preaward and Postaward Reviews, Defense
Contract Management Command, November 1992.
82
20. Chen, Kung,H. and Shimerda, Thomas A., An Empirical
Analysis of Useful Financial Ratios, Financial
Management, Spring 1981..
21. Stern Stewart Management Services, The Stern Stewart
PERFORMANCE 1000 The Definitive Guide to MVA and EVA"",
Stern Stewart Management Services, 1993.
22. Pinches, George E., Mingo, Kent A., and Caruthers, J.
Kent, THE STABILITY OF FINANCIAL PATTERNS IN INDUSTRIAL
ORGANIZATIONS, The Journal of Finance, May 1973.
23. Naval Supply Systems Command, Most .Recent 100 Contractors
Who Have Terminated for Default. Fiscal Years 1994 (OCT-
AUG) , 1993 (OCT-SEP) , 1992 (OCT-SEP) , Naval Supply Systems
Command, Contracting Management Directorate, Strategic
Planning & Automation Division, September 16, 1994.
83

84

INITIAL DISTRIBUTION LIST
1 . Defense Technical Information Center ,2
Cameron StationAlexandria, VA 22304-6145
2 . Library, Code 52 2
Naval Postgraduate SchoolMonterey, CA 93943-5101
3 . Dr . . Douglas Moses , Code SM/MO 1
Department of Systems ManagementNaval Postgraduate SchoolMonterey, CA 93943-5000
4 . LT William E. Bailey II, SC, USN . . .15529 20th AvenueSacramento, CA 95820
5 . Stern Stewart Management Services 1
40 West 57th StreetNew York, NY 10019
6 . CDR Neil Sieden, SC, USN 1
DRMI Code 64SeNaval Postgraduate SchoolMonterey, CA 93943-5201