Embed Size (px)
Citation preview
1
An Analysis of Double Taxation Treaties and their Effect on Foreign
Direct Investment.
Paul L. Baker*
University of Cambridge
Draft Version_23 May 2012 (Web Appendix Attached)
Abstract
Double taxation treaties are intended to eliminate double taxation, thereby encouraging FDI, and
prevent tax evasion, which previous literature argues will have a negative effect on FDI. Using a
segmented data set and matching econometrics, I show that double taxation treaties have no effect on
FDI from developed to less developed countries and substantiate why: Developed countries
unilaterally provide for the relief of double taxation and the prevention of fiscal evasion regardless of
the treaty status of a Host country. This eliminates the key economic benefit and risk that the treaties
would otherwise create for multinational enterprises’ FDI location decisions.
Keywords: double taxation treaties, foreign direct investment, multinational enterprises
JEL Classification: F21, F23, H25, H87
* Faculty of Economics, University of Cambridge, Austin Robinson Building, Sidgwick Avenue, Cambridge,
England, CB3 9DD (email:[email protected]). I wish to thank my supervisor Dr. Tom Crossley and research
advisor Dr. Toke Aidt for invaluable feedback as well as Manasa Patnam and the Applied Microeconomics
workshop participants for helpful comments. Any remaining errors are my own.
2
1. Introduction
Double taxation is the levying of taxes on the same income (or capital) of the same taxpayer
in the same period across two jurisdictions. In the introduction to its model tax convention, the OECD
emphasises the harmful effects that double taxation has on the movement of capital and other factors
in the development of inter-country economic relations, (OECD, 2010a). Because of these harmful
effects the OECD developed a model1 for country-pairs to use in negotiating double taxation treaties
(DTTs) to eliminate the problem of double taxation. The model convention seeks to do this by
harmonising tax definitions, defining taxable bases, assigning taxation jurisdictions, and indicating the
mechanisms to be used to remove double taxation when it arises. A second purpose of DTTs is to
prevent tax evasion. Therefore, the model convention also includes articles with respect to cross-
border transactions between associated enterprises, information-sharing between the contracting
states, and restricting access to treaty benefits to residents of the of the contracting states
Although DTTs are not a new concept, with many OECD countries having entered into them
with each other in the 1950’s to 1970’s, 60% of today’s 2,976 DTTs (UNCTAD, 2011) have been
entered into over the last 20 years, (see Figure 1, Appendix 1). This surge in DTTs includes a
significant expansion of treaties involving developing and transitioning economies, where, as of 2008
more than 50% of DTTs are between a developed country and either a developing or transitioning
economy, (UNCTAD, 2009). Over the same period, there has also been a surge in global foreign
direct investment (FDI2) flows with both developed and less developed countries (LDCs
3)
experiencing significant inward increases. However, as a source of FDI, developed countries continue
to significantly dominate, (see Figures 2 and 3, Appendix 1). It is this non-reciprocal relationship that
makes the issue of DTTs between developed countries and LDCs particularly interesting. Not only are
LDCs in need of foreign private capital, (UN, 2001), but, by entering into the DTT to attract FDI they
typically make source taxation concessions that can impose a significant cost on the LDC in terms of
lost tax revenue. Country-pairs with largely reciprocal FDI flows do not incur this cost because the tax
1 The OECD’s project on alleviating double taxation can be traced back to its 1963 “Draft Double Taxation
Convention on Income and Capital”, (OECD, 2010a). 2 The International Monetary Fund defines FDI as an international investment with a long term horizon and
significant influence over the management of the operation, (IMF, 1993). 3 I use this term to capture both developing and transitioning economies.
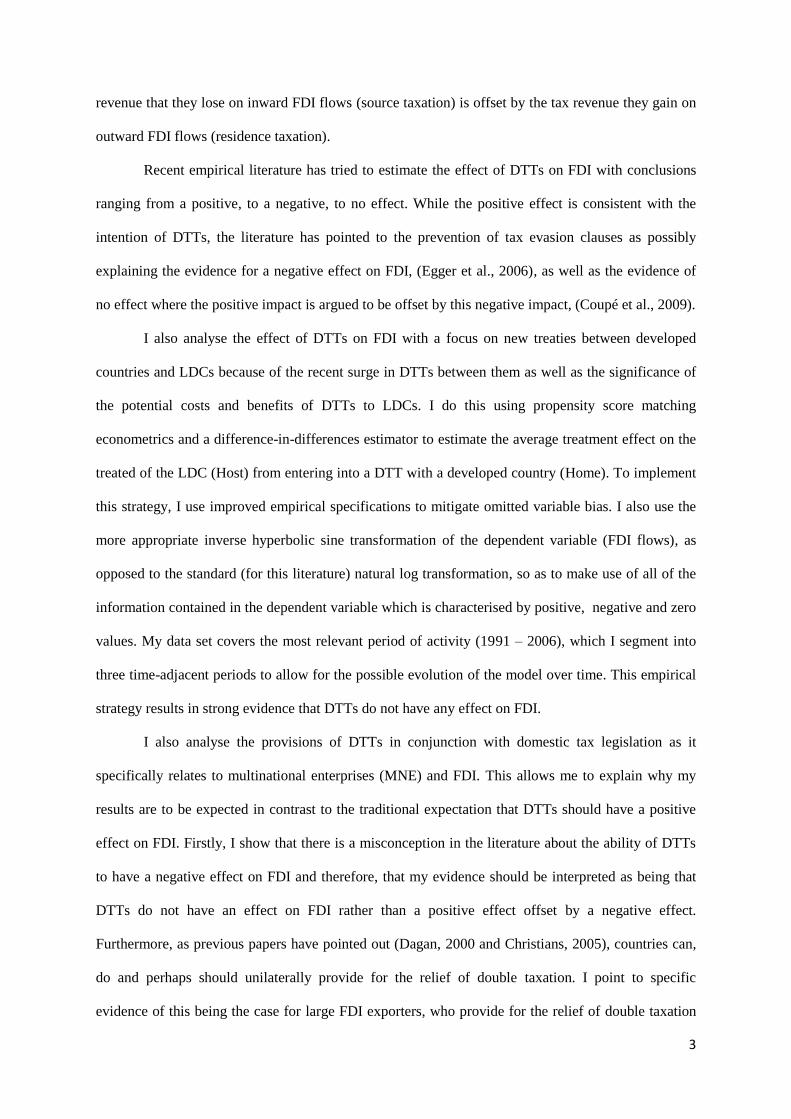
3
revenue that they lose on inward FDI flows (source taxation) is offset by the tax revenue they gain on
outward FDI flows (residence taxation).
Recent empirical literature has tried to estimate the effect of DTTs on FDI with conclusions
ranging from a positive, to a negative, to no effect. While the positive effect is consistent with the
intention of DTTs, the literature has pointed to the prevention of tax evasion clauses as possibly
explaining the evidence for a negative effect on FDI, (Egger et al., 2006), as well as the evidence of
no effect where the positive impact is argued to be offset by this negative impact, (Coupé et al., 2009).
I also analyse the effect of DTTs on FDI with a focus on new treaties between developed
countries and LDCs because of the recent surge in DTTs between them as well as the significance of
the potential costs and benefits of DTTs to LDCs. I do this using propensity score matching
econometrics and a difference-in-differences estimator to estimate the average treatment effect on the
treated of the LDC (Host) from entering into a DTT with a developed country (Home). To implement
this strategy, I use improved empirical specifications to mitigate omitted variable bias. I also use the
more appropriate inverse hyperbolic sine transformation of the dependent variable (FDI flows), as
opposed to the standard (for this literature) natural log transformation, so as to make use of all of the
information contained in the dependent variable which is characterised by positive, negative and zero
values. My data set covers the most relevant period of activity (1991 – 2006), which I segment into
three time-adjacent periods to allow for the possible evolution of the model over time. This empirical
strategy results in strong evidence that DTTs do not have any effect on FDI.
I also analyse the provisions of DTTs in conjunction with domestic tax legislation as it
specifically relates to multinational enterprises (MNE) and FDI. This allows me to explain why my
results are to be expected in contrast to the traditional expectation that DTTs should have a positive
effect on FDI. Firstly, I show that there is a misconception in the literature about the ability of DTTs
to have a negative effect on FDI and therefore, that my evidence should be interpreted as being that
DTTs do not have an effect on FDI rather than a positive effect offset by a negative effect.
Furthermore, as previous papers have pointed out (Dagan, 2000 and Christians, 2005), countries can,
do and perhaps should unilaterally provide for the relief of double taxation. I point to specific
evidence of this being the case for large FDI exporters, who provide for the relief of double taxation
4
regardless of whether the MNE is operating in a treaty-partner country or not. This removes the key
economic benefit attributed to DTTs that is expected to influence MNEs to invest in a treaty-partner
country, and, therefore explains why DTTs do not have a positive impact on FDI.
The paper proceeds as follows: Section 2 provides the background on DTTs and analyses
their potential to affect MNEs and their FDI location decisions. Section 3 reviews the literature,
Section 4 outlines my empirical strategy and Section 5 discusses the data. Section 6 presents the
results, including a qualitative analysis in support of the empirical evidence and Section 7 concludes.
2. Background
As effectively stated in its introduction, the main purpose of the OECD Model Tax
Convention on Income and on Capital4 is to eliminate double taxation, (OECD, 2010a). DTTs aim to
achieve this through tax definitions, the allocation of taxing rights to the respective states, and
mechanisms to alleviate any double taxation that would otherwise arise in a contracting state.
In particular, DTTs define a fixed place of business that undertakes active5 business to be a
Permanent Establishment. This is a key definition as the treaty establishes the taxing rights of the Host
country to be over the business profits attributable to a Permanent Establishment located within its
borders, (source taxation). The DTT also provides that the Home country must either exempt such
income from taxation (residence taxation) or provide a foreign tax credit for the Host taxes paid
against Home taxes otherwise payable (whichever is less). DTTs also provide for the allocation of
taxing rights over passive income, (dividends, interest and royalties). The OECD model states that
passive income is taxable in the Home country but, still provides for limited source taxation by
capping the Host’s withholding tax rates at: 5% on intercompany dividends6, 10% on interest
payments and 0% on royalties. The contracting states are of course free to negotiate whatever caps
they want, which in cases can be either higher or lower than these amounts.
4 This paper focuses on the OECD model as it is the dominant one in use for the negotiation of DTTs between
countries. The other prominent model, the “United Nations Model Double Taxation Convention between
Developed and Developing Countries” (UN, 2001), has significant components of the OECD model
incorporated into it (OECD, 2010a). Furthermore, I focus on the income-related articles of DTTs, although, they
typically also contain comparable articles on the taxation of capital. 5 This is as opposed to passive business activities such as being of a preparatory or ancillary nature, (e.g. a
warehouse purely for the purpose of storing or displaying goods). 6 For ownership ≥ 25% of the payer’s capital, otherwise a 15% rate applies
5
The second stated purpose of DTTs is the prevention of fiscal evasion. The OECD model
provides the sharing of information between the contracting states to assist the respective tax
authorities in enforcing domestic tax provisions7. Furthermore, DTTs contain clauses with respect to
Associated Enterprises’8 cross-border activity and their need to transact in accordance with the ‘arm’s
length’ principle, (i.e. as if they were independent entities). If this is not the case, the DTT indicates
that any profits that were under-accrued for an enterprise because of this association may be included
in its income and taxed thereon by the relevant state. This is effectively referring to issues of transfer
pricing and the shifting of income from higher to lower tax jurisdictions.
2.1. Why do LDCs enter into Double Taxation Treaties with Developed Countries?
The primary purpose is of course to eliminate double taxation, which the OECD highlights as
being an important obstacle to FDI, (OECD, 2010a). A treaty also mitigates uncertainty for the
foreign investor as to how the overseas profits will be taxed as earned and repatriated, (Neumayer,
2007). DTTs may also act as a signal of a commitment to a favourable foreign investment
environment (Christians, 2005). Taken together, if these attributes increase FDI, the LDC will enjoy
the traditional benefits attributed to it, (knowledge and technology spillovers, etc.). The LDC will also
enjoy an increased tax base and therefore, tax revenue (business profits and withholding taxes).
However, there are significant costs to the LDC from entering into a DTT. The costs that are
common to LDCs and developed countries are from effecting the treaty itself. DTTs can take years to
negotiate, and are sometimes even abandoned before the treaty is signed. Once it is signed it still
needs to be ratified in the respective countries before it is actually effective, a process that can take
another two to three years, or even longer and in some cases if at all. A cost that is particular to LDCs
and their DTTs with developed countries is due to the negotiated reduction in withholding tax rates.
Net FDI flows between developed countries and LDCs are largely unilateral in that the outward FDI
flowing from the developed country to the LDC far outweighs any inward FDI flows from the LDC to
the developed country. Therefore, although the negotiated reduction in withholding tax rates applies
equally to both contracting states, the LDC is agreeing to a much greater reduction in potential
7 The OECD Model also contains an article for the mutual assistance in collecting tax revenues.
8 Enterprises that are effectively directly or indirectly under common control and / or management.
6
withholding tax revenue9. Therefore, the LDC enters into DTTs with developed countries at
significant cost in the hopes of attracting increased FDI flows and the benefits they bring.
2.2 Why do Developed countries enter into Double Taxation Treaties with LDCs?
At face value, developed countries also enter into DTTs with LDCs to eliminate double
taxation. This benefits the developed country’s MNEs by preventing them from being at a competitive
disadvantage due to excessive tax costs. It also opens the door to foreign investment opportunities to
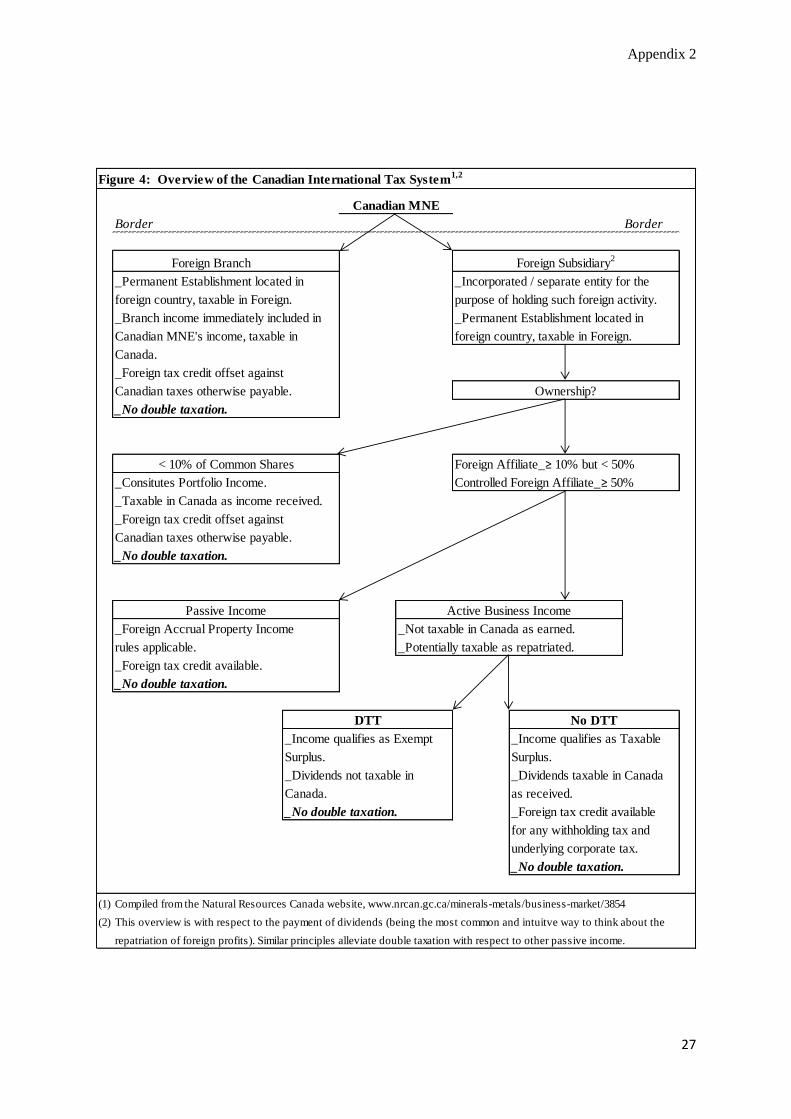
the benefit of both the MNEs and the LDC recipients. However, DTTs are not actually needed to
accomplish this, as double taxation can just as easily be eliminated unilaterally, (Dagan 2000,
Christians, 2005). Arguably, it is even easier to do so unilaterally as it does not require the negotiation
of an international treaty, (Dagan, 2000). See Figure 4 (Appendix 2) for an overview of the Canadian
international tax system and the way that it prevents double taxation regardless of the type of income,
ownership structure, or treaty status of the Host country10
.
Given that double taxation can be eliminated without a DTT, two schools of thought have
emerged in the literature to explain why (developed) countries actually enter into DTTs11
:
i. To prevent tax evasion.
This is true but, only to a point, and importantly, not to the effect that subscribers to this
school of thought suggest: by preventing the ability to evade tax, this causes MNEs to choose not to
invest in the treaty Host country thereby triggering a negative effect on FDI.
The argument is often made (e.g. Egger et al., 2006) with respect to the OECD model treaty
articles (in particular, Article 9 for Associated Enterprises, see OECD (2010a)) that reference the
ability of a contracting state to adjust the profits of an enterprise that transacted with an associated
enterprise in the other state at amounts other than they would have if the enterprises were independent
of one another. This reference ties in to another OECD project, “Transfer Pricing Guidelines for
9 This is in contrast to DTTs between developed countries where FDI flows are largely reciprocal such that the
reduction in withholding tax rates with respect to source taxation of passive income is offset by the increase in
the resident taxation of passive income. 10
This is a particularly good example as this system uses both mechanisms referred to in the OECD model for
eliminating double taxation: the exemption method (exempt surplus) and the credit method (foreign tax credit). 11
The identification of these concepts as two distinct schools of thought is not entirely fair, as most authors
acknowledge both ideas, however, they do tend to emphasise one motivation over another. See Dagan (2000) for
a game theoretic approach to unilateral double taxation relief and a discussion of the alternative motivations for
DTTs.
7
Multinational Enterprises and Tax Administrations” (OECD, 2010b), regarding the concern over the
ability of associated enterprises to shift profits from a higher to a lower tax jurisdiction by adjusting
the prices charged on intercompany transactions. These guidelines provide commentary and detailed
guidance on the arm’s length principle12
, methods by which to establish whether intercompany
transactions are being conducted in a manner consistent with this principle, and documentation that
tax authorities may require to establish the validity of the transfer prices being used. However, while
there is a link between DTTs and their reference to transfer pricing, the actual transfer pricing
provisions and requirements themselves are enacted at the countries’ domestic level. All thirty of the
OECD member countries (as at 2006) include some form of the arm’s length principle and / or
comprehensive transfer pricing requirements in their domestic tax provisions and which apply to
MNE activity regardless of any treaty status13
. This is intuitive as a country’s tax authority wants to
guard against transfer pricing schemes regardless of whether they occur with associated enterprises in
another country with which it has a DTT or not. Furthermore, although DTTs effectively repeat a
transfer pricing requirement that is already established domestically, what they do accomplish in these
same articles is the relief of transfer pricing related double taxation. The OECD model treaty indicates
that, if one state makes a transfer pricing adjustment to an enterprise’s profits and taxes it accordingly,
a corresponding adjustment should be made by the other state so as to eliminate any resulting double
taxation. Therefore, while the transfer pricing reference is often cited as helping to prevent tax
evasion, the real value-added for this article is with respect to its ability to alleviate double taxation
arising from a transfer pricing adjustment.
Additionally, the literature often cites the information sharing mechanisms contained in DTTs
as also preventing tax evasion by MNEs, (e.g. Barthel et al., 2010). Again, this is not quite accurate.
FDI is dominated by branches and wholly or majority-owned subsidiaries (IMF, 1993). Such
structures inherently have information safeguards built into them. These include the standard use of a
12
This principle is the tax literature’s characterisation of transactions that would occur between independent
parties. 13
This is as per a review of the Transfer Pricing Country Profiles available online at www.oecd.org. I restricted
this review to the OECD countries as they are typically the higher tax jurisdiction relative to LDCs.
Furthermore, if transfer pricing is a concern for an LDC, they can and do also domestically implement transfer
pricing provisions.

8
double-entry accounting system and third party attestation engagements (i.e. audits) over the
enterprises’ financial statements to ensure that all activity is being captured and reported.
Furthermore, domestic transfer pricing legislation often includes comprehensive documentation
requirements14
to substantiate intercompany transactions and the amounts they occur at. This is not to
suggest that tax evasion does not occur, but, rather to make the point that there is little information
that a Host country tax authority would have with respect to an associated enterprise (which
characterises FDI) that the Home country tax authority does not already have access to. Instead, the
real value of these articles is in capturing personal tax evasion. Developed country tax systems are
dominated by the principle of taxing residents on their worldwide income. This is difficult to enforce
for individuals as the system must rely on the self-reporting of foreign activity15
. However, in the case
of an individual who is resident in one country and has investments or works in another country, there
will typically be reporting done by the Host investment institution / employer to the Host tax
authority. This provides readily available information that can be shared with the Home tax authority
for it to ensure that the individual has reported all of his/her worldwide income. As per Figure 5
(Appendix 1), the importance of personal taxes to developed countries can be seen by it almost always
constituting a significantly greater share of tax revenue than corporate taxes. The information sharing
clauses can also be useful for corporate taxation where the domestic tax authority needs information
regarding transactions undertaken by a resident enterprise with a non-associated foreign enterprise. In
these cases, the domestic tax authority does not have access to the foreign enterprise’s information, in
which case it can use a DTT to request that information via the foreign tax authority. But, this is
activity between non-associated enterprises which is not relevant to FDI related discussions.
The prevention of tax evasion argument typically refers to the potential for DTTs to have a
negative effect on FDI via three channels: transfer pricing and exchange of information clauses
(discussed above) as well as clauses intended to prevent treaty shopping. However, it is important not
to lump these channels together as even having the same potential for a negative effect on FDI.
14
E.g. see the comprehensive transfer pricing documentation required by Canada’s tax legislation, reproduced in
the Transfer Pricing Country Profile for Canada at www.oecd.org. 15
Individual (as opposed to business) activity is seldom subjected to the same checks and balances that are
generated by audited financial statements.
9
Treaty shopping refers to the concern that a party that is not a resident of either of the
contracting states will funnel its investment through one of the them in order to enjoy the benefits of
the DTT which it would otherwise not have access to. This is often done by a non-resident setting up
an enterprise in one of the contracting states and then funnelling the FDI through that entity and into
the ultimate Host country. In order to prevent this abuse, DTTs increasingly include complex anti-
treaty shopping provisions, often being of some form of a ‘look through approach’ (OECD, 2010a)
which prevents the benefits of the DTT from applying where the enterprise used to conduct the
business is not controlled, either directly or indirectly, by residents of the contracting states.
Therefore, where the literature has (inaccurately) interpreted the transfer pricing and exchange of
information clauses as creating the potential for the DTT to impose a negative effect on the enterprise
(higher taxes), anti-treaty shopping clauses only serve to prevent an enterprise from accessing the
DTT and its benefits. This difference is subtle but important. The imposition of a negative effect by a
treaty leads to the intuition of it having the potential for a negative impact on FDI as firms avoid the
DTT so as to avoid its negative effects. However, anti-treaty shopping clauses that prevent access to a
DTT’s benefits do not incentivise the firm to either avoid or be attracted to the DTT, and therefore, it
will have no effect on such firms’ FDI decisions. The only scenario where a DTT’s anti-treaty
shopping clauses can generate a negative effect on FDI is where a DTT is renegotiated to strengthen
its anti-treaty shopping clauses so as to shut down existing FDI access to the DTT16
. However,
renegotiation of a treaty is a very different decision from that of whether to enter into a new DTT or
not, and that decision and its effects is not the subject of this paper nor the related literature.
ii. To shift tax revenue from LDC Host to Developed Home countries.
This school of thought revolves around the non-reciprocal FDI flows between developed
countries and LDCs as it provides an opportunity for the developed country to shift tax revenue from
the LDC to itself. By negotiating lower withholding taxes (see Table 1 in Appendix 3 for salient
examples), there is a smaller foreign tax credit that the developed country needs to allow for against
the domestic taxes levied on repatriated income, which increases the amount of tax that it collects.
16
Even then, it would have to be the case that the loss of the treaty benefits is enough to justify the costs of
either shifting the investment out of the host country to a new location or to at least curtail the operations by
ceasing additional funding to it.

10
Even where the developed country uses an exemption mechanism over repatriated income, the lower
withholding taxes allow for more of it to be repatriated Home which creates the opportunity for
greater tax on subsequent domestic income payments17
. This idea is commonly described as resident
taxation at the expense of source taxation. Subscribers to this school of thought sometimes extend the
concept to the DTT definition of a Permanent Establishment and its taxable activity to argue that it
effectively narrows the income that can be taxed in the Host country, (Christians, 2005). However, by
definition (IMF, 1993), FDI is in part defined by the investment being of a long term nature, which
will typically qualify it as a fixed place of business. Furthermore, Blonigen and Davies (2004) note
that MNE activity is dominated by the horizontal type (replicating operations overseas to serve the
local market) which will qualify as active business. Therefore, in practice, most of the investment
flows to developing countries will qualify as a Permanent Establishment and its profits will be taxable
in the Host country. The definition is about practicality so as to prevent nominal or incidental
activities having to be reported and taxed in the Host country, as the additional administration costs
are not worth the minor related tax revenues they might generate.
There are merits to both schools of thought. But, disentangling them and the way DTTs can
actually be expected to work in practice is critical to undertaking an empirical study of their effects
and interpreting the resulting evidence. It is true that DTTs are in part designed to prevent tax evasion,
but, in practice, this is more relevant to personal rather than corporate tax evasion. Therefore, we
should not expect to see DTTs discouraging FDI location. It is also true that DTTs have the potential
to shift tax revenues from Host LDCs to developed Home countries, (although not to the extent as
described in the literature), and this is a potential cost that the LDC must consider against the potential
benefits of a DTT.
3. Literature Review
There are relatively few empirical studies on the effects of DTTs on FDI and the evidence
across studies is conflicting. In roughly equal parts, the literature can be divided into evidence of a
17
As an example, Canada exempts intercompany dividends from taxation in Canada when they are received
from a (controlled) foreign affiliate that earns active business income in a treaty country. This provides for
greater funds to be repatriated to the Home parent company and the potential for tax upon dividend payments to
the parent company’s Home shareholders.
11
negative effect, no effect, or a positive effect.
One of the earliest empirical analyses, Blonigen and Davies (2002) use an ordinary least
squares and fixed effects strategy to estimate the effect of DTTs on FDI. They use a slightly modified
version of the Carr, Markusen and Maskus (2001) Knowledge-Capital Model of the Multinational
Enterprise empirical specification (CMM model) for control variables. A dyadic analysis, they
estimate a negative effect of DTTs on FDI over a sample of developed (source) countries to
developed and LDC (recipient) countries for the period 1982 – 1992. Similarly, Egger et al. (2006)
also conclude that DTTs have a negative impact on FDI. However, they use their own empirical
specification18
which they implement via a propensity score matching and difference-in-differences
estimation strategy for the period 1985 - 2000. In both cases the authors refer to the idea that DTTs
inhibit the potential for tax avoidance by MNEs which in turn discourages FDI and therefore, is a
possible explanation for the estimated negative effect that they find.
Blonigen and Davies (2004) revisit the same research question, but this time they restrict the
FDI source country to be the U.S. They again use a fixed effects strategy in combination with a
tailored version of the CMM Model over a data set that includes both developed and LDC host
countries for the years 1980 – 1999. However, in this analysis, they conclude that they find no
evidence of an effect of DTTs on FDI. Coupé et al. (2009) also conclude that they do not find any
evidence of a DTT effect on FDI flows over a sample (1990 – 2001) of OECD source countries to
Host transitioning economies. Their empirical strategy uses fixed and random effects as well as an IV
strategy to estimate a gravity model. However, their variables of interest are both DTTs and bilateral
investment treaties19
(BITS). In both studies, the authors suggest that their evidence can be explained
by the expected positive effects of DTTs on FDI being offset by a negative effect of DTTs. They
attribute the negative effect to DTTs imposing transfer pricing limitations which discourages MNE
location in the treaty Host countries. Alternatively, Blonigen and Davies (2004) also make the point
that it could simply be the case that DTTs have no effect on FDI.
Neumayer (2007) uses a fixed effects model for a dyadic analysis of the effect of U.S. DTTs
18
The empirical specification is derived from solving a general equilibrium model of FDI and international
taxation. The resulting control variables have a similar intuition to those included in the CMM model. 19
The authors conclude that they find a positive effect of BITs on FDI flows to transitioning economies.

12
on FDI between the U.S. and developing countries. He also uses a monadic analysis to estimate the
effect of OECD DTTs on total inward FDI to developing countries. Using a data set that stretches
from 2001 to as far back as 1970 and a selection of the standard controls drawn from the FDI
determinants literature, (including more recently, BITs) he concludes that he finds evidence of a
positive effect of DTTs on FDI. More recently, Barthel et al. (2010) undertake a dyadic analysis of
DTTs and FDI for a sample (1978 – 2004) of Home and Host countries which both include developed
and LDC economies. Using a fixed effects model as the primary estimation strategy and Arellano-
Bond GMM estimation for a robustness check, their paper also concludes that there is a positive effect
of DTTs on FDI.
Although each of the above papers contribute to the development of the literature, there are
still some important common gaps that my study addresses. To guard against heteroskedasticity, all of
the above papers use the standard natural log transformation of the FDI dependent variable, (with the
exception of Blonigen and Davies, (2002), who keep the dependent variable in levels). FDI is
characterised by positive, negative and zero values, which requires recasting the negative and zero
values to nominal positive amounts in order to take the natural logarithm. This eliminates valuable
information as even though the number of positive values for FDI outweighs the negative, the
magnitude of individual amounts is also an important influence in any estimation. Therefore, I use the
inverse hyperbolic sine transformation of my dependent variable as it provides the same guard against
heteroskedasticity but, admits negative and zero values along with the positive ones.
All of the papers, with the exception of Neumayer (2007) and Coupé et al. (2009), pool their
sample of Host countries to include both developed and LDC economies. This conflicts with Blonigen
and Wang’s (2004) paper, “Inappropriate Pooling of Wealthy and Poor Countries in Empirical FDI
Studies”. Furthermore, given the disparity in the FDI flows between developed economies (largely
reciprocal) and developed to LDC economies (largely non-reciprocal), the motivations for DTTs and
their potential costs and benefits are quite different for developed to developed versus developed to
LDC country-pairs. Therefore, I restrict my sample to have developed economies as the Home
countries and LDCs to be the Host countries.
Despite a rich literature on the determinants of FDI, (for examples, see Blonigen (2005), Carr

13
et al. (2001), Schneider and Frey (1985)), the empirical specifications used in the studies of the effects
of DTTs on FDI have shortcomings. This is likely due to data availability20
. However, this presents a
trade-off between the number of observations available and the potential for omitted variable bias. In
particular, the studies to date are well specified for core economic determinants with the addition of
only one or two other critical control variables but not their simultaneous inclusion. These include
BITs, which are entered into with the specific purpose of increasing FDI, and the related quality of
host domestic institutions for which they are intended to substitute, (see, for example, Schneider and
Frey (1985), Egger and Pfaffermayer, (2004), Neumayer and Spess (2005)). I also control for the host
country’s tax rate because of its prominence in the empirical research on the determinants of FDI, (see
De Mooij and Ederveen, (2003) and Blonigen (2005)) and because it is intuitive to control for taxes in
a study of double taxation treaties.
4. Empirical Strategy
Given the likelihood of heterogeneous treatment effects of DTTs on FDI, I estimate the
average treatment effect on the treated (ATT) using a propensity score matching approach21
, where:
ATT ≡ E{FDI1ij - FDI 0ij │DTTij = 1}
FDI1ij and FDI0ij are the outward FDI flows from Home country “i” to Host country “j” under the
counterfactual states of, respectively, having a DTT or not, conditional on the country-pair having a
DTT in place. As we cannot simultaneously observe a country-pair in its treated and untreated state,
we need to match a treated country-pair with a comparable untreated country-pair to serve as its
counterfactual. To ensure selection bias is not confounding the estimated treatment effect, a
propensity score estimation strategy with a properly specified model is used to achieve conditional
independence and effect the match:
FDI1, FDI0 ⊥ DTT │p(X)
where, p(X) ≡ Pr(DTT = 1│X) is the estimated propensity score of a country-pair entering into a
DTT as a function of the covariates captured within vector X, (see Rosenbaum and Rubin, (1983)).
20
FDI data is notorious for missing values, although this is noticeably improving over time. Adding control
variables, which typically also have missing values that often do not correspond with the FDI missing values,
decreases the number of available observations further. 21
A key advantage of a matching econometrics strategy is that it accommodates the likelihood of heterogeneous
treatment effects which regression-based approaches inherently do not, (Cobb-Clark and Crossley, 2003)).
14
Intuitively, if X contains the appropriate control variables, it will create good matches, and to alleviate
the curse of dimensionality, the propensity score estimation as a function of those control variables
provides the means to make and judge the quality of the match22
. However, as the vector X only
captures observable characteristics of the country-pair, I also use a difference-in-differences matching
estimator to eliminate any time-invariant unobservable heterogeneity:
∆ FDI Flows1 - ∆ FDI Flows0
To allow for the possibility that the model may change over time, I implement this strategy
over three time adjacent segments: 1991 – 1995, 1996 – 2000, and 1999 – 200323
.
4.1 Propensity Score Estimation
In the first stage of the analysis I estimate the propensity score for each country-pair
observation. My primary variable of interest (treatment) is a new double taxation treaty that comes
into effect (DTTE). The process of entering into a DTT requires the negotiation of the terms of the
treaty, which if successful, results in the signing of it. However, once signed, the treaty does not
actually become effective until each of the countries has it ratified. Once the treaty is ratified, it
typically stipulates that it is in effect as of 1 January of the year following ratification. Because the
treaty provisions are only of benefit to the MNE once the DTT is effective, I use the DTTE as my
treatment variable.
To estimate the propensity score, I use a probit model24
:
Pr(DTTEij = 1│Xij) = Φ{g(Xij)}
Where g(.) is the functional specification of the covariates and Φ is the standard normal cumulative
distribution function. For my core parsimonious specification, g(Xij) is:
β1 Sum_GDPij + β2 (Diff_GDPij)2 + β3 Diff_Skillij + β4 (Diff_SkijxDiff_GDPij) + β5 Trade Costi +
β6 Trade Costj + β7 Invest Costsj + β8 (T Costj x Sk Diff2) + β9 Distanceij + β10 Rule_Lawj +
β11 CEE_CISj + β12 BITRij+ β13 Corp Tax Ratej + β14 Sum_DTTEsij
The first nine control variables are the CMM model empirical specification (Carr et al., 2001) which
22
Readers who are unfamiliar with matching econometrics should see Cobb-Clark and Crossley, (2003). 23
The overlap in the final two segments is to allow for a long enough lag in the measure of the post-treaty FDI
to capture any potential effect of the DTT on FDI. 24
Kopeinig and Caliendo (2005) find that the choice of a logit versus probit model is of little practical
importance for estimating the propensity score.
15
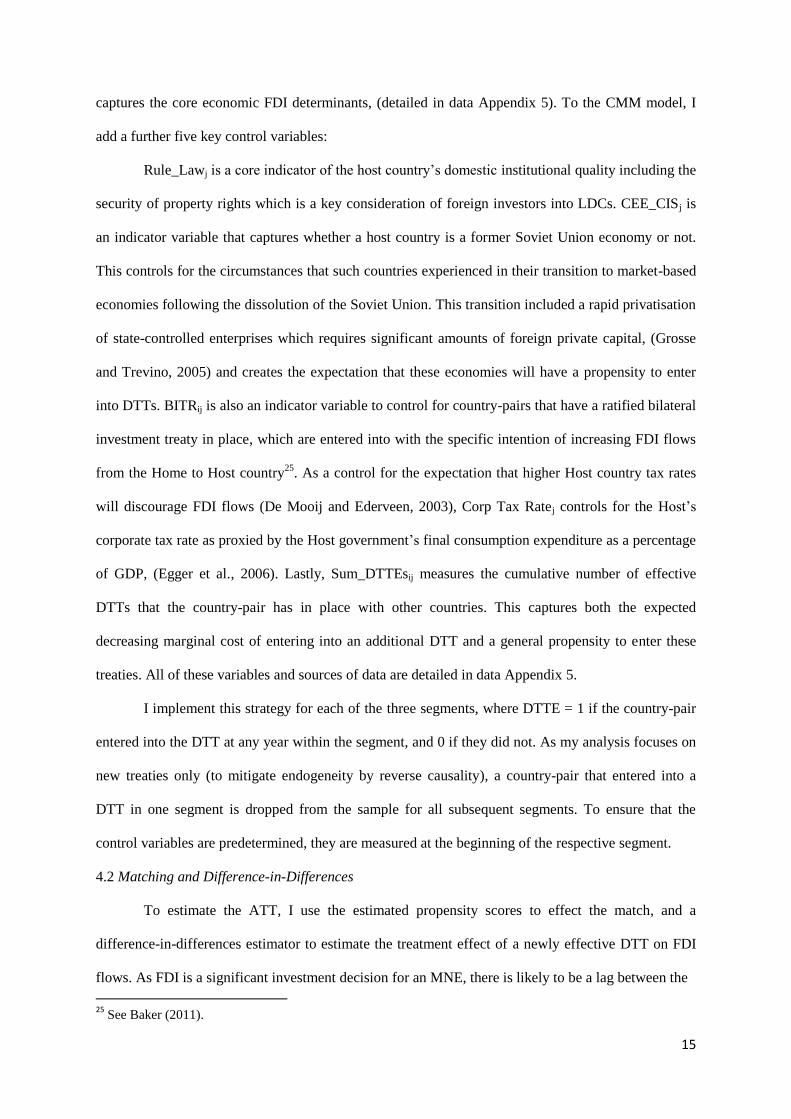
captures the core economic FDI determinants, (detailed in data Appendix 5). To the CMM model, I
add a further five key control variables:
Rule_Lawj is a core indicator of the host country’s domestic institutional quality including the
security of property rights which is a key consideration of foreign investors into LDCs. CEE_CISj is
an indicator variable that captures whether a host country is a former Soviet Union economy or not.
This controls for the circumstances that such countries experienced in their transition to market-based
economies following the dissolution of the Soviet Union. This transition included a rapid privatisation
of state-controlled enterprises which requires significant amounts of foreign private capital, (Grosse
and Trevino, 2005) and creates the expectation that these economies will have a propensity to enter
into DTTs. BITRij is also an indicator variable to control for country-pairs that have a ratified bilateral
investment treaty in place, which are entered into with the specific intention of increasing FDI flows
from the Home to Host country25
. As a control for the expectation that higher Host country tax rates
will discourage FDI flows (De Mooij and Ederveen, 2003), Corp Tax Ratej controls for the Host’s
corporate tax rate as proxied by the Host government’s final consumption expenditure as a percentage
of GDP, (Egger et al., 2006). Lastly, Sum_DTTEsij measures the cumulative number of effective
DTTs that the country-pair has in place with other countries. This captures both the expected
decreasing marginal cost of entering into an additional DTT and a general propensity to enter these
treaties. All of these variables and sources of data are detailed in data Appendix 5.
I implement this strategy for each of the three segments, where DTTE = 1 if the country-pair
entered into the DTT at any year within the segment, and 0 if they did not. As my analysis focuses on
new treaties only (to mitigate endogeneity by reverse causality), a country-pair that entered into a
DTT in one segment is dropped from the sample for all subsequent segments. To ensure that the
control variables are predetermined, they are measured at the beginning of the respective segment.
4.2 Matching and Difference-in-Differences
To estimate the ATT, I use the estimated propensity scores to effect the match, and a
difference-in-differences estimator to estimate the treatment effect of a newly effective DTT on FDI
flows. As FDI is a significant investment decision for an MNE, there is likely to be a lag between the
25
See Baker (2011).

16
DTT coming into effect and it potentially having an impact on FDI. Therefore, I use three windows
of increasing length of at least 1, 2 or 3 years post-DTTE.
I implement this stage using the kernel matching estimator (with bootstrapped standard
errors) as my primary matching algorithm. All matching algorithms involve a trade-off between bias
and variance. The kernel algorithm has the advantage of allowing me to test the robustness of my
results. By varying the kernel’s bandwidth I can directly affect this trade-off, where a lower
bandwidth decreases any bias and a higher bandwidth improves efficiency. For additional robustness,
I also use a nearest neighbour matching algorithm (with heteroskedasticity-consistent standard
errors26
).
An advantage of the difference-in-differences estimator is that it provides an additional guard
against endogeneity in the form of MNEs with existing FDI in a Host country lobbying the Home
government to enter into a DTT with the Host27
. By measuring the change in FDI before and after the
treatment, such endogeneity does not confound the estimate of the ATT as the estimator will only
capture any new FDI as triggered by the newly entered into DTT. The other possibility would be
MNEs who want to enter into a Host country and lobby their Home government to pursue a DTT with
the Host before they will undertake the FDI. This scenario is also fine as it is consistent with the point
of the DTT and the difference-in-differences estimator would only capture the related change in FDI.
The alternative would be that the MNE makes the FDI in anticipation of the DTT being entered into,
in which case the estimated treatment effect would be confounded. However, Coupé et al., (2009)
explore the timing of a potential effect on FDI by allowing for a lead time of 1, 2, and 3 years pre-
DTT and conclude that they do not find any anticipatory effect. Furthermore, this scenario is
implausible. Given the significant uncertainty in terms of the time (measured in years) before such a
treaty would come into effect and whether it will at all, any MNE that invests in a Host country today
will do so regardless of a subsequent DTT.
26
See Abadie and Imbens (2006) and (2008) who note the appropriateness of bootstrapped standard errors for
kernel matching methods, but, show that this method is biased for nearest neighbour matching methods and
therefore, provide an alternative estimator of the variance. 27
There would be no guarantee that a DTT would actually come into effect. At that point the Host country
already has the benefit of that FDI and therefore, has no further incentives to incur the costs of a DTT, unless
there is a credible threat that the MNE would reverse its FDI in the Host country.
17
5. Data
The data set centres on the outward FDI flows that I collected from the OECD International
Direct Investment Statistics database. I use all 30 OECD countries (membership as at 2006) for the
potential Home countries and all 206 non-OECD economies as the potential Host countries. To
mitigate heteroskedasticity, I use the inverse hyperbolic sine transformation of the dependent variable
which also preserves the information contained in all the potential FDI flow28
values (positive,
negative and zero). The data on the DTTs themselves are collected from the International Bureau of
Fiscal Documentation’s Tax Research Platform, which includes both the date of signing and
effectiveness for each treaty. In the rare case where the treaty is retroactively effective, I use the later
signing date as the ‘effective date’ as the MNE clearly cannot go back in time to make the investment.
The parsimonious empirical specification is my starting point / core estimation model. To
investigate the robustness of the results, I use two further specifications which build on it: i) the
parsimonious specification with the addition of lagged values of FDI flows as a control variable, and
ii) a comprehensive specification which makes use of the depth of the literature on the determinants of
FDI. These additional control variables, their justification for inclusion and data sources are included
in the data Appendix 5. See Gilligan and Hoddinott (2007) on both the importance in conditioning on
lagged values of the outcome variable and the desirability to over-parameterise the model (to increase
the quality of the matches) in implementing such matching strategies.
The data set covers the period 1991 to 2006. This period allows me to capture the most recent
and relevant wave of DTT activity, where I cut-off the analysis as at 2006 to prevent the evidence
from being confounded by the beginnings of the financial crisis in 2007.
6. Results and Analysis
See Table 2 for the propensity score estimation using the core parsimonious specification. As the
economic determinants of the CMM Model (Carr et al., 2001) have already received much discussion
in earlier papers29
, I restrict my discussion to the additional critical control variables that I have added
28
I focus on FDI flows rather than stocks. To be convincing evidence to a policy maker, we need to show the
effect of a DTT at the level of the movement of the capital. To justify the costs of entering into a DTT, the Host
will want to see an actual increase in the flows of investment into its country that it can attribute to the DTT. 29
See Baker (2011) for a detailed example of interpreting these coefficients in the context of BITS and FDI.

18
to the standard empirical specification.
The Rule of Lawj covariate is consistently positive and highly practically (relative to the
economic determinants) and statistically significant across all segments. The higher the quality of the
Host domestic institutions, the higher the probability is that the country-pair will enter into an
effective DTT. This can be interpreted from either the Host’s perspective, where stronger institutions
see the DTT as a prudent tool, or this can be viewed from the Home’s perspective where the Home
government will only enter into a treaty with a Host country that has the quality of institutions in
place to conclude and enforce a DTT. The CEE_CISj variable is also positive and highly practically
and statistically significant in the final two segments. The variable is not statistically significant in the
first segment as this is on the heels of the dissolution of the Soviet Union and former member
countries will only have just begun the transition to private markets and the negotiation of DTTs. The
estimates for the effect of BITs is less consistent across the segments, but there is nothing in the
statistically significant evidence to contradict the expectation that a Host country that seeks to
increase its inward FDI enters into treaties (BITs and DTTs) which are expected to increase that
Table 2: Probit Model_Propensity Score Estimation_Effective DTTs_Parsimonious Specification
Dependent Variable = DTTE
Sign2
Covariates Coeff x 103
z-stat Sign Coeff x 103
z-stat Sign Coeff x 103
z-stat Sign
+ Sum_GDPij -0.0253 0.13 0.2889 1.22 -0.0437 0.25
- (Diff_GDPij)2
0.0000 0.85 0.0000 0.23 0.0000 1.42
+ Diff_Skillij -10.9994 1.96 ** N -10.1704 2.38 ** N -5.6671 1.45
- (Diff_SkijxDiff_GDPij) -0.0050 1.58 -0.0029 0.78 -0.0074 1.98 ** Y
- Trade Costi 6.2012 1.55 -1.3709 0.83 0.0622 0.04
+ Trade Costj 1.6949 0.91 -1.6896 0.72 2.6043 1.00
- Invest Costsj 66.0042 1.24 -62.7205 1.39 -76.0804 1.66
- (T Costj x Sk Diff2) 0.0029 2.17 ** Y -0.0001 0.03 -0.0015 1.03
? Distanceij -0.0608 2.81 *** -0.0377 1.90 -0.0622 3.19 ***
+ Rule_Lawj 262.0817 4.09 *** Y 197.0311 2.36 ** Y 368.4922 4.66 *** Y
+ CEE_CISj 349.8691 1.37 781.0918 4.34 *** Y 858.6302 4.81 *** Y
+ BITRij 439.9566 1.81 417.4641 2.31 ** Y 138.8029 0.84
- Corp Tax Ratej (proxied) 8.3241 0.67 -6.8985 0.45 -7.0604 0.45
+ Sum_DTTEsij 15.6343 4.15 *** Y 15.4258 3.98 *** Y 16.9407 4.45 *** Y
N 1318 961 1214
Pseudo-R2
0.17 0.22 0.31
Balancing Property1
satisfied satisfied satisfied
% Treated obs. on Common Support 100% 100% 100%
The coefficients are reported at (the estimate x 103). *** denotes significance at the 1% level; ** at the 5% level. (1) The significance level for the
the Balancing Propert tests has been adjusted for a 'Bonferroni Correction' as recommended by Lee (2006). (2) The anticipated 'Sign' is as per
documented in Appendix 5.
1991_1995 1996_2000 1999_2003
19
investment. Although the Host corporate tax rate has a negative effect on FDI location itself, the Corp
Tax Ratej variable is not statistically significant across any of the segments indicating that it does not
have an effect on the probability of a country-pair entering into a DTT. This is the first quantitative
hint that DTTs are less about relieving double taxation than would be expected. As expected, the
cumulative number of treaties that a country-pair has entered into, Sum_DTTEsij, is positive and
highly statistically significant across the segments.
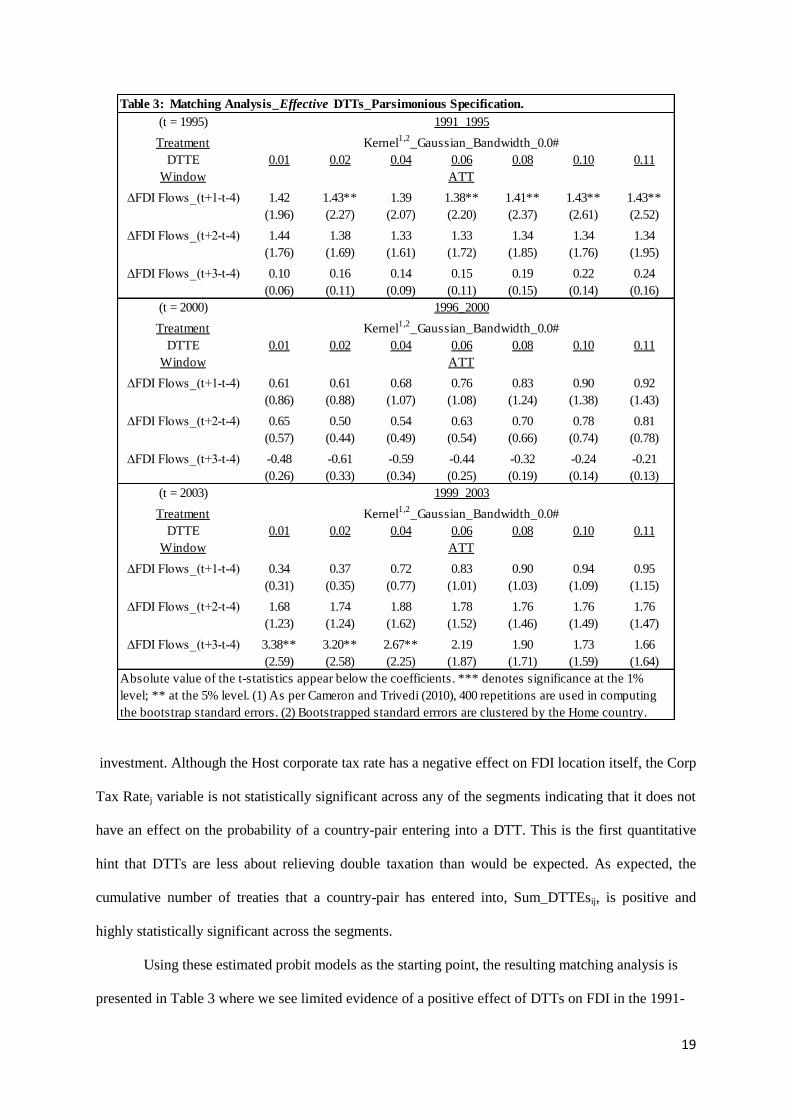
Using these estimated probit models as the starting point, the resulting matching analysis is
presented in Table 3 where we see limited evidence of a positive effect of DTTs on FDI in the 1991-
Table 3: Matching Analysis_Effective DTTs_Parsimonious Specification.
(t = 1995)
Treatment
DTTE 0.01 0.02 0.04 0.06 0.08 0.10 0.11
Window
∆FDI Flows_(t+1-t-4) 1.42 1.43** 1.39 1.38** 1.41** 1.43** 1.43**
(1.96) (2.27) (2.07) (2.20) (2.37) (2.61) (2.52)
∆FDI Flows_(t+2-t-4) 1.44 1.38 1.33 1.33 1.34 1.34 1.34
(1.76) (1.69) (1.61) (1.72) (1.85) (1.76) (1.95)
∆FDI Flows_(t+3-t-4) 0.10 0.16 0.14 0.15 0.19 0.22 0.24
(0.06) (0.11) (0.09) (0.11) (0.15) (0.14) (0.16)
(t = 2000)
Treatment
DTTE 0.01 0.02 0.04 0.06 0.08 0.10 0.11
Window
∆FDI Flows_(t+1-t-4) 0.61 0.61 0.68 0.76 0.83 0.90 0.92
(0.86) (0.88) (1.07) (1.08) (1.24) (1.38) (1.43)
∆FDI Flows_(t+2-t-4) 0.65 0.50 0.54 0.63 0.70 0.78 0.81
(0.57) (0.44) (0.49) (0.54) (0.66) (0.74) (0.78)
∆FDI Flows_(t+3-t-4) -0.48 -0.61 -0.59 -0.44 -0.32 -0.24 -0.21
(0.26) (0.33) (0.34) (0.25) (0.19) (0.14) (0.13)
(t = 2003)
Treatment
DTTE 0.01 0.02 0.04 0.06 0.08 0.10 0.11
Window
∆FDI Flows_(t+1-t-4) 0.34 0.37 0.72 0.83 0.90 0.94 0.95
(0.31) (0.35) (0.77) (1.01) (1.03) (1.09) (1.15)
∆FDI Flows_(t+2-t-4) 1.68 1.74 1.88 1.78 1.76 1.76 1.76
(1.23) (1.24) (1.62) (1.52) (1.46) (1.49) (1.47)
∆FDI Flows_(t+3-t-4) 3.38** 3.20** 2.67** 2.19 1.90 1.73 1.66
(2.59) (2.58) (2.25) (1.87) (1.71) (1.59) (1.64)
Absolute value of the t-statistics appear below the coefficients. *** denotes significance at the 1%
level; ** at the 5% level. (1) As per Cameron and Trivedi (2010), 400 repetitions are used in computing
the bootstrap standard errors. (2) Bootstrapped standard errrors are clustered by the Home country.
1999_2003
Kernel1,2
_Gaussian_Bandwidth_0.0#
ATT
1991_1995
Kernel1,2
_Gaussian_Bandwidth_0.0#
ATT
1996_2000
Kernel1,2
_Gaussian_Bandwidth_0.0#
ATT
20
1995 and the 1999-2003 segments and no evidence of an effect in the 1996-2000 segment30
. However,
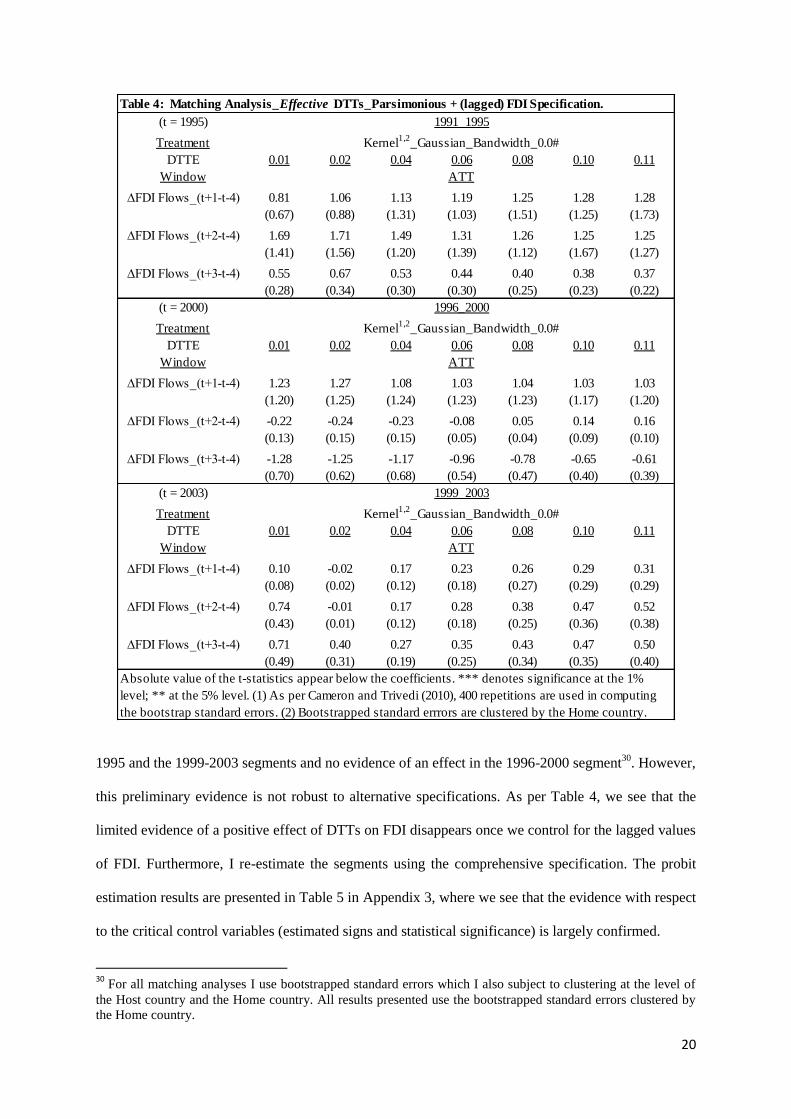
this preliminary evidence is not robust to alternative specifications. As per Table 4, we see that the
limited evidence of a positive effect of DTTs on FDI disappears once we control for the lagged values
of FDI. Furthermore, I re-estimate the segments using the comprehensive specification. The probit
estimation results are presented in Table 5 in Appendix 3, where we see that the evidence with respect
to the critical control variables (estimated signs and statistical significance) is largely confirmed.
30
For all matching analyses I use bootstrapped standard errors which I also subject to clustering at the level of
the Host country and the Home country. All results presented use the bootstrapped standard errors clustered by
the Home country.
Table 4: Matching Analysis_Effective DTTs_Parsimonious + (lagged) FDI Specification.
(t = 1995)
Treatment
DTTE 0.01 0.02 0.04 0.06 0.08 0.10 0.11
Window
∆FDI Flows_(t+1-t-4) 0.81 1.06 1.13 1.19 1.25 1.28 1.28
(0.67) (0.88) (1.31) (1.03) (1.51) (1.25) (1.73)
∆FDI Flows_(t+2-t-4) 1.69 1.71 1.49 1.31 1.26 1.25 1.25
(1.41) (1.56) (1.20) (1.39) (1.12) (1.67) (1.27)
∆FDI Flows_(t+3-t-4) 0.55 0.67 0.53 0.44 0.40 0.38 0.37
(0.28) (0.34) (0.30) (0.30) (0.25) (0.23) (0.22)
(t = 2000)
Treatment
DTTE 0.01 0.02 0.04 0.06 0.08 0.10 0.11
Window
∆FDI Flows_(t+1-t-4) 1.23 1.27 1.08 1.03 1.04 1.03 1.03
(1.20) (1.25) (1.24) (1.23) (1.23) (1.17) (1.20)
∆FDI Flows_(t+2-t-4) -0.22 -0.24 -0.23 -0.08 0.05 0.14 0.16
(0.13) (0.15) (0.15) (0.05) (0.04) (0.09) (0.10)
∆FDI Flows_(t+3-t-4) -1.28 -1.25 -1.17 -0.96 -0.78 -0.65 -0.61
(0.70) (0.62) (0.68) (0.54) (0.47) (0.40) (0.39)
(t = 2003)
Treatment
DTTE 0.01 0.02 0.04 0.06 0.08 0.10 0.11
Window
∆FDI Flows_(t+1-t-4) 0.10 -0.02 0.17 0.23 0.26 0.29 0.31
(0.08) (0.02) (0.12) (0.18) (0.27) (0.29) (0.29)
∆FDI Flows_(t+2-t-4) 0.74 -0.01 0.17 0.28 0.38 0.47 0.52
(0.43) (0.01) (0.12) (0.18) (0.25) (0.36) (0.38)
∆FDI Flows_(t+3-t-4) 0.71 0.40 0.27 0.35 0.43 0.47 0.50
(0.49) (0.31) (0.19) (0.25) (0.34) (0.35) (0.40)
Absolute value of the t-statistics appear below the coefficients. *** denotes significance at the 1%
level; ** at the 5% level. (1) As per Cameron and Trivedi (2010), 400 repetitions are used in computing
the bootstrap standard errors. (2) Bootstrapped standard errrors are clustered by the Home country.
1991_1995
Kernel1,2
_Gaussian_Bandwidth_0.0#
ATT
1996_2000
Kernel1,2
_Gaussian_Bandwidth_0.0#
ATT
ATT
1999_2003
Kernel1,2
_Gaussian_Bandwidth_0.0#

21
However, for this specification, I also add a control for the Home country’s corporate tax rate in
addition to the Host country’s corporate tax rate. Neither is statistically significant, which again
provides evidence that DTTs are less about double taxation than expected. The related matching
results are in Table 6 where the evidence of DTTs not having an effect on FDI is confirmed. These
specifications highlight the concern over omitted variable bias in previous studies.
To check that the lack of evidence of an impact of effective DTTs on FDI is not due to its
having already been triggered by the preceding signing of the treaty, I repeat the analysis using the
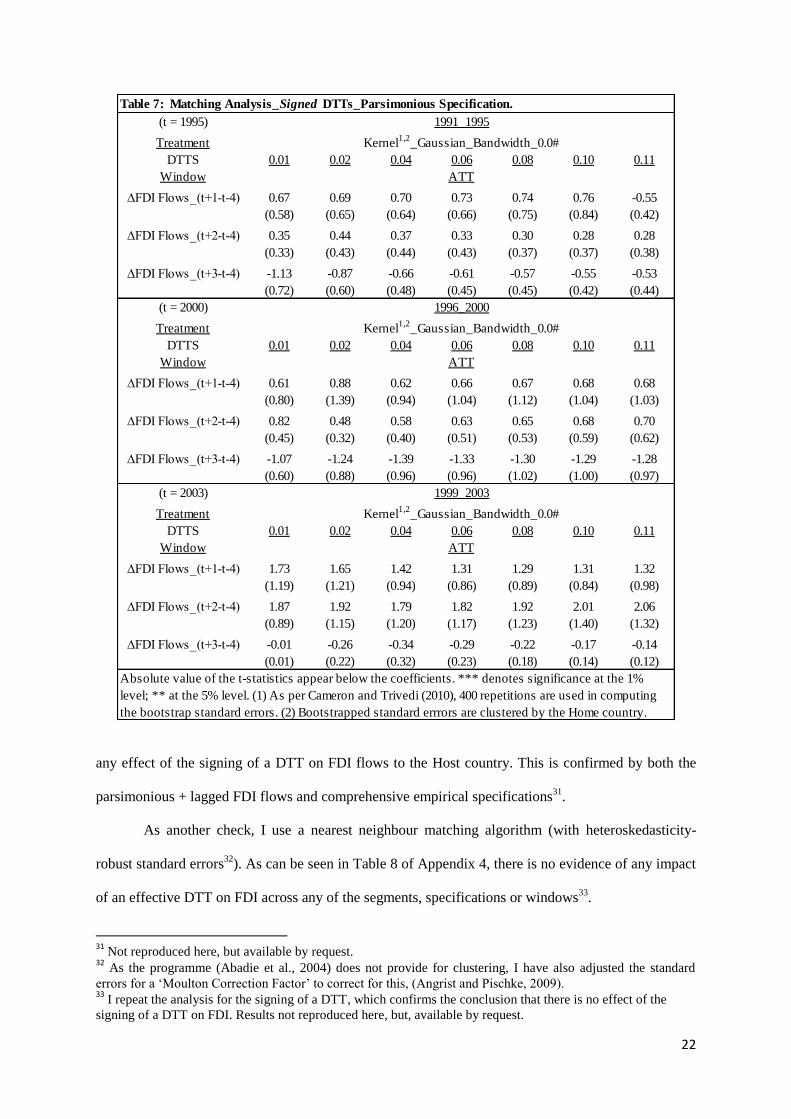
signing date as the treatment, (DTTS). As can be seen by Table 7, there is no evidence of there being
Table 6: Matching Analysis_Effective DTTs_Comprehensive Specification.
(t = 1995)
Treatment
DTTE 0.01 0.02 0.04 0.06 0.08 0.10 0.11
Window
∆FDI Flows_(t+1-t-4) 0.92 1.02 1.03 0.98 0.96 0.97 0.97
(1.35) (1.60) (1.74) (1.78) (1.68) (1.89) (1.80)
∆FDI Flows_(t+2-t-4) 1.16 1.26 1.23 1.20 1.20 1.21 1.21
(1.38) (1.54) (1.56) (1.45) (1.64) (1.64) (1.79)
∆FDI Flows_(t+3-t-4) -0.53 -0.43 -0.48 -0.51 -0.51 -0.51 -0.50
(0.30) (0.26) (0.28) (0.34) (0.37) (0.31) (0.33)
(t = 2000)
Treatment
DTTE 0.01 0.02 0.04 0.06 0.08 0.10 0.11
Window
∆FDI Flows_(t+1-t-4) 0.67 0.73 0.78 0.85 0.94 1.01 1.04
(0.91) (1.02) (1.13) (1.26) (1.37) (1.51) (1.56)
∆FDI Flows_(t+2-t-4) 0.37 0.42 0.59 0.72 0.86 0.98 1.04
(0.29) (0.35) (0.52) (0.61) (0.71) (0.90) (0.93)
∆FDI Flows_(t+3-t-4) -0.14 -0.24 -0.32 -0.30 -0.22 -0.14 -0.11
(0.07) (0.12) (0.17) (0.15) (0.12) (0.08) (0.06)
(t = 2003)
Treatment
DTTE 0.01 0.02 0.04 0.06 0.08 0.10 0.11
Window
∆FDI Flows_(t+1-t-4) 0.94 1.10 1.34 1.22 1.18 1.17 1.17
(0.72) (0.82) (1.11) (1.18) (1.14) (1.10) (1.05)
∆FDI Flows_(t+2-t-4) 1.58 1.69 1.96 1.94 1.97 1.99 2.00
(0.96) (1.11) (1.42) (1.56) (1.45) (1.45) (1.57)
∆FDI Flows_(t+3-t-4) 2.19 1.90 1.74 1.71 1.71 1.70 1.68
(1.59) (1.42) (1.27) (1.39) (1.33) (1.43) (1.37)
Absolute value of the t-statistics appear below the coefficients. *** denotes significance at the 1%
level; ** at the 5% level. (1) As per Cameron and Trivedi (2010), 400 repetitions are used in computing
the bootstrap standard errors. (2) Bootstrapped standard errrors are clustered by the Home country.
1991_1995
Kernel1,2
_Gaussian_Bandwidth_0.0#
ATT
1996_2000
Kernel1,2
_Gaussian_Bandwidth_0.0#
ATT
ATT
1999_2003
Kernel1,2
_Gaussian_Bandwidth_0.0#
22
any effect of the signing of a DTT on FDI flows to the Host country. This is confirmed by both the
parsimonious + lagged FDI flows and comprehensive empirical specifications31
.
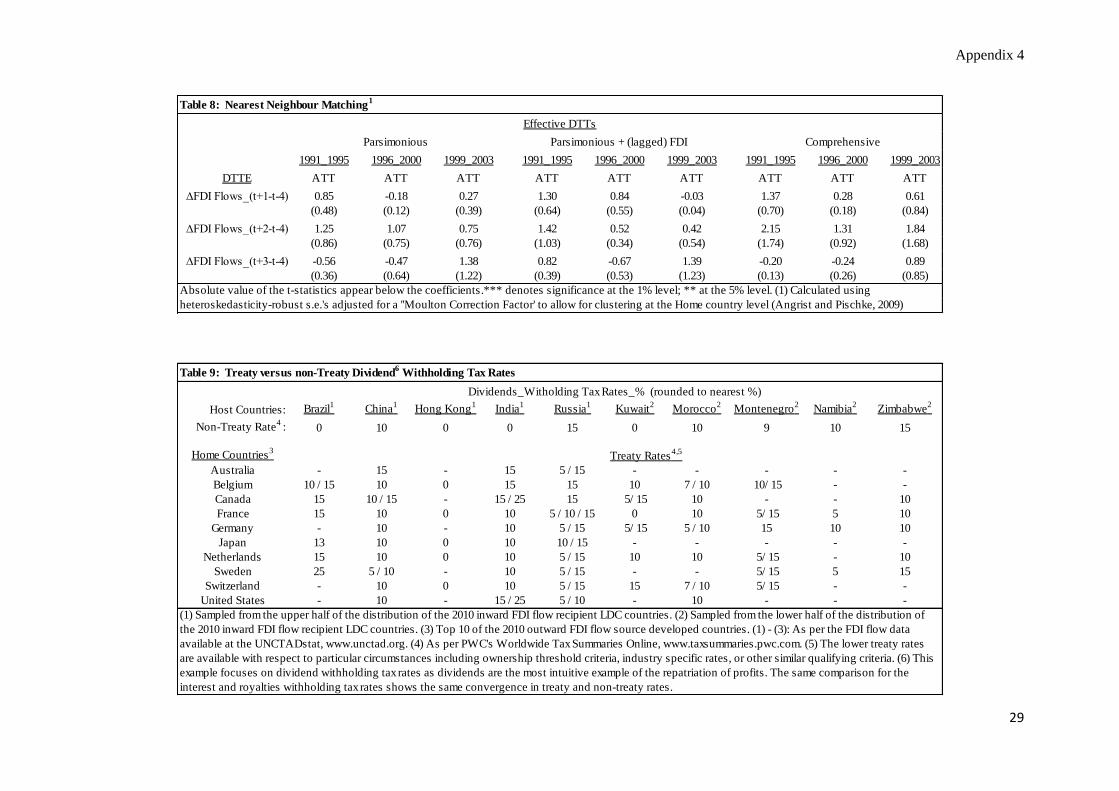
As another check, I use a nearest neighbour matching algorithm (with heteroskedasticity-
robust standard errors32
). As can be seen in Table 8 of Appendix 4, there is no evidence of any impact
of an effective DTT on FDI across any of the segments, specifications or windows33
.
31
Not reproduced here, but available by request. 32
As the programme (Abadie et al., 2004) does not provide for clustering, I have also adjusted the standard
errors for a ‘Moulton Correction Factor’ to correct for this, (Angrist and Pischke, 2009). 33
I repeat the analysis for the signing of a DTT, which confirms the conclusion that there is no effect of the
signing of a DTT on FDI. Results not reproduced here, but, available by request.
Table 7: Matching Analysis_Signed DTTs_Parsimonious Specification.
(t = 1995)
Treatment
DTTS 0.01 0.02 0.04 0.06 0.08 0.10 0.11
Window
∆FDI Flows_(t+1-t-4) 0.67 0.69 0.70 0.73 0.74 0.76 -0.55
(0.58) (0.65) (0.64) (0.66) (0.75) (0.84) (0.42)
∆FDI Flows_(t+2-t-4) 0.35 0.44 0.37 0.33 0.30 0.28 0.28
(0.33) (0.43) (0.44) (0.43) (0.37) (0.37) (0.38)
∆FDI Flows_(t+3-t-4) -1.13 -0.87 -0.66 -0.61 -0.57 -0.55 -0.53
(0.72) (0.60) (0.48) (0.45) (0.45) (0.42) (0.44)
(t = 2000)
Treatment
DTTS 0.01 0.02 0.04 0.06 0.08 0.10 0.11
Window
∆FDI Flows_(t+1-t-4) 0.61 0.88 0.62 0.66 0.67 0.68 0.68
(0.80) (1.39) (0.94) (1.04) (1.12) (1.04) (1.03)
∆FDI Flows_(t+2-t-4) 0.82 0.48 0.58 0.63 0.65 0.68 0.70
(0.45) (0.32) (0.40) (0.51) (0.53) (0.59) (0.62)
∆FDI Flows_(t+3-t-4) -1.07 -1.24 -1.39 -1.33 -1.30 -1.29 -1.28
(0.60) (0.88) (0.96) (0.96) (1.02) (1.00) (0.97)
(t = 2003)
Treatment
DTTS 0.01 0.02 0.04 0.06 0.08 0.10 0.11
Window
∆FDI Flows_(t+1-t-4) 1.73 1.65 1.42 1.31 1.29 1.31 1.32
(1.19) (1.21) (0.94) (0.86) (0.89) (0.84) (0.98)
∆FDI Flows_(t+2-t-4) 1.87 1.92 1.79 1.82 1.92 2.01 2.06
(0.89) (1.15) (1.20) (1.17) (1.23) (1.40) (1.32)
∆FDI Flows_(t+3-t-4) -0.01 -0.26 -0.34 -0.29 -0.22 -0.17 -0.14
(0.01) (0.22) (0.32) (0.23) (0.18) (0.14) (0.12)
Absolute value of the t-statistics appear below the coefficients. *** denotes significance at the 1%
level; ** at the 5% level. (1) As per Cameron and Trivedi (2010), 400 repetitions are used in computing
the bootstrap standard errors. (2) Bootstrapped standard errrors are clustered by the Home country.
1991_1995
Kernel1,2
_Gaussian_Bandwidth_0.0#
ATT
1996_2000
Kernel1,2
_Gaussian_Bandwidth_0.0#
ATT
ATT
1999_2003
Kernel1,2
_Gaussian_Bandwidth_0.0#
23
6.1 Qualitative Analysis of the Effects of DTTs on FDI
The most generous interpretation of the results I present here is that there is very weak
evidence of a positive effect of DTTs on FDI. A slightly more conservative interpretation of the
evidence is that DTTs do not have any effect on FDI. I subscribe to the latter interpretation both
because the weak preliminary evidence is not robust to sensible alternative empirical specifications,
and because it agrees with a qualitative analysis of DTTs and their potential for an effect on FDI.
Firstly, I interpret the lack of a statistically significant effect of DTTs on FDI as evidence that
DTTs do not have any effect on FDI rather than it being the net result of a positive effect offset by a
negative effect. As I show in Section 2, the existence of a DTT will not be a disincentive for the MNE
to locate in the treaty-partner country. Without a negative effect to offset a positive effect, the lack of
evidence of an impact should be attributed to DTTs not having any effect on FDI.
But, why is there no effect of DTTs on FDI? Looking at the top 10 developed country
exporters, which account for 83% of the total developed country annual outward FDI flows34
, each
one of them has a foreign tax credit or exemption mechanism (or some combination of the two) in
place that unilaterally relieves double taxation regardless of whether it occurs in a treaty-partner
country or not35
. Therefore, if there is exposure to double taxation, a DTT is not needed to be in place
to eliminate it. There are domestic provisions which achieve the same result. Furthermore, to the
extent that withholding taxes have the potential to affect FDI36
, because DTTs include negotiated caps
on the withholding taxes that the Host country can impose, this will encourage FDI. However, as
pointed out by Christians (2005), LDCs are increasingly unilaterally reducing their statutory
withholding tax rates to make themselves a more attractive location to FDI regardless of a treaty.
Looking at the same 10 Home countries, and a sample of 10 potential Host countries (Table 9,
Appendix 4) we see that the non-treaty withholding tax rates are in most cases very close to the treaty-
34
As per the annual outward FDI flows for the year 2010. The countries are: Australia, Belgium, Canada,
France, Germany, Japan, Netherlands, Sweden, Switzerland, and the United States. Source: UNCTADstat at
www.unctad.org. 35
As per a review of the PricewaterhouseCoopers Worldwide Tax Summaries Online available at
www.taxsummaries.pwc.com. 36
The potential effect can be limited. In the case that the Home country exempts qualifying repatriated foreign
income from taxation, withholding taxes do represent a direct cost to the MNE. If the Home country uses a
foreign tax credit mechanism on repatriation, then the withholding taxes only represent a cost to the MNE to the
extent that they exceed the Home taxes otherwise payable.
24
negotiated rates, and in some cases even better37
. Therefore, the key economic benefits that are
attributed to DTTs can be and are achieved unilaterally by Home and Host countries and hence,
available to the MNE regardless of the treaty status of the Home to Host countries in question. As to
the other potential benefits of a DTT - fiscal certainty, stability and the signalling of a favourable Host
investment climate - these are incidental and do not appear to be enough to influence the MNE’s FDI
locational decisions. This makes sense as other economic and institutional determinants of FDI
location, (Host workforce skill levels, rule of law, infrastructure, etc.) will far outweigh the incidental
reputational benefits attributable to the DTT, (Christians, 2005). Taken together, it is not actually
surprising that DTTs are not living up to the expectation of attracting FDI.
This is not to imply that DTTs are or will necessarily become irrelevant. Country-pairs are
still entering into them. The point is that the evidence does not support what is usually the expected
and largest potential benefit of DTTs to LDCs: to attract foreign direct investment. However, DTTs
are still relevant to partner countries with respect to personal taxation. As discussed, the information
sharing clauses38
are valuable in combatting personal tax evasion. Furthermore, DTTs also contain
articles which aim to mitigate double taxation at the personal level, including the taxation of cross-
border employment, pension and other sources of personal income39
. Also as discussed, the
information sharing aspect of DTTs is also relevant to cross-border transactions between non-
associated enterprises as the respective tax authorities must rely on each other to access information.
The benefits to double taxation treaties exist, but, they are less than expected.
This is consistent with the evidence that country-pairs have and continue to be entering into
DTTs at a constant but relatively slow rate. For additional insight, I conduct a Duration Analysis
(available online at www.econ.cam.ac.uk/postgrad/plb22) which shows that country-pairs are entering
into DTTs, but, they are not rushing to enter into them as we would expect if they had the intended
effect on FDI.
37
In the latter case, the lower non-treaty rate will also apply between treaty countries. 38
Tax Information Exchange Agreements (TIEAs) is another OECD project and is an alternative to the
information sharing provisions in DTTs. To date, these are largely entered into between OECD and tax haven
countries. 39
Whether these considerations would or are better provided for unilaterally is a discussion that is outside the
scope of this paper.

25
7. Conclusion
A key motivation for entering into DTTs is the elimination of double taxation so as to increase
FDI flows. LDCs are both in need of and actively seeking FDI but, as net importers of it, they are also
exposed to significant costs from the tax concessions that are made by entering into DTTs. Using a
propensity score matching and difference-in-differences estimation strategy I show that DTTs do not
have any effect on FDI. This evidence is consistent across all three of the periods that I analyse and is
robust to variations in the bandwidth parameter of the kernel matching algorithm, alternative
empirical specifications and matching algorithm. This evidence is in contrast to the previous literature
which has conflicting results. However, my results are derived from an empirical strategy that uses
improved empirical specifications and a more appropriate transformation of the dependent variable.
To substantiate the empirical results, I qualitatively analyse DTTs in connection with the
related domestic tax provisions. I show that Home countries unilaterally eliminate double taxation,
which removes the key economic benefit of DTTs as it relates to the MNE decision-making process
on FDI location. I also indicate the trend for Host countries to unilaterally reduce their non-treaty
withholding tax rates, which removes the other potential benefit that a DTT would have to attract FDI.
I also show that DTTs should not have a disincentive effect on an MNE’s foreign direct investment
location. The DTT’s inclusion of transfer pricing and exchange of information clauses is already
provided for at the domestic level and applies regardless of any DTT. Furthermore, anti-treaty
shopping clauses only restrict access to the benefits of a DTT which makes it irrelevant to the MNE
that cannot take advantage of it.
This evidence is relevant to the LDC policymaker when weighing the potential costs and
benefits of entering into a DTT with a developed country. The key economic benefit of attracting FDI
is not present. If the LDC has or will be decreasing its non-treaty withholding tax rates, then that
potential cost of the DTT is also not present. Therefore, the policymaker needs to carefully consider
what benefits the LDC is seeking from the DTT, (information-sharing, signalling of a foreign-
investment friendly environment, etc.) and whether they are worth the costs of negotiating and
effecting a DTT. If not, the evidence suggests that the resources may be better spent on other FDI
enhancing activities.

Appendix 1
26
1193
2651 2976
0
500
1000
1500
2000
2500
3000
3500
0
20
40
60
80
100
120
140
Cu
mu
lati
ve
An
nu
al
DTTs Annual
DTTs Cumulative
Figure 1: Double Taxation Treaties
source: UNCTADstat, www.unctad.org and WIR (2004, .., 2011)
0.15
1.40
1.97
1.24
0
0.5
1
1.5
2
2.5
Figure 2: Inward FDI Flows by Type of Economy, Trillion $USD
Developed Countries Less Developed CountriesWorld source: UNCTADstat, www.unctad.org
0
0.5
1
1.5
2Figure 3: Outward FDI Flows by Type of Economy, Trillion $USD
Developed Countries Less Developed Countries source: UNCTADstat, www.unctad.org
0.0
5.0
10.0
15.0
20.0
25.0
30.0
%
of
GD
P
Personal Tax Corporate Tax
Figure 5_Tax Revenue as % of GDP
source: www.oecd-ilibrary.org/taxation.
Appendix 2
27
Figure 4: Overview of the Canadian International Tax System1,2
Border Border
Foreign Branch
_Permanent Establishment located in _Incorporated / separate entity for the
foreign country, taxable in Foreign. purpose of holding such foreign activity.
_Branch income immediately included in _Permanent Establishment located in
Canadian MNE's income, taxable in foreign country, taxable in Foreign.
Canada.
_Foreign tax credit offset against
Canadian taxes otherwise payable.
_No double taxation.
Foreign Affiliate_≥ 10% but < 50%
_Consitutes Portfolio Income. Controlled Foreign Affiliate_≥ 50%
_Taxable in Canada as income received.
_Foreign tax credit offset against
Canadian taxes otherwise payable.
_No double taxation.
_Foreign Accrual Property Income _Not taxable in Canada as earned.
rules applicable. _Potentially taxable as repatriated.
_Foreign tax credit available.
_No double taxation.
_Income qualifies as Exempt _Income qualifies as Taxable
Surplus. Surplus.
_Dividends not taxable in _Dividends taxable in Canada
Canada. as received.
_No double taxation. _Foreign tax credit available
for any withholding tax and
underlying corporate tax.
_No double taxation.
(1) Compiled from the Natural Resources Canada website, www.nrcan.gc.ca/minerals-metals/business-market/3854
(2) This overview is with respect to the payment of dividends (being the most common and intuitve way to think about the
repatriation of foreign profits). Similar principles alleviate double taxation with respect to other passive income.
DTT No DTT
Canadian MNE
Foreign Subsidiary2
Ownership?
< 10% of Common Shares
Passive Income Active Business Income

Appendix 3
28
Table 5: Probit Model_Propensity Score Estimation_Effective DTTs_Comprehensive Specification
Dependent Variable = DTTE
Covariates Coeff x 103
z-stat Coeff x 103
z-stat Coeff x 103
z-stat
Sum_GDPij -0.0959 0.34 0.2785 0.93 -0.3300 1.45
(Diff_GDPij)2
0.0000 0.59 0.0000 0.72 0.0001 2.10 **
Diff_Skillij -3.5176 0.48 -9.5567 1.76 -6.6189 1.34
(Diff_SkijxDiff_GDPij) -0.0049 1.18 0.0007 0.16 -0.0057 1.48
Trade Costi 10.4553 2.00 ** -0.0148 0.01 0.9164 0.51
Trade Costj 4.0624 1.54 -2.4935 0.78 2.6018 0.77
Invest Costs j -80.0459 1.21 -115.6682 2.14 ** -164.8495 2.48 **
(T Costj x Sk Diff2) 0.0036 1.77 -0.0023 1.07 -0.0033 1.18
Distanceij -0.0819 3.00 *** -0.0552 2.29 ** -0.0770 3.21 ***
GDP per capitaj 0.0574 2.09 ** 0.0349 0.88 0.0249 0.79
GDP Grwth Rtj 6.0241 0.26 51.0007 1.60 -36.8574 1.25
Nat Res Abundj -9.4895 2.59 *** -6.8480 1.61 -1.5543 0.34
Exchg Ratej -0.7447 1.50 0.2102 1.28 -1.7480 2.86 ***
Inflation Ratej -0.5044 0.97 6.7205 1.13 -14.1036 1.50
Colonial Ties ij 289.7394 0.69 47.3109 0.09 513.6405 1.03
Common Langij 142.7857 0.49 288.7748 0.85 553.5431 1.50
Com Legal Originij 284.5575 1.44 109.8774 0.63 199.4937 1.12
Telephone Lines j -18.1818 1.13 -16.5813 1.29 -19.7974 1.63
Electicity Prod'n j - - 0.0000 1.16 0.0000 2.62 ***
Rule_Lawj 222.8235 2.44 ** 172.6722 1.25 500.9046 3.09 ***
CEE_CISj 252.4894 0.42 808.7466 2.35 ** 1113.5260 3.96 ***
BITRij 629.4364 1.93 474.9696 2.36 ** -81.3351 0.44
Corp Tax Ratei (proxied) -3.7403 0.19 -8.5649 0.41 -16.7622 0.77
Corp Tax Ratej (proxied) 2.1140 0.13 5.4019 0.20 -36.2452 1.54
Sum_DTTEsij 17.2563 3.07 *** 18.0494 3.57 *** 24.0467 4.85 ***
N 808 618 774
Pseudo-R2
0.21 0.25 0.36
Balancing Property1
satisfied satisfied satisfied
% Treated obs. on Common Support 100% 100% 100%
The coefficients are reported at (the estimate x 103). *** denotes significance at the 1% level; ** at the 5% level.
(1) The significance level for the Balancing Property tests has been adjusted for a 'Bonferroni Correction' as
recommended by Lee (2006).
1991_1995 1996_2000 1999_2003
Table 1_Examples of Negotiated DTT Withholding Tax Rate Reductions
Host Countries:
Dividends Interest Royalties Dividends Interest Royalties Dividends Interest Royalties
Non-Treaty Rate2
33 33 33 30 30 30 20 20 20
Home Countries
Canada 15 / 23 15 10 15 / 25 10 / 15 25 10 / 15 0 / 10 10
France 10 / 15 10 10 10 / 15 10 / 15 15 10 / 15 0 / 10 / 15 10
Germany 11 / 15 13 10 10 / 15 10 / 15 10 / 15 10 / 15 0 / 10 10 / 15
United Kingdom 15 / 23 13 10 15 / 25 10 / 15 15 / 25 10 / 15 0 / 10 10 / 15
United States 10 / 15 13 10 20 / 25 10 / 15 15 / 25 10 / 15 0 / 10 0 / 10(1) Average (2008 - 2010) total inward FDI flows are 2.5 to 10 times that of the average total outward FDI flows for these countries, as per
the FDI Flow data available at the UNCTAD STAT, www.unctad.org. (2) As per PwC's Worldwide Tax Summaries Online,
www.taxsummaries.pwc.com. (3) The lower treaty withholding tax rates are available with respect to particular circumstances including
ownership threshold criteria, industry-specific rates, or other similar qualifying criteria. (4) These countries were chosen on the basis of
being large FDI exporters who have DTTs in place with the selected Host countries.
Witholding Tax Rates_% (rounded to nearest %)
Jamaica1
Phillipines1
Indonesia1
Treaty Rates2,3
Appendix 4
29
Table 9: Treaty versus non-Treaty Dividend6 Withholding Tax Rates
Host Countries: Brazil1
China1
Hong Kong1
India1
Russia1
Kuwait2
Morocco2
Montenegro2
Namibia2
Zimbabwe2
Non-Treaty Rate4
: 0 10 0 0 15 0 10 9 10 15
Home Countries3
Australia - 15 - 15 5 / 15 - - - - -
Belgium 10 / 15 10 0 15 15 10 7 / 10 10/ 15 - -
Canada 15 10 / 15 - 15 / 25 15 5/ 15 10 - - 10
France 15 10 0 10 5 / 10 / 15 0 10 5/ 15 5 10
Germany - 10 - 10 5 / 15 5/ 15 5 / 10 15 10 10
Japan 13 10 0 10 10 / 15 - - - - -
Netherlands 15 10 0 10 5 / 15 10 10 5/ 15 - 10
Sweden 25 5 / 10 - 10 5 / 15 - - 5/ 15 5 15
Switzerland - 10 0 10 5 / 15 15 7 / 10 5/ 15 - -
United States - 10 - 15 / 25 5 / 10 - 10 - - -
(1) Sampled from the upper half of the distribution of the 2010 inward FDI flow recipient LDC countries. (2) Sampled from the lower half of the distribution of
the 2010 inward FDI flow recipient LDC countries. (3) Top 10 of the 2010 outward FDI flow source developed countries. (1) - (3): As per the FDI flow data
available at the UNCTADstat, www.unctad.org. (4) As per PWC's Worldwide Tax Summaries Online, www.taxsummaries.pwc.com. (5) The lower treaty rates
are available with respect to particular circumstances including ownership threshold criteria, industry specific rates, or other similar qualifying criteria. (6) This
example focuses on dividend withholding tax rates as dividends are the most intuitive example of the repatriation of profits. The same comparison for the
interest and royalties withholding tax rates shows the same convergence in treaty and non-treaty rates.
Dividends_Witholding Tax Rates_% (rounded to nearest %)
Treaty Rates4,5
Table 8: Nearest Neighbour Matching1
1991_1995 1996_2000 1999_2003 1991_1995 1996_2000 1999_2003 1991_1995 1996_2000 1999_2003
DTTE ATT ATT ATT ATT ATT ATT ATT ATT ATT
∆FDI Flows_(t+1-t-4) 0.85 -0.18 0.27 1.30 0.84 -0.03 1.37 0.28 0.61
(0.48) (0.12) (0.39) (0.64) (0.55) (0.04) (0.70) (0.18) (0.84)
∆FDI Flows_(t+2-t-4) 1.25 1.07 0.75 1.42 0.52 0.42 2.15 1.31 1.84
(0.86) (0.75) (0.76) (1.03) (0.34) (0.54) (1.74) (0.92) (1.68)
∆FDI Flows_(t+3-t-4) -0.56 -0.47 1.38 0.82 -0.67 1.39 -0.20 -0.24 0.89
(0.36) (0.64) (1.22) (0.39) (0.53) (1.23) (0.13) (0.26) (0.85)
Absolute value of the t-statistics appear below the coefficients.*** denotes significance at the 1% level; ** at the 5% level. (1) Calculated using
heteroskedasticity-robust s.e.'s adjusted for a ''Moulton Correction Factor' to allow for clustering at the Home country level (Angrist and Pischke, 2009)
Effective DTTs
Parsimonious Parsimonious + (lagged) FDI Comprehensive
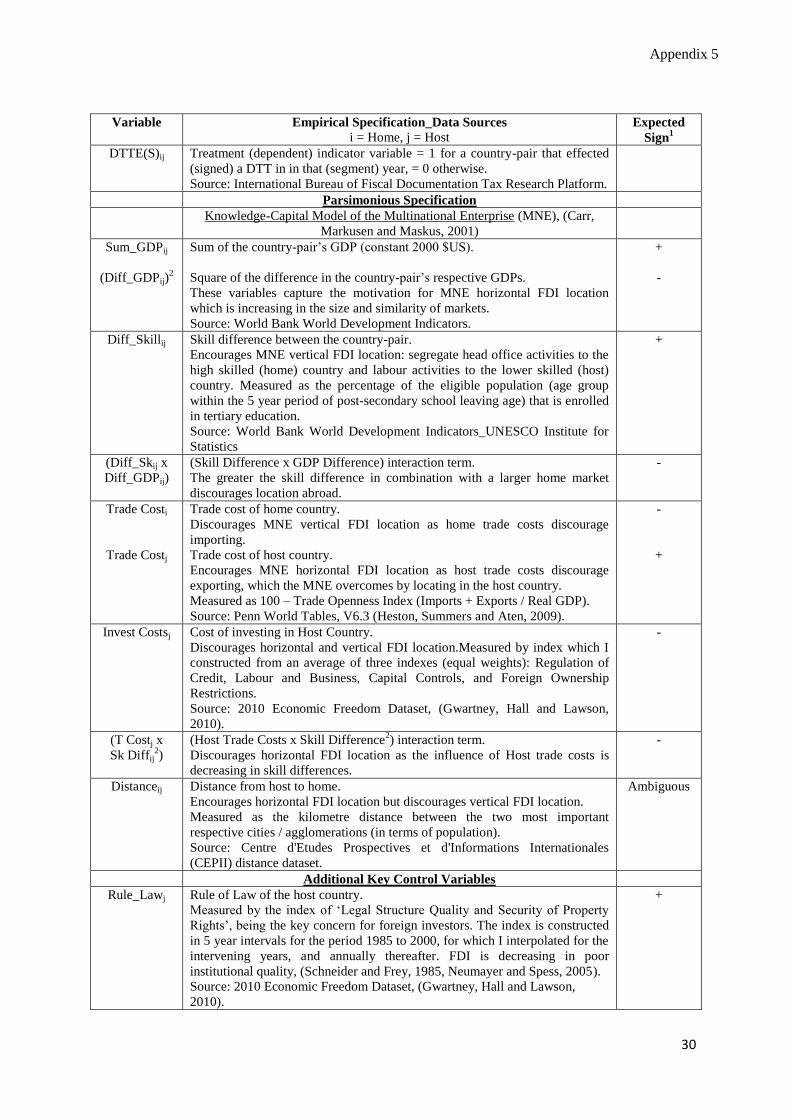
Appendix 5
30
Variable
Empirical Specification_Data Sources
i = Home, j = Host Expected
Sign1
DTTE(S)ij
Treatment (dependent) indicator variable = 1 for a country-pair that effected
(signed) a DTT in in that (segment) year, = 0 otherwise.
Source: International Bureau of Fiscal Documentation Tax Research Platform.
Parsimonious Specification
Knowledge-Capital Model of the Multinational Enterprise (MNE), (Carr,
Markusen and Maskus, 2001)
Sum_GDPij
(Diff_GDPij)2
Sum of the country-pair’s GDP (constant 2000 $US).
Square of the difference in the country-pair’s respective GDPs.
These variables capture the motivation for MNE horizontal FDI location
which is increasing in the size and similarity of markets.
Source: World Bank World Development Indicators.
+
-
Diff_Skillij
Skill difference between the country-pair.
Encourages MNE vertical FDI location: segregate head office activities to the
high skilled (home) country and labour activities to the lower skilled (host)
country. Measured as the percentage of the eligible population (age group
within the 5 year period of post-secondary school leaving age) that is enrolled
in tertiary education.
Source: World Bank World Development Indicators_UNESCO Institute for
Statistics
+
(Diff_Skij x
Diff_GDPij)
(Skill Difference x GDP Difference) interaction term.
The greater the skill difference in combination with a larger home market
discourages location abroad.
-
Trade Costi
Trade Costj
Trade cost of home country.
Discourages MNE vertical FDI location as home trade costs discourage
importing.
Trade cost of host country.
Encourages MNE horizontal FDI location as host trade costs discourage
exporting, which the MNE overcomes by locating in the host country.
Measured as 100 – Trade Openness Index (Imports + Exports / Real GDP).
Source: Penn World Tables, V6.3 (Heston, Summers and Aten, 2009).
-
+
Invest Costsj
Cost of investing in Host Country.
Discourages horizontal and vertical FDI location.Measured by index which I
constructed from an average of three indexes (equal weights): Regulation of
Credit, Labour and Business, Capital Controls, and Foreign Ownership
Restrictions.
Source: 2010 Economic Freedom Dataset, (Gwartney, Hall and Lawson,
2010).
-
(T Costj x
Sk Diffij2)
(Host Trade Costs x Skill Difference2) interaction term.
Discourages horizontal FDI location as the influence of Host trade costs is
decreasing in skill differences.
-
Distanceij Distance from host to home.
Encourages horizontal FDI location but discourages vertical FDI location.
Measured as the kilometre distance between the two most important
respective cities / agglomerations (in terms of population).
Source: Centre d'Etudes Prospectives et d'Informations Internationales
(CEPII) distance dataset.
Ambiguous
Additional Key Control Variables
Rule_Lawj
Rule of Law of the host country.
Measured by the index of ‘Legal Structure Quality and Security of Property
Rights’, being the key concern for foreign investors. The index is constructed
in 5 year intervals for the period 1985 to 2000, for which I interpolated for the
intervening years, and annually thereafter. FDI is decreasing in poor
institutional quality, (Schneider and Frey, 1985, Neumayer and Spess, 2005).
Source: 2010 Economic Freedom Dataset, (Gwartney, Hall and Lawson,
2010).
+

Appendix 5
31
CEE_CISj
CEE refers to a Central and Eastern European country. CIS refers to a
Commonwealth of Independent States country.
Indicator variable = 1 in 1990 or later for a host country that was formerly a
member of the Soviet Union, = 0 otherwise.
Countries that transition from centrally planned to market-based economies
seek foreign investment to support firm privatisation (Grosse and Trevino,
2005). DTTs are expected to encourage inward FDI.
+
BITRij
Indicator variable = 1 for a country-pair that has a ratified Bilateral Investment
Treaty. BITs are entered into to increase FDI, (Egger and Pfaffermayr, 2004).
Source: UNCTAD_International Investment Agreement Tools.
+
Corp Tax
Ratej
Host country corporate tax rate. Proxied by general government final
consumption expenditure as a percentage of GDP, (Egger et al., 2006).
Higher tax cost discourages FDI location, (De Mooij and Ederveen, 2003,
Blonigen, 2005).
Source: World Bank World Development Indicators.
_
Sum_DTTEsij Cumulative number of effective DTTs that the Home and Host country have
with other countries.
Assuming a decreasing marginal cost to entering a DTT, the propensity to sign
a DTT will be increasing in this total.
Source: Constructed from the treaty listings at the International Bureau of
Fiscal Documentation Tax Research Platform.
+
Comprehensive Specification
= Parsimonious Specification plus the following control variables:
GDP per
capitaj
GDP Grwth
Rtj
GDP per capita (constant 2000 $US) of the host country.
Annual GDP growth rate of the host country.
These GDP variables capture market quality (Gallagher and Birch, 2006),
thereby encouraging FDI location.
Source: World Bank World Development Indicators.
+
+
Nat Res
Abundj
Natural Resource abundance of host country.
Encourages extractive industry location (Gallagher and Birch, 2006).
I constructed an index in accordance with the literature (Ross, 2004): (Ores
and Metal Exports + Fuel Exports) / Total Merchandise Exports.
Source: World Bank World Development Indicators.
+
Exchg Ratej
(Level) Exchange rate of the host country with the USD.
Recognising competing incentives and conflicting literature, on balance,
depreciation of the host currency is expected to encourage inward FDI
(Blonigen, 2005).
Source: World Bank World Development Indicators.
+
Inflation Ratej
Inflation in the host country, (measured via the GDP deflator).
An often included determinant in the FDI literature for being indicative of the
level of macroeconomic stability (Schneider and Frey, 1985). It can also be
thought of as discouraging FDI due to the uncertainty it creates for Net
Present Value investment decision criteria.
Source: World Bank World Development Indicators.
-
Colonial Tiesij
Colonial Ties.
Indicator variable = 1 if home/host have ever shared a colonial link, = 0
otherwise.
An included control variable (Hallward-Driemeier, 2003) which can be
interpreted as a special relationship between home and host country, which
may cause home to be pre-disposed to investing in host and / or host to being
pre-disposed to entering into a DTT with home.
Source: CEPII Distance dataset.
+
Common
Langij
Common Language.
An indicator variable = 1 if Home and Host share an official language or
national language (spoken by ≥ 20% of the population).
An included control variable (Hallward-Driemeier, 2003) in the determinants
of FDI, where a different language can be interpreted as a barrier to
investment.
Source: CEPII Distance dataset.
+

Appendix 5
32
1. Anticipated signs are from the perspective of the literature on the determinants of FDI and how such
determinants have been estimated to impact FD or from the perspective of how such controls are anticipated to
directly affect the likelihood of a DTT being entered into.
Matching
Variable Empirical Specification_Data Source
FDI Flowsij
Outward (real) FDI flows from home to host country.
Windows:
∆FDI[(t+1) – (t-4)]
∆FDI[(t+2) – (t-4)]
∆FDI[(t+3) – (t-4)]
Where t = the year of measure with respect to the treatment variable, DTTE(S).
Source: OECD International Direct Investment Statistics Version 2010.
Investment Deflators in constant 2000 $USD, source: World Bank World Development
Indicators.
Home Countries:
Australia, Austria, Belgium, Canada, Czech Republic, Denmark, Finland, France, Germany, Greece,
Hungary, Iceland, Ireland, Italy, Japan, Korea, Luxembourg, Mexico, Netherlands, New Zealand,
Norway, Poland, Portugal, Slovak Republic, Spain, Sweden, Switzerland, Turkey, United Kingdom,
United States.
Com Legal
Originij
Common Legal Origin.
An indicator variable = 1 if home and host share a common legal origin, (UK,
French, German, Scandinavian, or Socialist), = 0 otherwise.
To control for the disincentive that different legal systems may have on a
foreign investor, and the increased ease that the same legal system will likely
have on negotiating a DTT.
Source: Professor Andrei Schleifer’s dataset (Harvard University, Dept. of
Economics), ‘The Economic Consequences of Legal Origins’ (2008).
+
Telephone
Linesj
Electricity
Prod’nj
Number of telephone mainlines per 100 people in the host country.
Electricity production in kilowatt hours for the host country.
These variables are taken as indicators of the level of infrastructure of the host
country, (Egger and Pfaffermayr, 2004), which is conducive to FDI location.
Source: World Bank World Development Indicators.
+
+
Corp Tax
Ratei
Home country corporate tax rate. Proxied by general government final
consumption expenditure as a percentage of GDP, (Egger et al., 2006).
Higher Home tax cost will increase the sensitivity of the MNE to double-
taxation and increase the need for expected benefits of a DTT.
Source: World Bank World Development Indicators.
+
FDI Flowsij
Outward (real) FDI flows from Home to Host country.
Endogeneity control, (Gilligan and Hoddinott, 2007).
Source: OECD International Direct Investment Statistics Version 2010.
Investment Deflators in constant 2000 $USD, source: World Bank World
Development Indicators.
-
33
References
Abadie, A., Imbens, G.W., (2006). “Large Sample Properties of Matching Estimators for Average
Treatment Effects”. Econometrica, 74(1): 235 – 267.
Abadie, A., Imbens, G.W., (2008). “Notes and Comments on the Failure of Bootstrap for Matching
Estimators”. Econometrica, 74(1): 235 – 267.
Angrist, J.D., Pischke, J-S.,(2009). “Mostly Harmless Econometrics. An Empiricist’s Companion”.
Princeton, NJ: Princeton University Press.
Baker, P.L., (2011). “Who Enters into Bilateral Investment Treaties and Do They Have an Impact on
Foreign Direct Investment?”, forthcoming.
Barthel, F., Busse, M., Neumayer E., (2010). “The Impact of Double Taxation Treaties on Foreign
Direct Investment: Evidence from a Large Dyadic Panel Data”. Contemporary Economics Policy,
28(3): 366 – 377.
Blonigen, B.A., (2005). “A Review of the Empirical Literature on FDI Determinants”. National
Bureau of Economic Research (NBER) Working Paper, No. 11299. Cambridge, MA: NBER.
Blonigen, B.A., Davies, R.B., (2002). “Do Bilateral Tax Treaties Promote Foreign Direct
Investment”. National Bureau of Economic Research (NBER) Working Paper, No. 8834. Cambridge,
MA: NBER.
Blonigen, B.A., Davies, R.B., (2004). “The Effects of Bilateral Tax Treaties on U.S. FDI Activity”.
International Tax and Public Finance, 11(5): 601 – 622.
Blonigen, B.A., Wang, M., (2004). “Inappropriate Pooling of Wealthy and Poor Countries in
Empirical FDI Studies”. National Bureau of Economic Research (NBER) Working Paper, No. 10378.
Cambridge, MA: NBER.
Cameron, A.C., Trivedi, P.K., (2010). “Microeconometrics Using Stata”, Revised Edition.Texas:
Stata Press.
Carr, D., Markusen, J.R., Maskus, K.E., (2001). “Estimating the Knowledge-Capital Model of the
Multinational Enterprise”. The American Economic Review, 91(3): 693 – 708.
Christians, A., (2005). “Tax Treaties for Investment and Aid to Sub-Saharan Africa, A Case Study”.
Brooklyn Law Review, 71(2): 639 – 700.
Cobb-Clark, D.A., Crossley, T., (2003). “Econometrics for Evaluations: An Introduction to Recent
Developments”. The Economic Record, 79(247): 491 – 511.
Coupé, T., Orlova, I., Skiba, A., (2009). In Sauvant and Sachs’ (Eds.), The Effect of Treaties on
Foreign Direct Investment: 171-224. New York, NY: Oxford University Press.
Dagan, T., (2000). “The Tax Treaties Myth”. New York University Journal of International Law and
Politics, 32: 939 – 996.
De Mooij, R.A., Ederveen, S., (2003). “Taxation and Foreign Direct Investment: A Synthesis of
Empirical Research”, International Tax and Public Finance, 10: 673 – 693.
Egger, P., Pfaffermayr, M., (2004). “The Impact of Bilateral Investment Treaties on Foreign Direct
Investment”. Journal of Comparative Economics, 32: 788 – 804.

34
Egger, P., Larch, M., Pfaffermayr, M., Winner, H., (2006). “The Impact of Endogenous Tax Treaties
on Foreign Tax Investment: Theory and Evidence”. The Canadian Journal of Economics, 39(3): 901-
931.
Gilligan, D.O., Hoddinott, J., (2007). “Is there Persistence in the Impact of Emergency Food Aid?
Evidence on Consumption, Food Security, and Assets in Rural Ethiopia”. American Journal of
Agricultural Economics, 89(2): 225 – 242.
Grosse, R., Trevino, L.J., (2005). “New Institutional Economics and FDI Location in Central and
Eastern Europe”. Management International Review, 45(2): 123 – 145. Reprinted (2009) in Sauvant
and Sachs’ (Eds.), The Effect of Treaties on Foreign Direct Investment: 273-294. New York, NY:
Oxford University Press.
Hallward-Driemeier, M. (2003). “Do Bilateral Investment Treaties Attract FDI? Only a Bit…and
They Could Bite”. World Bank Policy Research Working Paper, No.3121. Washington, DC: World
Bank.
IMF, International Monetary Fund, (1993). “Balance of Payments Manual”, 5ed. Washington, DC:
IMF
Kopeinig, S., Caliendo, M., (2005). “Some Practical Guidance for the Implementation of Propensity
Score Matching”. The Insitute for the Study of Labour (IZA) Discussion paper No. 1588. Bonn: IZA
Lee, W-S.,(2006). “Propensity Score Matching and Variations on the Balancing Test”, Melbourne
Institute of Applied Economic and Social Research Working Paper (August 2006). Melbourne:
Melbourne Institute of Applied Economic and Social Research. Available at SSRN:
http://ssrn.com/abstract=936782
Neumayer, N., Spess, L., (2005). “Do Bilateral Investment Treaties Increase Foreign Direct
Investment to Developing Countries?”. World Development, 33(10): 1567 – 1585.
Neumayer, E., (2007). “Do double taxation treaties increase foreign direct investment to developing
countries?”. Journal of Development Studies, 43(8): 1501-1519
OECD, (2010a). “Model Tax Convention on Income and on Capital, Condensed Version”. Paris:
Organisation for Economic Co-operation and Development.
OECD, (2010b). “Transfer Pricing Guidelines for Multinational Enterprises and Tax
Administrations”. Paris: Organisation for Economic Co-operation and Development.
Rosenbaum, P.R., Rubin, D.B., (1983). “The central role of the propensity score in observational
studies for causal effects”. Biometrika 70(1): 41 - 55
Schneider, F., Frey, B.S., (1985). “Economic and Political Determinants of Foreign Direct
Investment”. World Development, 13(2): 161 – 175.
UN, (2001). “United Nations Model Double Taxation Convention between Developed and
Developing Countries”. New York: United Nations Publications.
UNCTAD, (2004). “World Investment Report 2004 - The Shift Toward Services”. New York and
Geneva: United Nations Publications.
UNCTAD, (2005). “World Investment Report 2005 - TNCs and the Internationalization of R&D”.
New York and Geneva: United Nations Publications.
35
UNCTAD, (2006). “World Investment Report 2006 - FDI from Developing and Transitioning
Economies: Implications for Development”. New York and Geneva: United Nations Publications.
UNCTAD, (2007). “World Investment Report 2007 – Transnational Corporations, Extractive
Industries and Development”. New York and Geneva: United Nations Publications.
UNCTAD, (2008). “World Investment Report 2008 – Transnational Corporations, and the
Infrastructure Challenge”. New York and Geneva: United Nations Publications.
UNCTAD, (2009). “World Investment Report 2009 – Transnational Corporations, Agricultural
Production and Development”. New York and Geneva: United Nations Publications.
UNCTAD, (2010). “World Investment Report 2010 – Investing in a Low Carbon Economy”. New
York and Geneva: United Nations Publications.
UNCTAD, (2011). “World Investment Report 2011 – Non-Equity Modes of International Production
and Development”. New York and Geneva: United Nations Publications.
Data Citations
Gwartney, J.D., Hall, J.C., Lawson, R. (2010). “Economic Freedom Dataset”. Economic Freedom of
the World: 2010 Annual Report. Fraser Institute. www.freetheworld.com.
Heston, A., Summers, R., Aten, B., (2009). “Penn World Table Version 6.3”. Center for International
Comparisons of Production, Income and Prices. University of Pennylvania.
Stata Programmes
Becker, S.O., Ichino, A. (2002). “Pscore and related att* programmes to perform propensity score
matching and average treatment effect estimations”. Available at: http://sobecker.de/
Abadie, A., Drukker, D., Herr, J.L., Imbens, G.W., (2004). “Implementing Matching Estimators for
Average Treatment Effects in Stata”. The Stata Journal, 4(3): 290 – 311.
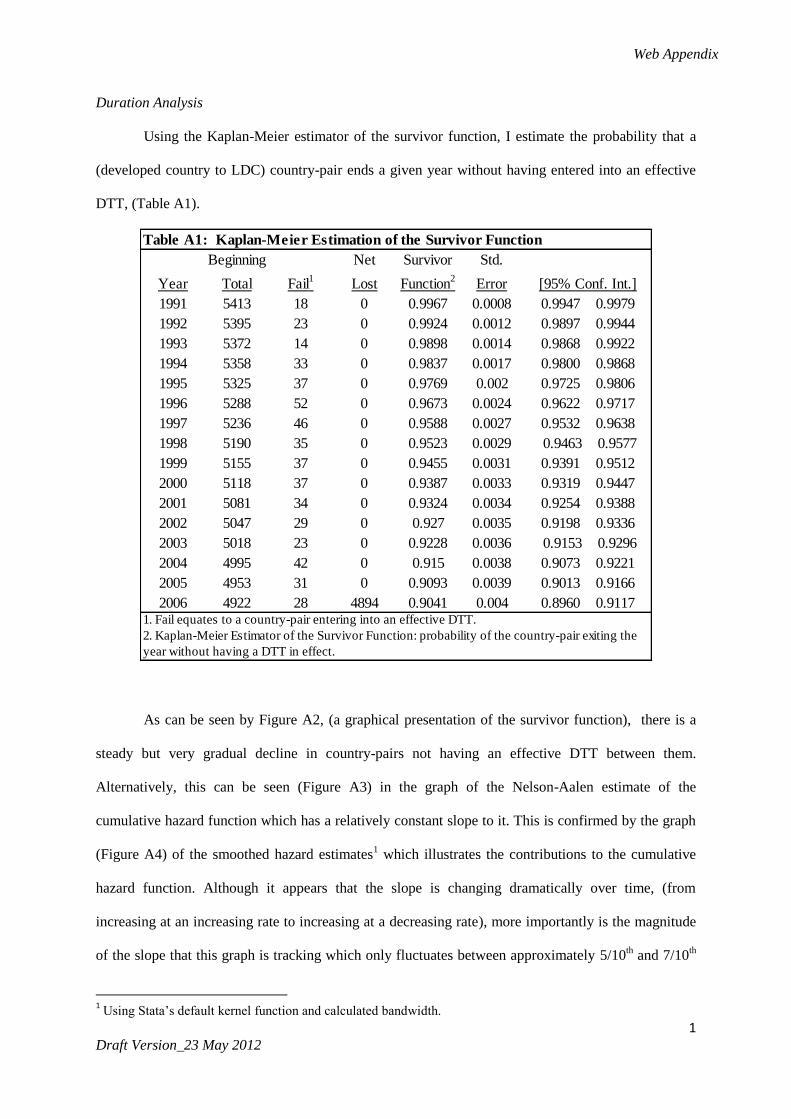
Web Appendix
1 Draft Version_23 May 2012
Duration Analysis
Using the Kaplan-Meier estimator of the survivor function, I estimate the probability that a
(developed country to LDC) country-pair ends a given year without having entered into an effective
DTT, (Table A1).
As can be seen by Figure A2, (a graphical presentation of the survivor function), there is a
steady but very gradual decline in country-pairs not having an effective DTT between them.
Alternatively, this can be seen (Figure A3) in the graph of the Nelson-Aalen estimate of the
cumulative hazard function which has a relatively constant slope to it. This is confirmed by the graph
(Figure A4) of the smoothed hazard estimates1 which illustrates the contributions to the cumulative
hazard function. Although it appears that the slope is changing dramatically over time, (from
increasing at an increasing rate to increasing at a decreasing rate), more importantly is the magnitude
of the slope that this graph is tracking which only fluctuates between approximately 5/10th and 7/10
th
1 Using Stata’s default kernel function and calculated bandwidth.
Table A1: Kaplan-Meier Estimation of the Survivor Function
Beginning Net Survivor Std.
Year Total Fail1
Lost Function2
Error
1991 5413 18 0 0.9967 0.0008
1992 5395 23 0 0.9924 0.0012
1993 5372 14 0 0.9898 0.0014
1994 5358 33 0 0.9837 0.0017
1995 5325 37 0 0.9769 0.002
1996 5288 52 0 0.9673 0.0024
1997 5236 46 0 0.9588 0.0027
1998 5190 35 0 0.9523 0.0029
1999 5155 37 0 0.9455 0.0031
2000 5118 37 0 0.9387 0.0033
2001 5081 34 0 0.9324 0.0034
2002 5047 29 0 0.927 0.0035
2003 5018 23 0 0.9228 0.0036
2004 4995 42 0 0.915 0.0038
2005 4953 31 0 0.9093 0.0039
2006 4922 28 4894 0.9041 0.0041. Fail equates to a country-pair entering into an effective DTT.
2. Kaplan-Meier Estimator of the Survivor Function: probability of the country-pair exiting the
year without having a DTT in effect.
0.9622 0.9717
[95% Conf. Int.]
0.9947 0.9979
0.9897 0.9944
0.9868 0.9922
0.9800 0.9868
0.9725 0.9806
0.9153 0.9296
0.9073 0.9221
0.9013 0.9166
0.8960 0.9117
0.9532 0.9638
0.9463 0.9577
0.9391 0.9512
0.9319 0.9447
0.9254 0.9388
0.9198 0.9336
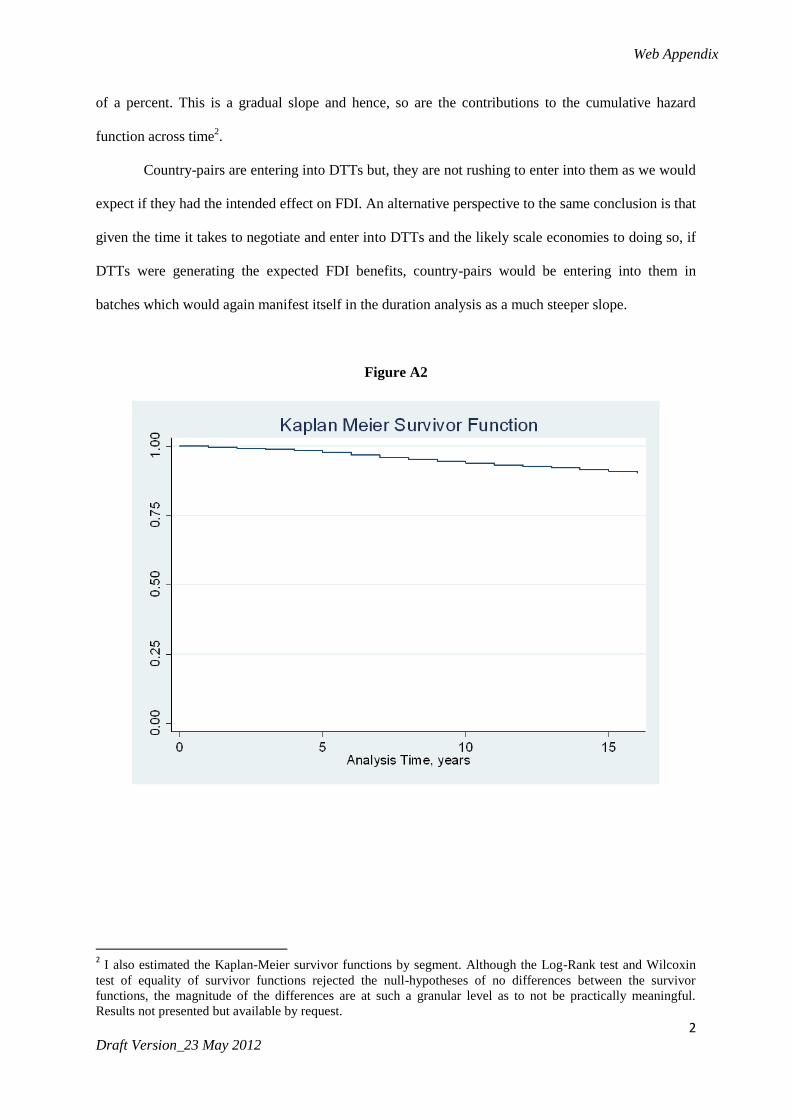
Web Appendix
2 Draft Version_23 May 2012
of a percent. This is a gradual slope and hence, so are the contributions to the cumulative hazard
function across time2.
Country-pairs are entering into DTTs but, they are not rushing to enter into them as we would
expect if they had the intended effect on FDI. An alternative perspective to the same conclusion is that
given the time it takes to negotiate and enter into DTTs and the likely scale economies to doing so, if
DTTs were generating the expected FDI benefits, country-pairs would be entering into them in
batches which would again manifest itself in the duration analysis as a much steeper slope.
Figure A2
2 I also estimated the Kaplan-Meier survivor functions by segment. Although the Log-Rank test and Wilcoxin
test of equality of survivor functions rejected the null-hypotheses of no differences between the survivor
functions, the magnitude of the differences are at such a granular level as to not be practically meaningful.
Results not presented but available by request.
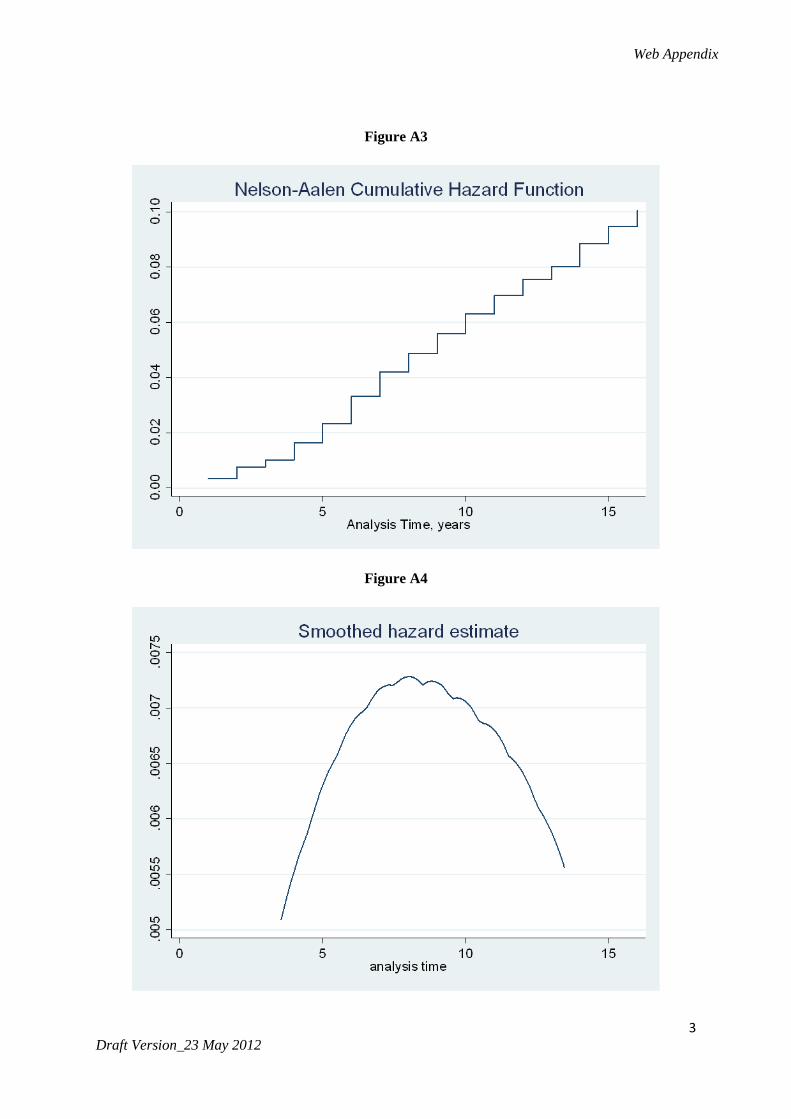
Web Appendix
3 Draft Version_23 May 2012
Figure A3
Figure A4