Embed Size (px)
Citation preview
Clean Air Task Force 1
An Analysis of Diesel Air Pollution and Public Health in America
(v. 1.3)
February 2005 Revision June 2005
18 Tremont St., Suite 530, Boston, MA 02108
Clean Air Task Force 2
Tel: (617) 624-0234
Read CATF’s Report: Diesel and Health in America: The
Lingering Threat: www.catf.us/goto/dieselreport
Find out about the risks of breathing diesel exhaust where you
live: http://catf.us/goto/dieselhealth Credits: Written by L. Bruce Hill, Ph.D., Senior Scientist Edited by Conrad Schneider, Barbara Warren and Joe Chaisson The John Merck Fund, The Heinz Endowments, The Beldon Fund, The New York Community Trust, and The Turner Foundation have provided support for the Clean Air Task Force Diesel Initiative, including this report. Dana Lowell and Tom Balon of M.J. Bradley & Associates and David Schoengold of MSB Energy Associates provided technical support. This report may be updated from time with additional technical information and analysis as it becomes available. Check the CATF web for future versions.

Clean Air Task Force 3
Introduction Today there are approximately 13 million diesels at work in the U.S. helping to build our cities and landscape, transport food and goods and takes us to and from work. However, more than three quarters of the U.S. population lives in cities near intersections, bus stops, highways, bus and truck depots, heavy industry and construction sites—all concentrated emissions sources. Rural areas with their agriculture and industry suffer their share of health effects from agricultural, construction and industrial diesel emissions too. The following report describes the methodology and results of a Clean Air Task Force analysis of death and disease from diesel in the U.S. each year, a more detailed companion to Diesel and Health in America: The Lingering Threat (available at: www.catf.us/goto/dieselreport/.) This report may be updated from time with additional technical information and analysis as it becomes available. Check the CATF web for future versions. Diesel engine exhaust contains a number of a potent carcinogens—particulate matter (largely elemental and organic carbon soot) coated in gaseous organic substances such as formaldehyde and PAH (a group of super-toxic gases that attach themselves to particles), shown to result in adverse birth outcomes in polish children and respiratory irritants such as acrolein. Other effects of living with diesel exhaust-laden air in our communities are elevated asthma attacks, emergency room visits, hospitalizations, heart attacks, strokes and untimely deaths. In children, particulate matter has also been associated with crib death. A 2004 study showed that particles and nitrogen dioxide have chronic adverse effects on lung development 10-18 year olds leading to deficits in lung function as the children reached adulthood. What’s more, diesel engines also release other gases such as carbon monoxide and nitrogen oxides that form ground level ozone. Results of the California Children’s Health Study suggest that ozone is associated with birth defects and new diagnoses of asthma. Soot from diesels also has an impact on the environment. Black carbon absorbs heat in the atmosphere and is a major cause of—and potential solution to-- climate warming. For all these reasons –and more—diesel exhaust is perhaps the most damaging source of air pollution in the U.S. today. But given today’s technology there is no need for diesels on the road today to leave clouds of acrid black smoke in their wake. While the burning sensation from breathing diesel exhaust is familiar, the serious consequences of breathing diesel exhaust are less well-understood by the public. Here, for the first time, we present estimates of health damages from diesels for counties all over America. For the risk in your state or county see Clean Air Task Force’s interactive web site at: http://www.catf.us/goto/dieselhealth . Medical studies have consistently demonstrated that diesel exhaust poses a serious health threat. For example EPA estimates that rules for newly manufactured highway and nonroad engines will save over 20,000 lives annually by 2030, the benefits of which will
Clean Air Task Force 4
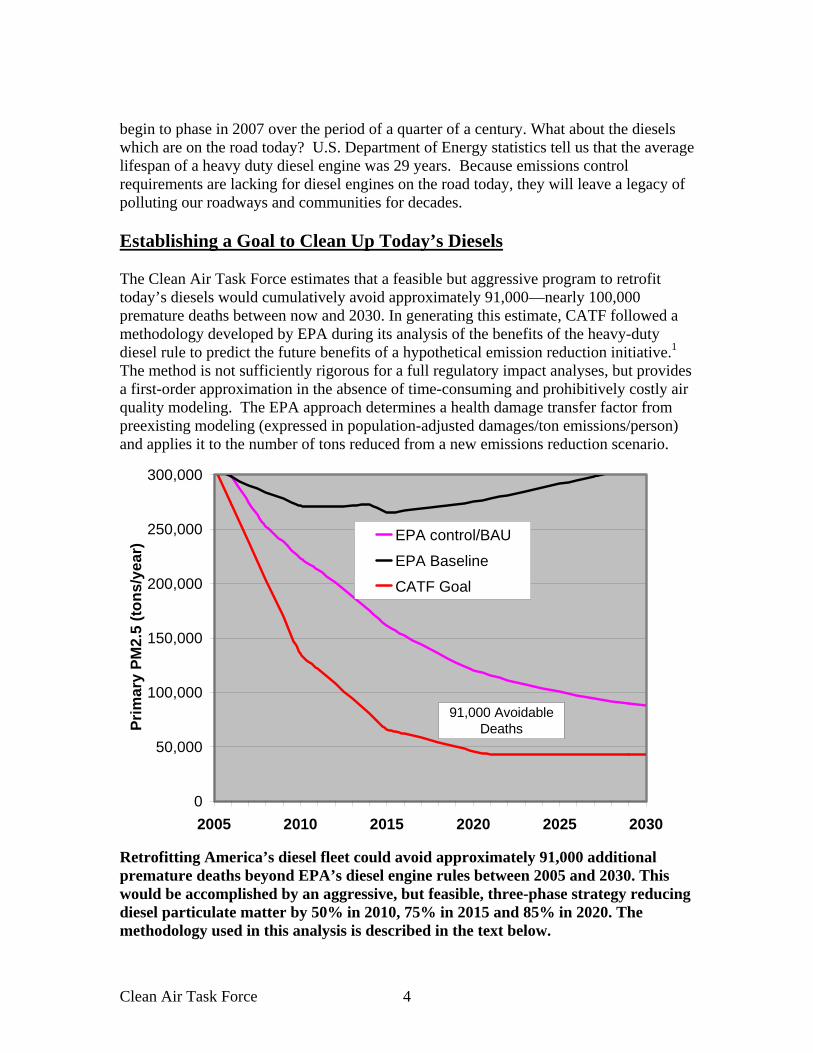
begin to phase in 2007 over the period of a quarter of a century. What about the diesels which are on the road today? U.S. Department of Energy statistics tell us that the average lifespan of a heavy duty diesel engine was 29 years. Because emissions control requirements are lacking for diesel engines on the road today, they will leave a legacy of polluting our roadways and communities for decades. Establishing a Goal to Clean Up Today’s Diesels The Clean Air Task Force estimates that a feasible but aggressive program to retrofit today’s diesels would cumulatively avoid approximately 91,000—nearly 100,000 premature deaths between now and 2030. In generating this estimate, CATF followed a methodology developed by EPA during its analysis of the benefits of the heavy-duty diesel rule to predict the future benefits of a hypothetical emission reduction initiative.1 The method is not sufficiently rigorous for a full regulatory impact analyses, but provides a first-order approximation in the absence of time-consuming and prohibitively costly air quality modeling. The EPA approach determines a health damage transfer factor from preexisting modeling (expressed in population-adjusted damages/ton emissions/person) and applies it to the number of tons reduced from a new emissions reduction scenario.
0
50,000
100,000
150,000
200,000
250,000
300,000
2005 2010 2015 2020 2025 2030
Prim
ary
PM2.
5 (to
ns/y
ear)
EPA control/BAU
EPA Baseline
CATF Goal
91,000 Avoidable Deaths
Retrofitting America’s diesel fleet could avoid approximately 91,000 additional premature deaths beyond EPA’s diesel engine rules between 2005 and 2030. This would be accomplished by an aggressive, but feasible, three-phase strategy reducing diesel particulate matter by 50% in 2010, 75% in 2015 and 85% in 2020. The methodology used in this analysis is described in the text below.
Clean Air Task Force 5
To determine annual reductions in directly-emitted PM2.5 from diesels between 2005 and 2030 in CATF’s three phase strategy, the following emissions trajectories were required (see emissions table below): Source of Emissions: EPA nonroad and highway diesel regulatory impact analyses. See Endnote for details. 2
⇒ Baseline Emissions: total PM2.5 prior to 2007 and non-road rules. (Source of emissions
⇒ “Business as Usual (BAU) PM2.5 emissions: baseline less emissions reductions from EPA diesel rules.
⇒ Clean-up Goal: the three-phase emissions clean-up goal trajectory calculated from reductions in baseline emissions of 50% in 2010, 75% in 2015, and 85% in 2020. This goal incorporates emissions reductions from both retrofits and EPA-required emissions reductions in the regulatory pipeline (e.g. 2007 highway diesel and non-road diesel rules.) The goal is conceptually modeled after the state of California’s Diesel Risk Reduction Plan that sets forth a goal of a 75% reduction in diesel PM emissions by 2010 and an 85% reduction by 2020.
The difference between EPA’s BAU and the CATF cleanup goal yields the incremental PM2.5 emission reductions benefit of the three-phase cleanup goal that would be realized beyond EPA’s new engine rules. To calculate the avoided death benefits of the three-phase strategy, a transfer factor was multiplied times tons of directly-emitted particulate matter reduced below the BAU scenario every year from 2005 to 2030. The benefits were then adjusted by future annual population for the 25 year period. Benefits were summed from 2005 to 2030 in order to provide an estimate of the benefits of the three-phase strategy. The three-phase approach leads to an estimate of about 91,000 avoidable deaths. These result from a benefit of about 3- 4,000 avoidable deaths per year summed over 25 years. In the context of the approximate 20,000 avoidable lives each year from rules for new highway and nonroad diesel engines, these added benefits are modest.

Clean Air Task Force 6
Pop (millions) Year EPA control/BAU EPA Baseline CATF Goal Delta Below BAU Avoidable Deaths294 2005 306,985 306,985 306,985 0 0297 2006 298,170 298,170 272,732 25,438 1,235299 2007 274,762 290,324 238,480 36,282 1,776301 2008 252,524 283,718 204,227 48,297 2,384304 2009 238,571 277,801 169,974 68,597 3,414306 2010 223,252 271,444 135,722 87,530 4,391309 2011 212,973 271,077 121,855 91,118 4,608311 2012 200,740 271,095 107,988 92,752 4,729314 2013 188,031 271,614 94,121 93,910 4,827316 2014 174,961 272,357 80,254 94,707 4,907319 2015 161,759 265,546 66,386 95,373 4,982322 2016 152,478 267,084 62,319 90,159 4,747324 2017 143,583 268,766 58,251 85,332 4,529327 2018 135,536 270,883 54,183 81,353 4,352329 2019 127,762 272,865 50,115 77,647 4,187332 2020 120,538 275,060 46,048 74,490 4,048334 2021 115,721 278,139 43,000 72,721 3,983337 2022 111,362 281,318 43,000 68,362 3,773340 2023 107,719 284,917 43,000 64,719 3,600342 2024 103,955 288,180 43,000 60,955 3,417345 2025 100,446 291,539 43,000 57,446 3,245348 2026 97,179 294,910 43,000 54,179 3,084350 2027 94,546 298,621 43,000 51,546 2,957353 2028 91,921 302,005 43,000 48,921 2,827356 2029 89,449 305,400 43,000 46,449 2,705358 2030 87,490 309,194 43,000 44,490 2,610
SUM --AVOIDED DEATHS (2005-2030) 91,315 PM2.5 Emissions Data and Population Used in Projection of Avoidable Deaths 2005-2030 (Tons of PM 2.5) (revised). Table includes emissions from category C-3 marine diesel engines running on residual oil.3 The transfer factor (relating deaths to PM2.5 emissions) was calculated as ratio of estimated premature deaths associated with diesel PM2.5 concentrations from modeled ASPEN 1999 directly-emitted diesel particulate matter.
ASPEN 1999 Direct PM2.5 tons 357,352Abt - ASPEN 1999 Mortality 15,915Factor: (Deaths /1000 tons) 0.0445
New Findings on Community Diesel Risk in the U.S.: Non Cancer Health Effects Diesel is everywhere in our environment. Diesel engine powers our economy, but in doing so, exacts a high price in disease and death. While a plethora of medical studies have identified relationships between diesel no single study has yet to quantify the disease and death attributable to diesel across America—until now. While EPA’s diesel

Clean Air Task Force 7
regulations will require a slow phase-in of emissions controls on new engines in the future, this analysis projects that today’s diesels today are responsible for thousands of unnecessary deaths annually. Diesel exhaust is a hazardous mix of carcinogens, respiratory irritants and inflammatory agents. Diesel particles act like magnets for toxic organic chemicals, many carcinogenic.4 The smallest diesel particles (“ultrafine particles”) can penetrate deep into the lung and enter the bloodstream bringing with them an array of toxins. Diesel exhaust contains 40 hazardous air pollutants (HAPs) listed by EPA, 15 of which are listed by the International Agency for Research on Cancer (IARC) as known, probable, or possible carcinogens. Thousands of medical studies have also documented that particulate matter, a “criteria” air pollutant regulated by EPA, is associated with adverse health impacts such as crib death in infants, reduced lung growth in children, and cardiovascular disease and related premature death in adults.5 This report highlights the results of a study by EPA’s contractor, Abt Associates, and commissioned by Clean Air Task Force, quantifying the disease and death due to fine particulate matter (soot, or PM2.5) from today’s diesel engines in 2010 in the U.S. each year. The national impacts analysis is based on the same air quality modeling platform (REMSAD) as earlier EPA benefits analyses including the Clean Skies Act and the 2007 Heavy Duty Engine Rule (see detailed discussion below). Abt estimates that 21,000 people will die prematurely every year in the U.S. as a result of exposure to particulate matter soot from mobile diesel sources in the U.S. (e.g. on-road highway engines, construction diesels engines, rail and marine engines.). In addition, Abt projects that an estimated 27,000 people suffer heart attacks and 2.4 million work loss days are associated with diesel, impacting America’s productivity each year. In additional to the national-scale health effects, Clean Air Task Force commissioned Abt to estimate local impacts using a separate approach based only on directly-emitted diesel particles in 1999 (using ASPEN model.) From this county level-analysis, Clean Air Task Force generated state and metropolitan area results. These community risk estimates are available on the web at http://catf.us/goto/dieselhealth/. As described in more detail below, your individual risk varies with location and lifestyle for example if you live in an area near a bus terminal, construction site, freight terminal or warehouse facility, your exposure will be higher than indicated by the average countywide risks estimated in this report. Results for selected states and metropolitan areas are summarized below.

Clean Air Task Force 8
National Annual Diesel Health Impacts 6 Annual Cases in the U.S., 2010
Premature Deaths-Adults 21,000 Case of Lung Cancer 3,000Non-fatal Heart Attacks 27,000Asthma Attacks 410,000Chronic Bronchitis 12,000Work Loss Days 2,400,000Restricted Activity Days 14,000,000Hospital Admissions 15,000Emergency Room Visits for Asthma 15,000
Health impacts of directly emitted diesel particulate matter, and secondary particulate matter from sulfur dioxide and nitrogen oxides in 2010. For more information see Abt report: http://www.catf.us/projects/diesel/dieselhealth/learn.php?site=0.
Clean Air Task Force 9
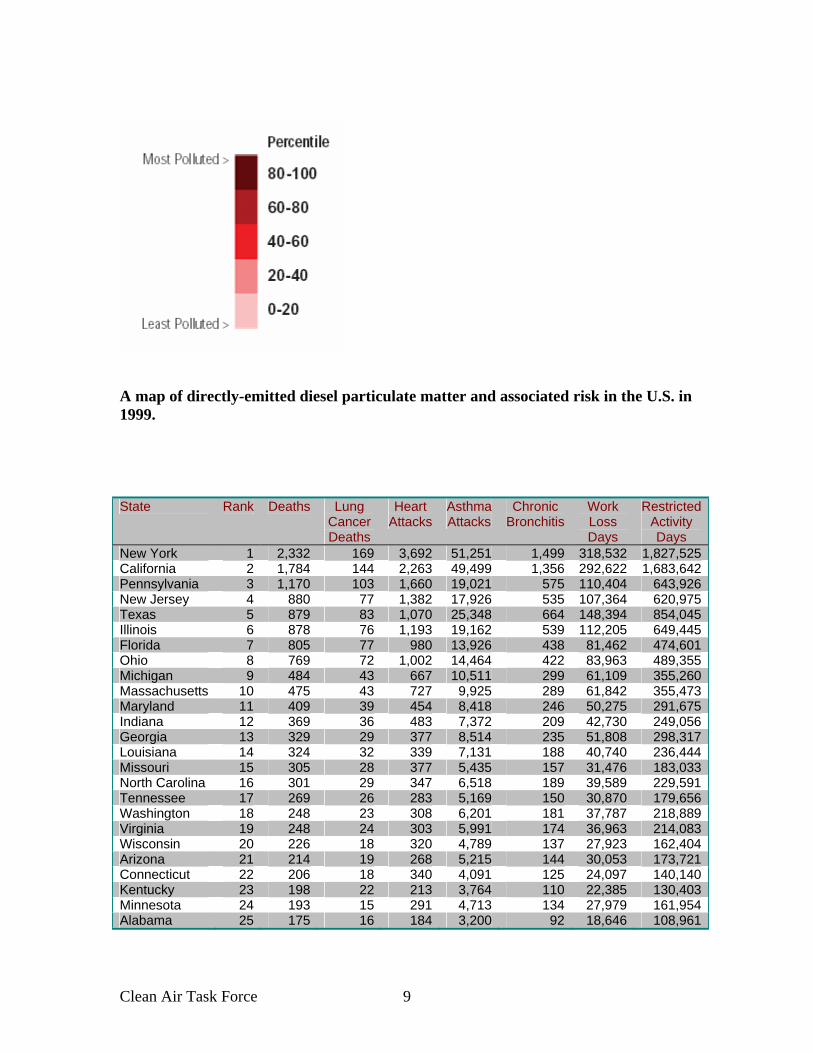
A map of directly-emitted diesel particulate matter and associated risk in the U.S. in 1999. State Rank Deaths Lung
Cancer Deaths
Heart Attacks
Asthma Attacks
Chronic Bronchitis
Work Loss Days
Restricted Activity Days
New York 1 2,332 169 3,692 51,251 1,499 318,532 1,827,525California 2 1,784 144 2,263 49,499 1,356 292,622 1,683,642Pennsylvania 3 1,170 103 1,660 19,021 575 110,404 643,926New Jersey 4 880 77 1,382 17,926 535 107,364 620,975Texas 5 879 83 1,070 25,348 664 148,394 854,045Illinois 6 878 76 1,193 19,162 539 112,205 649,445Florida 7 805 77 980 13,926 438 81,462 474,601Ohio 8 769 72 1,002 14,464 422 83,963 489,355Michigan 9 484 43 667 10,511 299 61,109 355,260Massachusetts 10 475 43 727 9,925 289 61,842 355,473Maryland 11 409 39 454 8,418 246 50,275 291,675Indiana 12 369 36 483 7,372 209 42,730 249,056Georgia 13 329 29 377 8,514 235 51,808 298,317Louisiana 14 324 32 339 7,131 188 40,740 236,444Missouri 15 305 28 377 5,435 157 31,476 183,033North Carolina 16 301 29 347 6,518 189 39,589 229,591Tennessee 17 269 26 283 5,169 150 30,870 179,656Washington 18 248 23 308 6,201 181 37,787 218,889Virginia 19 248 24 303 5,991 174 36,963 214,083Wisconsin 20 226 18 320 4,789 137 27,923 162,404Arizona 21 214 19 268 5,215 144 30,053 173,721Connecticut 22 206 18 340 4,091 125 24,097 140,140Kentucky 23 198 22 213 3,764 110 22,385 130,403Minnesota 24 193 15 291 4,713 134 27,979 161,954Alabama 25 175 16 184 3,200 92 18,646 108,961

Clean Air Task Force 10
25 states with the highest modeled adult diesel PM health impacts in 1999. State Rank Asthma
ER Visits
Acute Bronchitis
Lower Respiratory Symptoms
Upper Respiratory Symptoms
New York 1 1486 3255 38280 31464Texas 2 1393 2010 23182 18547Illinois 3 1183 1458 16800 13423Ohio 4 874 1100 12658 10105California 5 800 3829 44081 35177Florida 6 656 995 11419 9088Michigan 7 651 828 9515 7574Pennsylvania 8 573 1398 16161 12979New Jersey 9 541 1290 14938 12020Indiana 10 453 563 6471 5161Georgia 11 437 645 7414 5902Maryland 12 424 635 7324 5864Louisiana 13 398 546 6391 5229Missouri 14 330 417 4795 3829North Carolina 15 318 473 5423 4305Wisconsin 16 291 370 4251 3386Virginia 17 290 431 4944 3928Minnesota 18 286 361 4153 3308Massachusetts 19 282 639 7445 6037Tennessee 20 257 382 4386 3489Kentucky 21 186 276 3171 2525Alabama 22 162 244 2796 2222South Carolina 23 145 219 2508 1992Connecticut 24 124 305 3507 2794Iowa 25 122 154 1761 1399 25 states with the highest number of modeled diesel PM health impacts on children in 1999.
Metropolitan Area Rank Deaths Lung Cancer Deaths
Heart Attacks
New York-Newark-Edison, NY-NJ-PA MSA 1 2,729 202 4,342Los Angeles-Long Beach-Santa Ana, CA MSA 2 918 72 1,193Chicago-Naperville-Joliet, IL-IN-WI MSA 3 755 65 1,021Philadelphia-Camden-Wilmington, PA-NJ-DE-MD MSA
4 727 69 990
Boston-Cambridge-Quincy, MA-NH MSA 5 391 36 602Houston-Baytown-Sugar Land, TX MSA 6 356 35 444San Francisco-Oakland-Fremont, CA MSA 7 291 23 358Miami-Fort Lauderdale-Miami Beach, FL MSA 8 288 23 358Baltimore-Towson, MD MSA 9 285 28 290Detroit-Warren-Livonia, MI MSA 10 279 25 378Pittsburgh, PA MSA 11 237 21 340Washington-Arlington-Alexandria, DC-VA-MD- 12 226 19 302

Clean Air Task Force 11
WV MSA St. Louis, MO-IL MSA 13 217 20 263Dallas-Fort Worth-Arlington, TX MSA 14 205 19 258Atlanta-Sandy Springs-Marietta, GA MSA 15 199 17 239Tampa-St. Petersburg-Clearwater, FL MSA 16 185 18 210Phoenix-Mesa-Scottsdale, AZ MSA 17 183 16 230Cleveland-Elyria-Mentor, OH MSA 18 180 15 232Cincinnati-Middletown, OH-KY-IN MSA 19 171 18 219Seattle-Tacoma-Bellevue, WA MSA 20 165 15 208San Diego-Carlsbad-San Marcos, CA MSA 21 150 13 191Portland-Vancouver-Beaverton, OR-WA MSA 22 140 13 157Minneapolis-St. Paul-Bloomington, MN-WI MSA
23 133 11 205
New Orleans-Metairie-Kenner, LA MSA 24 128 13 131Riverside-San Bernardino-Ontario, CA MSA 25 123 10 142Baton Rouge, LA MSA 26 102 10 109Milwaukee-Waukesha-West Allis, WI MSA 27 95 8 130Columbus, OH MSA 28 84 9 113Indianapolis, IN MSA 29 82 8 107Louisville, KY-IN MSA 30 82 9 91Memphis, TN-MS-AR MSA 31 81 7 79Kansas City, MO-KS MSA 32 79 8 109Providence-New Bedford-Fall River, RI-MA MSA
33 76 7 119
Bridgeport-Stamford-Norwalk, CT MSA 34 69 6 121Beaumont-Port Arthur, TX MSA 35 65 7 65Orlando, FL MSA 36 65 7 85Allentown-Bethlehem-Easton, PA-NJ MSA 37 65 5 101Hartford-West Hartford-East Hartford, CT MSA 38 63 5 100Las Vegas-Paradise, NV MSA 39 62 7 71Virginia Beach-Norfolk-Newport News, VA-NC MSA
40 62 6 65
40 Metropolitan areas with modeled highest numbers of PM diesel health impacts in 1999.
Metropolitan Area (Per 100,000 population)
Rank Deaths
Lung Cancer Deaths
Heart Attacks
Asthma Attacks
Beaumont-Port Arthur, TX MSA 1 29.49 2.96 29.28 518.36Baton Rouge, LA MSA 2 26.85 2.58 28.88 649.68New York-Newark-Edison, NY-NJ-PA MSA
3 25.06 1.85 39.88 550.68
Philadelphia-Camden-Wilmington, PA-NJ-DE-MD MSA
4 21.56 2.03 29.34 383.22
Trenton-Ewing, NJ MSA 5 20.33 1.65 30.79 406.56Baltimore-Towson, MD MSA 6 18.65 1.84 18.98 338.30Huntington-Ashland, WV-KY-OH MSA 7 17.85 1.84 18.14 264.14New Orleans-Metairie-Kenner, LA MSA 8 17.14 1.77 17.52 373.32Pittsburgh, PA MSA 9 15.25 1.38 21.83 218.36Cincinnati-Middletown, OH-KY-IN MSA 10 14.84 1.53 19.02 306.02Boston-Cambridge-Quincy, MA-NH MSA 11 14.82 1.35 22.80 321.03

Clean Air Task Force 12
Chicago-Naperville-Joliet, IL-IN-WI MSA 12 14.80 1.27 20.02 334.75Mobile, AL MSA 13 14.45 1.58 14.54 272.93Longview-Kelso, WA MSA 14 14.20 1.29 14.95 257.10Houston-Baytown-Sugar Land, TX MSA 15 14.20 1.40 17.70 458.01Allentown-Bethlehem-Easton, PA-NJ MSA
16 13.99 1.10 21.92 244.36
Cleveland-Elyria-Mentor, OH MSA 17 13.86 1.18 17.81 236.31Toledo, OH MSA 18 13.77 1.27 17.41 260.11Los Angeles-Long Beach-Santa Ana, CA MSA
19 13.75 1.08 17.87 413.55
Lancaster, PA MSA 20 13.75 1.04 22.10 273.46Scranton--Wilkes-Barre, PA MSA 21 13.63 0.92 17.97 164.89St. Louis, MO-IL MSA 22 13.61 1.25 16.51 240.25Reading, PA MSA 23 13.56 1.15 20.89 239.96Lake Charles, LA MSA 24 13.53 1.35 14.21 272.69Springfield, OH MSA 25 13.21 1.32 15.76 205.24Portland-Vancouver-Beaverton, OR-WA MSA
26 12.63 1.15 14.18 290.75
Bridgeport-Stamford-Norwalk, CT MSA 27 12.62 1.11 22.29 276.42Harrisburg-Carlisle, PA MSA 28 12.40 1.03 19.44 228.16York-Hanover, PA MSA 29 12.34 1.09 20.67 252.93Wheeling, WV-OH MSA 30 12.32 1.12 13.54 162.15Lebanon, PA MSA 31 12.25 1.02 19.00 202.21Evansville, IN-KY MSA 32 12.25 1.19 15.27 210.52Memphis, TN-MS-AR MSA 33 12.24 1.11 12.05 256.33Savannah, GA MSA 34 12.18 1.09 12.87 232.76Dayton, OH MSA 35 12.03 1.20 15.97 229.08Vineland-Millville-Bridgeton, NJ MSA 36 11.98 1.03 16.67 214.44Tampa-St. Petersburg-Clearwater, FL MSA
37 11.94 1.17 13.60 187.87
Louisville, KY-IN MSA 38 11.86 1.30 13.15 221.93Sandusky, OH MSA 39 11.81 1.26 15.15 187.61Kankakee-Bradley, IL MSA 40 11.73 1.03 14.00 205.2040 Metropolitan areas with modeled highest per capita adult diesel PM health impacts in 1999.
MSA Rank Asthma ER
Visits
Acute Bronchitis
Lower Respiratory Symptoms
Upper Respiratory Symptoms
New York-Newark-Edison, NY-NJ-PA MSA 1 1,742 3,838 45,076 36,978Chicago-Naperville-Joliet, IL-IN-WI MSA 2 1,065 1,306 15,058 12,047Houston-Baytown-Sugar Land, TX MSA 3 644 917 10,626 8,555Los Angeles-Long Beach-Santa Ana, CA MSA
4 459 2,168 25,012 20,014
Philadelphia-Camden-Wilmington, PA-NJ-DE-MD MSA
5 426 978 11,336 9,140
Detroit-Warren-Livonia, MI MSA 6 368 471 5,414 4,312Dallas-Fort Worth-Arlington, TX MSA 7 351 512 5,875 4,673Washington-Arlington-Alexandria, DC-VA-MD-WV MSA
8 305 452 5,187 4,128
Atlanta-Sandy Springs-Marietta, GA MSA 9 302 445 5,113 4,075
Clean Air Task Force 13
Baltimore-Towson, MD MSA 10 259 384 4,444 3,571Miami-Fort Lauderdale-Miami Beach, FL MSA
11 247 375 4,312 3,432
Boston-Cambridge-Quincy, MA-NH MSA 12 238 530 6,194 5,043St. Louis, MO-IL MSA 13 236 298 3,435 2,751Minneapolis-St. Paul-Bloomington, MN-WI MSA
14 221 279 3,201 2,550
Cincinnati-Middletown, OH-KY-IN MSA 15 213 272 3,145 2,523Cleveland-Elyria-Mentor, OH MSA 16 184 235 2,702 2,157New Orleans-Metairie-Kenner, LA MSA 17 160 210 2,495 2,085Tampa-St. Petersburg-Clearwater, FL MSA 18 135 203 2,335 1,863Baton Rouge, LA MSA 19 135 181 2,120 1,731Columbus, OH MSA 20 122 150 1,721 1,370Milwaukee-Waukesha-West Allis, WI MSA 21 121 153 1,763 1,406Indianapolis, IN MSA 22 112 140 1,611 1,281Kansas City, MO-KS MSA 23 107 135 1,552 1,234Pittsburgh, PA MSA 24 95 235 2,705 2,165Memphis, TN-MS-AR MSA 25 93 139 1,597 1,273San Francisco-Oakland-Fremont, CA MSA 26 88 417 4,811 3,848San Antonio, TX MSA 27 80 118 1,357 1,077Orlando, FL MSA 28 79 120 1,374 1,093Louisville, KY-IN MSA 29 78 112 1,291 1,029Phoenix-Mesa-Scottsdale, AZ MSA 30 75 352 4,051 3,225Charlotte-Gastonia-Concord, NC-SC MSA 31 75 111 1,271 1,010Virginia Beach-Norfolk-Newport News, VA-NC MSA
32 71 104 1,197 952
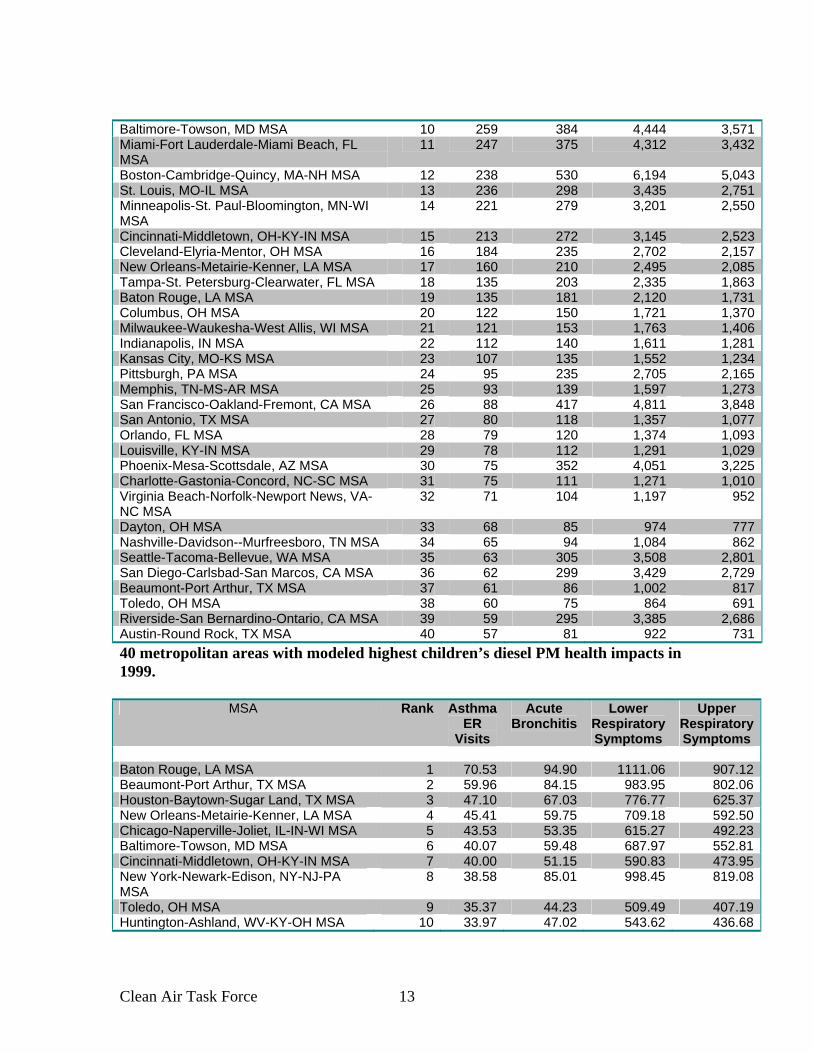
Dayton, OH MSA 33 68 85 974 777Nashville-Davidson--Murfreesboro, TN MSA 34 65 94 1,084 862Seattle-Tacoma-Bellevue, WA MSA 35 63 305 3,508 2,801San Diego-Carlsbad-San Marcos, CA MSA 36 62 299 3,429 2,729Beaumont-Port Arthur, TX MSA 37 61 86 1,002 817Toledo, OH MSA 38 60 75 864 691Riverside-San Bernardino-Ontario, CA MSA 39 59 295 3,385 2,686Austin-Round Rock, TX MSA 40 57 81 922 73140 metropolitan areas with modeled highest children’s diesel PM health impacts in 1999.
MSA Rank Asthma ER
Visits
Acute Bronchitis
Lower Respiratory Symptoms
Upper Respiratory Symptoms
Baton Rouge, LA MSA 1 70.53 94.90 1111.06 907.12Beaumont-Port Arthur, TX MSA 2 59.96 84.15 983.95 802.06Houston-Baytown-Sugar Land, TX MSA 3 47.10 67.03 776.77 625.37New Orleans-Metairie-Kenner, LA MSA 4 45.41 59.75 709.18 592.50Chicago-Naperville-Joliet, IL-IN-WI MSA 5 43.53 53.35 615.27 492.23Baltimore-Towson, MD MSA 6 40.07 59.48 687.97 552.81Cincinnati-Middletown, OH-KY-IN MSA 7 40.00 51.15 590.83 473.95New York-Newark-Edison, NY-NJ-PA MSA
8 38.58 85.01 998.45 819.08
Toledo, OH MSA 9 35.37 44.23 509.49 407.19Huntington-Ashland, WV-KY-OH MSA 10 33.97 47.02 543.62 436.68

Clean Air Task Force 14
Cleveland-Elyria-Mentor, OH MSA 11 33.82 43.08 495.81 395.78St. Louis, MO-IL MSA 12 33.03 41.74 481.52 385.57Lafayette, IN MSA 13 32.81 35.80 411.15 327.25Ann Arbor, MI MSA 14 32.80 37.54 431.25 343.30Dayton, OH MSA 15 32.32 40.29 463.61 370.08Detroit-Warren-Livonia, MI MSA 16 31.10 39.86 458.06 364.81Milwaukee-Waukesha-West Allis, WI MSA
17 30.66 38.72 445.29 355.16
Lake Charles, LA MSA 18 30.12 44.12 508.46 406.62Mobile, AL MSA 19 30.09 44.64 513.95 410.44Michigan City-La Porte, IN MSA 20 30.06 37.89 435.75 347.48Trenton-Ewing, NJ MSA 21 30.04 70.90 821.17 660.88Columbus, OH MSA 22 29.57 36.31 417.00 331.81Philadelphia-Camden-Wilmington, PA-NJ-DE-MD MSA
23 29.54 67.73 785.43 633.28
Springfield, OH MSA 24 29.53 37.04 426.02 339.89Evansville, IN-KY MSA 25 29.38 37.65 433.26 345.95Monroe, MI MSA 26 29.10 38.23 440.28 351.99Muncie, IN MSA 27 28.85 33.56 385.82 307.61Bloomington-Normal, IL MSA 28 28.50 33.07 379.34 301.39South Bend-Mishawaka, IN-MI MSA 29 28.46 35.02 402.39 320.55Kokomo, IN MSA 30 28.31 35.63 409.76 326.89Sandusky, OH MSA 31 28.02 36.34 418.08 333.68Elkhart-Goshen, IN MSA 32 28.01 35.23 404.86 322.66Minneapolis-St. Paul-Bloomington, MN-WI MSA
33 27.87 35.10 403.42 321.39
Indianapolis, IN MSA 34 27.55 34.40 394.92 314.09Kankakee-Bradley, IL MSA 35 27.51 34.96 401.41 319.44Memphis, TN-MS-AR MSA 36 27.27 40.73 468.48 373.64Rockford, IL MSA 37 27.01 34.51 396.56 315.89Louisville, KY-IN MSA 38 26.82 38.55 443.39 353.63Fort Wayne, IN MSA 39 26.75 33.66 386.44 307.48Atlanta-Sandy Springs-Marietta, GA MSA 40 26.74 39.31 452.02 360.3140 metropolitan areas with the modeled highest per capita children’s diesel PM health impacts in 1999.

Clean Air Task Force 15
21,000
17,000
14,000
12,000
5,000
24,000
0 5,000 10,000 15,000 20,000 25,000
Power Plant Emissions
Diesel Soot
Drunk Driving
HIV/AIDS
Firearm Homicide
Workplace
Annual Deaths
Annual deaths attributable to diesel particulate matter compared to other causes of death in the U.S.7 Diesel Exhaust-Related Cancer Risk in the U.S. CATF has calculated the average lifetime excess cancer risk posed by diesel for the nation and individual counties and states (48 states and the District of Columbia) as described in the methodology section below. Based on the national average diesel particulate matter concentration and using EPA’s range of lung cancer risk, we find average lung cancer risk ranges from 12 to 1210 cancers per million people over a 70-year lifetime.8 The same calculation using the State of California’s unit risk estimates a national average of 363 lung cancers per million people, 363 times greater than EPA’s “acceptable” level of one cancer in-a-million. For comparison, according to EPA’s 1999 National Air Toxics Assessment, the combined risk from all other air toxics is 48 per million.9 Therefore, diesel exhaust presents a lung cancer risk that is 7.5 times higher than the cancer risk of all other air toxics.10 (This estimate is based on the air toxics included in EPA’s 1996 National Air Toxic Assessment and inhalation as the only route of exposure.) In addition, CATF has calculated the cancer risk posed by diesel in counties in the lower 48 states and finds that residents of over two-thirds of U.S. counties experience a cancer risk greater than 100 in a million from diesel exhaust. Moreover, residents of eleven urban U.S. counties face a diesel cancer risk equal to 1,000 new cases of cancer in a population of one million. Applying California’s cancer unit risk for diesel particulate matter to the national average

Clean Air Task Force 16
concentration of directly-emitted diesel fine particles in 1999, results in a conservative estimate of 1,530 excess cases of lung cancer in the year 2005.11 The national estimates provided are calculated based on national average concentrations. Many areas of the country experience diesel PM levels well over 1 microgram, particularly urban areas and diesel hotspots. People who live in metropolitan areas with a high concentration of diesel vehicles and traffic feel their impacts most acutely. For example, the estimated risk of lung cancer from diesel in metropolitan areas is much higher than in areas with fewer diesels. In the rural counties we estimate a risk of 142 cancers per million based on the CARB unit risk, but three times that rate, 415 cancer per million, in urban counties. Therefore, the risk of lung cancer for people living in urban areas is three times that for those living in rural areas.12 The CATF website provides estimates for counties, cities and states. You can find the community cancer risk from diesel for your state, metropolitan area, and county on the web at: www.catf.us/goto/dieselhealth/. Personal risk varies with location and lifestyle. For example, if you live near a bus, truck, or train terminal, highway, construction site, or warehouse, or commute to work on congested roadways, your exposure may be higher than indicated by the county-wide average estimated here.
Methodology: How the Analysis was Performed. Estimates of Non-Cancer Health Effects from Diesel Particulate Matter I. National Health Impacts in 2010: To estimate the national health impacts from diesel engines in the U.S. , Clean Air Task Force utilized the same air quality modeling platform (REMSAD) used in EPA’s benefits analysis of the Clear Skies Act and the 2007 Heavy Duty Engine Rule regulatory impact analysis to model PM2.5 concentrations. CATF commissioned Abt Associates, EPA’s contractor for these analyses. The modeled health impacts of diesel particulate matter, Abt employed the same EPA science advisory board-approved methodology that has been used in numerous EPA regulatory impact analyses as well. A complete description

Clean Air Task Force 17
of Abt’s methodology and results for the 2010 analysis is available at: www.catf.us/goto/AbtREMSAD . The REMSAD (Regional Modeling System for Aerosols and Deposition)13 model was used by Abt for generating 2010 national health impacts. In the analysis Abt employed the identical platform and 2010 emissions inventory used by EPA for its Clear Skies Act analysis (see: http://www.epa.gov/air/clearskies/benefits.html.) The emissions inventory used in the analysis includes direct PM2.5, direct PM10, and primary elemental carbon and particulate matter precursor gas emissions NOX, SO2, VOC, NH3 from all sources, including non-road and highway diesel in 2010. Particulate matter concentrations from the REMSAD model include both primary (direct) and secondarily formed particles. REMSAD results were combined with PM2.5 monitoring data from 2001 to adjust the concentrations based on real-world PM2.5 concentrations. Abt Associates used a program they designed for EPA’s regulatory impact analyses, BenMAP (Benefits Mapping and Analysis Program)14 to predict health impacts in each grid cell using well known concentration-response functions (e.g. Pope 2002 for PM-related mortality) and appropriate populations. Air quality concentrations from both models were run through BenMAP and compiled at the county level and aggregated for states and metropolitan areas. Results reported are the average estimates; uncertainty was bounded by the 5th and 95th percentile values of estimated benefits. II. State, Metropolitan Area and Local Health Impacts in 1999: Using the same health benefits methodology, county-level health impacts were estimated using 1999 ASPEN model (Assessment System for Population Exposure Nationwide) ambient particulate matter concentrations.15 In the ASPEN model, ambient diesel particulate matter concentrations were generated with only directly-emitted diesel particulate matter in 1999, the latest emissions inventory available for directly-emitted diesel particulate matter. The ASPEN 1999 ambient diesel particulate matter concentrations were the bases for county health impacts generated by Abt using the BenMAP model described above. Results of the 1999 analysis may be found in Abt Associates’ report at www.catf.us/AbtASPEN/. State and MSA impacts were aggregated by CATF from the county level results.16 Estimates of Excess Lung Cancer Risk from Diesel Particulate Matter Cancer risk estimates were generated using the same ambient air quality data as used for the county-level non cancer health impacts described above: 1999 ASPEN model (Assessment System for Population Exposure Nationwide) ambient diesel particulate matter concentrations.17 The ASPEN model, ambient diesel particulate matter concentrations were generated with only directly-emitted diesel particulate matter emissions for 1999, the latest emissions inventory available for directly-emitted diesel particulate matter.
Clean Air Task Force 18
Excess lung cancer risk from diesel particulate matter were calculated by multiplying the average ambient directly-emitted diesel particulate matter concentration in the U.S. and each county, state and metropolitan area by the California Air Resources Board unit risk for diesel exhaust.18 (For more on California’s cancer unit risk for diesel exhaust see: Findings of the Scientific Review Panel on The Report on Diesel Exhaust as adopted at the Panel’s April 22, 1998, meeting. http://www.arb.ca.gov/toxics/dieseltac/de-fnds.pdf) Because EPA has declined to establish a unit risk for lung cancer attributable to diesel particulate matter (soot) CATF uses the California unit risk factor 3 X 10⁻⁴ (3 in 10,000) per microgram of diesel particulate matter in the air. The California unit risk is within the range of risk cited in the EPA Health Assessment for Diesel Exhaust, 10 -3 to 10 -5 (1 in 1,000 to 1 in 100,000) per microgram of diesel particulate matter in the air. (See: Health Assessment Document for Diesel Exhaust: Office of Research and Development, EPA/600/8-90/057F May 2002) at http://cfpub.epa.gov/ncea/cfm/recordisplay.cfm?deid=29060 ) Clean Air Task Force chose to use the California unit risk for a variety of reasons: a) California undertook a thorough review of diesel studies in the process of establishing the single diesel cancer unit risk; b) the CARB unit risk falls with EPA’s suggested risk range; and c) the CARB single unit risk provides for more efficient risk communication. Despite the inherent uncertainty in the use of the single cancer unit risk, even if the risk estimates were high by an order of magnitude (a factor of ten) most U.S. counties would still be characterized by an excess diesel cancer risk ten times greater EPA’s acceptable range; CATF’s analysis suggests that two thirds of all U.S. counties exceed 100 times EPA’s acceptable risk of one-in-a-million.

Clean Air Task Force 19
MSA Risk per Million RankBaton Rouge, LA MSA 992.23 1New York-Newark-Edison, NY-NJ-PA MSA 959.01 2New Orleans-Metairie-Kenner, LA MSA 888.95 3Beaum ont-Port Arthur, TX MSA 864.91 4Trenton-Ewing, NJ MSA 699.22 5Houston-Baytown-Sugar Land, TX MSA 690.77 6Philadelphia-Cam den-W ilm ington, PA-NJ-DE-MD MSA 658.28 7Los Angeles-Long Beach-Santa Ana, CA MSA 633.27 8Baltim ore-Towson, MD MSA 584.03 9Boston-Cam bridge-Quincy, MA-NH MSA 562.95 10Chicago-Naperv ille-Joliet, IL-IN-W I MSA 539.02 11Salt Lake City, UT MSA 533.16 12Cincinnati-Middletown, OH-KY-IN MSA 503.56 13Bridgeport-Stamford-Norwalk, CT MSA 494.05 14Portland-Vancouver-Beaverton, OR-W A MSA 488.26 15San Francisco-Oakland-Frem ont, CA MSA 480.17 16Huntington-Ashland, W V-KY-OH MSA 477.37 17Lancaster, PA MSA 462.83 18York-Hanover, PA MSA 460.17 19Allentown-Bethlehem -Easton, PA-NJ MSA 450.03 20Longview-Kelso, W A MSA 440.76 21Lake Charles, LA MSA 436.68 22Mobile, AL MSA 435.11 23Reading, PA MSA 428.26 24Toledo, OH MSA 422.67 25Cleveland-Elyria-Mentor, OH MSA 415.84 26Pittsburgh, PA MSA 415.43 27Phoenix-Mesa-Scottsdale, AZ MSA 415.16 28Seattle-Tacom a-Bellevue, W A MSA 412.65 29Harrisburg-Carlisle, PA MSA 412.46 30San Diego-Carlsbad-San Marcos, CA MSA 406.97 31St. Louis, MO-IL MSA 405.47 32Atlanta-Sandy Springs-Marietta, GA MSA 401.74 33Mem phis, TN-MS-AR MSA 397.15 34Dayton, OH MSA 388.81 35W ashington-Arlington-Alexandria, DC-VA-MD-W V MSA 387.10 36Louisv ille, KY-IN MSA 383.64 37Detroit-W arren-Livonia, MI MSA 381.12 38Savannah, GA MSA 375.75 39Milwaukee-W aukesha-W est Allis, W I MSA 375.50 40Ann Arbor, MI MSA 375.20 41Lebanon, PA MSA 372.56 42Oxnard-Thousand Oaks-Ventura, CA MSA 371.57 43Michigan City-La Porte, IN MSA 369.90 44Poughkeepsie-Newburgh-Middletown, NY MSA 367.77 45Evansville, IN-KY MSA 367.58 46New Haven-Milford, CT MSA 365.28 47Vineland-Millv ille-Bridgeton, NJ MSA 364.93 48Tam pa-St. Petersburg-Clearwater, FL MSA 364.50 49Colum bus, OH MSA 363.23 50
Worst 50 U.S. Metropolitan areas for diesel particulate matter-related lung cancer risk.
Clean Air Task Force 20
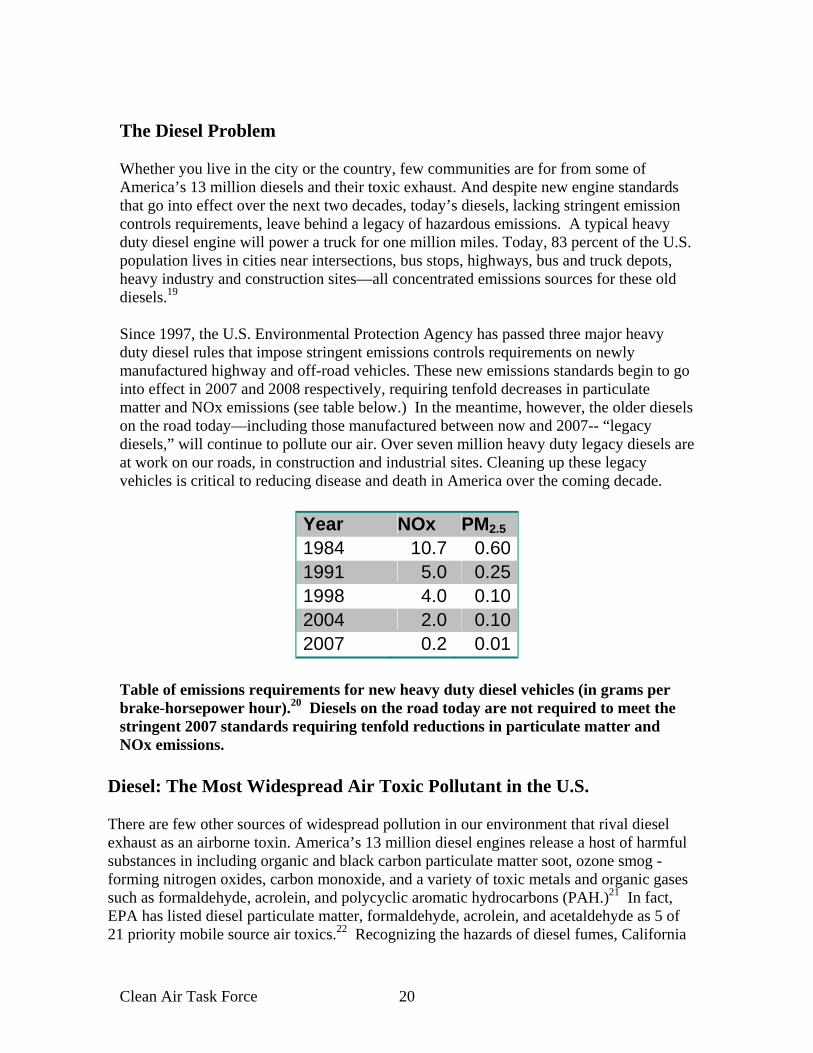
The Diesel Problem Whether you live in the city or the country, few communities are for from some of America’s 13 million diesels and their toxic exhaust. And despite new engine standards that go into effect over the next two decades, today’s diesels, lacking stringent emission controls requirements, leave behind a legacy of hazardous emissions. A typical heavy duty diesel engine will power a truck for one million miles. Today, 83 percent of the U.S. population lives in cities near intersections, bus stops, highways, bus and truck depots, heavy industry and construction sites—all concentrated emissions sources for these old diesels.19 Since 1997, the U.S. Environmental Protection Agency has passed three major heavy duty diesel rules that impose stringent emissions controls requirements on newly manufactured highway and off-road vehicles. These new emissions standards begin to go into effect in 2007 and 2008 respectively, requiring tenfold decreases in particulate matter and NOx emissions (see table below.) In the meantime, however, the older diesels on the road today—including those manufactured between now and 2007-- “legacy diesels,” will continue to pollute our air. Over seven million heavy duty legacy diesels are at work on our roads, in construction and industrial sites. Cleaning up these legacy vehicles is critical to reducing disease and death in America over the coming decade.
Year NOx PM2.5 1984 10.7 0.601991 5.0 0.251998 4.0 0.102004 2.0 0.102007 0.2 0.01
Table of emissions requirements for new heavy duty diesel vehicles (in grams per brake-horsepower hour).20 Diesels on the road today are not required to meet the stringent 2007 standards requiring tenfold reductions in particulate matter and NOx emissions.
Diesel: The Most Widespread Air Toxic Pollutant in the U.S. There are few other sources of widespread pollution in our environment that rival diesel exhaust as an airborne toxin. America’s 13 million diesel engines release a host of harmful substances in including organic and black carbon particulate matter soot, ozone smog -forming nitrogen oxides, carbon monoxide, and a variety of toxic metals and organic gases such as formaldehyde, acrolein, and polycyclic aromatic hydrocarbons (PAH.)21 In fact, EPA has listed diesel particulate matter, formaldehyde, acrolein, and acetaldehyde as 5 of 21 priority mobile source air toxics.22 Recognizing the hazards of diesel fumes, California

Clean Air Task Force 21
listed diesel exhaust as a “toxic air contaminant” in 1998 and similarly, EPA has listed diesel particulate matter soot as a “motor vehicle air toxic.” Particulate Matter Soot is Linked to Heart Attacks, Cancer, Stunted Lung Growth. Particulate matter soot has been linked to a wide variety of serious health impacts from upper and lower respiratory impacts such as asthma attacks and possible asthma onset, to heart attacks and premature death. 23 Soot from diesel may be more toxic than PM from other dangerous sources; a follow-up analysis of the Harvard “Six Cities” study indicated that particulate matter formed from mobile combustion sources increases daily mortality three times as much as for PM derived from coal.24 This may be in part because fresh diesel exhaust is comprised of ultrafine particles that are so small they can invade lung tissue and enter the bloodstream triggering adverse effects such as cardiovascular inflammation or causing blood clots.25,26,27,28 How risky is breathing air polluted with particles? A 2002 study published in the Journal of the American Medical Association found that living in the most polluted U.S. cities poses a similar risk as living with a smoker.29,30 Based on thousands of studies compiled by EPA, federal health standards were established for particulate matter soot in 1997. HOW PARTICULATE MATTER KILLS. Fine particulate matter soot, known as “PM2.5“, is less than 2.5 microns in diameter or 1/100th the width of a human hair. Soot is deposited deep in the lung where it can affect both the respiratory and cardiovascular systems. Researchers believe that many deaths caused by particulate matter are related to cardiovascular illness. Particulate matter soot aggravates cardiovascular disease including heart attacks by invading the bloodstream and initiating an inflammatory response, disrupting heart rate and increasing blood clotting. 31,32,33
Diesel combustion creates both fine and ultrafine particles (as small as 10-100 millionths of a meter). Ultrafine particles are a concern near diesel emission sources—highways, railyards, shipping ports, truck depots, etc. As ultrafine particles move away from the emission sources they tend to aggregate into larger particles to become fine PM. Thus exposure to ultrafine particles is particularly of concern for people who live, work and attend school diesel emissions sources.
Other serious health impacts of particulate matter soot have recently been described by scientists:
• Particulate matter was significantly associated with cardiovascular mortality and lung cancer death in the American Cancer Society study of 150 metropolitan areas across the U.S.34
• Particulate matter is associated with abnormal heart rhythms and heart attacks and atherosclerosis.35,36,37,38
• Increased incidence of stroke has been linked to particulate matter and other pollutants.39,40

Clean Air Task Force 22
• In an experimental study, diesel particles caused thromboses (stroke) providing “a plausible explanation for the increase in cardiovascular morbidity and mortality accompanying urban air pollution 41
• Particulate matter air pollution is associated with permanent respiratory damage—lung airway remodeling.42
• Results of the California Children’s health study suggest a host of adverse impacts from particulate matter exposure.
• Traffic studies link mortality to areas with high traffic volumes.43 • Cal-EPA and the Berkeley lab researchers found the prevalence of asthma and
bronchitis was 7 percent higher among children attending school in high-traffic neighborhoods, compared with children in schools on quieter streets.44
Diesel Exhaust is a Likely Carcinogen that also Impairs Immune, Reproductive, and Nervous Systems. Diesel exhaust contains a host of hazardous air pollutants both as gases and particles. The gaseous portion of the diesel exhaust mixture includes compounds such as acrolein that cause inflammation to the lungs and respiratory tract. Particles are also formed from gases such as polycyclic aromatic hydrocarbons or “PAHs.” Toxic chemical compounds and heavy metals are delivered to the bloodstream attached to particles. Ultrafine particles (smaller than one ten millionths of a meter in size) are released from fresh diesel exhaust and linger nearby, ultimately combining to form fine particles (PM2.5). Ultrafine particles are small enough to penetrate lung tissue, enter the bloodstream and travel to other human organs (heart, brain, kidneys), even entering individual cells to disrupt their normal function.
In fact, diesel emissions—other than diesel soot-- include 40 hazardous air pollutants listed under the Clean Air Act, 15 of which are known, probable or possible carcinogens.45,46 Carcinogenic compounds in diesel include formaldehyde, acetaldehyde, dioxins and PAH.47,48 Health impacts of these extremely toxic emissions range from respiratory irritation to reproductive impacts and cancer. For example, PAHs are associated with significant cancer risks.49, 50 California EPA completed a meta-analysis of over 30 epidemiological studies that investigated occupational exposure to diesel exhaust and cancer.51 The findings are consistent and support a causal relationship between diesel exhaust and the development of lung cancer in workers after long term exposure. The increased risk for workers was estimated at approximately 40%, after controlling for smoking. Diesel exhaust is carcinogenic. In adults, lifetime exposure of truckers and railroad workers to diesel exhaust has been associated with higher rates of cancers.52 Over 30 epidemiological studies link diesel particulate matter to lung cancers.53,54 ,55, 56,57,58 Diesel soot is toxic to DNA and human genes, adding to the weight of evidence showing diesel soot is carcinogenic.59 Studies have also linked diesel exhaust to bladder cancer.

Clean Air Task Force 23
Confirming diesel’s role in environmental cancers:
In 1988, the National Institute of Occupational Safety and Health (NIOSH) first
recommended that diesel exhaust be considered a potential occupational carcinogen. In 1998, the Scientific Review Panel for the California Air Resources Board estimated
the unit cancer risk from Diesel Particulate Matter to be 3 cancers in 10,000 persons
over a lifetime for each microgram of annual average diesel PM per cubic meter of air.60 This is equivalent to 300 excess lifetime lung cancers per million people. This estimate is consistent with EPA’s risk range.61
In May 2002 EPA issued its Health Assessment for Diesel Exhaust which found diesel
particulate matter soot to be a “likely” carcinogen.62 EPA did not settle on a unit risk factor but recommended a lifetime cancer risk range from 1 in 1,000 to 1 in 100,000.63
Air officials in southern California studied air toxics and cancer risk and found that
diesel particulate matter contributed about 70% of the total cancer risk for the area, the highest percentage of any pollutant and exceeding all other air toxics combined. 17 Single pollutants that are likely to cause cancer are generally of concern if they exceed a “one in a million” risk of cancer over a lifetime of exposure. (A one-in-a-million risk of cancer or less is considered by EPA acceptable for a single pollutant.64)
Other serious health effects of air toxics in diesel exhaust include: Respiratory Inflammation Diesel exhaust contains a host of hazardous air pollutants both as gases and particles. In addition to the respiratory inflammation caused by diesel PM, the gaseous portion of the diesel exhaust mixture includes compounds such as acrolein, acetaldehyde and formaldehyde that cause inflammation to the lungs and respiratory tract. Diesels make the majority contribution to these 3 air toxics, which were found by EPA in 1996 to impact large sections of the population at well above health- based levels of concern. For acrolein, almost the entire population of the US is exposed to unhealthy levels of acrolein. For both formaldehyde and acetaldehyde, half the population was exposed in 1996 to levels of these probable carcinogens that exceed EPA’s “one in a million” acceptable level. The excessive levels of these multiple toxics that cause respiratory inflammation are a public health concern. Immune System Effects Numerous effects have been identified in the whole immune system cascade of responses in humans and animals ultimately leading to increased allergic inflammatory responses and suppression of infection fighting ability. These include disruption of chemical signals and production of antibodies, and the alteration in mobilization of infection

Clean Air Task Force 24
fighting cells.65 Both increased allergic responses and decreased ability to fight infection are characteristics of asthma, an increasingly prevalent disease which has increased by 75% in 14 years, 1980-1994, according to a CDC survey.66
Reproductive, Developmental, and Endocrine Effects – Diesel emissions have also been associated with reproductive, developmental and endocrine effects in animals. Specifically, diesel exposure has been associated in animals with decreased sperm
Diesel particles are carbon at their core with toxics and carcinogenic substances attached to their surfaces. (Artist: Alan Morin.)

Clean Air Task Force 25
Table of air toxics commonly found in diesel exhaust.67
Ozone Smog, formed by Diesel NOx emissions is Linked to Childhood Asthma Onset, Stunted Lung Growth and premature death in adults. Ozone is harmful gas formed from nitrogen oxides and has been one of the most difficult ambient air pollutants to control. Recent ozone control efforts have centered on reducing nitrogen oxides (NOx) itself a harmful pollutant that gives city skies a brown cast during rush hour. NOx also forms secondary fine particulate matter, particularly in the winter time. Diesel NOX emissions have doubled since 1970 from 2.8 million tons to about 7 million tons per year in 2002. Reducing NOx is therefore a key to achieving attainment of federal ozone and fine particle standards. Ozone has been associated with an array of adverse health impacts including:
• Premature death68,69 • Upper and lower respiratory irritation, bronchitis. • Triggering of asthma attacks • Increases in hospital admissions and emergency room visits.70,71,72, 73
Carbon Monoxide Raising Risks of Heart Disease and Birth Defects. Carbon monoxide (CO) is a colorless, poisonous gas, formed by incomplete combustion and long known for its toxicity. Carbon monoxide is a byproduct of diesel combustion and recently been the subject of a number of studies that associate it with serious health impacts. CO is commonly found where particulate matter levels are high due to incomplete fuel combustion. Diesels are important sources of CO and contribute to unhealthy air

Clean Air Task Force 26
particularly in urban communities. Areas of concentrated CO are found where there is concentrated combustion such as congested highways, street crossings, and construction sites. CO enters the body through the lungs and into the bloodstream and reduces oxygen delivery to the body’s organs and tissues. Neurobehavioral, cardiovascular and respiratory symptoms are typical of lower level CO exposures. The health threat from CO is serious for those who suffer from cardiovascular and chronic obstructive pulmonary diseases.
Recent research suggests that exposure to CO is associated with the following health impacts:74
• Short-term CO exposure symptoms are similar to flu or virus. • Chronic exposure to CO doubled the probability of birth defects in more
polluted California cities.75 • CO exposure has also been linked to low birth weight and SIDs. • Chronic CO exposure in Atlanta was associated with elevated cardiovascular
emergency room visits.76 • CO may cause anginal pain, arrythmias and atherosclerosis. • Some studies suggest a possible link between chronic CO exposure and daily
mortality. • CO can result in decreased exercise tolerance.
Children and Seniors are at Greatest Risk Seniors and children alike depend on diesel public transportation. Diesel exhaust from the nation’s 400,000 school buses and 70,000 transit buses seep in through open windows and doors, exposing riders as well as those waiting to board. Diesel exhaust also can get into building ventilation systems causing poor indoor air quality. Seniors are another important population at risk. In a pilot study undertaken by Harvard School of Public Health supported by EPRI in St. Louis, seniors were shadowed with personal exposure monitoring equipment and results suggested significantly elevated short term changes in exposures to particulate matter when riding transit buses. Studies of the impacts of particulate matter on seniors in Boston and Baltimore suggest that changes in their heart rhythms and control mechanisms occur when particle levels rise.77 In Phoenix, daily mortality increased in seniors with increased levels of elemental and organic carbon (typical of diesels and other motor vehicles) and PM2.5. Collectively, these studies demonstrate that elevated particulate matter puts the elderly at risk and suggest a possible mechanistic link between PM and cardiovascular disease mortality.

Clean Air Task Force 27
Health researchers believe that children are more susceptible than adults to the adverse health effects of air pollution for a variety of reasons.78,79 For example, children are more active than adults and therefore breathe more rapidly. Children also have more lung surface area compared to their body weight and therefore they inhale more air pound-for- pound than adults do. Compared to adults, children also have higher lung volume to body size and higher respiration rates and spend more active time in the polluted outdoor environment. 80 Fine particle pollution has also been associated with serious adverse impacts in children.
• Researchers tracked the lung function of 1,700 children between the ages of 10 and 18 and found that current levels of fine particle pollution and nitrogen dioxide in the 12 communities studies had “chronic adverse effects on lung development” leading to deficits in lung function as the children reached adulthood.81, 82, 83
• In the same study, when children moved to communities with higher particulate matter, a decreased growth in lung function was observed.84
• Particulate matter has also been linked to infant death. In a comparison of 86 cities in the U.S., researchers found that infants who lived in a highly polluted city during their first two months of life had a mortality rate ten percent higher than infants living in the city with the cleanest air.85
• Investigators in the same study found that high particulate matter levels were associated with a 26 percent increased risk of Sudden Infant Death Syndrome and 40 percent increased risk of respiratory mortality.86
• Proximity to traffic has been linked to respiratory infections and allergic symptoms and asthma hospitalization in children.87
Millions of children live in areas that violate national air quality standards for the ozone. Researchers have also documented serious health damages from ozone exposures:

Clean Air Task Force 28
• Ozone has been linked to new asthma diagnoses in children —suggesting chronic ozone exposure may trigger asthma onset.88
• Ozone exposure has been associated with heart defects in newborns.89 • Absences from school are correlated with daily changes in ozone. 90 • Lung development may be stunted by regular exposure to ozone and cause
fundamental changes in lung and related brain development. In one study, monkeys exposed to ozone developed little more than half of the normal number of branches of their lungs.91
Diesel Causes Climate Warming and other Environmental Hazards Diesels have other impacts that despoil our natural environment. For example, diesel PM and NOX contribute to haze in many national parks, particularly those near urban areas. Black diesel soot also causes soiling of buildings. Diesels are associated with water pollution too. Leaked or spilled diesel fuels contribute to non-point source water pollutants. Diesel smoke is also composed of organic compounds, (e.g., PAHs and dioxins) and heavy metals that are deposited by air into waterways and remain persistent in the environment after getting into the food chain.92 NOx emissions from diesels result in nitrogen deposition and eutrophication of waterways leading to harmful algae blooms. Black carbon soot from diesels affects cloud cover and contributes to atmospheric warming due to its fundamental ability to absorb light and heat.93 In fact, black carbon soot may be the second most important contributor to global warming after carbon dioxide.94 But because carbon dioxide remains in the atmosphere for up to a century after it is emitted, top atmospheric researchers believe that reducing black carbon soot from diesel engines represents an important alternative strategy for immediately reducing atmospheric warming rates.95
Brown motor vehicle haze and ozone smog over Boston. The brown cloud is largely formed from mobile sources including diesel particulate matter and NOx emissions.

Clean Air Task Force 29
Black carbon is second only to carbon dioxide as a cause of global warming (Permission, James Hansen, Goddard Institute for Space Sciences.) Today’s Dirty Diesels. Ever since Rudolph Diesel (1858-1913) filed the first patent for the diesel--the ‘economical heat motor’ in 1892 diesels engines have been a workhorse of our economy. America’s 13 million diesel engines power most heavy-duty trucks, buses, trains, large ships, electricity generators, engines for non-road equipment such as excavators, cranes and agricultural equipment. Heavy-duty diesel engines are durable and may be in service for two or three decades and typically rebuilt one or more times. Diesels require less maintenance and because they utilize about two thirds of the fuel of a similar ignition-based gasoline engine for the equivalent power output, diesels generate energy more efficiently with lower carbon dioxide emissions than equivalent ignition-based gasoline engines. Despite the fuel economy of the diesel and lower carbon dioxide emissions, today’s diesels are more harmful to human health on a per-vehicle basis than emissions from similar gasoline powered engines. Diesels come in many shapes and sizes. Diesels are used for recreational use, lawn and garden equipment to the heaviest diesels such as large trucks, construction and agriculture as well as rail and marine shipping. Heavy duty diesel engines emit the lion’s share of diesel exhaust in the U.S. Moreover, heavy-duty diesel engines contribute the most (85-90 percent) to overall diesel PM emissions. Directly emitted fine particles from

Clean Air Task Force 30
highway diesels have declined since the mid 1990s, but there has been little improvement from other sources. Diesel exhaust from these sources account for one-third of ozone and particle -forming nitrogen oxides emissions in the U.S. Nitrogen oxides from highway diesels have increased dramatically, doubling since the 1970s.
Breakdown of the approximate 13 million diesel engines in the U.S. (1999 Data. Source: EPA.) “On-road” or highway diesels include many types of vehicles, such as municipal and commercial trucks and buses. Heavy duty highway diesels range from 8,500 lbs to those exceeding 60,000 lbs, such as 18-wheelers. Of the seven million diesels on the road today, 400,000 are school buses and 70,000 are transit buses. Highway diesels released 100,000 tons of directly-emitted fine particles in 2002, about one third of the total from diesels. Highway diesels also released 3.4 million tons of nitrogen oxides (NOx) in 2002, which accounted for 16 percent of all NOx emissions and half of all diesel NOx emissions in the U.S. 96

Clean Air Task Force 31
“Non-road” diesel engines and equipment do not typically travel on roads or highways. There were approximately six million non-road diesel engines in service in 2003. Examples of these non-road diesels include construction equipment such as excavators, mining equipment and agricultural machinery. In 2002, 155,000 tons or half of all the fine particles directly emitted from diesels came from non-road engines. Non-road diesels also released 1.6 million tons of NOx, 8 percent of all NOx emissions and one quarter of all diesel NOx emissions in the U.S. in 2002.97
Marine and river diesel emissions are dominated by large commercial ships polluting our largest ocean and river port cities. Efforts to control pollution from shipping have focused on NOx, although these engines also emit substantial quantities of fine particles. In 2002 marine diesel released 40,000 tons of directly-emitted fine particles, 13 percent of all diesel fine particles in the U.S. Marine diesels in the U.S. produced one million tons of diesel NOX in 2002, 5 percent of all U.S. NOx emissions and 14 percent of all diesel NOx emissions.98

Clean Air Task Force 32
Locomotive diesels account for a significant fraction of mobile source emissions in the U.S. today. In many areas, diesel trains travel through and pollute core urban and industrial areas. Diesel locomotives released 20,000 tons of directly-emitted diesel fine particles (six percent of all diesel fine particles) and 900,000 tons NOx (13 percent of diesel NOx). Diesel locomotives typically have a useful life of 40 years and are commonly rebuilt 5-10 times during their long service lives. For this reason, cleaning up today’s locomotives is an important priority.99
Diesel Exhaust “Hotspots” Pose Additional Health Risks Diesel smoke is nearly everywhere in our environment. Unlike smokestack emissions, diesel emissions are released at ground level close to people and where they breathe. While air quality modeling, such as reported in our study, estimates average exposures in a community, an individual’s exposure may be much greater or smaller depending on a

Clean Air Task Force 33
variety of factors, for example, the distance from where they live to major roadways and the nature of their commute to work. Such high-risk “hotspots” typically combine very high amounts of emissions where significant amounts of “ultrafine” particles are present. Ultrafine diesel exhaust particles may be responsible for additional health risks very near diesel emissions sources. 100 Several examples of such situations where diesel particulate health risk may be very high are described below. Ultrafine particles are found in fresh diesel exhaust and linger nearby, generally within 100 meters (or 300 feet) of a diesel source like a roadway.101 These particles ultimately combine – as noted above within about 100 meters - to form fine particles (PM2.5). Diesel engines create diesel particles that are in the smallest size range with a high percentage of ultrafine as well as fine particles. These ultrafines have large surface areas for toxic substances to attach themselves as “hitchhikers”. Ultrafine particles are small enough to penetrate lung tissue, enter the bloodstream and travel to other human organs (heart, brain, kidneys), even entering individual cells to disrupt their normal function.
Diesel exposure may be greatest near busy roadways construction sites, rail yards, ports and other areas of concentrated diesel use. (Artist: Alan Morin)

Clean Air Task Force 34
Diesel health risks are higher where people:
• Operate or work around diesel engines – Occupational exposures to diesel are amongst the highest environmental exposures and have been associated primarily with increased incidence of lung cancer. Furthermore, a study of diesel mechanics and train crewmen, and electricians working in a closed space near diesel generators suggests that diesel exposure may have caused both airway obstruction and serious impairment to the central nervous system. The report concludes that “impaired crews may be unable to operate trains safely.”102
• Live or work near areas where diesel emissions are concentrated - Diesel
particulate concentrations in the air are highest near highways, busy roadways, bus depots, construction sites, railroad yards, ports and inland waterways with diesel boat traffic, major bridges, tunnels and freight warehouses. Exacerbating the problem, diesel PM has been found to readily penetrate indoor spaces, thus exposing people twenty-four hours a day indoors and outdoors. Risk levels from a California rail yard adjacent to where 14,000-26,000 people live were estimated at 100 to 500 in a million.103 In another study, the cancer risk for persons exposed to emissions from a ferry in port and that live about 200 meters away, ranged from 50 to 280 additional cancer cases in a million.104 Numerous recent medical studies have also linked roadway proximity and traffic pollution to disease, asthma hospitalizations and shortened life expectancy.105 And studies conducted in New York City suggest elevated exposures to diesel soot on city sidewalks adjacent to heavy traffic.106,107
According to CATF’s analysis urban counties --where eighty-three percent of the U.S. population lives--experience about three times the diesel pollution as rural areas with correspondingly higher health risks to the people living there. This is likely due to the presence of concentrated multiple diesel emission sources in close proximity. Minority and low-income populations are more likely to live in urban communities where multiple diesel sources and high diesel pollution are present. These disproportionate health impacts often create an environmental justice issue.
• Regularly ride on school or transit buses, or commuter trains - Children are exposed to elevated levels of diesel as a result of the buildup of diesel exhaust inside school buses- especially with windows closed.108 Diesel exhaust levels on commuter trains and station platforms may also be high.109
• Commute Daily in Heavy Traffic - Commuters are exposed to some of the highest diesel emissions in their cars due to pollutants released from trucks and buses on the road with them. Car occupants riding behind a diesel bus, for example, can experience extremely high levels of dangerous fine particles. Los Angeles researchers measured high PM levels (130 ug/m3) behind an urban transit bus making numerous stops.110 Exposures in vehicles can have serious effects: a 2004 study suggests that young male state troopers experienced cardiac inflammation and rhythm changes.111

Clean Air Task Force 35
U.S. Counties designated as “non attainment” for PM2.5 (EPA, 2004.) Many cities and states will need to reduce emissions from existing diesels to meet this standard.112
Clean Air Task Force 36
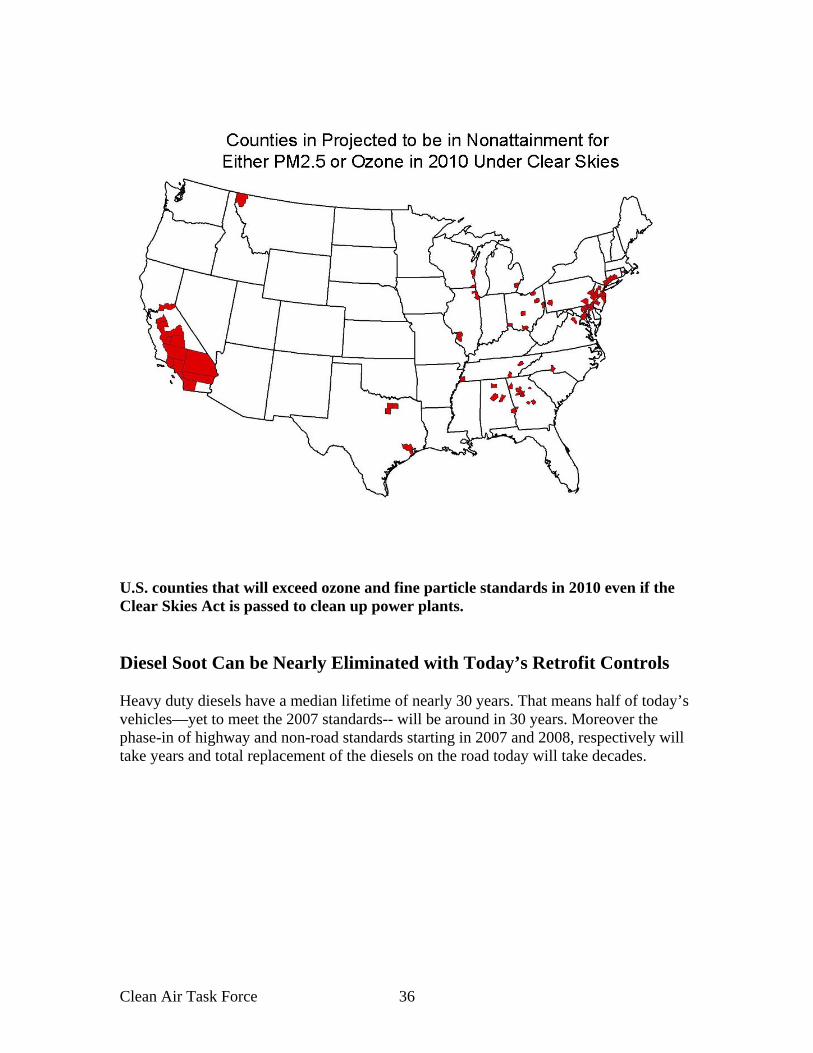
U.S. counties that will exceed ozone and fine particle standards in 2010 even if the Clear Skies Act is passed to clean up power plants.
Diesel Soot Can be Nearly Eliminated with Today’s Retrofit Controls Heavy duty diesels have a median lifetime of nearly 30 years. That means half of today’s vehicles—yet to meet the 2007 standards-- will be around in 30 years. Moreover the phase-in of highway and non-road standards starting in 2007 and 2008, respectively will take years and total replacement of the diesels on the road today will take decades.

Clean Air Task Force 37
The median lifetime of a heavy duty truck is nearly 30 years.113 Reducing Particulate Matter Emissions Reducing diesel particulate matter from existing diesel engines in America will require a variety of strategies such as: tailpipe retrofits, closed crankcase filtration systems, clean fuels, engine rebuild and replacement requirements, contract requirements, anti idling ordinances and legislation, truckstop electrification programs, aggressive fleet turnover policies and more. The most effective approach to reducing diesel soot will be direct application of retrofit technology. While fleet replacement turnover will remain an important part of cleaning up diesels in the U.S, today’s diesels do not necessarily need to be replaced to meet the challenge of reducing soot and related air toxics. Current technology can easily remove soot particles from diesel exhaust. Particulate matter retrofits range in cost from $1000 -$15,000, which can be a small investment in comparison to the cost of a new school or transit bus. Particulate matter retrofits are available from many engine manufacturers and can be easy to install especially on highway vehicles. However retrofits are not “one size fits all.” Retrofitting a fleet will typically require careful planning, including a mix of solutions-- depending on the engines being retrofitted and funds available. For example, some heavy duty engines lack modern electronic engine controls and are therefore too old for some retrofit devices. Other diesel equipment simply lacks the space for retrofit installation. Duty cycle is important consideration too, as some engines do not run constantly which

Clean Air Task Force 38
means that catalytic retrofit devices requiring consistent high engine temperatures do not operate as efficiently. Furthermore, some engines release pollution from crankcase ventilation in addition to the tailpipe, and therefore required different solutions. Fleets will need to develop a strategy to determine what works the best with their vehicles and equipment. Primary PM Reduction Technologies Technology Effectiveness
(% reduction)
Engine Technology Level
Fuel Penalty Maximum Sulfur Level
Cost (250 HP engine)
Diesel Oxidation Catalyst (DOC)
PM: 20 – 40%1 PM EC: 0-5%1 NOx: 0%
Euro 0 + Mechanical or electronic control
Marginal
500 PPM1
$1000 to $1500
High Efficiency DOC (HE DOC)
PM: 40 – 60%1 PM EC: 5-10% NOx: 0%
Euro 0 + Mechanical or electronic control
Marginal
500 PPM1
$2000 to $3000
Partial Flow Filter (PFF)
PM: 40 – 70%1 PM EC: 10-20%2 NOx: 0%
Euro 0 + Mechanical or electronic control
Marginal
500 PPM1
$3000 to $4500
Catalyzed Diesel Particulate Filter (C DPF)
PM: >95% PM EC: >95% NOx: 0-5%3
Euro 1 + Mechanical or electronic control
Marginal
50 PPM
$4000 to $7000
Active Diesel Particulate Filter (A DPF)
PM: >95% PM EC: >95% NOx: 0%
Euro 1 + Mechanical or electronic control
3 – 6%
500 PPM4
$12000 to $15000
NOTES: 1 DOCs primarily reduce the “wet” organic portion of PM, while removing only modest amounts of the smallest carbon particles. Older technology engines tend to have much more wet PM, so the % reduction of PM mass will be highest on these engines. Very high sulfur levels (above 50-ppm) will tend to deactivate the catalyst, and will also produce significant sulfate PM across the catalyst at high exhaust temperatures. 2 A partial flow filter directs a portion of PM through a physical filter where even the smallest carbon particles are captured and oxidized. This results in greater reductions of fine PM than a DOC or high efficiency DOC 3 Catalyzed DPFs result in modest reductions in total NOx as NO2 is reduced during oxidation of carbon. These devices also increase the percentage of NOx emitted as NO2 by 20-30%. 4 All of the active DPF systems being developed for on-highway vehicles in the US include a catalyzed filter and require fuel with maximum 50-ppm sulfur. Theoretically, active systems could be developed to work with up to 500-ppm fuel, but these systems would incur greater fuel penalty and would require additional annual maintenance. EC – Elemental Carbon

Clean Air Task Force 39
Catalyzed diesel particulate matter filters (DPF) combined with ultralow sulfur diesel fuel (ULSD) work and can reduce diesel soot and adsorbed air toxics by over 90 percent. In fact, Clean Air Task Force and cooperators field research shows that tailpipe soot self-pollution is undetectable inside school buses equipped with DPFs. In general, to install a DPF, the muffler is removed and replaced. DPFs range in cost from about $4,000-7,000 per application. DPFs have been used in thousands of on and offroad applications.
0
20
40
60
80
100
0 10 20 30 40 50 60 70Elapsed Time (Minutes)
PM
2.5
(ug/
m3)
0
20,000
40,000
60,000
80,000
100,000
Ultr
afin
e P
artic
le C
ount
(p
artic
les/
cc)PM2.5
Ultrafine PM
-20
0
20
40
60
80
100
0 10 20 30 40 50
Elapsed Time (Minutes)
PM
2.5
(ug/
m3)
-20000
0
20000
40000
60000
80000
100000
Ultr
afin
e P
artic
le C
ount
(p
artic
les/
cc)
Ultrafine PM (black)PM2.5 (red)
Retrofits Work. Top graph shows cabin air quality on a typical bus route in Ann Arbor MI. In the bottom graph, the DPF-ULSD-Spiracle combination eliminated PM2.5, ultrafine particles, black carbon, and PAH self pollution from the bus cabin. (Note: Ambient concentrations have been subtracted resulting in slightly negative apparent net concentrations. Concentrations below zero should be taken as zero net PM2.5 contribution to the bus. For full study go to http://www.catf.us/goto/dieselreport )

Clean Air Task Force 40
Diesel oxidation catalysts (DOCs) are a less expensive but less effective option. They are smaller and therefore even easier to install and have been verified by EPA to reduce total particulate matter emissions by 10-30 percent. The DOC is also attached to the exhaust system before the tailpipe and costs about $1,000 per application. DOCs may be appropriate for vehicles older that 1995 that lack electronic controls and for construction equipment where there is inadequate space for a DPF to be installed. DOCs have been installed on over 1.5 million trucks in the U.S., and on over 200,000 pieces of offroad equipment worldwide.114
CHILDREN ARE EXPOSED DIESEL SOOT RIDING YELLOW SCHOOL BUSES.
CATF STUDY SHOWS THAT CABIN PM CAN BE ELIMINATED WITH COMMONLY AVAILABLE EMISSIONS CONTROLS
Twenty four million students ride to school every day on yellow school buses that travel 4 billion miles a year. Students spend an average of an hour and a half a day on the bus.115 School buses are, by far, the safest way to get to school.116A recent study undertaken by Clean Air Task Force in cooperation with Purdue University researchers investigated cabin air quality on yellow buses in three cities (Chicago, IL, Atlanta, GA, and Ann Arbor MI). 117 In all three U.S. cities researchers found that diesel exhaust routinely entered into the bus cabin during typical school bus routes from the tailpipe and the engine compartment through the front door. At many stops, levels entering the bus exceeded multiple times the level of the daily fine particle (PM2.5) standard. During idling and queuing—where buses are parked closely end-to-end-- rapid build up of fine particles, ultrafine particles and black carbon occurred. Most importantly and as demonstrated by CATF’s research, installation of a diesel particulate filter and ultralow sulfur diesel fuel (ULSD) along with a closed crankcase filtration device eliminated all in-cabin particulate matter self-pollution including PM2.5, ultrafine particles, black carbon and particle bound PAH. The study showed that closed crankcase filtration system by itself has major benefits and can provide immediate and low cost reductions in particulate matter levels on school buses that have crankcase vents by rerouting the crankcase emissions back into the engine instead of into the engine compartment where it can blow into the front door of the bus. For a comprehensive report on the study go to: http://www.catf.us/goto/schoolbusreport/.

Clean Air Task Force 41
During a test, particle levels outside a conventional bus spike at a bus stop as the bus pulls away from the curb leaving a plume of smoke in its wake at a schoolyard or bus stop where a child may be getting off the bus.
The bus retrofit with a particulate matter filter leaves no particulate matter plume behind as it pulls away from a bus stop or school.

Clean Air Task Force 42
Clean Air Task Force research comparing the benefits of retrofit options on school bus cabin air quality proved unable to document in-cabin particulate matter benefits when a DOC was installed on a conventional bus. However, we cannot conclude based on our methodology that there are no PM reduction benefits from the DOC. The result does indeed suggest that a DPF is required to highly reduce or eliminate tailpipe particle emissions inside school buses.
Installing a diesel particulate filter (DPF) in this Atlanta school bus simply required removal and replacement of the muffler and tailpipe. Controlling NOx Emissions Although they have a shorter track record commercially, retrofit to reduce nitrogen oxides are under development and testing. Two promising technologies include selective catalytic reduction (SCR) and NOx adsorbers. SCR systems employ a catalyst and injection of a reagent, urea. SCRs are capable of reductions of 75-90 percent for NOx, 50-90 percent for hydrocarbons, and 30-50 percent for particulate matter soot.118 NOx adsorbers are another new catalyst-based technology with tests suggesting reductions up to 90 percent.

Clean Air Task Force 43
Primary NOx Reduction Technologies Technology Effectiveness
(% reduction)
Engine Technology Level
Fuel Penalty Maximum Sulfur Level
Cost (250 HP engine)
Low Pressure Exhaust Gas Recirculation (LP EGR)
PM: >95%5 PM EC: >95%5 NOx: 30-40%
Euro 2 + Mechanical or electronic control
2 – 4%
50 PPM5
$12000 to $150006
Selective Catalytic Reduction (SCR)
PM: 20% PM EC: 0-5% NOx: 70-85%
Euro 1 + Mechanical or electronic control
None7
500 PPM
$8000 to $10000
NOx Reduction Catalyst (NRC)
PM: 0% PM EC: 0% NOx: 30-40%
Euro 3 + Electronic control
5 - 10%
500 PPM
$10000 to $12000
NOx Adsorber (ADS)
PM: 0% PM EC: 0% NOx: >90%
Euro 3 + Electronic control
4 - 6%
10 PPM
$25,000+ Note 8
NOTES: 5 High pressure EGR systems can use fuel with high sulfur levels, but are difficult to retrofit onto older engines. Low pressure retrofit EGR systems must incorporate a C DPF, and therefore require ultra low sulfur fuel 6 Includes cost of C DPF 7 Requires urea reductant. Typical urea use would be 5 -10% of fuel used. 8 Not a fully commercialized technology EC – Elemental Carbon In addition to technology, fuels such as ultralow sulfur diesel and biodiesel, and fuel additives such as Purinox are sources of modest NOx emissions reductions. Lubrizol reports that its fuel additive Purinox achieves average NOx reductions of 20% and for particles, 54% percent.119 Ultralow sulfur diesel fuel (ULSD) with 15 parts per million sulfur is presently required for the use of DPFs and its use results in an approximate 10% reduction in diesel soot.120 Crankcase Emissions Diesel emissions do note come solely from tailpipes. In many highway diesels the engine crankcase ventilation releases significant quantities of soot and toxic gases into the air. The composition of engine crankcase emissions has not been well documented. Crankcase emissions are result from engine exhaust “blowing by” the piston rings into the crankcase which are then, in turn, vented to avoid high pressures building up in the crankcase.121 Crankcase emissions are comprised of hydrocarbons, NOx and PM, and according to EPA can emit over 100 lbs. of these pollutants over and engines lifetime.122,123
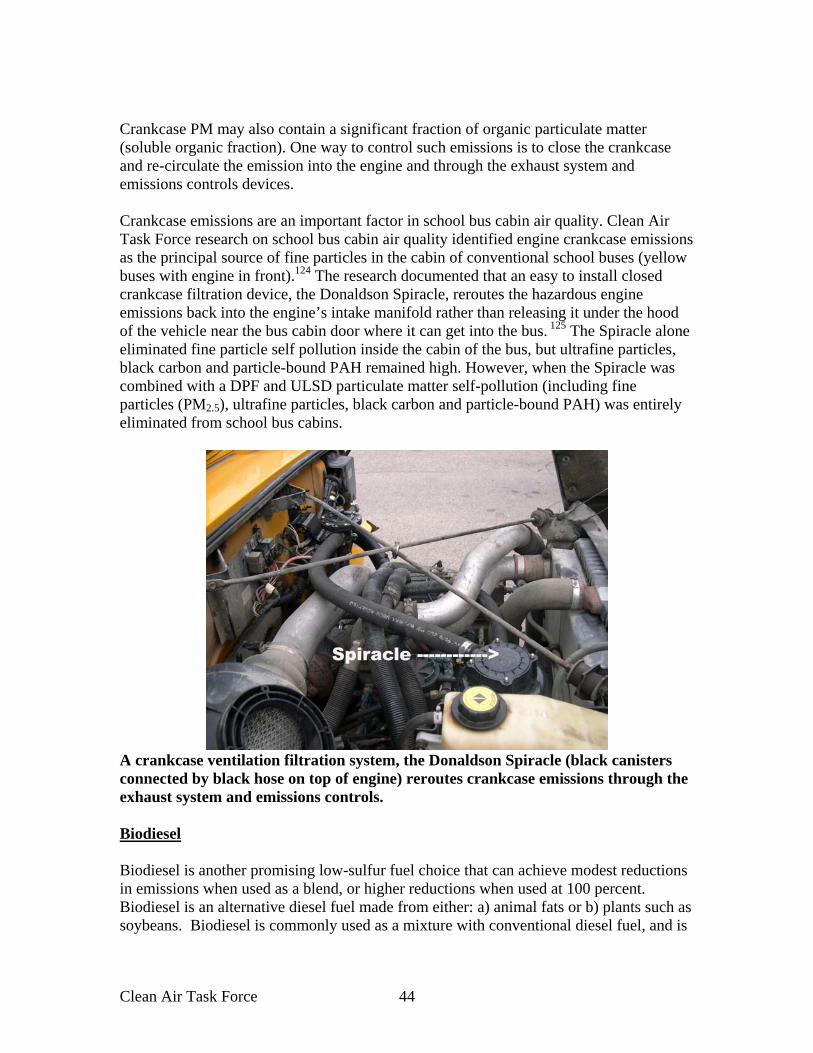
Clean Air Task Force 44
Crankcase PM may also contain a significant fraction of organic particulate matter (soluble organic fraction). One way to control such emissions is to close the crankcase and re-circulate the emission into the engine and through the exhaust system and emissions controls devices. Crankcase emissions are an important factor in school bus cabin air quality. Clean Air Task Force research on school bus cabin air quality identified engine crankcase emissions as the principal source of fine particles in the cabin of conventional school buses (yellow buses with engine in front).124 The research documented that an easy to install closed crankcase filtration device, the Donaldson Spiracle, reroutes the hazardous engine emissions back into the engine’s intake manifold rather than releasing it under the hood of the vehicle near the bus cabin door where it can get into the bus. 125 The Spiracle alone eliminated fine particle self pollution inside the cabin of the bus, but ultrafine particles, black carbon and particle-bound PAH remained high. However, when the Spiracle was combined with a DPF and ULSD particulate matter self-pollution (including fine particles (PM2.5), ultrafine particles, black carbon and particle-bound PAH) was entirely eliminated from school bus cabins.
A crankcase ventilation filtration system, the Donaldson Spiracle (black canisters connected by black hose on top of engine) reroutes crankcase emissions through the exhaust system and emissions controls. Biodiesel Biodiesel is another promising low-sulfur fuel choice that can achieve modest reductions in emissions when used as a blend, or higher reductions when used at 100 percent. Biodiesel is an alternative diesel fuel made from either: a) animal fats or b) plants such as soybeans. Biodiesel is commonly used as a mixture with conventional diesel fuel, and is

Clean Air Task Force 45
typically available as either as a blend, B20 (20% biodiesel) or B100 (100% biodiesel.)126 Biodiesel has a small fuel economy disbenefit, B20 reducing fuel economy by 2% and 10% for B100. The U.S. Department of Energy reports that biodiesel can reduce cancer risk due to diesel particulate matter by up to 94 percent for B100 and 27 percent for B20.127 For soybean-based B20 relative to average base fuel EPA reports the following emissions changes: 10% decrease in PM, 11% decrease in CO, 2% increase in NOx, 7% decrease in acetaldehyde; 2% decrease in acrolein; 8% decrease in formaldehyde. For B100 EPA reports a 45% decrease in PM, 65% decrease in hydrocarbons, 45% decrease in CO, 10% increase in NOX, 14% decrease in acetaldehyde, 15% decrease in formaldehyde, 9% decrease in acrolein,
Ultralow Sulfur Diesel Fuel is required to be available nationwide by mid-2006. Advanced Technologies Looking to the future, some bus manufacturers are promoting advanced engine technologies such as the diesel–electric hybrid. For example, Seattle, Kings County Washington, has purchased 235 diesel electric hybrid vehicles. Other bus replacement solutions include compress natural gas buses, and hydrogen fuel cell buses.

Clean Air Task Force 46
Seattle diesel-electric hybrid bus (courtesy, New Flyer)
References 1 EPA Memorandum, Bryan Hubbell to Sam Napolitano, July 2,2001. Estimated NOX, SO2 and PM emissions health damages for heavy duty vehicle emissions. 2 Emissions data from nonroad and highway diesel rules regulatory impacts analyses. Emissions data interpolated between years for missing data (simple linear interpolation). Nonroad emissions data is from Final NRT4 Regulatory Impact Analysis (EPA420-R-04-007, May 2004) Chapter 3/Emissions Inventory http://www.epa.gov/nonroad-diesel/2004fr/420r04007d.pdf Control Case: Control case mobile diesel PM2.5 emissions from Table 3.4-6b; control case locomotive and CMV PM2.5 emissions from Table 3.4-8b; control case RMV PM2.5 emissions from Table 3.4-9b. Baseline: Baseline nonroad PM emissions from Table 3.5-4b Column B; Baseline Locomotive and CMV from Table 3.2.1; Highway Diesel PM baseline and control case emissions from Final HD07 RIA, Table IIb-5, Chapter II/Health and Welfare Concerns and Emissions Benefit http://www.epa.gov/otaq/regs/hd2007/frm/ria-ii.pdf 3 Note that in its final nonroad rule, EPA removed C-3 marine engines from the diesel emissions inventory since these engines run on residual oil fuel—a dirtier-burning, less volatile fuel than diesel that runs in marine engines. We have chosen, per EPA’s original analysis (in the proposed nonroad rule) to leave those emissions in our analysis. 4 Health Effects Institute (1995). Diesel exhaust: a critical analysis of emissions, exposure and health effects. 5 EPA (2004) Air quality criteria for particulate matter (fourth external review draft.) Available at: http://cfpub2.epa.gov/ncea/cfm/partmatt.cfm 6 Modeled health impacts of less severe acute health impacts (e.g. other than mortality, heart attacks) likely understate the full magnitude of the impacts because many cases go unreported (e.g. asthma, bronchitis self treatment, or treatment in small clinics or private offices.) Furthermore, the U.S. does not manage a central database of national health records.
7 Sources of Cause of Death Statistics: 3,000 cancer and 35,000 heart disease-related deaths from second hand smoke: American Lung Associate Fact Sheet: http://www.lungusa.org/site/pp.asp?c=dvLUK9O0E&b=35422 ; 17,000 Drunk Driving Deaths in 2001. Mothers Against Drunk Driving: http://www.madd.org/home/ ; Center For Disease Control (CDC) October 14, 2004. Deaths Final Data: 2002, Table 11. Available at: http://www.cdc.gov/nchs/data/nvsr/nvsr53/nvsr53_05acc.pdf ; Firearm homicide, 11,829; HIV: 14,095;

Clean Air Task Force 47
Workplace 5,307; 23,600 Deaths from Power Plant Emissions: Abt Associates Report (2004): http://www.catf.us/publications/reports/Power_Plant_Emissions_June_2004.php
8 The number per million is the chance in a population of a million people who might be expected to get cancer over a 70-year lifetime. A potential cancer risk of 10 in a million means if one million people were exposed to a certain level of a pollutant or chemical there is a chance that 10 of them may develop cancer over their 70-year lifetime. This would be 10 new cases of cancer above the expected rate of cancer in the population. 9 For 1999 NATA national excess cancer risk from air toxics other than diesel see: Inside EPA, Inside Washington Publishers, (December 15, 2004) http://www.insideepa.com/ 10 This finding is based on inhalation as the only exposure path and is limited to the thirty-three air toxics included in EPA’s 1996 National Air Toxics Assessment (NATA). The relative cancer risk of diesel particulate matter is calculated as a ratio of the cancer risk of all air toxics tracked by EPA in the NATA divided by the risk of diesel particulate. We calculated the cancer risk for diesel PM in the U.S. based by applying the CARB cancer unit risk factor for diesel particulate matter to 1999 ASPEN model average national ambient concentration results for diesel PM. (Source for national toxic risk: Inside EPA, Inside Washington Publishers, December 15, 2004.) 11 The national average ambient diesel particulate matter concentration from 1999 ASPEN modeling (1.21 ug/m3) was multiplied times the CARB diesel particulate matter unit risk of 3 in 10,000 per 1.0 ug/m3 and distributed over the 2005 U.S. population to get total of 107,000 lifetime cancers assuming a 70-year lifetime of exposure to the national average ambient concentration. The annual estimated impact is calculated by dividing the 107,000 lifetime cancers by 70 years, arriving at 1,530 annual cancers attributable to diesels per year. This estimate is likely very conservative (low) because urban areas where larger populations dwell, are characterized by concentrations that are much higher than the national average. 12 According to the EPA’s categorization of counties as urban or rural, the average ASPEN 1999 ambient diesel fine particle concentration is 1.3822 ug/m3 for urban counties and 0.4730 ug/m3 for rural counties. The overall national average is 1.2096 ug/m3. These averages are population weighted. These averages convert (using the 0.0003 factor) to cancer risks of 415 per million urban, 142 per million rural, and 363 per million average. 13 see: http://remsad.saintl.com/ . 14 see: http://www.epa.gov/ttn/ecas/benmapdownload.html ) 15see: http://www.epa.gov/scram001/tt22.htm#rec 16 MSA risk is a population-weighted average across all of the counties within that MSA. The fraction which a county’s population makes up of its entire respective MSA was calculated for each county (some counties are not in MSAs, and these were ignored). These fractions were used to weight the health impacts for the county. The average value for the MSA was calculated as the average of the weighted impacts for each county. 17see: http://www.epa.gov/scram001/tt22.htm#rec 18 Follows the methodology employed by U.S. PIRG in its report: The Dangers of Diesel. Available at: http://www.uspirg.org/reports/dangersofdiesel2002/dangersofdieselreport2002.pdf 19 EPA (1999). Analysis of the Impacts of Control Programs on Motor Vehicle Toxics Emissions and Exposure in Urban Areas and Nationwide: Volume 1, EPA420-R-99-029, November 1999, Table 10-2. 20 Environmental Protection Agency fact sheet: Diesel Exhaust in the United States. EPA 420-F-02-048, September, 2002. Available at: http://www.epa.gov/otaq/retrofit/documents/420f03022.pdf . The unit of measure used by EPA for diesel emissions, g/bhp-hr = grams of pollutant released per brake horsepower hour. 21 California Air Resources Board (2000). Risk Reduction Plan to Reduce Particulate Matter Emissions from Diesel-Fueled Engines and Vehicles. CARB Mobile Source Control Division. October 2000. 22 40 CFR Part 80 & 86, Fed.Reg. Mar. 29, 2001 Final Rule. Control of Emissions of Hazardous Air Pollutants from Mobile Sources, p.17230-17273.

Clean Air Task Force 48
23 See, e.g.,
Pope, C.A., Thun, M.J., Namboordiri, M.M. and Dockery, D.W., et al.; Particulate Air Pollution as a Predictor of Mortality in a Prospective Study of U.S. Adults. 151 American Journal of Respiratory and Critical Care Medicine (1995). Available online at http://ajrccm.atsjournals.org/search.shtml.
Krewski, D., Burnett, R.T., Goldberg, M.S., Hoover, K., Siemiatycki, J., Jerrett, M., Abrahamowicz, A. and White, W.H., Reanalysis of the Harvard Six Cities Study and the American Cancer Society Study of Particulate Matter and Mortality; Special Report to the Health Effects Institute, Cambridge, MA (July 2000).
Samet, J.M., Dominici, F., Zeger, S.L., Schwartz, J. and Dockery, D.W.; National Morbidity, Mortality and Air Pollution Study, Part II: Morbidity, Mortality and Air Pollution in the United States; Health Effects Institute Research Report No. 94, Cambridge MA (June 2000).
Dockery, D.W., Pope, C.A., Xu, S. and Spengler, J.D., et al; An Association Between Air Pollution and Mortality in Six U.S. Cities; 329 New England J. Medicine 1753-59 (1993). Available online at http://nejm.org/content/1993/0329/0024/1753.asp. 24 Laden, F., Neas, L., Dockery, D. and Schwartz, J. (2000). Association of fine particulate matter from different sources with daily mortality in six U.S. cities. Environmental Health Perspectives, vol. 108, no. 10., p. 941-947. 25 Nemmar, A. et al (2002). Passage of inhaled particles into the blood circulation in humans. Circulation v. 105, 411-414. 26 EPA (2002). Health assessment for diesel engine exhaust. National Center for Environmental Assessment, Office of Research and Development, U.S. EPA.EPA/600/8-90/057F. May 2002. P.2-121-122. 27 Ultrafine PM is 0.005-0.05 microns in size. For reference fine mass PM (PM 2.5) contains all particulate matter less than 2.5 microns. Although ultrafine PM makes up a small percent of fine mass, it may constitute a large proportion of the numbers of particles. 28 Donaldson, Ken, et.al., (2001) “Ambient Particle Inhalation and the Cardiovascular System: Potential Mechanisms,” Envir. Health Perspectives, Vol. 109, Supp. 4, Aug. 2001, p. 525. 29 NYU Press release, March 5, 2002. Most Definitive Study Yet Shows Tiny Particles in Air Are Linked to Lung Cancer. 30 Pope. C.A., Burnett, R.T., Thun, M.J, Calle, E.E., Krewski, D., Ito, Kaz, Thurston, G.D., (2002). Lung cancer, cardiopulmonary mortality , and long term exposure to fine particulate air pollution. Journal of the American Medical Association, vol. 287, p. 1132-1141. 31 Peters, A. (2001). Increased particulate air pollution and the triggering of myocardial infarction. Circulation, v. 109. June 12, 2001. 32 Donaldson, K et al (2001). Ambient particle inhalation and the cardiovascular system: potential mechanisms. Environmental Health Perspectives, v. 109, supp. 4. 33 Ghio, A.J., Devlin, R.B. (2001). Inflamatory lung injury after bronchial instillation of air pollution particles. American Journal of Respiratory Critical Care Medicine, v. 164, p. 704-708. 34 Pope. C.A., Burnett, R.T., Thun, M.J, Calle, E.E., Krewski, D., Ito, Kaz, Thurston, G.D., (2002). Lung cancer, cardiopulmonary mortality , and long term exposure to fine particulate air pollution. Journal of the American Medical Association, vol. 287, p. 1132-1141. 35 Peters, A., Pope, A.C. (2002). Cardiopulmonary mortality and air pollution. The Lancet v. 360, p. 1184. October 19, 2002. 36 Brook, R.D., Brook, J.R., Urch, B., Rajagopalan, S., Silverman, P. (2002) Inhalation of fine particulate air pollution and ozone causes acute arterial vasoconstriction in healthy adults. Circulation v. 105, p. 1534-1536. 37 Peters, A., Dockery, D.W., ,Muller, J.E., Mittleman, M.A. (2001). Increased particulate air pollution and the triggering of myocardial infarction. Circulation vol. 103, 2810-2815. 38 Peters, A., Liu, E., Verier, R.I. et al. (2000). Air pollution and incidence of cardiac arrhythmia. Epidemiology, v. 11, p. 11-17. 39 Hong, Y., Lee, J, Kim, H., Kwon, H. (2002). Air pollution. A new risk factor in ischemic stroke mortality. Stroke, v.33, p.2165-2169.

Clean Air Task Force 49
40 Hong, Y., Lee, J., Kim, H., Ha, E., Schwartz, J. and Christiani, D.C. (2002). Effects of air pollutants on acute stroke mortality. Environmental Health Perspectives, v. 110, no. 2, February 2002. 41 Nemmar, A., Hoet, P., Dinsdale, D.,Vermylen, J., Hoylaerts,M., Nemery, B. Diesel Exhaust Particles in Lung Acutely Enhance Experimental Peripheral Thrombosis. (2003) Circulation. Vol. 107, p. 1202-1208. 42 Churg, A., Brauer, M., Avila-Casado, M., Fortoul, T.I., and Wright, J.L. (2003). Chronic exposure to high levels of particulate air pollution and small airway remodling. Environmental Health Perspectives v.111, no. 5, p. 714-718. 43 Hoek, G., Brunekreef, B., Goldbohm, S., Fischer, P. and van den Brandt, P. (2002). Association between mortality and indicators of traffic-related air pollution in the Netherlands: a cohort study. The Lancet vol. 360, p. 1203-1209. December 19, 2002. 44 Kim, J., Smorodinsky, S., Lipsett, M., Singer, B., Hodgson, A., and Ostro, B. (2004). Traffic-related Air Pollution near Busy Roads The East Bay Children's Respiratory Health Study. American Journal of Respiratory and Critical Care Medicine, vol 170, p. 520-526. 45 California Air Resources Board (1998). Proposed identification of diesel exhaust as a toxic air contaminant. California Environmental Protection Agency, Air Resources Board, Office of Environmental Health Hazard Assessment, April 22, 1998 46 EPA (2002). Health assessment for diesel engine exhaust. National Center for Environmental Assessment, Office of Research and Development, U.S. EPA. EPA/600/8-90/057F. May 2002.P.2-122. 47 www.epa.gov/ttn/atw/nata/rcharts/figure18.pdf 48 Lloyd, A.C., and Cackette, T.A. (2001). Diesel engines: environmental impacts and control. Journal of the Air and Waste Management Association, v. 51, p. 809-847. June 2001. 49 www.epa.gov/ttn/atw/nata/rcharts/figure18.pdf 50 Lloyd, A.C., and Cackette, T.A. (2001). Diesel engines: environmental impacts and control. Journal of the Air and Waste Management Association, v. 51, p. 809-847. June 2001. 51 California assessment of diesel exhaust as a toxic air contaminant, available at: http://www.arb.ca.gov/regact/diesltac/diesltac.htm . Also see: Findings of the Scientific Review Panel on The Report on Diesel Exhaust as adopted at the Panel’s April 22, 1998, meeting. http://www.arb.ca.gov/toxics/dieseltac/de-fnds.pdf . 52 See, for example, -EPA, Health Assessment Document for Diesel Exhaust: Office of Research and Development, Sept. 2002. Lloyd, A.C., and Cackette, T.A. (2001). Diesel engines: environmental impacts and control. Journal of the Air and Waste Management Association, v. 51, p. 809-847. June 2001; -Cohen, A.J. and Higgins, M.W.P. (1995). Health effects of diesel exhaust: epidemiology. In Diesel Exhaust : A critical analysis of emissions, exposure and health effects. p. 251-292. Health Effects Institute, Cambridge MA. April 1995; -Frumkin, H., Thun, M,J. (2001); Diesel Exhaust. Environmental Carcinogens, vol. 51, number 3, pp. 193-198, May/June 2001. 53 Cohen, A.J. and Higgins, M.W.P. (1995). Health effects of diesel exhaust: epidemiology. In Diesel Exhaust : A critical analysis of emissions, exposure and health effects. p. 251-292. Health Effects Institute, Cambridge MA. April 1995. 54 Frumkin, H., Thun, M,J. (2001); Diesel Exhaust. Environmental Carcinogens, vol. 51, numner 3, pp. 193-198, May/June 2001. 55 Health Effects Institute (1995). A critical analysis of emissions, exposure and health effects: a special report of the Institute’s diesel working group. Health Effects Institute, Cambridge MA. 56 EPA (2000) RIA, Heavy-duty engine and vehicle standards and highway fuel sulfur control requirements. EPA420-R-00-026, p II-93. 57 Lipsett, M., Campleman, S., (1999). Occupational exposure to diesel exhaust and lung cancer: a meta-analysis. American Journal of Public Health v. 89, no 7, p. 1009-1017. 58California Environmental Protection Agency Air Resources Board (2000). Risk reduction plan to reduce particulate matter emissions from diesel-fueled engines and vehicles. P.1 Executive Summary.
Clean Air Task Force 50
59 EPA, Health Assessment Document for Diesel Exhaust: Office of Research and Development, EPA/600/8-90/057F May 2002. P. 9-14. 60 California Air Resources Board (1998): Resolution 98-35. Identification of diesel exhaust as a toxic air contaminant. 61 EPA, Health Assessment Document for Diesel Exhaust: Office of Research and Development, September 2002. P. 8-15. 62 EPA, Health Assessment Document for Diesel Exhaust: Office of Research and Development, EPA/600/8-90/057F May 2002. 63 EPA, Health Assessment Document for Diesel Exhaust, Office of Research and Development, EPA/600/8-90/057F (May 2002) at: http://cfpub.epa.gov/ncea/cfm/recordisplay.cfm?deid=29060 64 The average person living in the US today is exposed to hundreds of toxic chemicals everyday by eating food, drinking water, using consumer products and just by breathing. Many of these toxic chemicals are also likely to cause cancer. To protect public health EPA suggests that the public’s exposure to single pollutants be safely below “one-in a-million”, because people are exposed to so many cancer-causing agents in their lifetimes. Using a “one-in a-million” risk level as a guidepost to protect public health can also help address the uncertainty we have about a toxic chemical’s potential for other serious health effects. In the US chemicals have often been more extensively tested for their ability to cause cancer, than for other serious health effects—birth defects, nervous system damage and other impacts. 65 Diaz-Sanchez, D., et al., Diesel Exhaust Particles Induce Local IgE Production in Vivo and Alter the Pattern of IgE Messenger RNA Isoforms, J. Clin. Invest., 94:1417-1425 (1994); Diaz-Sanchez, D., The Role of Diesel Exhaust Particles and Their Associated Polyaromatic Hydrocarbons in the Induction of Allergic Airway Disease, Allergy 52 (Suppl. 38), 52-56, (1997); Castranova, Vincent, et al., Effect of Exposure to Diesel Exhaust Particles on the Susceptibility of the Lung to Infection, EHP, Vol. 109, Suppl. 4, (August 2001),609-612.; 66 Pandya, Robert J. et. al., Diesel Exhaust and Asthma: Hypotheses and Molecular Mechanisms of Action, EHP:Volume 110, Supplement 1, Feb. 2002, 103-112.; citing CDC MMWR: CDC asthma surveillance summary 47:1-27 (1998). 67 For sources of data in this table, see: Environmental Protection Agency, “The Projection of Mobile Source Air Toxics from 1996 to 2007: Emissions and Concentrations,” August, 2001. (Totals do not reflect marine, rail, aircraft contributions)
EPA Health Assessment for Diesel Exhaust, Office of Research and Development, EPA/600/8-90/057F (May 2002). EPA declined to assign a unit risk for diesel particulate matter in the diesel Health Assessment, however EPA has indicated a probable range of 10-3 to 10-5 which translates to 12 to 1210 cancers per million.
EPA Health Assessment for Diesel Exhaust (2002) deemed diesel particulate matter a “likely” carcinogen, using yet-to-be-approved terminology. “Likely” under EPA’s proposed terminology is equivalent to “probable” under EPA’s approved terminology.
CARB Unit Risk: California Air Resources Board (1998): Staff Report for Rulemaking. Identification of diesel exhaust as a toxic air contaminant http://www.arb.ca.gov/regact/diesltac/diesltac.htm ; 68 Thurston, G.D. and Ito, K. 1999. Epidemiological studies of ozone exposure effects. IN Air Pollution and Health, Stephen T. Holgate et. al., Ed., Academic Press, London 69 Bell, M, McDermott, A, Zeger, S., Samet, J., Dominici, F. (2004) Ozone and Short-term Mortality in 95 US Urban Communities, 1987-2000. JAMA, November 17, 2004—Vol 292, No. 19. 70 Thurston, G.D. and Ito, K. 1999. Epidemiological studies of ozone exposure effects. In Air Pollution and Health, Stephen T. Holgate et. al., Ed., Academic Press, London. 71 Tolbert, P. E., et. al. 2000. Air quality and pediatric emergency room visits for asthma in Atlanta, Georgia. American Journal of Epidemiology, vol. 151, no. 8 p. 798-810 . 72 White, M.C., Etzel, R.A., Wilcox, W.D. and Lloyd, C. 1994. Exacerbation of childhood asthma and ozone pollution in Atlanta. Environmental Research vol. 65, p. 56-68.

Clean Air Task Force 51
73 Burnett, R., et. al. 2001. Association between ozone and hospitalization for acute respiratory diseases in children less than 2 years of age. American Journal of Epidemiology, vol. 153, no. 5, p. 444-452. 74Fierro, M., O’Rouke, M.K., Burgess, J.L. (2001) Adverse health effects of exposure to ambient carbon monoxide. September 2001. http://www.airinfonow.org/pdf/CARBON%20MONOXID2.PDF 75 Ritz, B. Yu, F., Fruin, F., Chapa, G., Shaw, G.M., Harris, J.A. (2002). Ambient air pollution and risk of birth defects in South California. American Journal of Epidemiology, v. 155, no. 1, p. 1-9. 76 Metzger, K.B., Tolbert, P., Klein, M., Peel, J.L., Flanders, W.D., Todd, K., Mullholland, J.A., Ryan, P.B. and Frumkin, H. (2003) Ambient air pollution and cardiovascular emergency departmenr visits in Atlanta, Georgia (1993-2000). Epidemiology, In Press. 77 See, e.g.,
Gold, D. Litonjua, A., Schwartz, J., Lovett, E., Larson, A., Nearing, B., Allen, G., Verrier, M., Cherry, R., Verrier, R. (2000). Ambient Pollution and Heart Rate Variability. Vol. 101, No. 11, 21 March 2000. P. 1267-1273.
Liao,D., Creason, J., Shy,C., Williams, R., Watts, R., and Zweidinger, R. (1999). Daily Variation of Particulate Air Pollution and Poor Cardiac Autonomic Control in the Elderly. Environmental Health Perspectives Volume 107, Number 7 July 1999
Mar,T., Norris,G., Koenig, J. and Larson, T (2000). Associations between Air Pollution and Mortality in Phoenix, 1995–1997. Environmental Health Perspectives • Volume 108, Number 4, April 2000. 78 Wiley, J.A., Robinson, J.P., Cheng, Y.T, Piazza, T, Stork, L, Pladsen, K. 1991. Study of children’s activity patterns. Final report contract No. A733-149; Survey Research Center, University of California, Berkeley, September 1991. 79 Snodgrass, W.R. Physiological and biochemical differences between children and adults and determinants of toxic response to environmental pollutants. In: Guzlean, et al., Similarities and Differences Between Children and Adults: Implications for Risk Assessment. 1151 Press, Washington, DC. (year unknown). 80 Thurston, G. D., 2000. Particulate matter and sulfate: Evaluation of current California air quality standards with respect to protection of children; California Air Resources Board, Office of Environmental Health Hazard Assessment; September 1, 2000. http://www.arb.ca.gov/ch/ceh/airstandards.htm 81 Gauderman, W.J., et al. (2004). The effect of air pollution on lung development from 10 to 18 years of age. New England Journal of Medicine,, v. 351, no. 11, September 9, 2004. 82Gauderman, W.J., McConnell, R., Gilliland, F., London, S., Thomas, D., Avol, E., Vora, H., Berhane, K., Rappaport, E., Lurmann, F., Margolis, H.G., and Peters, J. 2000. Association between aAir pollution and lung function growth in Southern California children. American Journal of Respiratory and Critical Care Medicine, vol. 162, no. 4, pp. 1-8. 83 Children examined in a dozen communities near Los Angeles experienced a three to five percent relative reduction in lung function growth between the most polluted and least polluted cities as a result of exposure to particulate matter. 84 Avol, E.L., Gauderman, W.J., Tan S.M., London, S.J., and Peters, J.M. (2001). Respiratory effects of relocating to areas of differing air pollution levels. American Journal of Respiratory and Critical Care Medicine v. 164 p. 2067-2072. 85 Woodruff, T., Grillo, J. and Schoendorf, K. 1997. The relationship between selected causes of postneonatal infant mortality and particulate air pollution in the United States. Environmental Health Perspectives, vol. 105, p. 608-612. 86 Industry called this study into question citing exposure misclassification due to insufficient assessment of geography/ location and related PM exposures. However, the HEI reanalysis of the American Cancer Society suggests that geographic exposure differences make relatively little difference in PM dose response. 87 See, e.g.
Brauer, M., Hoek, G., Van Vliet , P, et al (2002 ). Air Pollution from Traffic and the Development of Respiratory Infections and Asthmatic and Allergic Symptoms in Children. American Journal of Respiratory and Critical Care Medicine, v.166 , p. 1092-1098.

Clean Air Task Force 52
Lin, S., Munsie, J., Hwang, S., Fitzgerald, E and Cayo, M. (2002) Childhood Asthma
Hospitalization and Residential Exposure to State Route Traffic. Environmental Research Section A 88, p. 73-81. 88 McConnell, R. , Berhane, K., Gilliland, F., London, S.J., Islam, T., Gauderman, W.J., Avol, E., Margolis, H.G. and Peters, J.M. (2002). Asthma in exercising children exposed to ozone. The Lancet, v. 359, p. 386-391. February 2, 2002. 89 Ritz, B. Yu, F., Fruin, F., Chapa, G., Shaw, G.M., Harris, J.A. (2002). Ambient air pollution and risk of birth defects in South California. American Journal of Epidemiology, v. 155, no. 1, p. 1-9. 90 Peters, J.M., Avol, E., Berhane, K., Gauderman, W.J., Gillilland, F., London, S., Lurmann, H., Margolis, H., McConnell, R., and Thomas, D.C. 2001. Chronic respiratory effects of air pollution in southern California Children; Poster; HEI Annual Conference, Washington DC; Program and Abstracts; Health Effects Institute, Cambridge, MA 02139. 91 Plopper, C.G., Fanucci, M.V., Evans, M.J., Larson, S.P., Schelegle, E.S., Joad, J.P., Pinkerton, K.E., VanWinkle, L.S., Gershwin, L.J., Miller, L.A., Wu, R., Buckpitt, A.R., and Hyde, D.M. 2001. Air pollution effects in a primate model of asthma. Abstract and presentation, HEI Annual Conference, Washington DC; Program and Abstracts; Health Effects Institute, Cambridge MA, 02139 92 EPA (2002). Health assessment for diesel engine exhaust. National Center for Environmental Assessment, Office of Research and Development, U.S. EPA. EPA/600/8-90/057F. May 2002. P.2-121. 93 Hansen, J., Sata, M., Ruedy, R., Lacis, A. and Oinas, V. (2000). Global warming in the twenty-first century: an alternative scenario. Proceedings of the National Academy of Sciences. Early Edition, June 2000. 94 Jacobsen, M. (2001) Strong radioactive heating due to the mixing state of black carbon in atmospheric aerosols. Nature, v. 409, 8 February 2001. 95 Jacobsen, M. (2002) Control of fossil-fuel particulate black carbon and organic matter, the most effective method of slowing global warming. Journal of Geophysical Research. 96 For engine population data: EPA Diesel Engine Census, EPA Office of Transportation and Air Quality, 2004. For most recent highway diesel emissions see EPA Emissions Trends Report for 2002 at: http://www. epa.gov/ttn/chief/trends/trends02/trendsreportallpollut ants111504.xls 97 For descriptions of non-road engines see: EPA non-road rule: http://www.epa.gov/air/off-road/. For most recent non-road diesel emissions see: EPA Air Quality Trends for 2002 at: http://www.epa.gov/ttn/chief/trends/trends02/trends reportallpollutants111504.xls 98 For most recent marine diesel emissions see: EPA 2002 Emissions Trends Report at: http://www.epa.gov/ttn/chief/trends/trends02/trendsreport allpollutants111504.xls 99 For most recent locomotive diesel emissions, see: EPA 2002 Emissions Trends Report at: http://www.epa.gov/ttn/chief/trends/trends02/trendsreportallpollutants111504.xls 100 Ultrafine particles are generally one tenth of a micron to one one-hundredth of a micron in size. 101 Zhua, Y., Hinds,W., Kimb, S., Shenc, S. and Sioutas, C. (2002). Study of ultrafine particles near a major highway with heavy-duty diesel traffic Atmospheric Environment 36 (2002) 4323–4335 102 See, e.g.: For summary of occupational studies: Cohen, A.J. and Higgins, M.W.P. (1995). Health effects of diesel exhaust: epidemiology. In Diesel Exhaust: A critical analysis of emissions, exposure and health effects. p. 251-292. Health Effects Institute, Cambridge MA. April 1995; For most comprehensive and recent U.S. study: Railroad study: Garshick, E., Laden, F., Hart, J., Rosner, B., Smith, T., Dockery, D. and Speizer, F. (2004). Lung cancer in railroad workers exposed to diesel exhaust. Environmental Health Perspectives, v. 122, no. 15, p. 1539-1543. November 2004. For nervous system effects: Kilburn, K.H. (2000). Effects of diesel exhaust on neurobehavioral and pulmonary functions. Archives of Environmental Health, v. 55, no. 1, p. 11-17. 103 California Air Resources Board (2004) Staff report: initial statement of reasons for proposed rulemaking. Proposed Regulatory Amendments Extending the California Standards for Motor Vehicle Diesel Fuel to Diesel Fuel Used in Harborcraft and Intrastate Locomotives. October 2004. Available at: http://www.arb.ca.gov/regact/carblohc/isor.pdf 104 The number per million is the chance in a population of a million people who might be expected to get cancer over a 70-year lifetime. A potential cancer risk of 10 in a million means if one million people were

Clean Air Task Force 53
exposed to a certain level of a pollutant or chemical there is a chance that 10 of them may develop cancer over their 70-year lifetime. This would be 10 new cases of cancer above the expected rate of cancer in the population. Accrording to CARB expected rate of cancer for all causes, including smoking, is about 200,000 to 250,000 chances in a million (one in four to five people). 105 For example, a 2004 study in Ontario, Canada found increased risk of mortality from pulmonary (lung), cardiovascular (heart) and diabetes in people living within 100 meters of a roadway. 106 Kinney, P., Aggarwal, M., Northridge, M., Janssen, N. and Shepard, P. (2000). Airborne Concentrations of PM2.5 and Diesel Exhaust Particles on Harlem Sidewalks: A Community-Based Pilot Study. Environmental Health Perspectives, vol 108, no.3. 107 Lena, S., Ochieng, V., Carter, M., Holguín-Veras, J., and Kinney, P.. (2002) Elemental Carbon and PM2.5 Levels in an Urban Community Heavily Impacted by Truck Traffic. Environmental Health Perspectives, vol 110, no.10. 108 Hill, L.B., Zimmerman, N.J., and Gooch, J., A Multi-City Investigation of the Effectiveness of Retrofit Emissions Controls in Reducing Exposures to Particulate Matter in School Buses, Clean Air Task Force Report, (2005). Available at: http://www.catf.us/publications/reports/CATFPurdue_Multi_City_Bus_Study.php ; Wargo, J., and Brown, D., Children’s Exposure to Diesel Exhaust on School Buses. Environment and Human Health Inc., (February 2002), p. 76. http://www.ehhi.org/pubs/children_diesel.html; Natural Resources Defense Council, No Breathing in the Aisles. Diesel Exhaust Inside School Buses (2001). Available at: http://www.nrdc.org/air/transportation/schoolbus/sbusinx.asp; California Air Resources Board, “Characterizing the Range of Children’s Pollutant Exposure During School Bus Commutes,” (2003). Available at: http://www.arb.ca.gov/research/schoolbus/schoolbus.htm 109 Northeast States for Coordinated Air Use Management: Unpublished data, 2004. 110 Fruin et al (2000). Fine particle and black carbon concentrations inside vehicles. 10th Annual Conference of the International Society of Exposure Analysis, Oct. , 2000. 111See, e.g. Weinhold, B. (2001) Pollutants lurk inside vehicles: Don’t breathe and drive? Environmental Health Perspectives, vol. 109, no. 9, September 2001 Riediker, M., Cascio, W., Griggs, T., Herbst, M., Bromberg, P., Neas, L., Williams, R., and Devlin, R., (2004). Particulate Matter Exposure in Cars Is Associated with Cardiovascular Effects in Healthy Young Men. American Journal of Respiratory and Critical Care Medicine Vol 169. pp. 934-940, (2004)Marr, L.C., Grogan, L.A., Wohrnschimmel, H., Molina, L, Molina, M., Smith, T., Garshick, E. (2004). Vehicle traffic as a source of particulate polycyclic aromatic hydrocarbon exposure in the Mexico City metropolitan area. Environmental Science and Technology, v. 38, no. 9, p. 2584-2592. Fruin et al (2000). Fine particle and black carbon concentrations inside vehicles. 10th Annual Conference of the International Society of Exposure Analysis, Oct. , 2000. 112 See: http://www.epa.gov/pmdesignations/ 113 1990 Truck Survival Rate, U.S. DOE, (2003) Available at: http://www-cta.ornl.gov/data/tedb23/Spreadsheets/Table3_11.xls 114Source: MECA: http://www.meca.org/jahia/Jahia/engineName/filemanager/pid/229/dieselfact.PDF?actionreq=actionFileDownload&fileItem=213 115 http://www.epa.gov/cleanschoolbus/ 116 Latest statistics from the U.S. Department of Transportation tell the story: school buses have the best safety record of any form of transportation. Last year, just six youngsters were killed as school bus occupants. Yet, 800 youngsters are killed every year getting to and from school by some other means than a school bus.Source: Bus Information Council: http://www.schoolbusinfo.org/report.htm 117 See the full school bus report at: http://www.catf.us/publications/reports/CATF-Purdue_Multi_City_Bus_Study.php 118Source: MECA: http://www.meca.org/jahia/Jahia/engineName/filemanager/pid/229/retrofitfact.PDF?actionreq=actionFileDownload&fileItem=214 119 http://www.lubrizol.com/PuriNOx/questions.asp 120 Some suggest that the ULSD is unnecessary for the operation of a DPF.

Clean Air Task Force 54
121 Environmental Protectiuon Agency 40 CFR Parts 69, 80, and 86. Control of air pollution from new motor vehicles: heavy duty engine and vehicle standards and highway diesel fuel sulfur control requirements, final rule. Federal Register vol. 66, no. 12, Thursday January 18, 2001, page 5040. 122 EPA, Final Regulatory Impact Analysis, Heavy Duty Engine and Vehicle Standards and Highway Diesel Fuel Sulfur Control Requirements rule, EPA420-R-00-26, page III-78. 123 EPA Final Regulatory Impact Analysis, Control of Emissions from Nonroad Diesel Engines. EPA420-R-04-007. Section 4.1.6, page 4-101, May 2004. http://www.epa.gov/nonroad-diesel/2004fr/420r04007.pdf 124 http://www.catf.us/goto/schoolbusreport/ 125 http://www.donaldson.com/en/engine/support/datalibrary/002509.pdf 126 EPA (2002). Draft Technical Report: A Comprehensive Analysis of Biodiesel Impacts on Exhaust Emissions, October 2002 (EPA420-P-02-001). 127 http://www.afdc.doe.gov/pdfs/Biodiesel_fs.pdf