Embed Size (px)
Citation preview

East Tennessee State UniversityDigital Commons @ East
Tennessee State University
Electronic Theses and Dissertations Student Works
5-2001
An Analysis of Configurations in a NongradedElementary School in Northeast Tennessee.Pamela Ann EvanshenEast Tennessee State University
Follow this and additional works at: https://dc.etsu.edu/etd
Part of the Curriculum and Social Inquiry Commons
This Dissertation - Open Access is brought to you for free and open access by the Student Works at Digital Commons @ East Tennessee StateUniversity. It has been accepted for inclusion in Electronic Theses and Dissertations by an authorized administrator of Digital Commons @ EastTennessee State University. For more information, please contact [email protected].
Recommended CitationEvanshen, Pamela Ann, "An Analysis of Configurations in a Nongraded Elementary School in Northeast Tennessee." (2001). ElectronicTheses and Dissertations. Paper 76. https://dc.etsu.edu/etd/76

.
AN ANALYSIS OF CONFIGURATIONS IN A NONGRADED ELEMENTARY SCHOOL
IN NORTHEAST TENNESSEE
A Dissertation
Presented to
the Faculty of the Department of Educational Leadership and Policy Analysis
East Tennessee State University
In Partial Fulfillment
of the Requirements for the Degree
Doctor of Education
by
Pamela Ann Brown Evanshen
May 2001
Dr. Russell Mays, Chair Dr. Rebecca Isbell
Dr. Louise MacKay Dr. Russell West
Keywords: Nongraded, Multiage, Mixed-age, Nongraded Program Configuration, Continuous Progress,
Developmentally Appropriate Primary

2
ABSTRACT
AN ANALYSIS OF CONFIGURATIONS IN A NONGRADED ELEMENTARY SCHOOL
IN NORTHEAST TENNESSEE
by
Pamela Ann Brown Evanshen
The purpose of this study was to compare reading and math academic achievement scores of a cohort of students
who had experienced mixed-age (two-grade span) and multiage (three-grade span) configurations, in a selected
nongraded elementary school located in East Tennessee. Student attitude toward school, gender and socioeconomic
status were also analyzed.
The causal-comparative quantitative approach, along with convenience sampling, was the foundation for this study.
Academic achievement normal curve equivalency (NCE) scores from the TerraNova Comprehensive Test of Basic
Skills for the 1997-2000 academic years and survey results from the Attitude Toward School Inventory (Meier,
1973) given in the concluding year (2000) were analyzed using ANOVA, ANCOVA and t-tests to determine which
configuration produced better results for students.
Statistically significant results (p=. 05) were found indicating that the multiage students performed better in reading
achievement during the 1997 and 1998 years (ANOVA). ANCOVA results indicated multiage configuration to be
statistically significant in 2000 when controlling for prior reading achievement. ANOVA results proved to be
statistically significant in math for the multiage configuration in 1998. NCE mean scores in reading and math were
higher, some significantly higher, for all four years 1997, 1998, 1999, and 2000 for those students in the multiage
(three-grade span) configuration.
No statistically significant differences were found in configurations regarding attitude toward school, however in all
subtest areas the multiage (three-grade span) students mean scores were higher than the mixed-age (two-grade span)
students scores.
Findings include a stronger case for multiage (three-grade span) configuration when planning a nongraded
developmentally appropriate elementary program.

3
DEDICATION
Dedicated to my husband Brian and my son Tyler. Without their support, encouragement, love, patience, and
understanding this journey would have been impossible. Also, my parents, Pat Daly and Albert Brown, without
their love, guidance, and continual support I would not be the person that I am.

4
ACKNOWLEDGMENTS
I sincerely thank Dr. Russell Mays, my chairperson, for his positive attitude, encouragement, support and
valuable contribution to this project. Dr. Russell West, I thank you for your time and advice and for the statistical
knowledge you shared with me. I never thought I’d be excited about analyzing data. Your gentle, positive attitude
and willingness to help actually made it a fun challenge. Dr. Louise MacKay, I thank you for constant support
throughout the doctoral program and for your wonderful editing skills that assisted tremendously. Dr. Rebecca
Isbell, thank you so much for being the wonderful early childhood advocate that you are. You have mentored me
for so many years. My belief, understanding, and dedication to the constructivist approach are truly owed to you.
I appreciate Mr. William Clark, my mentor and friend. Without his encouragement and support I would
not have had the wonderful educational experiences that have led me to this point. Thank you for the moral
leadership that you consistently displayed. I thank all of the teachers at Washington Elementary School in
Kingsport, Tennessee (1994-2001) for their constant display of hard work and dedication to young children. It is
through their hard work that I became inspired to complete this study. They know what it takes to provide all
children with a positive learning environment in order to experience success and I thank them for being so
committed in their “non-traditional” approach. I thank the wonderful teachers in the Early Childhood Learning
Center who were the first group I worked with to establish multiage classes. They have encouraged and supported
my efforts in obtaining this degree and I sincerely thank them.
I express sincere gratitude to Cookie Greer, Linda Arnold, Susan Bishop, Pandy Elkins, Jaclyn Clendenen,
and Diane Ivey for their daily support and encouragement throughout the last three years as I worked to complete
the doctoral program. I appreciated coming to a positive work environment each day.
The journey would not have been as rewarding without the wonderful cohort that I was privileged to be a
part of in the ELPA department. Cohort XII, I thank you for your talents that you shared so willingly, and your
support and continual friendship throughout our semesters with one another. I especially want to thank two dear
friends in the cohort group, Dwain Arnold and Tracey Cook; they are two talented and fun friends who made each
part of the journey enjoyable. It would have been hard to endure this without them.
My mother Pat Daly inspired me to become an educator. When I was a young girl she volunteered with
children who had special needs. I learned from her how rewarding it is to work with others and how important
education is. She modeled in her volunteer work, in her job as a nurse, and as a mother of three girls what a positive
work ethic is, while consistently demonstrating care and concern for others. I express my love and admiration to
her.

5
Most of all, my love and appreciation go to my family, Brian and Tyler. Thank you so much for your
continuous love and support. Without their encouragement this study would have only been a dream. I thank them
from the bottom of my heart for making it a reality for me.

6
CONTENTS
Page
ABSTRACT .............................................................................................................................................. 2
DEDICATION .............................................................................................................................................. 3
ACKNOWLEDGMENTS ................................................................................................................................ 4
LIST OF TABLES............................................................................................................................................. 9
Chapter
1. INTRODUCTION ................................................................................................................................... 10
Purpose of the Study............................................................................................................................ 12
Research Questions………………………………………………………………............................... 13
Hypotheses… ...................................................................................................................................... 13
Hypothesis 1................................................................................................................................. 13
Hypothesis 2................................................................................................................................. 13
Hypothesis 3................................................................................................................................. 13
Hypothesis 4................................................................................................................................. 14
Hypothesis 5................................................................................................................................. 14
Hypothesis 6................................................................................................................................. 14
Hypothesis 7................................................................................................................................. 14
Hypothesis 8................................................................................................................................. 14
Hypothesis 9................................................................................................................................. 14
Hypothesis10................................................................................................................................ 15
Hypothesis 11............................................................................................................................... 15
Hypothesis 12............................................................................................................................... 15
Hypothesis 13............................................................................................................................... 15
Hypothesis 14............................................................................................................................... 15
Hypothesis 15............................................................................................................................... 15
Significance of the Study..................................................................................................................... 15
Limitations........................................................................................................................................... 16

7
Definition of Terms. ............................................................................................................................ 16
Overview of the Study. ........................................................................................................................ 17
2. REVIEW OF RELATED RESEARCH.................................................................................................... 18
History .............................................................................................................................................. 18
Definition and Program Configurations............................................................................................... 20
Philosophies That Guide Nongraded Programs................................................................................... 24
Characteristics of Nongraded Schools................................................................................................. 28
Benefits of Nongraded Schools. .......................................................................................................... 33
Student Attitude Towards School in Nongraded Programs. ................................................................ 35
Summary of Previous Research Findings. ........................................................................................... 36
3. RESEARCH METHODOLOGY ............................................................................................................. 39
Design………...................................................................................................................................... 39
Population ........................................................................................................................................... 39
Sampling Method. .............................................................................................................................. 40
Instrumentation.................................................................................................................................... 40
Data Collection.................................................................................................................................... 41
Data Analysis....................................................................................................................................... 42
Summary.............................................................................................................................................. 42
4. RESULTS……………............................................................................................................................. 43
Research Question #1…. ..................................................................................................................... 43
Research Question #2.. ........................................................................................................................ 53
Research Question #3.. ........................................................................................................................ 58
Research Question #4.. ........................................................................................................................ 63
5. SUMMARY, FINDINGS, CONCLUSIONS, IMPLICATIONS, AND RECOMMENDATIONS…….. 66
Summary.............................................................................................................................................. 66
Findings……… ................................................................................................................................... 67
Research Question #1…............................................................................................................... 67
Research Question #2................................................................................................................... 67
Research Question #3................................................................................................................... 68
Research Question #4................................................................................................................... 69
Conclusions.. ....................................................................................................................................... 69
Implications.. ....................................................................................................................................... 70

8
Page
Recommendations.. ............................................................................................................................. 71
REFERENCES… .............................................................................................................................................. 72
APPENDIX …….............................................................................................................................................. 78
Permission from Superintendent......................................................................................................... 78
VITA ………….. .............................................................................................................................................. 79

9
LIST OF TABLES
Table Page
1. Demographic Profile of Cohort During Year 2000 ............................................................................... 43
2. Demographic Profile of Cohort During 1999 ......................................................................................... 45
3. Demographic Profile of Cohort During 1998. ........................................................................................ 46
4. Demographic Profile of Cohort During 1997. ........................................................................................ 47
5. Multiage and Mixed-Age Configurations. .............................................................................................. 48
6. Cohort Normal Curve Equivalency Reading and Math Mean Scores for Configurations 1997-2000 .... 50
7. Results of ANOVA for Hypothesis 1 ..................................................................................................... 53
8. Results of ANOVA for Hypothesis 2 ..................................................................................................... 54
9. Results of ANOVA for Hypothesis 3 ..................................................................................................... 54
10. Results of ANOVA for Hypothesis 4. .................................................................................................... 55
11. Results of ANCOVA for Hypothesis 5................................................................................................... 56
12. Results of ANCOVA for Hypothesis 6................................................................................................... 57
13. Results of ANCOVA for Hypothesis 7................................................................................................... 58
14. Results of ANOVA for Hypothesis 8. .................................................................................................... 59
15. Results of ANOVA for Hypothesis 9. .................................................................................................... 59
16. Results of ANOVA for Hypothesis 10. .................................................................................................. 60
17. Results of ANOVA for Hypothesis 11. .................................................................................................. 61
18. Results of ANCOVA for Hypothesis 12................................................................................................. 61
19. Results of ANCOVA for Hypothesis 13................................................................................................. 62
20. Results of ANCOVA for Hypothesis 14................................................................................................. 63
21. Results of t-test for Hypothesis 15.......................................................................................................... 64

10
CHAPTER 1
INTRODUCTION
The traditional graded structure of schooling, credited to Horace Mann, was brought to the United States in
the mid 1800s. The belief behind this structure was democracy, which depended on educated citizens; therefore all
children must be educated. The challenge was how to organize schools into a system that could handle the large
number of European immigrants who were flooding into America. The Quincy Grammar School was founded in
Boston in 1848 and became the model by which thousands of elementary schools were patterned (Anderson &
Pavan, 1993).
Students were sorted by grade level of similar achievement and either passed or failed at the end of each
year. Teachers taught in separate classrooms and the idea of a systemized lock-step graded curriculum was thought
to heighten learning and make teaching easier. It permitted teachers to work with larger groups of students, which
was economically advantageous. Soon after implementation the concept was questioned and attacked. The president
of Harvard University, Charles W. Eliot and the president of the University of Chicago, William R. Harper,
expressed concern regarding the neglect of personal and social needs. John Dewey, University of Chicago, also
challenged the graded structure as it conflicted with his philosophy of appreciating the differences in individuals and
allowing individual students to learn from their experiences in and out of the classroom (Goodlad & Anderson,
1959). The graded structure however, survived the attack and remains in place today in the majority of our schools
across the nation (Anderson & Pavan, 1993).
Goodlad and Anderson (1987) stated, “There is simply no research that says a graded structure is
desirable.”(p. 18). The 1990 educational reform movement challenged educators to examine the educational
structure of schools in order to meet the needs of our ever changing, widely diverse society (Gaustad, 1992a).
Schools can no longer teach all the factual knowledge students will need to know. They need to teach how to think
critically, how to communicate effectively, how to solve problems and how to learn. According to Gaustad (1992a),
these are the primary goals of educational reform.

11
Nongraded or multiage education involves placing children of different ages, abilities, and emotional
maturity in the same classroom. In multiage classes students remain with the same teacher or team of teachers for
more than one year (Gaustad, 1996).
Multiage and multigrade are similar in philosophy yet differ in that the multigrade model is graded.
Children know if they are first, second, or third graders and are referred to by grade level. In multigrade classrooms
it is easier to retreat into less developmentally appropriate but more “accountable,” grade specific practices.
According to Grant and Johnson (1995), the multigrade model may be the stage in between the graded and
nongraded multiage model.
Multiage classrooms are nongraded. The focus is on each child’s individual progress. There is no
specific timetable, nor is it expected that everyone will follow the same pattern. Multiage instruction gives
developmentally appropriate practices the time and flexibility to function effectively and efficiently.
Research has shown us that multiage grouping promotes cognitive and social growth and reduces antisocial
behavior in students. It encourages teachers to use developmentally appropriate practices, integrate the curriculum,
and provide active learning opportunities for all students (Gaustad, 1997).
Developmentally appropriate practices result from the process of professionals making decisions about the
well-being and education of children. It is based on three kinds of information: what is known about child
development and learning, what is known about the strengths, interests, and needs of each individual child in the
class, and what is known about the social and cultural contexts in which children live. It allows educators to teach
students as individuals rather than as a whole group (Bredekamp & Copple, 1997). Developmentally appropriate
practice encourages integration of the curriculum. Recent knowledge about brain development offers strong support
for curriculum integration (Caine & Caine, 1994).
The nongraded school is seen to have three organizational advantages over the traditional graded school. It
provides an unbroken learning continuum without predetermined barriers, encourages continuous individual
progress and allows for flexibility in student grouping based on the individual needs of the child. A non-age-graded
organizational structure permits individual students to make continuous progress in each academic area, taking as
much or as little time as they need to complete the elementary school curriculum, rather than requiring them to
proceed in lock-step with their peers (Goodlad & Anderson, 1959).

12
In a review of 64 research studies published between January 1968 and December 1990, Pavan (1992)
found that students in nongraded settings do as well or better than students in traditional self-contained classes in
terms of academic achievement, mental health, and attitude toward school. Nongradedness or multiage continuous
progress education, as referred to by Grant and Johnson (1995), is a reform that is inevitable and will move us closer
to respecting what we know about how children grow and develop. It allows all children an opportunity to
experience success in school and brings truth to the phrase ‘learning is a lifelong process’ (Grant & Johnson, 1995).
Nongraded programs are designed to allow students to progress at their own rate over an extended period of
time. A variety of terms are used to describe the organizational structures often associated with nongraded
programs. Mixed-age grouping, placing students with an age range greater than one year together in the same
classroom, and multiage grouping, placing students with an age range greater than two years together in the same
classroom, are two types of nongraded configurations (Gaustad, 1994). Mixed-age depicts a two-grade span and
multiage a three-grade span in this study. Determining which configuration leads to greater academic achievement
and student attitude regarding school is an important issue that warrants further research to assist in school reform.
Purpose of the Study
There are a variety of nongraded configurations. For comparison purposes the term “grade” was used to
associate with the traditional structure of schooling. The traditional grading labels K, 1, 2, 3, 4, and 5 would not be
used in a nongraded program. Some nongraded configurations span over two grades (K-1, 2-3, 4-5) and some over
three grades (K-2, 3-5). The purpose of this study was to compare reading and math academic achievement scores of
a cohort of students who had experienced mixed-age (two-grade span) configurations and multiage (three-grade
span) configurations, in a selected nongraded elementary school located in East Tennessee. Students’ attitudes
toward school, gender, and socioeconomic status were also analyzed.

13
Research Questions
To determine if configuration, mixed-age (two-grade span) versus multiage (three-grade span), affects
student achievement in reading and math and/or attitude towards school, the following research questions were
posed:
1. What is the demographic profile of the cohort of students in the selected nongraded elementary school?
2. Is there a difference in normal curve equivalent reading achievement scores of the cohort of students in
mixed-age (two-grade span) and multiage (three-grade span) configurations?
3. Is there a difference in normal curve equivalent math achievement scores of the cohort of students in
mixed-age (two-grade span) and multiage (three-grade) span configurations?
4. Is there a difference in student attitude toward school of the cohort of students during what is traditionally
known as fifth grade in mixed-age (two-grade span) and multiage (three-grade span) configurations?
Hypotheses
The following hypotheses were examined at the .05 level of significance:
Hypothesis 1.
There are no statistically significant differences in the Total Reading scores on the 2000 TerraNova
Standardized Assessment of the cohort of students (during the fifth grade year) in mixed-age (two-grade span) and
multiage (three-grade span) configurations.
Hypothesis 2.
There are no statistically significant differences in the Total Reading scores on the 1999 TerraNova
Standardized Assessment of the cohort of students (during their fourth grade year) in mixed-age (two-grade span)
and multiage (three-grade span) configurations.
Hypothesis 3.
There are no statistically significant differences in the Total Reading scores on the 1998 TerraNova
Standardized Assessment of the cohort of students (during their third grade year) in mixed-age (two-grade span) and
multiage (three-grade span) configurations.

14
Hypothesis 4.
There are no statistically significant differences in the Total Reading scores on the 1997 TerraNova
Standardized Assessment of the cohort of students (during their second grade year) in mixed-age (two-grade span)
and multiage (three-grade span) configurations.
Hypothesis 5.
There is no significant difference in reading achievement scores of the cohort of students, during what is
traditionally known as fifth grade, in mixed-age (two-grade span) and multiage (three-grade span) configurations
after controlling for prior reading achievement.
Hypothesis 6.
There is no significant difference in reading achievement scores based on gender of the cohort of students,
during what is traditionally known as fifth grade, in mixed-age (two-grade span) and multiage (three-grade span)
configurations after controlling for prior reading achievement.
Hypothesis 7.
There is no significant difference in reading achievement scores based on socioeconomic status of the
cohort of students, during what is traditionally known as fifth grade, in mixed-age (two-grade span) and multiage
(three-grade span) configurations after controlling for prior reading achievement.
Hypothesis 8.
There are no statistically significant differences in the Total Math scores on the 2000 TerraNova
Standardized Assessment of the cohort of students (during the fifth grade year) in mixed-age (two-grade span) and
multiage (three-grade span) configurations.
Hypothesis 9.
There are no statistically significant differences in the Total Math scores on the 1999 TerraNova
Standardized Assessment of the cohort of students (during their fourth grade year) in mixed-age (two-grade span)
and multiage (three-grade span) configurations.

15
Hypothesis 10.
There are no statistically significant differences in the Total Math scores on the 1998 TerraNova
Standardized Assessment of the cohort of students (during their third grade year) in mixed-age (two-grade span) and
multiage (three-grade span) configurations.
Hypothesis 11.
There are no statistically significant differences in the Total Math scores on the 1997 TerraNova
Standardized Assessment of the cohort of students (during their second grade year) in mixed-age (two-grade span)
and multiage (three-grade span) configurations.
Hypothesis 12.
There is no significant difference in math achievement scores of the cohort of students, during what is
traditionally known as fifth grade, in mixed-age (two-grade span) and multiage (three-grade span) configurations
after controlling for prior math achievement.
Hypothesis 13.
There is no significant difference in math achievement scores based on gender of the cohort of students,
during what is traditionally known as fifth grade, in mixed-age (two-grade span) and multiage (three-grade span)
configurations.
Hypothesis 14.
There is no significant difference in math achievement scores based on socioeconomic status of the cohort
of students, during what is traditionally known as fifth grade, in mixed-age (two-grade span) and multiage (three-
grade span) configurations.
Hypothesis 15.
There are no statistically significant differences in student attitude toward school on the Attitude Towards
School Inventory (ATSI) (Meier, 1973) of the cohort of students, during what is traditionally known as fifth grade,
in mixed-age (two-grade span) and multiage (three-grade span) configurations.
Significance of the Study
This study was significant in providing useful information to school leaders concerning mixed-age (two-
grade span) and multiage (three-grade span) configurations and their relationship to reading and math achievement

16
and student attitude toward school in a nongraded school. According to Hart (1998), “For a half century and more,
an American system of schools flourished and produced citizens with basic skills with astonishing success
considering the tiny resources allotted: the one room country school. It had no classroom organization, no periods,
and no real grades. Students tutored students; groups formed and dissolved as needs indicated; the teacher had to
view students as individuals and work with them on that basis” (p. 277). The multiage (three-grade span)
configuration encourages teachers to meet the individual needs of the students. Instead of designing a curriculum
and fitting children into it, a developmental curriculum is designed to meet the specific individual needs of the child
(Connell, 1987).
Educators wishing to implement a nongraded program often wonder how the program should be
configured. Successful nongraded programs come in a variety of configurations (Grant, Johnson, & Richardson,
1995). This study, conducted in a K-5 nongraded elementary school, analyzed the difference between mixed-age
(two-grade span) and multiage (three-grade span) configurations and their effect on reading and math achievement
and student attitude toward school.
Limitations
This study was limited to those fifth grade students who attended a single nongraded elementary school
located in East Tennessee during the 1999/2000 school year. The cohort studied was the first group of students to
graduate from this newly designed nongraded school, which opened in August 1994. Furthermore, only the students
who had been in the mixed-age (two-grade span) and multiage (three-grade span) classes for more than one year
were included in the sample.
Definition of Terms
For the purposes of this study the following definitions will apply:
1. Academic Achievement. A measure of progress on a task or set of tasks as determined by results reported
on the TerraNova Standardized Achievement Test.
2. Attitude. Good defined attitude as: “The predisposition or tendency to react specifically towards an object,
situation, or value; usually accompanied by feelings and emotions; attitudes cannot be directly observed but
must be inferred from overt behavior, both verbal and nonverbal” (1973, p. 49).

17
3. Continuous Progress. The goal of continuous progress is to enable students to work at their own pace,
regardless of their age, neither spending extra time on material they have already learned, nor being rushed
on to new material before they are ready (Gaustad, 1994).
4. Individualized Instruction. The practice of making instruction/learning fit the individual; focusing on
individual goal setting and success.
5. Mathematics Achievement. Mathematics achievement is the normal curve equivalency score on the
TerraNova Achievement Test, Total Mathematics.
6. Mixed-age Grouping. The practice of teaching children with an age range greater than one year together
(Gaustad, 1994).
7. Multiage Grouping. The practice of teaching children with an age range greater than two years (Gaustad,
1994).
8. Nongraded Education. Grouping of students in classes without grade level designations and with a more
than one-year age span (Goodlad & Anderson, 1959).
9. Normal Curve Equivalency (NCE). An equal-interval standard score ranging from 1 to 99, with a mean of
50 and a standard deviation of 21.06 (Gall, Borg, & Gall, 1996).
10. Reading Achievement. Reading achievement is the student normal curve equivalency score on the
TerraNova Achievement Test, Total Reading.
Overview of the Study
This study is composed of five chapters. Chapter One is the introductory chapter containing the purpose of
the study, the research questions, the hypotheses, the significance of the study, limitations, and definition of terms.
Chapter Two contains the review of related literature. Chapter Three contains a description of the study, the
population, the sampling method, the instrumentation, the procedures, the methods of data collection, and the
methods of data analysis. Chapter Four contains a description of the data obtained, discusses how the data were
prepared for analysis, and presents the analysis of the data. Chapter Five presents the summary, conclusions,
implications, and recommendations for practice and for further study based on the analysis of the data.

18
CHAPTER 2
REVIEW OF RELATED RESEARCH
As we move into the 21st Century and educators strive to focus on individual students and their needs, the
expansion of nongraded programs will likely occur. Questions regarding configurations of these programs will be
posed. Data will need to be shared with both the educational and public communities. This chapter provides a
review of nongradedness focusing on the history, definition, and program configurations, philosophies that guide
nongradedness, characteristics of nongraded schools, benefits of nongraded programs, student attitude towards
school in nongraded programs, and a summary of previous research findings.
History
Dame schools of the seventeenth century and district schools of the eighteenth century were without grade
classifications. In these nongraded schools children of various ages received individualized and small group
instruction (Goodlad & Anderson, 1959). Until 1835, all schools in the United States were completely ungraded
(Shearer, 1899).
The “Little Red Schoolhouse” served children of various ages and ability levels in the same classroom
environment for many years until the growth of cities and Horace Mann’s proposal for age-graded groupings in the
mid-nineteenth century. In the original one-room school, children of all ages went to school together, learning from
each other and the teacher (Anderson & Pavan, 1993).
In the eighteenth century separate reading and writing schools were developed. Emphasis was on subject
matter and skills. “Norms” were beginning to be introduced. The first normal schools were established in the
United States in 1823 and 1827. They unified educational practices, ordered the content of instruction, and
influenced the spread of the graded structure during the last half of the nineteenth century (Goodlad & Anderson,
1959).
Horace Mann, Secretary of the Massachusetts Board of Education, introduced the graded system of
education in the mid 1800s. While visiting in Prussia he was impressed with the practice of classifying and dividing
students by age. Within a decade, Mann’s ideas were accepted and implemented in what is known as the factory

19
model, graded system of education or traditional schooling. This graded system was intended to bring efficiency to
American schools, very similar to the efficiency that factories provided for producing cloth, shoes, and other items.
The goal was to produce educated citizens (Grant & Johnson, 1995).
In 1848 the Quincy Grammar School in Boston was established. Within the next 15 to 20 years the graded
structure of schooling was the norm. One-room schools were only found in rural areas. This school marked the
emergence of full-fledged graded schools in the United States. Students were sorted into grades, which were
determined by like achievement levels. They passed or failed at the end of each year. Standardization of textbooks
emerged and teacher training for this lock-step curriculum approach prevailed (Goodlad & Anderson, 1959).
According to Otto (1934), the graded system was responsible for the philosophy that specific subject matter and
skills could be developed and taught in a set graded sequence.
According to Anderson and Pavan (1993), for a time, gradedness served a purpose. Since teachers were
not trained, it allowed them to specialize by learning the curriculum of a single grade rather than the entire
curriculum. The economic advantage was that teachers could work with students in larger groups instead of with
just a few at a time. In addition, the systemized approach made it easier to supervise teachers.
In the 1870s the graded school concept was questioned. Critics protested the rigid expectations, which
often shortchanged the needs of the individual student. However, the graded structure survived and remained
solidly in place until 1990. During the last decade of the twentieth century the nation began to reexamine school
practices, which led to educational reform, nongradedness being one type of reform movement (Anderson & Pavan,
1993).
In light of the ever-changing social and economic status of our country, schools are being re-evaluated.
Nongradededness is the focus of renewed interest (Gaustad, 1992a). Studies of human development and learning
provide us with inescapable, compelling facts about individuality, which points us toward a nongraded type of
elementary school structure (Goodlad & Anderson, 1959).

20
Definition and Program Configurations
As referred to by Gaustad (1992a), “Nongraded education is the practice of teaching children of different
ages and ability levels together, without dividing them into groups labeled by ‘grade’ designations” (p. 2). Children
make continuous progress at their own rates of speed remaining with the same teacher for more than one year.
Individuals are different and therefore should not be treated as items on an assembly line. A nongraded
organizational structure allows students to take as much or as little time as they need to complete the curriculum
rather than requiring them to proceed in lock-step with their peers (Gaustad, 1994).
Anderson & Pavan (1993) define nongradedness with the following 11 statements:
1) Individual differences in the pupil population are accepted and respected, and there is ample variability
in instructional approaches to respond to varying needs.
2) Learning, which is the “work” of the child, is intended to be not only challenging but also pleasurable
and rewarding.
3) Students are viewed as a whole; development in cognitive, physical, aesthetic, social, and emotional
spheres is nurtured.
4) The administrative and organizational framework, for example, with respect to pupil grouping
practices, is flexible and provides opportunities for each child to interact with children, and adults, of
varying personalities, backgrounds, abilities, interests, and ages.
5) Students are enabled through flexible arrangements to progress at their own best pace and in
appropriately varied ways. Instruction, learning opportunities, and movement within the curriculum
are individualized to correspond with individual needs, interests, and abilities.
6) Curricular areas are both integrated and separate. Instructional, programmatic, and organizational
patterns are flexible, with outcomes rather than mere coverage of content as the primary focus.
7) The expected standards of performance (in terms of outcomes) in the core areas of the curriculum are
clearly defined, so that the points to be reached by the end of a designated (e.g., a three-or four-year)
period are well known. However, the time taken to reach that end, and the path followed to that end, is
allowed to vary for students with different histories and potentialities.

21
8) Within the curriculum and related assessment practices, specific content learning is generally
subordinate to the understanding of major concepts and methods of inquiry, and the development of
the skills of learning: inquiry, evaluation, interpretation, and application.
9) Student assessment is holistic, to correspond with the holistic view of learning.
10) Evaluation of the learner is continuous, comprehensive, and diagnostic. Except for reference purpose
as necessary to parental and staff understanding, chronological age and grade norms play a much
smaller role in evaluation and reporting activities than does the child’s own growth history and
potential.
11) While there are some core components of the curriculum that are especially valued (as reflected in
performance standards in the major content areas), the system is largely teacher-managed and
controlled. Thus, it empowers teachers to create learning opportunities and to use instructional
strategies at their own discretion, based on the perceived needs of the students they are serving.
Assessment procedures are similarly flexible, individualized, and teacher managed (p. 62-63).
Because individuals are different, in order to maximize each child’s potential various treatments are
needed. The teacher’s focus is on the students learning rather than the teachers teaching. According to Gaustad
(1994), “The central tenet of nongraded education is that individuals are different and should not be subjected to
identical, assembly-line treatment” (p. 6).
Anderson (1993) stated “most advocates of nongradedness believe it is essential for students to belong to a
basic aggregation of children that embraces at least two (preferably three) age groups” (p. 11-12). A natural
learning environment according to Anderson (1993) is a heterogeneous multiage grouping, within which all sorts of
homogeneous and heterogeneous sub groupings can occur. The ideal nongraded grouping should involve 70-120
students and a team of three to six teachers. By combining multiage, team teaching and the philosophy and practices
of nongradedness a truly nongraded environment can be created (Anderson, 1993).

22
Authentic Nongradedness, according to Anderson (1993), meets the following criteria:
1. Replacement of labels associated with gradedness, like first grade and fifth grade, with group titles like
“primary unit” that are more appropriate to the concept of continuous progress;
2. Replacement of competitive-comparative evaluation systems (and the report cards associated with
them) with assessment and reporting mechanisms that respect continuous individual progress and
avoid competitive comparisons;
3. All grouping to include at least two heterogeneous age cohorts;
4. Groups assembled for instructional purposes to be non-permanent, being dissolved and reconstituted as
needed;
5. Organization of the teaching staff into teams, with teachers having maximum opportunities to interact
and collaborate;
6. Development of a flexible interdisciplinary, whole-child-oriented curriculum, with grade-normed
books and tests used only as resources (if used at all);
7. Adoption of official policies consistent with nongradedness in the school and at the school board level,
even where waivers of policy may be required (e.g., reporting enrollments by grades) (p. 12).
Sue Bernheisel (1992), Principal of Andrew J. Mitchell Primary School in Boulder City, Nevada,
established multiage classes because of “the idea that teachers tend to lose track of grade levels and begin to see
class members as unique individuals” (p. 22). The real-life setting encourages children to work together
cooperatively in a safe, comfortable environment. Teachers are challenged to prepare lessons and meaningful
experiences for all students. Parents who shared initial concerns regarding whether the oldest students in the group
were going to be challenged have been relieved of their fears (Bernheisel, 1992).
Lodish (1992), shared the pros and cons of mixed-age (two-grade span) groupings as found in the study of
Katz, Evangelou, and Hartman (1990). The wide range found in the mixed-age group offers students opportunities
to develop relationships with others who compliment, supplement, or match their own needs and styles. Older
children experience leadership opportunities and younger students are encouraged and assisted as needed.
Cooperation is found to be the norm in mixed-age groups in comparison to the traditional class grouping competitive
pressure. Fewer discipline problems are noted as a result of a less competitive environment. Children develop at
23
different rates, academically and socially. Mixed-age groupings do not call attention to underachieving students, as
each child is encouraged to proceed at their own rate. In traditional classrooms where students spend a great deal of
their time working in one large group on similar activities underachieving students are easily recognized, usually
causing discipline problems when unable to perform or compete. Some proponents of mixed-age classes argue that
the interaction of the younger children with the older children stimulates the learner to set high expectations for
themselves which results in them striving to accommodate to the more advanced in the group.
Some of the concerns noted by Lodish (1992) were difficulties developing friendships for the same-age,
same-sex children when the number of children in the mixed-age class is low; a tendency for teachers of mixed-age
groups to provide fewer challenges for the older children in the group; frustration from some younger competitive
students by what is perceived by them to be inferior work; difficulty in scheduling times for individual students to
work with special teachers; and teachers must do more work in planning instruction for the wider range of students
than is found in a traditional classroom.
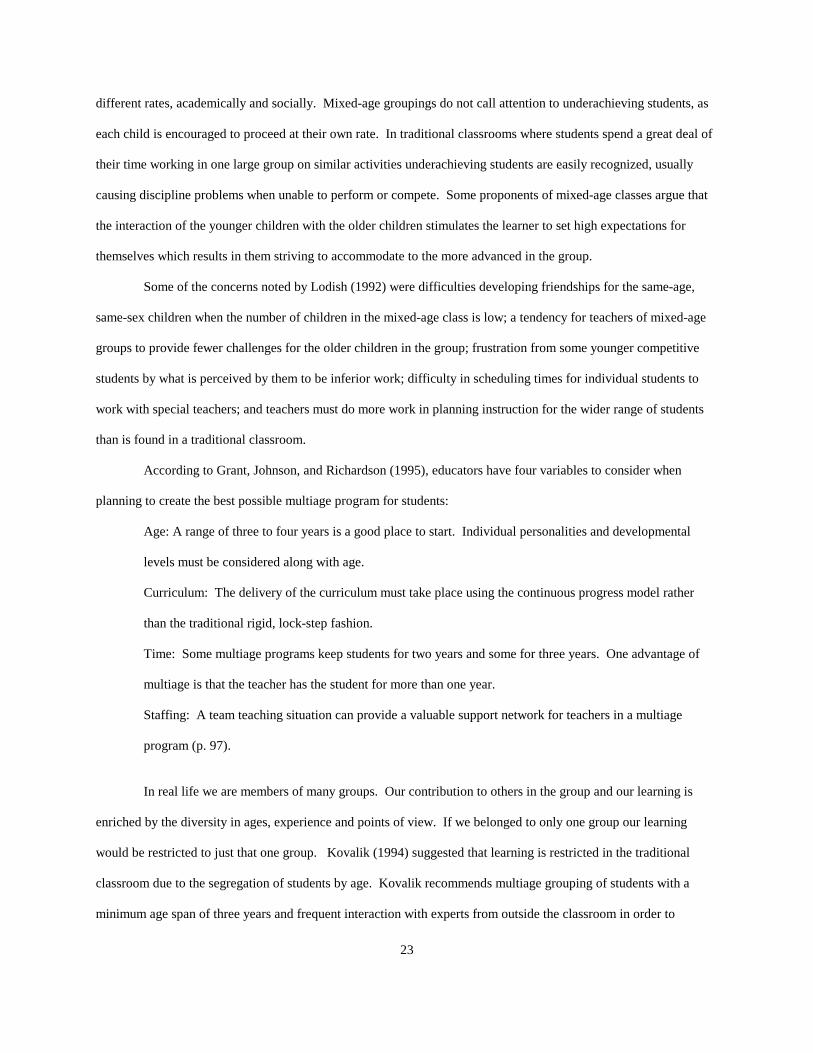
According to Grant, Johnson, and Richardson (1995), educators have four variables to consider when
planning to create the best possible multiage program for students:
Age: A range of three to four years is a good place to start. Individual personalities and developmental
levels must be considered along with age.
Curriculum: The delivery of the curriculum must take place using the continuous progress model rather
than the traditional rigid, lock-step fashion.
Time: Some multiage programs keep students for two years and some for three years. One advantage of
multiage is that the teacher has the student for more than one year.
Staffing: A team teaching situation can provide a valuable support network for teachers in a multiage
program (p. 97).
In real life we are members of many groups. Our contribution to others in the group and our learning is
enriched by the diversity in ages, experience and points of view. If we belonged to only one group our learning
would be restricted to just that one group. Kovalik (1994) suggested that learning is restricted in the traditional
classroom due to the segregation of students by age. Kovalik recommends multiage grouping of students with a
minimum age span of three years and frequent interaction with experts from outside the classroom in order to

24
provide a truly brain-compatible environment for students. Webb (1992) quotes one researcher’s observation:
“Segregating children by sex, race, ethnic, or socioeconomic differences is against the law. Is it right to segregate
by age?” (p. 90).
There are a variety of ways to configure nongraded classes. The Kentucky Department of Education uses
the terms multiyear, indicating groups may contain children with a three to four-year span age difference (K-2) and
dual year containing children with a two-year age span difference (K-1, 2-3) (Gaustad, 1992a). Montessori
programs divide children into multiage groups but overlap one age to the next (3-6, 6-9, 9-12). Cushman (1990),
reported teachers claim the multiage (three-grade span) is more work then just teaching the mixed-age (two-grade
span).
Having a three-year age span promoted change at Lincoln Elementary School in Corvallis, Oregon. It
forced teachers to break out of their graded, lock-step mindsets (Gaustad 1994). Miller (1994), however, found that
most schools preferred mixed-age classes with only a two-year span. With this configuration teachers could still
hang on to a familiar graded, lock-step practice. Mixed-age (two-grade span) classes are usually set up to solve a
problem such as balancing enrollment or class size, and money or space constraints. Multiage (three-grade span)
classes are set up for philosophical reasons creating a setting for continuous progress learning (Grant & Johnson,
1995).
Philosophies That Guide Nongraded Programs
Developmentally appropriate practices are at the heart of multiage classrooms. It allows teachers to focus
on individual student needs. “The true philosophy of nongradedness is the belief that individuals are unique and
need different treatments to reach their maximum growth potential” (Anderson & Pavan, 1993, p. 43).
Bredekamp and Copple (1997) define developmentally appropriate practices as the result from the process
of professionals making decisions about the well being and education of children based on at least three important
kinds of information or knowledge:
1. what is known about child development and learning - knowledge of age-related human
characteristics that permits general predictions within an age range about what activities,
materials, interactions or experiences will be safe, healthy, interesting, achievable, and also
challenging to children;

25
2. what is known about the strengths, interests, and needs of each individual child in the group to be
able to adapt for and be responsive to inevitable individual variation; and
3. knowledge of the social and cultural contexts in which children live to ensure that learning
experiences are meaningful, relevant, and respectful for the participating children and their
families (pp. 8-9).
Jean Piaget, Swiss psychologist is best known for his four stages of cognitive development: sensorimotor –
birth to 2 years; preoperational – 2 years to 7 years; concrete operational – 7 years to 11 years; and formal
operational – 11 years and up. Every normally developing child passes through these stages in the same order;
however, the time varies in the ages at which children attain each stage. Learning and thinking involve the
participation of the child. Children learn by doing, by being actively involved in the construction of knowledge.
Appropriate primary education provides many opportunities for children to think and explore the environment
actively rather than passively listening or learning by rote. Rather than expecting all children to progress at the same
rate, it allows for the individual timing of children’s achievement (Gaustad, 1992a). Age grouping is based upon
physical time, whereas children grow on biological time and operate on psychological time. Physical time is
uniform whereas biological and psychological times are variable. Within the same physical time period two
students of the same chronological age differ in their acquisition of skills. For example, one will discover decoding
while the other struggles with letter discrimination (Elkind, 1987).
Developmentally appropriate practices, as described by the position statement of the National Association
for the Education of Young Children, (NAEYC), closely matches the components of nongraded education and
inappropriate practices mirror that of traditional graded education (Gaustad, 1992b).
The National Association for the Education of Young Children emphasizes that teachers must teach the
“whole child,” supporting intellectual, social, emotional, and moral growth. They strongly recommend curriculum
integration, which actively involves the child both physically and cognitively (Bredekamp, 1997).
Gardner (1983), Harvard University psychologist, suggested that we each have at least seven intelligences.
His theory of multiple intelligences describes the intelligences as sets of problem-solving skills that enable the
learner to solve problems and create or acquire new knowledge. The identified intelligences are: logical
mathematical, linguistic, spatial, bodily-kinesthetic, musical, intrapersonal, and interpersonal. Understanding and
using the intelligences in planning curriculum experiences for children provides choice for students to acquire

26
knowledge in a meaningful way. An ideal curriculum program would focus on providing opportunities geared to all
seven intelligences. Most traditional educational systems have been geared toward the linguistic and logical-
mathematical learner (Gaustad, 1992a).
Information taught in meaningful ways is learned more easily than isolated facts (Shoemaker, 1989).
According to Kovalik (1994), memorizing and parroting back information does not indicate a real understanding.
Elkind (1987) suggests that pressure on students to learn things that their minds cannot comprehend may in fact be
harmful to the brain, causing it to do memorization instead of seeking understanding.
Sylwester (1995) discussed how our brain adapts itself to its environment. He reported that we could think
of the traditional classroom as an artificial environment similar to that of Diamond’s laboratory environment. She
studied the impact of the environment on the development of the brain (Diamond, 1988). Diamond’s results could
“…find their human representation in classrooms where the teacher dominates the curricular, instructional and
evaluative decisions and activities. It isn’t enough for students to be in a stimulating environment – they have to
help create it and directly interact with it” (Sylwester, 1995, p. 131). Our challenge is to transform a traditional
classroom environment into a natural human environment. “The class-and-grade or factory school system is
unrelated to present understandings of brain development and, in practice, ranges from severely to violently brain-
antagonistic” (Hart, 1998, p. 223).
Activities like student projects, cooperative learning and portfolio assessments directly involve students and
thus stimulate learning. Student projects are suggested as a major vehicle for learning (Blythe & Gardner, 1990).
Caine and Caine’s (1991) synthesis of research on the human brain led them to the same instructional
recommendation, themes and projects. This approach provides students the opportunity to see meaning and
patterns, process parts and whole simultaneously, and allow for the uniqueness of each brain.
Practical applications drawn from Diamond’s research suggest that teachers should provide students with
tender loving care. Diamond recommends that each student should be treated as an individual, with every effort to
bring forth his or her best (Sylwester, 1995). Brain research also shows that the learner’s emotional state
dramatically affects learning (Shoemaker, 1989). Learning involves emotions. It has long been recognized that in
practice emotion cannot be separated from cognitive thinking (Hebb, 1949). Emotions drive attention, create
meaning, and have their own memory pathways (LeDoux, 1994).

27
The quality and nature of the relationship between the teacher and his/her students is the key (Kovalik,
1994). Building a culture where students feel respected, cared about, and bonded to classmates, teachers, and the
school makes a “caring community” (Goleman, 1994).
Vygotsky’s social development theory emphasizes that social interaction plays a fundamental role in the
development of cognition (1962). He stated we learn first through person-to-person interactions and then
individually through internalization process that leads to deeper understanding (Vygotsky, 1978). Social interaction
is a key component for cognitive development. The range of skill that can be developed with adult guidance or peer
collaboration exceeds what can be done alone (Vygotsky, 1978). Vinson (2001) stated, “Some of the best teachers
in our classrooms are other children” (p. 89). A student who has accomplished a difficult task can in turn assist a
peer with the same task. It is gratifying for them to demonstrate a newly gained skill as well as reflect on how far
they have progressed, thus motivating them to continue to work to achieve what seems at the onset to be an
unachievable task (Vinson).
Bandura (1977) emphasized the importance of observing and modeling the behaviors, attitudes, and
emotional reactions of others in his social learning theory. He stated: “Learning would be exceedingly laborious,
not to mention hazardous, if people had to rely solely on the effects of their own actions to inform them what to do.
Fortunately, most human behavior is learned observationally through modeling: from observing others one forms an
idea of how new behaviors are performed, and on later occasions this coded information serves as a guide for
action” (p. 22).
Social theorist, Etzioni (1993) stated that emotional intelligence represents character and moral conduct
requires character. Goleman (1994) reported that emotional literacy programs improve children’s academic
achievement scores and school performance. Moral education is most potent when lessons are taught to children in
the course of real events, not just as abstract lessons (Rockefeller, 1991).
A primary goal of education must be to teach students how to learn, how to think critically, how to
communicate effectively and how to solve new problems as they arise (Gaustad, 1992a). John Dewey (1938) argued
that education be viewed as a process of living and not a preparation for future living. Goodlad (1997) reminded us
that Dewey suggested “democracy” as the word to best describe education.

28
Characteristics of Nongraded Schools
Integrated thematic instruction is the vehicle for bringing together brain research, teaching strategies, and
curriculum development (Kovalik, 1994). Shoemaker (1989) synthesizes the term integrated curriculum to “cut
across subject-matter lines, bringing together various aspects of the curriculum into meaningful association…it
reflects the real world, which is interactive…it involves the learner’s body, thoughts, feelings, senses, and
intuition…it unifies knowledge and provides a greater understanding than that which could be obtained by
examining the parts separately.” Integrated thematic instruction is the vehicle for making learning important and
exciting for students and teachers, according to McGeehan (1999).
According to Lolli (1998), “Curriculum in the multiage classroom is based upon a constructivist view of
learning” (p. 12). Children create meaning from the experiences and modeling that occurs around them. Phillips
(1995) identified three distinct roles in constructivism: the active learner, the social learner, and the creative learner.
Information is more easily learned and remembered when it is taught in a meaningful context, when it is
relevant to the learner and when the learner takes an active role in learning (Gaustad, 1992a). Real life is not
divided into separate subject areas. Meaningful content, according to Kovalik (1994),
1. is from real life, the natural world around us
2. depends heavily upon prior experience
3. is significant to membership in a learning club in which the learner holds full membership
4. is age-appropriate and thus, understandable
5. is rich enough to allow for pattern-seeking a means of identifying/creating meaning
6. is used within the life of the learner
7. does not involve an external rewards system. The brain is a self-congratulator. (p. 36)
Thematic units extend learning across the curriculum. Students can explore a theme, examining it from
many aspects. This is a natural way of learning for the brain (Hart, 1998).
Thematic units provide for integration of both content and skills usage in more realistic situations than is
possible with the traditional subject matter curriculum. Students have the opportunity to learn and use the
skills of learning to learn. They have more time for trial and error, as they perfect their performances, than
in the drill and practice mode of more traditional lessons. (Anderson & Pavan, 1993, p. 115)

29
Every brain is different; therefore, every learner has preferred ways of learning. When students have
choices to go about learning it allows the learner to become responsible and engaged in the process of learning
(Kovalik, 1994). Using Gardner’s (1993) Multiple Intelligence theory leaves us no excuse to insist that all students
learn the same thing in the same way.
According to Gaustad (1992a), “Students in a nongraded classroom are grouped for instruction in many
ways, some of which are also used in graded classrooms” (p. 24). The difference in nongraded programs is the
flexibility of the groupings based on the needs of the individual student. Groups may meet for a variety of purposes
with and without the teacher. Groupings may be formed based on interests, academic needs, cooperative learning,
learning styles, etc. Math and reading in a nongraded school often are taught in homogeneous groups with students
of similar developmental level, regardless of age. As children advance, groups are re-formed to accommodate
accordingly (Gaustad, 1992a).
Subjects like science and social studies lend themselves to heterogeneous groupings. These groupings
often form into cooperative groups, learning teams or clubs. Students working in cooperative groups learn about the
topic, practice skills at their current level of ability, and practice social skills as they work cooperatively with their
multiage peers (Gaustad, 1992a).
Problem-solving groupings can also be found in nongraded classrooms. Students engage in a
brainstorming session. The teacher fosters cross-age interaction as she directs questions and comments back and
forth between children (Gaustad, 1992a).
Peer tutoring or partnering of students has been shown to be valuable in the learning environment.
Children learn so much from one another (Nachbar, 1989). Younger children look up to older children for
leadership. Older students can help younger students; younger students can help older students. Students can use
skills they have learned in a situation that can boost self-esteem (Grant & Johnson, 1995).
According to Anderson (1993) multiage heterogeneous grouping is the most natural learning environment
for children. Within this multiage grouping all sorts of homogeneous and heterogeneous sub groupings can be
created as needed.
Continuous Progress is an integral part of the nongraded concept. Graded education resembles a stepladder
in contrast to the nongraded representation of a ramp. Graded instruction is generally geared toward the average
learner. The pace is comfortable for them. Faster learners are typically held back and slow learners struggle. At the

30
close of a year the student either moves up a step to the next grade or remains on the same step for another year
(Gaustad, 1994).
The goal of a continuous progress curriculum is to enable students to learn at their own pace. There is
respect for various learning styles and paces. There are two main ways to implement a continuous progress model.
Students make a linear progression through a carefully organized sequence of curriculum in each subject area. They
work independently and with groups of other students functioning at the same level. At the start of each new school
year they pick up where they left off.
The second approach seeks to provide unsequenced, open-ended situations. Projects, cooperative group
work and individual exploration are components (Gaustad, 1994). Pavan stated (1992) that with this more holistic
approach students undergo “an expansion of knowledge, skills, and understanding” (p. 22).
According to Grant, Johnson and Richardson (1995) the continuous progress curriculum takes place in a
supportive learning environment where students feel success, develop positive self-concepts and are helpful and
caring towards others. It has the following characteristics:
1) It is integrated. Separate subjects are replaced by an integrated curriculum, which engages children in
meaningful activities that explore concepts and topics relevant and meaningful to children’s lives.
2) Whole language, a developmental approach to teaching reading and writing, is the basis of the
language arts program.
3) Continuous progress accepts each child at his or her place on developmental learning continuums.
These continuums contain benchmarks, which clearly define major stages of growth. They allow
teachers to assess, evaluate, and plan curriculum.
4) It reflects an understanding that children construct knowledge and learn through active involvement
and play.
5) It is embedded in a learning environment where children cooperate and everyone is a teacher/learner.
6) Open-ended activities provide for a wide range of abilities, allowing each child to work at his or her
developmental ability level.
7) Ongoing assessment and evaluation of each child’s learning replaces practices such as tracking,
retention, and promotion.

31
8) It emphasizes the development of the whole child in the intellectual, social, emotional, artistic,
aesthetic, and physical realms.
9) It provides for both teacher-directed and child-initiated activities (p. 6).
Gifted children have the opportunity to move ahead, expand on a concept or skill or engage in a project. It
is far more beneficial for gifted children to remain with their multiage peer group then skip to the next grade or
multiage groups (Grant & Johnson, 1995).
For the “late bloomers”, children who get off to a slow start, nongraded continuous progress allows the
child to remain in the group for an additional year if necessary. This is not considered retention. It is extra teaching
time and learning time (Grant & Johnson, 1995). It is often referred to as the gift of time.
The multiage continuous progress model acknowledges individual differences in ability, learning styles and
rate of development as it builds on that diversity. It is an ideal model according to Grant and Johnson (1995).
Authentic Assessment is unlike practices used in traditional grade programs. It includes a variety of
assessment practices including classroom observation, collections of student work, and conferencing with students
(Gaustad, 1994). Anderson and Pavan (1993) stated, “Assessment should be conducted in order to better understand
the needs of the learner and to determine the direction of instruction” (p. 164). In addition to observation, collection
of work and conferencing, Anderson and Pavan (1993) also include reviewing skill achievement records as an
assessment practice.
Evaluative systems, found in graded programs, that use letters, numbers, bluebirds, and so on to indicate
achievement levels fail to report accurate and useful information. They are subjective and tend to account only for
the more insignificant aspects of learning. It is impossible to consider values, feelings, creativity, intuition,
judgment, and high levels of cognition (Curwin, 1978).
NAEYC agrees, thus discouraging the use of letter or numerical grades for primary children. They
recommend that teachers assess each child’s learning through written records of observation and evaluation of work
samples collected on a regular basis. Students should be involved in self-assessment, reflection, and revision of
their own work. Parents should be participatory members in the assessment of their child’s learning progress
(Bredekamp, 1997).

32
Portfolios, a collection of a student’s work, are a form of authentic assessment. “A portfolio is more than a
‘folder’ of student work; it is a deliberate, specific collection of accomplishments” (Hamm & Adams, 1991, p. 20).
They can include the work of one student or a group of students. They can cover one subject or all subjects. They
often include anecdotal notes, narrative report cards, surveys, test results, videos, completed assignment and project
rubrics, and other student accomplishments.
Kentucky’s Department of Education describes authentic assessment as a way to ensure that children know
and can demonstrate knowledge and skills. It is continuous and focuses on demonstrations of learning that can be
analyzed. It is a way to determine where children are on a continuum of beginning, developing, competent, or
expanded stages of their learning (1996).
Gaustad (1992a) stated, “Team teaching, which is frequently associated with nongraded education, has
many advantages” (p. 22). The children benefit from the diversity of teaching styles and the specific strengths of
each teacher on the team. There is more flexibility in scheduling and in grouping. There is a larger pool of children
to create subgroups for specific purposes. Groups are more successful in creative problem solving than individuals
working alone (Cohen, 1994).
Through collaboration teachers combine their skills and perspectives. With assessment, pooling data
allows the team to get a more comprehensive picture of the child’s accomplishments, understanding, and needs.
Many teachers are revitalized by the continual professional interaction.
Successful teaming requires time for team building to take place. Each member of the team needs to be
comfortable with the others’ styles of teaching, and trust must be developed and maintained. Teachers must be
willing to share. Teaming requires sharing of materials, skills, territory, equipment, and recognition for successes
and student achievement (Gaustad, 1994).
Although teaming is not a requirement for nongraded programs, the two are a natural fit. A personal
benefit is having a supportive partner or partners with whom you can share frustrations, and successes (Grant &
Johnson, 1995).

33
Benefits of Nongraded Schools
Parents, teachers, and students benefit from nongraded programs (Kasten, 1998). Students reported that
returning to school each year was like coming home. They benefit from the stable environment and from knowing
their teacher. Some researchers believe that children learn better when they work in an environment that is built on
long-term relationships (Kasten, 1998).
Parents reported that anxiety is lessened, as students do not have to worry about who their teacher and
classmates are from year to year. Teachers reported a smoother beginning to each year, as many of the students
already know the routines and expectations.
Little or no assessment is needed for the returning students. They immediately pick up where they left off.
Discipline issues are minimal. The relationship that already exists between the student and the teacher pays off. An
11 year old described this best in an interview after four years in a multiage class and one year in a single age, fourth
grade class. “We were more like a family. We knew each other very well. My new class is okay. I like it a little,
but it is not the same.” (Kasten, 1998, p. 5.)
According to Allison and Ong (1996) teachers and principals observed that multiage programs produced
the following outcomes for children:
1) low retention rates
2) positive social skills
3) less discipline problems
4) less truancy
5) better academic achievement
6) less negative attitudes toward school (p. 19).
The instructional approach, which involves meaningful, engaged learning encourages children to take
personal responsibility for learning. Students are encouraged to apply skills and strategies and to help each other
learn. Children keep track of their progress, make choices in learning activities and reflect on their growth (Nye,
1993). “If learners are to become independent, teachers must assume responsibility for teaching the behavior of
‘learning independently’” (Hunter, 1992, p. 57). This results in successful learning experiences for students.
Grant and Johnson (1995) list some advantages of multiage practices:

34
1. School fits child – knowing the child over time increases the teacher’s understanding of the child’s
needs; research shows better mental health and greater self-esteem in multiage
2. Efficient, effective learning environment – attendance is better and school is more fun; multiyear
placement encourages trust, bonding, and a sense of belonging; research on academic achievement
tends to favor multiage; at the start of the year the teacher knows majority of class; less repetitive
teaching; younger children have preview of what they will eventually be able to do; opportunity for
“academic eavesdropping” and other ways to move ahead at own rate
3. Process approach has long-term benefits – opportunity for all children to be both the younger and older
members of a peer group; learning is experienced as something personal, laying ground work for life-
long learning; skills and facts are presented in a context of strategies and concepts that can be tools for
further learning
4. Encourages friendships and learning – experience of mixed-age group which many children no longer
have at home or in their neighborhoods; opportunities for peer tutoring
5. Promotes cooperation and collaboration – classroom does not focus on competition between same-age
children; child can work with children of similar skill level but of different chronological ages; child
can reinforce a newly learned skill by teaching it to someone else
6. Creates a caring community – brings out older children’s willingness to help younger ones; older
children accept responsibility of being role models
7. Accommodates diversity and inclusiveness – heterogeneous class with flexible grouping and
regrouping; dynamic interaction among children of different developmental levels, interests, skills,
learning styles (p. 24).
The affective gains that students show are increased self-esteem, more cooperative behavior, better
attitudes toward school in general, increased caring behavior, enriched personal relationships, increased personal
responsibility, and a decline in discipline problems (Anderson & Pavan, 1993; Grant, 1993; Gutierrez & Slavin,
1992; Katz, Evangelou & Hartmen, 1990; Lodish, 1992; Mackey, Johnson, & Wood, 1995; Miller, 1993; Pratt,
1993; Stone, 1995; Uphoff & Evans, 1993; Villa & Thousand, 1993). The affective gains are due to the
minimization of competition and the celebration of individual differences and success as children progress at their
own pace (Anderson & Pavan, 1993; Katz, 1995; Stone, 1995).

35
Student Attitude Towards School In Nongraded Programs
Public schools need to be more attractive to students, “a place where they want to be rather than have to be”
(Hoy, 1972, p. 49). Educators have been increasingly aware that establishing positive student reactions to school
life is an important outcome (Jackson, 1968).
Thurstone and Chave (1929) defined attitude as “ … the sum-total of a man’s inclinations and feelings,
prejudice or bias, preconceived notions, ideas, fears, threats, and convictions about any specific topic” (p. 1).
Sorensen (1964) stated that “An attitude is a particular feeling about something…. a tendency to behave in a certain
way in situations which involve that something, whether person, idea, or object. It is partially rational and partially
emotional and is acquired, not inherent, in an individual” (p. 349).
Way (1981) found that students in multiage classrooms had significantly higher mean scores on the
Happiness and Satisfaction factor of the Piers-Harris Children’s Self-Concept Scale (Piers, 1977). Learning
occurred in a happier environment. Milburn (1981) found that students of all ages in the multiage experimental
school had a more positive attitude toward school and a higher self-concept than their counterparts in the traditional
grade-level groups. Veenman (1995) reported the outcomes of 11 studies concerning multiage grouping. With
regard to the noncognitive outcomes, the number of significant positive findings exceeded the number of studies in
which no significant differences were found. Students tended to score higher on attitudes towards school in
multiage classrooms than in single-age classrooms. According to Pratt and Treacy (1986) and Ford (1977) the
multiage classroom has the greatest impact on the affective domain of student performance. Multiage students have
more positive attitudes toward school. Four out of five studies favored the multiage students (Junell, 1970;
Milburn, 1981; Pratt & Treacy, 1986; Schrankler, 1976; Schroeder & Nott, 1974).
The longer a student is in a nongraded school the more favorable is school attitude (Anderson & Pavan,
1993). Fifty-two percent of the studies indicated that nongraded schools are better in relation to school attitudes, 43
% similar, and only 5 % worse than graded schools (Anderson & Pavan, 1993).
Miller (1989) concluded that multiage classes were superior in terms of student attitudes towards school
and self. Sorensen (1966) suggested, “A student’s attitude toward learning is probably the most important outcome
of education… The subject of attitudes is one of the most complex in the fields of education and psychology…

36
They are caused and developed from what a person does and from what has been done to him. Attitudes are learned,
and success and failure…probably influence the formation of attitudes. (p. 1)
Summary of Previous Research Findings
Pavan (1973) reported the results of a survey of all research studies published between 1968 and 1971
comparing nongraded and graded elementary schools. Sixteen studies were included. The survey favored
nongradedness resulting in very positive effects on academic achievement and mental health for students.
In 1977, Pavan summarized the results of 37 research projects on nongradedness published between 1968
and 1976. This comprehensive review included all studies that compared nongraded and graded students using a
standardized measure. Fifty-one comparisons were made between the experimental groups (nongraded) and control
groups (graded) using academic achievement tests. Twenty-nine favored nongradedness, 20 indicated that both
groups performed similarly, and two found that the nongraded students did not perform as well. In regards to
academic achievement, students in nongraded groups performed as well and possibly better than graded groups on
tests designed for the graded schools (Pavan, 1977).
Twenty-six of the 37 reports contained a mental health component. All of them favored the nongraded
group or reported no significant differences between the groups. A total of 57 comparisons of experimental and
control groups were reported. Many studies used more than one instrument. Twenty-seven comparisons favored
nongradedness, 25 found that both groups performed the same, and five found that nongraded students were not as
adequate. Positive self-concepts and good attitudes toward school were more likely to be found in nongraded
schools than graded schools (Pavan, 1977).
Longitudinal studies reported positive results. The longer a student is in a nongraded program the more
likely good things will happen. Results indicate more favorable school attitude, less chance of retention, and better
academic achievement. (Carter, 1974; Eells, 1970; Killough, 1971; Morris, Proger, and Morrell, 1971; Pavan, 1977,
1992; Perrin, 1969; Ramayya, 1972; Walker, 1973;). Seven longitudinal studies compared students who spent their
entire elementary years in a nongraded or traditional program. Nongraded students outperformed traditional
students on academic achievement measures. Students were more positive or the same as the graded group on the
mental health measures (Pavan, 1992).

37
Junell, 1970, found that underachievers with six years of multiage elementary school education had better
self-concepts and attitudes toward school than underachievers with a graded school experience. Boys also scored
better in terms of achievement and attitudes toward school and self in nongraded schools, compared with boys in
graded schools (Junell, 1970; Morris, Proger & Morrell, 1971; Wilt, 1971). Guarino (1982) found that students in
nongraded programs had higher academic achievement, lower anxiety, and higher self-concepts than those in graded
schools.
According to Pavan (1977), “There is now definitive research evidence to confirm the theories underlying
nongradedness. Research studies published between 1968 and 1975 most frequently favored nongradedness on
standardized measures of academic achievement and mental health” (p. 104).
The Northwest Regional Educational Laboratory’s research (1993) identified research findings in support
of nongraded or multiage grouping to be:
1) Nongraded grouping produces achievement outcomes, which are at least equal and sometimes superior
to those, produced by traditional graded structures.
2) Compared to students educated in traditional graded arrangements, those in nongraded settings have
more positive attitudes toward school, classmates, and teachers, as well as higher self-concepts as
learners and higher general self-esteem.
3) Notable behavioral outcomes of nongraded grouping include greater social and leadership skill
development, better school attendance, and markedly lower levels of aggression and other antisocial
acts.
4) Nongraded grouping decreases the incidence of retention and improves relationships between parents
and school personnel.
5) Nongraded settings are more congruent than single-grade grouping with the kinds of curricular content
and learning activities that are developmentally appropriate for young children.
A common thread in all of the studies conducted, regarding the effectiveness of the nongraded multiage
program, is the desire to determine what practice, graded or nongraded, will produce the most benefit to students.
Additional research is necessary to assist educational leaders in determining program configuration, mixed-age
(two-grade span) or multiage (three-grade span), since previous research favors a nongraded program.

38
This chapter has provided a review of nongradedness focusing on the history, definitions and program
configurations, philosophies that guide nongradedness, characteristics of nongraded schools, benefits of nongraded
programs, student attitude towards school in nongraded programs and a summary of previous research findings.
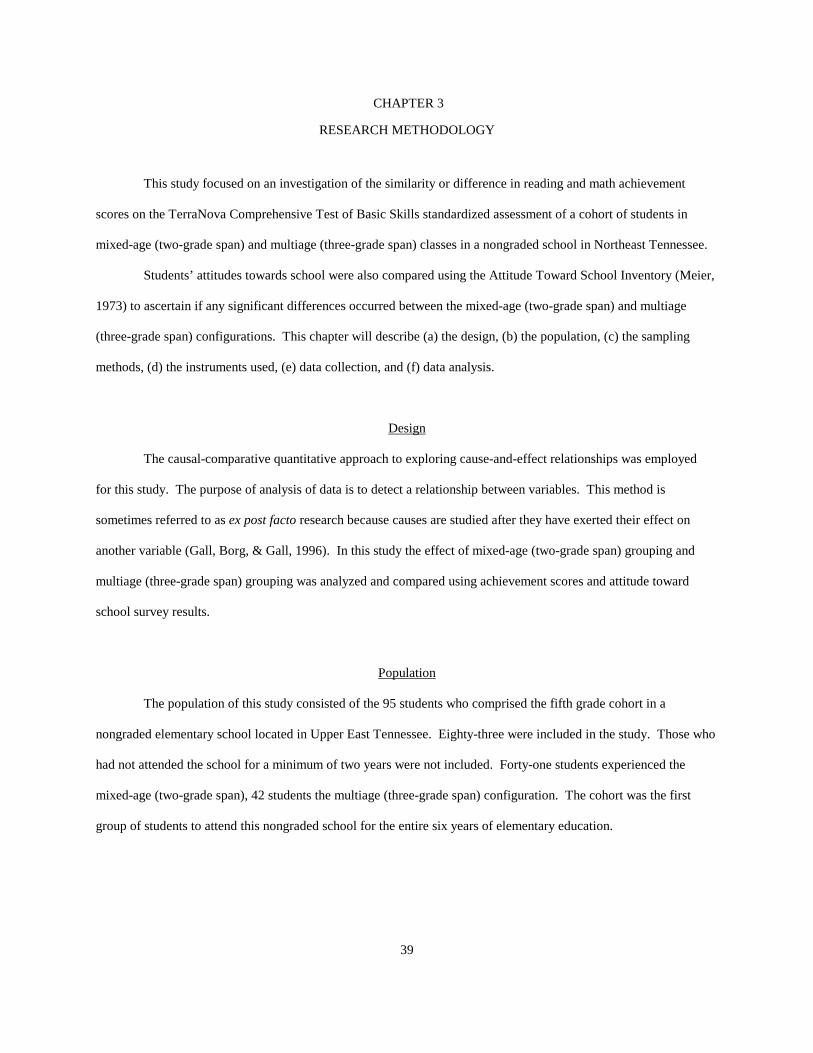
39
CHAPTER 3
RESEARCH METHODOLOGY
This study focused on an investigation of the similarity or difference in reading and math achievement
scores on the TerraNova Comprehensive Test of Basic Skills standardized assessment of a cohort of students in
mixed-age (two-grade span) and multiage (three-grade span) classes in a nongraded school in Northeast Tennessee.
Students’ attitudes towards school were also compared using the Attitude Toward School Inventory (Meier,
1973) to ascertain if any significant differences occurred between the mixed-age (two-grade span) and multiage
(three-grade span) configurations. This chapter will describe (a) the design, (b) the population, (c) the sampling
methods, (d) the instruments used, (e) data collection, and (f) data analysis.
Design
The causal-comparative quantitative approach to exploring cause-and-effect relationships was employed
for this study. The purpose of analysis of data is to detect a relationship between variables. This method is
sometimes referred to as ex post facto research because causes are studied after they have exerted their effect on
another variable (Gall, Borg, & Gall, 1996). In this study the effect of mixed-age (two-grade span) grouping and
multiage (three-grade span) grouping was analyzed and compared using achievement scores and attitude toward
school survey results.
Population
The population of this study consisted of the 95 students who comprised the fifth grade cohort in a
nongraded elementary school located in Upper East Tennessee. Eighty-three were included in the study. Those who
had not attended the school for a minimum of two years were not included. Forty-one students experienced the
mixed-age (two-grade span), 42 students the multiage (three-grade span) configuration. The cohort was the first
group of students to attend this nongraded school for the entire six years of elementary education.

40
Sampling Method
Convenience sampling was selected as the method to be used in this study. According to Gall et al. (1996),
a convenience sample suits the purpose of the study and is available and easy to access. Ninety-five students make
up the fifth grade population at the nongraded elementary school selected, 83 were included in the sample. The
students included in the sample attended the school for a minimum of two years. Forty-four of the students were
male and 39 female. Years of attendance at the nongraded school ranged from two to six. The school’s
organization is unique. No other school in the region exists where the achievement test scores and attitude survey
responses could be obtained without encountering a large number of additional variables that could not possibly
have been controlled. Using the population of the single school where so many common experiences were shared
and where the socio-economic backgrounds of the students are similar in both groups, controls to the maximum
degree possible the influence of other factors that may have impacted scores on one or both instruments.
Instrumentation
Academic achievement between the two groups was compared through the use of the TerraNova
Comprehensive Test of Basic Skills (CTB/McGraw Hill, 1996). This test is designed to measure achievement in the
basic skills taught in school. This state mandated achievement test is administered to all students in grades two
through 12 each spring in the selected nongraded school. The subject areas chosen for comparison were total
reading and total math. A customized version, for the State of Tennessee, of the Comprehensive Test of Basic Skills
was given in 1997, TerraNova version A in 1998, TerraNova version B in 1999 and a customized version of the
TerraNova in 2000.
Investigations of the CTBS have revealed them to be both reliable and valid. Testing for standardization
was conducted in the spring and fall of 1996. The public school sample was stratified by geographic region,
community type, district size, and demographic index based on community characteristics related to district
achievements. Standardization and norming procedures, as well as research studies addressing reliability and
validity issues, are reported in the Test Coordinator’s Handbook (CTB/McGraw-Hill, 1997).
The inventory used in the study to assess attitude toward school was the Attitude Toward School Inventory
(ATSI). It was designed by Meier and McDaniel (1973) to measure attitude toward school for children below the
sixth grade level. The subscales assess attitude toward schoolwork, teachers and school in general. Each subscale

41
contains fifteen questions, which are answered using a five point Likert scale. The Attitude Toward School
Inventory was found to be a reliable and valid tool. Over 1,000 students in fourth, fifth, and sixth grade were
involved in its development. Five hundred twenty-four students participated in five pilot studies. These studies
included subjects from urban and rural school districts in Louisiana and Indiana (Meier, 1973). Analysis of
correlations, using the multitrait-multimethod matrix, was used to estimate criterion related validity of the subscales.
The developer used standards, set by Campbell and Fiske (1959), to determine criterion related validity, which were
met in most cases. Item subscale and item total correlations were used to calculate construct validity. Of the 45
items all but two had item subscale and item total correlations of .43 or higher. Reliability was determined using the
test-retest method after a period of seven days. Student scores were .79, .81, and .83 on the subscales and .85 for
total score. Alpha reliability coefficients were .83, .88, and .89 on the subscales and .94 for total score (Meier,
1973).
Permission to use the inventory was found not to be necessary through a phone conversation with co-author
and retired professor, Dr. Ernest McDaniel, Purdue Educational Research Center, Purdue University, West
Lafayette, Indiana.
Data Collection
Classroom teachers administered the CTBS to the cohort of students the week before spring break of the
1997 – 2000 school years. The test forms were sent to Nashville. They were scanned in Nashville and exported to
CTB/McGraw Hill for scoring.
The interim Director of Schools, Dr. Vaughn Chambers, granted permission to begin this study of the
nongraded school. The school system was in the process of hiring a new Director. Dr. Nancy Vance became
Superintendent in January of 2001. Written permission was obtained at that time to obtain total math and total
reading scores and survey answer sheets necessary for data analysis (Appendix).
As part of ongoing evaluation at the selected nongraded elementary school the Attitude Toward School
Inventory was administered to the cohort by school personnel the third week of May 2000 (traditionally known as
the fifth grade year). All items were read to students who responded directly on answer sheets. The instrument
measures attitude toward schoolwork, teachers, and school in general

42
. Data Analysis
Data used in the statistical analysis for this study came from the TerraNova CTBS and Attitude Toward
School Inventory. The Statistical Program for the Social Sciences (SPSS) was used to analyze data. Analysis
included a one-way analysis of variance (ANOVA) to determine whether the mean scores of total math and total
reading achievement were different in mixed-age (two-grade span) and multiage (three-grade span) configurations.
Analysis of covariance (ANCOVA) was used to control for prior experiences. Gender and socioeconomic status
were also analyzed using ANCOVA.
Four t-tests were performed to test mean score differences on overall student attitude toward school, school
in general, school work, and teacher between the mixed-age and multiage configurations. Alpha level, (P<. 05), was
used to determine if statistical differences occurred between total reading and math achievement and attitude of
students in mixed-age (two-grade span) and multiage (three-grade span) classes.
Summary
Chapter Three presented the methodology and procedures used in this study. The population and sampling
method was described. The causal-comparative research method was chosen and explained. TerraNova CTBS and
Attitude Toward School Inventory Instruments, their validity and reliability, were presented. Methods of data
collection and data analysis were stated. Results of the analysis of data research are presented in Chapter Four.

43
CHAPTER 4
RESULTS
The research questions and hypotheses presented in Chapter One are addressed in this chapter, which
includes the findings from the study. The purpose of this study was to compare the effects of program configuration
on reading and math academic achievement and attitude towards school of a fifth grade cohort of students in a
nongraded elementary school located in East Tennessee. Mixed-age (two-grade span) and multiage (three-grade
span) were compared. Further analyses were conducted to determine if gender and socioeconomic status had any
effect on achievement.
Four research questions guided the study and 15 null hypotheses were tested. The first research question
provides descriptive data for the selected cohort of students.
Research Question #1
What is the demographic profile of the students in the cohort? Eighty-three students comprised the 5th
grade cohort studied in this nongraded primary school. The cohort was the first group to graduate from this newly
designed six-year old nongraded school. Demographic information of the cohort included configuration,
socioeconomic status and gender for the 2nd through 5th grade academic years, 1997-2000. Characteristics of the
sample are presented in Tables 1-5.
Table 1
Demographic Profile of Cohort During Year 2000 (Traditionally known as 5th grade)
Student Cohort 2000 Frequency Percent (5th Grade) _____________________________________________________________________________________________ Configuration
Multiage 42 50.6
Mixed-age 41 49.4
Total 83 100.0

44
Table 1 (continued)
Student Cohort 2000 Frequency Percent (5th Grade)
_____________________________________________________________________________________________ Gender
Male 44 53.0
Female 39 47.0
Total 83 100.0
Socioeconomic Status1
High 73 88.0
Low 10 12.0
Total 83 100.0
1 Low socioeconomic students qualify for free or reduced lunch.
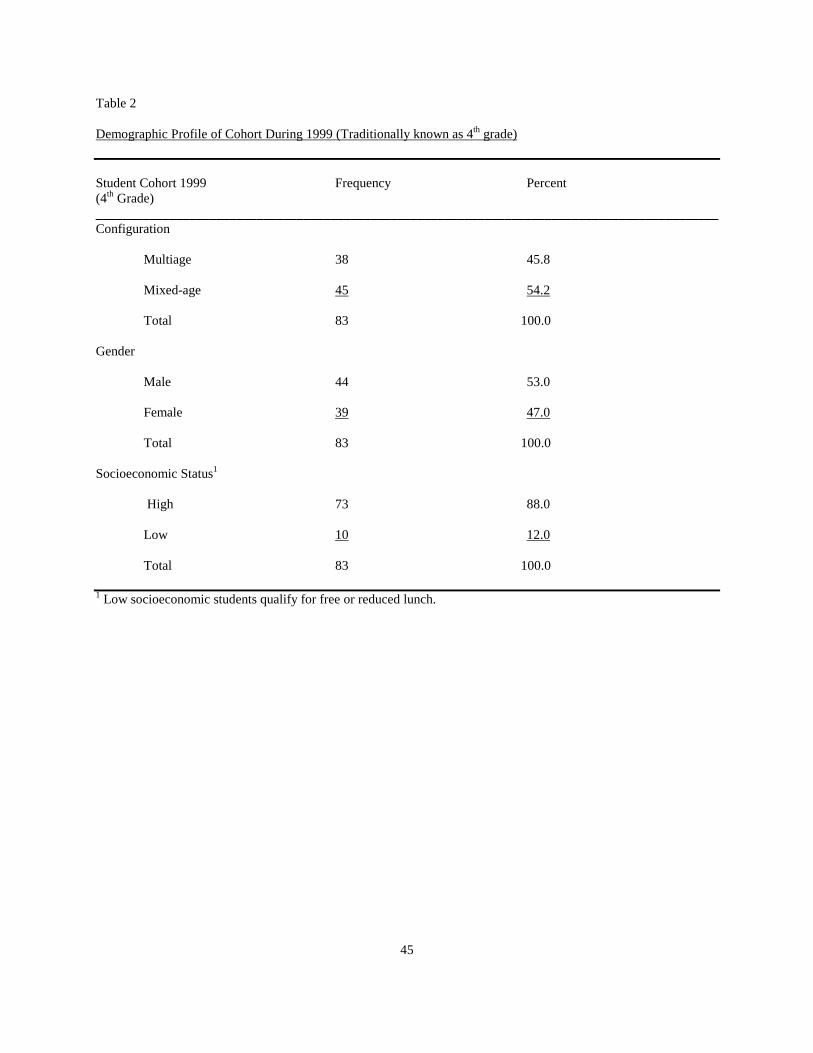
45
Table 2
Demographic Profile of Cohort During 1999 (Traditionally known as 4th grade)
Student Cohort 1999 Frequency Percent (4th Grade) _____________________________________________________________________________________________ Configuration
Multiage 38 45.8
Mixed-age 45 54.2
Total 83 100.0
Gender
Male 44 53.0
Female 39 47.0
Total 83 100.0
Socioeconomic Status1
High 73 88.0
Low 10 12.0
Total 83 100.0
1 Low socioeconomic students qualify for free or reduced lunch.

46
Table 3
Demographic Profile of Cohort During 1998 (Traditionally known as 3rd grade)
Student Cohort 1998 Frequency Percent (3rd Grade) _____________________________________________________________________________________________ Configuration
Multiage 24 28.9
Mixed-age 48 57.8
Missing2 11 13.3
Total 83 100.0
Gender
Male 36 43.4
Female 36 43.4
Missing2 11 13.3
Total 83 100.0
Socioeconomic Status1
High 63 75.9
Low 09 10.8
Missing2 11 13.3
Total 83 100.0
1 Low socioeconomic students qualify for free or reduced lunch. 2The 11 students missing were not enrolled in the school during 1998.

47
Table 4
Demographic Profile of Cohort During 1997 (Traditionally known as 2nd grade)
Student Cohort 1997 Frequency Percent (2nd Grade) _____________________________________________________________________________________________ Configuration
Multiage 21 25.3
Mixed-age 45 54.2
Missing2 17 20.5
Total 83 100.0
Gender
Male 33 39.8
Female 33 39.8
Missing2 17 20.5
Total 83 100.0
Socioeconomic Status1
High 59 71.1
Low 07 08.4
Missing2 17 20.5
Total 83 100.0
1 Low socioeconomic students qualify for free or reduced lunch. 2The 17 students missing were not enrolled in the school during 1997.

48
Table 5
Multiage (three-grade span) and Mixed-age (two-grade span) Configuration
1997-2000
Yearly Configuration Frequency Percent ______________________________________________________________________ 2000
Multiage 42 50.6
Mixed-age 41 49.4
Total 83 100.0
1999
Multiage 38 45.8
Mixed-age 45 54.2
Total 83 100.0
1998
Multiage 24 28.9
Mixed-age 48 57.8
Missing1 11 13.3
Total 83 100.0
1997
Multiage 21 25.3
Mixed-age 45 54.2
Missing2 17 20.5
Total 83 100.0
1The 11 students missing were not enrolled in the school during 1998. 2The 17 students missing were not enrolled in the school during 1997.

49
To further demonstrate the results refer to Figure 1.
Figure 1.
Table 6 presents multiage (three-grade span) and mixed-age (two-grade span) normal curve equivalency
reading and math mean and standard deviation scores of the selected cohort on the TerraNova Standardized
Assessment from 1997-2000. To further demonstrate the results refer to Figure 2 and Figure 3.
Frequency of Students in Configurations
4548
45
51
2124
3842
0
10
20
30
40
50
60
1997 1998 1999 2000Year
# St
uden
ts
Mixed AgeMultiage
Mixed-age (two-grade span) and Multiage (three-grade span)

50
Table 6
Cohort Normal Curve Equivalency Reading and Math Mean Scores for Multiage and Mixed-age Configurations
1997-2000
Configuration n M SD
Math
2000 Multiage 42 74.31 20.17
2000 Mixed-age 41 67.63 19.31
2000 Total 83 71.01 19.91
1999 Multiage 42 70.18 18.56
1999 Mixed-age 41 63.09 19.61
1999 Total 83 66.34 19.35
1998 Multiage 40 67.42 14.24
1998 Mixed-age 34 56.44 19.34
1998 Total 74 60.10 18.45
1997 Multiage 36 72.38 17.94
1997 Mixed-age 30 67.80 19.70
1997 Total 66 69.26 19.14

51
Table 6 (continued)
Configuration n M SD
Reading
2000 Multiage 42 72.98 21.14
2000 Mixed-age 41 67.49 16.53
2000 Total 83 70.27 19.09
1999 Multiage 38 67.05 16.14
1999 Mixed-age 45 62.58 20.17
1999 Total 83 64.63 18.46
1998 Multiage 24 67.75 19.31
1998 Mixed-age 48 57.60 19.73
1998 Total 72 60.99 20.05
1997 Multiage 21 76.52 17.72
1997 Mixed-age 45 63.69 26.55
1997 Total 66 67.77 24.70
_____________________________________________________________________________________________

52
Figure 2.
Figure 3.
Reading Mean Normal Curve Eqivalency (NCE) Scores in
Configurations
63.757.6 62.6 67.5
76.567.8 67.1
73.0
020406080
100
1997 1998 1999 2000Year
Mea
n N
CE
Scor
es Mixed AgeMultiage
Math Mean Normal Curve Eqivalency (NCE) Scores in Configurations
67.856.4
63.1 67.672.467.4 70.2 74.3
0
20
40
60
80
100
1997 1998 1999 2000
Year
Mea
n N
CE
Scor
es
Mixed AgeMultiage

53
The results of the study are presented under each of the following research questions.
Research Question #2
Is there a difference in normal curve equivalent reading achievement scores of the cohort of students in
mixed-age (two-grade span) and multiage (three-grade span) configurations? Analysis of variance (ANOVA), with
an alpha level of .05, was used to address question two and null hypotheses one through four.
Ho1. There is no statistically significant difference in the Total Reading scores, on the 2000 TerraNova
Standardized Assessment, of the cohort of students (5th grade year) in mixed-age (two-grade span) and multiage
(three-grade span) configurations. The results of this analysis are shown in Table 7.
Table 7
Results of ANOVA for Hypothesis 1: Differences in Total Reading Scores of Configurations in 2000
Configuration n M SD F p (2000 –5th grade) Multiage 42 72.98 21.14 1.730 .192
Mixed-age 41 67.49 16.53
Total 83 70.27 19.09 Table 7 presents results of one-way analysis of variance of configuration on
Reading achievement in 2000. The null hypothesis was retained (p =.192). No statistical differences were found
among the means of the mixed-age (two-grade span) and multiage (three-grade span) configurations.

54
Ho2. There is no statistically significant difference in the Total Reading scores, on the 1999 TerraNova
Standardized Assessment, of the cohort of students (4th grade year) in mixed-age (two-grade span) and multiage
(three-grade span) configurations. The results of this analysis are shown in Table 8.
Table 8
Results of ANOVA for Hypothesis 2: Differences in Total Reading Scores of Configurations in 1999
Configuration n M SD F p (1999 – 4th grade) Multiage 38 67.05 16.14 1.213 .274
Mixed-age 45 62.58 20.17
Total 83 64.63 18.46 Table 8 presents results of one-way analysis of variance of configuration on
Reading achievement in 1999. The null hypothesis was retained (p =.274). No statistical differences were found
among the means of the mixed-age (two-grade span) and multiage (three-grade span) configurations.
Ho3. There is no statistically significant difference in the Total Reading scores, on the 1998 TerraNova
Standardized Assessment, of the cohort of students (3rd grade year) in mixed-age (two-grade span) and multiage
(three-grade span) configurations. The results of this analysis are shown in Table 9.
Table 9
Results of ANOVA for Hypothesis 3: Differences in Total Reading Scores of Configurations in 1998
Configuration n M SD F p (1998 – 3rd grade) Multiage 24 67.75 19.31 4.289 .042
Mixed-age 48 57.60 19.73
Total 72 60.99 20.05

55
Table 9 presents results of one-way analysis of variance of configuration on Reading achievement in 1998.
The null hypothesis was rejected. Statistical differences existed among the means of the mixed-age (two-grade
span) and multiage (three-grade span) configurations (F =4.289, p =. 042). A statistically significant difference in
the Total Reading scores, on the 1998 TerraNova Standardized Assessment, of the cohort of students in mixed-age
(two-grade span) and multiage (three-grade span) configurations existed during their 3rd grade year. Those students
in multiage (three-grade span) configurations scored significantly higher in reading achievement on the 1998
TerraNova Assessment (M = 67.75), as compared to mixed-age group (M = 57.60).
Ho4. There is no statistically significant difference in the Total Reading scores, on the 1997 TerraNova
Standardized Assessment, of the cohort of students (2nd grade year) in mixed-age (two-grade span) and multiage
(three-grade span) configurations. The results of this analysis are shown in Table 10.
Table 10
Results of ANOVA for Hypothesis 4: Differences in Total Reading Scores of Configurations in 1997
Configuration n M SD F p (1997 – 2nd grade) Multiage 21 76.52 17.72 4.047 .048
Mixed-age 45 63.69 26.55
Total 66 67.77 24.70 Table 10 presents results of one-way analysis of variance of configuration on Reading achievement in
1997. The null hypothesis was rejected. Statistical differences existed among the means of the mixed-age (two-
grade span) and multiage (three-grade span) configurations (F=4.047, p=. 048). A statistically significant difference
in the Total Reading scores, on the 1997 TerraNova Standardized Assessment, of the cohort of students in mixed-
age (two-grade span) and multiage (three-grade span) configurations existed during their 2nd grade year. Those
students in multiage (three-grade span) configurations scored significantly higher in reading achievement on the
1997 TerraNova Assessment (M = 76.52), as compared to the mixed-age group (M = 63.69).
Analysis of covariance (ANCOVA) was used to address hypothesis 5. H05. There is no significant
difference in reading achievement scores of the cohort of students (during what is traditionally known as 5thgrade) in

56
mixed-age (two-grade span) and multiage (three-grade span) configurations after controlling for prior reading
achievement.
Table 11
Results of ANCOVA for Hypothesis 5: Difference in Reading Achievement within Configurations After
Controlling for Prior Reading Achievement
Configuration n M Adj. M SD F p 2000
Multiage 36 72.72 73.554 21.68 6.453 .014
Mixed-Age 30 67.47 66.469 15.97
Table 11 presents the results of analysis of covariance (ANCOVA). After controlling for prior reading
achievement in 1997, 1998, and 1999, configuration had a significant effect on reading achievement scores.
Analysis of covariance indicated configuration to be statistically significant. The null hypothesis was rejected.
Statistically significant differences were found in the Total Reading scores, on the TerraNova Standardized
Assessment, of the cohort of students during 5th grade in mixed-age (two-grade span) and multiage (three-grade
span) configurations after controlling for prior reading achievement. Multiage (three-grade span) students scored
significantly higher than mixed-age (two-grade span) students in reading achievement. The covariate effects were
as follows: reading 1999 (F =11.247, p =. 001), reading 1998 (F =12.690, p =. 001), and reading 1997 (F =. 740,
p=.393), indicating that 1998 and 1999 reading scores were significantly related to the 2000 reading scores.
ANCOVA was used to test hypotheses 6 and 7. H06. There is no significant difference in reading
achievement scores based on gender of the cohort of students (during what is traditionally known as 5th grade) in
mixed-age (two-grade span) and multiage (three-grade span) configurations.

57
Table 12
Results of ANCOVA for Hypothesis 6: Difference in Reading Achievement within Configurations by Gender
Configuration Gender n M Adj. M F p 2000
Multiage male 23 69.43 72.51 .038 .846
female 19 77.26 73.53
Total 42 72.98
Mixed-Age male 21 65.48 67.40 .005 .943
female 20 69.60 67.59
Total 41 67.49
Table 12 presents the results of analysis of covariance (ANCOVA). After controlling for prior reading
achievement in 1999, gender did not have a significant effect on reading achievement scores. The null hypothesis
was not rejected. Analysis of covariance indicated no statistically significant difference in configurations by gender.
H07. There is no significant difference in reading achievement scores based on socioeconomic status of the cohort
of students (during what is traditionally known as 5thgrade) in mixed-age (two-grade span) and multiage (three-grade
span) configurations.

58
Table 13
Results of ANCOVA for Hypothesis 7: Difference in Reading Achievement within Configuration by
Socioeconomic Status (SES)
Configuration SES n M Adj.M F p 2000
Multiage other 37 74.43 73.16 .039 .845
low 5 62.20 71.60
Total 42 72.98
Mixed-Age other 36 68.86 68.00 1.085 .304
low 5 57.60 63.77
Total 41 67.49
Table 13 presents the results of analysis of covariance (ANCOVA). After controlling for prior reading
achievement in 1999, socioeconomic status did not have a significant effect on reading achievement scores. The
null hypothesis was not rejected. Analysis of covariance indicated no statistically significant difference in
configurations by socioeconomic status.
Research Question #3
Is there a difference in normal curve equivalent math achievement scores of 5th grade students in mixed-
age (two-grade span) and multiage (three-grade span) configurations? Analysis of variance, with an alpha level of
.05, was used to address question three and null hypotheses eight through twelve.
Ho8. There is no statistically significant difference in the Total Math scores, on the 2000 TerraNova
Standardized Assessment, of the cohort of students (during what is traditionally known as 5th grade) in mixed-age
(two-grade span) and multiage (three-grade span) configurations. The results of this analysis are shown in Table 14.

59
Table 14
Results of ANOVA for Hypothesis 8: Differences in Total Math Scores of Configurations in 2000
Configuration n M SD F p (2000 –5th grade) Multiage 42 74.31 20.17 2.370 .128
Mixed-age 41 67.63 19.31
Total 83 71.01 19.91
Table 14 presents results of one-way analysis of variance of configuration on Math achievement in 2000.
The null hypothesis was retained. No statistical differences were found among the means of the mixed-age (two-
grade span) and multiage (three-grade span) configurations. Ho9. There is no statistically significant difference in
the Total Math scores, on the 1999 TerraNova Standardized Assessment, of the cohort of students (4th grade year) in
mixed-age (two-grade span) and multiage (three-grade span) configurations. The results of this analysis are shown
in Table 15.
Table 15
Results of ANOVA for Hypothesis 9: Differences in Total Math Scores of Configurations in 1999
Configuration n M SD F p (1999 – 4th grade) Multiage 38 70.18 18.56 2.832 .096
Mixed-age 45 63.09 19.61
Total 83 66.34 19.35
Table 15 presents results of one-way analysis of variance of configuration on Math achievement in 1999.
The null hypothesis was not retained. No statistical differences were found among the means of the mixed-age
(two-grade span) and multiage (three-grade span) configurations.

60
Ho10. There is no statistically significant difference in the Total Math scores, on the 1998 TerraNova
Standardized Assessment, of the cohort of students (3rd grade year) in mixed-age (two-grade span) and multiage
(three-grade span) configurations. The results of this analysis are shown in Table 16.
Table 16
Results of ANOVA for Hypothesis 10: Differences in Total Math Scores of Configurations in 1998
Configuration n M SD F p (1998 – 3rd grade) Multiage 24 67.42 19.31 6.071 .016
Mixed-age 48 56.44 19.34
Total 72 60.10 18.45
Table 16 presents results of one-way analysis of variance of configuration on Math achievement in 1998.
The null hypothesis was rejected. Statistical differences existed among the means of the mixed-age (two-grade
span) and multiage (three-grade span) configurations (F=6.071, p=. 016). A statistically significant difference in the
Total Math scores, on the 1998 TerraNova Standardized Assessment, of the cohort of students in mixed-age (two-
grade span) and multiage (three-grade span) configurations existed during their 3rd grade year. Those students in
multiage (three-grade span) configurations scored significantly higher in math achievement on the 1998 TerraNova
Assessment, (M = 67.42) as compared to the mixed-age group (M =56.44).
Ho11. There is no statistically significant difference in the Total Math scores, on the 1997 TerraNova
Standardized Assessment, of the cohort of students (2nd grade year) in mixed-age (two-grade span) and multiage
(three-grade span) configurations. The results of this analysis are shown in Table 17.

61
Table 17
Results of ANOVA for Hypothesis 11: Differences in Total Math Scores of Configurations in 1997
Configuration n M SD F p (1997 – 2nd grade) Multiage 21 72.38 17.94 .818 .369
Mixed-age 45 67.80 19.70
Total 66 69.26 19.14
Table 17 presents results of one-way analysis of variance of configuration on Math achievement in 1997.
The null hypothesis was retained. No statistical differences existed among the means of the mixed-age (two-grade
span) and multiage (three-grade span) configurations.
Analysis of covariance (ANCOVA) was used to address hypothesis 12. H012. There is no significant
difference in math achievement scores of the cohort of students (during what is traditionally known as 5thgrade) in
mixed-age (two-grade span) and multiage (three-grade span) configurations after controlling for prior math
achievement.
Table 18
Results of ANCOVA for Hypothesis 12: Difference in Math Achievement within Configurations After Controlling
for Prior Math Achievement
Configuration n M Adj.M SD F p 2000
Multiage 36 76.17 75.480 19.01 2.040 .158
Mixed-Age 30 69.90 70.725 20.25
Table 18 presents the results of analysis of covariance (ANCOVA). After controlling for prior math
achievement in 1997, 1998, and 1999, configuration did not have a significant effect on math achievement scores in
2000. The null hypothesis was retained. The covariate effects were as follows: math 1999 (F =15.972, p =. 000),
math 1998 (F =1.659, p =. 203), and math 1997 (F =. 784, p =. 379).

62
Analysis of covariance (ANCOVA) was used to test hypotheses 13 and 14. H013. There is no significant
difference in math achievement scores based on gender of the cohort of students (during what is traditionally known
as 5thgrade) in mixed-age (two-grade span) and multiage (three-grade span) configurations.
Table 19
Results of ANCOVA for Hypothesis 13: Difference in Math Achievement within Configurations by Gender
Configuration Gender n M Adj.M F p 2000
Multiage male 23 73.30 73.20 .501 .483
female 19 75.53 75.66
Total 42 74.31
Mixed-Age male 21 65.71 68.46 .127 .724
female 20 69.65 66.76
Total 41 67.63
Table 19 presents the results of analysis of covariance (ANCOVA). After controlling for prior math
achievement in 1999, gender did not have a significant effect on math achievement scores. The null hypothesis was
retained. Analysis of covariance indicated no statistically significant difference in configurations by gender.
H014. There is no significant difference in math achievement scores based on socioeconomic status of the
cohort of students (during what is traditionally known as 5thgrade) in mixed-age (two-grade span) and multiage
(three-grade span) configurations.
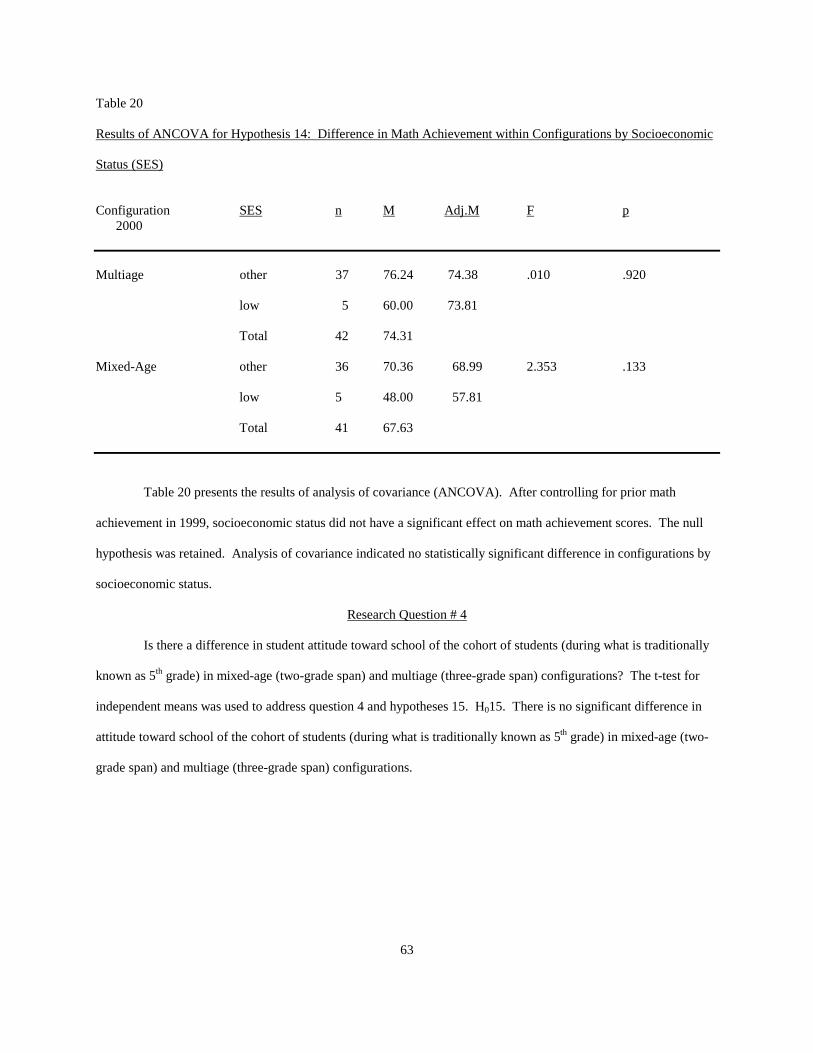
63
Table 20
Results of ANCOVA for Hypothesis 14: Difference in Math Achievement within Configurations by Socioeconomic
Status (SES)
Configuration SES n M Adj.M F p 2000
Multiage other 37 76.24 74.38 .010 .920
low 5 60.00 73.81
Total 42 74.31
Mixed-Age other 36 70.36 68.99 2.353 .133
low 5 48.00 57.81
Total 41 67.63
Table 20 presents the results of analysis of covariance (ANCOVA). After controlling for prior math
achievement in 1999, socioeconomic status did not have a significant effect on math achievement scores. The null
hypothesis was retained. Analysis of covariance indicated no statistically significant difference in configurations by
socioeconomic status.
Research Question # 4
Is there a difference in student attitude toward school of the cohort of students (during what is traditionally
known as 5th grade) in mixed-age (two-grade span) and multiage (three-grade span) configurations? The t-test for
independent means was used to address question 4 and hypotheses 15. H015. There is no significant difference in
attitude toward school of the cohort of students (during what is traditionally known as 5th grade) in mixed-age (two-
grade span) and multiage (three-grade span) configurations.

64
Table 21
Results of T-test for Hypothesis 15: Difference in Attitude Towards School of Configurations in 2000
Attitude n M SD t p (two-tailed)
School in General Multiage 44 69.93 10.79 1.57 .119
Mixed-age 43 65.84 13.33
School Work
Multiage 44 55.73 8.66 .57 .568
Mixed-age 45 54.58 10.17
Teacher
Multiage 44 58.86 9.16 1.53 .130
Mixed-age 45 55.78 9.85
Overall Attitude
Multiage 44 184.52 26.14 1.39 .168
Mixed-age 43 176.12 30.19
The t-test for independent means was used to test the hypothesis. The two-tailed probability for overall
attitude towards school was p =.168; therefore the null hypothesis was retained. There is no significant difference in
attitude towards school of those students in mixed-age (two-grade span) and multiage (three-grade span)
configurations, while the means were slightly higher in the multiage configuration than mixed-age configuration
(multiage M = 184.52, mixed-age M = 176.12), this difference was not statistically significant. To further
demonstrate the results refer to Figure 4.

65
Figure 4.
Chapter Five presents an analysis and interpretation of these results along with recommendations for
further research.
Attitude Toward School Survey Results (2000)
65.8
54.6 55.8
69.9
55.7 58.9
01020304050607080
School inGeneral
School Work Teacher
Mea
n Sc
ore
Mixed AgeMultiage

66
CHAPTER 5
SUMMARY, FINDINGS, CONCLUSIONS, IMPLICATIONS, AND RECOMMENDATIONS
Summary
The primary goal of this study was to compare reading and math achievement of students who experience
mixed-age (two-grade span) and multiage (three-grade span) configurations in a selected nongraded elementary
school in East Tennessee. The convenience sample was selected due to its unique organization. According to
Anderson (1993), the ideal nongraded grouping should involve 70-120 students and a team of three to six teachers.
“Most advocates of nongradedness believe it is essential for students to belong to a basic aggregation of children
that embraces at least two (preferably three) age groups” (p. 11). The selected nongraded school opened in the fall
of 1994 with six multiage (three-grade span) learning centers, each containing 80-120 students and a team of four to
five teachers. During the second year (1995/1996 school year), some mixed-age (two-grade span) classes were
formed. During the 1996/1997-1999/2000 school years two learning centers remained multiage (three-grade span)
and four were mixed-age (two-grade span) in configuration. TerraNova Comprehensive Test of Basic Skills was
administered to all students in grades 2 – 5 each spring. Total reading and total math normal curve equivalency
scores for 2nd –5th grade were obtained for the 5th grade cohort of students. These students were the first to
experience the nongraded structure for their six years of elementary schooling, resulting in graduation in May 2000.
Achievement scores were analyzed for all four years to determine if a significant difference existed between
configurations. Attitude toward school as well as gender and socioeconomic status were also analyzed.
This chapter provides conclusions drawn from the findings of the study presented in Chapter Four and the
review of the literature, which was presented in Chapter Two, as well as recommendations for further research.
Four research questions guided this study.
67
Findings
Research Question 1
What is the demographic profile of the students in the cohort? Eighty-three students comprised the 5th
grade cohort studied in this six-year old newly designed nongraded school. Of the 83 students 44 were male and 39
female. Seventy-three students were of middle-high socioeconomic status, whereas 10 were of low socioeconomic
status (qualifying for free or reduced lunch). During the 1999/2000 school year, 42 students were in the multiage
(three-grade span) configuration and 41 in the mixed-age (two-grade span) configuration. Equal balance in gender
was found in both configurations. Multiage had 23 males, 19 females for a total of 42 students and mixed-age had
21 males and 20 females, totaling 41. Prior to the 1999/2000 school year, more students were in the mixed-age
(two-grade span) configuration than the multiage (three-grade span) configuration. Refer to Figure 1. Normal curve
equivalency mean scores for reading and math on the Terra Nova Comprehensive Test of Basic Skills were
obtained. Mean scores were consistently higher in both reading and math for those students in multiage (three-grade
span) configurations. Refer to Figure 2 and Figure 3.
Research Question 2
Is there a difference in mean normal curve equivalent reading achievement scores of the cohort students in
mixed-age (two-grade span) and multiage (three-grade span) configurations? Analysis of variance (ANOVA)
indicated there was no significant difference at the .05 level in total reading scores between mixed-age and multiage
configurations in years 2000 and 1999. However, the mean NCE reading score was higher for multiage (three-grade
span) students in both 2000 and 1999 (2000 – multiage M = 72.98, mixed-age M = 67.49 and 1999 –multiage M =
67.05, mixed-age M = 62.58).
Analysis of variance indicated a statistically significant difference in total reading score means between
mixed-age and multiage configurations in years 1998 and 1997. The mean revealed students in multiage (three-
grade span) configured classes scoring significantly higher in reading achievement (1998 – multiage M =67.75,
mixed-age M = 57.60 and 1997 – multiage M =76.52, mixed-age M = 63.69) than those students in mixed-age (two-
grade span) classes.

68
In order to control for prior reading achievement in 1999, 1998 and 1997 an analysis of covariance
(ANCOVA) was conducted to determine if configuration had a significant effect on reading achievement scores.
According to Best & Kahn (1998), differences in the initial status of the groups can be removed statistically so that
they can be compared as though they are equated. The analysis of covariance after controlling for prior reading
achievement indicated configuration to be statistically significant. Multiage (three-grade span) students scored
significantly higher in reading achievement. The adjusted M for multiage (three-grade span) students was 73.55,
mixed-age (two-grade span) students M was 66.47.
Analysis of covariance for gender and socioeconomic status resulted in no significant differences in
configuration, however the mean scores for male and female were higher in multiage classes (male M= 69.43,
female M = 77.26) than mixed-age classes (male M = 65.48, female M = 69.60). Students in middle-high
socioeconomic group (indicated as other) and students in low socioeconomic group (indicated as low) both had
higher mean scores in multiage configured classrooms. In multiage classes, other M = 74.43 and low M = 62.20. In
mixed-age classes, other M = 68.86 and low M = 57.60.
Research Question 3
Is there a difference in mean normal curve equivalent math achievement scores of the cohort students in
mixed-age (two-grade span) and multiage (three-grade span) configurations? The analysis of variance indicated
there was no significant difference at the .05 level in total math scores between mixed-age (two-grade span) and
multiage (three-grade span) configurations in years 2000, 1999, and 1997. However, the mean NCE math score was
higher for multiage (three-grade span) students in the three years; 2000, 1999, and 1997 (2000 – multiage M =
74.31, mixed-age M = 67.63, 1999 –multiage M = 70.18, mixed-age M = 63.09 and 1997 – multiage M = 72.38,
mixed-age M = 67.80).
Analysis of variance indicated a statistically significant difference in total math score means between
mixed-age and multiage configurations in 1998. The mean revealed students in multiage (three-grade span)
configured classes scoring significantly higher in math achievement (1998 – multiage M =67.42, mixed-age M =
56.44) than those students in mixed-age (two-grade span) classes.

69
In order to control for prior math achievement in 1999, 1998, and 1997 an analysis of covariance was
conducted to determine if configuration had a significant effect on achievement scores. The analysis of covariance
after controlling for prior math achievement indicated configuration not to be statistically significant. The adjusted
M for multiage students was 75.48, mixed-age students M was 70.73.
Analysis of covariance for gender and socioeconomic status resulted in no significant differences in
configuration, however the mean scores for male and female were higher in multiage (three-grade span) classes
(male M= 73.30, female M = 75.53) than mixed-age (two-grade span) classes (male M = 65.71, female M = 69.65).
Students in middle-high socioeconomic group (indicated as other) and students in low socioeconomic group
(indicated as low) both had higher mean scores in multiage configured classrooms. In multiage classes, other M =
76.24 and low M = 60.00. In mixed-age classes, other M = 70.36 and low M = 48.00.
Research Question 4
Is there a difference in student attitude toward school of the cohort of students (during what is traditionally
known as 5th grade) in mixed-age (two-grade span) and multiage (three-grade span) configurations? Results from
the t-test indicated no statistically significant difference in attitude towards school of those students in mixed-age
(two-grade span) and multiage (three-grade span) configurations. However, the differences in means were slightly
higher in the multiage (three-grade span) configurations in all areas, ‘school in general’, ‘school work’, ‘teacher’ and
‘overall attitude’. Refer to Figure 4.
Conclusions
As our society changes and educators continue to learn about brain development and how children learn
best, the search will continue for the ideal learning environment for students. According to Gaustad (1994), “The
central tenet of nongraded education is that individuals are different and should not be subjected to identical,
assembly-line treatment” (p. 6). Research is available which favors nongradedness. The question still asked is
which configuration leads to greater academic success.
As a result of the findings of this study, the following conclusions were offered concerning configuration,
mixed-age (two-grade span) or multiage (three-grade span), in a nongraded school.
This study supported the research and recommendations made by Anderson (1993), Kovalik (1994),
Gaustad (1994), and Grant and Johnson (1995), who reported that a multiage (three-grade span) configuration is

70
preferable. The cohort of students in multiage (three-grade span) classes in the selected nongraded school produced
higher NCE mean scores in both reading and math, whereas the mixed-age (two-grade span) students scored 5 –13
points lower in reading and math during the four years studied. Statistically significant differences were found in
1998 in both reading and math, multiage (three-grade span) students producing the higher scores. During the 1998
year, the students in the cohort were in what is traditionally known as 3rd grade. Students in the multiage (three-
grade span) classes just completed a K, 1,2 multiage class and were in the spring of their first year in a new three-
grade span configuration. They were the youngest in the newly formed multiage group. The mixed-age (two-grade
span) class students were just completing their second year in a two-grade span class where they were the oldest
students in what is traditionally known as 3rd grade.
After controlling for prior reading achievement it was found that the multiage (three-grade span)
configuration for the 2000 year (typically known as the 5th grade year) had a significant effect on reading
achievement scores. This supports results from previous longitudinal studies that report positive results indicating
more favorable school attitude and better academic achievement the longer a student is in a nongraded program
(Eeles, 1970; Killough, 1971; Morris, Proger & Morrell, 1971; Pavan, 1977; Perrin, 1969; Walker, 1973).
Although no statistically significant differences were found in attitude toward school in multiage (three-
grade span) and mixed-age (two-grade span) configurations, the mean scores for ‘school in general’, ‘school work’,
‘teacher’ and ‘overall attitude’ were higher for students in multiage (three-grade span) configured classes.
Implications
If we believe that all children are entitled to an education and that all children can learn, then every child
should be given that opportunity to learn. A nongraded elementary structure can enable a child to learn at a pace
that is right for them, ultimately resulting in success. As educators, it is our job to create safe, supportive, enriching
environments, for students to experience a developmentally appropriate integrated curriculum. We now have factual
brain research to substantiate our previous thoughts on why integration is so critical for learning. It is through this
hands-on, cooperative approach focusing on continuous progress for the learner that we will reach our goal of
student academic and social success for all.
The degree of implementation of nongradedness is an important factor influencing academic and social
student performance. A multiage (three-grade span) class, as evidenced in this study and defined by Anderson and

71
Pavan (1993) in Chapter Two, enables the educator to form a true “community of learners” where individuals
become successful. Students learn how to learn, how to communicate and collaborate with others. They become
excited about directing their own learning. They become responsible learners. As noted in Chapter Two, mixed-age
(two-grade span) class configurations often allow teachers to hang on to familiar graded, lock-step practices,
resulting in a lesser degree of implementation of the components of nongradedness which may result in lower
academic and social success as indicated in the results of this study. As Anderson (1993) stated the time for
nongradedness has finally come. It is now up to us to determine which configuration will lead to the greatest
academic and social success for all of our children. It is my hope that this study will contribute to the goal of
providing the appropriate environment so that all children can learn.
Recommendations
As a result of this study the following recommendations are offered:
1. Further quantitative and qualitative studies should be conducted in other nongraded schools, which
contain both two-grade and three-grade span configurations, to determine which produces greater
academic achievement in reading and math.
2. Research studies need to be conducted to determine level of developmentally appropriateness of
teaching in nongraded schools and in mixed-age and multiage classes.
3. Research should be conducted to determine criteria to be used to select teachers for nongraded
schools.
4. Research should be conducted to determine differences in teachers of mixed-age (two-grade span)
and multiage (three-grade span) classes.
5. Research should be conducted to develop a classroom observation and rating tool for identifying
characteristics of nongraded classes.
6. Longitudinal studies should be conducted comparing middle and high school achievement of
students who attended nongraded and graded elementary programs.

72
REFERENCES
Allsion, J., & Ong, W. (1996). Dimensions of Early Childhood. 18-23.
Anderson, R.H., & Pavan, B.N. (1993). Nongradedness: Helping it to happen. Lancaster, PA: Technomic Publishing Company.
Anderson, R.H. (1993). The return of the nongraded classroom. Principal. 72, 9-12.
Bandura, A. (1977). A social learning theory. Englewood Cliffs, NJ: Prentice-Hall.
Bernheisel, S. (1992). Give it a Try. Principal, 71, 22.
Best, J., & Kahn, J. (1998). Research in education. Boston: Allyn and Bacon.
Blythe, T., & Gardner, H. (1990). A school for all intelligences. Educational Leadership, 47, 33-37.
Bredekamp, S., & Copple, C. (1997). Developmentally appropriate practice in early childhood programs. Washington, DC: National Association for the Education of Young Children. Campbell, D., & Fiske, D. (1959). Convergent and discriminant validation by the multitrait-multimethod matrix. Psychological Bulletin, 47, 31. Caine, G., & Caine, R. (1994). Making connections: Teaching and the human brain. Menlo Park, CA: Addison- Wesley. Carter, J. (1974). A study of the effects of multi-grade grouping on the attitudes toward self, others and school of selected third and fifth grade students. Dissertation Abstracts, 34, 5469A. Cohen, E. (1994). Designing groupwork: Strategies for the heterogeneous classroom. 2nd edition. New York: Teachers College Press. Connell, D. (1987). The first 30 years were the fairest: Notes from the kindergarten and ungraded primary (K,1,2). Young Children, 42, 30-39. CTB /McGraw-Hill. (1996). TerraNova Prepublication Technical Bulletin. Monterey, CA: Author.
CTB/McGraw-Hill. (1997). Teacher’s guide to the TerraNova. Monterey, CA: Author.
Curwin, R. (1978). The grades of wrath: Some alternatives. Learning, 6, 60-63.
Cushman, K. (1990). The whys and hows of the multi-age primary classroom. American Educator, 14, 28-32.
Dewey, J. (1938). Experience and education. New York: Macmillan.
Diamond, M. (1988). Enriching heredity: The impact of environment on the anatomy of the brain. New York: Free Press. Eells, C. (1970). A study of academic ability of immigrant pupils over five years in a suburban nongraded school system. Dissertation Abstracts, 31, 579A. Elkind, D. (1987). Miseducation: Preschoolers at risk. New York: Knopf.

73
Etzioni, A. (1993). The spirit of community. New York: Crown.
Ford, B. (1977). Multiage grouping in elementary school and children’s affective development: A review of recent research. The Elementary School Journal, 78, 149-159. Gall, M., Borg, W., & Gall, J. (1996). Educational research. White Plains, NY: Longman.
Gardner, H. (1983). Frames of mind: Theory of multiple intelligences. New York: Basic Books.
Gardner, H. (1993). Multiple intelligences the theory in practice. New York: Basic Books.
Gaustad, J. (1992a). Nongraded education mixed-age, integrated, and developmentally appropriate education for primary children. Oregon School Study Council Bulletin,35, N7. Gaustad, J. (1992b). Making the transition from graded to nongraded primary education. Oregon School Study Council Bulletin, 35, N8. Gaustad, J. (1994). Nongraded education overcoming obstacles to implementing the multiage classroom. Oregon School Study Council Bulletin, November and December 1994, 38, N3&4. Gaustad, J. (1996). Implementing multiage education. Research Roundup, 13, 2-5.
Gaustad, J. (1997). Building support for multiage education. Eugene, OR: College of Education. University of Oregon. (ERIC Digest. 114, EDO-EA- 97-6). Goleman, D. (1994). Emotional Intelligence. New York: Bantam Books.
Good, C. (1973). Dictionary of education. New York: McGraw-Hill.
Goodlad, J. (1997). In praise of education. New York: Teachers College Press.
Goodlad, J., & Anderson, R. (1959). The nongraded elementary school. New York: Harcourt, Brace. Goodlad, J., & Anderson, R. (1987). The nongraded elementary school. New York: Teachers College Press. Grant, J. (1993). Questions and answers about multiage programs. In D. Sumner (Ed.), Multiage classrooms: The ungrading of America’s schools 17-19. Peterborough, NH: Society for Developmental Education. Grant, J., & Johnson, B. (1995). A common sense guide to multiage practices. Columbus, OH: Teacher’s Publishing Group. Grant, J., Johnson, B. , & Richardson, I. (1995). Multiage Q & A – 101 practical answers to your most pressing questions. Peterborough, NH: Crystal Springs Books. Guarino, A. (1982). An investigation of achievement, self-concept, and school related anxiety in graded and
nongraded elementary schools. Doctoral Dissertation. Rutgers University.
Gutierrez, R. & Slavin, R. (1992). Achievement effects of the nongraded elementary school: a best evidence syntheses. Review of educational research. 62, 333-376. Hamm & Adams. (1991). What is a portfolio? (K. Burke). In R. Fogarty, The multiage classroom: A collection , (p. 187). Palatine, IL: IRI Skylight. (Reprinted from The mindful school: How to assess thoughtful outcomes. p. 44-49, 1993, Palatine, IL)
74
Hart, L. (1998). Human brain & human learning. White Plains, NY: Books for Educators.
Hebb, D. (1949). Organization of behavior. New York: John Wiley & Sons.
Hoy, W. K. (1972). Dimensions of student alienation and characteristics of secondary schools. Interchange, 3, 36-52.
Hunter, M. (1992). How to change to a nongraded school. Alexandria, VA: Association for Supervision and Curriculum Development. Jackson, P. (1968). Life in Classrooms. New York: Holt, Rinehart & Winston.
Junell, J. (1970). An analysis of the effects of multigrading on a number of noncognitive variable. Unpublished doctoral dissertation, University of Washington . Katz, L., Evangelou, D., & Hartman, J. (1990). The case for mixed-age grouping in early education. Washington, DC: National Association for the Education of Young Children. Katz, L., (1995, May). The benefits of mixed-age grouping. ERIC Digest (Online). Available: http://ericps.ed.uiuc.edu/eece/pubs/digests/1995/lkmag95.html. Kasten, W. (1998). Why does multiage make sense? Compelling arguments for educational change. Primary Voices K-6. 6, 2-8. Kentucky Department of Education (1996, February). Partnership for Kentucky School Reform. From dilemma to opportunity: a report on education reform in Kentucky, five years after the Kentucky Education Reform Act of 1990. Lexington, KY: Author. 47 pages Killough, C. (1971). An analysis of the longitudinal effects that a nongraded elementary program, conducted in an open-space school, had on the cognitive achievement of pupils. Doctoral dissertation, University of Houston. Kovalik, S. (1994). ITI: The model integrated thematic instruction. Kent, WA: Books for Educators.
LeDoux, J. (1994). Emotion, memory and the brain. Scientific American. 270, 50-57.
Lodish, R. (1992). The pros and cons of mixed-age grouping. Principal, 71 (6), 20-22.
Lolli, E. (1998). Multiage magic. Primary Voices, 6, 10-17.
Mackey, B., Johnson, R., & Wood, T. (1995). Cognitive and affective outcomes in a multiage language arts program. Journal of Research in Childhood Education, 10, 49-61. McGeehan, J. (1999). Transformations: Leadership for brain-compatible learning. Kent, WA: Books for Educators. Meier, R. S. (1973). Development and analysis of an instrument designed to measure attitude toward school for children in grades 4 to 6. Unpublished master’s thesis, Purdue University, West Lafayette, Indiana. Milburn, D. (1981). A study of multi-age or family-grouped classrooms. Phi Delta Kappan, 513-514. Miller, B. (1989). The multigrade classroom: A resource handbook for small, rural schools. Portland ,OR: Northwest Regional Laboratory, ED 320 719.

75
Miller, B. (1993). A review of the quantitative research on multigrade instruction. In D. Summer (Ed.), Multiage classrooms: the ungrading of American schools, 65-63. Peterborough, NH: Society for Developmental Education. Miller, B. (1994). Children at the center implementing the multiage classroom. Portland, OR: Northwest Regional Educational Laboratory. Miller, D. (1988). Review of the comprehensive tests of basic skills fourth edition. The eleventh mental measurements yearbook, 219. Milburn, D. (1981). A study of multi-age or family grouped classrooms. Phi Delta Kappan, 62, 513-514.
Morris, V., Proger, B. & Morrell, J. (1971). Pupil achievement in a nongraded primary plan after three and five years of instruction. Educational Leadership, 29, 621-625. Nachbar, R. (1989). A K,1 class can work-wonderfully! Young Children, 44, 67-71.
Northwest Regional Educational Laboratory. (1993). Nongraded primary education. (Online). Available: http://www.nwrel.org/scpd/sirs/8/2029.html. Nye, B. (1993). Some questions and answers about multiage grouping. ERS Spectrum, 11, 38-45.
Oregon School Study Council. (1989). Integrative education: A curriculum for the twenty-first century. Eugene,
OR (Online). Available: http://www.ed.gov/databases/ERIC_Digests/ed390112.html.
Otto, H. (1934). Historical sketches of administrative innovations. Educational Administration and Supervision, 20, 161-172. Pavan, B. (1977). The nongraded elementary school: research on academic achievement and mental health. Texas Tech Journal of Education, 4, 91-107. Pavan, B. (1973). Nongradedness? One view. Educational Leadership 30, 401-403.
Pavan, B. (1992). The benefits of nongraded schools. Educational Leadership, 50, 182-185.
Perrin, J. (1969). A statistical and time change analysis of achievement differences of children in a nongraded and graded program in selected schools in the Little Rock Public Schools. Dissertation Abstracts, 30, 530A. Phillips, D. (1995). The good, the bad, and the ugly: The many faces of constructivism. Educational Researcher, 24, (7), 5-12. Piers, E. (1977). The Piers-Harris children’s self-concept scale. Research Monograph. Nashville, TN: Counselor Recordings and Tests. Pratt, C. & Treacy, K. (1986). A study of student grouping practices in early childhood classes in Western Australian government primary schools. (Cooperative Research Series No. 9). Nedlands, Australia: Education Department of Western Australia. Pratt, D. (1993). On the merits of multiage classrooms. The multiage classroom: A collection. Ed. Robin Fogarty. Palatine, IL: IRI/Skylight Publishing. Privett, N. (1996). Without fear of failure: The attributes of an ungraded primary school. The School Administrator. 6-11.

76
Ramayya, D. (1972). Achievement skills, personality variables and classroom climate in graded and nongraded elementary schools. Psychology in the Schools, 9, 88-92. Rockefeller, S. (1991). John Dewey: Religious faith and democratic humanism. New York: Columbia University Press. Shearer, W. (1899). The grading of schools. New York: H.P. Smith.
Shoemaker, B. (1989). Integrative Education: A Curriculum for the Twenty-First Century. OSSC Bulletin, Eugene, Oregon: Oregon School Study Council, ED 311 602. Schrankler, W. J. (1976). Family grouping and the affective domain. Elementary School Journal, 76, 432- 439.
Schroeder, R., & Nott, R. E. (1974). Multiage grouping---it works! Catalyst for Change, 3, 15-18.
Sorensen, H. (1966). Introduction, attitudes and academic success. Charles Wethington. Bureau of School Service, College of Education, University of Kentucky. Sorensen, H. (1964). Psychology in education. New York: McGraw-Hill.
Stone, S. (1995). Teaching strategies: empowering teachers, empowering children. Childhood Education, 71, 294- 295. Sylwester, R. (1995). A celebration of neurons an educators guide to the human brain. Alexandria, VA: Association for Supervision and Curriculum Development. Thurston, L., & Chave, E. (1929). The measurement of attitudes. Chicago: The University of Chicago Press.
Uphoff, J. & Evans, D. (1993). The country school comes to town: A case study of multiage grouping and teaching. In D. Sumner (Ed.), Multiage classrooms: the ungrading of America’s schools, 36-38. Peterborough, NH: Society for Developmental Education. Veenman, S. (1995). Cognitive and noncognitive effects of multigrade and multi-age classes: A best-evidence synthesis. Review of Educational Research. 65, 319-381. Villa, R. & Thousand, J. (1993). Enhancing success in heterogeneous classrooms and schools: The powers of partnership. In D. Sumner (Ed.), Multiage classrooms: the ungrading of America’s schools, 51- 61. Peterborough, NH: Society for Developmental Education. Vinson, B. (2001). Fishing and Vygotsky’s concept of effective education. Young Children, 56, 88-89.
Vygotsky, L. (1962). Thought and language. Cambridge, MA: MIT Press.
Vygotsky, L. (1978). Mind in society. Cambridge, MA: Harvard University Press.
Walker, W. (1973). Long term effects of graded and nongraded primary programs. Doctoral Dissertation, George Peabody College of Teachers, Nashville, Tennessee. Way, J. (1981). Achievement and self-concept in multiage classrooms. Educational Research Quarterly. 6 , 69-75. Webb, T. (1992). Multi-age grouping in the early years: building upon children’s developmental strengths, Kappa Delta Pi Record, 28, 90-92.

77
Wilt, H. (1971). A comparison of student attitudes toward school, academic achievement, internal structures and procedures: the nongraded school versus the graded school. Dissertation Abstracts, 31, 5105A.

78
APPENDIX
Permission from Superintendent
January 2, 2001
XXXXXXXX
Superintendent of Schools
XXXXXXXX Schools
City, State 55555
Dear Dr. XXXXX,
The purpose of this letter is to obtain written permission to utilize TerraNova reading and math scores and
attitude toward school survey results of the first cohort of students to complete their elementary education at
XXXXXX Elementary School, the class of 2000. I met with Dr. XXXXX, while he was serving as Interim Director
of Schools and obtained verbal permission to pursue my interest in completing a dissertation about the nongraded
elementary school in XXXXXXX Schools. I wanted to wait until the new Superintendent began to obtain written
permission.
My dissertation is titled “An Analysis of Configurations in a Nongraded Elementary School in Northeast
Tennessee”. I believe the results will be helpful for those who are considering implementing a nongraded program
as well as serve as an analysis of the program itself. Results will be shared with you and the principal,, XXXX,
upon completion.
Sincerely,
Pamela A. Evanshen
Permission is granted for Pamela A. Evanshen to utilize TerraNova reading and math scores and attitude toward
school survey results of the first cohort of students, the class of 2000, to complete their elementary education at
XXXXXXX Elementary School.
_______________________________________________ ____________________________
Signature Date

79
VITA
PAMELA ANN BROWN EVANSHEN Personal Data: Date of Birth: July 6, 1960 Place of Birth: Kearny, New Jersey Marital Status: Married Education: Public Schools, Kearny, New Jersey Tusculum College, Greeneville, Tennessee; Special, Elementary, and Early Childhood Education, B.A., 1982 East Tennessee State University, Johnson City, Tennessee; Special Education, M.A., 1984 East Tennessee State University, Johnson City, Tennessee; Educational Leadership and Policy Analysis, Ed.D., 2001 Professional Experience: Lead Teacher, East Tennessee State University Child Study Center; Johnson City, Tennessee, September 1982 - May 1983 Teacher Assistant, East Tennessee State University, Washington County Preschool Handicapped Program, Johnson City, Tennessee, September 1983 – May 1984 Director/Teacher, East Tennessee State University, Washington County Preschool Handicapped Program, Johnson City, Tennessee, August 1984 – May 1985 Teacher, Fairfax County Schools, Preschool Special Education Program, Fairfax, Virginia, February 1986 – June 1988 Director/Preschool Teacher, Kingsport City Schools, Early Childhood Learning Center, August 1988 – August 1989 Full Time Director and Preschool Special Needs Coordinator, Kingsport City Schools, Early Childhood Learning Center, August 1989 - August 1990 Director, Kingsport City Schools, Early Childhood Learning Centers, August 1990 – July 1996 Assistant to the Principal, Kingsport City Schools, George Washington Elementary School, Kingsport, Tennessee, August 1996 – Present
Adjunct Faculty, East Tennessee State University, Johnson City, Tennessee, January 1994 - Present
Honors and Awards: Who's Who in American Colleges, 1980-81. Alpha Chi, College Honor Society Member Leadership Talent Scholarship Recipient, Tusculum College Student Council for Exceptional Children Service Award, 1982, Tusculum College Career Ladder III, Tennessee Department of Education, 1997