Embed Size (px)
Citation preview

NOVATEUR PUBLICATIONS
INTERNATIONAL JOURNAL OF INNOVATIONS IN ENGINEERING RESEARCH AND TECHNOLOGY [IJIERT]
ISSN: 2394-3696 VOLUME 2, ISSUE 8, AUG-2015
1 | P a g e
AN ANALYSIS OF COLD STORE BY CFD SIMULATION
Praneeth H R, PG Student
Department of Mechanical Engineering, Vidyavardhaka College of Engineering, Mysuru, India
Dr. B. Sadashive Gowda
Principal, Vidyavardhaka College of Engineering, Mysuru, India
ABSTRACT
This paper deals with the numerical analysis of 3d model of a cold store of dimensions 4.5 m (L) x 3.3 m (W) x
2.5 m (H), which is developed to study the effects of design parameters on flow and temperature fields within the
cold store. The variation in number of inlets, position of inlets and stacking methodology affect flow and
temperature fields within the cold store. Results of CFD simulation indicated the optimum position of the inlets,
number of inlets and stacking methodology required to have uniform flow and temperature field within the cold
store. It also proved that CFD is a convenient tool for designing and optimizing the flow field in the cold store.
Keywords: Computational fluid dynamics; Cold store; Frozen food; Numerical simulation;
INTRODUCTION
A cold store is a place where the perishable items such as fruits, vegetables, drugs, flowers are stored to minimize
spoiling and thereby extending their shelf life. It retains the characteristics of food product, nutritive value and
freshness of perishable items for the longer duration of time. Within the cold store, if there exists uneven
distribution of temperature and air, it results in hot spots over food products stored, dull appearance on surface and
loses its freshness and nutritive value. These problems could be overcome by proper design of the cold stores.
A short discussion of the previous studies of authors who attempted to focus on how the flow and temperature
fields within a cold store affected by design parameters are presented here. Enhai Liu et.al [1] carried out
theoretical and experimental analysis on an industrial cold storage. CFD was used for analysis of flow field inside
the cold storage; the study confirmed the optimum forced air supply was 2 m/sec. Jing Xie et.al [2] studied the
influence of design parameters (corner baffle, food storage) of cold store on airflow and temperature fields .S A
Tassou et.al [3] proposed a model for wet-air cooled stores based on CFD analysis, in which they considered
buoyancy effects also. Model identified design area problems and helped in investigating the effect of design
parameters on the wet-air cooled store performance. Tanaka et.al 4] examined the cooling performance of a
partially loaded cold store with large solid objects without porous media using a transient three dimensional CFD
model. The effect of different loading patterns on the cooling effectiveness was studied by this author.

NOVATEUR PUBLICATIONS
INTERNATIONAL JOURNAL OF INNOVATIONS IN ENGINEERING RESEARCH AND TECHNOLOGY [IJIERT]
ISSN: 2394-3696 VOLUME 2, ISSUE 8, AUG-2015
2 | P a g e
Yongfu Xu et.al [5] considered a transient 3d CFD model of heat and mass transfer in porous bulks of particulate
foodstuffs. Moisture diffusion and heat transfer was considered within the spherical shaped solids and the heat of
respiration as an empirically derived function of temperature. They predicted moisture and temperature changes in
potatoes during cooling.
The main objective of this project is to carry out the numerical simulation of the cold store in order to achieve a
uniform flow and temperature field within the cold store, resulting in proper cooling of perishable goods, thus
increasing their shelf life, to analyse the effect of multiple inlets (position and number of the inlets) and stacking
methodology on the flow and temperature fields within the cold store.
II MATHEMATICAL FORMULATION
2.1 The physical model and coordinate system
A 3D model of a cold store is created in ICEM CFD (Ver. 14.5). In view of the geometry, the Cartesian co-
ordinate system is chosen to describe the geometry, where X, Y and Z axes represent the length, height and
breadth of the cold store respectively.
Table 2.1 Dimensions of various parts of cold store shown in Fig 2.1
Dimensions of cold store 4.5m (l) x 3.3m (h) x 2.5m (b)
Dimensions of inlet duct and outlet duct 1 m x 0.150 m x 0.3 m
Dimensions of the crates of the racks 0.5m (l) x 1.8m (b) x 0.3m (h)
Air gap between the crates of racks 0.3 m
Cold room wall thickness 0.15 m
Fig.2.1 Typical dimensions of a cold store
I R O
1m
1m
AG
I – INLET
O – OUTLET
R – RACKS
AG – AIR GAP

NOVATEUR PUBLICATIONS
INTERNATIONAL JOURNAL OF INNOVATIONS IN ENGINEERING RESEARCH AND TECHNOLOGY [IJIERT]
ISSN: 2394-3696 VOLUME 2, ISSUE 8, AUG-2015
3 | P a g e
III MESHING
The model is created using ICEM CFD software.
The whole model is divided into different parts namely inlet, outlet, inner wall, racks and outer wall.
Global Mesh parameters are defined which gives information regarding type of mesh. The global element
seed size, part parameters are setup and mesh is computed which gives the mesh information regarding total
number of elements.
An unstructured tetra mesh is generated in order to perform computations with the Octree approach. The
global element seed size is fixed to 200 based on grid independent study. After setting up part parameters
for various parts, a mesh is generated with nearly 5 to 6 lakh elements.
Fig.3.1 Meshed model of a loaded cold store
IV GOVERNING EQUATIONS
The 2D incompressible, turbulent flow is described using a constant-property Boussinesq fluid.
div (ρVΦ) = div (τgradΦ)+S
Here, Φ is general variable
τ is generalized diffusion coefficient corresponding to Φ
S is generalized source term corresponding to Φ

NOVATEUR PUBLICATIONS
INTERNATIONAL JOURNAL OF INNOVATIONS IN ENGINEERING RESEARCH AND TECHNOLOGY [IJIERT]
ISSN: 2394-3696 VOLUME 2, ISSUE 8, AUG-2015
4 | P a g e
Table4.1Relationship between the parameters and different partial differential equations
EQUATION Φ τ S
Momentum Eq in X-direction
u
η + ηt - 𝜕𝑝
𝜕𝑥+𝜕
𝜕𝑥(ηeff
𝜕𝑢
𝜕𝑥)+
𝜕
𝜕𝑦(ηeff
𝜕𝑣
𝜕𝑥)
Momentum Eq in Y-direction v η + ηt - 𝜕𝑝
𝜕𝑦+𝜕
𝜕𝑥(ηeff
𝜕𝑢
𝜕𝑦)+
𝜕
𝜕𝑦(ηeff
𝜕𝑣
𝜕𝑦)
K- Equation K η + 𝜂
𝜎𝑘 ρGk-ρε
ε-Equation ε η + 𝜂
𝜎𝜀
𝜀
𝑘( C1ρGk-C2𝜌ε)
Energy conservation T 𝜂
𝑝𝜏 +
𝜂𝑡
𝜎𝑇 0
Here, Gk = 𝜂𝑡
𝜌 { 2 [ (
𝜕𝑢
𝜕𝑥 )
2 + (
𝜕𝑣
𝜕𝑦 )
2 ] + (
𝜕𝑢
𝜕𝑦 +
𝜕𝑣
𝜕𝑥 )
2 +(
𝜕𝑤
𝜕𝑥) 2
+(𝜕𝑤
𝜕𝑦)
2 }
ηeff = η + ηtandηt =ρCµ𝑘2
𝜀
Table 4.2The values of coefficients of the k-ε model [6]
Cµ C1 C2 σk σε 𝜎𝑇
0.09 1.44 1.92 1.0 1.3 0.9-1.0
V BOUNDARY CONDITIONS
The applicable boundary conditions for the computation of the cold storage are as follows:
Inlet: In the present analysis the velocity at inlet is varied from 1 m/s to 3 m/s in steps of 1 m/s. The inlet
temperature is fixed at278 K.
Outlet: Relative pressure is set as zero, which facilitates the air flow within the cold storage.
Racks: Heat flux; i.e. heat generated due to respiration of fruits stored within the racks for different design
configurations are considered.
Wall: The no slip condition and smooth surface conditions are assumed.
Outer wall: Heat transfer coefficient and outside temperatures are specified as 0.027Wm-2
K-1
and 298 K
respectively.
Two domains were considered for the computation such as air and solid wall, both domains are stationary.
Air is a fluid domain and K-e model is used for accounting the turbulence. Reference Pressure is assumed to be
1 atm.
Solid wall is a solid domain which is given the properties of polystyrene foam.

NOVATEUR PUBLICATIONS
INTERNATIONAL JOURNAL OF INNOVATIONS IN ENGINEERING RESEARCH AND TECHNOLOGY [IJIERT]
ISSN: 2394-3696 VOLUME 2, ISSUE 8, AUG-2015
5 | P a g e
VI VALIDATION
The problem is solved using ANSYS CFX and the code is validated with the results of a research paper [2] for, it is
found that it agrees well with the results of the published work as shown in figures 6.1 and 6.3.
Fig.6.1Previous work model of flow field for 7m/s
Fig.6.2Present work model of flow field for 7m/s
Fig.6.3 Previous work model of flow field and temperature field in the cold store for 6m/s

NOVATEUR PUBLICATIONS
INTERNATIONAL JOURNAL OF INNOVATIONS IN ENGINEERING RESEARCH AND TECHNOLOGY [IJIERT]
ISSN: 2394-3696 VOLUME 2, ISSUE 8, AUG-2015
6 | P a g e
Fig.6.4 Present work model of flow field in the cold store for 6m/s
Fig.6.5 Present work model of temperature field in the cold store for 6m/s
It may be seen from fig.6.1 and Fig.6.3 that here is recirculation of air with less velocity, causing hot spots in that
region
Comparing the Fig.6.3 with Fig.6.4,it is found that the stacking of foodstuff within the cold store affect the flow
field making it to be non uniform and disorder as it creates a large number of eddies.
From the Fig.6.5, it is found that temperature on the i) windward face is lower than leeward face ii) upper side is
lower than downside which agrees with the previous work result as shown in Fig.6.3. Thus the empty and loaded
cold store models are validated.

NOVATEUR PUBLICATIONS
INTERNATIONAL JOURNAL OF INNOVATIONS IN ENGINEERING RESEARCH AND TECHNOLOGY [IJIERT]
ISSN: 2394-3696 VOLUME 2, ISSUE 8, AUG-2015
7 | P a g e
VII PRESENT STUDY
In the present study the design parameters affecting the flow and temperature fields are studied. The design
parameters include the position of the inlet, number of the inlets and outlets and the stacking methodology. It aims
to have uniform air flow and temperature distribution within the cold store and thus prevent hot spots on the
surface of the produce. The following designs are considered for analysis
A) To change the position of the inlet and outlet in case of single inlet type of cold stores
DESIGN 1
Fig.7.1 A cold store with inlet at 500 mm and outlet at 1500 mm from base
Fig.7.2 A cold store with inlet at 100 mm and outlet at 1900 mm from base
NOVATEUR PUBLICATIONS
INTERNATIONAL JOURNAL OF INNOVATIONS IN ENGINEERING RESEARCH AND TECHNOLOGY [IJIERT]
ISSN: 2394-3696 VOLUME 2, ISSUE 8, AUG-2015
8 | P a g e
B) To have different configurations of multiple air inlets and outlets instead of single inlet and outlet and
changing the stacking methodology.
DESIGN 2
Fig.7.3A cold store with 1500 mm gap between racks
Fig.7.4A cold store with 1000 mm gap between racks
Fig.7.5 A cold store with 500 mm gap between racks

NOVATEUR PUBLICATIONS
INTERNATIONAL JOURNAL OF INNOVATIONS IN ENGINEERING RESEARCH AND TECHNOLOGY [IJIERT]
ISSN: 2394-3696 VOLUME 2, ISSUE 8, AUG-2015
9 | P a g e
DESIGN 3
Fig.7.6 A cold store with 1000 mm gap between racks, an inlet at top and air gap of 200 mm at bottom of
racks
DESIGN 4
Fig.7.7 A cold store with 1000 mm gap between racks, an inlet at top and bottom of racks and air gap of 200
mm at bottom of racks
DESIGN 5
Fig.7.8 A cold store with 1000 mm gap between racks, inlets at top and bottom of racks and air gap of 200
mm at bottom of racks
VIII RESULTS AND DISCUSSION
The results obtained indicate the flow and temperature fields which are obtained for different design
configurations in which design parameters namely viz. position of the inlet, number of inlets& outlets are varied.
Figures show the results generated by ANSYS CFX. In these figures, velocity vector and temperature contours

NOVATEUR PUBLICATIONS
INTERNATIONAL JOURNAL OF INNOVATIONS IN ENGINEERING RESEARCH AND TECHNOLOGY [IJIERT]
ISSN: 2394-3696 VOLUME 2, ISSUE 8, AUG-2015
10 | P a g e
shown by different colors, which describe the flow and temperature fields characteristics within the cold store for
different design configurations.
8.1 Results obtained for single inlet type of cold stores
The figures 8.1.1 and 8.2.1 show velocity vector for different configurations of cold store,which gives the
characteristics of flow field in the cold store. These design configuration refers tosingle inlet types of cold store.
The vectors show the velocity variation and how flow occurs at different points within the cold store. As we can
see from these vector diagram, there exists recirculation of air in between the racks, at the top and sides of the
racks, in between the air gap provided between the crates of the racks, near the inlet and outlet and in the empty
spaces in cold store.It accounts for the non uniform distribution of the airflow in the cold store, resulting in the non
uniform distribution of temperature field within the cold store as shown in figures8.1.2 and 8.2.2. This is easily
depicted by temperature variation on the surface of the food product as shown in temperature contours. High
temperature could be noticed at the top, bottom, sides of the crates of racks and at the corner of the rooms.Thus,
there exists a temperature variation of about 0.50C - 0.7
0C on the surface of food products as seen from
temperature contour. Therefore, in order to overcome these defeciencies several other multiple inlet configuration
are tried.
DESIGN 1
Fig.8.1.1 Flow field of a cold store with inlet at 500 mm and outlet at 1500 mm from base
Fig.8.1.2 Temperature field of a cold store with inlet at 500 mm and outlet at 1500 mm from base

NOVATEUR PUBLICATIONS
INTERNATIONAL JOURNAL OF INNOVATIONS IN ENGINEERING RESEARCH AND TECHNOLOGY [IJIERT]
ISSN: 2394-3696 VOLUME 2, ISSUE 8, AUG-2015
11 | P a g e
Fig.8.2.1 Flow field of a cold store with inlet at 100 mm and outlet at 1900 mm from base
Fig.8.2.2 Temperature field of a cold store with inlet at 100 mm and outlet at 1900 mm from base
8.2 Results obtained for multiple inlet type of cold stores
Cold stores with multiple inlet configurations are shown in Fig. 8.3.1 to Fig.8.5.2, with number of inlets being
three.These inlets are such that they are inline with the multiple outlets and air gapprovided in between the crates of
the racks. Fromfigures 8.3.1, 8.4.1 and 8.5.1 depicting velocity vector diagrams,it is found that such a modification
in the design configuration of the cold store resulted in decreased recirculation of air in between racks and near the
inlet and outlet. But still there exists a noticebale amount of recirculation at top and bottom of the racks. It accounts
for higher temperature on the surface of produce at the top and sometimes at the bottom and sides, as shown in
figures 8.3.2, 8.4.2, 8.5.2. In these cases, the temperature variation on the surface of produce kept in racks vary upto
about 0.50C - 1
0C.
Thus in order tofully achieve uniform airflow and uniform temperature distribution in the cold store room, an
additional inlet is provided at the top and a small air gap is provided at the bottom as shown in Fig. 8.6.1 to
Fig.8.6.2. But still it does not give the uniform airlow and temperature distribution, as there exists recirculation of
air at the bottom of the racks where the air gap is provided. Also higher temperatures of about 0.50C - 0.7
0C at
bottom of racks causing a hot spot at that point of the food produce. So a small improvement, i.e providing an
additional inlet at the bottom as shown in Fig.8.7.1to Fig.8.7.2 and Fig.8.8.1 to Fig.8.8.2 results in uniform
temperature and airflow fields in the cold stores. Here, the temperature variation on the surface of produce kept in
racks is about 0.10C - 0.3
0 C.
From the above study, it is found that the design configurations 5 and 6 of cold stores as shown in Fig.8.7.1 to
Fig.8.7.2 and Fig.8.8.1to Fig.8.8.2 with uniform flow and temperature distribution gives the desired results. The
results obtained are for inlet air velocity of 3 m/s and an air gap of300 mm between the crates of racks.

NOVATEUR PUBLICATIONS
INTERNATIONAL JOURNAL OF INNOVATIONS IN ENGINEERING RESEARCH AND TECHNOLOGY [IJIERT]
ISSN: 2394-3696 VOLUME 2, ISSUE 8, AUG-2015
12 | P a g e
DESIGN 2
Fig.8.3.1Flow field of a cold store with 1500 mm gap between racks
Fig.8.3.2 Temperature field of cold store with 1500 mm gap between racks
Fig.8.4.1 Flow field of a cold store with 1000 mm gap between racks
NOVATEUR PUBLICATIONS
INTERNATIONAL JOURNAL OF INNOVATIONS IN ENGINEERING RESEARCH AND TECHNOLOGY [IJIERT]
ISSN: 2394-3696 VOLUME 2, ISSUE 8, AUG-2015
13 | P a g e
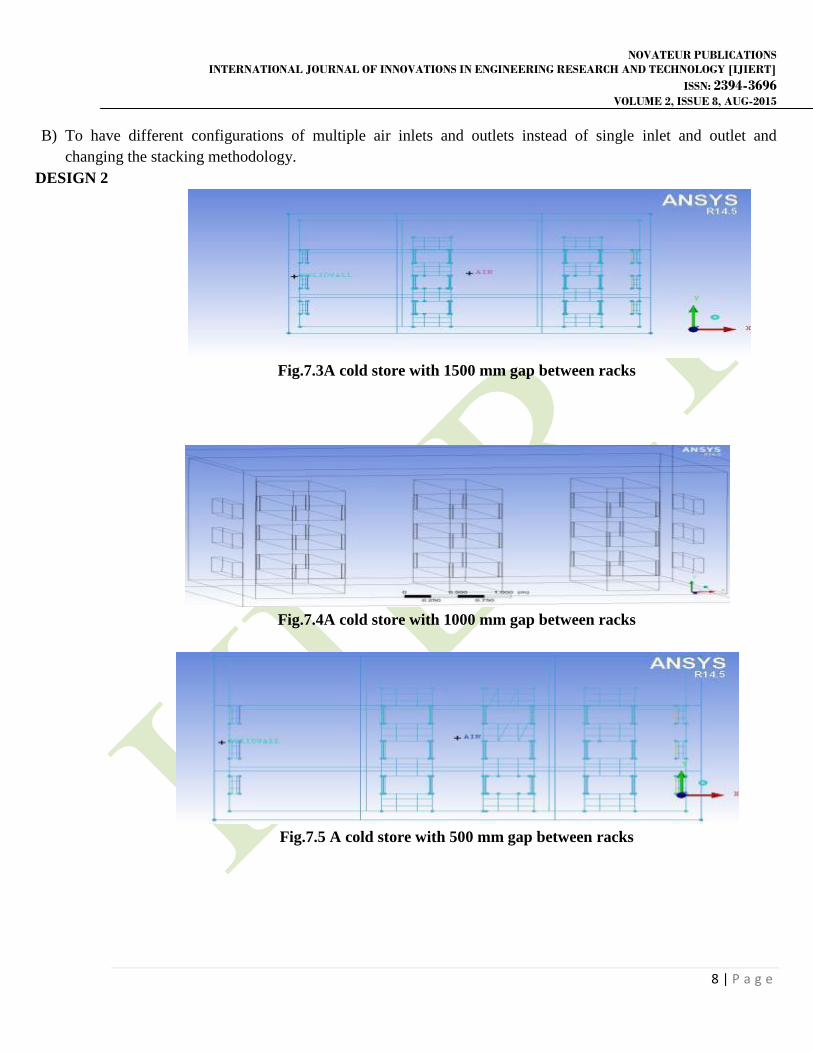
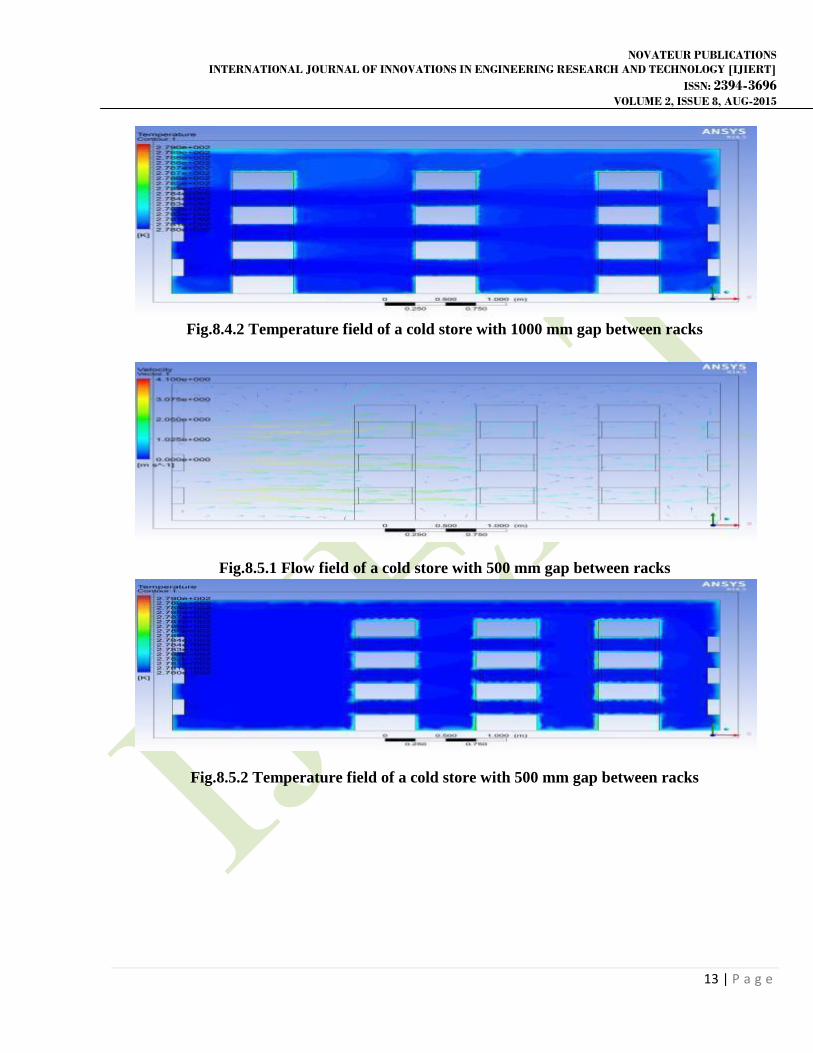
Fig.8.4.2 Temperature field of a cold store with 1000 mm gap between racks
Fig.8.5.1 Flow field of a cold store with 500 mm gap between racks
Fig.8.5.2 Temperature field of a cold store with 500 mm gap between racks

NOVATEUR PUBLICATIONS
INTERNATIONAL JOURNAL OF INNOVATIONS IN ENGINEERING RESEARCH AND TECHNOLOGY [IJIERT]
ISSN: 2394-3696 VOLUME 2, ISSUE 8, AUG-2015
14 | P a g e
DESIGN 3
Fig.8.6.1 Flow field of a cold store with 1000 mm gap between racks, an inlet at top and air gap
of 200 mm at bottom of racks
Fig.8.6.2 Temperature field of a cold store with 1000 mm gap between racks, an inlet at top and
air gap of 200 mm at bottom of racks
DESIGN 4
Fig.8.7.1Flow field for design configuration 4 of cold store

NOVATEUR PUBLICATIONS
INTERNATIONAL JOURNAL OF INNOVATIONS IN ENGINEERING RESEARCH AND TECHNOLOGY [IJIERT]
ISSN: 2394-3696 VOLUME 2, ISSUE 8, AUG-2015
15 | P a g e
Fig.8.7.2 Temperature field for design configuration 4 of cold store
DESIGN 5
Fig.8.8.1 Flow field for design configuration 5 of a cold store
Fig.8.8.2 Temperature field for design configuration 5 of a cold store

NOVATEUR PUBLICATIONS
INTERNATIONAL JOURNAL OF INNOVATIONS IN ENGINEERING RESEARCH AND TECHNOLOGY [IJIERT]
ISSN: 2394-3696 VOLUME 2, ISSUE 8, AUG-2015
16 | P a g e
VII CONCLUSIONS
A CFD analysis is carried out to investigate the airflow and temperature fields within the cold store. Based on
exhaustive study of various design configurations, results and discussions the following conclusions could be made:
1. Providing air gap between the racks reduces the hot spot areas on the surface of the racks when compared with
the continuous racks having no air gaps.
2. The optimum position of the inlet is that it should be in line with the air gap between the crates of the racks, and
outlet, also inlets should be provided at top and bottom of the racks to facilitate uniform airflow and
temperature distribution within the cold store.
3. Multiple inlets as stated in conclusion 2 proved to be beneficial by 11.5% in terms of reduction in variation of
temperature over the surface of racks in which food is stored when compared to single inlets. It also resulted in
uniform airflow and temperature field within the cold store.
4. Study confirms that the racks with lesser length i.e. 500 mm provides temperature variation of about 0.30C to
0.40C when compared to that of 1000 mm which provides better results with lesser temperature variation of
0.10C over the surface of the racks in which food produce are stored.
VIII REFERENCES
1. Enhai Liu, Tingting Yu, Shengyong Liu, Hongwei Liu, ”Flow Field Analysis and Defrosting Cycle
Optimization in a Large-scale Industrial Cold storage Facility”, Journal of Food and Nutrition Research, 2014,
Vol. 2, No. 9, 567-574.
2. Jing Xie, Xiao-Hua Qu, Jun-Ye Shi, Da-Wen Sun, ”Effect of design parameters on flow and temperature fields
of a cold store by CFD simulation” ,Journal of Food Engineering 77 (2006) 355–363.
3. S.A. Tassou & W.Xiang, “Modeling the Environment within a wet-Air cooled Vegetable Store”, Journal of
Food Engineering 38 (1998) 169-187.
4. Tanaka.F., Konishi, Y., Kuroki, Y., Hamanaka, D., Uchino, T. “The use of CFD to improve the performance of
partially loaded cold store”, Journal of Food process Engineering (2011) ISSN: 1745-4530.6.Tao, W. Q.
(2001). “Numerical heat transfer” (2nd ed.). Xi’an, China: Xi’an Jiaotong University Publishing Co. (pp. 12–
246).
5. Yongfu Xu, Dean Burfoot, “Simulating the bulk storage of foodstuffs”, Journal of Food Engineering, 39(1999),
Issue1, Pages 23-39.
6. Tao, W. Q. (2001). “Numerical heat transfer” (2nd ed.). Xi’an, China: Xi’an Jiaotong University Publishing
Co. (pp. 12–246).