Embed Size (px)
Citation preview

AN ANALYSIS OF SPRING BIRD MIGRATION PHENOLOGY IN KANSAS
by
JUDD PATTERSON
B.S., Kansas State University, 2005
A THESIS
submitted in partial fulfillment of the requirements for the degree
MASTER OF ARTS
Department of Geography College of Arts And Sciences
KANSAS STATE UNIVERSITY Manhattan, Kansas
2008
Approved by:
Major Professor Dr. John Harrington, Jr.

Abstract
In late summer and fall, many migratory birds journey south from the North American
Great Plains to spend the winter in locations with greater food availability. As spring returns, a
combination of genetics and environmental cues trigger these birds to return north to their
breeding grounds. Several bird migration phenology studies from Europe, Australia, and the
eastern/northern United States have discovered that some bird species are returning earlier in the
spring, a change that has often been correlated with a warming climate. This study aimed to be
the first to analyze possible changes in both spring bird migration phenology and regional spring
climate change in Kansas.
First arrival dates (FADs) were collected for thirty bird species, resulting in a database
with over 6,000 FAD entries. For northeast Kansas, 1997-2007 median arrival dates were
calculated and compared to dates published by Dr. Richard Johnston in 1965. In southcentral
Kansas, 1997-2007 and 1947-1967 median arrival dates were calculated and compared.
Temperature data from spring (February through May) were also obtained from the National
Climate Data Center’s United States Historical Climatology Network for all stations within
northeast and southcentral Kansas and temporal trends were analyzed with linear regression
analysis.
A comparison between median arrival dates in northeast Kansas found that eleven species
had altered their arrival date by a potentially significant number of days. Nine of these had
advanced their arrival and two showed a delay. In southcentral Kansas, nine species were shown
to have statistically significant differences in median arrival dates between time periods. Six of

these showed an advance and three showed a delay. Five species showed the same trend between
both regions, with four arriving earlier by an average 9.4 days and one delaying by an average of
4.5 days. Temperature trends for both subregions in Kansas showed significant warming of 1.8-
2.6°F (1.0-1.4°C) over the last century, with the largest warming observed in February and
associated strongly with increasing minimum temperatures.
The results from this study provide the first evidence that some bird species have recently
altered the timing of their arrival in Kansas, with a greater shift toward earlier arrival dates.
While the majority of these shifts were correlated with spring warming in Kansas, additional
research is necessary to determine the precise cause(s) of these phenological shifts. Still, given
existing literature and Intergovernmental Panel on Climate Change predictions for continued
warming in the next century, continued alterations to bird migration phenology seem likely.

iv
Table of Contents
List of Figures ................................................................................................................................ vi
List of Tables ................................................................................................................................ vii
List of Supplemental Files ........................................................................................................... viii
Acknowledgements........................................................................................................................ ix
Dedication ....................................................................................................................................... x
CHAPTER 1 - Introduction ............................................................................................................ 1
Justification................................................................................................................................. 2
CHAPTER 2 - Literature Review................................................................................................... 4
Bird Migration ............................................................................................................................ 4
Historical Explanations....................................................................................................... 5
Origins of Bird Migration ................................................................................................... 7
Migration Strategies............................................................................................................ 8
The Call to Migrate........................................................................................................... 10
Adaptability....................................................................................................................... 11
Phenology ................................................................................................................................. 12
Definition/History ............................................................................................................. 12
Growing Importance ......................................................................................................... 13
First Arrival Dates............................................................................................................. 14
Climate Change......................................................................................................................... 16
Global/Hemispheric Trends .............................................................................................. 16
Regional Trends ................................................................................................................ 17
Climate Change Impacts on Birds ............................................................................................ 19
Breeding Phenology.......................................................................................................... 19
Shifts in Distribution......................................................................................................... 20
Migration Phenology ........................................................................................................ 21
Birds in Kansas ......................................................................................................................... 24
Winter Locations............................................................................................................... 24
Arrival of Migrants in Kansas........................................................................................... 26

Kansas Migration Phenology Publications ....................................................................... 29
Literature Summary .................................................................................................................. 31
CHAPTER 3 - Data and Methods................................................................................................. 33
Study Area ................................................................................................................................ 34
Time Period............................................................................................................................... 34
Species ...................................................................................................................................... 35
First Arrival Database............................................................................................................... 38
Database Design................................................................................................................ 38
Contributors ...................................................................................................................... 39
Consistency Checks .......................................................................................................... 43
Analysis of FADs...................................................................................................................... 45
Northeast Kansas .............................................................................................................. 45
Southcentral Kansas.......................................................................................................... 47
Weekend Bias ................................................................................................................... 49
Analysis of Kansas Spring Climate Data.................................................................................. 49
CHAPTER 4 - Results and Discussion......................................................................................... 53
FAD Database........................................................................................................................... 53
Kansas Spring Climate Trends ................................................................................................. 56
Northeast Kansas Arrival Analysis........................................................................................... 61
Southcentral Kansas Arrival Analysis ...................................................................................... 67
Summary................................................................................................................................... 73
CHAPTER 5 - Summary and Conclusions................................................................................... 76
Limitations and Future Work.................................................................................................... 77
Concluding Remarks................................................................................................................. 81
References..................................................................................................................................... 82
v

List of Figures
Figure 2.1 – Year-round Distributions of Two Short-distance Migrants........................................ 9
Figure 2.2 – March-April-May Long-term United States Temperature Trends (°F/Decade)....... 18
Figure 2.3 – Estimated Winter Range for 45 Kansas Breeding Birds .......................................... 25
Figure 2.4 – Average Minimum Temperature in March - Isotherms for Kansas (1950-2000) .... 28
Figure 3.1 – Six Subregions of Kansas......................................................................................... 35
Figure 4.1 – Spatial Distribution (by County) of Collected Arrival Records in Kansas .............. 54
Figure 4.2 – Temporal Distribution of Collected Arrival Records in Kansas (1882-2007) ......... 55
Figure 4.3 – Temporal Distribution of Collected Arrival Records in Kansas (1882-1996) ......... 55
Figure 4.4 – Northeast Kansas Spring Temperatures Trends ....................................................... 57
Figure 4.5 – Southcentral Kansas Spring Temperatures Trends................................................... 58
Figure 4.6 – 1997-2007 Northeast Kansas Bird Arrival Dates by Day of Week.......................... 63
Figure 4.7 – 1997-2007 Southcentral Kansas Bird Arrival Dates by Day of Week..................... 71
Figure 4.8 – 1947-1967 Southcentral Kansas Bird Arrival Dates by Day of Week..................... 71
vi

List of Tables
Table 3.1 – Migratory Bird Species Used in his Study................................................................. 37
Table 3.2 – Summary of Observers Represented in FAD Database (with >25 records) .............. 41
Table 3.3 – Query for Northeast Kansas FADs ............................................................................ 45
Table 3.4 – Query for Southcentral Kansas FADs ....................................................................... 48
Table 3.5 – Period of Record for Northeast Kansas USHCN Stations......................................... 51
Table 3.6 – Period of Record for Southcentral Kansas USHCN Stations .................................... 52
Table 4.1 – Summary of Final Database Contents by Region of Kansas ..................................... 54
Table 4.2 – NE Kansas Spring Temperature Trends Based Upon 1895-2005 (8 stations) .......... 56
Table 4.3 – SC Kansas Spring Temperature Trends Based Upon 1895-2005 (5 stations)........... 58
Table 4.4 – SC Kansas Spring Temperature Trends Based Upon 1947-2005 (5 stations)........... 59
Table 4.5 – Monthly Minimum Temperature Trends Based Upon 1895-2005 ............................ 59
Table 4.6 – Migration Calendar for Northeast Kansas (based upon 1997-2007) ......................... 62
Table 4.7 – Northeast Kansas Median Arrival Date Comparison ................................................ 65
Table 4.8 – Potentially Significant Changes in Northeast Kansas Median Arrivals .................... 66
Table 4.9 – Southcentral Kansas Median Arrival Date Comparison............................................ 68
Table 4.10 – Significant Changes in Southcentral Kansas Median Arrivals................................ 69
Table 4.11 – Species with Consistent Trends in both Southcentral and Northeast Kansas.......... 74
Table 4.12 – Diets of Species with Consistent Trends in Southcentral and Northeast Kansas .... 75
vii

List of Supplemental Files
Microsoft Access Database – Kansas_bird_phenology.mdb - Last Modified April 18, 2008
viii
Acknowledgements
This project required the cooperation of many different individuals across the state of
Kansas. First and foremost I would like to thank my advisor, Dr. John Harrington, for his
continued encouragement, editing suggestions, and gentle prodding to keep the project moving
forward. Funding for my research assistantships came from the National Park Service, through
the Great Plains Cooperative Ecosystem Studies Unit, and from NSF-funding for the Ecological
Forecasting project. The entire Department of Geography at Kansas State University has been a
tremendous aid to my growth and a true highlight of my time at K-State. I am also extremely
grateful for the many bird watchers across the state of Kansas who donated their time and energy
toward collecting and compiling bird arrival records. Among those who provided their assistance
were Gregg Friesen, Matt Gearheart, Dan Gish, Leon Hicks, Pete Janzen, Lowell Johnson, Mark
Land, Dan Mulhern, Chuck Otte, Rob Penner, Dwight Platt, Scott Seltman, Thomas Shane, Max
Thompson, John Zimmerman, the Kansas Department of Wildlife and Parks, and many KSBIRD
listserv participants. Without the alert eyes and ears of these observers, this project would have
never been possible.
ix

Dedication
This thesis is dedicated to my parents and grandparents who have been a constant source
of strength and support in my life. I treasure every moment that we are together, and I cannot
thank you enough for the encouragement that is always there when I need a hand.
x

1
CHAPTER 1 - Introduction
The story of bird migration is the story of promise - a promise to return. –Winged Migration (film), 2001
Bird migration is one of the most widespread and spectacular biological phenomena in
the world. Hundreds of migratory species move back and forth between breeding and wintering
locations, often utilizing stopover locations in between. Individual birds and large flocks weave a
complex tapestry of migration routes that link locations across the planet. What triggers these
species to leave one area, travel long distances, and relocate to a new location? Birds are driven
primarily by the availability (or lack) of resources necessary for survival (Weidensaul 1999).
Recent studies have shown that the Earth is undergoing many shifts. Global temperature
trends show warming of 0.74°C over the last century, and regional trends for the Great Plains
indicate warming of 1°C over nearly the same time period (IPCC 2007, National Assessment
Synthesis Team 2000). Others have documented substantial changes in terrestrial land cover and
use as our planetary population of 6.6 billion humans modifies the environment to obtain food
and fiber. Some measures of these on-going changes to the global system, such as first leaf date
in spring and last spring freeze, have advanced by approximately a week over the last half-
century in the Northern Hemisphere (Schwartz 2006). Other scientific investigations have shown
the impacts of habitat loss and fragmentation on both the breeding and wintering grounds of
migratory species (Herkert 1994, Morris et al. 2004, Robbins 1989).
In addition, a host of studies on plants and animals have shown organism adjustments
consistent with climate change. One meta-analysis of 143 studies found 80% of the studied

species showed shifts in the direction expected by warming temperatures (Root et al. 2003). In
birds, advances in breeding dates, distributional shifts northward, and changes in the timing of
migration have all been observed (Dunn and Winkler 1999, Hitch and Leberg 2006, Butler
2003). From Australia to Europe to North America, evidence continues to mount that organisms
are responding to global change in significant and observable ways.
The purpose of this thesis was to examine spring bird migration phenology in Kansas and
to look for recent adjustments that might be due to regional climate change. The main questions
of this research were:
1) Is there evidence that spring bird migration phenology has shifted in Kansas over the last fifty to one-hundred years?
2) Has spring climate changed in Kansas over the last century?
The first question was answered by comparing recent and mid-twentieth century arrival dates for
a suite of bird species in Kansas. The second question was answered by analyzing spring
temperature datasets from weather stations in Kansas. Concluding remarks synthesize the
findings from these two separate analyses.
Justification
We are currently in a period of global change with major alterations apparent in climate,
land cover/land use, biodiversity, and more. There is a need to better understand the magnitude
and impact of these global trends. It is especially desirable to know the local expression of
global change. Measures of phenology provide a simple way to partially assess these changes.
Are flowers blooming earlier? Are birds arriving earlier in the spring, or departing later in the
fall? Despite the apparent simplicity of these questions, the study of phenology provides a way to
summarize a set of deeper, more complex processes (Schwartz 1998). The spring arrival of a
2

migratory bird is not simply a calendar date, but it reflects climatic conditions and food
availability along a migration route between locations. Likened by some to the study of the
“pulse of life”, the study of phenology can inform of advances or delays in seasonal changes and
provides opportunities to observe how global trends are manifested at the local level (Bradley et
al. 1999).
Migratory birds are particularly good indicators of phenological change. They are a
heavily studied wildlife group and arrival dates are available from scientists and an increasing
number of bird watchers (Crick 2006). Birds are also popular with the public, and significant
changes observed in well-known species are likely to generate interest from a wide audience.
Kansas and the central Great Plains represent an understudied region in terms of
phenology. No previous comparisons of historic and recent bird migration records were found
for this region. As a result, this thesis endeavored to reduce this knowledge gap, and to provide
insight into possible climate change impacts in Kansas.
3

CHAPTER 2 - Literature Review
On cool August nights you can hear their whistled signals as they set wing for the pampas, to prove again the age-old unity of the Americas. Hemisphere solidarity is new among statesmen, but not among the feathered navies of the sky.
–Aldo Leopold, 1966, A Sand County Almanac
Bird Migration
Across the globe, environmental conditions are in constant flux. As our planet orbits the
sun on a 23.5° tilt, seasonal changes drive adjustments in a variety of variables such as sunlight,
weather, and food availability. Animals must adjust to these shifting conditions, and many do
this by undertaking migrations (Berthold 2001). Defined broadly, migration is the act of moving
from one area of residence to another (Berthold 2001). Migration is common among almost all
groups of living creatures, but it is often found in simple forms such as the movement of
earthworms to deeper soil layers or fish that bury themselves in lake sediment as winter arrives.
Whereas there are examples of long-distance migration in insects, arthropods, fish, reptiles, and
mammals, no group can claim migration quite like birds (Berthold 2001).
Worldwide there are hundreds of species of birds that migrate. One estimate is that 50
billion of the 200-400 billion individual birds on the planet undertake migration movements each
year (Berthold 2001). The timing of migration can vary greatly, and not a single day of the year
passes without at least a few bird species on the move (Berthold 2001). The level of difficulty in
bird migration also varies widely. Some birds may simply change their elevation on a
mountainside, while others push physiological limits as they cover several thousands kilometers
in nonstop flight.
4

The tiny, thirteen gram, Blackpoll Warbler is one example of a species with an almost
unbelievable journey. Each fall populations that breed in Alaska make their way east across
North America, covering up to 4,800 km. Upon reaching the east coast, most refuel, turn south,
and fly nonstop for another 3,200 km over the Atlantic Ocean to coastal South America. While
these tiny birds rely on a few grams of fat to fuel their flight, scientists estimate that if powered
by gasoline their efficiency would near 720,000 mpg (Weidensaul 1999).
Yet, even the Blackpoll Warbler’s migration feat is surpassed by many other bird species.
Bar-tailed Godwits nest in Siberia and western Alaska and overwinter far to the south in New
Zealand. Incapable of landing on the water to feed or rest, these birds fly nonstop routes of up to
11,000 km on each leg of their two-way journey (Weidensaul 1999). Other species fly overland
and utilize a series of stopover sites to refuel and continue their trip. The Upland Sandpiper uses
this strategy and annually flies back and forth between the Great Plains and Paraguay (Houston
and Bowen 2001). Migrating birds cross oceans, fly through severe weather, pass over the high
mountains, and encounter just about everything in between as they connect habitats across the
planet.
Historical Explanations
For thousands of years, humans have witnessed the disappearance and eventual
reappearance of many bird species. The writings of Aristotle in the 4th century BC provide some
of the oldest known explanations for this annual phenomenon. Aristotle clearly understood the
basics of migration in large species such as the Eurasian Crane that move between Europe and
the Nile River delta (Gill 1994). However, he proposed a variety of more speculative theories for
the behavior of smaller birds.
5

Aristotle promoted the idea that many birds hibernated in “hollow trees, eaves, or in the
mud of marshes” (Lincoln et al. 1998). He believed that some birds would simply hide for the
winter and reemerge when suitable conditions returned. Aristotle’s idea was extremely
persistent, and even Carolus Linnaeus still believed that swallows hibernated at the bottom of
lakes in 1757 when be published Migrationes Avium (Alerstam 1993). At the present time only
the Common Poorwill of North America is known to spend periods hibernating during winter,
but it is still migratory in part of its range (Woods et al. 2005).
Aristotle also promoted a theory of transmutation to explain why certain species were not
present during winter. Based upon the observation that European Robins became abundant
around the time that Common Redstarts disappeared, he reasoned that the two birds were in fact
alternate plumages of the same species. His explanation for the seasonal switch of the Orphean
Warbler and Blackcap was a similar transmutation (Balme 1991, Armstrong 2006).
Other theories were also popular for a time, including the idea that smaller birds were
incapable of making long distance treks on their own. Many were convinced that warblers and
songbirds had to latch onto large birds such as storks and cranes in order to be transported to
their winter homes. A particularly intriguing theory originated from a 1703 publication titled “An
Essay toward the Probable Solution of this Question: Whence come the Stork and the
Turtledove, the Crane, and the Swallow, when they Know and Observe the Appointed Time of
their Coming.” The author of this publication, who was identified only as “a Person of Learning
and Piety,” promoted the theory that birds flew to the moon to spend each winter (Lincoln et al.
1998).
Given that many birds migrate at night and often at altitudes of 150 to 6,000 meters, it is
not hard to understand why aspects of migration have been difficult for previous scholars to
6

understand (Lincoln et al. 1998). The recent unraveling of migration mysteries has been aided by
new techniques and technologies. Of note has been the use of bird bands to identify and track
individual birds. While recovery rates are low, often less than one percent in songbirds, banding
recoveries have provided enough data points to speculate on migration routes and distances
(Berthold 2001). Even more recent advances have been the use of radar to track migratory flocks
at night and small satellite transmitters to record the spatio-temporal patterns of larger birds
(Berthold 2001).
Origins of Bird Migration
When and why did birds start migrating? The answers to these seemingly simple
questions have been sought by ornithologists for centuries, and they remain partially unknown
even today (Gill 1994). Birds evolved more than 140 million years ago, and were originally non-
migratory (Berthold 2001). Whereas fossil evidence for migratory birds dates back more than
100 million years, it does not appear that long distance migration became common until 15-45
million years ago (Steadman 2005).
Several theories have speculated on the drivers that heralded the switch from sedentary to
migratory species, including changes in prehistoric environmental conditions, competition
among species, competition among individuals of a species, and transient food resources
(Berthold 2001). While biologists continue to debate the evolution of migration, it has been
generally accepted that migration originated in birds of the tropics. Spurred by one or more of
these drivers, tropical birds gradually moved to higher latitudes where they were able to
capitalize on the seasonal pulse of food made possible by longer summer days (Bell 2000).
The exploitation of seasonal abundance, and consequential avoidance of resource
scarcity, is a key underpinning of migration. Most birds migrate because of a lack of food and
7

not necessarily as a way to escape from cold temperatures. In fact many birds are surprisingly
tolerant of frigid temperatures (Weidensaul 1999). The Golden-crowned Kinglet is smaller in
size and weight than most of the warblers that migrate to the tropics, and yet it manages to
survive cold winters in North Dakota and Minnesota by exploiting available food supplies
(Ingold and Galati 1997). However, for the many species that have not carved out a winter niche,
migration becomes necessary for survival.
Migration Strategies
Birds have developed a diverse set of migration strategies based upon factors such as
their range, dietary requirements, weather tolerance, flying abilities, habitat requirements, and
prevailing winds. There are species that use different routes on the outbound and inbound trips,
as well as populations from northern latitudes that leap-frog over southerly populations of the
same species during migration (Berthold 2001). While many complexities exist, for the purposes
of this study it is only necessary to understand two generalized migration strategies: short-
distance and long-distance. Populations that do not exhibit migration at all are said to be
sedentary or resident species.
Short-distance migrants are species that typically concentrate in the southern end of their
breeding range for the winter, or only relocate a short distance farther south. In the United States,
there are several species such as the Blue-gray Gnatcatcher, Tree Swallow, and House Wren that
typically winter in southern states along the Gulf Coast and in Mexico. As spring returns, these
species quickly move north to reoccupy their full breeding range (Lincoln et al. 1998). It has
been hypothesized that these migrants might be able to monitor the passing of cold fronts and
stay in tune with the weather on their breeding grounds. This would allow them to very
8

efficiently move northward as spring conditions improve (Butler 2003). The two maps in Figure
2.1 provide typical distributions for short distance migrants in North America.
Figure 2.1 – Year-round Distributions of Two Short-distance Migrants
Source: The Birds of North America Online (Cornell Lab of Ornithology 2007)
Long-distance migrants leave their breeding grounds far behind and fly hundreds or
thousands of kilometers to arrive on separate wintering (non-breeding) grounds. In North
America, this commonly means wintering in the Caribbean, Central America, or South America.
Several species travel well south of the equator and winter in locations such as southern Brazil
and Argentina (Lincoln et al. 1998). From a Northern Hemisphere perspective, the phrase
“wintering grounds/location” makes sense and has remained popular in many publications.
However, it should be noted that many wintering birds are actually enjoying summer in the
southern hemisphere.
9

The Call to Migrate
How does a Yellow-billed Cuckoo wintering in the sub-humid forests of Ecuador know
when it should return north to the Great Plains to breed? Genetics plays a major role in the
initiation of feather molt, premigratory fat deposition, migratory restlessness, and the timing and
direction of migration itself. These processes have been shown to be regulated extensively by
genetically based circadian (daily) and circannual (yearly) rhythms (Berthold 2001). These
biological clocks allow birds to operate amid fluctuations in environmental conditions. The
circannual rhythm is especially critical near the equator where environmental cues such as
photoperiod may be of limited use (Gwinner 1996).
While genetics provides the basis for timing of migration, environmental factors are also
important. It seems likely that genetic programs are flexible and allow for correcting behavior
based upon exogenous influences. For starters, it is now known that circannual rhythms are
routinely synchronized to photoperiod to ensure seasonal coordination (Berthold 2001). Some
long-distance migrants are particularly sensitive to photoperiod. These birds are disconnected
from conditions on their distant breeding grounds and must rely on their circannual rhythm,
which is fine-tuned by photoperiod, to time their long migrations (Butler 2003).
In addition, weather has also been shown to sometimes accelerate, delay, interrupt, or
redirect migratory movements. In day to day migratory movements, wind and precipitation have
the largest recognized influence (Berthold 2001). It is also important to recall that migration is
fundamentally about exploiting seasonally available resources. Food availability is often related
to temperature, which ensures that changes in weather and climate exert a considerable impact
on migration (Berthold 2001).
10

Adaptability
The timing, routes and destinations of bird migration have never been absolutely static.
Over time there have been substantial shifts, including several that were driven by Earth-Sun
orbital periodicities and related Pleistocene climatic variations. During the last 150,000 years,
there have been two ice ages that forced most birds to breed in areas near the equator. By their
very existence, extant bird species must have either adapted their migration strategies to survive
a colder, ice-dominated world or evolved in the interim (Coppack and Both 2003).
Substantial changes in migration routes have also been observed in shorter time periods.
Up until the early 1960’s, Blackcaps from central Europe wintered in the Mediterranean or
Africa. By 1961, however, it was noted that a small group flew northwest where they would take
a shorter route and arrive in the British Isles for winter. It is thought that both the increase in
winter bird feeding and milder winters have allowed this new winter strategy to succeed.
Thousands of Blackcaps now winter in the British Isles, while others continue to follow the
longer route to the Mediterranean. It is impressive how quickly this substantial change took
place, and provides evidence that pioneering populations have the potential to quickly pave new
migratory pathways (Berthold 2001).
Other research into the genetic basis of migration has estimated that for songbirds, the
genetic transformation from an almost pure migratory population to an almost pure resident
population would take approximately twenty-five generations or just forty years (Berthold 2001).
The reverse from a migrant to resident population is also possible. Migratory behavior appears to
be evolutionarily stable in birds, which means that it should not be lost in a population even in
the face of extreme selective pressure for populations to become resident (Berthold 2001). The
result in many species is a flexible genotype that allows for resident populations to become
11

mobile, and migrants to settle down depending upon environmental conditions. However, there
are still physiological and temporal limits to the rate of adaptation that may be tested by future
global change.
Phenology
Definition/History
The science of phenology is the “study of periodic biological events in the animal and
plant worlds as influenced by the environment, especially temperature changes driven by
weather and climate” (Schwartz 2003, 3). Typical phenological events range from budding trees
and blooming flowers to emerging insects and migrating birds. By noting the timing of these
often simple behaviors or events, it is possible to gain insight into more complex processes
(Schwartz 1998). Observation of these recurring cycles has even been likened to taking a
measure on the “pulse of life” (Bradley et al. 1999).
Evidence for recorded phenological observations go back to the 11th century BC in
China, and the longest continuous record is of cherry tree flowering in Japan since 705 AD
(Schwartz 2003). By comparison, recorded phenology is much more recent in Europe where the
oldest datasets reach back to the early 1700’s. By the 1850’s, recording phenological
observations appealed to a great number of scientists. Phenological interest was maintained for
the next century, and most developed countries had systems in place to coordinate the collection
of phenology records (Sparks and Menzel 2002).
An example of this trend was the North American bird migration phenology effort first
coordinated by Wells W. Cooke in 1882. While this study was originally designed for observers
in the Mississippi flyway, it enlarged to the entire United States and Canada when it was taken
over by the American Ornithologists’ Union in 1883. By the end of the decade phenology
12

observations were incorporated into the federal governments’ Division of Economic Ornithology
and then finally the Bureau of Biological Survey (The Survey 1935). Considering the time
period, the observer network was quite impressive. In 1889 alone, over 3,000 correspondents
sent in their first arrival records (Droege and Keller 2001).
After experiencing a period of popular appeal, interest in phenology faded around the
middle of the twentieth century. Submissions to the North American bird migration dataset
waned and collection was stopped entirely in 1970. In part this trend was fueled by the notion
among scientists that phenology was “a harmless pastime of natural historians” and not of
particular value to science (Sparks and Menzel 2002)
Growing Importance
In recent years, phenology has enjoyed a rapid resurgence thanks to interest in using
phenological methods and datasets to tackle critical research topics such as global modeling,
monitoring, and climate change (Schwartz 1999). These historical records are now considered to
be witnesses of global environmental effects, and are being mined for signs of ecosystem
response to change. In particular, many measures of phenology are regarded as sensitive to
changes in temperature, which makes them valuable in searches for regional and global climate
change impacts (Badeck et al. 2004).
There is now a renewed urgency to discover and preserve historic datasets. Substantial
data still exist in paper form and await organization and analysis. The hope is that these datasets
will provide clues to future changes (Sparks and Menzel 2002). In addition, new efforts are being
promoted to create regional and global phenological networks similar to existing meteorological
networks. These networks would tie in both surface and satellite measurements to improve our
understanding of global change (Schwartz 1999).
13

First Arrival Dates
A common measure of migration phenology in bird species is first arrival date (FAD).
For a particular observer, the FAD represents the day that the first individual of a species is
detected (visually or by song) after a seasonal absence. In Kansas, most of these dates are
recorded in February through May, which is a period when many species migrate to or through
the state after wintering to the south. However, it is important to note that FADs are not limited
to a particular season, and FADs can be recorded in any month to mark the return of birds that
utilize diverse migration strategies.
Over the last two centuries, many bird watchers and ornithologists have noted the
seasonal return of bird species. One famous example is the mid-March return of Cliff Swallows
to Mission San Juan Capistrano in southern California, which has been recorded since the 1700’s
(Roane 1995). Many of these historic migration records were preserved in journals, field
notebooks, calendars, or bird checklists, but for contemporary records this has largely shifted to
spreadsheets, birding software packages, email listserv communication, and online databases
such as Journey North and Cornell University’s eBird. Even still, many records of first arrival
have been lost, go unrecorded, or remain spread out in small datasets.
When using FADs in an analysis, there are several potential sources of error to consider.
Especially with long-term datasets, there may be changes in observer skill, equipment, or effort
that can alter arrival date record quality (Butler 2003). Particularly when data has been collected
by amateur bird watchers, there is a tendency for arrival dates to be recorded on weekends.
Weekend bias has been noted in several British first arrival datasets, but was not thought to
impact results in long-term datasets as long as the weekday/weekend activity pattern remained
consistent over time (Sparks 1999).
14

Also, by sampling only the first individual of a species to arrive, there are concerns that
FADs do not adequately represent the bulk of migration. Assuming that the arrival of a species
each year follows a predictable curve, such as a bell-shaped curve, FADs only represent the
leading edge of that curve and may not accurately predict the arrival of the rest of the population
(Mills 2005). It is also known that for most species, males arrive significantly earlier than
females and are thus the most likely gender to be represented in FAD dates (Francis and Cooke
1986). FADs are still very useful, but known issues caution against using FAD analysis to draw
firm conclusions about the entire migration of a species without further investigation.
Changes in bird population size can be another source of bias. One particular study of the
Red-backed Shrike in Europe found a strong relationship between earlier arrival dates and
increased population size. The study authors attributed this to both the increased statistical
chance of detecting a bird within a larger population, as well as the biological influence whereby
birds are thought to be individually more vocal as the population increases (Tryjanowski and
Sparks 2001). It should be noted that the Red-backed Shrike is a cryptic bird species and this bias
may not be as strong in species that are visible and/or vocal even when present in low densities.
While there are many potential concerns with FADs, these datasets remain extremely
useful in studying bird migration. No other measure of migration phenology is as commonly
collected across the globe, and there are often rich historical datasets available (Mills 2005).
Higher quality datasets that overcome some of these issues are limited to active bird banding
stations, or from unfortunate circumstances where birds are collected daily by collisions with
glass buildings or tower guide wires (MacMynowski and Root 2007; Morris et al. 2003). These
more complete data are uncommon, and are limited in terms of geographic and temporal
15

coverage. It will be valuable if researchers continue to learn the best ways to analyze and
interpret FADs.
Climate Change
Global/Hemispheric Trends
The current scientific consensus is that the climate is changing worldwide. An
Intergovernmental Panel on Climate Change (IPCC) report in 2007 indicated that, “Warming of
the climate system is unequivocal, as is now evident from observations of increases in global
average air and ocean temperatures, widespread melting of snow and ice, and rising global
average sea level.” The 2007 assessment pointed out a 0.74°C increase in global average
temperature over the previous one hundred years. The report also provided model results based
upon six emission scenarios, which indicate that 21st century warming is likely to be between 1.8
and 4.0°C (IPCC 2007).
Other investigations into this large-scale warming trend have produced two important
observations. The first involves the seasonality of the warming. Several studies have found that
Northern Hemisphere land areas are warming fastest in winter and spring (Easterling et al. 1997;
Schwartz et al. 2006). These studies suggest that the intensity of winter and arrival of a
biologically relevant spring might be changing in the Northern Hemisphere.
The second observation is that the rise in global temperatures has been impacted by
“average annual minimum temperatures increasing at twice the rate of maximum temperatures”
(Alward et al. 1999). An analysis of 1950-1993 nonurban temperature records found that March-
April-May minimum temperatures had increased at a rate of 2.26°C/century globally and
2.28°C/century in the Northern Hemisphere (Easterling et al. 1997). Continuation of this trend of
16

increased minimum temperatures is supported by the IPCC claim that “warmer and fewer cold
days and nights over most land areas” is “virtually certain” in the twenty-first century (IPCC
2007).
Regional Trends
Whereas global climate change statistics can be helpful in communicating the widespread
nature and general magnitude of the warming, it is essential to consider more detailed, regional
analyses. This is particularly important because not all areas are warming at the same rate, and in
fact some areas even show cooling or no trend at all (Hussell 2003; Marra et al. 2005). While
there has not been an extensive amount of literature published on temperature trends in the Great
Plains, the available literature does point toward warming.
The EPA issued a “Climate Change and Kansas” brochure in 1998 that stated that over
the last century, the temperature in Manhattan, Kansas, had warmed by 0.7°C (1.3°F). Then in
2000, the National Assessment Synthesis Team released a publication on climate change impacts
on the United States. This publication considered past and future trends for the Great Plains
mega-region, which included Kansas and portions of nine nearby states. The report concluded
that mean annual temperatures in the northern and central Great Plains had risen more than 1°C
(2°F) in the past century. It also indicated that both the Hadley and Canadian global climate
models project continued temperature rises throughout the Great Plains mega-region. The
greatest warming is predicted to occur in the winter and spring, where it would have great
potential to impact the onset of spring and the return of migratory birds (National Assessment
Synthesis Team 2000).
A series of graphics created by the NOAA Climate Prediction Center helps to visualize
recent temperature trends. In creating these maps, climate data were grouped into 102 climate
17

regions for the United States. Observations from 1941-1975 were used to determine a baseline
temperature for each region. Then using the data from 1976-2005, a best fit trend was calculated
and the resulting slopes were shown on a choropleth map. These maps are available for three
month periods as well as for the entire year. Figure 2.2 presents the map for March-April-May
spring temperatures, which indicates that the western states have warmed at a faster rate than the
east. While all three climate regions in Kansas have shown positive warming trends, the western
two-thirds of the state appears to have warmed faster than the eastern third.
Figure 2.2 – March-April-May Long-term United States Temperature Trends (°F/Decade)
Source: (Climate Prediction Center 2005)
18

Climate Change Impacts on Birds
As the impacts of climate change are felt around the globe, researchers have begun to
observe changes in birds. Studies from several continents now indicate that breeding dates,
species distributions, and migration dates are changing in some species.
Breeding Phenology
Several studies have looked for alterations in breeding phenology, specifically the onset
of egg-laying. In an analysis of 3,450 nest records from Tree Swallows across the northern
United States and Canada, a nine day advance in egg-laying date was observed between 1959
and 1991. This change was associated with an increase in mean April-June temperatures. Laying
dates were affected the strongest during the 1960’s and 1980’s, with less significant change
during the 1970s (Dunn and Winkler 1999).
The authors of the study proposed two potential mechanisms for the advancement of
breeding. First, aerial insects may be emerging earlier in the season, thereby speeding up the
accumulation of the reserves necessary for breeding. A second proposed mechanism is that the
warmer temperatures may have reduced the energy requirements of females prior to egg-laying.
With laying dates advancing over a wide study area, this study provides evidence that a large-
scale influence such as climate change is involved (Dunn and Winkler 1999).
A follow-up study looked at Tree Swallow egg laying dates from southern Ontario and
came to different conclusions. From 1969 to 2001, the Tree Swallows just to the north of Lake
Erie did not show significant differences in average dates of egg-laying among decades.
However, it was also found that the spring temperatures were not changing in this region over
the time period studied (Hussell 2003).
19

Another North American study looked at Mexican Jays in Arizona. Between 1971 and
1998, the mean date of egg-laying had advanced by 10.1 days. First nest building had also
advanced by a slightly larger total of 10.8 days. These trends were statistically compared to a
range of climate variables measured at the study area and found to be related to significant trends
toward monthly minimum temperature increases in March and April (Brown et al. 1999).
Research from other continents also reports on detection of change in the breeding dates
of some bird species. A study of nearly 75,000 nest records from the United Kingdom found that
between 1971 and 1995 there was a significant trend toward earlier laying dates for 20 species
(31%), with the average shift being 8.8 days (range 4-17). This group represented a wide cross
section of taxonomic groups and included both resident and migrant species. Only a single
species was found to be laying significantly later during this time period (Crick et al. 1997).
Shifts in Distribution
Significant shifts in the bird distributions have also been demonstrated by several studies.
One analysis from Great Britain found that between two time periods, 1968-1972 and 1988-
1991, the breeding distributions of more than fifty species had advanced northward. The average
movement was 18.9 km over the time span analyzed, or 0.95 km/year (Thomas and Lennon
1999).
A similar study was later conducted in the United States with U.S. Geological Survey
Breeding Bird Survey data. Comparisons were made between the observations for 1967-1971
and 1998-2001 for the central and eastern United States. After dividing the species into those
with southern and northern distributions, researchers looked for changes in range boundaries
between the two time periods. It was found that among the southern birds, nine of the twenty-
seven species had shifted significantly northward, and only two significantly southward. The
20

average advance of all southern birds was 2.35 km/year to the north. It was also noted that none
of the northern birds moved south during this time period (Hitch and Leberg 2007).
In addition, several attempts have been made to model potential range shifts given
predicated climate scenarios. Based upon a projection of a 2.5°C temperature increase by the end
of the 21st century, potential range boundaries shifted more than 500 km in African bird species,
and by more than 1,000 km in European bird species. Furthermore, the speed of these shifts was
compared to known range shifts that occurred during late Quaternary period. In all cases the
predicted changes were much greater than the changes evident in the fossil record. Thus, the
potential exists that some bird species would be unable to alter their ranges fast enough to keep
pace with rapid climate change (Huntley et al. 2006).
A similar study looked at potential distribution impacts of the next fifty years of climate
change on birds of the Great Plains and Rocky Mountains. Using a Genetic Algorithm for Rule-
set Production (GARP) model and both current and projected climate scenarios, it was found that
birds of the plains were more likely to be impacted than montane birds. For the nineteen
grassland species analyzed, suitable habitat moved from 0-400km and the area of this habitat was
reduced by a mode of thirty-five percent (Peterson 2003)
Migration Phenology
Migratory birds are involved in a series of arrivals and departures as they move between
breeding, stopover and winter habitats. Many researchers have scrutinized historic and recent
datasets to look for changes in the timing of these events. One of the most studied measures of
migration phenology is the spring FAD.
In Australia, an analysis of FADs for twenty-four species found that half were exhibiting
a significant trend toward early arrival since 1960. Only one species was found to be arriving
21

significantly later. At the same time, annual minimum and maximum temperatures across south-
east Australia were determined to be increasing at 0.13°C/decade and 0.17°C/decade
respectively.
Similarly, in the United Kingdom, a study of county arrival dates from 1966 to 1996
found that 54 of 56 species showed a trend towards earliness (22 were statistically significant).
Most of these species FADs were also negatively correlated with mean March-April
temperatures (Sparks 1999). Another British study also found an advance in arrival dates for 17
of 20 species over the last thirty years and correlated this with increasing temperatures in their
African wintering grounds (Cotton 2003).
Analysis of the arrival dates for ninety-six species collected in south-central Manitoba
from 1939 to 2001 indicated that more than a quarter of the species showed significant trends
toward earlier arrival, whereas only two percent showed a significant trend toward later arrival.
Approximately half of the total species showed a significant relationship between arrival date
and the mean temperature of their month of arrival (Murphy-Klassen et al. 2005).
In Colorado, American Robins have advanced their arrival at a high altitude field site by
fourteen days between 1981 and 1999. While spring temperatures have risen by 1.4°C during
this period, snowfall has also increased and resulted in no change to the date of first bare ground.
This raises the concern that if warmer springs are cuing the robins to return earlier, this signal
might become out of sync with food availability (Inouye et al. 2000).
Some research also indicates potentially uneven effects on birds with different migration
strategies. One study looked at bird arrivals from 1903-1950 as compared to 1951-1993. A
thirteen day advance in short-distance migrants was found, with only a four day advance in long-
distance migrants (Butler 2003). A second study looked at FADs for eight long-distance migrant
22

warblers. Seven of eight species were arriving in Fargo, ND, at the same time as forty years ago,
despite a measure of spring (degree days accumulated to 300; starting in February) that had
advanced in North Dakota by 8.6 days. The study suggests that arrival dates might be
constrained by endogenous factors in these long distance migrants or are being impacted by
uneven climate changes along the migration route (Strode 2003).
An intriguing study was conducted with detailed migration data collected from birds
killed after flying into the windows at McCormick Place in Chicago. It was found that short-
distance migrants are the most likely to be connected to climate conditions. By contrast, the
arrivals of seventy-five percent of long-distance migrants were correlated with variations in
North Atlantic oscillation (NAO). This suggests that short-distance migrants might be influenced
by regional conditions and long-distance migrants by continental-scale climate (MacMynowski
and Root 2007).
It is also necessary to consider a subset of migration phenology studies that have found
little or no evidence for changes in arrival dates. One of these studies is from Maine where
arrival dates from 1899-1911 were compared to 1994-1997 dates for eighty species. Nearly
sixty-four percent of the species showed no trend between the two time periods. Of the twenty-
nine species that did show a significant trend, twenty are actually arriving later now than at the
turn of the century (Wilson et al. 2000). This seems somewhat unexpected, but it is important to
note that this study did not provide any analysis of spring temperature trends in Maine. Based
upon a map of March-April-May trends from 1976 to 2005 from the Climate Prediction Center,
the two NOAA climate zones in Maine indicate a slight cooling in the north and no change in the
south (Fig. 2.2). This visual representation of Maine’s spring climate history over the past
century helps to explain this apparent anomaly.
23

A twenty year record of bird arrivals in northern Norway shows a similar pattern.
Analysis of data for 1980 to 2000 revealed no significant trends in arrival dates across thirty-one
bird species. This is consistent with the fact that spring temperatures have not shown a trend in
this area of northern Norway in recent decades (Barrett 2002).
The ultimate reason that birds would arrive on their breeding grounds earlier would be to
take advantage of similar shifts toward earlier emergence of food resources such as insects or
flowering plants (Both and Visser 2005). Some studies indicate that particularly among short-
distance migrants this might already be occurring (Cotton 2003). Other studies have shown that
long-distance migrants seem to be more constrained in their response to climate change (Butler
2003; Strode 2003). A major concern is whether advancing springs may impact the phenology of
food resources (e.g., insect hatching) to a greater degree than migrants can respond. The resulting
“phenological disjunction” could have potentially severe consequences for both adult
survivorship and breeding success (Crick 2004).
Birds in Kansas
According to the state bird checklist, 470 bird species have been observed in Kansas at
least once. Two of these, the Carolina Parakeet and Passenger Pigeon, went extinct in the
twentieth century (Kansas Ornithological Society 2007). Approximately 203 of the remaining
species are known to breed in the state, and a substantial number of these are migrants (Busby
and Zimmerman 2001, Zimmerman 1985).
Winter Locations
As a mid-latitude state in the middle of a large continent, Kansas experiences strong
seasonal differences in climate (Rosenberg 1986). A climate summary available from the High
24

Plains Regional Climate Center (2006) indicates that in Manhattan, Kansas, seasonal warmth is
greatest in July when average monthly maximum temperature reach 33.5°C (92.3°F). By
January, Manhattan has hit the other extreme and average monthly minimum temperatures have
dropped to -7.7°C (18.1°F).
Figure 2.3 – Estimated Winter Range for 45 Kansas Breeding Birds
Source: (Partners in Flight 2007)
25

Winter in Kansas is characterized by cold weather and long nights, which causes many
plant and insect species to enter dormancy or die. With these two major sources of food in short
supply, many birds migrate south to take advantage of more available food. A Partners in Flight
map (Fig. 2.3) provides an excellent way to visualize the preferred winter locations for a variety
of short-distance and long-distance migrants that breed in Kansas. While only showing the
winter locations for a subset of migratory birds, it indicates that Kansas birdlife has very strong
connections to locations such as central Texas, Florida and the Caribbean, Central America, and
both northern and central regions of South America.
Arrival of Migrants in Kansas
The idea of migration corridors, or flyways, became popular in the United States in the
mid-1900’s. The concept was largely based upon banding recoveries from ducks and geese that
were mapped by Fred Lincoln of the U.S. Bureau of Biological Survey. From his study, four
major flyways were named: Atlantic, Mississippi, Central, and Pacific; these names have been
used to denote official Fish and Wildlife Service administrative boundaries. While these
generalized pathways describe the migratory movement of some species, particularly waterfowl,
they are of limited use in describing the pathways used by other groups of birds (Lincoln et al.
1998).
It is clear that the general spring migration pattern in North American is a northward
movement of birds. This is guided in part by major north-south trending physical geographic
features such as the Rocky Mountains and the Mississippi River Valley (Gill 1994). However,
there is evidence that this overall pattern of south-north orientation needs altering when
considering local conditions. While very little has been published about the path of migratory
26

species through Kansas or nearby states, some general thoughts can be drawn from climate
patterns.
Previous studies have shown that birds such as American Robins and Canada Geese
roughly follow the progression of the 2°C mean daily temperature isotherm as they move north
each spring (Gill 1994). Spring temperatures in Kansas generally trend from warmest in the
southeast to coolest in the northwest. An example of March minimum temperature isotherms can
be seen from a map of WORLDCLIM data (Fig. 2.4). It makes sense to propose that birds
arriving in spring are likely to appear first in the warmest areas of the state (southeast) to take
advantage of opportunities to feed on emerging plants and insects.
The speed with which migrants move through Kansas also varies greatly by species and
the weather conditions for a particular year. Even small birds are capable of covering 240-400
km per day during migration (Lincoln et al. 1998). Given that Kansas is 340 km from south to
north, and 671 km from east to west (752 km diagonal), most birds could theoretically cover the
state in less than two days. However, many species rely on a series of stopover locations to feed
and refuel for the next leg of their journey. Observations reported to the Kansas bird watching
listserv (KSBIRD-L) suggest that some species make rapid progress through the state, while
others take several weeks to reach all expected locations.
27

Figure 2.4 – Average Minimum Temperature in March - Isotherms for Kansas (1950-2000)
Source: (Hijmans, Cameron, and Parra 2006)
As mentioned previously, bird banding has helped improve our understanding of bird
migration routes. Unfortunately, due to low recovery rates, maps for many non-game species are
either not available or reveal few patterns. For example, in bird banding from 1955-2004, 9,880
Dickcissels have been banded in the United States and only seven have been recovered or
sighted again. The same situation can be found with many other migratory species, with just 67
of 17,427 Eastern Kingbirds being recovered (USGS Patuxent 2004). It may take advances in
28

satellite transmitters that can be carried by small birds before we gain a detailed understanding of
how most migratory birds move through the state of Kansas.
Kansas Migration Phenology Publications
Over the past century, several published documents have summarized bird migration
phenology for portions of Kansas. One of the first was the History of the Birds of Kansas by
Colonel N.S. Goss in 1891. While Goss did not give exact migration dates, he described the
general time frame when each species was known to return. For example, he wrote “arrive last of
April to first of May” for the Baltimore Oriole and “arrive the first of May” for the Common
Nighthawk (Goss 1891). While not useful for quantitative comparisons to more recent records,
this resource provides a valuable snapshot of migration in Kansas more than a century ago.
The next notable attempt to capture bird migration data was undertaken by Wells
Woodbridge Cooke, a man referred to as the “Father of cooperative study of bird migration in
America” (Palmer 1917). Cooke was an employee of the U.S. Biological Survey for many years
and worked to summarize thousands of bird migration records. He published summaries of
average arrival dates by town in the Audubon Society’s bimonthly Bird-Lore publication. These
articles were released a few species per issue from 1903 until his death in the spring of 1916.
Cooke’s summaries of Kansas reports almost always included data from the town of Onaga in
Pottawatomie county. On occasion there were also summaries from the other northeast Kansas
towns of Manhattan and Ottawa.
The original source of the Onaga bird arrival reports was a self-trained naturalist and
farmer, Ferdinand F. Crevecoeur. Living in rural Pottawatomie County for sixty years, he kept
careful records of arriving birds, bird song, sunrise, weather, insects, plants, and more.
Crevecoeur submitted his bird migration records to the U.S. Biological Survey for at least 41
29

years (USDA 1931). A summary of Crevecoeur’s notes, including earliest and latest arrival dates
(but no average or median dates), was published in 1932 by Arthur Goodrich (Goodrich 1932).
Harry H. Hall taught at Kansas State Teachers College in Pittsburg. He spent eight years
studying the arrival and departure of birds in southeastern Kansas. He concentrated on eleven
southeast counties, but particular observational effort was placed on Crawford county. Hall’s
published findings provided average times of arrival and departure for many of the 208 species
and subspecies that he regularly observed (Hall 1935).
A study by R. F. Miller and Ivan L. Boyd was published in June of 1947. Unfortunately,
arrival dates were only recorded to the nearest week, which reduces the usefulness of this study
for detecting trends in migration arrival dates. The data represents “East-Central Kansas,” which
was described as “a strip of territory extending from Lake Quivira in Johnson County west to
Lake Kahola in Morris County and from Lawrence and Topeka southward to Emporia,
Williamsburg, and Richmond” (Miller and Boyd 1947).
A more recent study of bird migration phenology in Kansas included median dates of
arrival and departure for many common birds (Johnston 1965). Dr. Johnston indicated that the
phenological measures summarized in his paper were the result of FADs gathered from various
sources including his own Douglas county records, museum specimens, and records from six
other individuals. Using a membership list published in the 1955 Kansas Ornithological Society
(KOS) Bulletin, the cities of residence for five of the six contributors were found: Eunice Dingus
of Mound City (Linn county), L.B. Carson of Topeka (Shawnee county), Carl Holmes of Topeka
(Shawnee county), Elizabeth Cole of Shawnee (Johnson county), and Orville Rice of Topeka
(Shawnee county). Mary Louise Myers was not found in the KOS directory. Considering the
30

known geographic locations of the data that Johnston summarized, his median arrival dates are
considered to represent northeast Kansas.
The time period represented by his arrival records is not explicitly stated. All dates were
obviously collected no later than the spring of 1965 based upon the publication date. Museum
specimens would have likely covered a large range of potential dates from the late nineteenth
century up to 1965, with perhaps a bias toward the earlier dates when specimen collecting was
more common. It seems reasonable to assume that the arrival records of Johnston’s six
collaborators represent the 10-25 years prior to 1965 (about 1940-1965), but there is no direct
evidence to corroborate this estimation.
Since Johnston’s 1965 work, bird migration phenology has attracted much less attention.
A period of occurrence, which included the latest and earliest known presence dates, was
published in Thompson and Ely’s two-volume Birds In Kansas series, but a large-scale analysis
of mean or median arrival dates was beyond the scope of that book project. No additional
statewide or subregion analyses were located.
Literature Summary
Humans have long been fascinated with the phenomena of bird migration. Early
explanations were often incomplete and inaccurate, but more recent revelations have been made
possible through careful and dedicated repeat observation, banding, satellite transmitters, and
increased global observation. Phenology has also reemerged as an important science that is
capable of tracking and monitoring local and regional impacts from global change.
Globally, temperatures have risen and are projected to continue to rise in the future. As
ambient conditions change, effects have been noted across a range of ecosystems and trophic
levels. Evidence is mounting that migratory birds have already been impacted by the warmer
31

conditions and associated environmental changes such as earlier spring greenup (Schwartz
1998). Specifically, many studies from Europe, Australia, and North American indicate that
some bird species have already responded by breeding earlier, moving their ranges northward,
and arriving earlier in the spring (Butler 2003, Dunn and Winkler 1999, Hitch and Leberg 2007,
Hussell 2003, Sparks 1999).
Many migratory bird species fly to or pass through Kansas each spring. Several
publications published in or prior to 1965 provide insight into historic bird arrival dates.
However, no recent studies have compared these historic arrival dates to more recent
observations. This thesis will endeavor to fill part of this information gap.
32

CHAPTER 3 - Data and Methods
The truth about migration is that birds are conjured from the soft April air of a Gulf Coast sky. The blue is rolled up to make indigo buntings and cerulean warblers, the fog folds in on itself to birth gray catbirds and gnatcatchers, while the orange clouds at dusk give of themselves to create orioles....Once the sky is full to bursting with these new-made wonders, it lets them fall like snow on the land.
–Scott Weidensaul, 2001, Living on the Wind
Many studies of bird migration utilize first arrival dates (FADs) to track the start of
migration from year to year. To accomplish the goals of this project it was necessary to assemble
a substantial database of FADs. Records were initially collected with only general spatial and
temporal limits (central Great Plains; 1800’s through present). As thesis data collection
continued, a better understanding of available data sources developed. Guided by this improved
knowledge, two attainable analyses of FADs were identified. When combined with an analysis
of local spring climate trends, three primary objectives for this study were identified:
1) Develop a migration calendar of expected arrival dates for birds in northeast Kansas
based upon 1997-2007 data. Calculate median arrival dates and compare to the median
arrival dates published by Johnston in 1965.
2) Analyze FAD trends in southcentral Kansas from 1947 to 2007.
3) Examine available spring climate data for both northeast and southcentral Kansas.
Specifically, examine trends in minimum, maximum, and mean temperature over the last
century. Compare these findings to the bird arrival analyses.
33

Study Area
Originally the intent was to include the central Great Plains states of Nebraska, Kansas,
and Oklahoma. However, during early data gathering efforts it became clear that it would be
considerably more difficult to obtain records outside of Kansas. Personal connections within the
Kansas bird watching community made it much easier to locate individuals with useful
information, and ultimately to obtain their data for use in this study. As a result, the broad study
region for this project became the state of Kansas, including all 105 counties.
Even within Kansas it was clear that the timing of bird migration is not uniform across
the state. An accurate study of migration phenology needs to look at smaller subregions. As a
result, the state of Kansas was divided into six subregions based upon county lines: northeast
(NE), southeast (SE), northcentral (NC), southcentral (SC), northwest (NW), and southwest
(SW) (Fig. 3.1). While there was a tendency for the three southern regions to be slightly larger,
each subregion covers roughly the same area.
Time Period
Initial data searches were without regard for time period, which resulted in the collection
of records from the late 1800’s to the spring of 2007. As the search continued, it became
apparent that records older than ten years were significantly more difficult to obtain. It seems
likely that this is an indication that the late 1990’s was a period when bird watchers began to
utilize computers to keep track of their records. Older paper records sometimes exist, but they
are harder to find and require more resources to digitize.
34

Figure 3.1 – Six Subregions of Kansas
As a consequence of data availability, the focus narrowed to two regions, with some
variation in dates and approach. Northeast Kansas was included with a focus on 1997-2007. A
comparison with older arrival dates was then possible by utilizing median arrival dates published
by Johnston in 1965. For southcentral Kansas, the time period of interest was expanded to 1947-
2007. This was made possible by the availability of two datasets from Harvey county that began
in the 1940’s. The highest data density was between 1947-1967 and again from 1997-2007. The
existence of individual arrival records (as opposed to summary statistics) allowed for statistical
comparisons between these two separate time periods in southcentral Kansas. The other four
regions of Kansas were dropped from consideration since less data were available and the ability
to analyze change over time was limited.
Species
A critical step was the selection of a subset of migratory birds to consider in the analyses.
Thirty species native to Kansas were selected based upon two primary characteristics. The first
35

criterion was that these birds had to be short or long distance migrants that generally leave
Kansas in the fall/winter and return in the spring. Several partial migrants, such as the American
Robin and American Crow, were excluded because they continue to reside in Kansas in high
numbers throughout the winter.
The second criterion was that these species had to be widely distributed within Kansas.
More specifically, species had to occur regularly in at least two-thirds of the state in order to be
selected. In general, these thirty species also represent commonly observed species for which
many arrival dates have been recorded.
The one species that least fits the second criterion is the Common Poorwill. The poorwill
is a cryptic species that occurs in western and central Kansas, and it is locally common in the
Flint Hills (Thompson and Ely 1989). Because of its effective camouflage and tendency to
vocalize in the late evening or early morning, records from this species are sparse. Still, as the
only bird in the world that is known to hibernate, it was included in the study.
A list of the thirty selected migratory species is shown in Table 3.1. Throughout this
study the birds are referred to by their common names as standardized in the Seventh Edition
American Ornithologists’ Union Check-list of North American Birds (American Ornithologists’
Union 1998). This table also includes a column indicating whether each species is considered to
be a short or long distance migrant. It should be noted that migratory strategies are not absolute
and populations of some species exhibit intermediate or mixed strategies. A best estimate of a
species dominate migration strategy was selected based upon a previous North American
migration phenology study (Butler 2003) as well as maps available from the Birds of North
America Online (Cornell Lab of Ornithology 2007).
36

Table 3.1 – Migratory Bird Species Used in his Study
Common Name Scientific Name General Migration Strategy
Baltimore Oriole Icterus galbula Long-distance Barn Swallow Hirundo rustica Long-distance Bell's Vireo Vireo bellii Short-distance Blue-gray Gnatcatcher Polioptilla caerulea Short-distance Brown Thrasher Toxostoma rufum Short-distance Chimney Swift Chaetura pelagica Long-distance Chipping Sparrow Spizella passerina Short-distance Common Nighthawk Chordeiles minor Long-distance Common Poorwill Phalaenoptilus nuttallii Short-distance Common Yellowthroat Geothlypis trichas Short-distance Dickcissel Spiza americana Long-distance Eastern Kingbird Tyrannus tyrannus Long-distance Eastern Phoebe Sayornis phoebe Short-distance Field Sparrow Spizella pusilla Short-distance Grasshopper Sparrow Ammodramus savannarum Short-distance Gray Catbird Dumetella carolinensis Short-distance Great Crested Flycatcher Myiarchus crinitus Short-distance House Wren Troglodytes aedon Short-distance Indigo Bunting Passerina cyanea Long-distance Orange-crowned Warbler Vermivora celata Short-distance Purple Martin Progne subis Long-distance Rose-breasted Grosbeak Pheucticus ludovicianus Long-distance Ruby-throated Hummingbird Archilochus colubris Long-distance Tree Swallow Tachycineta bicolor Short-distance Turkey Vulture Cathartes aura Short-distance Upland Sandpiper Bartramia longicauda Long-distance Warbling Vireo Vireo gilvus Long-distance Western Kingbird Tyrannus verticalis Short-distance Yellow Warbler Dendroica petechia Long-distance Yellow-billed Cuckoo Coccyzus americanus Long-distance
Common and scientific names are based upon the American Ornithologists’ Union Check-list of North American Birds, Seventh Edition (American Ornithologists’ Union 1998)
37
First Arrival Database
Database Design
Collected FADs were initially stored in a Microsoft Excel spreadsheet. However, it
quickly became apparent that a more robust data storage solution was required. Excel’s date
format does not store dates prior to January 1, 1900 and spreadsheets have limited querying
capacity. The solution was to enter the records into a Microsoft Access Database. This software
choice made data import very efficient and allowed subsets of data to be queried easily.
The database includes two separate, but related, tables. The main table is
‘PhenologyData.’ It holds all the arrival records. A secondary table named ‘Birds’ holds
information on each of the bird species that is stored in the database. When a record is added to
‘PhenologyData’, the user is limited to selecting a bird species that is found in the related ‘Birds’
table. This relational database design was useful in that updates to the ‘Birds’ table are
immediately available to the ‘PhenologyDates’ table, allowing for powerful querying and fewer
errors on data entry.
The first arrival database was designed to record as much detail as possible for each
sighting. Realizing that not all records would have detailed location information, a minimum
threshold was established that required the county of each sighting. Any arrival date for which
the county was not available, or discernable from supporting information, was excluded from the
database. Other required fields were the bird species observed, arrival date, and a note on the
source of the data. The name of the observer was not required, but it was recorded when
available. There were several optional fields that captured more detailed information, such as
latitude and longitude, when known. This database was designed for long-term use, and will be
provided to the Kansas Ornithological Society for updating and safe-keeping.
38

Contributors
In 1965, Johnston relied on a network of accomplished bird watchers in northeast Kansas
to support his study. Similarly, this investigation relied upon the observations of many of the
most experienced birders in Kansas. Dr. Max Thompson is a former professor of biology at
Southwestern College, coauthor of the two-volume Birds in Kansas book series, and current
president of the Kansas Ornithological Society (KOS). For several years Thompson has
maintained a database that includes breeding records, early arrivals dates, and late departure
dates for most birds in Kansas. He was able to provide exported report text files for twenty-six
species. Each file was reviewed manually to extract all records that represented arrival dates.
Pete Janzen, of Wichita, is another Kansas bird watcher who had an extensive collection
of bird sightings with excellent coverage from the early 1980’s to 2007 and sporadic
observations back to 1970. After each birding trip, Janzen records the locations that he visited
and all species that were seen. Using a series of formulas in Excel it was possible to extract the
first observation of each species for each year. These FADs were then placed into the growing
Access database.
Janzen also provided a second collection of observations that he obtained while writing
his book The Birds of Sedgwick County and Cheney Reservoir (Janzen 2007). Most of these
arrival records were from new observers, but some of Janzen’s own records were also included.
To prevent duplicates, these dates were reviewed manually before being imported into the
Access database.
Finally, Janzen also provided contact information for a long-time Kansas resident and
bird-watcher named Dr. Dwight Platt. Platt is a former biology professor at Bethel College who
lives in Harvey County. Beyond a few breaks for college and time spent in India, Platt has lived
39

and noted bird arrivals on the same several acres of property since the 1940s (personal
communication, 29 March 2007). The arrival dataset that he provided spans forty-three of the
years between 1947 and 2007. Platt also had calendars in his possession that were recorded by
Edna Ruth and her two sisters. The Ruth sisters lived together in Harvey County and recorded
birds seen in their yard and on trips to nearby locations from 1942 to 1970.
Others in southcentral Kansas also had helpful bird arrival records. Rob Penner works for
The Nature Conservancy as the Central Kansas Project Director. He is located at Cheyenne
Bottoms in Barton County and was able to provide his arrival notes from 1997-2006. Leon Hicks
had 2004-2007 records from Sedgwick, Sumner, and Cowley Counties. Gregg Frieson was able
to email sporadic records from the last eleven years in Harvey County. Additionally, Scott
Seltman provided a valuable set of arrival records spanning 1976-2007 from Pawnee and other
Kansas counties. Seltman is a farmer, which helps to ensure that he is outdoors in good habitat
every spring (personal communication, 12 March 2007).
In Riley County, Tom Shane was a graduate student in Biology at Kansas State
University in the mid 1960’s. Working under Dr. John Zimmerman, Tom went on many birding
trips and kept checklists which he photocopied and sent for use in this study. These checklists
were manually reviewed and FADs for each species were extracted. Some of Dr. John
Zimmerman’s own Konza Prairie Biological Station observations from the 1980’s were also
obtained from the Konza Prairie LTER website as text files. Each file was parsed for useful first
arrival records.
Dan Mulhern had recent Riley County records from 1997-2007. In addition, Dr. Lowell
Johnson, who is retired from the Department of Plant Pathology at K-State is another Riley
40

County birder. He provided a rather extensive list of first arrival dates for Riley and
Pottawatomie Counties from 1980 to 2007.
Nearby in Geary County, extension agent Chuck Otte has kept good records since the late
1980’s. He provided a copy of his 1989-2007 records via email. Others in northeast Kansas also
had recent records. Tom Parker provided 2001-2007 records from Marshall County, Dan Gish
provided 2001-2007 records from Shawnee County, Mark Land provided 1997-2007 records
from Johnson County, and Matt Gearheart provided 1997-2007 records from Johnson County
and several other counties from across the state. All observers who contributed twenty-five or
more records are recorded in Table 3.2.
Table 3.2 – Summary of Observers Represented in FAD Database (with >25 records)
Observer FADs Dates (Not Always Continuous) Primary County
Dwight Platt 731 1947-2007 Harvey Edna Ruth 673 1942-1970 Harvey Pete Janzen 582 1969-2007 Sedgwick Chuck Otte 500 1989-2007 Geary Lowell Johnson 490 1980-2007 Riley Scott Seltman 413 1976-2007 Pawnee Mark Land 279 1998-2007 Johnson Matt Gearheart 249 1997-2007 Johnson Dan Gish 186 2001-2007 Shawnee Thomas Shane 182 1964-2007 Geary Rob Penner 152 1996-2006 Barton Tom Parker 141 2000-2007 Marshall Leon Hicks 96 2004-2007 Sedgwick John Zimmerman 80 1981-1983 Riley Gregg Friesen 78 1988-2007 Harvey Judd Patterson 74 2003-2007 Riley Steve Kingwood 49 1978-1984 Sedgwick Robert J. Antonio 38 1998-2007 Douglas Dan Mulhern 38 1997-2007 Riley Terry Mannell 32 2005-2007 Ellis Frederika F. Hubbard 26 1927-1953 Franklin Brett Sandercock 26 2005-2007 Riley
41

Arrival records were also sought from sources other than individual bird watchers. The
oldest records from the late 1800s to early 1900s were found in archived microfilm versions of
the National Audubon Society’s Bird Lore publication. This resource was not completely mined
for arrival dates after determining that it could not provide a sufficient number of arrival records
from the early twentieth century for a statistically sound analysis.
On advice from Rob Penner, a substantial arrival dataset maintained by Kansas
Department of Wildlife and Parks (KDWP) staff at Cheyenne Bottoms was located. A letter of
request was sent to field supervisor, Karl Grover. Grover provided a spreadsheet with 1976-2006
records for many species. These dates represented the collective observations of all staff at
Cheyenne Bottoms.
Many states also have an email listserv that is used by the local bird watching
community. KSBIRD was formed in 1996 to discuss birds and their habitats in Kansas, and had
490 subscribers as of August 1, 2007 (L-Soft 2007). Several hundred FADs were extracted from
emails that were sent in during the spring of 2007. An additional archive of over 31,700
messages from prior years was also available. It was not feasible to read all messages in order to
pull out relevant observations, so only messages containing the keywords “FAD” (3), “FOS”
(194), and “arrival” (373) were mined for arrival dates. While the abbreviation FAD is
commonly used in scientific literature, the birdwatchers of Kansas often preferred to use FOS
(First of Season) to denote the arrival date for a particular species. “First” was determined to be
too generic as a search term after it was located in 7,029 messages.
Several websites that track the migration of individual species were also used. Journey
North is sponsored by the Annenberg Foundation and is a portal specifically designed for K-12
42

teachers and students to study and track wildlife migration and seasonal change. The data archive
at Journey North provided Ruby-throated Hummingbird FADs for several locations in Kansas
from 1998-2007, Barn Swallow arrival dates from 2001-2007, and Baltimore Oriole arrival dates
from 1997-2007 (Journey North 2007).
Other species-specific arrival datasets were also available online. The Driftwood Wildlife
Association sponsors ChimneySwifts.org, which solicits and records arrival dates during
Chimney Swift migration through the United States. A few records from Kansas for the years
1999 to 2007 were obtained from their website (Driftwood Wildlife Association 2007).
Similarly, the Purple Martin Conservation Association records arrival dates through its Scout
Arrival Study. Several hundred arrival records for Kansas from the 1998-2007 time period were
available (Purple Martin Conservation Association 2007).
A leader in websites designed to capture data from observers across the country is eBird,
which is run by the Cornell Lab of Ornithology. The popularity of this site is growing and it is
gradually being utilized by more birders to archive bird trip reports. A web interface is used to
input bird sightings, and a series of charts and graphs allow for data exploration. Unfortunately,
exported data was summarized by the week of occurrence. Without a way to obtain records with
a specific date of observation, this resource was not useful for this project.
Consistency Checks
After combining many separate data sources, there were several issues that needed to be
resolved. Sometimes records that were missing the county of observation included more specific
location information such as the name of a lake or wildlife refuge. After querying for these blank
county records, the place names were input into Google Earth in order to locate each site and
associate it with the proper county.
43

The second issue to be corrected involved the names of the observers. The observer name
associated with each record came from sources such as online databases and email signatures.
This resulted in a variety of spellings, abbreviations, and titles. Middle initials were used
whenever possible and social and professional titles were removed. When more than one
observer was noted for a particular arrival date, the two names were sorted alphabetically by last
name (and then first name) and separated by a semicolon. The purpose of this standardization
was to make the database more valuable as a long-term migration phenology reference, and to
simplify the process of finding duplicate records.
The third major database issue was the potential for duplicate records. Duplicates were
especially likely from individuals who provided their personal records, and who might have also
reported their data to one or more online resources. The Microsoft Access Find Duplicate Record
Query Wizard was used to search for records with the same species, observation date, and
county. Then the observer and source fields were used as supplemental information to make a
decision on whether one of the records should be deleted. When choosing between two records
to delete, the record with the least information was removed. Over two hundred duplicates were
removed using this process.
Finally, some arrival observations were significantly later than all other dates for a
particular species. In these cases it was clear that the species had arrived much earlier but was
not detected for several weeks due to busy schedules, vacations, or other causes of insufficient
observer effort. In several extreme cases these outlier dates were removed from the database. In
situations where it was not clear whether the date was accurate or not, the date was retained in
the database. The goal was to error on the side of caution and to allow future researchers full
access to potentially useful data. This study also relied upon the use of the carefully selected
44

statistical measures, such as the median first arrival date, which is less sensitive to outliers than
the mean.
Analysis of FADs
Northeast Kansas
The first step in analyzing the 1997-2007 arrival dates in northeast Kansas was to design
a query to pull the relevant data from the table of arrival records. This was done in the Microsoft
Access Query Design View with both the ‘PhenologyDates’ and ‘Birds’ tables active. The query
had several parameters that are each listed and explained in Table 3.3:
Table 3.3 – Query for Northeast Kansas FADs
Field Value Explanation PhenologyDates.DateObserved >=#1/1/1997# And <=#12/31/2007# Limited temporal
coverage to dates from 1997-2007
PhenologyDates.DateType "Spring Arrival" Only records marked as spring arrivals; excluded fall arrivals
PhenologyDates.County "Nemaha" Or "Brown" Or "Doniphan" Or "Atchison" Or "Jefferson" Or "Leavenworth" Or "Wyandotte" Or "Johnson" Or "Miami" Or "Douglas" Or "Shawnee" Or "Osage" Or "Wabaunsee" Or "Jackson" Or "Geary" Or "Riley" Or "Pottawatomie" Or "Marshall" Or "Morris" Or "Franklin"
Limited the geographic extent to the 20 counties of NE Kansas (Fig. 3.1)
PhenologyDates.State "Kansas" Ensured that records were from Kansas
PhenologyDates.DayOfYear >=32 And <152 Only arrival dates from Feb, Mar, Apr, or May; earlier dates were wintering individuals and later dates were from insufficient effort
Birds.ThesisSpecies Yes Returned only the 30 sp. selected for analysis
45

The returned DayOfYear field comes from the SQL database programming language
‘dayYear’ function that converts a date to an integer value from 0 to 366 (e.g. January 11, 2007 =
11; March 11, 2007 = 70; March 11, 2004 [leap year] = 71). While this is sometimes referred to
as the Julian Date, it is more correctly termed the day-of-year or ordinal date. Using the day-of-
year removes the influence that leap years have on calendar dates.
Despite the correction for leap years, the day-of-year does not remove all year to year
variability. Our calendar system relies on an average year length of 365.25 days, while the vernal
equinox year is roughly 365.2422 days. Over a century, the equinox arrives approximately 0.78
days earlier on the calendar than in the physical world. This is usually reset each century when a
leap year is skipped. Long term studies that ignore this issue may be biased by as much as 10
percent (Hussell 2003).
For the highest degree of precision in long term studies, bird arrival dates should be
converted into a measure of hours before/after the vernal equinox. However, to make this effort
worthwhile, the arrival dates themselves would need to include the hour of the observation. Since
dates with this level of precision are extremely rare, most studies choose to ignore differences in
photoperiod and the current calendar system. This study followed the precedent established in
published literature and used the day-of-year for comparisons.
This research also relies upon an assumption regarding how FADs are expected to change
over time. Assuming a bell-shaped curve of bird arrival dates for a species, this study assumes
that the entire distribution would shift toward earlier or later arrivals. This assumption expects
that the distribution for a particular species would not exhibit significantly altered skewness,
kurtosis, or range over time.
46

After running the query to extract 1997-2007 records for northeast Kansas, the results
were copied into Microsoft Excel. For each species, the Excel functions ‘Median’, ‘Average’
(Mean), and ‘StdDev’ were used to calculate summary statistics. It should be noted that
throughout published scientific phenology literature it is common to refer to the median of a set
of first arrival dates as the median arrival date. The median arrival dates in this paper follow that
precedent and should not be mistaken to represent the date that the median individual of a bird
population passes through a location, a value that is exceedingly difficult to estimate.
For the northeast Kansas data, a typical arrival range was also calculated by adding and
subtracting the standard deviation from the calculated mean arrival date. Both the median date
and the typical arrival range were then converted from day-of-year to a calendar date for a non-
leap year. All of these data were recorded in a table and subsequently compared to the data
published by Johnston in 1965.
Southcentral Kansas
Similar to the extraction of relevant records for northeast Kansas, a query was designed
to pull all 1947-2007 records from southcentral Kansas. Details of this query are explained in
Table 3.4.
After running the query, these dates were copied into Microsoft Excel. The next step was
to compare the earliest arrival dates to a more recent set of arrival dates. Originally two eleven-
year periods were considered, with 1947-1957 serving as the early set and 1997-2007 as the
recent set. However, the sample size of the earlier set was too small for meaningful statistical
analyses. As a result, the early period was expanded to include 1947-1967. There were no sample
size concerns for the recent 1997-2007 time period.
47

Table 3.4 – Query for Southcentral Kansas FADs
Field Value Explanation PhenologyDates.DateObserved >=#1/1/1947# And <=#12/31/2007# Limited temporal
coverage to dates from 1997-2007
PhenologyDates.DateType "Spring Arrival" Limited the records to those marked as spring arrivals; excluded fall arrivals
PhenologyDates.County "Rush" Or "Pawnee" Or "Edwards" Or "Kiowa" Or "Comanche" Or "Barton" Or "Stafford" Or "Pratt" Or "Barber" Or "Rice" Or "Reno" Or "Kingman" Or "Harper" Or "McPherson" Or "Harvey" Or "Sedgwick" Or "Sumner" Or "Marion"
Limited the geographic extent to the 18 counties of SC Kansas (Fig. 3.1)
PhenologyDates.State "Kansas" Ensured that records were from Kansas
PhenologyDates.DayOfYear >=32 And <152 Only arrival dates from Feb, Mar, Apr, or May; earlier dates were wintering individuals and later dates were from insufficient effort
Birds.ThesisSpecies Yes This returned on the thirty species that were selected for final analysis.
The 1947-1967 arrival dates were compared to the 1997-2007 arrival dates with the
Mann-Whitney U test statistic. This comparison of means between these two independent
samples was selected over the t-test because of non-normal first arrival date distributions. The
distributions for many species did not improve even after several attempted data transformations.
Despite its status as a non-parametric statistical test, the U test still provides a powerful method
to see if arrival dates have undergone statistically significant shifts between 1947-1967 and
1997-2007.
48

Weekend Bias
The data for each analyzed time period were also checked for a weekend bias. This data
bias occurs when observational effort increases on Saturday and Sunday and is lower on
weekdays. With completely random effort and a sufficiently large pool of arrival dates, the
expected percentage of weekend observations would be 28.6 percent (two-sevenths).
A simple method for detecting this bias is to divide the number of weekend observations
by the total number of observations to see how closely it matches the expected percentage. A
more statistically rigorous approach makes use of a Chi-Square test. A large Chi-Square value
indicates that one or more of the days differs from expected frequencies. This test does not
indicate which day deviates from the expected frequency, but this can usually be determined by
visually inspecting the data in a simple form such as a bar graph.
Analysis of Kansas Spring Climate Data
In order to investigate regional climate trends, temperature data were downloaded from
the United States Historical Climatology Network (USHCN) website. The USHCN is maintained
by the National Climatic Data Center (NCDC) and the Carbon Dioxide Information and Analysis
Center (CDIAC) of Oak Ridge National Laboratory. It consists of 1,221 stations within the lower
forty-eight contiguous states and is described as a “high-quality, moderate-sized dataset of
monthly averaged maximum, minimum, and mean temperature and total monthly precipitation.”
The network stations were selected carefully based upon criteria such as length of period of
record, percent missing data, and spatial coverage. The USHCN dataset is intended “to assist in
the detection of regional climate change” (Williams et al. 2007).
49

Version two of the USHCN dataset was released in late July 2007 and provides monthly
temperature records for thirty-one stations within Kansas. Most of these stations have mean,
maximum, and minimum monthly temperature records from the late 1800’s up to 2005. In the
course of being prepared for the USHCN dataset, these data have been adjusted for a variety of
factors including outliers, missing observations, instrumentation changes, and urban heat island
effects (Williams et al. 2007).
In Kansas, early migrants such as the Turkey Vulture and Field Sparrow start arriving in
February, with the entire suite of breeding species having returned by mid-May. As a result, the
time period from February-May was chosen for climate trend analysis. This four month time
period was considered to be the biologically relevant spring for migrant birds in Kansas. While
this matches the definition used in some studies (Butler 2003; Murphy-Klassen et al. 2005), it
should be noted that other North American studies have chosen to consider spring climate trends
only from March-May (MacMynowski and Root 2007) or even April-June (Dunn and Winkler
1999).
Urban heat-adjusted mean, maximum, and minimum temperature files were downloaded
from the USHCN website. These files were obtained in a comma-delimited format that was
opened in Microsoft Excel. After sorting, the values for February, March, April, and May were
copied to a separate worksheet. At this point it was possible to calculate a February-May average
for mean, maximum, and minimum temperatures for each year from 1895 to 2005. Throughout
these calculations, the climate data was kept in the dataset’s native unit of Fahrenheit (°F). All
final tables include a conversion that also shows the metric equivalent in Celsius (°C).
This procedure was repeated for all eight locations within northeast Kansas that were
represented in the USHCN database: Atchinson, Eskridge, Horton, Lawrence, Leavenworth,
50

Manhattan, Olathe, and Ottawa (Table 3.5). Once the data had been organized for all locations, a
final summary average across all eight northeast Kansas was computed for mean, maximum, and
average temperatures.
Table 3.5 – Period of Record for Northeast Kansas USHCN Stations
Station Location Period of Record Atchison 1895 - 2005 Eskridge 1897 - 2005 Horton 1895 - 2005 Lawrence 1895 - 2005 Leavenworth 1902 - 2005 Manhattan 1895 - 2005 Olathe 1895 - 2005 Ottawa 1895 - 2005
After summarization, the data from each station and the overall northeast Kansas
averages were input into the statistical package SPSS v12.0. SPSS linear regression analysis was
then completed with temperatures input as dependent variables, and year as the independent
variable in each case. Both slopes and significance values (p-values) were recorded for each
regression line.
A similar analysis of monthly mean, maximum, and minimum temperature was
completed for the five USHCN stations within southcentral Kansas: Anthony, Coldwater,
Larned, McPherson, and Medicine Lodge (Table 3.6). February through May temperature trends
were organized by station and then an average for all southcentral locations was calculated.
Individual station data and the overall southcentral averages were then input into SPSS. Linear
regression analyses were completed and slopes and significance values were once again
recorded.
51

Table 3.6 – Period of Record for Southcentral Kansas USHCN Stations
Station Location Period of Record Anthony 1906 - 2005 Coldwater 1903 – 2005 Larned 1895 - 2005 McPherson 1895 - 2005 Medicine Lodge 1895 - 2005
52

CHAPTER 4 - Results and Discussion
There is symbolic as well as actual beauty in the migration of the birds, the ebb and flow of the tides, the folded bud ready for the spring. There is something infinitely healing in the repeated refrains of nature – the assurance that dawn comes after night and spring after winter.
–Rachel Carson, 1955, The Edge of the Sea
FAD Database
Even before its use in analyses, the compiled database of first arrival records represents a
significant resource and valuable product of this study. In total, 6,053 first arrival dates were
collected for the thirty study species. An additional 866 records from nineteen other species are
also located and included.
While these records are from ninety Kansas counties, a majority represent locations in
northeast and southcentral Kansas (Table 4.1; Fig. 4.1). Temporal coverage ranges from April 4,
1882, to June 9, 2007, with approximately 60 percent of the records coming from the 1997-2007
time period (Fig. 4.2). Figure 4.3 focuses on the temporal distribution of arrival dates prior to
1997, which highlights that few records were available prior to 1940. This database likely
represents the most complete record of first arrival dates assembled for birds within the state of
Kansas.
53

Table 4.1 – Summary of Final Database Contents by Region of Kansas
Region Records Species Represented Region Counties Represented
Northeast 2,626 100% (30 of 30) 100% (20 of 20) Southeast 535 100% (30 of 30) 100% (19 of 19) Northcentral 128 93% (28 of 30) 76% (13 of 17) Southcentral 2,637 100% (30 of 30) 100% (18 of 18) Northwest 25 43% (13 of 30) 42% (5 of 12) Southwest 102 83% (25 of 30) 58% (11 of 19)
Figure 4.1 – Spatial Distribution (by County) of Collected Arrival Records in Kansas
Dark lines represent subregion boundaries
54

Figure 4.2 – Temporal Distribution of Collected Arrival Records in Kansas (1882-2007)
0
100
200
300
400
500
600
700
1880 1890 1900 1910 1920 1930 1940 1950 1960 1970 1980 1990 2000
Year
n
Figure 4.3 – Temporal Distribution of Collected Arrival Records in Kansas (1882-1996)
0
25
50
75
100
125
150
1880 1890 1900 1910 1920 1930 1940 1950 1960 1970 1980 1990
Year
n
55
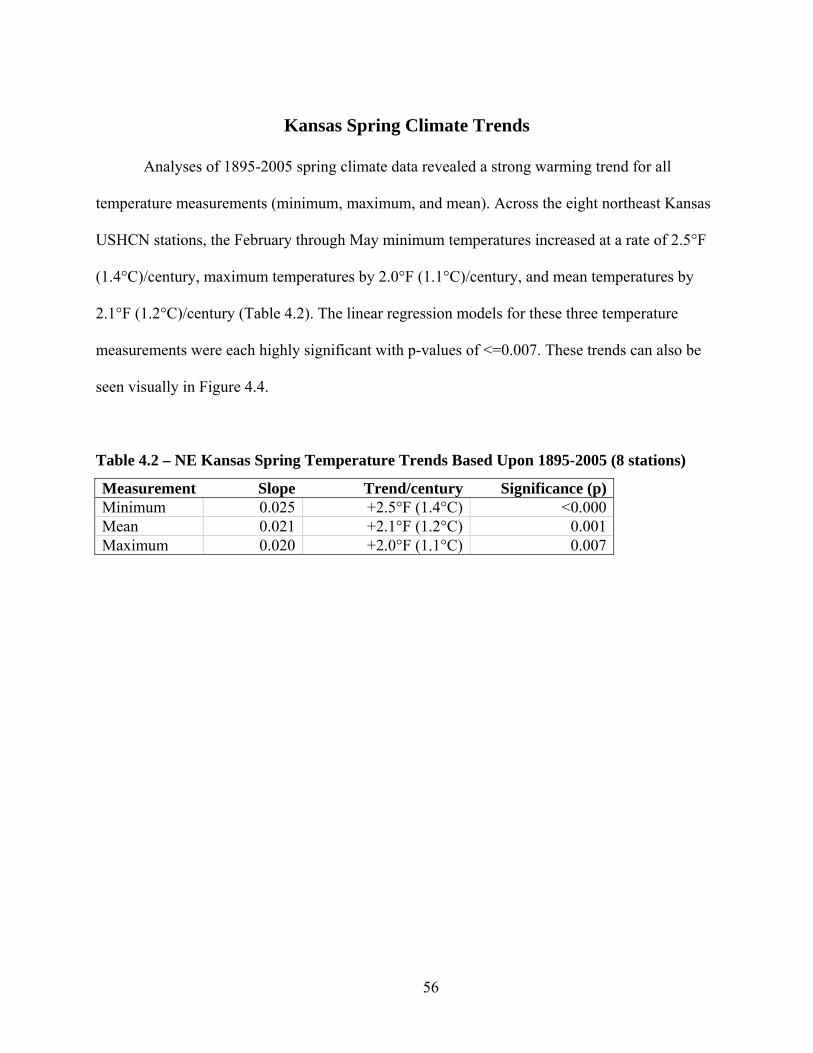
Kansas Spring Climate Trends
Analyses of 1895-2005 spring climate data revealed a strong warming trend for all
temperature measurements (minimum, maximum, and mean). Across the eight northeast Kansas
USHCN stations, the February through May minimum temperatures increased at a rate of 2.5°F
(1.4°C)/century, maximum temperatures by 2.0°F (1.1°C)/century, and mean temperatures by
2.1°F (1.2°C)/century (Table 4.2). The linear regression models for these three temperature
measurements were each highly significant with p-values of <=0.007. These trends can also be
seen visually in Figure 4.4.
Table 4.2 – NE Kansas Spring Temperature Trends Based Upon 1895-2005 (8 stations)
Measurement Slope Trend/century Significance (p) Minimum 0.025 +2.5°F (1.4°C) <0.000 Mean 0.021 +2.1°F (1.2°C) 0.001 Maximum 0.020 +2.0°F (1.1°C) 0.007
56

Figure 4.4 – Northeast Kansas Spring Temperatures Trends
y = 0.0247x + 35.397
y = 0.0203x + 58.635
y = 0.0211x + 47.103
30
35
40
45
50
55
60
65
70
1895 1910 1925 1940 1955 1970 1985 2000
Tem
pera
ture
(°F)
Mean Maximum Minimum
Climate trends from the five southcentral Kansas weather stations were similar. February
through May minimum temperatures increased at a rate of 2.6°F (1.4°C)/century and mean
temperatures by 1.8°F (1.0°C)/century (Table 4.3). The results for these two measures were both
highly significant, with calculated p-values of <=0.003. However, the maximum temperature
trend of 1.0°F (0.6°C) had a p-value of 0.222 and was not considered statistically significant.
Figure 4.5 provides a line graph of these temperature measurements over time.
57

Table 4.3 – SC Kansas Spring Temperature Trends Based Upon 1895-2005 (5 stations)
Measurement Slope Trend/century Significance (p) Minimum 0.026 +2.6°F (1.4°C) <0.000 Mean 0.018 +1.8°F (1.0°C) 0.003 Maximum 0.010 +1.0°F (0.6°C) 0.222
Figure 4.5 – Southcentral Kansas Spring Temperatures Trends
y = 0.0258x + 35.227
y = 0.0101x + 62.61
y = 0.0183x + 48.857
30
35
40
45
50
55
60
65
70
75
1895 1910 1925 1940 1955 1970 1985 2000
Tem
pera
ture
(°F)
Mean Maximum Minimum
In southcentral Kansas, trends based upon the shorter time period from 1947 to 2005
were also calculated to make a more direct comparison to the analyzed arrival dates. Results
showed a general increase in the positive slopes of the linear regression lines, but none quite met
the p≤0.05 requirement commonly used for statistical significance. However, both minimum and
58

mean temperature were significant at the p≤0.10 level, with trends of 2.3°F (1.3°C) and 2.8°F
(1.6°C)/century, respectively (Table 4.4). Many climate datasets from the Great Plains are
characterized by variability between years, which can hinder trend detection over short time
periods (Ojima and Lackett 2002). It seems likely that this was a factor in the discovery that
warming over the past 111 years was more significant than the trends seen in the last 59 years.
Table 4.4 – SC Kansas Spring Temperature Trends Based Upon 1947-2005 (5 stations)
Measurement Slope Trend/century Significance (p) Minimum 0.023 +2.3°F (1.3°C) 0.083 Mean 0.028 +2.8°F (1.6°C) 0.098 Maximum 0.027 +2.7°F (1.5°C) 0.240
Beyond the spring average, regression analyses for each month were performed to
explore the timing of spring warming from 1895-2005. In northeast Kansas, minimum
temperatures warmed the fastest in February, with a statistically significant increase of 4.5°F
(2.5°C)/century. Minimum temperatures showed progressively less warming in March, April,
and May (Table 4.5).
Table 4.5 – Monthly Minimum Temperature Trends Based Upon 1895-2005
Month Northeast Trend/century Southcentral Trend/century February +4.5°F (2.5°C)** +4.7°F (2.6°C)** March +2.3°F (1.3°C)--- +2.6°F (1.4°C)*-- April +1.9°F (1.1°C)*-- +1.2°F (0.7°C)--- May +1.4°F (0.8 °C)--- +3.2°F (1.8°C)**
* = significant at the p ≤ 0.05 level ** = significant at the p ≤ 0.01 level
In southcentral Kansas, February once again showed the largest increase in minimum
temperatures, with a statistically significant 4.7°F (2.6°C)/century increase. Just like northeast
59

Kansas, March and April both showed progressively less warming. However, May minimum
temperatures in southcentral Kansas showed a surprising increase of 3.2°F (1.8°C)/century. This
warming was statistically significant and well above anything seen in any month other than
February. These results seem to indicate that while the overall trend in Kansas is for spring
warming, there can be marked variability between regions.
This study reveals that the past century has been a period of rather consistent spring
warming in portions of Kansas. Minimum temperatures are generally exhibiting the greatest
degree of change, with February accounting for much of the warming. Several warming trends
were noted in both northeast and southcentral Kansas, but even these neighboring regions
exhibited differences in the magnitudes and timing of warming. This comparison highlights the
complex and often varied nature of climate change even over small areas.
Several previous studies of regional climate change have shown an annual warming
trend, rather than a quantitative seasonal breakdown. Still, it is clear that the evidence for
warming found in this study generally agrees with several previous assessments of climate
change. For example, the Central Great Plains report for the U.S. Global Change Research
Program (U.S. GCRP) indicated that the central Great Plains have warmed and that temperatures
increased by 2°F (1.1°C) over the last century (Ojima and Lackett 2002). Furthermore, the U.S.
GCRP report also provides evidence that minimum temperatures have increased more than
maximums and that most of this warming was concentrated in winter (including February). A
study of spring climate data in both Ithaca, NY, and Boston, MA, also found that February
showed the strongest warming trend (Butler 2003), which is consistent with the results from this
study.
60

Another report indicated that Northern Hemisphere spring minimum temperatures were
increasing by 4.1°F (2.3°C)/century (Easterling et al. 1997). That figure is somewhat higher than
the 2.5-2.6°F (1.4°C)/century warming calculated in this study for northeast and southcentral
Kansas. At least part of this difference is explained by the fact that the hemispheric trend also
includes northern latitude locations that are warming more rapidly than Kansas.
While this study and others indicate that spring warming has already occurred, there is
also evidence that warming is likely to continue. Model projections for the planet show likely
temperature increases between 3.2 and 7.2°F (1.8-4.0°C) in the next century (IPCC 2007).
Regionally, 21st century projections for the Great Plains show that additional warming of 7-12°F
(4-7°C) is possible. The seasonality of this increase is projected to continue to be mostly in
winter and spring, where it has potential to impact many spring ecological and biogeographic
events (National Assessment Synthesis Team 2000).
In Kansas, February through May represents a period of rapid biological change. As
winter transitions into spring, countless insect and plant species emerge from senescence, seed,
and eggs. As late winter and spring have grown milder, growing degree days have accumulated
faster, which is likely to have advanced the phenology of some organisms. It is therefore
plausible that observed climate change in Kansas has contributed to advances in the phenology
of migrating birds. The next portion of this study was conducted to look for this evidence in the
arrival dates for thirty bird species.
Northeast Kansas Arrival Analysis
The migration calendar developed for northeast Kansas (Table 4.6) provides several
opportunities to better understand the arrival of migratory birds. Not only are the species ordered
by the median arrival date, but they include the typical arrival range, and the early arrival date. It
61

is apparent that some species such as the Baltimore Oriole are very consistent migrants. Over a
twenty county area and eleven years of observation, orioles arrived dependably within a 10 day
period. On the other end of the spectrum, the Field Sparrow exhibited a temporally wider
migration strategy wherein its arrival was spread over a thirty-five day period.
Table 4.6 – Migration Calendar for Northeast Kansas (based upon 1997-2007)
Species Median Arrival Typical Arrival Range (Days) Earliest
ArrivalEastern Phoebe 13 Mar 4 Mar to 24 Mar (20) 16 FebTurkey Vulture 18 Mar 6 Mar to 27 Mar (21) 15 FebPurple Martin 25 Mar 13 Mar to 5 Apr (23) 27 FebField Sparrow 26 Mar 7 Mar to 11 Apr (35) 5 FebTree Swallow 29 Mar 19 Mar to 10 Apr (22) 13 MarChipping Sparrow 3 Apr 25 Mar to 11 Apr (17) 11 MarBarn Swallow 9 Apr 31 Mar to 18 Apr (18) 19 MarBlue-gray Gnatcatcher 11 Apr 5 Apr to 19 Apr (14) 2 AprCommon Poorwill 11 Apr 4 Apr to 19 Apr (15) 1 AprBrown Thrasher 12 Apr 31 Mar to 21 Apr (21) 21 FebUpland Sandpiper 17 Apr 7 Apr to 28 Apr (21) 31 MarHouse Wren 20 Apr 13 Apr to 27 Apr (14) 27 MarChimney Swift 22 Apr 15 Apr to 28 Apr (13) 7 AprOrange-crowned Warbler 22 Apr 14 Apr to 1 May (17) 5 AprGrasshopper Sparrow 23 Apr 12 Apr to 7 May (25) 25 MarWarbling Vireo 28 Apr 19 Apr to 6 May (17) 13 AprRuby-throated Hummingbird 28 Apr 17 Apr to 10 May (23) 26 MarBaltimore Oriole 29 Apr 23 Apr to 3 May (10) 16 AprEastern Kingbird 29 Apr 19 Apr to 6 May (17) 23 MarCommon Yellowthroat 2 May 22 Apr to 9 May (16) 7 AprGreat Crested Flycatcher 2 May 25 Apr to 8 May (13) 20 AprWestern Kingbird 2 May 23 Apr to 10 May (17) 18 AprGray Catbird 3 May 25 Apr to 8 May (13) 11 AprIndigo Bunting 4 May 27 Apr to 8 May (10) 20 AprRose-breasted Grosbeak 5 May 28 Apr to 10 May (12) 22 AprYellow Warbler 5 May 28 Apr to 9 May (11) 7 AprCommon Nighthawk 6 May 30 Apr to 13 May (13) 26 AprDickcissel 7 May 30 Apr to 14 May (13) 21 AprBell's Vireo 8 May 2 May to 15 May (13) 29 AprYellow-billed Cuckoo 12 May 6 May to 18 May (12) 3 May
Long-distance migrants are shown in bold; dates represent non-leap year
62

A potential bias mentioned in the literature review was the tendency for arrival records to
fall on weekends. A weekend bias was detected for the 1997-2007 arrival records in northeast
Kansas. Two-fifths (40%; n=789) of the arrivals fell on a weekend (Saturday or Sunday), when
the expected proportion based upon equal daily effort would have been 28.6 percent. A Chi-
squared test was used to test for a statistically significant difference from the expected
distribution. The results support the idea that a weekend bias exists within the data (χ2 = 154.9;
df=6; p<0.001). As seen in Figure 4.4, Saturday showed the strongest deviation from the
expected distribution.
Unfortunately, Johnston did not provide a similar analysis of weekend bias from the
arrival dates that he used for his study. While it can be assumed that Johnston’s dates might have
exhibited a similar bias of unequal weekly observer effort, the full impact that any difference
might have on subsequent comparisons is unknown.
Figure 4.6 – 1997-2007 Northeast Kansas Bird Arrival Dates by Day of Week
217 220
281
224242
446
343
0
50
100
150
200
250
300
350
400
450
500
Monday Tuesday Wednesday Thursday Friday Saturday SundayDay of Week
n
63

A comparison between Johnston’s 1965 published median arrival dates and the calculated
1997-2007 median arrival dates is presented in Table 4.7. Non whole number changes are a
result of the nature of calculating a median arrival date for an even number of observations. The
species were ordered by the magnitude of change between the two dates, with three species that
did not have arrival dates in Johnston’s publication being dropped from further analysis. It is
apparent that a majority of the species showed advances in median arrival dates. In fact, fifteen
(56%) showed an advance, three (11%) showed no change, and nine (33%) showed a delay in
migration. Still, it is important to note that these are simply observations of raw difference and
not all changes are likely to be statistically significant.
Unfortunately, because Johnston’s 1965 publication only provides a median arrival date
and not a full listing of all individual arrival observations, a strong statistical comparison was not
possible. Some degree of variation in arrival dates is natural and expected, and there may also be
spatial differences between the summarized records. As a result, only species showing a FAD
difference of greater than three days were considered potentially significant. This was a
subjective cutoff based upon an estimate of the power of this analysis. The goal was to select
species whose FADs vary significantly between the two time periods.
64

Table 4.7 – Northeast Kansas Median Arrival Date Comparison
Species <1965 1997-2007 Change Tree Swallow 24 Apr 29 Mar -26.0 Chipping Sparrow 23 Apr 3 Apr -20.0 Barn Swallow 21 Apr 9 Apr -12.0 Field Sparrow 7 Apr 26 Mar -11.5 Common Nighthawk 15 May 6 May -9.0 Eastern Phoebe 22 Mar 13 Mar -9.0 Ruby-throated Hummingbird 6 May 28 Apr -7.5 Brown Thrasher 19 Apr 12 Apr -7.0 Grasshopper Sparrow 29 Apr 23 Apr -5.5 Gray Catbird 6 May 3 May -2.5 Orange-crowned Warbler 25 Apr 22 Apr -2.5 Indigo Bunting 6 May 4 May -2.0 Upland Sandpiper 19 Apr 17 Apr -2.0 Common Yellowthroat 3 May 2 May -1.0 Purple Martin 26 Mar 25 Mar -1.0 Bell's Vireo 8 May 8 May 0 Chimney Swift 22 Apr 22 Apr 0 Yellow-billed Cuckoo 12 May 12 May 0 Baltimore Oriole 28 Apr 29 Apr 1.0 Eastern Kingbird 28 Apr 29 Apr 1.0 House Wren 19 Apr 20 Apr 1.0 Dickcissel 4 May 7 May 3.0 Great Crested Flycatcher 29 Apr 2 May 3.0 Rose-breasted Grosbeak 2 May 5 May 3.0 Turkey Vulture 15 Mar 18 Mar 3.0 Western Kingbird 28 Apr 2 May 4.0 Yellow Warbler 30 Apr 5 May 5.0 Blue-gray Gnatcatcher --- 11 Apr --- Common Poorwill --- 11 Apr --- Warbling Vireo --- 28 Apr ---
Long-distance migrants are shown in bold; dates represent non-leap year
65

The table was reduced to show only the species with potentially significant changes in
arrival dates. Results are once again skewed, with more species arriving earlier (n=9; 82%) rather
than later (n=2; 18%) (Table 4.8). Species arriving earlier did so by an average of twelve days,
while later arriving species shifted by five days. Twice as many short-distance migrants
advanced their phenology as compared to long-distance migrants. The species delaying their
migration were split, with both a short-distance and a long-distance migrant represented.
Table 4.8 – Potentially Significant Changes in Northeast Kansas Median Arrivals
Species <1965 1997-2007 Change Tree Swallow 24 Apr 29 Mar -26.0 Chipping Sparrow 23 Apr 3 Apr -20.0 Barn Swallow 21 Apr 9 Apr -12.0 Field Sparrow 7 Apr 26 Mar -11.5 Common Nighthawk 15 May 6 May -9.0 Eastern Phoebe 22 Mar 13 Mar -9.0 Ruby-throated Hummingbird 6 May 28 Apr -7.5 Brown Thrasher 19 Apr 12 Apr -7.0 Grasshopper Sparrow 29 Apr 23 Apr -5.5 Western Kingbird 28 Apr 2 May 4.0 Yellow Warbler 30 Apr 5 May 5.0
Long-distance migrants are shown in bold; dates represent non-leap year
The analysis of northeast Kansas arrival dates provides evidence that between the mid-
1960’s and 1997-2007 some birds have changed their arrival dates. The most common direction
and largest magnitudes of change have been toward earlier spring arrivals. Many previous
studies of migration phenology have suggested that a warming climate is a likely cause of
observed advances in arrival (Butler 2003; Dunn and Winkler 1999; Murphy-Klassen 2005).
Combined with finding of significant spring warming trends in Kansas, the evidence mounts that
arrival date adjustments are related to recent climate change.
66

Southcentral Kansas Arrival Analysis
While originally considering thirty species, only twenty-three had sufficient arrival
records from southcentral Kansas for analysis. This reduction was required mainly due to a lack
of arrival dates for the 1947-1967 time period. The comparison between 1947-1967 and 1997-
2007 in southcentral Kansas is summarized in Table 4.9.
Observed changes ranged from a twenty-five day advance to an eight day delay in arrival.
Simply considering the difference between the two time periods, there was nearly an even split
between the eleven species that arrived earlier and the ten that arrived later. Two species showed
no change between the two time periods.
After using a Mann-Whitney U test to compare the arrival dates between time periods, it
became apparent that, in statistically meaningful terms, more species advanced, rather than
delayed, their spring arrival. Nine species were found to have statistically significant shifts in
their arrival date. Six (66%) of these were advances and only three (33%) were delays in
migration (Table 4.10). Among species arriving earlier, the average advance was ten days, while
delays averaged four days. Both of these numbers are slightly less, but still very similar, to the
results noted in northeast Kansas.
67

Table 4.9 – Southcentral Kansas Median Arrival Date Comparison
Species 1947-1967
1997-2007 Change Mann-Whitney U
Significance (p-value)Purple Martin 12 Apr 18 Mar -25.5 0.000Common Nighthawk 21 May 9 May -12.0 <0.000Ruby-throated Hummingbird 9 May 27 Apr -11.5 0.004Barn Swallow 18 Apr 10 Apr -8.0 0.006Eastern Phoebe 24 Mar 17 Mar -6.5 0.014Indigo Bunting 10 May 5 May -5.0 <0.000Common Yellowthroat 4 May 29 Apr -4.5 0.070Rose-breasted Grosbeak 6 May 4 May -1.5 0.418Blue-gray Gnatcatcher 16 Apr 15 Apr -1.5 0.414Brown Thrasher 18 Apr 17 Apr -1.0 0.703Yellow-billed Cuckoo 14 May 13 May -0.5 0.881Chipping Sparrow 19 Apr 19 Apr 0 0.502Great Crested Flycatcher 1 May 1 May 0 0.487Upland Sandpiper 21 Apr 22 Apr 0.5 0.676Gray Catbird 4 May 5 May 1.0 0.734Baltimore Oriole 28 Apr 30 Apr 2.0 0.068House Wren 16 Apr 18 Apr 2.0 0.061Orange-crowned Warbler 23 Apr 25 Apr 2.0 0.990Eastern Kingbird 27 Apr 30 Apr 3.0 0.108Chimney Swift 18 Apr 22 Apr 4.0 0.018Yellow Warbler 3 May 7 May 4.0 0.013Warbling Vireo 27 Apr 3 May 6.0 0.193Dickcissel 29 Apr 7 May 8.0 0.001Turkey Vulture --- 31 Mar --- ---Western Kingbird --- 25 Apr --- ---Field Sparrow --- 14 Apr --- ---Bell’s Vireo --- 9 May --- ---Tree Swallow --- 4 Apr --- ---Grasshopper Sparrow --- 25 Apr --- ---Common Poorwill --- --- --- ---
Long-distance migrants are shown in bold; dates represent non-leap year
It is also important to note that when the difference between a pair of arrival dates was
three or fewer days, the two dates were not found to be statistically different. On the other hand,
all but two of the pairs with four or more days of separation were statistically significant. This
adds support to the subjective decision used earlier that considered all species from northeast
Kansas with a difference of more three days to be potentially significant.
68

Table 4.10 – Significant Changes in Southcentral Kansas Median Arrivals
Species 1947-1967 1997-2007 Change Purple Martin 12 Apr 18 Mar -25.5 Common Nighthawk 21 May 9 May -12.0 Ruby-throated Hummingbird 9 May 27 Apr -11.5 Barn Swallow 18 Apr 10 Apr -8.0 Eastern Phoebe 24 Mar 17 Mar -6.5 Indigo Bunting 10 May 5 May -5.0 Chimney Swift 18 Apr 22 Apr 4.0 Yellow Warbler 3 May 7 May 4.0 Dickcissel 29 Apr 7 May 8.0
Long-distance migrants are shown in bold; dates represent non-leap year
In southcentral Kansas, all but one of the species advancing their arrival was a long-
distance migrant. This finding differs from northeast Kansas, where short-distance migrants were
twice as numerous as long-distance migrants among species arriving earlier. While several
studies have found a relationship between migration strategy and the magnitude of change in the
arrival date, the results from this study are rather mixed. In Kansas, migration strategy does not
seem to be a consistent predictor of the direction or magnitude of change in arrival date.
There are several possible explanations for why short and long-distance migrants do not
show a clear trend in Kansas. It may partially be a result of the small number of bird species
being considered in this analysis. In northeast Kansas eleven species showed a trend over time,
while nine showed a trend in southcentral Kansas. Considering that some species advanced and
others delayed their arrival, these are very small samples in which to draw conclusions on the
proportions of short and long-distance migrants. Due to a lack of early time period data, there
were also significantly fewer short distance migrants studied in southcentral Kansas.
The inconsistent findings may also highlight inadequacies in the simplistic labels of short
and long-distance migrants. As mentioned earlier, some species exhibit intermediate strategies
that share attributes of both migration strategies. In addition, some long-distance species cross
69

the Gulf of Mexico when returning to the United States, whereas others travel overland through
Central America and Mexico. Among the overland birds, some species travel slowly north as
winter begins to wane, and other species travel quickly north once spring has arrived. It seems
likely that the specifics of the migration route and timing of movement along that route are of
more consequence than simply the distance traveled.
In the 1997-2007 arrival records of southcentral Kansas there was once again a detectable
weekend bias (Fig. 4.7). Weekends accounted for 43.2 percent of arrival records rather than the
28.6 percent expected with equal observer effort. A Chi-square test confirmed a deviation from
the expected frequency (χ2 = 33.6; df=6; p<0.001), with Saturday again showing up as the
preferred day to observe arriving bird species.
The analysis of daily effort from 1947-1967 showed a slightly different trend (Fig. 4.8).
Weekend bias was less apparent overall, with 34.3 percent of observations on weekends rather
than the expected 28.6 percent. A Chi-square test still confirmed a deviation from the expected
frequency (χ2 = 166.4; df=6; p<0.001), but it was Sunday that had the most observations. A
consistent bias over time is preferable to a bias that changes between time periods (Sparks 1999).
While there was a bias in both time periods, the characteristics of that bias shifted.
70

Figure 4.7 – 1997-2007 Southcentral Kansas Bird Arrival Dates by Day of Week
132
107 109130
166
297
193
0
50
100
150
200
250
300
350
Monday Tuesday Wednesday Thursday Friday Saturday SundayDay of Week
n
Figure 4.8 – 1947-1967 Southcentral Kansas Bird Arrival Dates by Day of Week
62 62
95
84
63
73
118
0
20
40
60
80
100
120
140
Monday Tuesday Wednesday Thursday Friday Saturday SundayDay of Week
n
71

Published literature provided no precedent for how best to handle weekend bias and few
studies mention any effort to even consider weekend bias. An untested technique that might be of
value would be to remove a random sample of observations from days, such as Saturday or
Sunday, that have the greatest impact on the kurtosis (peakedness) of the distribution. This
method would only be useful in large datasets so that the sampling would be less likely to
remove all records for a species.
In southcentral Kansas, there is once again evidence that among species adjusting their
arrival dates, the most common and strongest shifts are toward an earlier arrival. This is
consistent with expectations under a scenario of climate warming. However, it is important to
consider that the advance in arrival dates may be influenced by other factors.
For example, the Purple Martin’s advance of more than three weeks might be related to
the proliferation of houses designed to attract martins. Since the 1800s, Purple Martins have
become increasingly reliant upon humans to provide suitable nesting structures. In fact, by the
start of the twentieth century Purple Martins east of the Rocky Mountains relied almost
exclusively on human-made structure for nesting (Brown 1997). While no data exists on the
number of artificial nesting structures that have been provided in Kansas over time, the number
is likely to have grown along with an increasing human population. As more martin homes are
placed in residential neighborhoods, observer effort would be expected to increase and increase
the likelihood that early Purple Martins are observed and reported. Similarly, it is possible that
the Ruby-throated Hummingbird arrival dates have been skewed in recent years due to greatly
increased artificial feeding.
These findings should also be considered in light of the observations themselves. The
1947-1967 arrival dates come from two independent observers from Harvey County, Kansas.
72

The 1997-2007 arrival dates are from several observers (five key observers) across a wider cross-
section of southcentral Kansas. There are two primary implications of these facts. First, the early
1947-1967 arrival dates all come from Harvey County, which is on the eastern edge of the
defined southcentral Kansas. Considering the general southeast to northwest movement of
migratory birds in Kansas, the Harvey county observations alone may produce an earlier median
arrival date than if a more inclusive sampling of southcentral Kansas arrival dates had been
possible. This geographical consideration may explain why some species show an apparent shift
toward delayed arrival dates.
Secondly, the 1947-1967 arrival dates are much more susceptible to changes in observer
effort. If a key observer from the 1997-2007 time period was unavailable for a spring, the median
arrival date was generally not impacted because there were still several other observers across
the region. However, with only two recorded observers from 1947-1967, any shift in effort
translated more directly into influences on available data and median arrival dates. However,
given the preceding concerns it is encouraging that so many species showed nonsignificant shifts
in arrival date. This suggests that despite these concerns, median arrival dates between the two
time periods are comparable.
Summary
A total of fifteen species showed either potentially significant arrival trends in northeast
Kansas or significant trends in southcentral Kansas. Of these, eleven have shifted toward earlier
arrivals since the 1960s, while the other four have shown arrival delays. It is also noteworthy that
five species showed the same trend in both northeast and southcentral Kansas, while no species
show differing trends between regions (Table 4.11). Of the five species showing the same trend,
73

four are arriving earlier by 6.5-12 days (average 9.4), with one species arriving later by 4-5 days
(average 4.5).
These observed trends were also found to have occurred during a period of both global
and regional spring warming. Evidence is statistically strong that minimum and mean
temperatures rose by 1.8-2.6°F (1.0-1.4°C) in February through May over the past century in
portions of Kansas. These results are largely consistent with a scenario of climate warming and
are similar to other studies that have found correlations between increasing spring temperatures
and a high proportion of advancing arrival dates.
Table 4.11 – Species with Consistent Trends in both Southcentral and Northeast Kansas
1947-1967 vs. 1997-2007 Species Southcentral KS Arrival
Change in DaysNortheast KS Arrival
Change in DaysCommon Nighthawk -12.0 -9.0Ruby-throated Hummingbird -11.5 -7.5Barn Swallow -8.0 -12.0Eastern Phoebe -6.5 -9.0Yellow Warbler 4.0 5.0
As mentioned earlier, a key underpinning of bird migration is food availability. The diet
of each species that showed a consistent trend between northeast and southcentral Kansas was
examined online (Cornell Lab of Ornithology 2007). Among the four species showing consistent
advances, three feed primarily upon flying insects. The fourth species relies on flower nectar
supplemented with the occasional insect. The one species showing a delay in migration feeds
mainly on tree-dwelling insects such as caterpillars (Fig. 4.12). Most of the thirty-species studied
feed at least partially on insects, but it is intriguing that aerial insect specialists appear together
among species with the most rapid advance in their spring migration phenology.
74

These results may provide a clue to the reason why some species have altered their spring
arrival in Kansas. It seems possible that specific flying insects and flowering plants may have
already advanced their spring emergence date, an effect that has rippled up the food chain to
avian consumers. Similarly, it may indicate that the caterpillars preferred by Yellow Warblers
may be emerging at later dates than in years past.
Table 4.12 – Diets of Species with Consistent Trends in Southcentral and Northeast Kansas
Species Direction of Arrival Trend Diet
Common Nighthawk Advance flying insects Ruby-throated Hummingbird Advance floral nectar & small insects Barn Swallow Advance flying insects Eastern Phoebe Advance flying insects; small fruits in unfavorable weather Yellow Warbler Delay insects (especially caterpillars) & other arthropods
Beyond diet, there may be other explanations for arrival delays in particular bird species.
In particular, species that cover a lot of ground may develop migration delays due to cooling
regional climate at stopover locations. This lack of warming is evident in spring temperatures of
the southeastern United States (Fig. 2.2), and potentially locations in Mexico, Central America,
or South America as well. The highly variable spring climate of the continental interior, which
can switch between unseasonable warmth and strong Arctic cold fronts, is an additional
complicating factor.
75

CHAPTER 5 - Summary and Conclusions
Statistical analyses of spring bird migration arrival dates between mid-century (~1940-
1965) and the present (1997-2007) were conducted for a suite of species in both northeastern and
southcentral Kansas. Spring climate trends from 1895-2005 were also analyzed. The key findings
are summarized below:
• In northeast Kansas, February through May (spring) minimum, mean, and maximum
temperatures have all increased between 1895-2005. Observed trends were +2.0-2.5°F
(1.1-1.4°C)/century.
• In southcentral Kansas, February through May (spring) minimum and mean temperatures
have increased between 1895-2005. Observed trends were +1.8-2.6°F (0.6-
1.4°C)/century.
• February exhibited the greatest warming of monthly minimum temperatures: +4.5-4.7°F
(2.5-2.6°C)/century.
• Fourteen of the twenty-nine bird species analyzed showed no sign of a statistically
significant alteration in their spring median arrival date.
• Fifteen species showed arrival date trends in at least one region, with eleven species
found to be arriving earlier and four delaying their spring migration arrival.
• Four species (Common Nighthawk, Ruby-throated Hummingbird, Barn Swallow, Eastern
Phoebe) were found to be arriving earlier in both northeast and southcentral Kansas. The
average advance was 9.4 days.
76

• One species (Yellow Warbler) was found to be arriving later in both northeast and
southcentral Kansas. The average delay was 4.5 days.
• There was no consistent relationship between migration strategy (short/long-distance
migrant) and change in arrival dates.
• The preferred food resources among the species with the most rapid advances in spring
arrival dates were flying insects and/or flower nectar.
• The most common direction and largest magnitude of change was toward an earlier
arrival date. Combined with regional climate trends, this is suggestive that a warmer
climate has advanced the migration phenology of some bird species in Kansas.
• Predictions of continued winter and spring warming suggest that arrival dates for many
species are likely to continue to advance.
It was clear that while bird migration is not changing uniformly across all species, there is
strong evidence for recent change in a subset of species. The five species showing similar trends
between the two study regions are particularly interesting. The fact that these two separate
analyses were consistent, provides additional evidence that these species are shifting their
migration phenology in Kansas. These five species may represent the “canaries in the coal mine”
and provide clues to how other bird species will respond to continued warming.
Limitations and Future Work
A major limitation of this study was that in northeast Kansas, the summary statistics
published by Johnston were used in place of individual arrival records from multiple observers.
As a result, it was not possible to use standard statistical tests to confirm if differences between
Johnston’s median arrival dates and those calculated by this study were statistically significant. It
77

was likewise not possible to fully investigate potential biases associated with the spatial
distribution of records, or the days of the week when observations were made.
While many bird watchers and organizations provided useful bird records, the relative
scarcity of arrival records was still surprising. Many of the most active bird watchers in Kansas
had no records of first arrival beyond the current year, and even locations such as Quivira
National Wildlife Refuge and the Audubon Rowe Sanctuary had no records. It was particularly
surprising that even in a large city such as Wichita, with several hundred-thousand residents,
only one individual was located with a multiyear record of recent arrivals for the study species.
Based upon reports to the KSBIRD listserv in 2007, it is clear that many bird watchers in Kansas
are keenly aware of the spring arrival of bird species, but these records seem to disappear if not
captured almost immediately after the observation.
While online resources such as Journey North and eBird help to preserve some first
arrival data, more organized and local efforts are likely to be of greater use to future studies.
Locations that are routinely visited by qualified observers, such as parks, nature centers, and
preserves should be encouraged to start collaborative phenological records, perhaps even as part
of existing education programs. Dr. Valerie Wright recently started such a program as part of the
Konza Environmental Education Program to monitor plants, insects, birds, reptiles, and
mammals at the Konza Prairie Biological Station (Konza Prairie LTER 2007)
In the absence of a national phenological network, organizations such as the Kansas
Ornithological Society will need to step up and ensure that bird migration arrival dates are
collected and preserved. A simple way for observers to report their first arrival dates is needed. A
potential solution is a joint web interface and paper form that would allow all observers to report
78

their observations on a seasonal basis. Data preservation would then be the responsibility of the
sponsoring organization, instead of relying on each observer to keep multiyear records.
Given that it may not be possible to collect phenology data for a large number of species,
a suggested starting place would be the five species that this study found to be changing arrival
dates in both northeast and southcentral Kansas: Common Nighthawk (advancing), Ruby-
throated Hummingbird (advancing), Barn Swallow (advancing), Eastern Phoebe (advancing),
and Yellow Warbler (delaying). Beyond these species that already appear to be changing, it
would be valuable to carefully monitor another five to ten species that exhibited little evidence of
change in this study. Long-term datasets on a small suite of carefully selected birds could
provide valuable insight into important shifts among the birds of Kansas.
Although temperature data was available back to the late nineteenth century in Kansas,
very few bird arrival records prior to 1947 were available. Fortunately, after an extensive search
that led to several dead ends, an extremely valuable data record was discovered. The USGS
Patuxent Wildlife Research Center has a storage facility in Laurel, Maryland, that holds all six
million original migration record cards submitted by various observers to the U.S. Biological
Survey from the 1880s to 1970s. These are under the care of Chandler S. Robbins, the original
organizer of the North American Breeding Bird Survey. For the thirty species used in this study,
more than 7,000 individual migration cards from Kansas exist in the dataset (Robbins personal
communication, 17 July 2007). The migration record program was most active in the early
nineteenth century, and so it seems likely that most of these records represent data from the
1880s to approximately the 1940s.
At present these records are being preserved only in their original undigitized form. It
will take time and effort to capture the important data from these cards, but this process would
79

create an extremely valuable ornithological resource. There is great potential to gain insight into
bird migration in Kansas nearly a century ago, and to make careful comparisons with climate
trends over an extended time period. Rarely are biological datasets of such depth available from
a time early in the history of the state of Kansas, and the opportunity to preserve and study these
records should not be lost.
Additionally, it would be valuable for future studies to focus narrowly on a specific bird
species or small group of related birds. This would allow much more detailed scrutiny of climate
changes along the entire migration route from wintering to breeding grounds. It would also allow
close inspection of diets to determine if underlying prey phenology has changed. Both the
specifics of migration routes and diet can be difficult to fully explore for a large, diverse group of
birds.
80

Concluding Remarks
An analysis of migration phenology for a set of bird species is a complicated undertaking.
Long term data are often difficult to obtain and contain biases based upon changes in observer
skill and effort, the locations where birds are sought, and bird population levels. In addition,
species behave in unique ways and interact with a diverse set of climates and environments on
their migration routes. Despite these factors, it is often still possible to see overall trends and to
look for correlations to environmental change.
This study provides the first evidence that some migratory bird species appear to have
advanced their spring arrival in Kansas. This study also provides a detailed evaluation of
regional climate trends in northeast and southcentral Kansas, where late-winter and early spring
warming are apparent. While suggestive that a warmer climate is impacting bird migration, a
fuller exploration of the causal connection between these two trends will be necessary.
81

References
Alerstam, Thomas. 1993. Bird Migration. Cambridge: Cambridge University Press.
American Ornithologists' Union. 1998. Check-list of North American Birds, 7th ed. American
Ornithologists' Union. Washington, D.C.
Badeck, Franz W., Alberte Bondeau, Kristin Bottcher, Daniel Doktor, Wolfgang Lucht, Jorg
Schaber, and Stephen Sitch. 2004. Responses of spring phenology to climate change.
New Phytologist 162: 295-309.
Balme, D.M. editor and translator. 1991. History of Animals. Books VII-X. Harvard University
Press: Cambridge, Massachusetts.
Barrett, Robert T. 2002. The phenology of spring bird migration to north Norway. Bird Study 49:
270-277.
Bell, Christopher P. 2000. Process in the evolution of bird migration and pattern in avian
ecogeography. Journal of Avian Biology 31: 258-265.
Berthold, Peter. 2001. Bird Migration. 2nd edition. Oxford University Press: New York.
Both, Christiaan, and Marcel E. Visser. 2005. The effect of climate change on the correlation
between avian life-history traits. Global Change Biology 11: 1606-1613.
Bradley, Nina L., A. Carl Leopold, John Ross, and Wellington Huffaker. 1999. Phenological
changes reflect climate change in Wisconsin. Proceedings of the National Academy of
Sciences of the United States of America 96: 9701-9704.
Brown, C. R. 1997. Purple Martin (Progne subis). In The Birds of North America, No. 287 (A.
Poole and F. Gill, eds.). The Academy of Natural Sciences, Philadelphia, PA, and The
American Ornithologists’ Union. Washington, D.C.
82

Brown, Jerram L., Shou-Hsien Li , and Nirmal Bhagabati. 1999. Long-term trend toward earlier
breeding in an American bird: A response to global warming? Proceedings of the
National Academy of Sciences of the United States of America 96: 5565-69.
Bureau of the Biological Survey. 1935. The Survey. 16(4-6): 59-65.
Busby, William H. and John L. Zimmerman. 2001. “Kansas Breeding Bird Atlas”.
http://www.ksbirds.org/kos/kbbat.pdf (last accessed 5 September 2007).
Butler, Christopher J. 2003. The disproportionate effect of global warming on the arrival dates of
short-distance migratory birds in North America. Ibis 145: 484-95.
Climate Prediction Center. 2005. United States Temperature and Precipitation Trends.
http://www.cpc.ncep.noaa.gov/trndtext.shtml (last accessed 1 October 2007).
Coppack, Timothy and Christiaan Both. 2003. Predicting life-cycle adaptation of migratory birds
to global climate change. Opmaak 14(43): 369-377.
Cornell Lab of Ornithology. 2007. The Birds of North America Online.
http://bna.birds.cornell.edu/bna (last accessed 2 October 2007).
Cotton, Peter A. 2003. Avian migration phenology and global climate change. Proceedings of
the National Academy of Sciences of the United States of America 100(21): 12219-22.
Crick, Humphrey Q.P., Caroline Dudley, David E. Glue, and David L. Thomson. 1997. UK birds
are laying eggs earlier. Nature 388: 526.
Crick, Humphrey Q. P. 2004. The impact of climate change on birds. Ibis Suppl. 1: 48-56.
Crick, Humphrey Q.P. 2006. Migratory Wildlife in a Changing Climate. Migratory Species and
Climate Change. United Nations Environment Programme.
Driftwood Wildlife Association. 2007. Chimney Swift Sightings.
http://www.concentric.net/%7edwa/page118.html (last accessed 2 October 2007).
83

Droege, Sam and Elizabeth Keller. 2001. Spring arrival dates of birds in North America: An
evaluation of 100 years of data and recommendations for their continued collection.
Unpublished manuscript.
Dunn, Peter O. and David W. Winkler. 1999. Climate change has affected the breeding date of
tree swallow throughout North America. Proceedings of the Royal Society of London
266: 2487-90.
Easterling, David R., Briony Horton, Philip D. Jones, Thomas C. Peterson, Thomas R. Karl,
David E. Parker, M. James Salinger, Vyacheslav Razuvayev, Neil Plummer, Paul
Jamason, and Christopher K. Folland. 1997. Science 277: 364-367.
Gill, Frank. 1994. Ornithology. 2nd Edition. New York: W.H. Freeman and Company.
Goodrich, Arthur L. 1932. Crevecoeur’s Notes on Birds in Pottawatomie County, Kansas.
Transactions of the Kansas Academy of Science 35: 85-92.
Goss, Colonel N.S. 1891. History of the Birds of Kansas. Topeka: Geo. W. Crane and Co.
Hall, Harry H. 1935. The birds of southeastern Kansas, with migration dates. Transactions of the
Kansas Academy of Science 38: 311-315.
Herkert, James R. 1994. The effects of habitat fragmentation on Midwestern grassland bird
communities. Biological Applications 4(3): 461-471.
High Plains Regional Climate Center. 2006. Manhattan, Kansas 1/1/1900 to 10/31/2006 Monthly
Climate Summary. http://hprcc1.unl.edu/cgi-bin/cli_perl_lib/cliMAIN.pl?ks4972 (last
accessed 1 October 2007).
Hijmans, Robert J., Susan Cameron, and Juan Parra. 2006. WORLDCLIM v1.4.
http://www.worldclim.org/ (last assessed 1 October 2007).
84

Hitch, Alan T. and Paul L. Leberg. 2007. Breeding Distributions of North American Bird
Species Moving North as a Result of Climate Change. Conservation Biology 21(2): 534-
539.
Houston, C. S., and D. E. Bowen, Jr. 2001. Upland Sandpiper (Bartramia longicauda). In The
Birds of North America, No. 580 (A. Poole and F. Gill, eds.). The Birds of North
America, Inc., Philadelphia, PA.
Hubbard, F.F. 1953. Spring arrival dates of the house wren. Bulletin of the Kansas
Ornithological Society. 4(2):17
Huntley, Brian, Yvonne C. Collingham, Rhys E. Green, Geoffrey M. Hilton, Carsten Rahbek,
and Stephen G. Willis. 2006. Potential impacts of climatic change upon geographic
distributions of birds. Ibis 148: 8-28.
Hussell, David J. T. 2003. Climate change, spring temperatures, and timing of breeding of tree
swallows (Tachycineta bicolor) in Southern Ontario. The Auk 3: 607-18.
Ingold, J. L., and R. Galati. 1997. Golden-crowned Kinglet (Regulus satrapa). In The Birds of
North America, No. 301 (A. Poole and F. Gill, eds.). The Academy of Natural Sciences,
Philadelphia, PA, and The American Ornithologists’ Union. Washington, D.C.
Inouye, David W., Billy Barr, Kenneth B. Armitage, and Brian D. Inouye. 2000. Climate change
is affecting altitudinal migrants and hibernating species. Proceedings of the National
Academy of Sciences of the United States of America 97(4): 1630-1633.
Intergovernmental Panel on Climate Change. 2007. Climate Change 2007: The Physical Science
Basis. Fourth Assessment Report of Working Group 1. Eds. Solomon et al. Cambridge:
Cambridge Univ. Press.
85

Janzen, Pete. 2007. The Birds of Sedgwick County and Cheney Reservoir. Kansas Ornithological
Society.
Johnston, R.F. 1960. Directory to the bird-life of Kansas. University of Kansas Museum of
Natural History Miscellaneous Publication 23.
Johnston, R.F. 1965. Directory to the birds of Kansas. University of Kansas Museum of Natural
History Miscellaneous Publication 41:22.
Journey North. 2007. Past Seasons: Maps and Sightings.
http://www.learner.org/jnorth/maps/archives.html (last accessed 2 October 2007).
Kansas Ornithological Society. 2007. Kansas Birds: Species List for Kansas.
http://ksbirds.org/checklist/KansasChecklist.pdf (last accessed 1 October 2007).
Konza Prairie LTER. 2007. Konza Environmental Education Program: Phenology.
http://www.konza.ksu.edu/keep/phenology/phenologyintro.asp (last accessed 1 October,
2007).
Lincoln, Frederick C., Steven R. Peterson, and John L. Zimmerman. 1998. Migration of birds.
U.S. Department of the Interior, U.S. Fish and Wildlife Service, Washington, D.C.
Circular 16. Jamestown, ND: Northern Prairie Wildlife Research Center Online.
http://www.npwrc.usgs.gov/resource/birds/migratio/index.htm (Version 02APR2002).
L-Soft. 2007. Lists hosted at LISTSERV.KSU.EDU. 2007.
http://www.lsoft.com/scripts/wl.exe?XH=LISTSERV.KSU.EDU (Last accessed 1
October 2007).
MacMynowski, Dena and Terry L. Root. 2007. Climate and the complexity of migratory
phenology: sexes, migratory distance, and arrival distributions. International Journal of
Biometeorology 51(5): 361-373.
86

Marra, Peter P., Charles M. Francis, Robert S. Mulvihill, Frank R. Moore. 2005. The influence
of climate on the timing and rate of spring bird migration. Oecologia 142: 307-315.
Members of the Kansas Ornithological Society as of December, 1955. 1955. Kansas
Ornithological Society Bulletin 6(4): 21-25.
Miller, R.F., Ivan L. Boyd. 1947. Migration records of birds in East-Central Kansas.
Transactions of the Kansas Academy of Science 50(1): 62-71.
Mills, Alexander M. 2005. Changes in the timing of spring and autumn migration in North
American migrant passerines during a period of global warming. Ibis 147: 259-69.
Morris, Ryan D., Peter P. Marra, Kurt T. Kyser, Thomas W. Sherry, and Laurene M. Ratcliffe.
2004. Tropical winter habitat limits reproductive success on the temperate breeding
grounds in a migratory bird. Proceedings - Royal Society of London 271: 59-64.
Murphy-Klassen, Heather M., Todd J. Underwood , Spencer G. Sealy , and Ashleigh A. Czyrnyj.
2005. Long-term trends in spring arrival dates of migrant birds at Delta Marsh, Manitoba,
in relation to climate change. The Auk 122 (4): 1130-1148.
National Assessment Synthesis Team. 2000. Climate Change Impacts on the United States: The
Potential Consequences of Climate Variability and Change. U.S. Global Change
Research Program. Cambridge: Cambridge University Press.
Ojima, D.S., J.M. Lackett, and the Central Great Plains Steering Committee and Assessment
Team. 2002. Preparing for a Changing Climate: The Potential Consequences of Climate
Variability and Change – Central Great Plains. Report for the U.S. Global Change
Research Program. Colorado State University.
Olmstead, Roger. 1955. Observations of Purple Martins. Bulletin of the Kansas Ornithological
Society 6(2): 8-10
87

Palmer, T.S.. 1917. In Memoriam: Wells Woodbridge Cooke. The Auk 34(2): 119-132.
Partners in Flight. 2007. Making Connections for Bird Conservation: Linking States, Provinces
and Territories to Important Wintering and Breeding Grounds.
http://www.partnersinflight.org/pubs/ts/04-Connections/ (last accessed October 1 2007).
Peterson, A. Townsend. Projected climate change impacts on Rocky Mountain and Great Plains
birds: generalities of biodiversity consequences. Global Change Biology 9: 647-655.
Roane, Kit R. 1995. San Juan Capistrano Journal; Could This Be the Year Swallows Don't
Return? New York Times 3 March.
http://query.nytimes.com/gst/fullpage.html?res=990CE6D6123BF930A35750C0A96395
8260 (last accessed 24 February 2008).
Robbins, Chandler S., John R. Sauer, Russell S. Greenburg, and Sam Droege. 1989. Population
declines in North American birds that migrate to the neotropics. Proceedings of the
National Academy of Sciences of the United States of America 86: 7658-7662.
Root, Terry L., Jeff T. Price, Kimberley R. Hall, Stephen H. Schneider, Cynthia Rosenzweig,
and J. Alan Pounds. 2003. Fingerprints of Global Warming on Wild Animals and Plants.
Nature 241:57-60.
Rosenberg, N.J. 1986. Adaptations to adversity: agriculture, climate and the Great Plains of
North America. Great Plains Quarterly. 6:202-217.
Schwartz, Mark D. 1998. Green-wave Phenology. Nature 394: 839-840.
Schwartz, Mark D. 1999. Advancing to full bloom: planning phenological research for the 21st
century. International Journal of Biometeorology 42:113-118.
Schwartz, Mark D., Rein Ahas , and Anto Aasa. 2006. Onset of spring starting earlier across the
Northern Hemisphere. Global Change Biology 12: 343-51.
88

Sparks, T. H. 1999. Phenology and the changing pattern of bird migration in Britain.
International Journal of Biometeorology 42: 134-138.
Sparks, T. H., and A. Menzel. 2002. Observed Changes in Seasons: An Overview. International
Journal of Climatology 22: 1715-25.
Steadman, David W. 2005. The paleoecology and fossil history of migratory birds. In Birds of
Two Worlds: The Ecology and Evolution of Migration, ed. Russell Greenberg and Peter
P. Marra, 5-17. Baltimore: Johns Hopkins University Press.
Strode, Paul K. 2003. Implications of climate change for North American wood warblers
(Parulidae). Global Change Biology 9: 1137-1144.
The Purple Martin Conservation Association. 2007. Scout Arrival Study.
http://purplemartin.org/scoutreport/ (last accessed 2 October 2007).
Tryjanowski, P. and T.H Sparks. 2001. Is the detection of the first arrival date of migrating birds
influenced by population size? A case study of the red-backed shrike Lanius collurio.
International Journal of Biometerorology 45: 217-219.
U.S. Department of Agriculture (USDA). 1931. Information for the Press.
http://www.fws.gov/news/historic/1931/19310115.pdf (last accessed 3 October 2007).
U.S. Geological Survey (USGS) Patuxent Wildlife Research Center. 2004. Bird Banding and
Encounter Data. http://www.pwrc.usgs.gov/BBL/homepage/SPEC.HTM (last accessed 1
October 2007).
Woods, C. P., R. D. Csada, and R. M. Brigham. 2005. Common Poorwill (Phalaenoptilus
nuttallii). The Birds of North America Online (A. Poole, Ed.). Ithaca: Cornell Laboratory
of Ornithology.
89

90
Williams, C. N., M. J. Menne, R. S. Vose, and D. R. Easterling. 2007. United States Historical
Climatology Network Monthly Temperature and Precipitation Data. ORNL/CDIAC-187,
NDP-019. Carbon Dioxide Information Analysis Center, Oak Ridge National Laboratory,
Oak Ridge, Tennessee.
Wilson Jr., Herbert W., Daniel Kipervaser, and Scott A. Lilley. 2000. Spring arrival dates of
Maine migratory breeding birds: 1994-1997 vs. 1899-1911. Northeastern Naturalist 7(1):
1-6.
Zimmerman, J. L. 1985. Birds of Konza Prairie Research Natural Area, Kansas. The Prairie
Naturalist 17: 185-192.