Embed Size (px)
Citation preview
An analysis of Africa’s export
performance and export similarity for
select countries within the Tripartite
Free Trade Area market
by Taku Fundira
tralac Trade Brief
No. S13TB03/2013
July 2013
���� Please consider the environment before printing this publication
www.tralac.org | [email protected] | Twitter @tradelawcentre | Copyright © tralac, 2013.
Readers are encouraged to quote and reproduce this material for educational, non-profit purposes, provided the source is
acknowledged. All views and opinions expressed remain solely those of the authors and do not purport to reflect the views of tralac.
TR
AD
E B
RIE
F

Copyright © tralac, 2013.
Readers are encouraged to quote and reproduce this material for educational, non-profit purposes,
provided the source is acknowledged. All views and opinions expressed remain solely those of the
authors and do not purport to reflect the views of tralac
This publication should be cited as: Fundira, T. 2013.
An analysis of Africa’s export performance and export similarity for select countries within the
Tripartite Free Trade Area market. Stellenbosch: tralac.
This publication has been financed by The Swedish Embassy Nairobi. The Swedish Embassy Nairobi
does not necessarily share the views expressed in this material. Responsibility for its contents rests
entirely with the author.
www.tralac.org | [email protected] | Twitter @tradelawcentre
Readers are encouraged to quote and reproduce this material for educational, non-profit purposes,
provided the source is acknowledged. All views and opinions expressed remain solely those of the authors
and do not purport to reflect the views of tralac.

An analysis of Africa’s export performance and export similarity for select
countries within the Tripartite Free Trade Area market
tralac Trade Brief | S13TB03/2013 | Author: Taku Fundira
3
An analysis of Africa’s export performance and export similarity for select
countries within the Tripartite Free Trade Area market
by Taku Fundira
Background
Significant efforts towards regional economic integration are under way in all regions of the world,
involving developing and developed countries alike. Africa is no exception to this trend. Efforts to
integrate the economies of African countries can be traced back to 1910 when the Southern African
Customs Union (SACU) was established. While SACU’s conception was not driven by sovereign
states per se but rather by a decision from the colonial rulers – the British Empire – to facilitate
economic engagement, the importance of trade integration cannot be overemphasised. On a
continental basis, the establishment of the Organisation of African Unity in 1963, which was
disbanded and replaced by the African Union (AU) in 2002, attests to Africa’s drive to secure a long-
term economic and political future.
Motivated by a consensus that by merging its economies and pooling its capacities, endowments and
energies, the African continent could overcome its daunting development challenges, the Abuja Treaty
(1991) laid the groundwork for the creation of the African Economic Community (AEC), with the
regional economic communities (RECs) serving as the building blocks. The RECs are expected to
merge into the African Common Market between 2019 and 2023 (AfDB, 2011).
The United Nations (UN) (2010) notes that economic diversification in Africa can deliver the
improved utilisation of the continent’s vast agricultural and mineral resources. Africa’s economic
prospects can be greatly improved through minerals processing, the expansion of manufacturing
activities, the production and export of non-traditional agricultural and industrial products, and the
further development of services sectors such as tourism. To capitalise on these opportunities, however,
African countries must become integrated into the world economy and develop stronger and more
sophisticated export sectors in order to maintain and achieve sustained growth.
Despite the numerous efforts to integrate, very few successes have been attained. The African
continent has been lagging behind in terms of global competitiveness although it has enormous growth
potential. Indeed, the relationship between economic growth and trade liberalisation has been the
An analysis of Africa’s export performance and export similarity for select
countries within the Tripartite Free Trade Area market
tralac Trade Brief | S13TB03/2013 | Author: Taku Fundira
4
subject of considerable study and analysis, with the majority suggesting a positive correlation between
the two (Baldwin and Venables, 2004). For Africa, regional integration remains the key strategy for
African governments to ‘accelerate the transformation of their fragmented small economies, expand
their markets, widen the region’s economic space, and reap the benefits of economies of scale for
production and trade, thereby maximizing the welfare of their nations’ (UNECA, 2010).
A common understanding in Africa is that this objective can be achieved by fostering intra-African
trade and unifying each regional marketplace through the progressive removal of artificial trade
barriers on the continent. Therefore, RECs are forming free trade areas (FTAs) or customs unions to
integrate national economies, giving them large enough internal markets with the aim of achieving
production efficiency levels comparable to those in the industrialised countries. The FTA or customs
union generates important spin-off effects associated with the enlarged market (UNECA, 2010)1.
The objective
It is against this background that this study aims to discuss the issues of Africa’s export performance
and more specifically export competition for South Africa and Kenya2 in the envisaged COMESA-
EAC-SADC3 Tripartite Free Trade Area (TFTA) which was launched on 12 June 2011 at a summit in
Johannesburg, South Africa.
The motivation behind this analysis is based on the premise that the apparent objective behind the
trade strategies being adopted by African countries is to achieve a number of goals such as to create a
competitive environment and achieve sustainable economic growth and development, with emphasis
being placed on increasing exports. In this process, the TFTA will be the continent’s biggest FTA
comprising 26 countries spanning from Cape Town to Cairo with an estimated market potential of
US$ 1 trillion.4
1 See also Sandrey et al. (2011). 2 Our focus on South Africa and Kenya when looking at export competition is based on the fact that they are the major importers and exporters of goods within the TFTA. Earlier analysis conducted by tralac using the GTAP model confirms that amongst the winners of a successfully established TFTA are South Africa, Kenya and Egypt more especially for manufactured goods (Jensen and Sandrey, 2011). 3 This refers to the southern and eastern regional economic communities of the Common Market for East and Southern Africa (COMESA), the East African Community (EAC) and the Southern African Development Community (SADC). 4 See Fundira (2011).

An analysis of Africa’s export performance and export similarity for select
countries within the Tripartite Free Trade Area market
tralac Trade Brief | S13TB03/2013 | Author: Taku Fundira
5
Methodology
This study investigates the degree of South Africa and/or Kenya’s (RSA-Ken) export similarity with
those of various exporters to the TFTA market. Calculating export similarity is useful in determining
the similarity or dissimilarity of countries in terms of their export compositions. To achieve this, the
Export Similarity Index (ESI) proposed by Finger and Kreinin (1979) is used. The various countries
considered in this analysis include both developing and developed countries.
This comparison serves two purposes: (i) analysing the similarity of RSA-Ken’s exports with those of
other major developing countries provides a measure of how directly these countries compete with
RSA-Ken in the TFTA market; and (ii) the comparison with developed countries offers an indication
of the level of sophistication of their exports (Erlat and Ekmen, 2009).
According to Erlat and Ekment (2009), ‘“[E]xport similarity” is not a concept directly related to
competitiveness. Evaluating the relative competitiveness levels of two countries with very different
trade patterns (and especially with very different export structures) would not make much sense. In
order to be meaningful and indicative for shaping future trade policies, competitiveness of a country
should be analyzed relative to another country which has more-or-less a similar trade structure’.
Finger and Kreinin (1979) note that one advantage of using the ESI over other measures is mainly
because it uses readily available standardised international trade data.
The remainder of this paper is structured as follows. The next section provides an overview of
Africa’s export performance both externally and within the continent. This is then followed by a
review of the concept of export similarity. This is followed by an analysis of South Africa and
Kenya’s export similarity with various major competitors in the TFTA market. The paper concludes
with some policy implications and recommendations.
Africa’s export performance and Foreign Direct Investment in perspective
Historically, Africa’s export performance has typically been portrayed as poor compared to other
developing regions. In the past decade Africa has become a new frontier of economic and other
opportunities. Furthermore, it is host to some of the fastest-growing economies in the world. Real
Gross Domestic Product (GDP) of Africa increased by 5.2% annually in the past decade, compared
with 2.3% in the 1990s (WEF, 2011).

An analysis of Africa’s export performance and export similarity for select
countries within the Tripartite Free Trade Area market
tralac Trade Brief | S13TB03/2013 | Author: Taku Fundira
6
There seems to be consensus among African leaders that a strong export performance is typically a
prerequisite for reaching robust, sustained and shared growth if one considers some of the regional
integration initiatives that are currently being implemented within the continent. Blanke et al. (2011)
note that in Africa strong export performance does not only mean high export growth, but also
increased export diversification from low value-added activities to higher value-added ones. By
diversifying, countries are better able to lower the volatility of growth through a reduced vulnerability
of exports to external shocks. Exports of services are also critical and can play an important role in
this regard.
African policymakers have also recognised the positive role that Foreign Direct Investment (FDI) can
play in promoting growth, productivity, and development in their economies. According to Blanke et
al. (2011), FDI can be particularly beneficial for export sectors, as foreign companies help integrate
developing countries into the global economy by easing access to foreign markets and including local
enterprises in global production chains. The remainder of this section looks at export trends and
initiatives currently undertaken by African countries to attract FDI.
a) Export trends
Although the growth of African economies as a whole accelerated in the past decade, their export
growth rates continued to lag behind those of other developing regions, thus further widening the gap
between Africa and the rest.
Latest available 2011 data reveals that African exports constitute a mere 3% of world export share,
with a value of approximately US$594 billion. Top exporters with their market share include Nigeria
(18%); South Africa (16%); Algeria (12%) and Angola (11%).5
A six-year review of Africa’s performance reveals that out of the top 10 African exporters, only
Ghana (44%), Congo (17%), Nigeria (8%), South Africa (7%), Angola (7%) and Egypt (6%) were
gaining market share in the world market (growth rates above world average growth of 5%).
5 Statistics are based on the author’s calculations using the ITC TradeMap database.

An analysis of Africa’s export performance and export similarity for select
countries within the Tripartite Free Trade Area market
tralac Trade Brief | S13TB03/2013 | Author: Taku Fundira
7
Table 1: Trade indicators for African exports
Exporters Trade indicators
2011
US$ (millions)
Compound annual
growth in value
(2007-2011) (%)
Annual growth in
value (2010-2011) (%)
Share in
exports (%)
World 17 855 727 5 19 100
Africa 593 984 12 20 3.3
Nigeria 109 116 8 37 18.4
South Africa 92 976 7 30 15.7
Algeria 73 436 1 29 12.4
Angola 66 150 7 25 11.1
Egypt 30 782 6 17 5.2
Morocco 21 796 3 22 3.7
Libya 18 740 -18 -62 3.2
Ghana 18 401 44 252 3.1
Tunisia 17 847 2 9 3.0
Congo 16 071 17 132 2.7
Rest of Africa 128 669
21.7
Source: ITC TradeMap
A closer look at Africa’s export product portfolio reveals that growth in exports has been mostly
driven by primary products mainly in mining and mineral products, which accounted for a 72% share
of exports.
Blanke et al. (2011) note that mining represented 73% of export growth between 1995 and 2008, the
highest of all regions. Vulnerability to external shocks remains a major concern, mainly attributed to
the lack of production and export diversification – in terms of both goods and partners.6
Reversing Africa’s marginalisation in global trade, diversifying its exports, and moving them up on
the technology ladder are therefore key policy priorities. Table 2 below highlights the top exported
products and top exporters’ share of the particular product.
6 In general, Africa’s main exports to its traditional trading partners, in particular the EU and the US, constitute an average of 57% of total exports. However, China in particular and Asia in general are also increasingly becoming important export markets for Africa.

An analysis of Africa’s export performance and export similarity for select
countries within the Tripartite Free Trade Area market
tralac Trade Brief | S13TB03/2013 | Author: Taku Fundira
8
Table 2: Top Export products and top exporters (2011)
HS
Code Description
2011
(US$ million) % share Top exporters (%share)
TOTAL All products 593 984
'27 Mineral fuels, oils, distillation products, etc.
348 045 59 Nigeria (30%); Algeria (20%); Angola (19%)
'71 Pearls, precious stones, metals, coins, etc
40 908 7 South Africa (51%); Ghana (11%); Botswana (11%)
'26 Ores, slag and ash 23 536 4 South Africa (61%); DRC (7%); Mauritania (7%)
'85 Electrical, electronic equipment 12 055 2 Tunisia (37%); Morocco (29%); South Africa (14%)
'74 Copper and articles thereof 11 284 2 Zambia (60%); DRC (18%); South Africa (7%)
'72 Iron and steel 10 671 2 South Africa (75%); Egypt (9%); Zimbabwe (3%)
'87 Vehicles other than railway, tramway
8 936 2 South Africa (81%); Tunisia (4%); Morocco (4%)
'84 Machinery, nuclear reactors, boilers, etc.
8 760 1 South Africa (71%); Tunisia (6%); Guinea (3%)
'18 Cocoa and cocoa preparations 8 560 1 Côte d’Ivoire (49%); Ghana (27%); Nigeria (12%)
'89 Ships, boats and other floating structures
7 200 1 Congo (41%); Gabon (15%); Angola (13%)
Other 114 030 19
Source: ITC TradeMap
b) Towards creating an enabling environment for investment in Africa7
Working towards creating an enabling environment to attract foreign direct investment has become a
common phenomenon among African countries at both the national and regional level. In the past few
decades, Africa has made significant strides toward democratic governance, transparent economic
systems, and the elimination of some of the crippling bureaucratic barriers to trade and investment.
Since 2005, of the 53 regulatory changes observed by the United Nations Conference on Trade and
Development (UNCTAD) in Africa, four-fifths (42) were favourable to FDI, while 11 made the
environment less favourable (WIR, 2006).
7 For a more detailed analysis, see an earlier discussion note by the author, available at http://www.tralac.org/2011/11/30/towards-creating-an-enabling-environment-for-investment-in-africa-highlights-of-the-comesa-investment-report/
An analysis of Africa’s export performance and export similarity for select
countries within the Tripartite Free Trade Area market
tralac Trade Brief | S13TB03/2013 | Author: Taku Fundira
9
The positive outcomes of some of these efforts can be seen in countries like Angola, Ethiopia,
Mozambique and Rwanda which recently saw inflation-adjusted growth rates higher than those of
India, Russia or Brazil. The World Bank rates Mauritius a better place to do business than Germany,
and South Africa ranks above Chile. Botswana, Tunisia, Rwanda, Ghana, Namibia, and Zambia all
offer a more favourable entrepreneurial environment than China (de Vignemont and Smallwood,
2011).
Privatisation, long viewed as generally improving the output and efficiency of the organisations that
are privatised, continues across Africa. Algeria, Angola, Comoros, Congo, Côte d’Ivoire, Kenya,
Libya, Mauritius, Morocco, Nigeria, Sierra Leone and Tunisia either privatised specific sectors or
introduced plans to enhance cross-sectoral liberalisation. The industries affected included utilities,
telecommunications and tourism. Some programmes attracted Trans-National Corporations (TNCs)
from developing countries. In Angola, for example, the privatisation agency approved Telecom
Namibia’s bid to become the first private operator of Angola’s fixed-line network. Egypt pursued a
policy aimed at opening up its markets in activities where it had a clear advantage (e.g. tourism) as
well as in some manufacturing (WIR, 2006).
Another set of favourable changes concerns attempts to improve the investment climate. Recognising
that an investor-friendly admission phase has a beneficial effect on the subsequent relationship
between host and investor, a number of countries have reformed their admission procedures by
introducing one-stop shops. A number of African countries, such as Egypt, Ghana, Senegal and South
Africa, have reformed their tax systems, often reducing corporate income taxes. Some have eased
operational conditions for TNCs. For example, Egypt is facilitating the entry and residence of
foreigners (WIR, 2006).
These developments have not only occurred at the country level, but also at the regional level, where
RECs have developed mechanisms aimed at harnessing investments into the region. In eastern and
southern Africa, COMESA and SADC are examples of RECs that have put in place a regional
investment policy aimed at promoting the region as an attractive destination particularly for markets
seeking FDI. For the former, regional investment policy is embodied in the COMESA Common
Investment Area (CCIA) while the latter is enshrined in the SADC Investment and Finance Protocol.
The only REC which is yet to develop mechanisms for a common investment area is the EAC,
although as a result of multiple overlapping memberships, we note that four out of five EAC states are
part of the CCIA, and one country, Tanzania, is part of the SADC Investment and Finance Protocol.

An analysis of Africa’s export performance and export similarity for select
countries within the Tripartite Free Trade Area market
tralac Trade Brief | S13TB03/2013 | Author: Taku Fundira
10
An interesting trend to note with regard to recent investments in Africa,8 which is different to the
nature and type of investments that Africa has traditionally received from the global players, is the
fact that investments are diversified and focus is less concentrated on primary resource-based
investments. Evidence suggests an increase in investment in services. Sectors receiving special
investment attention include telecoms (towers, broadband services), financial services (commercial
banks, insurance, ancillary services such as ATMs), agribusiness, infrastructure, oil and gas (marginal
fields, oil field services, gas development), mining, and electric power (energy infrastructure, energy
services). South Africa continues to play a significant role in terms of intra-African FDI. According to
the World Investment Report (2011), the share of African host countries in the outward stock of South
African FDI increased from less than 5% before 2000 to 22% in 2008, reaching almost $11 billion.
Export similarity and competition
The Export Similarity Index, developed by Finger and Kreinin (1979), is intended to measure the
similarity between exports of any two countries to a third market. The more similar the export profiles
are, the more likely that economies are competitors in global markets. High similarity indices may
also indicate limited potential for inter-industry trade with a regional trading arrangement.
By definition, the ESI is the sum over export categories of the smaller of the sectoral export shares (as
a percentage) of each country under study. The ESI takes a value between 0 and 100%. A value of
zero indicates no overlap in the export profiles (the countries are not competitors), a value of 100
indicates perfect overlap. Mathematically this can be represented as follows:
������, � � ��������
����, ���
�
���� ∗ 100%
Where
���� ������� !�� "�#$ %�� �����%&����%'�� "$% (!)��' ") !��%*�;
��������� ��,-�,!� "�#$ %�� �����%&����%'�� ") !��%*�;
���� ������� !�� "�#$ %�� �����%&����%'�� "$% (!)��' ") !��%*�;
��������� ��,-�,!� "�#$ %�� �����%&����%'�� ") !��%*�. 8 This is mainly intra-African investments: See the COMESA Investment Report 2011.

An analysis of Africa’s export performance and export similarity for select
countries within the Tripartite Free Trade Area market
tralac Trade Brief | S13TB03/2013 | Author: Taku Fundira
11
We note that ESI is also not affected by the relative sizes of the exports. According to Finger and
Kreinin (1979: 906), ’[S]ince the index is intended to compare only patterns of exports across product
categories, it should not be influenced by the relative sizes or scales of total exports’.
The major limitation of the ESI is that it is sensitive to the chosen level of data such that its value
increases with the higher level of aggregation and vice versa. By keeping this in mind in interpreting
the results, we make our calculations at a relatively disaggregated level in order to see the
heterogeneities across/within industries.
The analysis: data issues
Export figures of South Africa, Kenya, and Brazil, Russia, India, and China (the BRIC countries) as
well as of the European Union (EU), Japan and the United States of America (US) are analysed in the
target market of the TFTA.
Two trade data sources are used in the analysis: the Global Trade Atlas (BRICS and Japan) and the
International Trade Centre (ITC) TradeMap database (Kenya, the EU and the US) at the four-digit
Harmonised System9 (HS) level of classification. We note the limitations of trade data, and, for this
section especially, access to reliable African trade data, as it does impact on the analysis. Furthermore,
as trade data may be distorted or simply not reported for a given year, we only considered a review
period for the years where data was available; in this case the majority had available data for a five-
year period (2006-2011, with 2011 the latest available year for data sourced from ITC TradeMap for
countries under review). We must therefore treat the analysis as indicative of trade flows over the
review period.
We would further caution that this analysis is one that, while perhaps providing some useful pointers,
does have limitations as highlighted already. Limitations include the fact that there may be non-tariff
barriers operating; tastes and preferences may be a factor; and trade classifications of products at a
detailed level may not be strictly comparable.
Therefore export figures of the TFTA from countries in our sample can only provide meaningful and
indicative ESI at the four-digit (HS4) level of trade as opposed to the ideal relatively more
disaggregated six-digit (HS6) level. At the HS6 level, our initial analysis indicates a high level of
9 The Harmonised System is a merchandise trade classification that operates in a sequentially more detailed level from internationally harmonised (hence the name) HS2 to 4- and 6-digit levels, and often operates down even to HS10 for individual countries.

An analysis of Africa’s export performance and export similarity for select
countries within the Tripartite Free Trade Area market
tralac Trade Brief | S13TB03/2013 | Author: Taku Fundira
12
heterogeneity and is thus interpreted as implying no competition among the countries in our sample.
Thus, by comparing the ESI at the HS4, some level of similarity is observed for certain specific
sectors or product groups.
The analysis: results
Figure 1 presents the graphical results for South Africa and Kenya’s ESI with select partner countries
from 2006 to 2011. As already noted, an ESI takes a value between 0 and 1. Therefore if, for example,
country ‘i’ and country ‘j’ export similar goods to the TFTA market, ESI equals 1; if exports of the
two countries are absolutely different, then ESI equals 0. If the index takes on an ascending trend over
the review period, we can conclude that the two countries share more and more similar export
structures, that is, they compete more and more fiercely in the TFTA market.
In Figure 1, the two graphs represent South Africa and Kenya’s ESI with each other and other
developing and developed countries. Generally, for each of the paired countries, the ESI is relatively
low – below 50% for all countries under review with the exception of the South Africa-EU ESI that is
over 50% for most of the period under review. Thus, given these ESI figures, the notion of fierce
competition for the TFTA market is not yet prevalent now.
Figure 1: South Africa’s and Kenya’s Export Similarity indeces with select countries for the
TFTA market

An analysis of Africa’s export performance and export similarity for select
countries within the Tripartite Free Trade Area market
tralac Trade Brief | S13TB03/2013 | Author: Taku Fundira
13
The South Africa and Kenya ESI
For South Africa, the EU has the highest ESI over the review period. The main trends are the relative
increasing ESI of South Africa and all the countries under review up to the 2008/2009 period with the
exception of Brazil.10 Post-2009, the trends are somewhat mixed. First, a relative declining trend is
observed for South Africa’s ESI with the EU, Kenya, US, Brazil and Russia, and secondly Japan,
India, and China revert to the pre-2008 relative increasing trend. The main reasons are as follows:
• Firstly, on gross trade volume level, the TFTA countries are negotiating FTAs and preferential
agreements not only with South Africa but also with the other countries under review such as
the ACP-EU Economic Partnership Arrangements (EPAs). Where there are no formal
negotiations, cooperation agreements through initiatives such as the Forum on China-Africa
Cooperation (FOCAC), the India-Africa Summit and the Brazil-Africa Summit have made
these countries potential suppliers into the TFTA market. Therefore, the closer trade-partner
relationships developed have positive effects on their exports to the TFTA market. All these
initiatives would cause a disadvantageous environment for South African products into the
TFTA market.
• Secondly, on a product level (see Table 3), South Africa competes relatively more with
countries that have a relatively diversified export portfolio in the TFTA market, although this
10 We note the anomaly in the RSA-Brazil ESI for 2008, which indicates no overlap of exports in that year, which may be partly attributed to competition in substitutes in the TFTA market.

An analysis of Africa’s export performance and export similarity for select
countries within the Tripartite Free Trade Area market
tralac Trade Brief | S13TB03/2013 | Author: Taku Fundira
14
may not be evident in the top 10 exports11 to the TFTA of the respective countries. The main
competitors, which are also traditional trading partners of Africa, include the EU and the US,
but also the emerging giant – China.
For Kenya, export overlap is much lower with maximum ESI not exceeding 35%. Furthermore, the
main trends are somewhat different to that of South Africa in the TFTA market although the EU has
the highest export overlap (ESI= 35%). Over the review period, the ESI trends fall into three
categories: i) relatively increasing or stable over review period (EU, Japan and China); ii) relatively
increasing and then declining (Brazil and the US); and iii) fluctuating (India and Russia). Export-
product composition indicates that Kenya does not export similar products (low export overlap) to
other countries under review.
11 The top 10 products do not show any homogeneity between South Africa and its competitors.

An analysis of Africa’s export performance and export similarity for select countries within the Tripartite Free Trade Area market
tralac Trade Brief | S13TB03/2013 | Author: Taku Fundira
15
Table 3: Top 10 export commodities for select countries to the TFTA market at HS4 level (US$ millions)
RSA Kenya EU
_Total
All Commodities
2006 2011 _Total
All Commodities
2006 2011 _Total
All Commodities
2006 2011
1 454 3 359 1 345 2 603 54 904 78 470
HS Description HS Description HS Description
1001 Wheat and meslin 379 1 772 0902 Tea 168 254 2710 Petroleum oils, not crude
1 697 4 521
4407 Wood sawn or chipped 254 296 2710 Petroleum oils, not crude 96 169 8703 Cars (including station wagon)
2 995 3 339
2710 Oil (not crude) 4 172 2523 Cements, portland 45 117 8517 Electric appliances for line telephony
807 2 817
1512 Sunflower seed, safflow 41 139 1511 Palm oil & its fraction 24 104 3004 Medicament mixtures 1 485 2 651
8802 Aircraft, powered; spacecraft
0 122 3401 Soap 19 94 8708 Parts & access of motor vehicles
1 978 2 468
4412 Plywood, veneered panels
48 92 7210 Flat-rolled products of iron or non-al/s
77 94 9999 Commodities not elsewhere specified
1 640 2 027
3105 Fertiliser 9 76 3923 Plastic packing goods 46 81 8802 Aircraft (helicopters, aeroplanes)
712 1 470
7208 Fl-rl iron & na steel 33 57 2402 Cigars, cheroots, cigarillos & cigarettes
41 70 7102 Diamonds, not mounted or set
706 1 264
7203 Spongy ferrous products & iron
0 53 3004 Medicament mixtures 31 64 8471 Automatic data processing machines
1 068 1 043
8704 Motor vehicles for transport of goods
32 44 2403 Pipe, chewing & snuff tobaccos
0 58 8704 Trucks, motor vehicles 1 076 1 022
Other 654 536
Other 799 1 499
Other 40 738 55 848

An analysis of Africa’s export performance and export similarity for select countries within the Tripartite Free Trade Area market
tralac Trade Brief | S13TB03/2013 | Author: Taku Fundira
16
Table 3 continued
US Japan Russia
_Total
All Commodities
2006 2011 _Total
All Commodities
2006 2011 _Total
All Commodities
2006 2011
12 120 18 347 6 740 7 639 1 454 3 359
HS Description HS Description HS Description
9999 Commodities not elsewhere specified
698 2 320 8703 Motor cars & vehicles for transporting persons
1 719 1 464 1001 Wheat and meslin 379 1 772
1001 Wheat and meslin 351 1 186 8704 Motor vehicles for transport of goods
934 1 094 4407 Wood sawn or chipped 254 296
1005 Maize (corn) 504 713 8708 Parts & accessories for motor vehicles
538 501 2710 Oil (not crude) 4 172
8431 Machinery part 882 690 8408 Compression, internal combustion piston engines
247 498 1512 Sunflower seed, safflow or cottonseed oil
41 139
7108 Gold unwrought or in semi-manufactured forms
0 530 8702 Motor vehicle for transport
251 390 8802 Aircraft, powered; spacecraft
0 122
8704 Trucks, motor vehicles 189 409 8429 Self-propelled bulldozers, graders
234 342 4412 Plywood, veneered panels
48 92
2710 Petroleum oils, not crude
96 406 4011 New pneumatic tyres, of rubber
145 224 3105 Fertilisers 9 76
8701 Tractors 195 393 7208 Fl-rl iron & na steel 39 209 7208 Fl-rl iron & na steel 33 57
8703 Cars (including station wagons)
338 386 0000 Special HS CI/JP/KR/MX/NO
82 132 7203 Spongy ferrous products & iron
0 53
7204 Ferrous waste and scrap iron & steel
115 383 8406 Steam turbines & other vapour turbines, parts
5 107 8704 Motor vehicles for transport of goods
32 44
Other 8 753 10 933
Other 2 546 2 678
Other 654 536

An analysis of Africa’s export performance and export similarity for select countries within the Tripartite Free Trade Area market
tralac Trade Brief | S13TB03/2013 | Author: Taku Fundira
17
Table 3 cont.
Brazil India China
_Total
All Commodities
2006 2011 _Total
All Commodities
2006 2011 _Total
All Commodities
2006 2011
4 188 6 241 6 618 16 128 14 714 36 896
HS Description HS Description HS Description
1701 Cane Or Beet Sugar 577 1 388 2710 Oil (not crude) 2 246 4 739 8517 Electric apparatus for line telephony
294 1 642
0207 Meat & Ed Offal Of Poultry
232 574 3004 Medicaments 314 993 6402 Footwear 325 902
2601 Iron Ores & Concentrates,
383 567 8703 Motor cars & vehicles 227 782 6104 Women’s or girls’ suits 248 807
0202 Meat Of Bovine Animals, Frozen
422 465 1701 Cane or beet sugar 16 433 4011 New pneumatic tyres, of rubber
231 745
1507 Soybean Oil 37 215 8517 Electric apparatus for line telephony, etc., parts
2 391 4202 Travel goods, handbags, wallets
171 742
1001 Wheat And Meslin 9 190 0202 Meat of bovine animals, frozen
78 305 8471 Automatic data process machines
269 722
8701 Tractors 145 173 2818 Artificial corundum 18 296 5407 Woven fabric of synthetic fil yarn
302 570
1005 Corn (Maize) 11 154 7210 Fl-rl iron & na steel 182 291 6103 Men’s or boys’ suits 169 513
8704 Motor Vehicles For Transport Of Goods
204 130 5205 Cotton yarn (not sewing thread)
124 235 9403 Furniture nesoi and parts thereof
93 443
8708 Parts & Access For Motor Vehicles
175 128 7208 Fl-rl iron & na steel 82 202 8429 Self-propelled bulldozers
135 435
Other 1 993 2 257
Other 3 329 7 461
Other 12 477 29 375

An analysis of Africa’s export performance and export similarity for select
countries within the Tripartite Free Trade Area market
tralac Trade Brief | S13TB03/2013 | Author: Taku Fundira
18
Brazil, India and China ESI
We noted that in the TFTA market trade data used in the analysis indicates relatively low levels of
export overlap/similarity (ESI ≤ 0.5) for all countries under review. It is worthwhile to analyse how
other emerging markets especially Brazil, China and India are competing against a) each other in the
TFTA, and b) against Africa’s traditional partners from the north (namely the EU and US). Japan and
Russia are also interesting countries to analyse as all of them have shown significant interest in the
African market over the past decade (Fundira, 2012a). Figure 2 below provides a graphical illustration
of ESI trends for Brazil, China and India in the TFTA market.
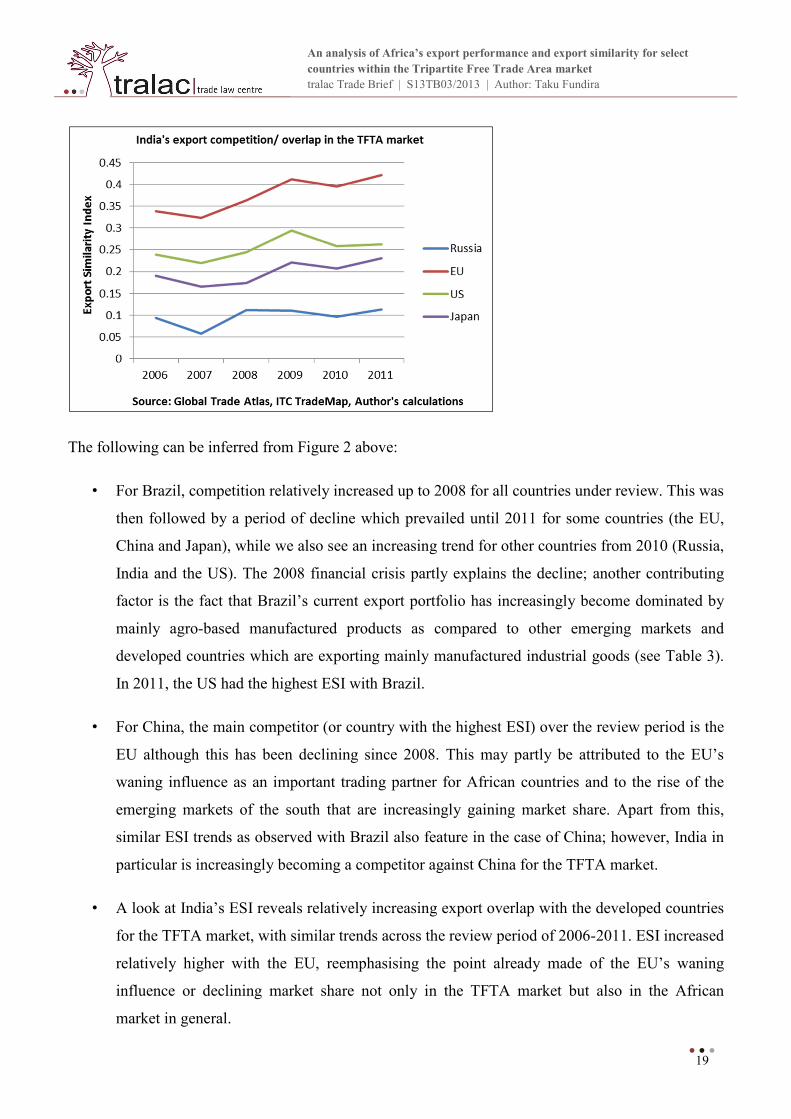
Figure 2: Export Similarity Indeces for Brazil, China and India with select countries in the
TFTA market
An analysis of Africa’s export performance and export similarity for select
countries within the Tripartite Free Trade Area market
tralac Trade Brief | S13TB03/2013 | Author: Taku Fundira
19
The following can be inferred from Figure 2 above:
• For Brazil, competition relatively increased up to 2008 for all countries under review. This was
then followed by a period of decline which prevailed until 2011 for some countries (the EU,
China and Japan), while we also see an increasing trend for other countries from 2010 (Russia,
India and the US). The 2008 financial crisis partly explains the decline; another contributing
factor is the fact that Brazil’s current export portfolio has increasingly become dominated by
mainly agro-based manufactured products as compared to other emerging markets and
developed countries which are exporting mainly manufactured industrial goods (see Table 3).
In 2011, the US had the highest ESI with Brazil.
• For China, the main competitor (or country with the highest ESI) over the review period is the
EU although this has been declining since 2008. This may partly be attributed to the EU’s
waning influence as an important trading partner for African countries and to the rise of the
emerging markets of the south that are increasingly gaining market share. Apart from this,
similar ESI trends as observed with Brazil also feature in the case of China; however, India in
particular is increasingly becoming a competitor against China for the TFTA market.
• A look at India’s ESI reveals relatively increasing export overlap with the developed countries
for the TFTA market, with similar trends across the review period of 2006-2011. ESI increased
relatively higher with the EU, reemphasising the point already made of the EU’s waning
influence or declining market share not only in the TFTA market but also in the African
market in general.

An analysis of Africa’s export performance and export similarity for select
countries within the Tripartite Free Trade Area market
tralac Trade Brief | S13TB03/2013 | Author: Taku Fundira
20
Conclusion
This paper reviewed Africa’s export performance and the export similarity of South Africa, Kenya
and also other select countries (BRIC, EU, the US, Japan) in the target TFTA market. It is undeniable
that other factors exist – with the exception of tariffs – that weaken the trade effects on South Africa
and/or Kenya in the TFTA. These include competition in the substitutes between South Africa and/or
Kenya and TFTA members; competition from other countries signing FTAs; preferential agreements;
or even increasing trade partnerships with TFTA members in the TFTA market. Such factors cannot
be ignored.
It is undoubtedly true that in the future the TFTA market will be an important market, not only for the
member countries whose objective is to increase intraregional trade, but also for third-party countries
such as the emerging markets of the south and also the traditional partners of the north. In this context,
the ESI was used to analyse the level of competition in the TFTA market. We conclude that from the
current analysis we cannot state with any degree of confidence the extent to which South Africa
and/or Kenya face competition for the TFTA market from third-party countries such as the BRIC
countries, the EU, the US or Japan. The ESI calculated for any particular competing countries for the
TFTA market was low (less than 50%) implying relatively low competition/overlap.
However, the indications are that there will be fierce competition for the TFTA market, more
especially as African countries such as South Africa and/or Kenya among others diversify their export
base. In the current environment, there is still space for South Africa or Kenya and other African
countries not considered here to optimise their export structure so as not to lose existing or potential
market share in the TFTA market. While other variables can also exert a significant influence on trade
volume and trade flows in the TFTA market, the envisaged TFTA provides more opportunities for the
African countries if properly structured and implemented. It is up to the TFTA members to ensure that
such opportunities are harnessed.
Recommendations: What can African countries do to enhance their
competitiveness?
This question is not a new one. It has been resonating among researchers and policy makers alike. It is
one that has no one-size-fits-all approach. It is one that requires a step-by-step approach and a review
of past experiences and lessons learnt. We leave these important topics for future research.

An analysis of Africa’s export performance and export similarity for select
countries within the Tripartite Free Trade Area market
tralac Trade Brief | S13TB03/2013 | Author: Taku Fundira
21
However, there is one important topic on which there is consensus regarding its role in enhancing
competitiveness amongst African governments and that is the approach to regional integration.
Despite the numerous efforts to integrate, very few successes have been attained. The African
continent has been lagging behind in terms of global competitiveness although it has enormous growth
potential.
Time for a new culture, a new ideology12
A new culture and a new ideology amongst African countries are necessary in order to complete
effective economic integration. The fact that the African Union ceased recognising new RECs and
encouraged the consolidation of existing RECs to which governments are complying demonstrates a
strong political commitment on the part of the partner states. However, the existing RECs still have to
overcome major challenges. The main challenge is the gap between the commitments and their
implementation.
At this early stage, there are important lessons to be learnt and consideration to be given as to what
would contribute to a successful regional economic integration arrangement. Within the building
blocks – the RECs – there is firstly a need to provide the regional institutions and mainly the
secretariats with a clear mandate to make independent decisions guided by the agreements.
Furthermore, to function effectively, these regional institutions and secretariats should be provided
with adequate resources both in terms of financial and human capital. The recent introduction of a
community levy in CEMAC, EAC and the Economic Community of West African States (ECOWAS)
is a first step to address these financial difficulties.
What will mark a turning point for African integration is the commitment of member states to the
development of a comprehensive rules-based integration arrangement within the consolidated RECs.
This implies that they will implement the provisions of the agreement and subscribe to effective
monitoring of compliance and sanctions for non-compliance. The remedy lies in the outcome of the
political economy that operates differently and is distinct from the past.
12 For a full discussion see Fundira (2012b).

An analysis of Africa’s export performance and export similarity for select
countries within the Tripartite Free Trade Area market
tralac Trade Brief | S13TB03/2013 | Author: Taku Fundira
22
References
AfDB. 2011. Southern Africa Regional Integration Strategy Paper 2011 – 2015. Tunis (Tunisia):
African Development Bank Group. [Online]. Available:
http://www.afdb.org/fileadmin/uploads/afdb/Documents/Project-and-Operations/2011-2015%20-
%20Southern%20Africa%20-%20Regional%20Integration%20Strategy%20Paper.pdf.
Baldwin, R.E. and Venables, A.J. 2004. Regional Economic Integration. Working Paper 14. Geneva:
Graduate Institute of International Studies.
Blanke, J., Brixiova, Z., Dadush, U., Gurcanlar, T. and Iarossi, G. 2011. Exports, FDI, and
Competitiveness in Africa. The Africa Competitiveness Report 2011. World Economic Forum, the
World Bank and the African Development Bank. [Online]. Available:
http://www3.weforum.org/docs/WEF_GCR_Africa_Report_2011.pdf.
COMESA. 2011. COMESA Investment Report. Common Market for Eastern and Southern Africa.
[Online]. Available:
http://www.comesa.int/attachments/article/239/2011%20COMESA%20Investment%20Report.pdf.
de Vignemont, G. and Smallwood, R. 2011. Africa: the next investment destination. Price Waterhouse
Coopers (PWC). [Online]. Available: https://www.africataxsymposium.co.za/downloads/ATBS-Ses-
2011-28-15-00-06.pdf.
Erlat G. and Ekmen, S. 2009. Export Similarity And Competitiveness: The Case of Turkey in the EU
Market. Paper presented at EconAnadolu 2009: Anadolu International Conference in Economics June
17-19, 2009, Eskişehir, Turkey. [Online]. Available:
http://econ.anadolu.edu.tr/fullpapers/Erlat_Ekmen_econanadolu2009.pdf
Finger J.M. and Kreinin, M.E. 1979. A measure of ‘export similarity’ and its possible uses. Economic
Journal, 89: 905-912, December. [Online]. Available:
http://graduateinstitute.ch/webdav/site/ctei/shared/CTEI/Baldwin/Publications/Chapters/Trade%20Th
eory/Baldwin_Venables_Handbook.pdf
Fundira, T. 2011. Launching the Tripartite Free Trade Area negotiations: opportunities and
challenges. tralac Hot Seat Comment, 15 June. Stellenbosch. [Online]. Available:
http://www.tralac.org/2011/06/15/launching-the-tripartite-free-trade-area-negotiations-opportunities-
and-challenges/

An analysis of Africa’s export performance and export similarity for select
countries within the Tripartite Free Trade Area market
tralac Trade Brief | S13TB03/2013 | Author: Taku Fundira
23
Fundira T. 2012a. Trade at a glance: the BRICS and Japan’s engagement with Africa. Stellenbosch:
tralac. [Online]. Available: http://www.tralac.org/files/2012/01/S12WP012012-TradeAtGlance-
BRICSJapanAfrica-20120125fin.pdf.
Fundira, T. 2012b. Prospects for attaining a Continental Free Trade Area: amidst a culture of missed
deadlines in Africa. tralac Hot Seat Comment, 12 December. Stellenbosch. [Online]. Available:
http://www.tralac.org/2012/12/12/prospects-for-attaining-a-continental-free-trade-area-amidst-a-
culture-of-missed-deadlines-in-africa/.
Grinsted, J. and Sandrey, R. 2011. The Tripartite Free Trade Area: A Computer Analysis. In Sandrey,
R. Grinstad, H.J. Vink, N. Fundira, T. Wiljoen, W. 2011. Cape to Cairo – an assessment of the
tripartite free trade area. [Online]. Available: http://www.tralac.org/2011/06/15/cape-to-cairo-an-
assessment-of-the-tripartite-free-trade-area/
Sandrey, R. Grinstad, H.J. Vink, N. Fundira, T. Wiljoen, W. 2011. Cape to Cairo – an assessment of
the tripartite free trade area. [Online]. Available: http://www.tralac.org/2011/06/15/cape-to-cairo-an-
assessment-of-the-tripartite-free-trade-area/
UNECA. 2010. Assessing Regional Integration in Africa IV: Enhancing Intra-African Trade. Addis
Ababa: Economic Commission for Africa. [Online]. Available:
http://uneca.africa-devnet.org/files/Assessing%20Regional%20Integration%20in%20Africa%204.pdf
Vogl, M. and Ouattara, W. 2012. Obstacles to sustainable regional integration in West Africa. GREAT
Insights, 1(9). November. [Online]. Available:
http://www.ecdpm.org/Web_ECDPM/Web/Content/Navigation.nsf/index2?readform&http://www.ecd
pm.org/Web_ECDPM/Web/Content/Content.nsf/0/FD921CD94A523CD8C1257AAD0046E809?Ope
nDocument
WEF. 2011. Africa Competitiveness Report 2011. World Economic Forum. [Online]. Available:
http://www3.weforum.org/docs/WEF_GCR_Africa_Report_2011.pdf.
WIR. 2006. FDI from developing and transition economies: implications for development. World
Investment Report, UNCTAD.
WIR. 2011. Non-equity modes of international production and development. World Investment
Report, UNCTAD.
- - -