Embed Size (px)
Citation preview

An alginate impression method to detect dental caries in
patients with crown and bridge restorations
N J Mentz Johannesburg
2007

An alginate impression method to detect dental caries in patients with crown and bridge restorations
Nicolaas Johannes Mentz A research report submitted to the Faculty of Dentistry, University of the Witwatersrand
Johannesburg, in partial fulfillment of the requirement of the degree of Master of
Dentistry.
Johannesburg
2007
ii
Declaration
_____________________________________________________
I, Nicolaas Johannes Mentz, declare that this research work is my own work and has not been submitted or incorporated in another dissertation or thesis for another degree. The experimental work was performed in the Department of Oral Microbiology, School of Oral health Sciences, University of the Witwatersrand.
_______________ N J MENTZ
iii

Dedication
This research report is dedicated to my wife JoAnne, and my three children Nicolas, Christine, and Jonathan who supported and encouraged me.
iv
Acknowledgements
_____________________________________________________ For the tireless efforts of Professor Maeve Coogan whose guidance during the experimental phase and advice in preparing this research report were of immense value.
v

Abstract
Introduction: Patients with numerous crowns and bridges are at risk of
developing secondary caries on cervical margins of the crowns. This recurrent
decay accounts for 60% of the reasons for the replacement of restorations.
Detection and treatment of subclinical lesions is important to prevent cavitation.
An alginate impression material has been used to locate cariogenic bacteria in
established carious lesions. Aims: An alginate impression technique was used to
assess the level of Streptococcus mutans and Lactobacilli on the crown margins
of the teeth of the restored group and control subjects. Conventional caries
activity tests were also used to compare these two groups. Methods: Twenty
control group subjects with no crowns and a mean DMFS of 16 and 20 the
restored group patients with at least 10 crowns and a mean DMFS of 129 were
included in the study. Impressions were taken with a hydrocolloid material mixed
with culture broth, incubated and examined for the presence of S. mutans and
Lactobacilli on the cervical margins. The results were compared using the two-
sample t-test, chi-squared test and a generalized logistic regression analysis.
Results: More S. mutans and Lactobacilli were cultured on impressions of the
restored group than the control patients (p=0.01 and 0.002). A higher proportion
of patients in the restored group had high concentrations of S. mutans and
Lactobacilli on their teeth than subjects in the control group (p < 0.001). In the
restored group, sixty six per cent of teeth in the posterior and 48% in the anterior
segment were crowns. S. mutans and Lactobacilli were found in higher
concentrations on the posterior than the anterior teeth of the restored group
patients than the control patients (p = 0.016 and 0.047). Furthermore, more
Lactobacilli were cultured from the saliva of the restored group than control
subjects while the buffering capacity of plaque and the ability of saliva to
neutralize acids were lower in the restored group than control group subjects.
Conclusion: The impression technique showed that S. mutans and Lactobacilli
accumulated in the posterior of the mouth and were associated with crowns
indicating these particular sites are at risk.
vi
Table of Contents _______________________________________________________ Declaration……………………………………………………………….………………….. iii
Dedication ……………………………………………………………………………….…... iv
Acknowledgement…………………………………………………………….……………. v
Abstract………………………………………………………………………………………. vi
Table of Contents…………………………………………………………………………… vii
List of Tables………………………………………………………………………………… ix
List of Figures……………………………………………………………………………….. xi
Chapter 1: Introduction………………………………………………………………….…. 1
1.2 The Diagnosis of dental caries……………………………………………………..…. 3
1.3 Methods of dental detection……………………………………………………….….. 3
1.3.1 Visual examination……………………………………………………………….….. 3
1.3.2 Radiographic observations…………………………………………………….….… 4
1.3.3 Fibreoptical transillumination examination (FOTI)………………….…................. 4
1.3.4 Other methods of detection………………………………………….…………….... 5
1.4 Factors implicated in dental caries……………………………………….….............. 5
1.4.1 The Influence of diet……………………………………………………………….… 6
1.4.2 Cariogenic bacteria………………………………………………………..…………. 6
1.4.3 Susceptible host…………………………………………………………………….... 8
1.4.3.1 Saliva flow……………………………………………………………….………….. 8
1.4.3.2 Plaque pH……………………………………………………………….…………... 9
1.5 The Present study……………………………………………………….……………... 9
1.5.1 Aims…………………………………………………………….……….…………….. 10
Chapter 2: Methods and materials…………………………………………………….…. 11
2.1 Selection of subjects……………………………………………………….…………... 11
2.2 Clinical evaluation………………………………………………………….…………… 11
2.2.1 Radiographic evaluation………………………………………………….……….…. 11
2.2.2 Visual examination…………………….………………………………………….….. 11
2.3 Plaque index…………………………………………………………………………….. 12
2.4 Diet analysis…………………………………………………………………………….. 12
vii

2.5 Saliva collection…………………………………………………………………………. 12
2.6 Buffering capacity of plaque…………………………………………………………… 13
2.7 Lactobacilli and Streptococcus mutans counts……………………………………… 13
2.8 The Impression technique…………………………………………………….............. 13
2.9 Statistical analysis……………………………………………………………………… 15
Chapter 3: Results………………………………………………………………………….. 16
3.1 Saliva buffering and flow………………………………………………………………. 16
3.2 Buffering capacity of plaque…………………………………………………………… 16
3.3 DMFS and plaque index……………………………………………………………….. 16
3.4 Diet……………………………………………………………………………………….. 16
3.5 Salivary S. mutans and Lactobacilli………………………………………….............. 17
3.6 Overall comparison of S. mutans and Lactobacilli on impressions……………….. 17
3.7 The Position of restorations in the restored patients……………………………….. 17
3.8 The Distribution of microorganisms on impressions of natural teeth……………... 17
3.9 S. mutans on impressions………………...…………………………………………… 17
3.10 Lactobacilli on impressions………………………………………………….............. 18
Chapter 4: Discussion…………………………………………………………….............. 28
4.1 Saliva buffering and saliva flow………………………………….……………………. 28
4.2 Buffering capacity of plaque…………………………………………………………… 29
4.3 Plaque index…………………………………………………………………………….. 30
4.4 Diet analysis…………………………………………………………………………….. 30
4.5 S. mutans and Lactobacilli in saliva………………………………………………….. 31
4.6 S. mutans and Lactobacilli on impressions………………………………………….. 31
4.7 Distributions of S. mutans on the maxilla and the mandible……...………………... 33
4.8 Distribution of Lactobacilli on the maxilla and the mandible……………………….. 34
4.9 Conclusion………………………………………………………………………………. 34
Chapter 5: List of references………………………………………………...……………. 37
viii
List of tables.
Table 1. The flow rate of saliva in the restored and control group subjects at rest and
stimulated by chewing and acid…………………….…………………….... …......................19
Table 2. The buffering capacity of resting and stimulated saliva produced by chewing and
exposure to citric acid in the restored and control group subjects………………………….19
Table 3. Buffering capacity of plaque in the restored and control group
subjects…….…………………………………………………………….………………………. 20
Table 4. The plaque index of the restored and control group
subjects…...………………………………………………………………………………………20
Table 5. The percentage of teeth with plaque in the left posterior, right posterior and
anterior segments of the mandible and maxilla of the restored group
patients……………………………………………………………………………......................20
Table 6. The percentage of teeth with plaque in the left posterior, right posterior and
anterior segments of the mandible and maxilla in the control group
subjects…………………………………………………………………………..………………..21
Table.7. The dietary intake of the restored group patients and control group
subjects…………………………………………………………………………...…………….…21
Table 8. The logarithm of the number of S. mutans and Lactobacilli in stimulated saliva
produced by chewing…………………………………………………………………………….22
Table 9. Total scores for S. mutans and Lactobacilli on impressions of the
teeth……………………………………………………………………………….………………22
ix

Table 10. The number of teeth, crowns, implants and pontics in the left .posterior, right
posterior and anterior segment of the mandible and maxilla in the restored group
patients………………………………………………...………………………………….…….23
Table 11. The percentage of natural teeth, implants, crowns and pontics that carried
Lactobacilli, S. mutans, Lactobacilli and S. mutans or no microorganisms in control and
the restored group subjects…….…………....………………………….……………………...23
Table 12. The distribution of S. mutans on impressions of the Maxilla teeth of the restored
group and control group subjects. A score of 0 was assigned if no colonies were present
in the segment, 1 for one colony , 2 for two colonies, 3 for three to ten colonies and 4
when confluent colonies were present……………………………………………..............…24
Table 13. The distribution of S. mutans on impressions of the mandibular teeth of the
restored and control group subjects. A score of 0 was assigned if no colonies of S.
mutans were present in the segment, 1 for one colony , 2 for two colonies, 3 for three to
ten colonies and 4 when confluent colonies were present……………….………………….25
Table 14. The distribution of Lactobacilli on impressions of the maxillary teeth of the
restored and control group subjects. A score of 0 was assigned if no colonies of
Lactobacilli were present in the segment, 1 for one colony , 2 for two colonies, 3 for three
to ten colonies and 4 when confluent colonies were present……………………………….26
Table 15. The distribution of Lactobacilli on impressions of the mandibular teeth of the
restored and control group subjects. A score of 0 was assigned if no colonies of
Lactobacilli were present in the segment, 1 for one colony, 2 for two colonies, 3 for three
to ten colonies and 4 when confluent colonies were present……………..………………...27
x

List of figures.
Fig 1 Proposed model of the stages of development of carious lesions………………… 2
xi

Chapter 1
Introduction
Traditionally dental caries has been defined as the localized destruction of the hard
tissues of the tooth by acids produced by bacteria. More recently, this process has
been described as an interaction between a dental plaque biofilm and the tooth
surface and subsurface. The detectable lesion is a manifestation of one of the stages
in the process of remineralization and demineralization. Cavitation occurs if the
process of remineralization and demineralization are out of balance (Pitts, 2004).
The disease process can be visualized in terms of a pie chart (Pitts, 1997), with the
largest slice being the largest component of subclinical lesions. Lesions are
considered by the depth of penetration into the tooth tissue according to a system
used by the World Health Organization. Subclinical caries is the earliest change to
the dental enamel with subsurface enamel demineralization (Pitts, 2004).
Caries can occur at several clinical levels (Figure 1) and ranges from:
• A. Subclinical lesion with mineralization and demineralization and includes
colonization but not invasion
• B. Lesions only detectable by FOTI or radiographs or Diagnodent®
• C. Clinically detectable enamel lesions by visual and radiographic means. D1.
• D. Clinically detectable lesions in enamel by visual inspection. D2.
• E. Clinically detectable lesions in the dentine by visual inspection. D3
• F. Pulpal exposure.

E. Clinically detectable lesions in the dentine by visual inspection. D3.
A. Subclinical lesion with mineralization and demineralization and includes colinization but not invasion.
F.Pulpal exposure
B. Lesions only detectable by FOTI or radiographs or diagnodent
C. Clinically detectable enamel lesions by visual and radiographic means. D1.
D.Clinically detectable lesions in enamel by visual inspection. D2.
Fig 1 Proposed model of the stages of development of carious lesions (Pitts, 1997)
2

1.2 The Diagnosis of dental caries Primary caries occurs on previously unaffected teeth and is most likely in to occur a
younger age group. Secondary caries occurs around old fillings, replacement fillings,
crowns and in teeth that already have restorations (Mjör and Toffenetti, 2000). The
diagnosis of secondary caries is difficult as demonstrated in a study undertaken by
Merrett and Elderton in Scotland in 1984. Several dentists assessed the status of
secondary decay on extracted teeth before they were sectioned in the laboratory.
The clinical evaluation did not always correspond to the laboratory diagnosis of
secondary decay. The reason for operator inconsistency is that the assessment is
subjective and variability occurs even amongst the most experienced practitioners,
especially in the early stages of the disease. This has prompted the development of
alternative methods for the diagnosis of primary and secondary dental caries.
1.3 Methods of caries detection There are several methods employed in the detection of dental caries. Those most
frequently used are visual and radiographic examination.
1.3.1 Visual examination An explorer, dry teeth, and a good light are considered sufficient for the detection of
occlusal lesions (Kidd and Pitts 1990). A sharp explorer is not recommended
because diagnoses based on "sticky" fissures are not accurate, and the use of these
methods promotes decay (Mitropoulos et al, 1990). This method will not detect initial
colonization of the tooth surface by bacteria but relies on an existing established
demineralised lesion. When this method is used, it is possible to overlook root decay
on crown margins especially buccally or palatally during the examination. A further
weakness of this method is that it is difficult to detect caries when the light is poor, in
the presence of debris and in inaccessible areas. However, the method is accurate
when it is employed in the anterior areas of the mouth but poor when used for the
posterior areas (Pitts 1991). It may be valuable in patients with crowned teeth
because Zoellner et al, (2002) detected more caries by visual examination than by
radiographs.
3

1.3.2 Radiographic observations The literature centers on the detection of approximal lesions by means of
radiographs, which play a crucial role in the treatment decisions. The interpretations
of radiographs are extremely operator dependent and radiographic caries diagnosis
can yield many conflicting interpretations on the same radiograph ranging from over
treatment to no treatment (Espelid and Tveit 1986)
Bitewing radiographs are the most frequently performed dental radiographic
examination method but have several shortcomings because an established lesion
may become arrested, and it is not possible to determine if a cavity is progressing.
More than one radiograph is required for a comparative view to detect an increase in
demineralization of the tooth over a period (Pitts, 1997). Another limitation is that the
method is interpreter sensitive, furthermore there are problems associated with a two
dimensional image (Farman 1990, Pitts 1991). However when a lesion on a bitewing
x-ray is detected the lesion has progressed into the dentine and remineralization is
not likely to occur. An added problem is that radiographs can only detect an
established lesion once demineralization has occurred (Kidd and Pitts, 1990).
Fluoride treatment may alter the radiographic appearance of the lesion by making it
radiopaque with radiolucent areas of active decay (Pitts 1991). The detection of
subclinical carious lesions is particularly difficult in patients with crowns and fixed
partial dentures, because visual and radiographic examination is only 75% accurate
(Zoellner et al, 2002).
1.3.3 Fibreoptical transillumination examination (FOTI) A recent development is the use of a fibreoptic probe to transilluminate the teeth. A
study was undertaken to compare this method to visual and radiographic
examination. Transillumination revealed three and a half times more dental lesions
than visual inspection. This method was more valuable for detecting approximal
dentine lesions, but does not readily identify enamel lesions (Pitts, 1997). In addition
more lesions can be detected by radiographic examination than transillumination.
4

This clearly demonstrates that it is not possible to diagnose approximal lesions
adequately when only one method is used (Pitts 1991).
1.3.4 Other methods of detection Several alternative methods have been used to determine decalcification and
cavitation. Seddon (1989) proposed the use of orthodontic elastics to separate the
teeth and take an impression, which is viewed under an electron microscope.
Rimmer and Pitts (1990) separated the teeth and inspected them visually. They
reported an increase in the number of lesions that could be diagnosed using this
method compared to radiographs (Pitts 1991). These techniques are of no clinical
value because it is impractical.
An electrical conductance method that measures electrical conductivity changes
within the tooth caused by demineralization is also not reliable. It has a false-positive
rate of 20% and therefore increases the risk of unnecessary operative intervention.
The electrical conductance diagnostic tool is used mainly in the diagnosis of occlusal
decay. Another method that is used is Laser Fluorescence, which induces
fluorescence of the enamel and discriminates between carious and sound enamel.
The enamel is less fluorescent in areas of reduced mineral content. The
disadvantage of this technique is that wet teeth and plaque films have a negative
effect on laser fluorescence (Tam and Mc Comb 2001).
1.4 Factors implicated in dental caries Three main etiological factors are associated with dental caries, a cariogenic diet, the
action of cariogenic bacteria and a susceptible host.
5
1.4.1 The Influence of diet A study by Tenuta et al (2006) showed that the frequent intake of large amounts of
refined carbohydrates has the single most important influence on acid production,
microbial growth and the development of decay. Dietary analysis indicates that caries
active individuals consumed more sucrose than caries free subjects (Coogan and
Motelekar 1996). A definite relationship appears to exist between the consumption of
refined sugars and the incidence of dental caries. Bacteria will metabolize the sugar
for energy, produce polysaccharides, and create a localized anaerobic condition in
plaque that encourages acid production. The result is the formation of organic acids
such as lactic, propionic and acetic acid. Extracellular polysaccharides also aid in the
adherence of bacteria to tooth structure. In contrast, an increase in dietary fiber
intake appears to require more mastication and has an abrasive and cleaning action
on the teeth and gums contributing to the maintenance of a healthy condition (Cole
and Eastoe 1977).
1.4.2 Cariogenic bacteria There is conclusive evidence to implicate the Streptococcus group of bacteria,
especially Streptococcus mutans in the carious process. Streptococcus mitis,
Streptococcus anginosus, the S. salivarius-group, Enterococcus faecalis,
Actinomyces naeslundii, Actinomyces viscosus and the Lactobacilli can all produced
caries under certain conditions However, the bacteria most often implicated are S.
mutans and the Lactobacilli (Marsh and Martin, 2001). The focus has been on these
bacteria because they are acidogenic i.e. able to ferment sugars to acid, and aciduric
which is the ability to tolerate high levels of acid. S. mutans are moderately aciduric
and can grow at a pH below 5.5. Acids particularly lactic acid cause
demineralization, and result in the formation of a lesion by the dissolution and
removal of calcium and phosphorus ions. The process is characterized by the initial
demineralization of the outer enamel, followed by attack on the underlying dentine
(Kidd and Joyston-Bechal, 1987a). S. mutans can also synthesize extracellular
glucans and fructans that aid in the colonization of the tooth surface. Lactobacilli
6

have similar properties but are mainly associated with the progression of caries
lesions (Hamilton, 1987).
There is a well-established relationship between the microorganism S. mutans and
Lactobacilli in saliva, and the development of dental caries (Jenkins, 1978). S.
mutans may be associated with active lesions in the mouth and may also indicate a
high sucrose intake because these microorganisms are sugar dependent. However,
a relationship exists between decayed and filled surfaces (DFS) and the level of S.
mutans in the mouth while Lactobacilli increase with the caries status of a subject
(Fitzgerald et al, 1994). The presences of Lactobacilli may be an indication of an
active lesion, as well as a high sugar intake and the presence of stagnant areas.
Stagnant areas are prevalent in patients with fixed orthodontic bands, partial
dentures, and erupting third molars (Kleinberg 2002). Smooth surface caries
frequently yield a higher proportion of S. mutans from white spot lesions and produce
a lower and faster rate of pH fall than in adjacent plaque on sound enamel. The
presence of these microorganisms may indicate sub clinical dental caries (Marsh and
Martin 2001).
In 1985 Ellen et al sampled the root surfaces of elderly and infirm patients, with
reduced salivary flow for the presence of cariogenic bacteria. Both S. mutans and
Lactobacilli were frequently isolated from surfaces diagnosed as carious while
surfaces with neither S. mutans nor Lactobacilli were found in caries-inactive
subjects. S. mutans and Lactobacillus were isolated more frequently from caries-free
surfaces in caries-active than caries-inactive subjects and were recovered from
proportionately more surfaces in subjects experiencing new root caries than in those
that remained free of new caries. Patients who carried only S. mutans had a three to
five times higher risk of developing active root caries than those with only
Lactobacilli. A higher salivary lactobacillus count following root exposure due to
periodontal surgery was also noted. They found the best indicator of root caries
development is when S. mutans and Lactobacilli occur together. A shortcoming of
this study was that it was unable to predict which surfaces would develop decay.
7

1.4.3 Susceptible host A susceptible site is an area that favours plaque accumulation because this promotes
stagnation and retention. According to Kidd and Joyston-Bechal (1987a), several
sites are particularly susceptible:
• The enamel pits and fissures of molars and premolars;
• Approximal enamel tooth surfaces just cervical to the contact point;
• The enamel of the cervical margin of the tooth just coronal to the gingival
margin;
• Exposed root surfaces because of gingival recession;
• The margins of restorations especially if they are overhanging or deficient;
• The tooth surfaces adjacent to bridges or dentures.
Patients with numerous crowns are at risk of developing secondary decay. Those
with fixed partial denture abutment teeth have increased secondary decay on the
abutment teeth because the interproximal areas are difficult to access for cleaning
and are prone to the accumulation of plaque (Zoellner et al, 2002). Secondary caries
is a frequent cause of failure in fixed prosthodontics (Glantz et al, 1993) and
accounts for nearly 60% of the reasons for replacement of restorations, most
occurring cervically and approximally.
1.4.3.1 Saliva flow The effect of salivary flow is important in the regulation of the pH in the mouth. In
addition it is supersaturated with calcium and phosphate ions that have the ability to
remineralize early lesions. Absence of saliva or diminished flow can lead to an
increased incidence of dental caries (Kidd and Joyston-Bechal 1987 b, c). The rate of
clearance of carbohydrate after ingestion shows that subjects have either a rapid or a
slow clearance irrespective of the type of carbohydrate. Sucrose is cleared rapidly
from the saliva, but remains above the fasting level for one hour after a sucrose rinse
(Luke et al, 1999).
8

1.4.3.2 Plaque pH After the consumption of carbohydrates, there is a rapid drop in the pH of plaque that
may remain depressed for between 30 and 60 minutes. This pH drop can be plotted
against time and is called the Stephan curve after the person who described it in
1944 (Kidd and Joyston- Bechal 1987 a). The acids produced can be either lactic or
acetic acid, depending on the amount of carbohydrate consumed. The more
carbohydrate consumed, the more lactic acid is formed. This contrasts with acetic
acid, which is produced when carbohydrate intake is low and minimal plaque is
present. Thus acetic acid is beneficial because it has a buffering effect (Coogan and
Motlekar 1996).
1.5 The Present study
Early diagnosis is important in prevention and progression of cavitation considering
the implications, of recurrent decay such as revision treatment, endodontic therapy,
or the loss of teeth. The recording of non-cavitated lesions is essential (Pitts and
Stramm 2004, Pitts 2004). An untreated subclinical lesion forms a cavity that cannot
be remineralized and requires a filling (Kidd and Joyston-Bechal, 1987 b). There are
limits to the visual, radiographic and tactile evaluation of crowns. More sensitive and
specific diagnostic methods are required to detect incipient lesions
Caries activity tests including saliva buffering and flow, the accumulation and
buffering capacity of plaque as well as the diet have been successfully employed to
evaluate the caries status of patients while S. mutans and Lactobacilli in saliva can
be used as predictors of caries activity (Wilson and Ashley, 1989). Bacteria colonize
the tooth surfaces and form a biofilm well before detection of the lesion either by
visual or radiographic means (Marsh, 2004; Guggenheim et al, 2004). S. mutans has
been identified in secondary caries lesions by using confocal laser scanning
microscopy and immunofluorescent labeling (Gonzalez-Cabezas et al, 1995)
whereas the Lactobacilli are closely associated with active lesions (Kleinberg 2002).
Previous studies have shown that high counts of cariogenic microorganisms are
associated with the presence and onset of dental decay (Roeters et al, 1995). Thus
9

patients with a high caries experience will have an increased caries risk if bacteria
have accumulated in a particular site (Bowden, 1996).
Finding a method that can detect S. mutans and Lactobacilli and locating them to
specific sites on the teeth would be valuable. The presence of these cariogenic
bacteria at specific sites could be used for the early diagnosis of carious active
lesions not visible on routine examination. An alginate impression material that can
locate these cariogenic bacteria in established carious lesions on the teeth has been
developed (Coogan, Creaven and Galpin, 1995).
1.5.1 Aims
This study investigated the ability of the impression technique to detect Lactobacilli
and S. mutans on the margins of the teeth of patients with extensive crown
restorations and compared these results with impressions of subjects with no visible
decay. Thus its use in the early diagnosis of dental caries in patients with extensive
restorations would be beneficial. Additional factors that predisposed them to
secondary caries may assist with this diagnosis. Therefore the flow rate and buffering
capacity of saliva, plaque accumulation, sucrose and fibre in the diet and S. mutans
and Lactobacilli in saliva in the two groups were compared.
10

Chapter 2
Methods and Materials 2.1 Selection of subjects Two groups of 20 individuals each with a minimum of 20 teeth were selected for the
study. The restored group included subjects with prosthetic rehabilitation and at least
10 teeth restored with crowns, bridges or implants. The control group had less than
two filled surfaces, no erupting teeth, no active carious lesions, no orthodontic bands
or removable dentures.
2.2 Clinical evaluation Two clinical examinations were undertaken, a radiographic and a visual evaluation.
2.2.1 Radiographic evaluation. Two bitewing radiographs were taken to evaluate the posterior occlusion. The
radiographs were taken using a Sirona 60 Kv x-ray unit and Kodak type E film and
developed in an automatic developer. The x-rays were viewed using a standard
viewing box at three times magnification. The anterior teeth were not x-rayed as
these teeth could be evaluated by using visual means (Pitts 1991). The radiographs
were reexamined after 1 month to check for operator consistency.
2.2.2 Visual examination Visual examination was undertaken to establish the presence of decay. The number
of decayed missing and filled surfaces (DMFS) was counted. The examination was
conducted in a dental chair using a dental light and five times magnification loops.
The number of tooth surfaces was recorded as sound, decayed, missing, and filled
using the criteria of Kidd and Joyston-Bechal (1987 c). Probing of teeth is not
recommended because the visual assessment of the teeth gives the same
information as a combined visual-tactile examination (Hildebrandt, 1995).
11
2.3 Plaque index A plaque index was obtained by painting the teeth with Lorvic® new 2-tone
disclosing solution (The Lorvic Corporation , St Louis) using a cotton ball and asking
the patient to rinse their mouths with plain water. The number of mesial, distal,
palatal and buccal surfaces with plaque was counted and recorded as a percentage
of surfaces covered by plaque.
2.4 Diet analysis The patients were asked to fill in a four-day diet sheet, and record everything they ate
or drank during the four-days. The daily sucrose and fibre intake was calculated
using the tables compiled by Langenhoven et al (1991).
2.5 Saliva collection
Three samples of saliva were collected in sterile McCartney bottles.
• Resting saliva sample was collected while the patients were asked to sit
quietly and expectorate into a bottle for 10 minutes.
• Stimulated saliva produced by chewing. Patients were asked to chew on a
sterile rubber tube while expectorating into a sterile bottle for 10 mins. This
saliva samples was used for culturing Lactobacillus and S. mutans.
• Saliva stimulated by exposure to acid was obtained by placing 0.5ml 2% citric
acid on the tongue at one-minute intervals for 10 mins while the patients were
expectorating into a bottle.
The volume of saliva that was produced in 10 minutes was measured. Thereafter the
modified Driesen test was used to test the buffering capacity of the saliva (Driesen et
al, 1946). Two milliliters of concentrated saliva were placed in a conical flask with two
drops of the indicators Bromocresol Purple and Bromocresol Green. The samples
were titrated against 0.01N lactic acid to a pH of 4, the end point of Bromocresol
Green. The amount of acid that changed the colour from blue to green indicated the
buffering capacity of saliva. The results were expressed as mls 0.01N lactic acid.
12

2.6 Buffering capacity of plaque
The initial pH of plaque on the tongue was determined by placing MERCK
Universalindikator pH0-14 (Merck KGaA 64271 Darmstadt Germany) on the tongue
and recording the result. Thereafter the patients were asked to rinse their mouths
with 25 ml 10% glucose for two minutes. The pH of the plaque on the tongue was
recorded after five minutes and thereafter at five minute intervals either for a period
of 30 minutes until a pH of 7 or the initial resting pH was reached. The plaque on the
tongue was used to measure the pH of plaque because a recent study has shown
that the pH of plaque on the tongue is similar to plaque that accumulates on teeth
(Ferjskov et al, 1992).
2.7 Lactobacilli and Streptococcus mutans counts The stimulated saliva produced while chewing was diluted 1:10, a 1:100, and a
1:1000 in sterile phosphate buffered saline with a pH of 7.3. The concentrated and
diluted samples were plated on Rogosa Agar (Oxiod, Basingstoke) and Mutans
Bacitracin Agar (MBA) consisting of Mitis Salivarius Agar (Difco®) containing
0.00001% Bacitracin. After inoculation the plates were incubated at 37° for 72 hours
under CO2 and the number of colonies was counted.
2.8 The Impression technique Impressions were taken of the mouth using a modified hydro-colloid impression
material mixed with culture broth. (P. G. S. Alginate, Milner Dental. Pty Ltd,
Johannesburg). The hydrocolloid was adapted by excluding Bronol, Niasept sodium,
peppermint oil excellent F and color 34K48PG green from the alginate. It was
sterilized by irradiating with 2 kGy of gamma rays before use (Isotron South Africa
Pty. Ltd.).
Two broths were used for the study, Mutans Bacitracin broth (MBB) for the culture of
S. mutans and Tomato Juice broth (TJB) for culturing Lactobacilli. MBB contained
1% peptone, 1% to tryptone, 0.1% glucose, 8.5% sucrose, 0.4% dipotassium
phosphate, 0.0075% trypan blue and 0.00008% crystal violet. The broth was made
13

selective by adding 0.00001% Bacitracin. TJB contained 300 ml filtered whole
tomato (Koo®), 5 g yeast extract, 10 g glucose, 15 g agar, 2 ml bromo -cresol purple
and 5 ml Salt A (Salts A contains10 g K2HPO4 and10 g KH 2PO4) and 1000 ml
distilled water. TJB was used because Rogosa broth (Oxoid) that was made up by
excluding agar from the recipe inhibited the setting of the alginate.
Patients were seated in a dental chair in a standard position for routine impressions
and the impressions were taken under sterile conditions. The operator wore sterile
surgical gloves and rinsed the gloves with 70% alcohol between impressions. The
sterile impression material was decanted into a sterile mixing bowl, mixed and
spatulated for 90 seconds with either sterile MBB or TJB broth to form a smooth
impression paste. The paste was placed in a sterile impression tray, inserted in the
mouth and allowed to set. Thereafter the impressions were placed in a sterile Petri
dish separated by a sterile Perspex tube, transferred to a candle jar and incubated
under CO2 for 48 hours at 370C. Impressions were taken of both the maxilla and the
mandible for each subject.
After incubation, the impressions were examined at 10 times magnification under a
stereo microscope for the presence of Streptococcus mutans and Lactobacilli
colonies on the margins of the crowns, bridges, implants and teeth of the restored
patients and on the gingival margins of the teeth of the control group.
The arches were divided into three sections, the premolars and molars (posterior) on
the right and on the left side of the mouth and the canines and incisors in the centre
(anterior). The following scoring was used for each section
• no colonies was assigned a score of zero;
• only one colony scored 1
• two colonies scored 2
• three to ten colonies scored 3
• confluent colonies scored 4
The same scoring system was used for the maxilla and mandible
14

2.9 Statistical analysis The two groups were compared, separately with respect to each of the sets of
measurements. The saliva, dental plaque and diet measurements were compared
using the two-sample t-tests.
• Since the S. mutans and Lactobacilli measurements are on a 0 to 4 scale, the two
groups of patients were compared using the chi-squared tests. In addition Inter-
arch and intra-arch measurements in the different areas of the mouth i.e. the
anterior and posterior segments of the maxilla and mandible, on the left and right
were compared.
• A generalized logistic regression analysis was performed, which takes into
account the ordinal nature of these scores in order to test simultaneously whether
the area of the mouth from which the measurements were taken (anterior or
posterior, maxilla or mandible) as well as the group from which the patients came
(caries or control) affected the S. mutans and Lactobacilli scores.
• Finally, a total of the S. mutans the Lactobacilli score was calculated for each
patient by summing the individual scores over the different parts of the mouth. A
two-sample t-test was used to compare the total score in the two groups.
Results were accepted as statistically significant at the 5% or lower level.
15

Chapter 3
Results
3.1 Saliva buffering and flow There was no significant difference in the flow rate between the restored and the
control groups (Table 1). When the buffering capacity of the saliva of the restored
and control patients were compared, the saliva produced by stimulation with acid was
significantly lower (p=0.020) in the restored than in the control group. There was no
significant difference in the buffering between the 2 groups when the resting saliva
and the saliva stimulated by chewing were compared (Table 2).
3.2 Buffering capacity of plaque The buffering capacity of plaque was lower in the restored group than the control
group (Table 3). This difference was statistically significant (p < 0.001).
3.2 DMFS and plaque index The mean DMFS of the restored group was 129 and the control group 16.
The plaque index was significantly lower (p = 0.018) in the restored than the control
group (Table 4). In the control patients, more plaque accumulated on the mandibular
teeth of the anterior segment of the mouth than the maxillary teeth and the posterior
segments (Table 5) while the distribution of plaque in the control group was similar in
all three segments (Table 6).
3.4 Diet The fiber intake was significantly higher (p = 0.029) in the restored than the control
group (Table 7). There was no significant difference between the two groups
regarding the amount of sucrose consumed and the frequency of intake.
16

3.5 Salivary S. mutans and Lactobacilli
The Lactobacillus count was significantly higher in the restored group than the control
subjects (p < 0.001). However, the S. mutans count was not significantly different
between the restored and control subjects (Table 8).
3.6 Overall comparison of S. mutans and Lactobacilli on impressions Microorganisms colonized three times more teeth in the restored subjects than
controls. Five times more teeth in the restored patients carried both S. mutans and
Lactobacilli and almost double as many Lactobacilli than control subjects The
percentage of teeth with S. mutans was similar in both groups. In the restored
patients, Lactobacilli occurred more often than S. mutans on implants, teeth, pontics
and crowns (Table 9).
3.7 The Position of restorations in the restored patients
Most of the crowns were in the posterior segment of the mandible and the anterior
segment of the maxilla while implants were in the posterior segment of mandible
(Table 10).
3.8 The Distribution of microorganisms on impressions of natural teeth
Only 7% of teeth in control subjects were colonized by both S. mutans and
Lactobacilli whereas these microorganisms were isolated from 34% of the teeth of
the restored subjects (Table 11).
3.9 S. mutans on impressions A generalized logistic regression analysis showed that patients in the restored group
had high concentrations of S. mutans than the control subjects. This difference was
statistically significant (p < 0.001). More S. mutans occurred on impressions of the
natural teeth of the restored patients than the control subjects. This difference was
also statistically significant (p < 0.010). S. mutans was found in significantly higher
concentrations on the posterior than the anterior teeth in both the maxilla and the
mandible of the restored patients (p = 0.016). A comparison of the maxilla of the
17

restored and control subjects showed there was no difference in the distribution of S.
mutans (Table 12). In contrast significantly higher concentrations (p = 0.031) of S.
mutans were cultured from the anterior surfaces of the mandible of the restored
patients than control subjects (Table 13).
3.10 Lactobacilli on impressions A generalized logistic regression analysis of the data showed that more restored
patients had high levels of Lactobacilli than control subjects (p = 0.001). More
Lactobacilli were cultured on impressions of the teeth of the restored patients than
control subjects (p=0.002). Overall Lactobacilli were found in significantly higher
concentrations on the posterior than the anterior teeth (p = 0.047). Higher
concentrations of Lactobacilli were cultured from the right posterior surfaces of the
maxilla (p = 0.013) (Table 14) and the left posterior surfaces of the mandible (p =
0.005) of the restored patients (Table 15).
18
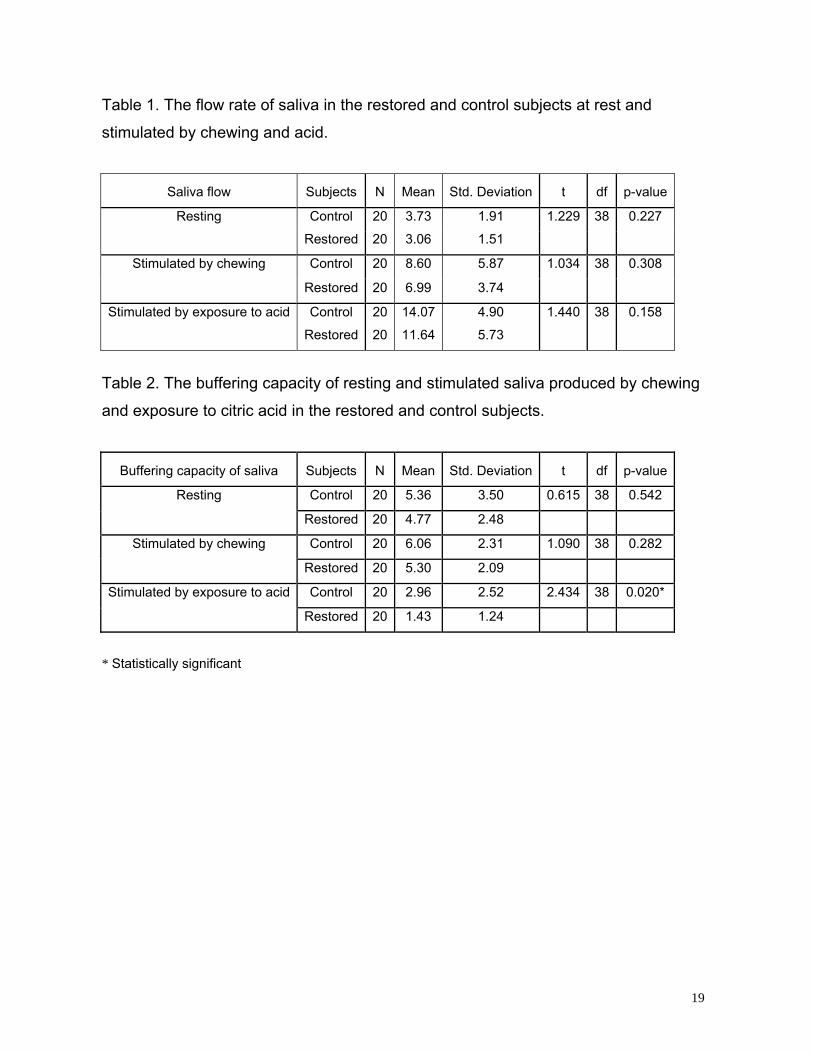
Table 1. The flow rate of saliva in the restored and control subjects at rest and
stimulated by chewing and acid.
Saliva flow Subjects N Mean Std. Deviation t df p-value
Control 20 3.73 1.91 1.229 38 0.227 Resting
Restored 20 3.06 1.51
Control 20 8.60 5.87 1.034 38 0.308 Stimulated by chewing
Restored 20 6.99 3.74
Control 20 14.07 4.90 1.440 38 0.158 Stimulated by exposure to acid
Restored 20 11.64 5.73
Table 2. The buffering capacity of resting and stimulated saliva produced by chewing
and exposure to citric acid in the restored and control subjects.
Buffering capacity of saliva Subjects N Mean Std. Deviation t df p-value
Control 20 5.36 3.50 0.615 38 0.542 Resting
Restored 20 4.77 2.48
Control 20 6.06 2.31 1.090 38 0.282 Stimulated by chewing
Restored 20 5.30 2.09
Control 20 2.96 2.52 2.434 38 0.020* Stimulated by exposure to acid
Restored 20 1.43 1.24
* Statistically significant
19

Table 3. Buffering capacity of plaque in the restored and control subjects
Subjects N Mean Std. Deviation t df p-value
Control 20 80.52 5.00 3.633 38 0.001*
Restored 20 69.13 13.09
*Statistically significant
Table 4. The plaque index of the restored and control subjects.
Subjects N Mean Std. Deviation t df p-value
Control 20 53.84 16.69 2.471 38 0.018*
Restored 20 37.58 24.25
* Statistically significant
Table 5. The percentage of teeth with plaque in the left posterior, right posterior and
anterior segments of the mandible and maxilla of the restored subjects.
Mandible
L posterior Anterior R posterior
21.2 48.675 28.35
Maxilla
L posterior Anterior R posterior
28.35 34.65 38.3
20

Table 6. The percentage of teeth with plaque in the left posterior, right posterior and
anterior segments of the mandible and maxilla in the control subjects
Mandible
L posterior Anterior R posterior
55.75 45.03 50.15
Maxilla
L posterior Anterior R posterior
60.5 43.74 63.5 60.5
Table 7. The dietary intake of the restored patients and control subjects
Std.
Deviation Subjects N Mean t df
p-
value
Control 20 49.42 30.04 0.093 38 0.926
Sucrose intake in
grams /day Restored
20 48.38 40.06
Control 20 2.76 1.23
-
0.331 38 0.742
Frequency of
Sucrose intake Restored 20 2.92 1.81
Control 20 9.04 2.92
-
2.272 38 0.029*
Fibre intake in
grams /day Restored 20 13.02 7.28
* Statistically significant
21

Table 8. The logarithm of the number of S. mutans and Lactobacilli in stimulated
saliva produced by chewing.
Subjects N Mean
Std.
Deviation t df p-value
Control 20 4.230 0.777 1.223 38 0.229 S. mutans
Restored 20 3.669 1.898
Control 20 1.803 1.815 -4.435 38 0.000* Lactobacilli
Restored 20 4.264 1.691
* Statistically significant
Table 9. Total scores of S. mutans and Lactobacilli on impressions of the teeth.
Subjects N Mean Std. Deviation t df
p-
value
Control 20 6.700 4.835 -2.704 38 0.010*
S. mutans Restored 20 11.050 5.326
Control 20 7.600 5.968 -3.265 38 0.002*
Lactobacilli Restored 20 13.550 5.549
* Statistically significant
22
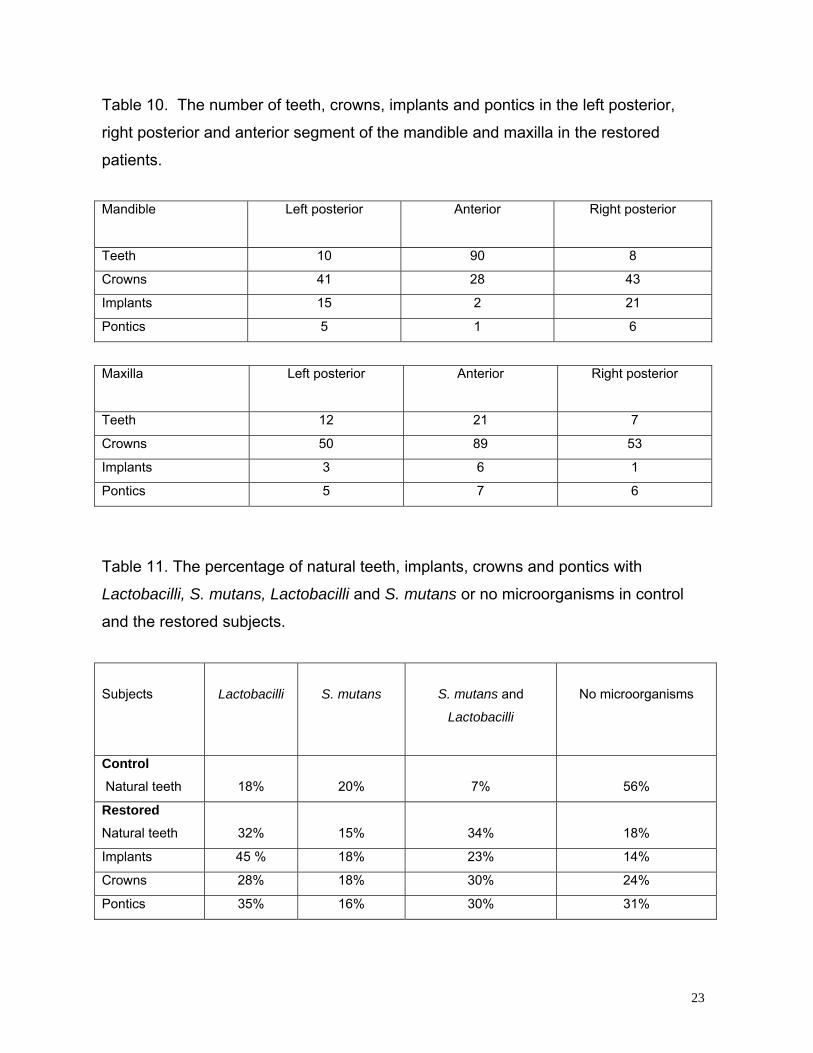
Table 10. The number of teeth, crowns, implants and pontics in the left posterior,
right posterior and anterior segment of the mandible and maxilla in the restored
patients.
Mandible Left posterior Anterior Right posterior
Teeth 10 90 8
Crowns 41 28 43
Implants 15 2 21
Pontics 5 1 6
Maxilla Left posterior Anterior Right posterior
Teeth 12 21 7
Crowns 50 89 53
Implants 3 6 1
Pontics 5 7 6
Table 11. The percentage of natural teeth, implants, crowns and pontics with
Lactobacilli, S. mutans, Lactobacilli and S. mutans or no microorganisms in control
and the restored subjects.
Subjects
Lactobacilli
S. mutans
S. mutans and
Lactobacilli
No microorganisms
Control Natural teeth
18%
20%
7%
56%
Restored Natural teeth
32%
15%
34%
18%
Implants 45 % 18% 23% 14%
Crowns 28% 18% 30% 24%
Pontics 35% 16% 30% 31%
23

Table 12. The distribution of S. mutans on impressions of the Maxilla teeth of the
restored and control subjects. A score of 0 was assigned if no colonies were present
in the segment, 1 for one colony, 2 for two colonies, 3 for three to ten colonies and 4
when confluent colonies were present.
Left Posterior
Score
0 1 2 3 4Total
Chi-square
df
p-value
3 7 8 1 1 20 2.686 4 0.612
Control
Restored 1 8 6 3 2 20
Maxilla Anterior
Score
0 1 2 3 4Total
Chi-square
df
p-value
11 6 2 0 1 20 6.427 4 0.169
Control
Restored 5 5 5 1 4 20
Right Posterior
Score
0 1 2 3 4
Chi-square
df
Total
p-value
6 6 6 1 1 20 3.467 4 0.483
Control
Restored 6 4 4 5 1 20
24

Table 13. The distribution of S. mutans on impressions of the mandibular teeth of the
restored and control subjects. A score of 0 was assigned if no colonies were present
in the segment, 1 for one colony, 2 for two colonies, 3 for three to ten colonies and 4
when confluent colonies were present.
Left Posterior
Score
0 1 2 3 4
Chi-
square df p-value
2 9 7 2 0 6.447 4 0.168 Control
Restored 3 5 4 5 3
Anterior
Score
0 1 2 3
Chi-
square df 4 p-value
9 9 1 0 1 10.600 4 0.031* Control
Restored 3 6 5 4 2
* Statistically significant
Right Posterior
Score
0 1 2 3
Chi-
square df 4 p-value
9 4 4 3 0 8.123 4 0.087 Control
Restored 4 1 6 6 3
25
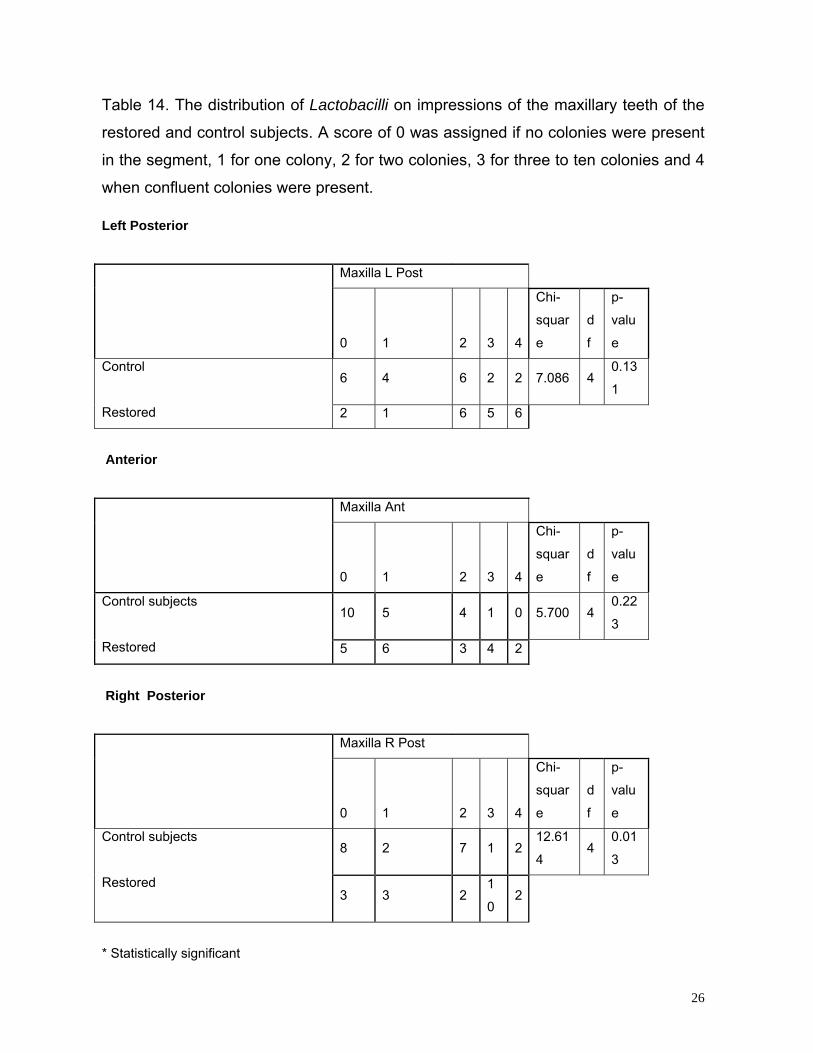
Table 14. The distribution of Lactobacilli on impressions of the maxillary teeth of the
restored and control subjects. A score of 0 was assigned if no colonies were present
in the segment, 1 for one colony, 2 for two colonies, 3 for three to ten colonies and 4
when confluent colonies were present.
Left Posterior
Maxilla L Post
0 1 2 3
Chi-
squar
e
d
f 4
p-
valu
e
6 4 6 2 2 7.086 4 0.13
1
Control
Restored 2 1 6 5 6
Anterior
Maxilla Ant
0 1 2 3
Chi-
squar
e
d
f 4
p-
valu
e
10 5 4 1 0 5.700 4 0.22
3
Control subjects
Restored 5 6 3 4 2
Right Posterior
Maxilla R Post
0 1 2 3
Chi-
squar
e
d
f 4
p-
valu
e
8 2 7 1 212.61
4 4
0.01
3
Control subjects
Restored 3
* Statistically significant
3 2 1
0 2
26
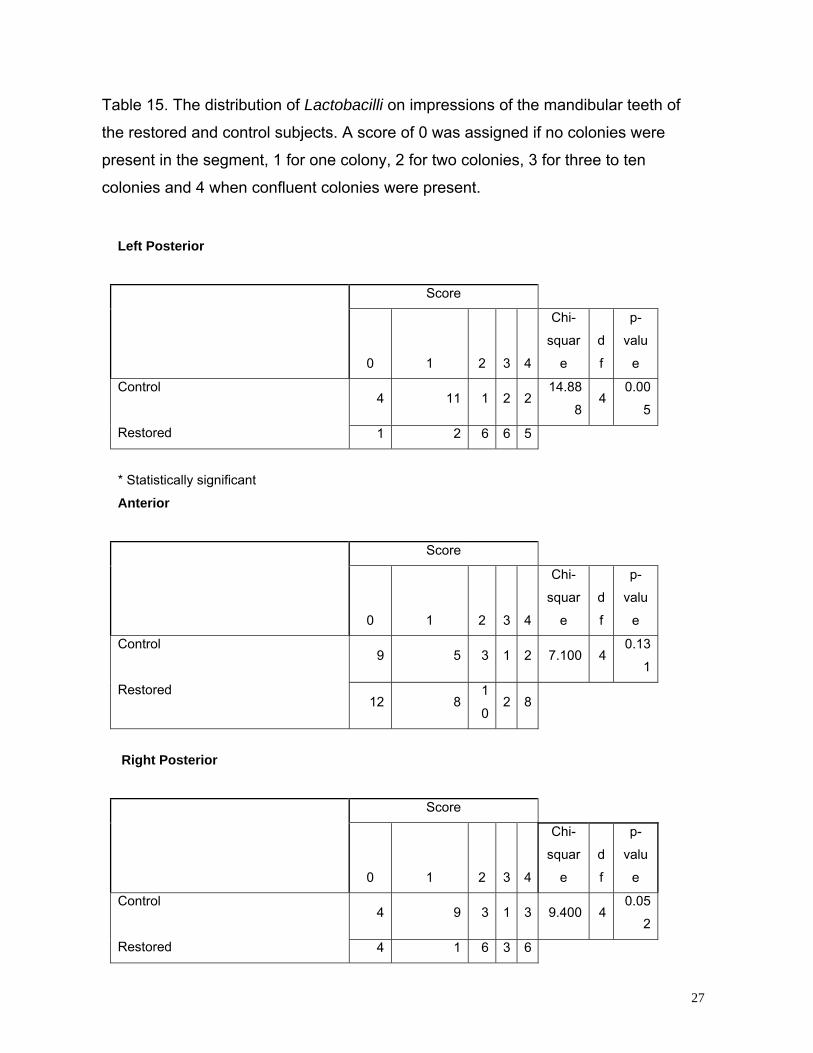
Table 15. The distribution of Lactobacilli on impressions of the mandibular teeth of
the restored and control subjects. A score of 0 was assigned if no colonies were
present in the segment, 1 for one colony, 2 for two colonies, 3 for three to ten
colonies and 4 when confluent colonies were present.
Left Posterior
Score
0 1 2 3
Chi-
squar
e
d
f 4
p-
valu
e
4 11 1 2 214.88
8 4
0.00
5
Control
Restored 1 2 6 6 5
* Statistically significant
Anterior
Score
0 1 2 3
Chi-
squar
e
d
f 4
p-
valu
e
9 5 3 1 2 7.100 4 0.13
1
Control
Restored 12
1
028 8
Right Posterior
Score
0 1 2 3
Chi-
squar
e
d
f 4
p-
valu
e
4 9 3 1 3 9.400 4 0.05
2
Control
Restored 4 1 6 3 6
27

Chapter 4
Discussion
4.1 Saliva buffering and saliva flow
The salivary tests showed that the buffering capacity of saliva produced by stimulation
with acid was significantly lower (p=0.020) in the restored than the control group.
However, there was no difference between the two groups when the buffering capacity
of resting saliva and stimulated saliva produced while chewing, were compared (Tables
1 and 2). The decrease in the ability of the restored patients to buffer the acids may be
related to a change in saliva. A recent study has shown that sucking acidic sweets can
change whole mouth saliva composition, by exhausting the buffering capacity of the
saliva (Jensdottir et al, 2005). Even though stimulated saliva is more resistant to
changes in pH than resting saliva during hydrochloric acid titration (Moritsuka et al,
2006) the ongoing production of organic acids in the mouth by cariogenic
microorganisms may eventually exhaust the buffering capacity of saliva.
The difference in saliva buffering capacity may also be related to stress. Twelve of the
restored patients were professional or company owners who had demanding life styles
and none of the control group belonged to this category. This may have changed the
composition of saliva and reduced the flow because Morse et al, (1981) have shown
that reduction in anxiety increases the flow and pH of saliva. A recent study has also
shown there is a significant stress-mediated increase of salivary total protein
concentration, alpha-amylase activity, amylase/protein ratio, alpha-amylase output, s-
28

IgA concentration, and s-IgA output but reduced bacterial aggregation, in saliva in
people who are stressed (Bosch et al, 1996)
4.2 Buffering capacity of plaque
An examination of the results of the plaque tests showed that the buffering capacity was
significantly lower in the restored (p<0.001) than the control group (Table 3).
Furthermore on exposure to a sugar rinse, the plaque pH fell below 5.5 and remained
low for a longer period than in control subjects. A prolonged drop in pH below 5.5
indicates that with frequent exposure to sugar the mouth will remain acidic for long
periods and cause decalcification of the teeth. The inability to raise the pH probably
contributed to caries susceptibility in the restored subjects.
Plaque is unique because it contains acids, proteins, bicarbonates as well as
phosphates that resist a change in the pH (Hicks et al, 2003). However, the restored
patients carried more cariogenic bacteria than the controls (Table 9). These patients
would form a plaque biofilm that contains high levels of cariogenic bacteria. When
these conditions are combined with a high sucrose intake, the pH will be depressed for
a prolonged period leading to subsurface demineralization of the tooth. Furthermore,
there is a definite correlation between saliva buffering capacity and plaque buffering
capacity (Hicks et al, 2003). The situation in the restored subjects would be aggravated
by the production of saliva with poor buffering capacity because saliva contains
bicarbonates, phosphates and proteins that all contribute to the buffering capacity of the
saliva and subsequently plaque (Shellis and Dibdin 1998). Buffering capacity is
affected by the diffusion of the saliva through the biofilm of the plaque (Hicks et al,
29

2003). Thus plaque that is able to control changes in acidity would keep the pH stable
whereas cariogenic plaque would have the opposite effect.
4.3 Plaque index
The plaque index was significantly lower in the restored group than in the control
group (p = 0.018) (Table 4). A comparison the distribution of the plaque in the
posterior left and right and in the anterior segments of the mandible in the restored
patients showed a higher percentage of plaque accumulation on the anterior
segment, where the most natural teeth occurred (Tables 5 and 10). In the control
patients, most plaque accumulated on the posterior segments of mandible and the
maxilla (Table 6).
4.4 Diet analysis
The restored subjects consumed more fibre (p = 0.029) than the control subjects (Table
7) while sucrose consumption was similar but relatively high in both groups. The
protective effect of a high fiber intake in the restored group is not supported by the
findings of Cole and Eastoe (1977) that showed that a high fiber intake is associated
with a low DMFS. This supports the idea that caries is a multifactorial disease and that
saliva may play an important role in the development and in the control of this infection.
30
4. 5 S. mutans and Lactobacilli in saliva
The levels of Lactobacillus in saliva was significantly higher (Table 8) in the restored
than in control subjects (p=0.000). The probable explanation is that the mouths of the
restored patients were extensively restored with crowns, bridges and implants that are
associated with stagnant areas and the Lactobacilli would accumulate readily in these
stagnant areas. This is supported by the findings of (Kleinberg 2002) who showed that
the presence of restorations encourages the multiplication of these cariogenic
microorganisms. The importance of stagnation is emphasized by Kleinberg (2002) who
stated that orthodontic bands and brackets create stagnant areas that favour the
accumulation of Lactobacilli and the development of decay.
Although the counts of S. mutans were also high, there was no difference between the
controls and the restored group. The high S. mutans count may be associated with high
sucrose consumption in both groups. The low DMFS in the control group could rather
be attributed to the absence of stagnant areas and good saliva flow than the presence
or absence of S. mutans and the consumption of sucrose.
4.6 S. mutans and Lactobacilli on impressions
There were more S mutans on the impressions of the restored (p= 0.010) than control
subjects (Table 9). When the natural teeth were, assessed S. mutans was present in
the same proportion in the restored and control subjects (Table11). The same ratio of
un-restored teeth in both groups was colonized by S. mutans. This suggests that S.
mutans may not solely be implicated in the formation of caries. S. mutans attaches
31

readily to the acquired pellicle on teeth even in the absence of sucrose. Once it is
attached, it utilizes the acquired pellicle for growth (Marsh & Martin, 2001). S mutans
will attach to teeth irrespective of the presence of restorations (Table 10). The
distribution of S mutans in the restored and control subjects in different parts of the
maxilla was not significant (Table 12), which is a further indication that the salivary
pellicle may be responsible for the attachment of S mutans. The growth on impressions
suggests that the presence of S. mutans, their location and level of the infection does
not necessarily indicate that an infected site is at risk.
There were almost twice as many Lactobacilli on the impressions of the restored than
control subjects (Table 9). This difference was highly significant (p=0.002) which
suggests that conditions in the mouths of the restored subjects encouraged the
colonization of the majority of crowns, pontics, teeth and implants by Lactobacilli.
These high levels of Lactobacilli could be explained by Kleinberg (2002) who found that
sites with changes in morphological conditions lead to carbohydrate retention. This will
encourage the formation of acidogenic dental plaque and promote the development of
carious lesions as well as serving as a source of infection. The high levels of Lactobacilli
on the impressions was also associated with a significantly higher Lactobacillus count in
the saliva of the restored patients (p=0.000) than control subjects (Table 8). These
observations confirm that high levels of salivary Lactobacilli are an indication of
stagnant sites as well as a high carbohydrate intake (Tenuta et al, 2006).
Examination of the sites colonized by both Lactobacilli and S mutans showed there was
a difference between the restored and control subjects. These microorganisms
32
occurred together on 7% of the teeth in caries-free subjects and almost 30 % of teeth
crowns and pontics of the restored subjects (Table 11). This indicates that teeth and
crown margins colonized by both these microorganisms are at risk of developing
secondary decay. This is supported by Kleinberg (2002) who showed that S mutans and
Lactobacillus must both be present for caries to occur. Furthermore the presence of a
combination of S mutans and Lactobacillus is more efficient in selecting patients at risk
than teeth colonized by only S mutans or Lactobacilli (Stecksen-Blicks, 1985).
These observations support the idea that a lesion is initiated by S mutans with the
production of acid when plaque accumulates and a diet high in sucrose is consumed. A
change in morphology of the tooth or the dentition by the placement of prostheses will
favour the associated colonization by Lactobacilli and the development of a subclinical
or initial lesion. Thus, it appears that the initial stage of decay is associated with an
increase in dietary carbohydrate that leads to an alteration in the microorganisms with S
mutans and Lactobacilli becoming more dominant with the acid sensitive species
decreasing (Marsh and Martin, 2001). This study has shown that the impression
technique is invaluable because it indicates that particular areas are at risk.
4.7 Distribution of S. mutans on the maxilla and the mandible
S. mutans occurred in significantly higher proportions in the restored patients than
control subjects (p = 0.031). They were cultured mainly from the anterior surfaces of
the teeth in the mandible (Table 13) and were associated with the accumulation of
plaque in this site. The high saliva flow could lead to the deposition of salivary proteins
that would encourage plaque accumulation and colonization by S. mutans. Even
33

though plaque and S. mutans accumulated in this site the teeth were less prone to
decay. The reason could be the washing and buffering effect of saliva and the
protective role of immunoglobulins in saliva (Bosch et al, 1996).
4.8 Distribution of Lactobacilli on the maxilla and the mandible
Lactobacilli were found in significantly higher proportions of patients in the restored than
the control group, with high concentrations being cultured on the right posterior surfaces
in the maxilla (p = 0.013) and on the left posterior surfaces in the mandible (p = 0.005)
(Table 14 and 15). This difference could not be explained by the available data
because there was no relationship between the accumulation of the Lactobacilli and the
number of implants crowns or pontics. These differences may be attributed to a change
in the morphology of the existing prostheses, arch form or differences in tooth brushing
habits. They found that right-handed tooth brushers, had an increase in buccal plaque
and gingivitis on the contra-lateral side but no differences noted in left-handed brushers.
(Addy et al, 1987).
4.9 Conclusion
This study has shown that the buffering capacity of saliva produced by stimulation with
acid was significantly lower in the restored than the control group. Furthermore, the poor
buffering capacity of the restored patients had a significant impact on their DMFS. The
on-going production of acids by cariogenic microorganisms and the consumption of
acidic foods and drinks probably exhausted the buffering capacity of saliva. There is an
interaction between the buffering capacity of plaque and saliva (Shellis and Dibdin,
1988) with salivary bicarbonate ions replenishing the buffer capacity of plaque and
34

influencing the formation of organic acids. This had an effect on plaque because the
buffering capacity was significantly lower in the restored than the control group.
Exposure to fermentable carbohydrates in these patients would lead to a low pH of
dental plaque and contribute to caries susceptibility in the restored subjects. The risk is
compounded in patients who have poor saliva buffering capacity as well as a high
sucrose intake. The buffering capacity of saliva produced by acid stimulation was
significantly poorer in the restored patients than in the controls, which suggests that
saliva has an important role to play in the regulation of pH and in the control of dental
caries.
The initial stage of caries may be the attachment of S. mutans whereas the promotion of
the lesion is aided by the production of acids by Lactobacilli. The presence of
restorations will promote the accumulation of carbohydrate that will encourage the
multiplication of cariogenic organisms. An advantage of the impression technique was it
indicated sites where cariogenic microorganisms accumulated. This was invaluable
because it indicated that particular sites were at risk.
This study has shown that it is important to investigate saliva in conjunction with an
impression technique to identify the presence and sites colonized by S. mutans and
Lactobacilli. Sites at risk may have developed sub-clinical decay and not detectible by
convention methods. The impression technique makes it possible to determine the
extent of infection and the location of cariogenic bacteria. This is important because it
makes tooth specific treatment possible. This has advantage over visual detection
because the early treatment of incipient lesions is possible.
35
This study indicates that diet, microorganism and host susceptibility determine whether
a patient will develop dental caries. Detection of decay at an early stage is reliant on the
culturing of specific microorganisms and can significantly alter the future DMFS of the
patient. The affected tooth structure can be treated with a regimen of fluoride to
promote remineralization and reduce the levels of cariogenic bacteria. In addition a
caries promoting diet can be modified and other antimicrobial chemicals can be applied
to the teeth. Thus salivary tests, microbial impressions and diet analysis are invaluable
for the long-term follow up of the restored patients with extensive restorations. These
observations suggest that conventional caries susceptibility tests should be routinely
undertaken on patients with a history of decay. These tests combined with the
impression technique can be used to identify sites at risk and enable the clinician to
treat early lesions and reverse the process of decay. This is important because
remineralization at an early stage is possible especially if fluoride is present in the saliva
(Kidd and Joyston-Bechal, 1987a).
36
Chapter 5
List of References
• Addy M, Griffiths G, Dummer P, Kingdom A and Shaw WC (1987) The
distribution of plaque and gingivitis and the influence of toothbrushing hand in
a group of South Wales 11-12 year-old children. Journal Clinical
Periodontology. Nov; 14(10):564-72.
• Bowden GH (1996) Mutans streptococci caries and chlorhexidine. Canadian
Dental Journal, 62, 700-707.
• Bosch JA, Brand HS, Ligtenberg TJ, Bermond B, Hoogstraten J, and Nieuw
Amerongen AV (1996) Psychological stress as a determinant of protein levels
and salivary-induced aggregation of Streptococcus gordonii in human whole
saliva. Psychosomatic Medicine, 58, 374-382.
• Cole AS and Eastoe JE (1977) Dietary fibre biochemistry and oral biology,
John Wright and Sons Ltd: Bristol, Chapter 11, 112.
• Coogan MM and Motlekar HB (1996) Salivary and plaque acids in caries
active and caries free subjects. Journal of the Dental Association of South
Africa, 51, 823-827.
• Coogan MM, Creaven PJ and Galpin JS (1995) Longitudinal study on an
impression technique for predicting caries activity. Caries Research, 29, 295.
• Driezen S, Mann AW, Cline J K, and Spies T D (1946) the buffer capacity of
saliva as a measure of dental caries activity. Journal of Dental Research, 25,
213-222.
• Ellen RP, Banting DW, and Filllery ED (1985) Streptococcus mutans and
Lactobacillus detection in the assessment of dental root surface caries risk.
Journal of Dental Research, 64, 1245-1249.
• Espelid I and Tveit AB (1986) Clinical and radiographic assessment of
approximal carious lesions. Acta Odontologica Scandinavica, 44, 31-37.
37
• Farman AG (1990) Prediction of efficacy of a bitewing radiographs for caries
detection. Oral surgery, Oral Medicine, Oral Pathology, 69, 506-513.
• Fejerskov O, Scheie AA and Manji F (1992) the effect of sucrose on plaque
pH in the primary and permanent dentition of caries inactive and active
Kenyan children. Journal of Dental Research, 71, 25-31.
• Fitzgerald RJ, Adams BO and Davis ME (1994) A microbiological study
recurrent dental caries. Caries Res, 28, 409-415.
• Glantz PO, Nilner K, Jendersen MD and Sundberg H (1993) Quality of fixed
prosthodontics after 15 years. Acta Odontologica Scandinavica, 51, 247-252.
• Gonzalez-Cabezas C, Li Y, Noblitt TW, Gregory RL, Kafrawy AH and Stookey
GK (1995) Detection of Mutans Streptococci in Secondary Carious Lesions
Using Immunofluorescent Techniques and Confocal Laser Scanning
Microscopy. Caries Research, 29, 198-203.
• Guggenheim B, Guggenheim M, Gmϋr R, Giertsen E and Thurnheer T (2004)
Applications of the Zurich Biofilm Model to Problems of Cariology. Caries
Research, 38, 212-222.
• Hamilton IR (1987) Effects of changing environment on sugar transport and
metabolism by oral bacteria. In Sugar transport and metabolism in gram-
positive bacteria, ed Reizer J and Peterkofsky A. Ellis Horwood Limited:
Chichester, 94-96.
• Hicks J, Garcia-Godoy F and Flaitz CJ (2003) Biological factors in dental
caries: role of saliva and dental plaque in the dynamic process of
demineralization and remineralization (Part 1). Clinical Pediatric Dentistry, 28:
47-52.
• Hildebrandt G (1995) Caries Risk Assessment and Prevention for Adults.
Journal of Dental Education. 59, 972-977.
• Jenkins GN (1978) The Physiology and Biochemistry of the Mouth. 4th ed.
Blackwell Scientific Publications: Oxford, 414 - 425.
• Jensdottir T, Nauntofte B, Buchwald C, Bardow A (2005) Effects of sucking
acidic candy on whole-mouth saliva composition, Caries Research, 39, 468-
474.
38

• Kidd EAM and Pitts NB (1990) A reappraisal of the value of the bitewing
radiograph in the diagnosis of posterior approximal caries. British Dental
Journal, 169, 195-200.
• Kidd Edwina AM and Joyston-Bechal S (1987a) Introduction. In Essentials of
Dental Caries: The disease and its Management, Ch 1, pp1-15. Bristol:
Wright.
• Kidd Edwina AM and Joyston-Bechal S (1987b) Diagnosis and its relevance to
management In Essentials of Dental Caries: The disease and its
Management, Ch 4, pp 42-57. Bristol: Wright.
• Kidd Edwina AM and Joyston-Bechal S (1987c) Saliva in caries. In Essentials
of Dental Caries: The disease and its Management, Ch 5, pp 58-67. Bristol:
Wright.
• Kleinberg I (2002) A Mixed Ecological Approach to Understanding the Role of
the Oral Bacteria in Dental Causation: an Alternative to Streptococcus Mutans
and the Specific- Plaque Hypothesis. Critical Review Oral Biology and
Medicine, 13, 108-125.
• Langenhoven ML, Kruger M, Gouws E et al (1991) Research Institute for
Nutritional Diseases Food Composition Tables, 3rd Edition, Cape Town: South
African Medical Research Council.
• Luke GA, Gough H, Beely JA and Geddes DAM (1999) Human Salivary Sugar
Clearance after Sugar Rinses and Intake of Foodstuffs. Caries Research, 33,
123-129.
• Marsh PD and Martin MV (2001) Factors involved in the adherence of micro-
organisms to the oral surfaces. Oral biology, 4th Edition, Bodmin Cornwall:
MPG Books Ltd, Ch 4.
• Marsh PD (2004) Dental Plaque as a Microbial Biofilm. Caries Research, 38,
204-211.
• Merrett MC and Elderton RJ (1984) An in vitro study of restorative dental
treatment decisions and dental caries. British Dental Journal, 157,128-133.
39
• Mitropoulos CM, Lennon MA, and Worthington HV (1990) A national
calibration exercises for the British Association for the Study of Community
Dentistry regional examiners. Community Dental Health, 7, 179-187.
• Moritsuka M, Kitasako Y, Burrow MF, Ikeda M and Tagami J (2006) The pH
change after HCl titration into resting and stimulated saliva for a buffering
capacity test. Australian Dental Journal. Jun; 51:170-174.
• Morse DR, Schacterle GR, Furst ML and Bose K (1981) Stress, relaxation,
and saliva: a pilot study involving endodontic patients. Oral Surgery Oral
Medicine Oral Pathology, 52, 308 - 313.
• Mjör IA and Toffenetti F (2000) Secondary caries: a literature review with case
reports. Quintessence International, 31,165–179.
• Pitts NB and Stamm JW (2004) International Consensus Workshop on Caries
Clinical Trials (ICW-CCT)--final consensus statements: agreeing where the
evidence leads. Journal Dental Research, 83, Spec No C: C125-128.
• Pitts NB (1991) Diagnostic methods for caries: what is appropriate when?
Journal of Dentistry, 19, 377-382.
• Pitts NB (1997) Patients Caries Status in the Context of Practical Evidence
Based Management of the Initial Caries Lesion. The Journal of Dental
Education 61, 861-865.
• Pitts NB (2004) Are We Ready to Move from Operative to Non-Operative/
Preventive Treatment of Dental Caries in Clinical Practice? Caries Research,
38, 294-304.
• Rimmer PA and Pitts NB (1990) Temporary elective tooth separation as a
diagnostic aid in general dental practice. British Dental Journal, 169, 87-92.
• Roeters FJ M, van der Hoeven J S, Burgersdijk RCW and Scharken MJM
(1995) Lactobacilli, Mutans streptococci and Dental Caries: A Longitudinal
Study in Two-Year-Olds, up to the Age of Five Years. Caries Research, 29,
272- 279.
• Seddon R P (1989) The detection of cavitation in caries approximal surfaces
in vivo by tooth separation, impression and scanning electron microscopy
Journal of Dentistry, 17, 117-120.
40
• Shellis RP and Dibdin GH (1988) Analysis of the buffering systems in dental
plaque. Journal of Dental Research, 67, 438-46.
• Stecksen-Blicks C (1985) Salivary counts of lactobacilli and Streptococcus
mutans in caries prediction. Scandinavian Journal of Dental Research, 93,
204-12.
• Tam LE and McComb D (2001) Diagnoses of Occlusal Caries: Part II. Recent
Diagnostic Technologies) Journal of the Canadian Dental Association, 67,
459-463.
• Tenuta L M A, Ricomini Filho AP, Del Bel Cury AA, and Cury JA (2006)
Effect of Sucrose on the Selection of Mutans Streptococci and Lactobacilli in
the Dental Biofilm in situ. Caries Research 40, 546-549.
• Wilson RF and Ashley FP (1989) Identification of caries risk in schoolchildren:
salivary buffering capacity and bacterial counts, sugar intake and caries
experience as predictors of 2-year and 3-year caries increment. British Dental
Journal. 167, 99-102.
• Zoellner A, Heuermann M, Weber HP, Gaengler P (2002) Secondary caries in
crowned teeth: correlation of clinical and radiographic findings. Journal
Prosthetic Dentistry. 88, 314-319.
41