Embed Size (px)
Citation preview
P1: Dhirendra Samal (GJE)
Autonomous Robots KL1492-03 April 23, 2002 13:46
Autonomous Robots 13, 21–35, 2002c© 2002 Kluwer Academic Publishers. Manufactured in The Netherlands.
An Agricultural Mobile Robot with Vision-Based Perceptionfor Mechanical Weed Control
BJORN ASTRAND AND ALBERT-JAN BAERVELDTHalmstad University, Halmstad, Sweden
Abstract. This paper presents an autonomous agricultural mobile robot for mechanical weed control in outdoorenvironments. The robot employs two vision systems: one grey-level vision system that is able to recognise therow structure formed by the crops and to guide the robot along the rows and a second, colour-based vision systemthat is able to identify a single crop among weed plants. This vision system controls a weeding-tool that removesthe weed within the row of crops. The row-recognition system is based on a novel algorithm and has been testedextensively in outdoor field tests and proven to be able to guide the robot with an accuracy of ±2 cm. It has beenshown that colour vision is feasible for single plant identification, i.e. discriminating between crops and weeds. Thesystem as a whole has been verified, showing that the subsystems are able to work together effectively. A first trialin a greenhouse showed that the robot is able to manage weed control within a row of crops.
Keywords:
1. Introduction
The world-wide problem of environmental pollution
Au: Pls.providekeywords
caused by excessive use of herbicides and the increas-ing cost of chemicals call for alternative methods forcrop protection. A potential way to reduce chemicalsis to employ precision techniques for various types ofagricultural operations so that chemicals can be usedwhere they have an optimal effect at a minimum quan-tity. It will even be possible in some operations to aban-don the use of chemicals and apply other methods, e.g.mechanical weed control. There is political interest inthe European Union in increasing the amount of eco-logically grown products. The goal is that about 5–10%of the total field area should be processed by organicfarming methods by the year 2005. Organic farming isnot only a political goal; there is also a push from themarket. More and more customers are asking for prod-ucts that are organically grown. This has led to a prob-lem for companies that need to increase their suppliesof organically grown products to meet customer de-mands. For example, it is difficult to extend the amount
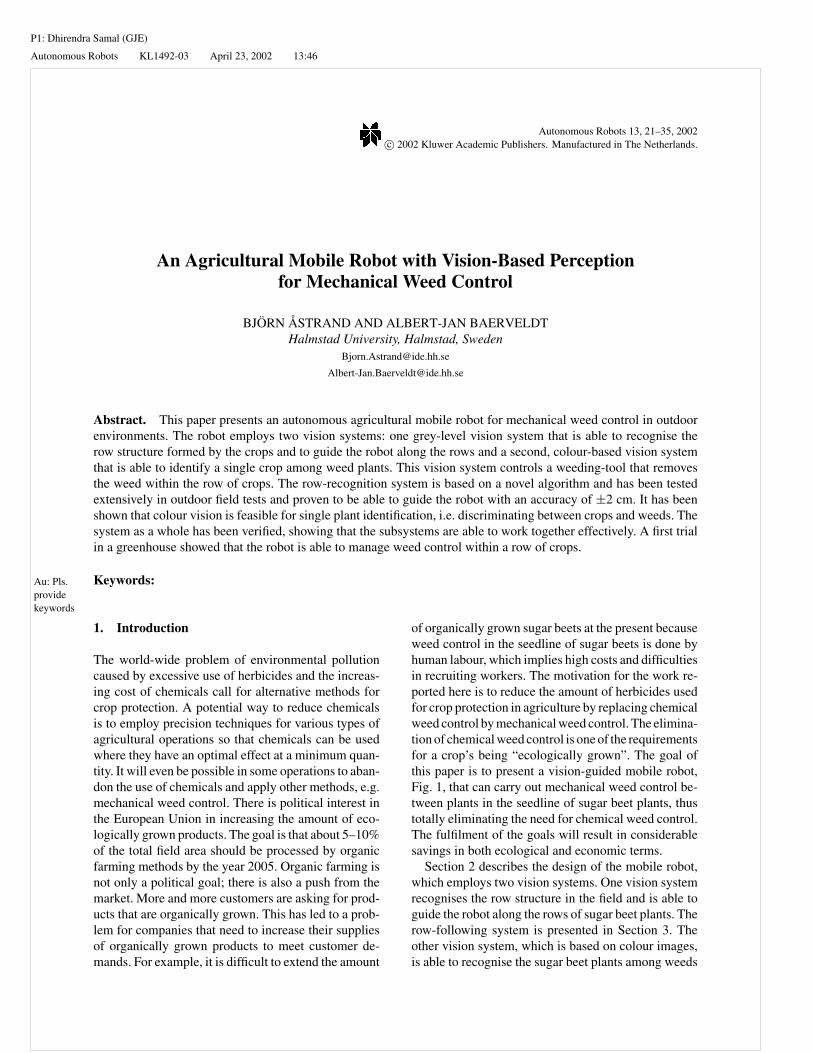
of organically grown sugar beets at the present becauseweed control in the seedline of sugar beets is done byhuman labour, which implies high costs and difficultiesin recruiting workers. The motivation for the work re-ported here is to reduce the amount of herbicides usedfor crop protection in agriculture by replacing chemicalweed control by mechanical weed control. The elimina-tion of chemical weed control is one of the requirementsfor a crop’s being “ecologically grown”. The goal ofthis paper is to present a vision-guided mobile robot,Fig. 1, that can carry out mechanical weed control be-tween plants in the seedline of sugar beet plants, thustotally eliminating the need for chemical weed control.The fulfilment of the goals will result in considerablesavings in both ecological and economic terms.
Section 2 describes the design of the mobile robot,which employs two vision systems. One vision systemrecognises the row structure in the field and is able toguide the robot along the rows of sugar beet plants. Therow-following system is presented in Section 3. Theother vision system, which is based on colour images,is able to recognise the sugar beet plants among weeds
P1: Dhirendra Samal (GJE)
Autonomous Robots KL1492-03 April 23, 2002 13:46
22 Astrand and Baerveldt
Figure 1. Mobile robot.
and controls the weed removing system. This visionsystem is discussed in Section 4. Finally, preliminaryresults of a field test are presented.
2. Design of the Mobile Robot
2.1. Approach
Sugar beet plants are cultivated in rows, which di-vides the problem of weed control into two parts:weed control between and weed control within rows,i.e. in the seedline between crop plants. Weed con-trol between rows requires only the recognition of arow structure whereas weed control within a row re-quires the recognition of individual sugar beet plantsamong weeds, which is a more complex perceptiontask. As most crops are cultivated in rows, the focusof the vision-oriented research in general for guidingagricultural implements has been to obtain an esti-mate of the row position. There have been a number ofpublications of successful implementations of row fol-lowing (Marchant, 1996; Marchant and Brivot, 1995;Billingsley and Schoenfisch, 1995; Slaughter et al.,
1997; Ollis and Stentz, 1996). However, only a fewreports have been published on systems for individualplant recognition tested in the field. Tillet et al. (1998)developed an autonomous robot for precision spray-ing in a transplanted cauliflower field. Their robot hastwo driving wheels, with one motor for each wheel, atthe front and two passive wheels at the rear. A cam-era is placed between the front axle, viewing an areaof 2 m2. The vision system estimates plant positionand uses this estimate for row-guidance and precisionspraying. Segmentation is achieved by several steps ofimage processing, based on near-infrared images, tobe able to discriminate weeds from crops (Brivot andMarchant, 1996). Lee et al. (1997) developed a systembased on machine vision for precision spraying in-rowweeds in tomato fields. The system is mounted on avision-guided row cultivator (Slaughter et al., 1997)that is able to track the centre of the seedline of thecrop. Separate cameras are used for row recognitionand for single crop recognition. The reason for this isthe often-reported problem of non-uniform illumina-tion. By employing two cameras, the vision system forplant recognition can be encapsulated and thus controlcan be taken over illumination.
P1: Dhirendra Samal (GJE)
Autonomous Robots KL1492-03 April 23, 2002 13:46
Vision-Based Perception for Mechanical Weed Control 23
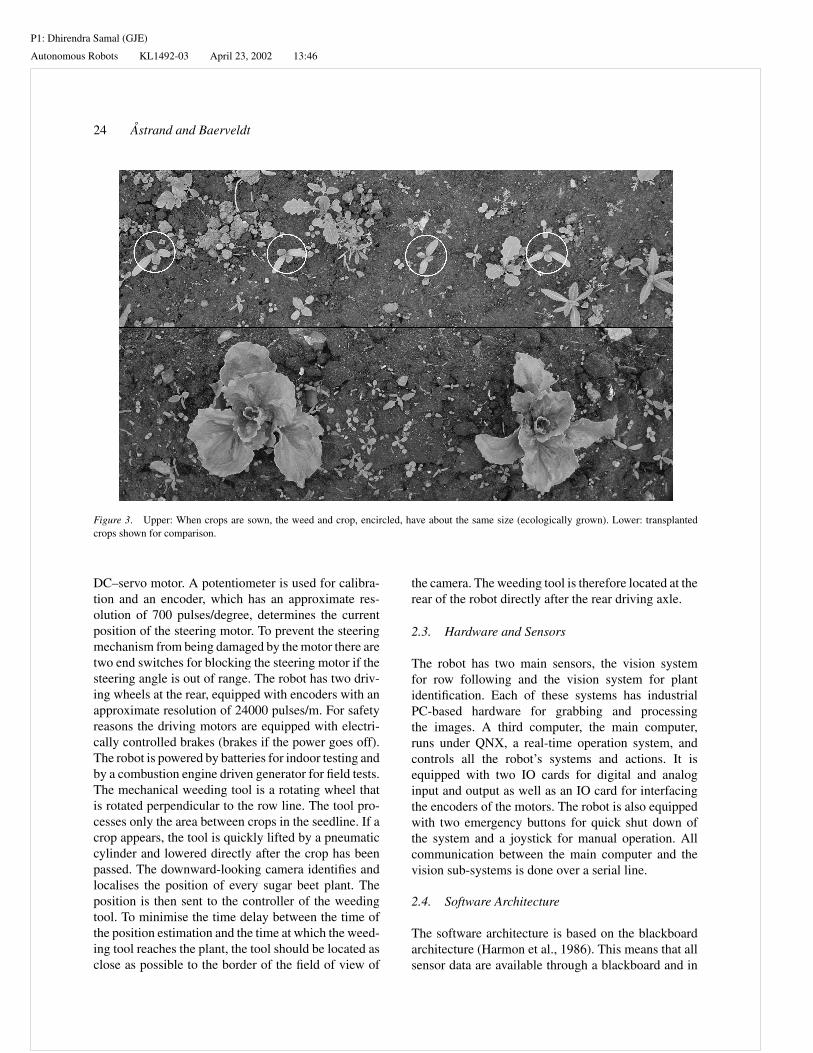
The systems described above focused on precisionspraying and not mechanical weed control for in-rowweeds, which is the aim of this work. Another impor-tant aspect of our work is that the organically growncultivation we aim at implies a relatively high numberof up to twelve weed plants per crop plant (in our casesugar beet plants). Moreover, as sugar beet plants aresown and not planted, the crop and weed have aboutthe same size, see Fig. 3. These two factors make therecognition task of both the row structure and indi-vidual plants much more difficult. Existing algorithmsfor row recognition were not sufficient for our appli-cation (Marchant, 1996; Marchant and Brivot, 1995;Billingsley and Schoenfisch, 1995; Slaughter et al.,1997; Ollis and Stentz, 1996; Lee et al., 1997). We thusdecided to develop a new row recognition algorithmand a new plant recognition algorithm that fit the re-quirements imposed by organic farming of sown crops.
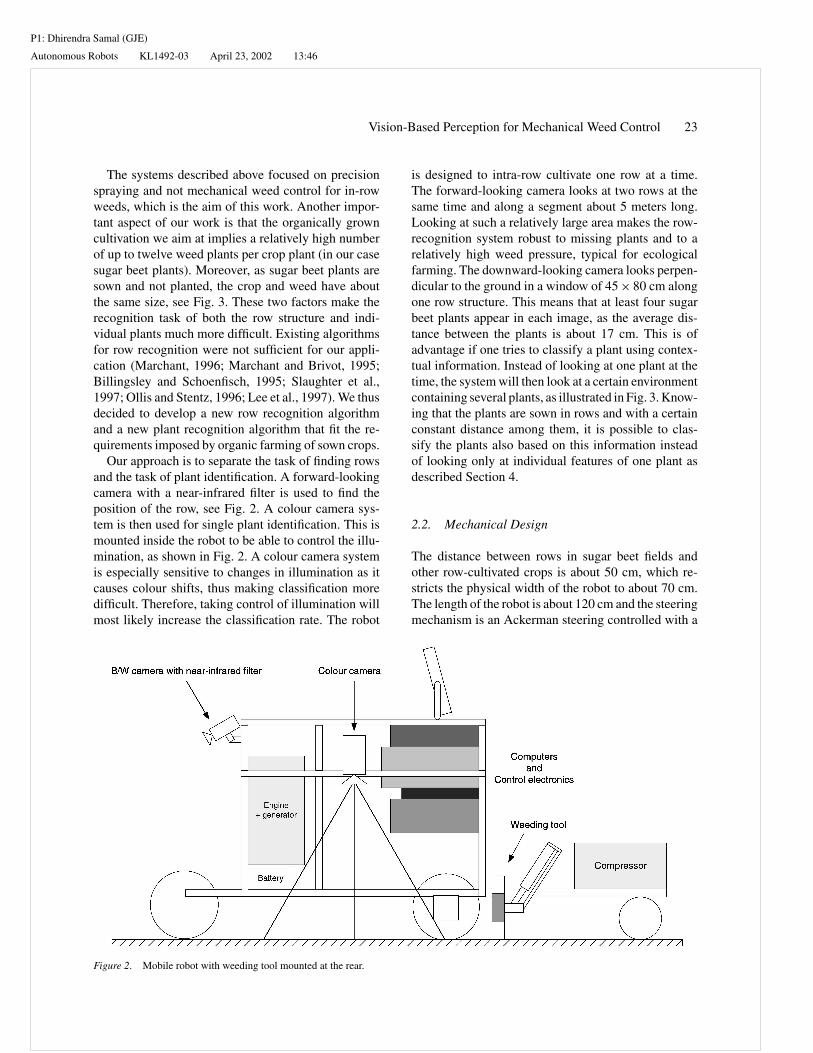
Our approach is to separate the task of finding rowsand the task of plant identification. A forward-lookingcamera with a near-infrared filter is used to find theposition of the row, see Fig. 2. A colour camera sys-tem is then used for single plant identification. This ismounted inside the robot to be able to control the illu-mination, as shown in Fig. 2. A colour camera systemis especially sensitive to changes in illumination as itcauses colour shifts, thus making classification moredifficult. Therefore, taking control of illumination willmost likely increase the classification rate. The robot
Figure 2. Mobile robot with weeding tool mounted at the rear.
is designed to intra-row cultivate one row at a time.The forward-looking camera looks at two rows at thesame time and along a segment about 5 meters long.Looking at such a relatively large area makes the row-recognition system robust to missing plants and to arelatively high weed pressure, typical for ecologicalfarming. The downward-looking camera looks perpen-dicular to the ground in a window of 45 × 80 cm alongone row structure. This means that at least four sugarbeet plants appear in each image, as the average dis-tance between the plants is about 17 cm. This is ofadvantage if one tries to classify a plant using contex-tual information. Instead of looking at one plant at thetime, the system will then look at a certain environmentcontaining several plants, as illustrated in Fig. 3. Know-ing that the plants are sown in rows and with a certainconstant distance among them, it is possible to clas-sify the plants also based on this information insteadof looking only at individual features of one plant asdescribed Section 4.
2.2. Mechanical Design
The distance between rows in sugar beet fields andother row-cultivated crops is about 50 cm, which re-stricts the physical width of the robot to about 70 cm.The length of the robot is about 120 cm and the steeringmechanism is an Ackerman steering controlled with a
P1: Dhirendra Samal (GJE)
Autonomous Robots KL1492-03 April 23, 2002 13:46
24 Astrand and Baerveldt
Figure 3. Upper: When crops are sown, the weed and crop, encircled, have about the same size (ecologically grown). Lower: transplantedcrops shown for comparison.
DC–servo motor. A potentiometer is used for calibra-tion and an encoder, which has an approximate res-olution of 700 pulses/degree, determines the currentposition of the steering motor. To prevent the steeringmechanism from being damaged by the motor there aretwo end switches for blocking the steering motor if thesteering angle is out of range. The robot has two driv-ing wheels at the rear, equipped with encoders with anapproximate resolution of 24000 pulses/m. For safetyreasons the driving motors are equipped with electri-cally controlled brakes (brakes if the power goes off).The robot is powered by batteries for indoor testing andby a combustion engine driven generator for field tests.The mechanical weeding tool is a rotating wheel thatis rotated perpendicular to the row line. The tool pro-cesses only the area between crops in the seedline. If acrop appears, the tool is quickly lifted by a pneumaticcylinder and lowered directly after the crop has beenpassed. The downward-looking camera identifies andlocalises the position of every sugar beet plant. Theposition is then sent to the controller of the weedingtool. To minimise the time delay between the time ofthe position estimation and the time at which the weed-ing tool reaches the plant, the tool should be located asclose as possible to the border of the field of view of
the camera. The weeding tool is therefore located at therear of the robot directly after the rear driving axle.
2.3. Hardware and Sensors
The robot has two main sensors, the vision systemfor row following and the vision system for plantidentification. Each of these systems has industrialPC-based hardware for grabbing and processingthe images. A third computer, the main computer,runs under QNX, a real-time operation system, andcontrols all the robot’s systems and actions. It isequipped with two IO cards for digital and analoginput and output as well as an IO card for interfacingthe encoders of the motors. The robot is also equippedwith two emergency buttons for quick shut down ofthe system and a joystick for manual operation. Allcommunication between the main computer and thevision sub-systems is done over a serial line.
2.4. Software Architecture
The software architecture is based on the blackboardarchitecture (Harmon et al., 1986). This means that allsensor data are available through a blackboard and in
P1: Dhirendra Samal (GJE)
Autonomous Robots KL1492-03 April 23, 2002 13:46
Vision-Based Perception for Mechanical Weed Control 25
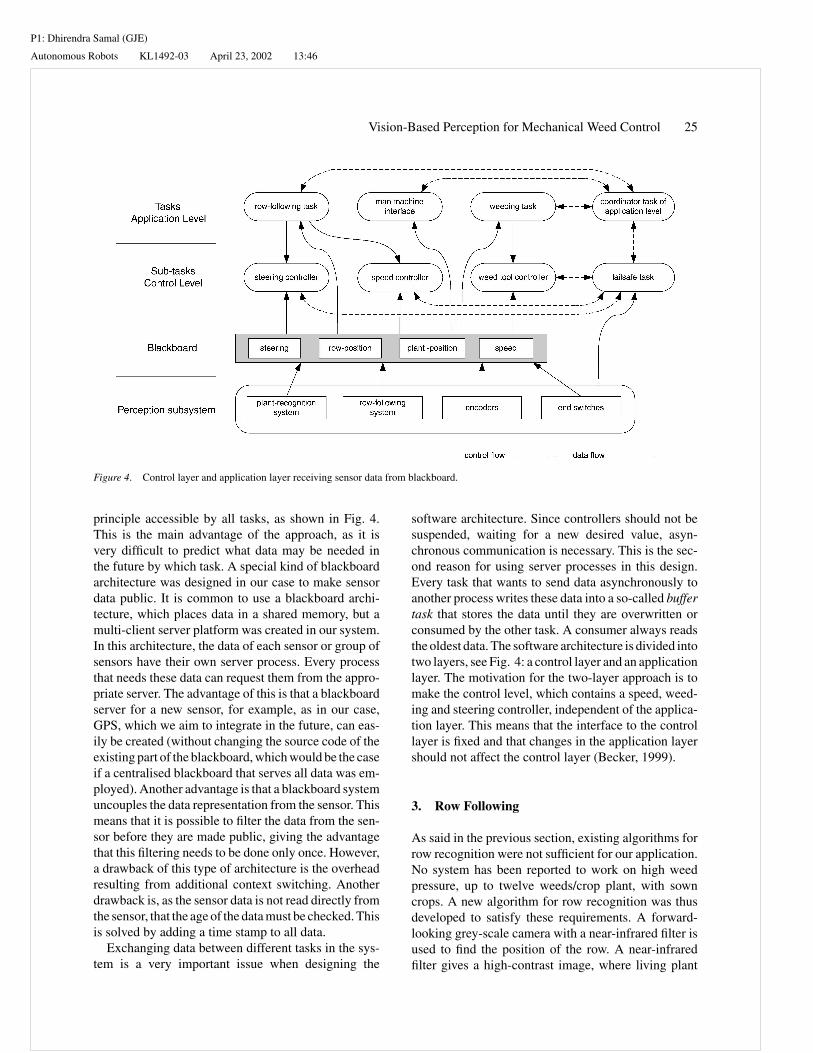
Figure 4. Control layer and application layer receiving sensor data from blackboard.
principle accessible by all tasks, as shown in Fig. 4.This is the main advantage of the approach, as it isvery difficult to predict what data may be needed inthe future by which task. A special kind of blackboardarchitecture was designed in our case to make sensordata public. It is common to use a blackboard archi-tecture, which places data in a shared memory, but amulti-client server platform was created in our system.In this architecture, the data of each sensor or group ofsensors have their own server process. Every processthat needs these data can request them from the appro-priate server. The advantage of this is that a blackboardserver for a new sensor, for example, as in our case,GPS, which we aim to integrate in the future, can eas-ily be created (without changing the source code of theexisting part of the blackboard, which would be the caseif a centralised blackboard that serves all data was em-ployed). Another advantage is that a blackboard systemuncouples the data representation from the sensor. Thismeans that it is possible to filter the data from the sen-sor before they are made public, giving the advantagethat this filtering needs to be done only once. However,a drawback of this type of architecture is the overheadresulting from additional context switching. Anotherdrawback is, as the sensor data is not read directly fromthe sensor, that the age of the data must be checked. Thisis solved by adding a time stamp to all data.
Exchanging data between different tasks in the sys-tem is a very important issue when designing the
software architecture. Since controllers should not besuspended, waiting for a new desired value, asyn-chronous communication is necessary. This is the sec-ond reason for using server processes in this design.Every task that wants to send data asynchronously toanother process writes these data into a so-called buffertask that stores the data until they are overwritten orconsumed by the other task. A consumer always readsthe oldest data. The software architecture is divided intotwo layers, see Fig. 4: a control layer and an applicationlayer. The motivation for the two-layer approach is tomake the control level, which contains a speed, weed-ing and steering controller, independent of the applica-tion layer. This means that the interface to the controllayer is fixed and that changes in the application layershould not affect the control layer (Becker, 1999).
3. Row Following
As said in the previous section, existing algorithms forrow recognition were not sufficient for our application.No system has been reported to work on high weedpressure, up to twelve weeds/crop plant, with sowncrops. A new algorithm for row recognition was thusdeveloped to satisfy these requirements. A forward-looking grey-scale camera with a near-infrared filter isused to find the position of the row. A near-infraredfilter gives a high-contrast image, where living plant
P1: Dhirendra Samal (GJE)
Autonomous Robots KL1492-03 April 23, 2002 13:46
26 Astrand and Baerveldt
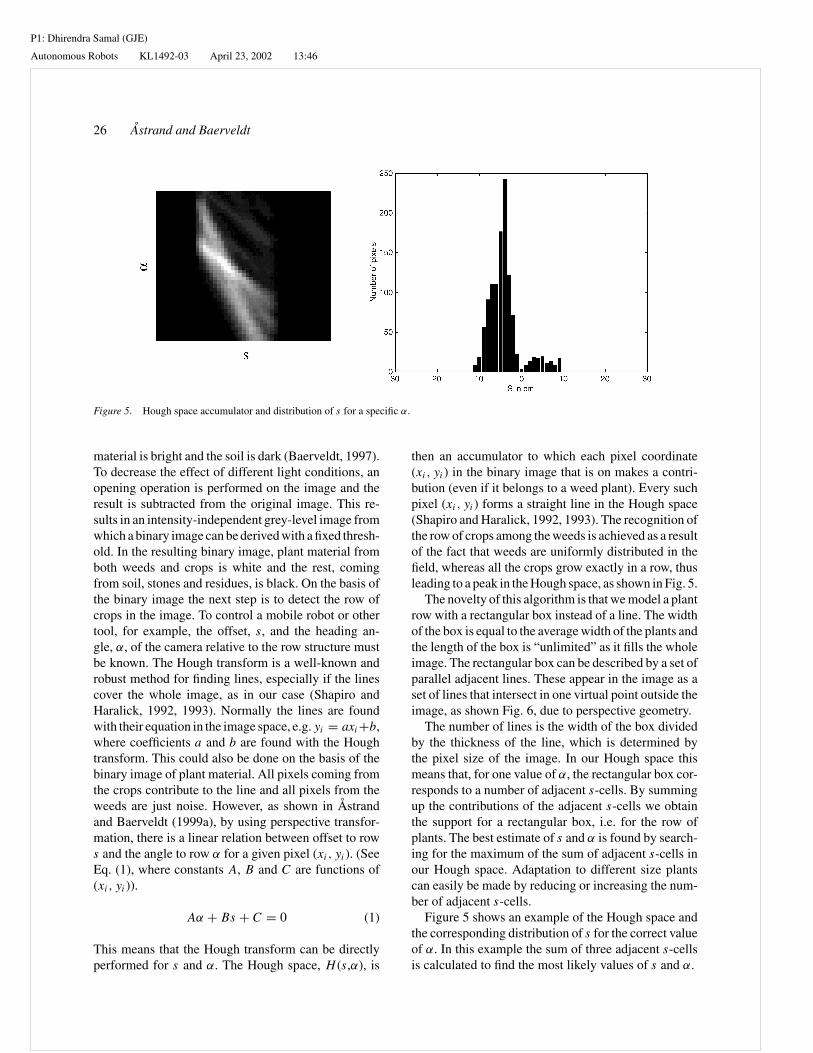
Figure 5. Hough space accumulator and distribution of s for a specific α.
material is bright and the soil is dark (Baerveldt, 1997).To decrease the effect of different light conditions, anopening operation is performed on the image and theresult is subtracted from the original image. This re-sults in an intensity-independent grey-level image fromwhich a binary image can be derived with a fixed thresh-old. In the resulting binary image, plant material fromboth weeds and crops is white and the rest, comingfrom soil, stones and residues, is black. On the basis ofthe binary image the next step is to detect the row ofcrops in the image. To control a mobile robot or othertool, for example, the offset, s, and the heading an-gle, α, of the camera relative to the row structure mustbe known. The Hough transform is a well-known androbust method for finding lines, especially if the linescover the whole image, as in our case (Shapiro andHaralick, 1992, 1993). Normally the lines are foundwith their equation in the image space, e.g. yi = axi +b,where coefficients a and b are found with the Houghtransform. This could also be done on the basis of thebinary image of plant material. All pixels coming fromthe crops contribute to the line and all pixels from theweeds are just noise. However, as shown in Astrandand Baerveldt (1999a), by using perspective transfor-mation, there is a linear relation between offset to rows and the angle to row α for a given pixel (xi , yi ). (SeeEq. (1), where constants A, B and C are functions of(xi , yi )).
Aα + Bs + C = 0 (1)
This means that the Hough transform can be directlyperformed for s and α. The Hough space, H (s,α), is
then an accumulator to which each pixel coordinate(xi , yi ) in the binary image that is on makes a contri-bution (even if it belongs to a weed plant). Every suchpixel (xi , yi ) forms a straight line in the Hough space(Shapiro and Haralick, 1992, 1993). The recognition ofthe row of crops among the weeds is achieved as a resultof the fact that weeds are uniformly distributed in thefield, whereas all the crops grow exactly in a row, thusleading to a peak in the Hough space, as shown in Fig. 5.
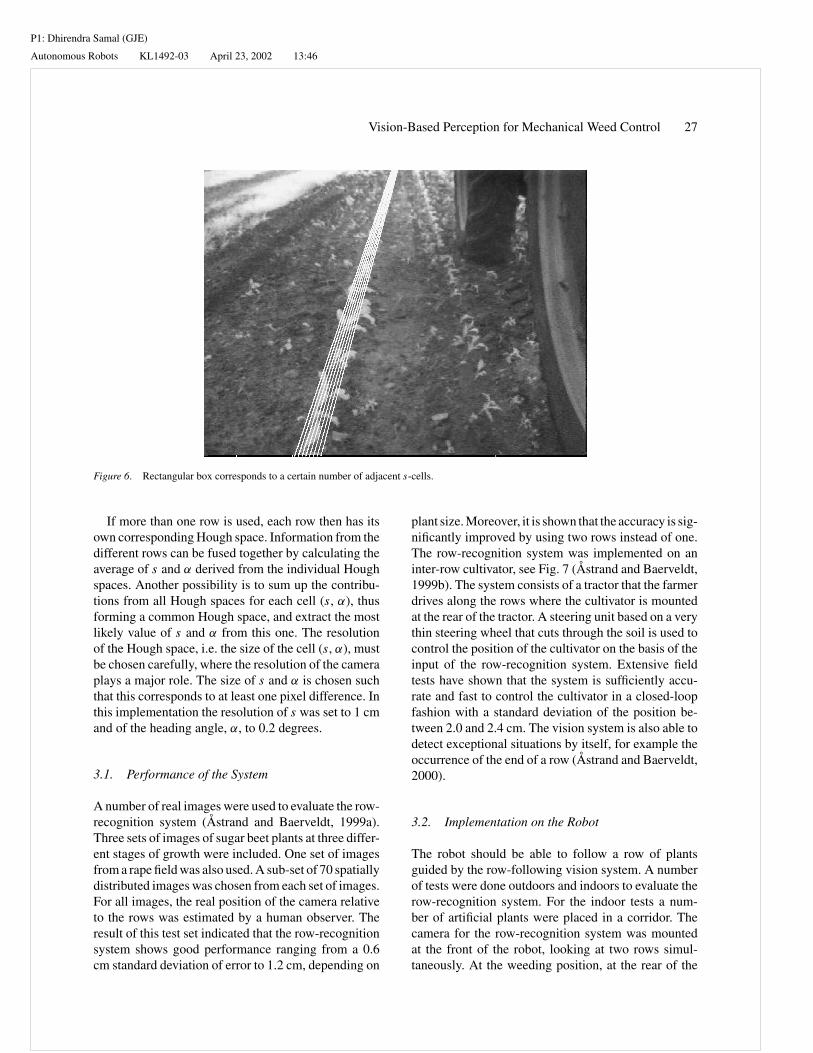
The novelty of this algorithm is that we model a plantrow with a rectangular box instead of a line. The widthof the box is equal to the average width of the plants andthe length of the box is “unlimited” as it fills the wholeimage. The rectangular box can be described by a set ofparallel adjacent lines. These appear in the image as aset of lines that intersect in one virtual point outside theimage, as shown Fig. 6, due to perspective geometry.
The number of lines is the width of the box dividedby the thickness of the line, which is determined bythe pixel size of the image. In our Hough space thismeans that, for one value of α, the rectangular box cor-responds to a number of adjacent s-cells. By summingup the contributions of the adjacent s-cells we obtainthe support for a rectangular box, i.e. for the row ofplants. The best estimate of s and α is found by search-ing for the maximum of the sum of adjacent s-cells inour Hough space. Adaptation to different size plantscan easily be made by reducing or increasing the num-ber of adjacent s-cells.
Figure 5 shows an example of the Hough space andthe corresponding distribution of s for the correct valueof α. In this example the sum of three adjacent s-cellsis calculated to find the most likely values of s and α.
P1: Dhirendra Samal (GJE)
Autonomous Robots KL1492-03 April 23, 2002 13:46
Vision-Based Perception for Mechanical Weed Control 27
Figure 6. Rectangular box corresponds to a certain number of adjacent s-cells.
If more than one row is used, each row then has itsown corresponding Hough space. Information from thedifferent rows can be fused together by calculating theaverage of s and α derived from the individual Houghspaces. Another possibility is to sum up the contribu-tions from all Hough spaces for each cell (s, α), thusforming a common Hough space, and extract the mostlikely value of s and α from this one. The resolutionof the Hough space, i.e. the size of the cell (s, α), mustbe chosen carefully, where the resolution of the cameraplays a major role. The size of s and α is chosen suchthat this corresponds to at least one pixel difference. Inthis implementation the resolution of s was set to 1 cmand of the heading angle, α, to 0.2 degrees.
3.1. Performance of the System
A number of real images were used to evaluate the row-recognition system (Astrand and Baerveldt, 1999a).Three sets of images of sugar beet plants at three differ-ent stages of growth were included. One set of imagesfrom a rape field was also used. A sub-set of 70 spatiallydistributed images was chosen from each set of images.For all images, the real position of the camera relativeto the rows was estimated by a human observer. Theresult of this test set indicated that the row-recognitionsystem shows good performance ranging from a 0.6cm standard deviation of error to 1.2 cm, depending on
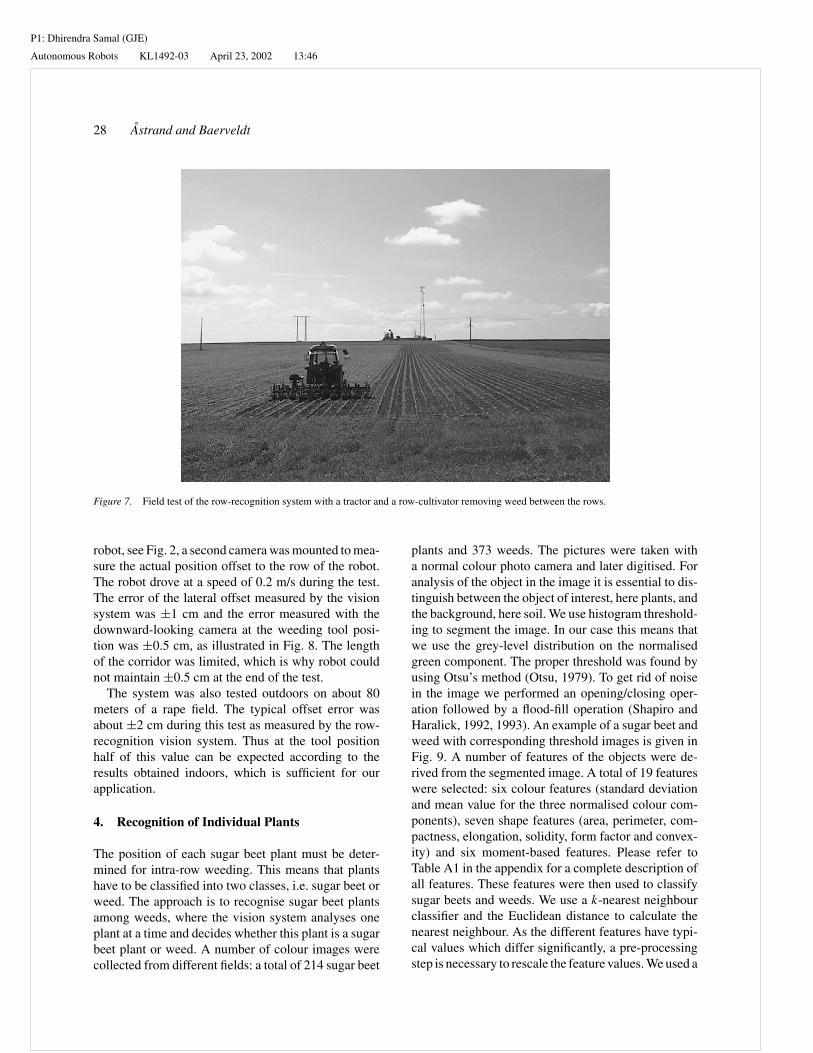
plant size. Moreover, it is shown that the accuracy is sig-nificantly improved by using two rows instead of one.The row-recognition system was implemented on aninter-row cultivator, see Fig. 7 (Astrand and Baerveldt,1999b). The system consists of a tractor that the farmerdrives along the rows where the cultivator is mountedat the rear of the tractor. A steering unit based on a verythin steering wheel that cuts through the soil is used tocontrol the position of the cultivator on the basis of theinput of the row-recognition system. Extensive fieldtests have shown that the system is sufficiently accu-rate and fast to control the cultivator in a closed-loopfashion with a standard deviation of the position be-tween 2.0 and 2.4 cm. The vision system is also able todetect exceptional situations by itself, for example theoccurrence of the end of a row (Astrand and Baerveldt,2000).
3.2. Implementation on the Robot
The robot should be able to follow a row of plantsguided by the row-following vision system. A numberof tests were done outdoors and indoors to evaluate therow-recognition system. For the indoor tests a num-ber of artificial plants were placed in a corridor. Thecamera for the row-recognition system was mountedat the front of the robot, looking at two rows simul-taneously. At the weeding position, at the rear of the
P1: Dhirendra Samal (GJE)
Autonomous Robots KL1492-03 April 23, 2002 13:46
28 Astrand and Baerveldt
Figure 7. Field test of the row-recognition system with a tractor and a row-cultivator removing weed between the rows.
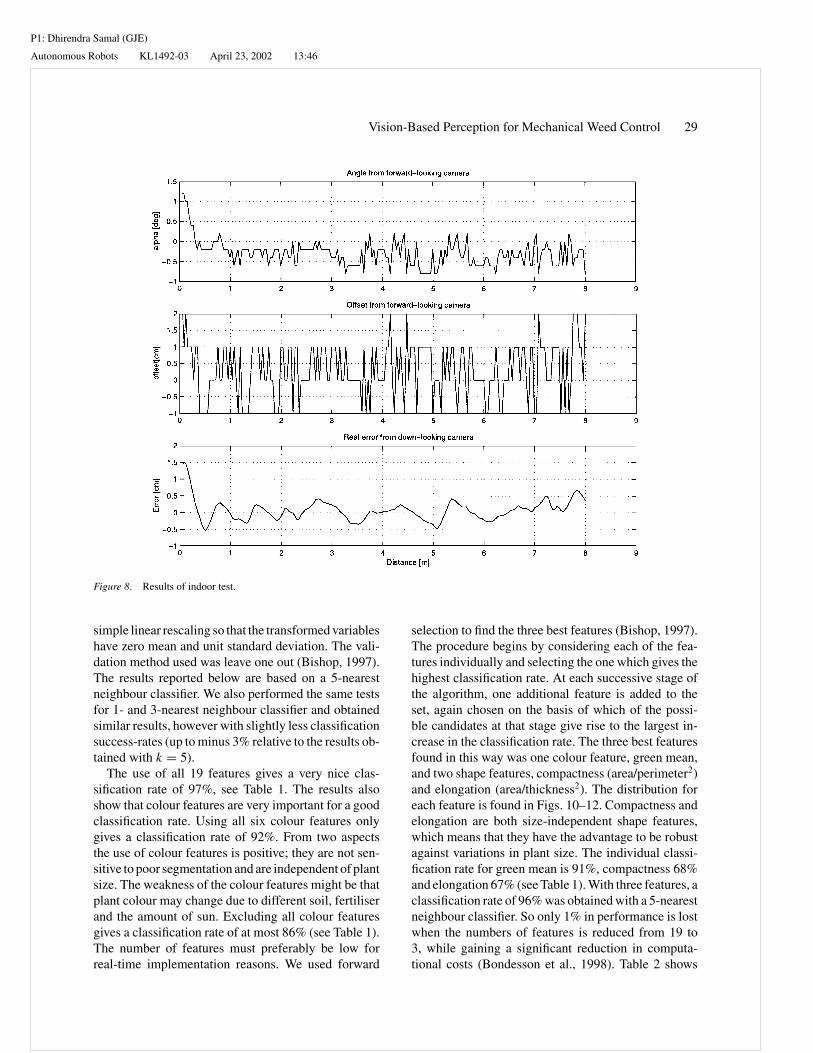
robot, see Fig. 2, a second camera was mounted to mea-sure the actual position offset to the row of the robot.The robot drove at a speed of 0.2 m/s during the test.The error of the lateral offset measured by the visionsystem was ±1 cm and the error measured with thedownward-looking camera at the weeding tool posi-tion was ±0.5 cm, as illustrated in Fig. 8. The lengthof the corridor was limited, which is why robot couldnot maintain ±0.5 cm at the end of the test.
The system was also tested outdoors on about 80meters of a rape field. The typical offset error wasabout ±2 cm during this test as measured by the row-recognition vision system. Thus at the tool positionhalf of this value can be expected according to theresults obtained indoors, which is sufficient for ourapplication.
4. Recognition of Individual Plants
The position of each sugar beet plant must be deter-mined for intra-row weeding. This means that plantshave to be classified into two classes, i.e. sugar beet orweed. The approach is to recognise sugar beet plantsamong weeds, where the vision system analyses oneplant at a time and decides whether this plant is a sugarbeet plant or weed. A number of colour images werecollected from different fields: a total of 214 sugar beet
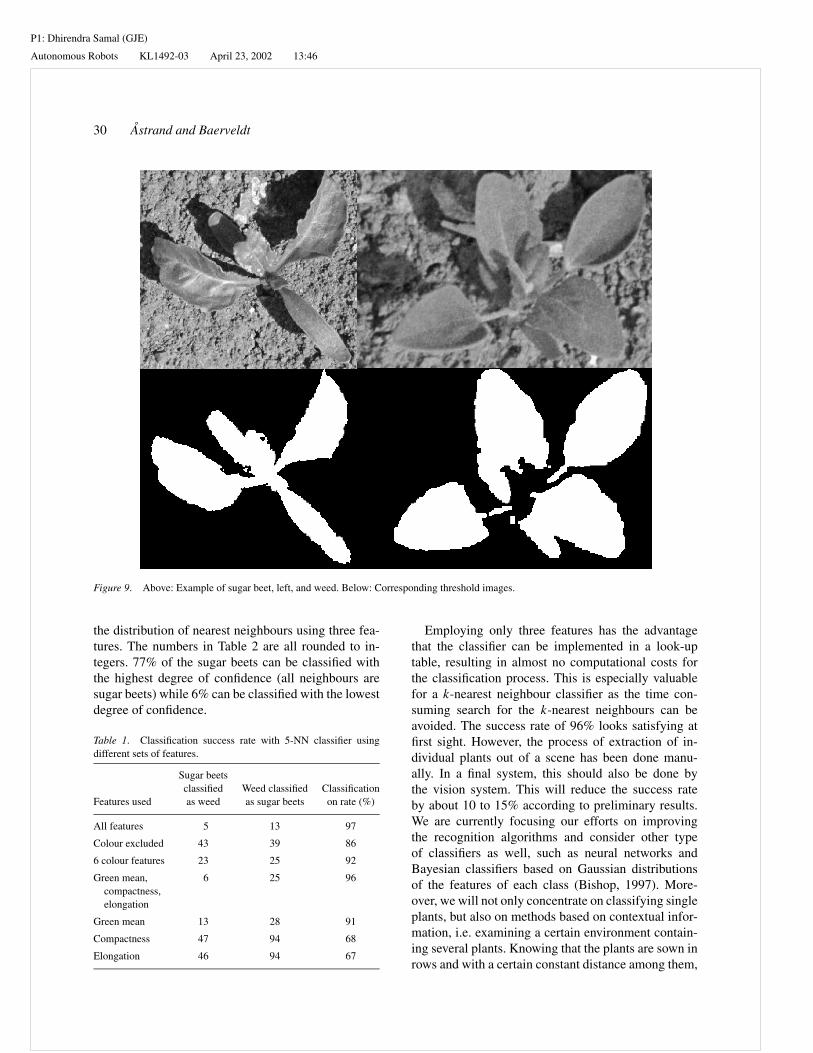
plants and 373 weeds. The pictures were taken witha normal colour photo camera and later digitised. Foranalysis of the object in the image it is essential to dis-tinguish between the object of interest, here plants, andthe background, here soil. We use histogram threshold-ing to segment the image. In our case this means thatwe use the grey-level distribution on the normalisedgreen component. The proper threshold was found byusing Otsu’s method (Otsu, 1979). To get rid of noisein the image we performed an opening/closing oper-ation followed by a flood-fill operation (Shapiro andHaralick, 1992, 1993). An example of a sugar beet andweed with corresponding threshold images is given inFig. 9. A number of features of the objects were de-rived from the segmented image. A total of 19 featureswere selected: six colour features (standard deviationand mean value for the three normalised colour com-ponents), seven shape features (area, perimeter, com-pactness, elongation, solidity, form factor and convex-ity) and six moment-based features. Please refer toTable A1 in the appendix for a complete description ofall features. These features were then used to classifysugar beets and weeds. We use a k-nearest neighbourclassifier and the Euclidean distance to calculate thenearest neighbour. As the different features have typi-cal values which differ significantly, a pre-processingstep is necessary to rescale the feature values. We used a
P1: Dhirendra Samal (GJE)
Autonomous Robots KL1492-03 April 23, 2002 13:46
Vision-Based Perception for Mechanical Weed Control 29
Figure 8. Results of indoor test.
simple linear rescaling so that the transformed variableshave zero mean and unit standard deviation. The vali-dation method used was leave one out (Bishop, 1997).The results reported below are based on a 5-nearestneighbour classifier. We also performed the same testsfor 1- and 3-nearest neighbour classifier and obtainedsimilar results, however with slightly less classificationsuccess-rates (up to minus 3% relative to the results ob-tained with k = 5).
The use of all 19 features gives a very nice clas-sification rate of 97%, see Table 1. The results alsoshow that colour features are very important for a goodclassification rate. Using all six colour features onlygives a classification rate of 92%. From two aspectsthe use of colour features is positive; they are not sen-sitive to poor segmentation and are independent of plantsize. The weakness of the colour features might be thatplant colour may change due to different soil, fertiliserand the amount of sun. Excluding all colour featuresgives a classification rate of at most 86% (see Table 1).The number of features must preferably be low forreal-time implementation reasons. We used forward
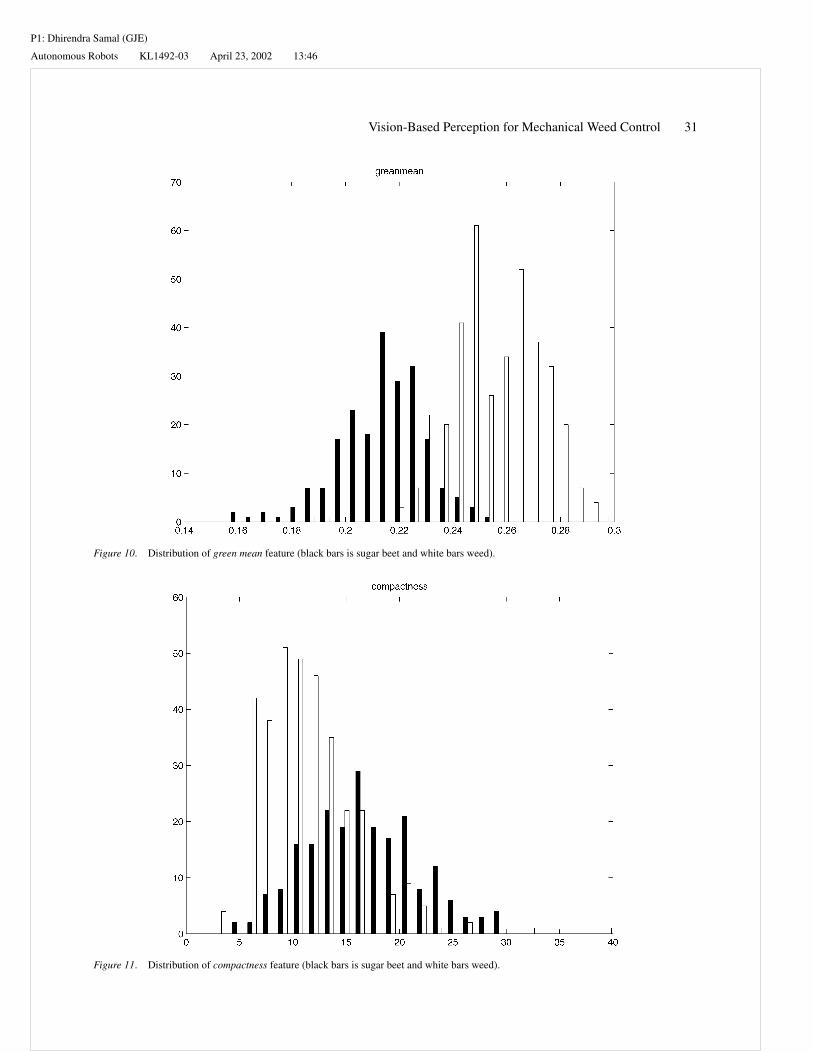
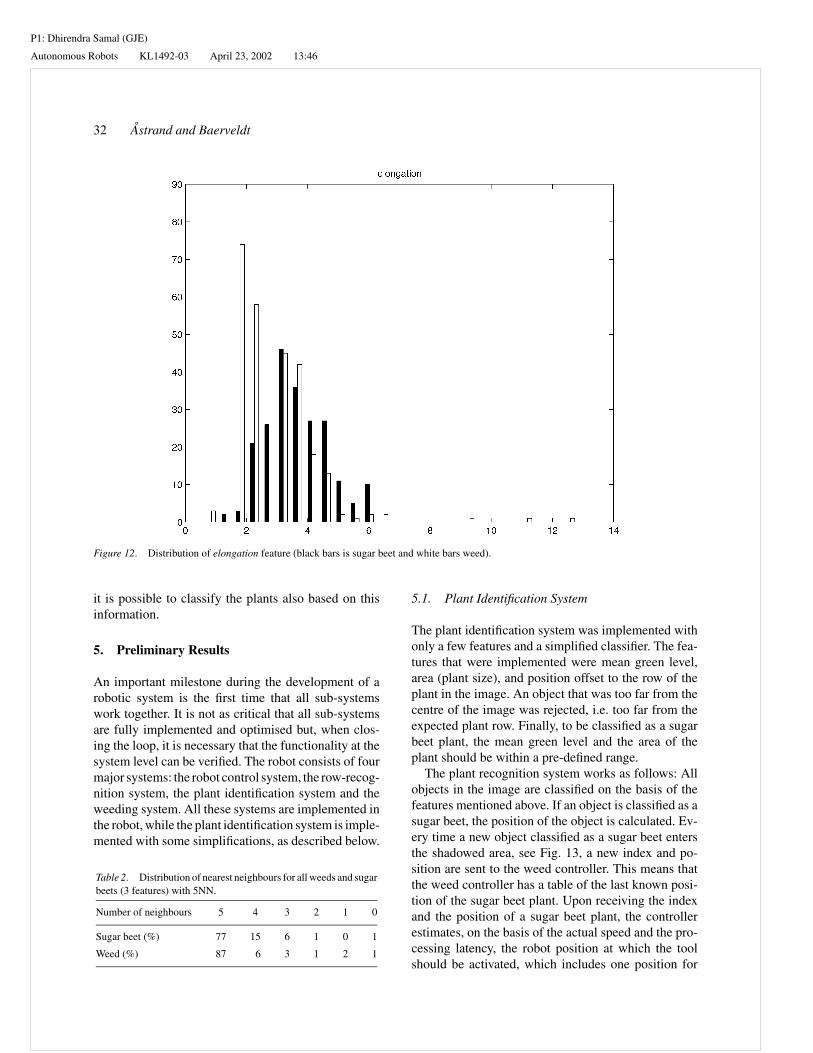
selection to find the three best features (Bishop, 1997).The procedure begins by considering each of the fea-tures individually and selecting the one which gives thehighest classification rate. At each successive stage ofthe algorithm, one additional feature is added to theset, again chosen on the basis of which of the possi-ble candidates at that stage give rise to the largest in-crease in the classification rate. The three best featuresfound in this way was one colour feature, green mean,and two shape features, compactness (area/perimeter2)and elongation (area/thickness2). The distribution foreach feature is found in Figs. 10–12. Compactness andelongation are both size-independent shape features,which means that they have the advantage to be robustagainst variations in plant size. The individual classi-fication rate for green mean is 91%, compactness 68%and elongation 67% (see Table 1). With three features, aclassification rate of 96% was obtained with a 5-nearestneighbour classifier. So only 1% in performance is lostwhen the numbers of features is reduced from 19 to3, while gaining a significant reduction in computa-tional costs (Bondesson et al., 1998). Table 2 shows
P1: Dhirendra Samal (GJE)
Autonomous Robots KL1492-03 April 23, 2002 13:46
30 Astrand and Baerveldt
Figure 9. Above: Example of sugar beet, left, and weed. Below: Corresponding threshold images.
the distribution of nearest neighbours using three fea-tures. The numbers in Table 2 are all rounded to in-tegers. 77% of the sugar beets can be classified withthe highest degree of confidence (all neighbours aresugar beets) while 6% can be classified with the lowestdegree of confidence.
Table 1. Classification success rate with 5-NN classifier usingdifferent sets of features.
Sugar beetsclassified Weed classified Classification
Features used as weed as sugar beets on rate (%)
All features 5 13 97
Colour excluded 43 39 86
6 colour features 23 25 92
Green mean, 6 25 96compactness,elongation
Green mean 13 28 91
Compactness 47 94 68
Elongation 46 94 67
Employing only three features has the advantagethat the classifier can be implemented in a look-uptable, resulting in almost no computational costs forthe classification process. This is especially valuablefor a k-nearest neighbour classifier as the time con-suming search for the k-nearest neighbours can beavoided. The success rate of 96% looks satisfying atfirst sight. However, the process of extraction of in-dividual plants out of a scene has been done manu-ally. In a final system, this should also be done bythe vision system. This will reduce the success rateby about 10 to 15% according to preliminary results.We are currently focusing our efforts on improvingthe recognition algorithms and consider other typeof classifiers as well, such as neural networks andBayesian classifiers based on Gaussian distributionsof the features of each class (Bishop, 1997). More-over, we will not only concentrate on classifying singleplants, but also on methods based on contextual infor-mation, i.e. examining a certain environment contain-ing several plants. Knowing that the plants are sown inrows and with a certain constant distance among them,
P1: Dhirendra Samal (GJE)
Autonomous Robots KL1492-03 April 23, 2002 13:46
Vision-Based Perception for Mechanical Weed Control 31
Figure 10. Distribution of green mean feature (black bars is sugar beet and white bars weed).
Figure 11. Distribution of compactness feature (black bars is sugar beet and white bars weed).
P1: Dhirendra Samal (GJE)
Autonomous Robots KL1492-03 April 23, 2002 13:46
32 Astrand and Baerveldt
Figure 12. Distribution of elongation feature (black bars is sugar beet and white bars weed).
it is possible to classify the plants also based on thisinformation.
5. Preliminary Results
An important milestone during the development of arobotic system is the first time that all sub-systemswork together. It is not as critical that all sub-systemsare fully implemented and optimised but, when clos-ing the loop, it is necessary that the functionality at thesystem level can be verified. The robot consists of fourmajor systems: the robot control system, the row-recog-nition system, the plant identification system and theweeding system. All these systems are implemented inthe robot, while the plant identification system is imple-mented with some simplifications, as described below.
Table 2. Distribution of nearest neighbours for all weeds and sugarbeets (3 features) with 5NN.
Number of neighbours 5 4 3 2 1 0
Sugar beet (%) 77 15 6 1 0 1
Weed (%) 87 6 3 1 2 1
5.1. Plant Identification System
The plant identification system was implemented withonly a few features and a simplified classifier. The fea-tures that were implemented were mean green level,area (plant size), and position offset to the row of theplant in the image. An object that was too far from thecentre of the image was rejected, i.e. too far from theexpected plant row. Finally, to be classified as a sugarbeet plant, the mean green level and the area of theplant should be within a pre-defined range.
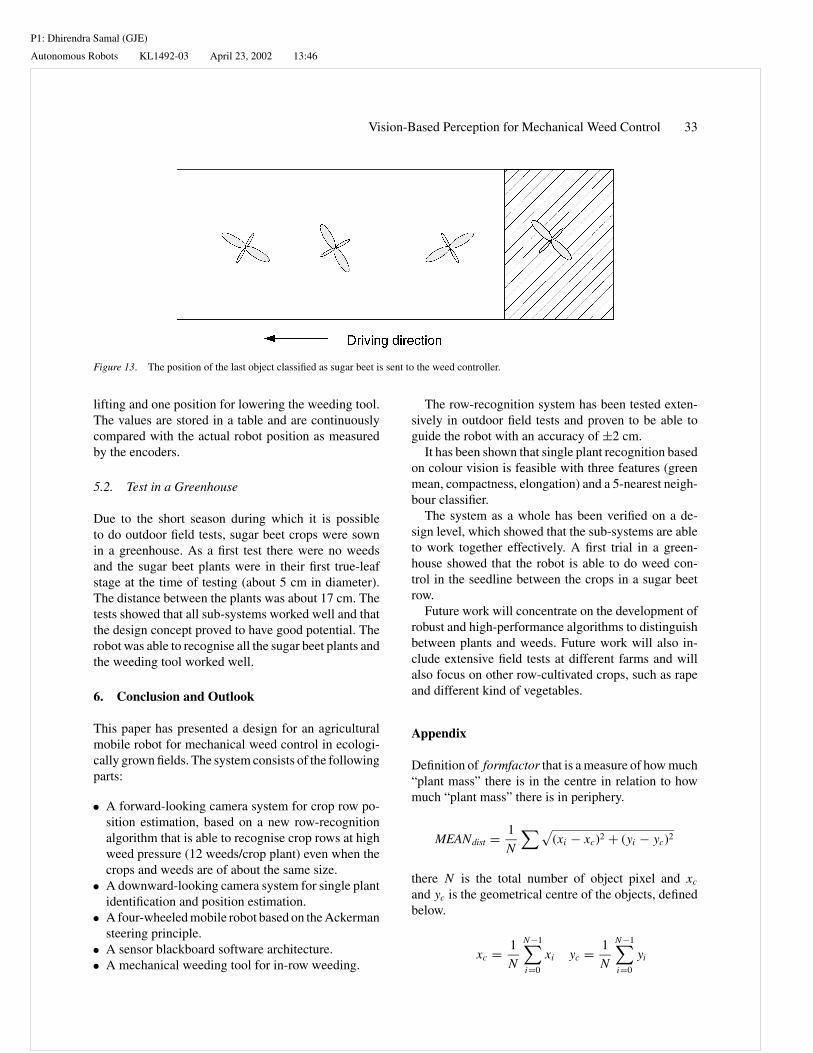
The plant recognition system works as follows: Allobjects in the image are classified on the basis of thefeatures mentioned above. If an object is classified as asugar beet, the position of the object is calculated. Ev-ery time a new object classified as a sugar beet entersthe shadowed area, see Fig. 13, a new index and po-sition are sent to the weed controller. This means thatthe weed controller has a table of the last known posi-tion of the sugar beet plant. Upon receiving the indexand the position of a sugar beet plant, the controllerestimates, on the basis of the actual speed and the pro-cessing latency, the robot position at which the toolshould be activated, which includes one position for
P1: Dhirendra Samal (GJE)
Autonomous Robots KL1492-03 April 23, 2002 13:46
Vision-Based Perception for Mechanical Weed Control 33
Figure 13. The position of the last object classified as sugar beet is sent to the weed controller.
lifting and one position for lowering the weeding tool.The values are stored in a table and are continuouslycompared with the actual robot position as measuredby the encoders.
5.2. Test in a Greenhouse
Due to the short season during which it is possibleto do outdoor field tests, sugar beet crops were sownin a greenhouse. As a first test there were no weedsand the sugar beet plants were in their first true-leafstage at the time of testing (about 5 cm in diameter).The distance between the plants was about 17 cm. Thetests showed that all sub-systems worked well and thatthe design concept proved to have good potential. Therobot was able to recognise all the sugar beet plants andthe weeding tool worked well.
6. Conclusion and Outlook
This paper has presented a design for an agriculturalmobile robot for mechanical weed control in ecologi-cally grown fields. The system consists of the followingparts:
• A forward-looking camera system for crop row po-sition estimation, based on a new row-recognitionalgorithm that is able to recognise crop rows at highweed pressure (12 weeds/crop plant) even when thecrops and weeds are of about the same size.
• A downward-looking camera system for single plantidentification and position estimation.
• A four-wheeled mobile robot based on the Ackermansteering principle.
• A sensor blackboard software architecture.• A mechanical weeding tool for in-row weeding.
The row-recognition system has been tested exten-sively in outdoor field tests and proven to be able toguide the robot with an accuracy of ±2 cm.
It has been shown that single plant recognition basedon colour vision is feasible with three features (greenmean, compactness, elongation) and a 5-nearest neigh-bour classifier.
The system as a whole has been verified on a de-sign level, which showed that the sub-systems are ableto work together effectively. A first trial in a green-house showed that the robot is able to do weed con-trol in the seedline between the crops in a sugar beetrow.
Future work will concentrate on the development ofrobust and high-performance algorithms to distinguishbetween plants and weeds. Future work will also in-clude extensive field tests at different farms and willalso focus on other row-cultivated crops, such as rapeand different kind of vegetables.
Appendix
Definition of formfactor that is a measure of how much“plant mass” there is in the centre in relation to howmuch “plant mass” there is in periphery.
MEANdist = 1
N
∑ √(xi − xc)2 + (yi − yc)2
there N is the total number of object pixel and xc
and yc is the geometrical centre of the objects, definedbelow.
xc = 1
N
N−1∑
i=0
xi yc = 1
N
N−1∑
i=0
yi
P1: Dhirendra Samal (GJE)
Autonomous Robots KL1492-03 April 23, 2002 13:46
34 Astrand and Baerveldt
VARdist = 1
N
∑[√
(xi − xc)2 + (yi − yc)2
− MEANdist]2
formfactor = MEANdist√VARdist
Table A1. List of features.
Number Name Description
1 Green mean The mean value, over the hole plant,of the normalised green colour, g =G/(R + G + B).
2 Green std The standard deviation, over the holeplant, of the normalised green colour.
3 Red mean The mean value, over the hole plant,of the normalised red colour, r = R/
(R + G + B).
4 Red std The standard deviation, over the holeplant, of the normalised red colour.
5 Blue mean The mean value, over the hole plant,of the normalised blue colour, b = B/
(R + G + B).
6 Blue std The standard deviation, over the holeplant, of the normalised blue colour.
7 Area Area is defined as the number of pixelsbelonging to the plant.
8 Perimeter Perimeter is defined as the number ofpixels of the plant boundary.
9 Compactness area/perimeter2
10 Elongation area/thickness2, there thickness isdefined as the number of shrinkingsteps of an object until only one pixelis left in the image.
11 Solidity area/(area of convex hull), there convexhull is described as the area formedif a rubber band would be tightenaround the object.
12 Formfactor See definition above in this appendix.
13 Convexity perimeter/(perimeter of convex hull).
14
15
16
17
18
19
Moment1
Moment2
Moment3
Moment4
Moment5
Moment6
These are functions of moments,which are invariant to geometrictransformations such as translation,scaling and rotation. Defined in Jain(1989).
Acknowledgments
This work was carried out in the Mech-Weedproject, which has been a co-operative effort between
Halmstad University and Danisco Sugar AB. Theproject was sponsored by the Swedish foundation Stif-telsen for Kunskaps- och Kompetensutveckling. Theproject is currently sponsored by Skogs- och jord-brukets forskningsrAd, SJFR. Thanks to Bernd Beckerfor his work with the mobile robot platform.
References
Astrand, B. and Baerveldt, A.J. 1999a. Mechatronics in agriculture—robust recognition of plant rows. In 2nd International Confer-ence on Recent Advances in Mechatronics (ICRAM’99), Istanbul,Turkey, pp. 135–141.
Astrand, B. and Baerveldt, A.J. 1999b. Robust tracking of plantrows using machine vision. In Sixth International Conference onMechatronics and Machine Vision in Practice, Middle East Tech-nical University, Ankara, Turkey, pp. 95–101.
Astrand, B. and Baerveldt, A.J. 2000. A vision based row-followingsystem for agricultural robots. In Proceedings of the Symposiumon Image Analysis, Swedish Society for Automated Image Analysis(SSAB), Halmstad, Sweden, pp. 113–117.
Baerveldt, A.J. 1997. Vision-guided mechanical weed-control. In2nd International Workshop on Mechatronical Computer Sys-tems for Perception and Action (MCPA’97), Pisa, Italy, pp. 135–138.
Becker, B. 1999. Development of the real time software for an agri-cultural robot. Diploma Thesis in Computer Science, HalmstadUniversity—Fachhochschule Ulm.
Billingsley, J. and Schoenfisch, M. 1995. Vision-guidance of agri-cultural vehicles. Autonomous Robots, 2:65–76.
Bishop, C.M. 1997. Neural Networks for Pattern Recognition,Oxford University Press: New York.
Bondesson, F. Minas, M., and Winberg, U. 1998. Classification ofsugar-beet plants among weeds using machine vision. MasterProject Electrical Engineering, Halmstad University.
Brivot, R. and Marchant, J.A. 1996. Segmentation of plants andweeds for a precision crop protection robot using infrared images.Proceedings of the IEE, Vision, Image and Signal Processing,143(2):118–124.
Harmon, S.Y., Bianchini, G.L., and Pinz, B.E. 1986. Sensor data fu-sion through a distributed blackboard. In 1986 IEEE InternationalConference on Robotics and Automation, San Francisco, CA, pp.1449–1454.
Jain, A.K. 1989. Fundamentals of Digital Image Processing, PrenticeHall: Englewood Cliffs, New Jersey.
Lee, W.S. Slaughter, D.C., and Giles, D.K. 1997. Robotic weed con-trol systems for tomatoes using machine vision system and preci-sion chemical applications. In Proceedings of the 1997 ASAE An-nual International Meeting, Minneapolis, Minnesota, Paper No.97-3093.
Marchant, J.A. 1996. Tracking of row structure in three crops us-ing image analysis. Computer and Electronics in Agriculture,15(2):161–179.
Marchant, J.A. and Brivot, R. 1995. Real-time tracking of plantrows using a Hough transform. Real-Time Imaging, 1:363–371.
Ollis, M. and Stentz, A. 1996. First result in vision based cropline tracking. In Proceedings of the 1996 IEEE International
P1: Dhirendra Samal (GJE)
Autonomous Robots KL1492-03 April 23, 2002 13:46
Vision-Based Perception for Mechanical Weed Control 35
Conference on Robotics and Automation, Minneapolis, Min-nesota, pp. 951–956.
Otsu, N. 1979. A threshold selection method from grey-levelhistograms. IEEE Trans. on Systems Man and Cybernetics,9(1):63–66.
Shapiro, L.G. and Haralick, R.M. 1992/1993. Computer and RobotVision Volume I and II, Addison, Wesley Publishing Company:Reading, MA.
Slaughter, D.C., Chen, P., and Curley, R.G. 1997. Computervision guidance system for precision cultivation. In ASAEMeeting Presentation, Minneapolis, Minnesota, Paper No. 97-1079.
Tillett, N.D., Hague, T., and Marchant, J. A. 1998. A robotic systemfor plant-scale husbandry. Journal of Agricultural EngineeringResearch, 69:169–178.
Bjorn Astrand received his master’s degree in Computer SystemEngineering in 1995. He is currently a Ph.D. student at the Schoolof Information Science, Computer and Electrical Engineering at
Halmstad University. His research interests are in mechatronics,robotics and computer vision.
Albert-Jan Baerveldt is a Professor of Mechatronic Systems at theSchool of Information Science, Computer and Electrical Engineeringat Halmstad University in Sweden, where he holds the Getinge Chairof Mechatronic Systems. He received the Ph.D. degree in Mechatron-ics from the Swiss Federal Institute of Technology, Zurich in 1993,where he conducted research mainly in the field of vision-guidedrobot arms. During this time he also won the first worldchampi-onship for ping pong playing robots in Hong-Kong in 1992. HisPh.D. work on the bin-picking problem was awarded with a grantto exhibit the work at the “Research and Development Exhibition”at the Hannover Fair 1992 in Germany, which is one of the largestindustrial fairs in the world. In 1994 he had a postdoc position at theInstitute of Automatic Control at Lund Technical University, Lundin Sweden. Since 1994 he has been working at Halmstad Universityin Sweden. Currently he is leader of the Intelligent Systems Lab. Hisresearch interest include robotics and computer vision.

![Cross-Modal Interpretation of Multi-Modal Sensor Streams ... · sensor signals for robot perception [3]. They enhance robot perception by exploiting interaction as an additional source](https://img.pdfslide.us/doc/110x75/5ea343d752780b0b226c18a0/cross-modal-interpretation-of-multi-modal-sensor-streams-sensor-signals-for.jpg)