Embed Size (px)
Citation preview

University of Montana University of Montana
ScholarWorks at University of Montana ScholarWorks at University of Montana
Graduate Student Theses, Dissertations, & Professional Papers Graduate School
2014
An Adaptive Hybrid Method for Link Prediction in Multi-Modal An Adaptive Hybrid Method for Link Prediction in Multi-Modal
Directed Complex Networks Using the Graph Traversal Pattern Directed Complex Networks Using the Graph Traversal Pattern
William Lyon
Follow this and additional works at: https://scholarworks.umt.edu/etd
Part of the Computer Sciences Commons
Let us know how access to this document benefits you.
Recommended Citation Recommended Citation Lyon, William, "An Adaptive Hybrid Method for Link Prediction in Multi-Modal Directed Complex Networks Using the Graph Traversal Pattern" (2014). Graduate Student Theses, Dissertations, & Professional Papers. 4358. https://scholarworks.umt.edu/etd/4358
This Thesis is brought to you for free and open access by the Graduate School at ScholarWorks at University of Montana. It has been accepted for inclusion in Graduate Student Theses, Dissertations, & Professional Papers by an authorized administrator of ScholarWorks at University of Montana. For more information, please contact [email protected].

An Adaptive Hybrid Method For Link Prediction In Multi-ModalDirected Complex Networks Using The Graph Traversal Pattern
By
William James Lyon
B.A. Economics, University of Montana, Missoula, Montana, 2006B.S. Business Administration, University of Montana, Missoula, Montana 2006
Thesis
presented in partial fulfillment of the requirements for the degree of
Master of Sciencein Computer Science
The University of MontanaMissoula, MT
December 2014
Approved By:
Sandy Ross, Dean of the Graduate SchoolGraduate School
Jesse JohnsonDepartment of Computer Science
Robert SmithDepartment of Computer Science
Douglas DalenbergDepartment of Economics

ii
Lyon, William - M.S. - December 2014 Computer Science
An Adaptive Hybrid Method For Link Prediction In Multi-Modal Directed ComplexNetworks Using The Graph Traversal Pattern
Chairperson: Jesse Johnson
The paper examines the link prediction problem for directed multi-modal complex networks.Specically, a hybrid method combining collaborative filtering and Triadic Closeness methodsis developed. The methods are applied to a sample of the GitHub network. Implementationdetails are discussed, with a focus on design of a scalable system for handilng large datasets. Finally, results of this new method are discussed with no significant improvement overcurrent methods.

Declaration
I hereby declare that this thesis is my own work and e�ort and that it has not beensubmitted anywhere for any award. Where other sources of information have been used,they have been acknowledged.
William Lyon


Contents
1 Introduction 11.1 Online Social Collaboration Networks . . . . . . . . . . . . . . . . . . . . . 11.2 Link Prediction For Directed Multi-Modal Networks - An Adaptive Hybrid
Method . . . . . . . . . . . . . . . . . . . . . . . . . . . . . . . . . . . . . . 2
2 Previous Work 32.1 Recommendation As Link Prediction . . . . . . . . . . . . . . . . . . . . . 32.2 Similarity-based Algorithms . . . . . . . . . . . . . . . . . . . . . . . . . . 42.3 Network-based Methods . . . . . . . . . . . . . . . . . . . . . . . . . . . . 5
2.3.1 Triadic Closeness . . . . . . . . . . . . . . . . . . . . . . . . . . . . 52.4 Directed Social Networks . . . . . . . . . . . . . . . . . . . . . . . . . . . . 62.5 The case for a hybrid method . . . . . . . . . . . . . . . . . . . . . . . . . 6
3 Methods 73.1 Sample Network . . . . . . . . . . . . . . . . . . . . . . . . . . . . . . . . . 73.2 Algorithms . . . . . . . . . . . . . . . . . . . . . . . . . . . . . . . . . . . . 8
3.2.1 Collaborative Filtering . . . . . . . . . . . . . . . . . . . . . . . . . 8Similarity Metrics . . . . . . . . . . . . . . . . . . . . . . . . . . . 9
3.2.2 Triadic Closeness . . . . . . . . . . . . . . . . . . . . . . . . . . . . 103.2.3 An adaptive hybrid method . . . . . . . . . . . . . . . . . . . . . . 17
3.3 Data . . . . . . . . . . . . . . . . . . . . . . . . . . . . . . . . . . . . . . . 183.3.1 Github Archive . . . . . . . . . . . . . . . . . . . . . . . . . . . . . 20
FollowEvent . . . . . . . . . . . . . . . . . . . . . . . . . . . . . . 20WatchEvent (Stars) . . . . . . . . . . . . . . . . . . . . . . . . . . 21
3.3.2 Data Analysis . . . . . . . . . . . . . . . . . . . . . . . . . . . . . . 223.4 Implementation . . . . . . . . . . . . . . . . . . . . . . . . . . . . . . . . . 25
3.4.1 Architecture . . . . . . . . . . . . . . . . . . . . . . . . . . . . . . . 25Data collection layer . . . . . . . . . . . . . . . . . . . . . . . . . . 26Analytics layer . . . . . . . . . . . . . . . . . . . . . . . . . . . . . 26Evaluation and visualization layer . . . . . . . . . . . . . . . . . . 28
v

Contents vi
4 Evaluation 294.1 Evaluation Metrics . . . . . . . . . . . . . . . . . . . . . . . . . . . . . . . 29
4.1.1 Precision . . . . . . . . . . . . . . . . . . . . . . . . . . . . . . . . . 294.1.2 HitRatio@N (Recall) . . . . . . . . . . . . . . . . . . . . . . . . . . 294.1.3 Evaluation . . . . . . . . . . . . . . . . . . . . . . . . . . . . . . . . 29
5 Summary and Outlook 325.1 Further research . . . . . . . . . . . . . . . . . . . . . . . . . . . . . . . . . 32
Bibliography 34

CHAPTER 1Introduction
Many social, biological and information systems can be modeled as complex networks(or graphs) where the nodes are individuals and the edges (or links) between nodesrepresent interaction between the nodes. The term complex network is used to describegraphs (consisting of nodes and edges) that exhibit non-trivial topological structure.These networks often consist of real-world interactions, such as computer, social andcollaboration networks that cannot be modeled as a random graph[Ste10]. With thegrowing popularity of online social networks (such as Facebook and Twitter) in recentyears, much research has been devoted to understanding these types of complex networks.One area of that research is recommender systems: the problem of recommendinginteresting content/users in the network. Examples of these systems used in productioninclude Twitter’s "Who To Follow" system [Pan13], LinkedIn’s "People You Might Know",and similar recommendation in FaceBook. When modeled as a graph, recommendersystems become link predictors answering the question can the system predict removedlinks in the remaining network? In this paper we explore the problem of link predictionin complex networks, and apply the methods to a data set from the GitHub onlinesocial collaboration network. A novel system for generating link predictions is discussed,implemented and evaluated.
1.1 Online Social Collaboration NetworksA new type of social network that has been gaining popularity is the online socialcollaboration network. Online social collaboration networks map social interactionsallowing users to collaborate toward some common goal. An example of this type ofnetwork is GitHub 1. GitHub is a software collaboration web service built around thegit version control system. Software developers use GitHub to collaborate on softwareprojects, to share their projects, to interact with other developers/users, and to followwhat other users are working on. GitHub is perhaps the largest community of software
1 http://www.github.com
1

1.2 Link Prediction For Directed Multi-Modal Networks - An Adaptive Hybrid Method 2
developers in the world, with perhaps the largest collection of open source softwareunder active development. As we will see, this provides a very rich dataset for analysis.In a more practical sense, improving recommender systems for the GitHub network canhelp users find software projects and users with whom to collaborate faster and moreeasily. This could lead to a more productive software development ecosystem.
1.2 Link Prediction For Directed Multi-Modal Networks - An Adaptive Hybrid MethodThe goal of this thesis is to explore the link prediction problem, as applied to onlinesocial collaboration networks. Much of the previous literature in this area focuses onhomogenous (single relationship) undirected social networks. We extend this researchto focus on heterogenous (multiple relationship type) or multi-modal directed socialcollaboration networks, specifically the GitHub network. We duplicate the work donepreviously in this area and develop a novel approach to link prediction, specifically anadaptive ensemble method.
The remainder of this paper is outlined as follows:
Chapter 2 - Previous Work. A review of the literature in this field. We show howlink prediction fits into the recommender system literature and discuss how linkprediction methods have adapted as they are applied to evolving types of networks.
Chapter 3 - Methods. An examination of the data used for this project as well as anin-depth explanation of the algorithms used for link prediction, in the contextof the graph traversal pattern, which is also explained in this chapter. A novelapproach for link prediction is proposed, a combined similarity and networkstructure method. Implementation details involving graph data modeling andgraph databases are discussed.
Chapter 4 - Evaluation. This new recommender system is evaluated relative to similaritybased methods and network structure methods. Challenges of the present systemare discussed.
Chapter 5 - Summary. Areas of further research are discussed.

CHAPTER 2
Previous Work
The link prediction problem for complex networks was best formalized by Kleinberg:"Given a snapshot of a social network, can we infer which new interactions among itsmembers are likely to occur in the near future?" [LN07] It is this problem which weaddress in this paper. We discuss how link prediction fits into the world of recommendersystems and provide a brief overview of the methods commonly used for the linkprediction program. We identify two distinctive types of link prediction algorithms:similarity based algorithms and network based algorithms.
2.1 Recommendation As Link Prediction
Consider a bipartite graph of Users and Items where the edges of the network representpurchase links: if a link exists between User 1 and Item x then User 1 has purchasedItem x. Recommender systems modeled on this type of data take the form of "users whobought x also bought y", as often seen on online retail sites such as Amazon. For example,in Figure 2.1 we see a bipartite graph as described above. An item recommendationfor User 1 takes the form of a predicted link in the network. This is an example of aUser-Item link prediction, however we could also predict links between Users based onthe structure of the network, similarity between User-Item preferences, or both. Anexample of user recommendation is LinkedIn’s "Do You Know..." feature, which suggestsUsers. These types of link prediction/recommender systems can be generalized as "WhoTo Follow" recommender systems and it is this type of recommendation on which thispaper will focus [Pan13].
3

2.2 Similarity-based Algorithms 4
Figure 2.1: Here we see an example of an item recommender system modeled as a graphwhere the nodes are Users and Items and the edges indicate a purchse of an Item by a User.When modeled this way recommendation takes the form a predicted link in the graph.
2.2 Similarity-based AlgorithmsSimilarity based methods rely on the computation of a user-user similarity metric, whichis then used to make recommendations. This is based on the homophily principle, thatusers are more likely to be interested in users similar to them.[Ric11] Each pair of nodesin the network is assigned a score S
uv
, which represents the strength of the similaritybetween u and v. To generate predicted links, all unobserved links u,v are ranked basedon S
uv
, with the highest ranked selected as predicted links. Similarity metrics are oftencalculated based on observed links in the networks, with the concept of overlappingneighbors in the network being a common distinguishing characteristic. [Lu10]
Table 2.1: Common similarity metrics. Defintion of several commonly used similaritymetrics. Note that Pearson correlation and Cosine similarity make use of weighted edges,while Jaccard is calculated without taking edge weights into account.
Metric Definition DescriptionJaccard J(A,B) = |AflB|
|AfiB| Size of the intersection of neigh-bors divided by the union of thesets of neighbors
Pearson correlationPn
i=1(Xi≠X)(Yi≠Y )ÔPni=1(Xi≠X)2
ÔPni=1(Yi≠Y )2
A mean adjusted correlation coef-ficient.
Cosine similaritynP
i=1Ai◊Bi
snP
i=1(Ai)2◊
snP
i=1(Bi)2
Cosine distance between two vec-tors.

2.3 Network-based Methods 5
If edge weights (often a User-Item rating) are available, the Pearson Coe�cient orCosine similarity are commonly used. For binary ratings the Jaccard metric is oftenused. Table 2.1 shows the definition for these metrics.
When user preferences are taken into account (such as the User-Item purchasenetwork shown in Figure 2.1) to calculate the similarity metric the system is said tomake use of collaborative filtering. Collaborative filtering systems produce user specificrecommendations based on patterns of behavior observed from other users. Typicallythis involves observing ratings of items and using either latent factor models or aneighborhood based approach to generate item recommendations[Ric11]. With the riseof social network analysis however, often instead of user-item recommendations, we aremore interested in generating user-user recommendations. User-user recommendationsare the focus of this project. The underlying assumption of collaborative filtering is thatof homophily: similar users like similar things. Collaborative filtering implementationscan be problematic when applied to a large dataset. Most methods require a largesparse matrix for computation, the use of which is not always performant. Instead, theproblem can be modeled as a graph, and make use of the graph traversal pattern as analternative to the construction of a large sparse matrix [Rod10]. Consider for a momentthe time complexity involved in calculating the all-pairs User-User similarity metricnecessary for collaborative filtering. This is at best an O(n2) computation, dependingon the similarity metric being calculated. This obviously does not scale well to largenetworks and so implementation details must be taken into account.
2.3 Network-based MethodsNetwork-based methods analyze the structure of the network to develop recommendations.Example of this include PageRank [Pag], HITS [LN07], SALSA [Lem01], and TriadicCloseness. The PageRank and HITS algorithms attempt to rank nodes in the networkby their relative importance, or centrality in the network. PageRank does this bycomputing an eigenvector centrality, while HITS focuses on identifying nodes that canbe classified as authorities, forming important hubs in the graph. SALSA and relatedmethods use a more probabilistic approach and use random walks through the graph togenerate link predictions. Indeed the Twitter Who To Follow system is based on such amethod. [Pan13]. Other methods such as Triadic Closeness use patterns in the networkto generate recommendations.
2.3.1 Triadic Closeness
Triadic Closeness is based on the graph theory concept of triadic closure. Triadic closureis the hypothesis that for two nodes in a network u and v, the existence of an edgebetween u, v is highly correlated with the overlap of u and v direct connections (neighboroverlap). The Triadic Closeness method uses triad pattern detection to determine thelikelihood that a given triad pattern is likely to close in the network (that an edge will

2.4 Directed Social Networks 6
form from u to v). Triadic Closeness can be summarized as:
Triad Closeness = Number of closed triadsNumber of potentially closed triads (2.1)
2.4 Directed Social NetworksThere is an important distinction to note between undirected social networks and directedsocial networks. Much of the literature has focused on undirected social networks only[Lu10]. In fact the similarity metrics shown above are all based on undirected socialnetworks. A notable exception is the Triadic Closeness method described by Schall[Sch14].
2.5 The case for a hybrid methodThere is a clear gap in the literature making use of combined network based methodswith similarity based methods [Lu10]. My contribution to this field is to explore howthese methods can be combined to improve the accuracy of such recommendations. Alinear combination of a collaborative filtering similarity based approach and a networkbased approach leveraging the use of directed networks is proposed, based somewhaton the work developed in [Can08]. By combining a network-based method with asimilarity-based method we are able to capture more information about the structure ofthe network and information about specific user preferences and actions. By taking intoaccount the proportion of edge types available for each user we are able to adjust theweights for each method in the hybrid metric, making the method adaptive for eachuser, based on the quantity of information available that describe each user’s actions inthe network. To enhance the e�ectiveness of the combined method we focus exclusivelyon multi-modal networks. Multi-modal networks are a type of complex network thatcontain multiple relationship types and/or multiple node types. Finally, we focus hereon making use of the graph traversal pattern. By modeling our data as a graph wecan e�ciently implement the methods discussed by traversing the graph, focusing ona local portion of the graph, rather than complex and expensive calculations for theentire network.
CHAPTER 3
Methods
Here we describe the data used and detail the implementation of the link predictionexperiment. We first examine in detail two methods for link prediction using a samplenetwork: collaborative filtering using the Jaccard similarity metric and the TriadicCloseness method. We then show how these two methods can be used together in ahybrid predictor using adaptive weights. An experiment using data from the Githubsocial collaboration network is discussed. The data used in this experiment is examined.Finally, implementation is discussed. We focus on the link prediction problem for apartially observed network. We assume certain links are missing from the network andattempt to predict the missing link(s), focusing on User-User edges.
3.1 Sample Network
Consider the network shown in figure 3.1. This is a sample network which was randomlygenerated and does not represent any real world observed data. However, we shall referto this network to demonstrate the techniques used in this project. The sample networkcontains two types of nodes: Users and Items. Each User can FOLLOW other Users.This is represented as a User-User directed edge with the label :FOLLOWS. Similarly,Users can express their interest in an Item with the :LIKES relationship (or edge).This type of network structure is similar to those observed in social networks (suchas Facebook, or Twitter), but also in collaboration networks, such as Github. Sincethe network has multiple types of nodes and edges it is referred to as a multi-modal
network[Ste10].
7

3.2 Algorithms 8
Figure 3.1: This sample network will be used to demonstrate the methods used for linkprediction in this paper. This network demonstrates a random multi-modal network withmultiple types of nodes and edges.
3.2 AlgorithmsFor illustrative purposes we will work through three examples of link prediction algo-rithms for the sample network shown above. First, using the collaborative filteringmethod with the Jaccard similarity metric. We will use User-Item edges to identifysimilar uses and generate recommendations based on those similarities. Next, we walkthrough the Triadic Closeness method as described in [Sch14]. Using probabilitiesobserved from triad patterns we will generate link predictions and compare to thosecreated using collaborative filtering. Finaly, we propose a hybrid method that combinescollaborative filtering and Triadic Closeness using an adaptive weighting system. In thecontext of the sample network we focus on predicting User-User :FOLLOWS edges only.
For the purposes of the next three sections we will consider link prediction for user J.We proceed through each algorithm manually, ignoring some implementation details fornow that will explored in depth in the proceeding section.
3.2.1 Collaborative FilteringCollaborative filtering is a method of generating recommendations based on the ho-mophily principle: users who are similar are likely to be interested in similar items. Itis implemented by finding similar users, based on some similarity metric [Ric11]. Herewe will use User-Item edges as an indication of a User’s binary rating of an Item. The

3.2 Algorithms 9
Jaccard metric is used to show a proportion of overlapping neighbors.
Similarity MetricsThe Jaccard index is used to identify similar users. For two users, a and b, let A and Bdenote the sets of all users being followed by a and b, respectively. The Jaccard index istherefore as defined in Equation 3.4.
J(A,B) = |A fl B||A fi B| (3.1)
In this context, Jaccard is defined as the intersection of the Items liked by a and bdivided by the union of the items likes by a and b. This results in a number between 0and 1, indicating the strength of similarity between users a and b.
To generate recommendations for user J , we first must identify all friend-of-friendnodes, that is nodes that share a neighbor Item in common with J . That gives us theset {N}. Our possible recommendations are now reduced to N. We will now computethe Jaccard similarity metric for the pair (J, N):
J(J,N) = |J fl N ||J fi N | (3.2)
The intersection of J and N here is defined as all items that have an incoming :LIKESedge from both J and N . Looking at the graph we can see that the intersection is Item2.Similarly, we can look at the graph to find the items that compose the union of J andN .
J(J,N) = |{Item2}||{Item2, Item4, Item5}| (3.3)
We are only interested in the size of the two sets, so we simply count the elements.
J(J,N) = 13 (3.4)
We can now predict the edge J æ N with weight 1/3. 1
As you can see, the collaborative filtering link prediction process for a given user x
1 If we were interested in predicting User-Item links, we could allow each similar user to vote forother Items in which J might have an interest. We now take the top k nodes that have the highestJaccard score and allow each to vote for new outgoing links to form from J . Here we will select Land recommend any outgoing links from L as destination nodes for predicted links emminating fromJ . However, we are only concerned here with User-User edges.

3.2 Algorithms 10
involves finding other users most similar to user x, then finding items those similar usersare most interested in. In this sense collaborative filtering can be thought of as verysimilar to k-nearest neighbors, where the distance calculation is based on some similaritymetric.
3.2.2 Triadic Closeness
Graph theory proposes the concept of triadic closure, the hypothesis that the creation ofan edge between u and v is related to the degree of overlapping neighbors in u and v’srespective networks. [Ste10] The concept of Triadic Closeness is an application of thetheory of triadic closure, specifically taking into account the directed nature of socialnetworks. For a given fully observed network, Triadic Closeness can be thought of as theratio of the number of closed triads to the number of potentially closed triads[Sch14]. Atriad consists of three nodes u, z, v where edges (ignoring direction) u,z and z,v exist.Edges between u and v may exist, however the concept of triadic closure posits that animplicit connection exists between u and v.
Algorithm 1 Link prediction algorithm for Triadic Closeness1: input : G(U, E), x, N2: usersSample Ω getRandomUsers(U,x)3: results Ω {}4: for eachuserinusersSample do
5: validationEdge Ω getRandomEdge(G, user)6: removeEdge(validationEdge,G)7: triads Ω getTriads(user, G)8: pred Ω {}9: for u, v in triads do
10: tc Ω calcTC(u,v,G)11: pred Ω pred + {tc, u, v}12: end for
13: predictions Ω topXSortedByTC(pred, N)14: hit Ω isvalidationEdgeinpredictions?15: addEdge(validationEdge, G)16: results Ω results + {hit, pred, u, v, validation
e
dge}17: end for
18: return results

3.2 Algorithms 11
Figure 3.2: For any given triad (u, z, v) there is an implicit link between u and v. TriadicCloseness is a measure of the strengt of this implicit link.
In a directed network there are 27 distinct configurations, or patterns that a triadcan take on. Figure 3.3 shows the 9 unique open triad patterns. Table 3.1 shows triadpatterns that are open, that is no connection exists between nodes u and v. The patternidentifications (T 01, T02...) are taken from[Sch14]. Any open triad can be closed in oneof three possible ways: u Ω v, u æ v, or u ¡ v.

3.2 Algorithms 12
Figure 3.3: Here all possible open triad patterns are shown. Each of the nine uniquetriad patterns are labled using an identifier Txy where y indicates which of the nine openpatterns the triads corresponds and x indicates if the triad is open (0), if the triad is closedwith an edge u æ v (1), if the triad is closed with an edge u Ω v (2) or if the triad is closedwith two edges u ¡ v (3). This triad pattern identification scheme is used when computingTriadic Closeness.
Figure 3.4: A triad is considered to be closed if an edge exists between u and v. In thetriad pattern ID, Txy, x identifies how the triad is closed.
Figure 3.4 shows the three distinct ways in which an open triad can be closed. Eitherthe creation of an edge u æ u, the creation of an edge u Ω v, or the creation of twoedges u æ v and u Ω v. In terms of the triad pattern id, the first digit indicates if the

3.2 Algorithms 13
triad is open (0), closed with an edge u æ v (1), closed with an edge u Ω v (2), orclosed with two edges u æ v and u Ω v (3). With this nomenclature we are now ableto represent each possible triad pattern with a two digit identifier.
TCuv
=X
zœ≈ (u)fl≈ (v)wP (u, v, z) ◊ w(z) (3.5)
As shown in Equation 3.5, triadic closeness for u,v is defined as the sum of wP timesw(z) over all triads in which u is a member in the network. The weights wP and w(z)are defined below.
wP (u,v,z) = F (T (u,v,z) + 10) + F (T (u,v,z) + 30)F (T (u,v,z)) (3.6)
The function T (u,v,z) retrieves the triad pattern ID (as shown in Figures 3.3 and 3.4)of the triad (u,v,z), while the function F (...) retrieves the frequency of a given triadpattern in the network. Thus, wP can be be thought of as the proportion of triads of agiven pattern that were closed with a link u æ v.
TCuv
=X
zœ≈ (u)fl≈ (v)wP (u,v,z) ◊ 1
kz
(3.7)
w(z) is defined as the inverse of the degree of z. This weight is meant to express thesignificance of edges u ¡ z and z ¡ v relative to the number of edges connecting zthroughout the entire network.
Having collected these triad pattern frequencies, we can now generate recommendationsas we did above for user J .
The first step is to identify all open triads of the form u,z,v where J is u and no linkbetween u,z exists. Those triads are:
• (J,F,G)• (J,I,N)• (J,P,Q)
Thus the three possible recommendations that we might generate are J æ G, J æ N ,and J æ Q. To determine the rank of the predictions, we must calculate the triadiccloseness metric for the pairs (J,G), (J,N) and (J,Q).
TCJG
=X
zœ≈ (J)fl≈ (G)wP (J, G, z) ◊ w(z) (3.8)

3.2 Algorithms 14
Table 3.1: Open triad pattern frequency in the sample network. This frequencies are usedto compute Triadic Closeness.
ID Pattern CountT06 u æ z Ω v 20T04 u æ z æ v 14T08 u Ω z Ω v 14T02 u ¡ z æ v 8T07 u Ω z ¡ v 8T09 u Ω z æ v 8T03 u æ z ¡ v 3T05 u ¡ z Ω v 3
Table 3.2: Closed triad pattern frequency in the sample network.
ID Pattern CountT18 u Ω z Ω v Ω u 3T14 u æ z æ v Ω u 2T16 u æ z Ω v Ω u 2T19 u Ω z æ v Ω u 2T15 u ¡ z Ω v Ω u 1T17 u Ω z ¡ v Ω u 1T24 u æ z æ v æ u 3T26 u æ z Ω v æ u 2T28 u Ω z Ω v æ u 2T29 u Ω z æ v æ u 2T22 u ¡ z æ v æ u 1T23 u æ z ¡ v æ u 1T34 u æ z æ v ¡ u 1T38 u Ω z Ω v ¡ u 1
TCJG
= wP (J, G, F ) ◊ w(F ) (3.9)
wP (J,G,F ) = F (T (J,F,G) + 10) + F (T (J,F,G) + 30)F (T (J,F,G)) (3.10)

3.2 Algorithms 15
We can see that T(J,F,G) = T03, so we have:
wP (J,G,F ) = F (T03 + 10) + F (T03 + 30)F (T03) (3.11)
wP (J,G,F ) = F (T13) + F (T33)F (T03) (3.12)
wP (J,G,F ) = 0 + 03 (3.13)
wP (J,G,F ) = 0 (3.14)
TCJG
= 0 (3.15)
Next for J,N:
TCJG
=X
zœ≈ (J)fl≈ (G)wP (J, N, z) ◊ w(z) (3.16)
TCJG
= wP (J, I, N) ◊ w(I) (3.17)
wP (J,G,F ) = F (T (J,I,N) + 10) + F (T (J,I,N) + 30)F (T (J,I,N)) (3.18)
We can see that T(J,I,N) = T08, so we have:
wP (J,G,F ) = F (T08 + 10) + F (T08 + 30)F (T08) (3.19)
Using tables 3.1 and 3.2 we can substitute the triad frequencies.
wP (J,G,F ) = 3 + 114 (3.20)

3.2 Algorithms 16
wP (J,G,F ) = 0.286 (3.21)
w(I) = 1/3 (3.22)
TCJN
= 0.286 ◊ 1/3 = 0.095 (3.23)
and finally, calculate TC(J,Q):
TCJQ
=X
zœ≈ (J)fl≈ (Q)wP (J, Q, z) ◊ w(z) (3.24)
TCJG
= wP (J, P, A) ◊ w(Q) (3.25)
wP (J,P,Q) = F (T (J,P,Q) + 10) + F (T (J,P,Q) + 30)F (T (J,P,Q)) (3.26)
We can see that T(J,P,Q) = T04, so we have:
wP (J,P,Q) = F (T04 + 10) + F (T04 + 30)F (T04) (3.27)
wP (J,P,Q) = 2 + 014 (3.28)
wP (J,P,Q) = 0.143 (3.29)
w(P ) = 1/3 (3.30)

3.2 Algorithms 17
TCJQ
= 0.143 ◊ 1/3 (3.31)
TCJQ
= .048 (3.32)
We can then sort our recommendations by TC and the most likely edge we willrecommend is J æ Q.
3.2.3 An adaptive hybrid methodEach of the two methods described above do not fully capture the information neededto make robust recommendations:
• Collaborative filtering captures similar items to identify nodes that a user mightfind interesting, however the model does not capture any probabilistic informationto inform how likely the link is to form, given the relevant/similar node.
• While Triadic Closeness captures probabilistic information that informs how likelycertain triad patterns are to close, it is not informed by any user rating observations.This results in predictions based solely on patterns and ignoring content similarity.
We next examine how these two methods can be combined to improve link prediction.[Lu2010] identifies such hybrid methods as a way to improve accuracy of link predictionbeyond what any one algorithm might be able to obtain.
While such an hybrid method could be defined as a simple weighted average with fixedweights as described in [Can08], we instead propose an adaptive weighting mechanismto take into account the information available for each component of the hybrid metric.
Consider:
AEMu,v
=X
cœcomponents
c(u, v) ◊ wc
(u,v) (3.33)
Using Jaccard and Triadic Closeness, this becomes:
AEMu,v
= J(u,v) ◊ wJ
(u,v) + TC(u,v) ◊ wT C
(u,v) (3.34)
Both Jaccard and Triadic Closeness metrics are in the range {0,1} so we do not needto normalize. J(u,v) is described above in Equation XX and TC(u,v) in Equation 3.34,but what values to assign the weights w
J
and wT C
? Rather than assigning equal weights,the weights should be assigned according to the proportion of our confidence in eachmetric. Since we are dealing with a multi-modal network, each metric is calculatedusing a certain relationship type. Here Jaccard is calculated using User-Item :LIKES

3.3 Data 18
relationships, while Triadic Closeness is calculated using only User-User :FOLLOWSrelationships. For a given user, u we can use the proportion of total out-edges of eachrelationship type as the weight for the corresponding metric.
For example:
wJ
(u,v) = count(u ≠ {: LIKES}≠ >)count(u ≠ {ú}≠ >) (3.35)
wT C
= count(u ≠ {: FOLLOWS}≠ >)count(u ≠ {ú}≠ >) (3.36)
Where count(u ≠ {: LIKES}≠ >) is the number of outgoing :LIKES edges for Useru and count(u ≠ {ú}≠ >) is the total number of outgoing edges (both :LIKES and:FOLLOWS).
We can think of each outgoing edge as a rating or vote from that user, expressingtheir interest. If for a given user we observe 10 :FOLLOWS edges and only 1 :LIKESedge, we have greater confidence in the accuracy of the Triadic Closeness metric sincewe have more information about User u’s preferences.
3.3 Data
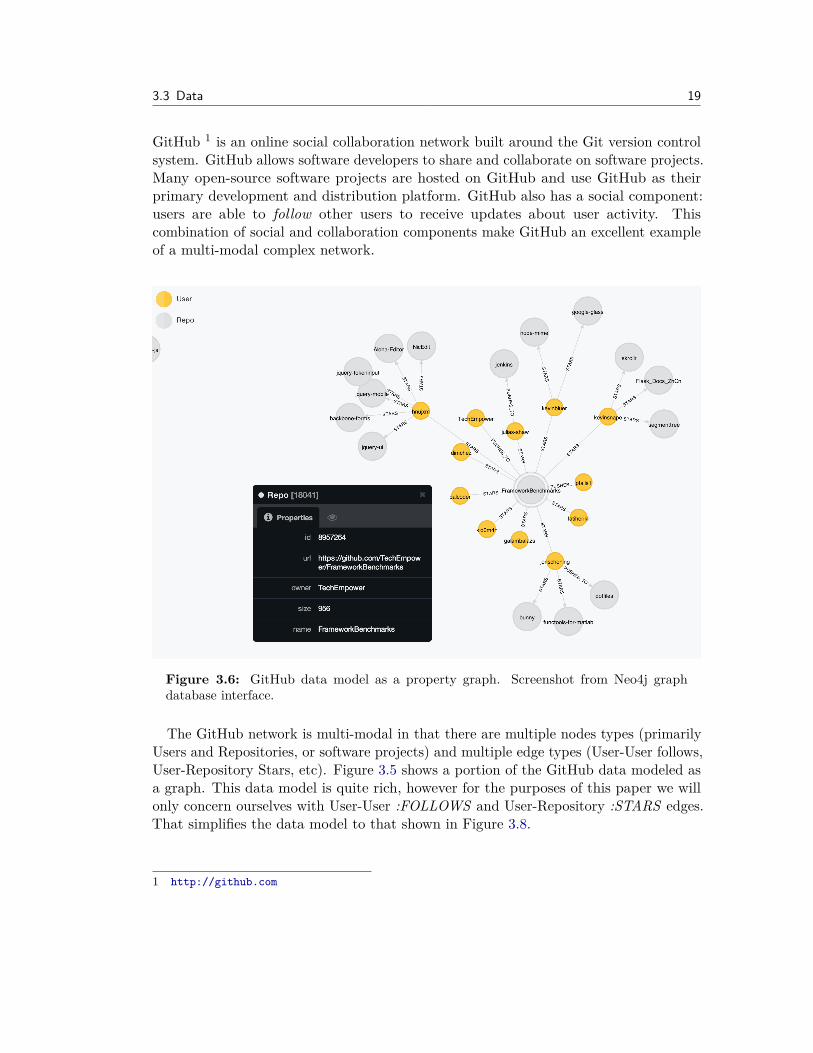
Figure 3.5: GitHub data model as a labeled property graph.
3.3 Data 19
GitHub 1 is an online social collaboration network built around the Git version controlsystem. GitHub allows software developers to share and collaborate on software projects.Many open-source software projects are hosted on GitHub and use GitHub as theirprimary development and distribution platform. GitHub also has a social component:users are able to follow other users to receive updates about user activity. Thiscombination of social and collaboration components make GitHub an excellent exampleof a multi-modal complex network.
Figure 3.6: GitHub data model as a property graph. Screenshot from Neo4j graphdatabase interface.
The GitHub network is multi-modal in that there are multiple nodes types (primarilyUsers and Repositories, or software projects) and multiple edge types (User-User follows,User-Repository Stars, etc). Figure 3.5 shows a portion of the GitHub data modeled asa graph. This data model is quite rich, however for the purposes of this paper we willonly concern ourselves with User-User :FOLLOWS and User-Repository :STARS edges.That simplifies the data model to that shown in Figure 3.8.
1 http://github.com

3.3 Data 20
Figure 3.7: The GitHub follow graph is a simple graph with User nodes and Follows edges.
3.3.1 Github ArchiveData was collected from GitHub Archive[Gita], a service that maintains an archive of allpublic events emitted by the GitHub API[Gitb]. These include events such as creationof new repositories, pushes to repositories, repository stars, and user follows. Data wascollected for the time period April 1st, 2013 - April 1st, 2014. Table 3.3 shows summarystatistics about the size of the network built from this data. It is important to note thatthis data represents only a sample of the network, not the complete GitHub network.
A graph data model is used to represent this data as the data is highly connected:it is describing entities (users and repositories) and their interactions (stars, follows,pushes, etc). Figure 3.6 shows an example of a subgraph of user and repository nodesand the interactions among those entities, modeled as a graph.
FollowEventThe data collected from GitHub Archive is in the streaming JSON format. An exampleof a User-User folow event is shown below:
1 {2 "created_at": "2013-07-11T15:03:05-07:00",3 "payload": {4 "target": {5 "id": 4602587,6 "login": "smarquez1",7 "followers": 1,8 "repos": 1,9 "gravatar_id": "42eb6556201588fa7641bf2f0bf615e6"
10 }11 },12 "public": true,13 "type": "FollowEvent",14 "url": "https://github.com/smarquez1",15 "actor": "matiasalvarez87",16 "actor_attributes": {17 "login": "matiasalvarez87",18 "type": "User",

3.3 Data 21
19 "gravatar_id": "0ee1a5bec013545c91ad05c451fb9715",20 "name": "Matias Alvarez Duran",21 "company": "NaN Labs",22 "blog": "http://ar.linkedin.com/pub/matias-emiliano-alvarez-duran/17/39b/
a96",23 "location": "Argentina",24 "email": "[email protected]"25 }26 }
Listing 3.1: JSON document example of data point - Follow event
WatchEvent (Stars)User-Repository stars event data is formatted as in this example:
1 {2 "created_at": "2013-07-11T15:01:56-07:00",3 "payload": {4 "action": "started"5 },6 "public": true,7 "type": "WatchEvent",8 "url": "https://github.com/CamDavidsonPilon/Probabilistic-Programming-and-
Bayesian-Methods-for-Hackers",9 "actor": "cebe",
10 "actor_attributes": {11 "login": "cebe",12 "type": "User",13 "gravatar_id": "2ebfe57beabd0b9f8eb9ded1237a275d",14 "name": "Carsten Brandt",15 "company": "cebe.cc",16 "blog": "http://cebe.cc/",17 "location": "Berlin, Germany",18 "email": "[email protected]"19 },20 "repository": {21 "id": 7607075,22 "name": "Probabilistic-Programming-and-Bayesian-Methods-for-Hackers",23 "url": "https://github.com/CamDavidsonPilon/Probabilistic-Programming-and-
Bayesian-Methods-for-Hackers",24 "description": "aka \"Bayesian Methods for Hackers\": An introduction to
Bayesian methods + probabilistic programming with a computation/understanding-first, mathematics-second point of view. All in pure Python ;) ",
25 "homepage": "http://camdavidsonpilon.github.io/Probabilistic-Programming-and-Bayesian-Methods-for-Hackers",
26 "watchers": 3353,27 "stargazers": 3353,

3.3 Data 22
28 "forks": 444,29 "fork": false,30 "size": 1264,31 "owner": "CamDavidsonPilon",32 "private": false,33 "open_issues": 21,34 "has_issues": true,35 "has_downloads": true,36 "has_wiki": true,37 "language": "Python",38 "created_at": "2013-01-14T07:46:28-08:00",39 "pushed_at": "2013-07-04T17:08:47-07:00",40 "master_branch": "master"41 }42 }
Listing 3.2: JSON document example of data point - Watch Event
3.3.2 Data AnalysisTable 3.3 shows some descriptive statistics about the GitHub dataset used for thisproject. The observed network consists of 1.7 million nodes (this includes both Usersand Repositories) and 10.7 million edges (both User-User follows edges and User-Repository stars edges.
Table 3.3: Summary statistics for the data collected from GitHub Archive
CountNum nodes 1,751,605Num edges 10,740,463Mean degree 6.13Num USER nodes 871,382Num REPO nodes 880,223Num : FOLLOWS edges 1,120,069Num : STARS edges 9,620,394Mean : FOLLOWS degree 1.29Mean : STARS degree 11.04
As an initial sanity check for exploring the data we compute PageRank for the observedGitHub network. PageRank is a link analysis algorithm that assigns weights to nodesin a network based on that nodes relative importance, or centrality in the network.[Pag] It is similar to a measure of eigenvector centrality. PageRank has the weakness ofonly being applicable to a homogenous or single mode network, therefore we apply the

3.3 Data 23
algorithm to the User-User follows subgraph and the User-Repository stars subgraphseparately. The GraphLab PageRank algorithm implementation is used [GraphLab].
Table 3.4: Here we see the most "central" Users per their PageRank rankings. This isbased on the graph created by user-user follows edges.
User PageRankfunkenstein 413.14mojombo 300.01torvalds 248.21rippleFoundation 220.29visionmedia 140.52paulirish 129.59BYVoid 114.29schacon 112.17JakeWharton 110.55defunkt 106.86mattt 99.38worrydream 87.33hakimel 83.05pjhyett 80.89addyosmani 80.59mbostock 75.63mdo 70.40LeaVerou 66.92tekkub 62.24nf 60.93
Tables 3.4 and 3.5 show the highest ranked Users and Repositories for the GitHubdata collected.
Table 3.4 shows the results of the PageRank algorithm using User-User followsrelationships only. As a sanity check of the data, we expect the highest ranked Usersto be influential developers in the open-source software development community - thenodes with highest relative importance in this context. A cursory evaluation of the listof GitHub usernames confirms that this is indeed the case:
mojombo Tom Preston-Werner, a co-founder and developer of GitHubtorvalds Linus Torvalds, maintainer of the linux operating system kernel

3.3 Data 24
Table 3.5: Top 20 central GitHub repositories by PageRank.
Repository PageRankhttps://github.com/vhf/free-programming-books 455.07https://github.com/twbs/bootstrap 335.46https://github.com/jquery/jquery 289.42https://github.com/resume/resume.github.com 251.99https://github.com/mandatoryprogrammer/Octodog 233.41https://github.com/angular/angular.js 202.18https://github.com/mbostock/d3 149.55https://github.com/torvalds/linux 133.48https://github.com/FortAwesome/Font-Awesome 121.47https://github.com/twitter/bootstrap 111.42https://github.com/laravel/laravel 106.75https://github.com/papers-we-love/papers-we-love 102.25https://github.com/joyent/node 101.27https://github.com/rethinkdb/rethinkdb 92.34https://github.com/neovim/neovim 91.52https://github.com/libgit2/libgit2 90.99https://github.com/rogerwang/node-webkit 88.23https://github.com/github/gitignore 88.08https://github.com/dypsilon/frontend-dev-bookmarks 86.73https://github.com/zurb/foundation 84.25
paulirish Paul Irish, a well known Google developermbostock Mike Bostock, core developer of d3.js a popular JavaScript data visualization
librarymdo Mark Otto, one of the developers of Bootstrap the widely used frontend CSS/-
Javascript framework
These are indeed software developers that could be considered very influential to theopen source software community.
Similarly, Table 3.5 enumerates the 20 most central GitHub software repositories,according to PageRank. Here we expect to see influential and widely used open-sourcesoftware projects. Scanning through the list we are able to identify several widely usedand important projects:

3.4 Implementation 25
/twbs/bootstrap Twitter Bootstrap, a popular frontend framework/angular/angular.js A widely used JavaScript framework developed by Google/torvalds/linux The linux operating system kernel/laravel/laravel An enterprise PHP framework/joyent/node The infamous node.js project
3.4 Implementation
Figure 3.8: The GitHub follow graph is a simple graph with User nodes and Follows edges.
We implement a system capable of generating recommendations using each of thethree methods described above (Jaccard similarity, Triadic Closeness, and an adaptivehybrid method). This system is written in Java and makes use of the Neo4j graphdatabase.
3.4.1 ArchitectureWe design the system to handle large amounts of data, beyond what will fit into memoryon a single machine. When developing such a system the tradeo�s become:
• Complexity of the system. A distributed cluster allows for more e�cient in-memory processing performance, however at the expense of complexity. Designing

3.4 Implementation 26
algorithms for distributed systems is complicated, as is running and maintainingsuch systems. If data is to be distributed across multiple instances, ineviatablythere is a tradeo� between data duplication and network latency as highly connectedgraph data such as complex networks typically cannot be partitioned completely.
• Memory access. If we make the assumption that the data will not fit into memory,then we need some sort of persistence layer. Accessing this persistence layer willdramatically reduce processing performance relative to in-memory computationand so this persistence layer must be designed to optimize our specific data accessuse-cases.
Data collection layerAs mentioned in the previous section, the data for this experiment is collected fromGitHub Archive. One year of events are downloaded for analysis. The data collectionlayer handles querying GitHub archive streaming JSON data, filtering for events bytype and converting the data into flat CSV formatted files. These CSV files are thene�ciently loaded into a Neo4j graph database instance. The data collection layer isimplemented in Python.
Analytics layerThe analytics layer is capable of running link prediction experiments with validationor generating ad-hoc link predictions for a given user node in the network. Queries tothe embedded Neo4j instance are done using the Cypher query language and are listedbelow. The analytics layer is implemented in Java.
1 MATCH (u1:User {name: {u1}}), (u2:User { name:{u2}})2 MATCH (u1)-[:STARS]->(x:Repo)<-[:STARS]-(u2) WITH x, u1, u23 WITH count(x) as intersect, u1, u24 //MATCH (u1)-[r:STARS]->(intersection:Repo)<-[:STARS]-(u2) WITH u1, u2,
intersection LIMIT 105 //WITH count(intersection) as intersect, u1, u26 MATCH (u1)-[r:STARS]->(rest1) WITH u1, u2, intersect, collect(DISTINCT rest1)
AS coll17 MATCH (u2)-[r:STARS]->(rest2) WITH u1, u2, collect(DISTINCT rest2) AS coll2,
coll1, intersect8 WITH u1, u2, intersect, coll1, coll2, length(coll1 + filter(x IN coll2 WHERE
NOT x IN coll1)) as union9 WITH u1, u2, (1.0*intersect/union) as jaccard
10 RETURN jaccard
Listing 3.3: Cypher query for computing Jaccard similarity
1 // Identify triad pattern2 // u<->z<->v3 // to calc TC for u<->v4 //MATCH (u:User {id: �a�})

3.4 Implementation 27
5 //MATCH (z:User {name: �c�})6 //MATCH (v:User {name: �d�})7 MATCH (u:User), (z:User), (v:User) WHERE u<>v AND v<>z AND z<>u // for all 3
node combos8 MATCH (u)--(z)--(v) // find triads only9 //MATCH (u)-->(v) // closed triads only
10 WITH DISTINCT u, z, v11 OPTIONAL MATCH t01=(z)-->(u)-->(z)-->(v)-->(z) WHERE NOT (u)--(v)12 OPTIONAL MATCH t02=(z)-->(u)-->(z)-->(v) WHERE NOT (u)--(v)13 OPTIONAL MATCH t03=(u)-->(z)-->(v)-->(z) WHERE NOT (u)--(v)14 OPTIONAL MATCH t04=(u)-->(z)-->(v) WHERE NOT (u)--(v)15 OPTIONAL MATCH t05=(v)-->(z)-->(u)-->(z) WHERE NOT (u)--(v)16 OPTIONAL MATCH t06=(u)-->(z)<--(v) WHERE NOT (u)--(v)17 OPTIONAL MATCH t07=(u)<--(z)-->(v)-->(z) WHERE NOT (u)--(v)18 OPTIONAL MATCH t08=(v)-->(z)-->(u) WHERE NOT (u)--(v)19 OPTIONAL MATCH t09=(u)<--(z)-->(v) WHERE NOT (u)--(v)20 WITH21 CASE22 WHEN t01 IS NOT NULL THEN �t01�23 WHEN t02 IS NOT NULL THEN �t02�24 WHEN t03 IS NOT NULL THEN �t03�25 WHEN t04 IS NOT NULL THEN �t04�26 WHEN t05 IS NOT NULL THEN �t05�27 WHEN t06 IS NOT NULL THEN �t06�28 WHEN t07 IS NOT NULL THEN �t07�29 WHEN t08 IS NOT NULL THEN �t08�30 WHEN t09 IS NOT NULL THEN �t09�31 END32 AS type33 WITH collect(type) AS types34 WITH types//, length(types) as triadcount35 WITH36 [x IN types WHERE x = �t01� | x] AS t01_c,37 [x IN types WHERE x = �t02� | x] AS t02_c,38 [x IN types WHERE x = �t03� | x] AS t03_c,39 [x IN types WHERE x = �t04� | x] AS t04_c,40 [x IN types WHERE x = �t05� | x] AS t05_c,41 [x IN types WHERE x = �t06� | x] AS t06_c,42 [x IN types WHERE x = �t07� | x] AS t07_c,43 [x IN types WHERE x = �t08� | x] AS t08_c,44 [x IN types WHERE x = �t09� | x] AS t09_c45 RETURN46 // divide by triadcount for frequency?47 1.0*length(t01_c) AS t01,48 1.0*length(t02_c) AS t02,49 1.0*length(t03_c) AS t03,50 1.0*length(t04_c) AS t04,
3.4 Implementation 28
51 1.0*length(t05_c) AS t05,52 1.0*length(t06_c) AS t06,53 1.0*length(t07_c) AS t07,54 1.0*length(t08_c) AS t08,55 1.0*length(t09_c) AS t09;
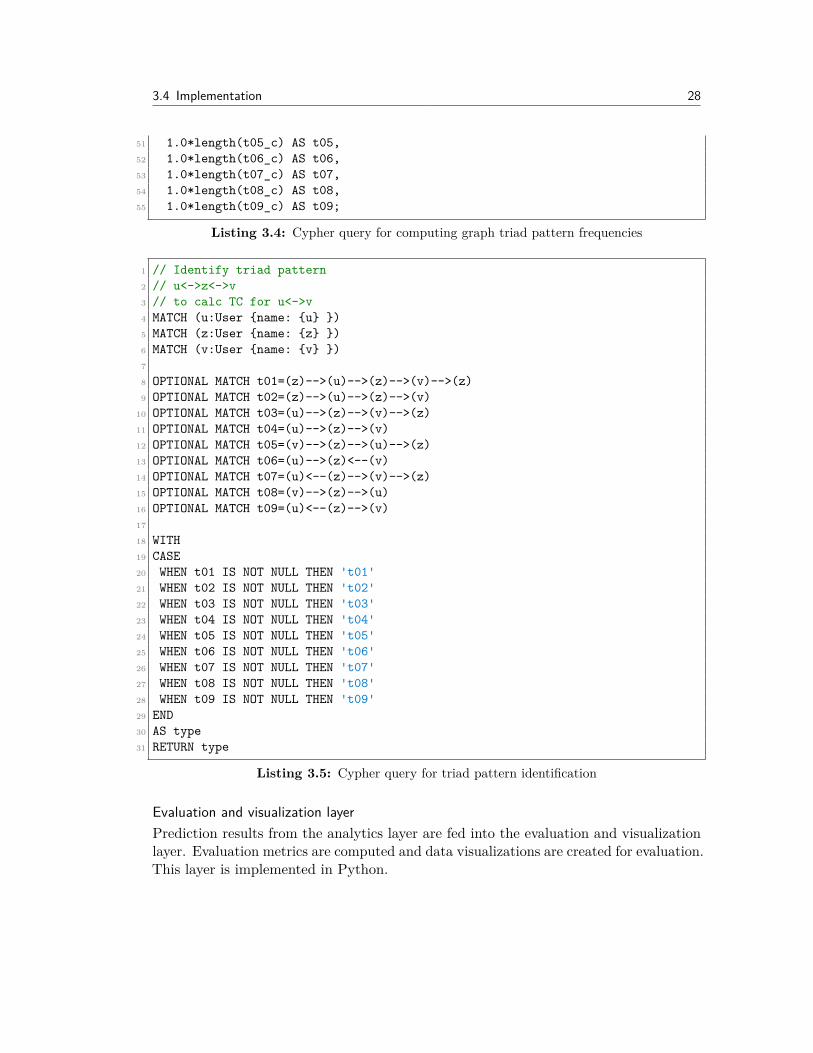
Listing 3.4: Cypher query for computing graph triad pattern frequencies
1 // Identify triad pattern2 // u<->z<->v3 // to calc TC for u<->v4 MATCH (u:User {name: {u} })5 MATCH (z:User {name: {z} })6 MATCH (v:User {name: {v} })7
8 OPTIONAL MATCH t01=(z)-->(u)-->(z)-->(v)-->(z)9 OPTIONAL MATCH t02=(z)-->(u)-->(z)-->(v)
10 OPTIONAL MATCH t03=(u)-->(z)-->(v)-->(z)11 OPTIONAL MATCH t04=(u)-->(z)-->(v)12 OPTIONAL MATCH t05=(v)-->(z)-->(u)-->(z)13 OPTIONAL MATCH t06=(u)-->(z)<--(v)14 OPTIONAL MATCH t07=(u)<--(z)-->(v)-->(z)15 OPTIONAL MATCH t08=(v)-->(z)-->(u)16 OPTIONAL MATCH t09=(u)<--(z)-->(v)17
18 WITH19 CASE20 WHEN t01 IS NOT NULL THEN �t01�21 WHEN t02 IS NOT NULL THEN �t02�22 WHEN t03 IS NOT NULL THEN �t03�23 WHEN t04 IS NOT NULL THEN �t04�24 WHEN t05 IS NOT NULL THEN �t05�25 WHEN t06 IS NOT NULL THEN �t06�26 WHEN t07 IS NOT NULL THEN �t07�27 WHEN t08 IS NOT NULL THEN �t08�28 WHEN t09 IS NOT NULL THEN �t09�29 END30 AS type31 RETURN type
Listing 3.5: Cypher query for triad pattern identification
Evaluation and visualization layerPrediction results from the analytics layer are fed into the evaluation and visualizationlayer. Evaluation metrics are computed and data visualizations are created for evaluation.This layer is implemented in Python.

CHAPTER 4Evaluation
The result of the algorithm is a set of user IDs that are predicted destination nodes,given a specific source node. These are recommended users that the specified user mightbe interested in following.
4.1 Evaluation MetricsEach method described above in Chapter 3 is evaluated using the same evaluationmetrics for comparison. They are as follows.
4.1.1 PrecisionIn this context, precision is defined as the number of relevant links predicted dividedby the total number of link predicted. A link is said to be relevant if it is one of theexisting but removed links.
4.1.2 HitRatio@N (Recall)The other evaluation metric we will use is the HitRatio@N, where N is the number ofpredicted links for a given user (at one iteration of the validation). This metric is definedas the number of users for which at least one correct link was predicted, divided by thetotal number of users for which predictions were generated.
4.1.3 EvaluationThe system is evaluated using 200 iterations for validation with di�erent configurationsfor N , where N is the number of predicted links generated for each user sampled. Ateach validation run a user is selected at random (cross-validation is used to avoid astatistical bias from users being selected multiple times). Tables 4.1 and 4.2 summarizethe results. We can see that all three methods perform much better than the randomselection baseline. Jaccard similarity does not perform as well as triadic closeness, whichis expected based on the results presented in [Sch14]. Our adaptive ensemble methodhowever, does not perform any better than the triadic closeness method and for someconfigurations performs more poorly than triadic closeness.
29

4.1 Evaluation Metrics 30
Table 4.1: HitRatio@N (%) results for Jaccard similarity (JS), Triadic Closeness (TC)and adaptive ensemble (AE) methods. Random probability is shown for comparison.
N JS (%) TC (%) AE (%) Random (%)5 5.51 5.84 10.24 5.738 ◊ 10≠4
10 6.87 12.71 10.15 1.1476 ◊ 10≠3
20 5.83 11.70 6.84 2.2952 ◊ 10≠3
40 4.90 14.41 11.43 4.5904 ◊ 10≠3
50 8.82 9.09 8.11 5.738 ◊ 10≠3
75 4.49 11.54 13.52 8.607 ◊ 10≠3
100 9.47 12.00 7.37 1.14 ◊ 10≠2
250 8.86 10.71 8.33 2.869 ◊ 10≠2
500 12.86 22.86 12.70 5.738 ◊ 10≠2
Table 4.2: Precision (%) results for Jaccard similarity, Triadic Closeness and adaptiveensemble methods.
N JS TC AE5 1.178 ◊ 10≠2 1.2084 ◊ 10≠2 2.113 ◊ 10≠2
10 7.43 ◊ 10≠3 1.346 ◊ 10≠2 1.092 ◊ 10≠2
20 3.16 ◊ 10≠3 6.232 29 ◊ 10≠3 3.6363 ◊ 10≠3
40 1.366 ◊ 10≠3 3.9206 ◊ 10≠3 3.2867 ◊ 10≠3
50 2.046 ◊ 10≠3 2.2596 ◊ 10≠3 1.905 97 ◊ 10≠3
75 6.97 ◊ 10≠4 1.757 21 ◊ 10≠3 2.0024 ◊ 10≠3
100 1.152 ◊ 10≠3 1.405 81 ◊ 10≠3 7.989 ◊ 10≠4
250 4.329 ◊ 10≠4 5.798 ◊ 10≠4 4.1694 ◊ 10≠4
500 3.856 ◊ 10≠4 5.874 ◊ 10≠4 3.608 ◊ 10≠4

4.1 Evaluation Metrics 31
(a) Plot of precision results. (b) Violin plot of precision results.
Figure 4.1: Plots comparing precision results for Jaccard similarity, triad closeness andadaptive ensemble methods.
(a) Plot of HitRatio@N results. (b) Violin plot of HitRatio@N results.
Figure 4.2: Plots of HitRatio@N results for Jaccard similarity, triadic closeness andadaptive ensemble methods.
CHAPTER 5Summary and Outlook
This paper has explored the link prediction problem as applied to complex networks.An adaptive hybrid method is developed and evaluated against data from the GitHubnetwork. We find that Jaccard similarity performs much better than the randombenchmark and that Triadic Closeness performs better than Jaccard similarity. Theadaptive hybrid method developed here performs no better than triadic closeness, andin some cases performs worse.
The relatively poor performance of the adaptive hybrid model could potentially beimproved by adding a normalization process to the weights of each component andby adding additional components. Due to the structure of the network data used, thenumber of relationships observed for each type of relationship (follows and stars) aredisproportional. There are approximately ten times as many stars relationships inthe data set as follows relationships. This skew should be taken into account with anormalization process to avoid one component of the hybrid model skewing the metric.Finally, additional components could be added to the hybrid model to improve accuracy.
5.1 Further researchThe GitHub network provides a rich data set for analysis. More data from this networkshould be included in the data model for the adaptive hybrid method. This couldperhaps improve performance, but also link prediction for other edge types should beexplored.
The methods presented here should be extended to other datasets. Online socialcollaboration networks such as AngelList and CrunchBase provide open API accessand data exports for research. These networks provide a rich dataset with data aboutthe founding of startup companies, employment and venture funding for startups. Theapplication of the methods presented here could allow for predictions about who willleave their current jobs to found startups and who will fund them. In fact, data analystsare already exploring these type of predictions [mattermark].
The system implemented for this paper was designed to be as scalable as possible,making the assumption that a single machine would be used for analysis (instead of a
32

5.1 Further research 33
distributed cluster). This design consideration severely limited the performance of sucha system. While it was possible to complete the analysis using the system as designed,for larger datasets a distributed graph processing engine such as SparkX [sparkx] orthe more recently developed techniques of on-disk processing which take advantage ofperformant solid state drives, such as GraphChi [graphChi] should be considered.

Bibliography
[Gita] url: http://www.githubarchive.org/ (cit. on p. 20).
[Gitb] url: https://developer.github.com/v3/activity/events/types/ (cit.on p. 20).
[Agg11] Charu C. Aggarwal: Social Network Data Analytics. London: Springer,2011.
[Aie12] Luca Maria Aiello, Alain Barrat, Rossano Schifanella, Ciro Cat-tuto, Benjamin Markines, and Filippo Menczer: ‘Friendship predictionand homophily in social media’. InACM Transactions on the Web (May 2012),vol. 6(2): pp. 1–33.
[Brz09] Michael J Brzozowski and Daniel M Romero: ‘Who Should I Follow ?Recommending People in Directed Social Networks ’. InProceedings of the FifthInternational AAAI Conference on Weblogs and Social Media. Brzozowski.Associate for the Advancement of Artificial Intelligence, 2009: pp. 458–461.
[Can08] Laurent Candillier and Frank Meyer: ‘Designing Specific WeightedSimilarity Measures to Improve Collaborative Filtering Systems’. InAdvancesin Data Mining. Medical Applications, E-Commerce, Marketing, and Theoret-ical Aspects Lecture Notes in Computer Science (2008), vol. 5077: pp. 242–255(cit. on pp. 6, 17).
[Che] Charalampos Chelmis, Viktor K Prasanna, and Southern Cali-fornia: ‘Social Link Prediction in Online Social Tagging Systems’. InACMTransactions on Information Systems (), vol. V(212): pp. 1–27.
[Chi] Nitin Chiluka, Nazareno Andrade, and Johan Pouwelse: ‘A LinkPrediction Approach to Recommendations in Large-Scale User-GeneratedContent Systems’. In (), vol.
[Dav11] Darcy Davis, Ryan Lichtenwalter, and Nitesh V. Chawla: ‘Multi-relational Link Prediction in Heterogeneous Information Networks’. In2011International Conference on Advances in Social Networks Analysis and Mining(July 2011), vol.: pp. 281–288.
34

Bibliography 35
[Du10] Nan Du, Hao Wang, and Christos Faloutsos: ‘Analysis of Large Multi-modal Social Networks : Patterns and a Generator’. InMachine Learning andKnowledge Discovery in Databases Lecture Notes in Computer Science (2010),vol. 6321: pp. 1–16.
[Faw06] Tom Fawcett: ‘An introduction to ROC analysis’. InPattern RecognitionLetters (June 2006), vol. 27(8): pp. 861–874.
[Lem01] R Lempel and S Moran: ‘SALSA: The Stochastic Approach for Link-Structure Analysis’. InACM Transactions on Information Systems (2001), vol.19(2): pp. 131–160 (cit. on p. 5).
[LN07] David Liben-Nowell and Jon Kleinberg: ‘The Link-Prediction Problemfor Social Networks’. InJournal of the American Society For InformationScience and Technology (2007), vol. 58(7): pp. 1019–1031 (cit. on pp. 3, 5).
[Lic10] Ryan N Lichtenwalter, Jake T Lussier, and Nitesh V Chawla: ‘NewPerspectives and Methods in Link Prediction’. InKDD 2010. ACM, 2010:pp. 243–252.
[Lin13] Jimmy Lin and Dmitriy Ryaboy: ‘Scaling Big Data Mining Infrastructure :The Twitter Experience’. InSIGKDD Explorations (2013), vol. 14(2): pp. 6–19.
[Lu10] Linyuan Lu and Tao Zhou: ‘Link Prediction in Complex Networks: ASurvey’. InarXiv:1010.0725v1 (2010), vol. (cit. on pp. 4, 6).
[L09] Linyuan Lü and Tao Zhou: ‘Role of weak ties in link prediction of complexnetworks’. InProceeding of the 1st ACM international workshop on Complexnetworks meet information & knowledge management - CNIKM ’09 (2009),vol.: p. 55.
[Pan13] Reza Zadeh Pankaj Gupta, Ashish Goel, Jimmy Lin, Aneesh Sharma,DongWang: ‘WTF: The Who to Follow Service at Twitter’. InInternationalWorld Wide Web Conference Committee. 2013 (cit. on pp. 1, 3, 5).
[Ric11] Franceso Ricci, Lior Rokach, Bracha Shapira, and Paul B. Kantor:Recommender Systems Handbook. London: Springer, 2011 (cit. on pp. 4, 5, 8).
[Rod09] Marko A Rodriguez, David W Allen, Joshua Shinavier, and GaryEbersole: ‘A Recommender System to Support the Scholarly CommunicationProcess’. InarXiv preprint (2009), vol. arXiv 0905.1594v1.
[Rod10] Marko A Rodriguez and Peter Neubauer: ‘The Graph Traversal Pattern’.InarXiv preprint (2010), vol. arXiv:1004.1001v1: pp. 1–18 (cit. on p. 5).
[Sch14] Daniel Schall: ‘Link prediction in directed social networks’. InSocial Net-work Analysis and Mining (Feb. 2014), vol. 4(1): p. 157 (cit. on pp. 6, 8, 10,11, 29).
[Ste10] Maarten van Steen: Graph Theory and Complex Networks: An Introduction.2010 (cit. on pp. 1, 7, 10).

Bibliography 36
[Sym11] Panagiotis Symeonidis, Eleftherios Tiakas, and Yannis Manolopou-los: ‘Product recommendation and rating prediction based on multi-modalsocial networks’. InProceedings of the fifth ACM conference on Recommendersystems - RecSys ’11 (2011), vol.: p. 61.
[Pag] ‘The PageRank Citation Ranking: Bringing Order to the Web’. In (1998),vol.: pp. 1–17 (cit. on pp. 5, 22).
[Wan] Xi Wang and Gita Sukthankar: Link Prediction in Heterogeneous Collab-oration Networks.
[Xin13] Reynold S Xin, Joseph E Gonzalez, Michael J Franklin, Ion Stoica,and U C Berkeley: ‘GraphX : A Resilient Distributed Graph System onSpark’. In. 2013.

List of Figures
2.1 Item Link Prediction . . . . . . . . . . . . . . . . . . . . . . . . . . . . . 4
3.1 Sample multi-modal network . . . . . . . . . . . . . . . . . . . . . . . . . 83.2 Triad example . . . . . . . . . . . . . . . . . . . . . . . . . . . . . . . . . 113.3 triad patterns . . . . . . . . . . . . . . . . . . . . . . . . . . . . . . . . . 123.4 closed triad patterns . . . . . . . . . . . . . . . . . . . . . . . . . . . . . . 123.5 GitHub graph data model . . . . . . . . . . . . . . . . . . . . . . . . . . . 183.6 GitHub data model as a property graph. Screenshot from Neo4j graph
database interface. . . . . . . . . . . . . . . . . . . . . . . . . . . . . . . . 193.7 User-User data model . . . . . . . . . . . . . . . . . . . . . . . . . . . . . 203.8 Link prediction system architecture . . . . . . . . . . . . . . . . . . . . . 25
4.1 Plots comparing precision results for Jaccard similarity, triad closenessand adaptive ensemble methods. . . . . . . . . . . . . . . . . . . . . . . . 31
4.2 Plots of HitRatio@N results for Jaccard similarity, triadic closeness andadaptive ensemble methods. . . . . . . . . . . . . . . . . . . . . . . . . . 31
37

List of Tables
2.1 Common similarity metrics. . . . . . . . . . . . . . . . . . . . . . . . . . . 4
3.1 Open triad pattern frequency in the sample network. This frequencies areused to compute Triadic Closeness. . . . . . . . . . . . . . . . . . . . . . . 14
3.2 Closed triad pattern frequency in the sample network. . . . . . . . . . . . 143.3 GitHub network descriptive statistics . . . . . . . . . . . . . . . . . . . . 223.4 PageRank for User-User follows . . . . . . . . . . . . . . . . . . . . . . . 233.5 PageRank for User-Repository stars . . . . . . . . . . . . . . . . . . . . . 24
4.1 Evaluation Results - HitRatio@N . . . . . . . . . . . . . . . . . . . . . . 304.2 Evaluation results - Precision . . . . . . . . . . . . . . . . . . . . . . . . . 30
38

Listings
3.1 JSON document example of data point - Follow event . . . . . . . . . . . 203.2 JSON document example of data point - Watch Event . . . . . . . . . . . 213.3 Cypher query for computing Jaccard similarity . . . . . . . . . . . . . . . 263.4 Cypher query for computing graph triad pattern frequencies . . . . . . . 263.5 Cypher query for triad pattern identification . . . . . . . . . . . . . . . . 28
39