Embed Size (px)
Citation preview

AN ABSTRACT OF THE DISSERTATION OF
Kathleen Guillozet for the degree of Doctor of Philosophy in Forest Resources
presented on August 8, 2011.
Title: Livelihoods and Land Use Change in Highland Ethiopia
Abstract approved:
________________________________________________________________ John C. Bliss
Abstract:
This dissertation investigates livelihood and land use change dynamics in a
community at the farm-forest periphery in highland Ethiopia. I use interviews and
livelihood assessment data to compare the strategies used by members of different
wealth groups to negotiate and maintain access to forest resources, and integrate
socioeconomic, bio-physical and spatially explicit data to examine changing land use
and household vulnerability. This approach sheds new light on scalar aspects of
poverty-environment relationships with implications for environmental justice and
rural development policy.
Chapter one provides an overview of the context and approach to this research.
Chapter two illustrates the importance of scale in understanding household
vulnerability. It uses diverse data to describe political, historic, biophysical and
economic factors that shape vulnerability. Chapter three describes household
livelihoods and increasing foreign investment pressure in Ethiopia’s natural forests,
with an emphasis on the history of forest management and access in the study site. It
describes processes of forest boundary making and conflict in the study area.
Chapter four outlines two scenarios to describe the amount of agricultural land
required to replace forest incomes in the community under study. These scenarios,
termed “fuelwood replacement” and “fuelwood replacement with agricultural
intensification,” use agricultural land as a proxy for fuelwood incomes, retaining the
connection to physical space that is inherent to natural resources, rather than
presenting abstracted monetary values that disassociate resources from power and
access dynamics. Chapter five draws together unifying ideas, outlines policy
recommendations and describes areas for future research.
©Copyright by Kathleen Guillozet
August 8, 2011
All Rights Reserved
Livelihoods and Land Use Change in Highland Ethiopia
by
Kathleen Guillozet
A DISSERTATION
submitted to
Oregon State University
in partial fulfillment of
the requirements for the
degree of
Doctor of Philosophy
Presented August 8, 2011
Commencement June 2012
Doctor of Philosophy dissertation of Kathleen Guillozet presented on August 8, 2011.
APPROVED:
_____________________________________________________________________ Major Professor, representing Forest Resources
_____________________________________________________________________ Head of the Department of Forest Engineering and Resource Management
_____________________________________________________________________ Dean of the Graduate School
I understand that my dissertation will become part of the permanent collection of
Oregon State University libraries. My signature below authorizes release of my
dissertation to any reader upon request.
_____________________________________________________________________
Kathleen Guillozet, Author
ACKNOWLEDGEMENTS
I thank my husband Peter for his encouragement, assistance, companionship and
advice through every phase of this work. I am grateful to my family for their constant
support and enthusiasm. Thanks to friends who offered welcome breaks over the
past four years, especially to Janet and Steve for their incredible generosity when a
short stopover became a long one.
I thank my advisor John Bliss for his incredible mentorship. His wisdom, humor and
patience made my work enjoyable from start to finish. I learned so much in the last
four years, most through John’s teaching. I am grateful to Sunil Khanna for sharing his
insights on household research and for his generous assistance with household
surveys and statistics. I thank Larry Becker for his advice concerning field research
and for the great discussions on decentralization and farm forest livelihoods. I hope
to continue this work. I thank Badege Bishaw for facilitating contacts with the Wondo
Genet College of Forestry. Thanks to Stella Coakley, who was a wonderful Graduate
Representative through the first stages of my degree, and to Courtland Smith who
took over during my defense. Sincere thanks to Oregon State University faculty who
developed and taught the many excellent courses that I took during my studies and
who offered advice that helped shape my research. In particular, I thank Jo Albers,
Temesgen Hailemaraim, Dave Hibbs, Mike Newton, Robin Rose and Mark Wilson. I
also thank the social theory club: Erin Kelly, Jesse Abrams, Sera Janson and Lauren
Redmore, for pushing the boundaries of my thinking and my sense of humor.
I am forever grateful to friends and colleagues in Ethiopia. I thank everyone at
Wondo Genet who welcomed me and Peter to Ethiopia, especially Dr. Melaku
Bekele. Thanks to Mamo Kebede for first bringing me to what would become my
research site and for offering invaluable advice during the early phases of my stay.
Many thanks to Mersha Gebrehiwot for the lovely meals and conversation and to
Tewodros Assefa for his friendship. Thanks to everyone at the Forest Enterprise,
especially Ato Didha Dirriba for his kindness. Special thanks everyone at the Forest
Enterprise office who endured my regular interruptions with grace and good humor. I
am indebted to Tiglu Seboka for his generosity of time, insight and assistance. Many
thanks to Gemmedi and Gose, who worked long days with me in the forest. Their
unending good humor made the hard walking much easier and I thank them for
sharing their knowledge and experience. Thanks to Shukuri who was the best
translator I could have hoped for. His kindness and patience made the work a
pleasure. Warm thanks to Misganu for his friendship and thoughtfulness. I am
grateful to the local community members who allowed me to interview them, and
also to the Kebele leaders and Ministry of Agriculture who welcomed me. I am
continuously awed by the strength and kindness of the people I met. I thank
everyone at the Gambo Hospital and Mission who were endlessly generous to me
and Peter, especially Abba Renzo and Abba Oscar. I thank the Sisters for the coffee
breaks and conversation and to all of the doctors and nurses for their laughter and
good work. Thanks to our wonderful neighbors Dalu and family, and to everyone who
offered us friendship during our stay. I look forward to seeing you again.
I am grateful for the funding that I received in support of my research and studies. I
sincerely thank the OUS-SYLFF Graduate Fellowship for International Research, the
Starker Program in Private and Family Forestry, the Land Deal Politics Initiative small
grants program, the US Department of Education’s Foreign Language Area Studies
Fellowship, the College of Forestry, the Richardson Fellowship, the Alfred and Vera
Meier Fellowship, the Mary McDonald Fellowship, the Walt A Gruette Fellowship, the
Alfred W Moltke Scholarship, the Oregon Lottery Scholarship and the Harris Lab.
CONTRIBUTION OF AUTHORS
Dr. John C Bliss contributed to the writing of all chapters.
TABLE OF CONTENTS
Page
Chapter 1 - General Introduction ................................................................................... 1
1.1 Livelihoods and Forests: The context for this study ..................................... 5
1.2 Dissertation Structure ................................................................................... 8
1.3 Study Design and Approach .......................................................................... 9
1.4 Site Selection and Community Introduction ............................................... 16
Chapter 2 - Understanding smallholder vulnerability through a multi-scalar perspective ................................................................................................................... 24
2.1 Introduction ................................................................................................ 25
2.2 Background ................................................................................................. 25
2.3 Approach ..................................................................................................... 29
2.4 Findings ....................................................................................................... 32
2.5 Discussion .................................................................................................... 56
Chapter 3 - Household Livelihoods and Increasing Foreign Investment Pressure in Ethiopia’s Natural Forests ............................................................................................ 59
3.1 Introduction ................................................................................................ 60
3.2 Processes driving forest investment in Ethiopia ......................................... 61
3.3 Communities at the Forest-Farm Interface ................................................ 68
3.4 Case Study Evidence .................................................................................... 71
3.5 Community Forest Benefits and the Potential for Conflict ......................... 85
3.6 Discussion .................................................................................................... 91
TABLE OF CONTENTS (continued)
Page
Chapter 4 - Land Use, Livelihoods and Deforestation: Connecting Case Study Evidence to Global Narratives ...................................................................................... 94
4.1 Introduction ................................................................................................ 95
4.2 Background ................................................................................................. 98
4.3 Case Study Evidence .................................................................................. 101
4.4 Discussion .................................................................................................. 118
4.5 Conclusion ................................................................................................. 122
Chapter 5 - Conclusion ............................................................................................... 124
5.1 Unifying Concepts ..................................................................................... 126
5.2 Policy Recommendations .......................................................................... 127
5.3 Future Research ........................................................................................ 131
BIBLIOGRAPHY............................................................................................................ 134
APPENDICES ................................................................................................................ 148
Appendix A: Supplemental Interview Information ......................................... 149
Appendix B: Household Livelihoods Survey Instrument ................................. 152
Appendix C: Forest Measurement Protocols .................................................. 167
Appendix D: Species List, 2010 Arsi Forest Plots ............................................ 172
Appendix E: Crop Production and Pricing Figures .......................................... 173
LIST OF FIGURES
Figure # Page
1.1 Lefebvre's True Space and Truth of Space in the Context of Power and Political Economic Realities (with focal areas in solid black circles) .................................. 12
2.1 Focal areas and scalar levels of analysis ............................................................... 31
2.2 Land use change within a 141,976 hectare forest area, 1976-present ................ 39
2.3 Change in number of trees per hectare among three diameter classes in five plant communities (1969 and 2010) .................................................................... 42
2.4 Class 1 and 2 stand basal area (SBA), by species, Podocarpus forest (1969 and 2010) and diameter class distributions ................................................................ 43
2.5 Household Incomes and Expenditures by Wealth Group ..................................... 55 3.1 Land use change within a 141,976 hectare forest area, 1976-present ................ 74
3.2 Government entities involved in forest regulation enforcement, Arsi Forest ..... 81
4.1 Mean Maize Prices in Ethiopian Birr (ETB) in the Arsi Region (January 2009-January 2010) ..................................................................................................... 110
4.2 Land Use by Area, Farmland by Wealth Group; Source: Field Data .................. 112
4.3 Farmland Requirements under Fuelwood Replacement Scenarios .................. 117
LIST OF TABLES
Table # Page
2.1 Livelihood Characteristics 1970-present ............................................................... 35
2.2 Plant Communities and Elevation Ranges Identified in 1969 ............................... 40
2.3 Household Characteristics by Wealth Group at the Study Site in 2009-2010 and and in the Arsi Bale Wheat Livelihood Zone (ABW LZ) in 2006-2007 .................. 51
2.4 Household Expenditures* by Wealth Group at the Study Site in 2009-2010 and in the Arsi Bale Wheat Livelihood Zone (ABW LZ) in 2006-2007. ........................ 52
2.5 Vulnerability focal areas and scales ...................................................................... 57
3.1 Challenges to forest management and investment in Ethiopia ........................... 66
3.2 Natural Forest Working Circles in Study Site (1990) ............................................. 75
3.3 Extent (ha) and Value (£) of Forest Enterprise Landholdings, 2010 ..................... 76
3.4 Forest regulations and governing bodies in Arsi Forest, 1930-present ................ 78
3.5 Selected Benefits, Beneficiaries and Effects, 1880s-2010 .................................... 83
3.6 Effects of new tenures on forest benefits, 1940-present ..................................... 84
3.7 Attributes by Wealth Ranking in Study Site, 2010 ................................................ 86
4.1 Agricultural practices, income sources and constraints to production modified from USAID FEWS in the ABW Livelihood Zone ................................................. 103
4.2 Population by Household (HH) Wealth Group and Landholdings ...................... 107
4.3 Land Uses within Village Boundaries .................................................................. 112
4.4 Production assumptions for Scenarios ............................................................... 115
4.5 Estimated Hectares Required to Replace Fuelwood Incomes ............................ 126
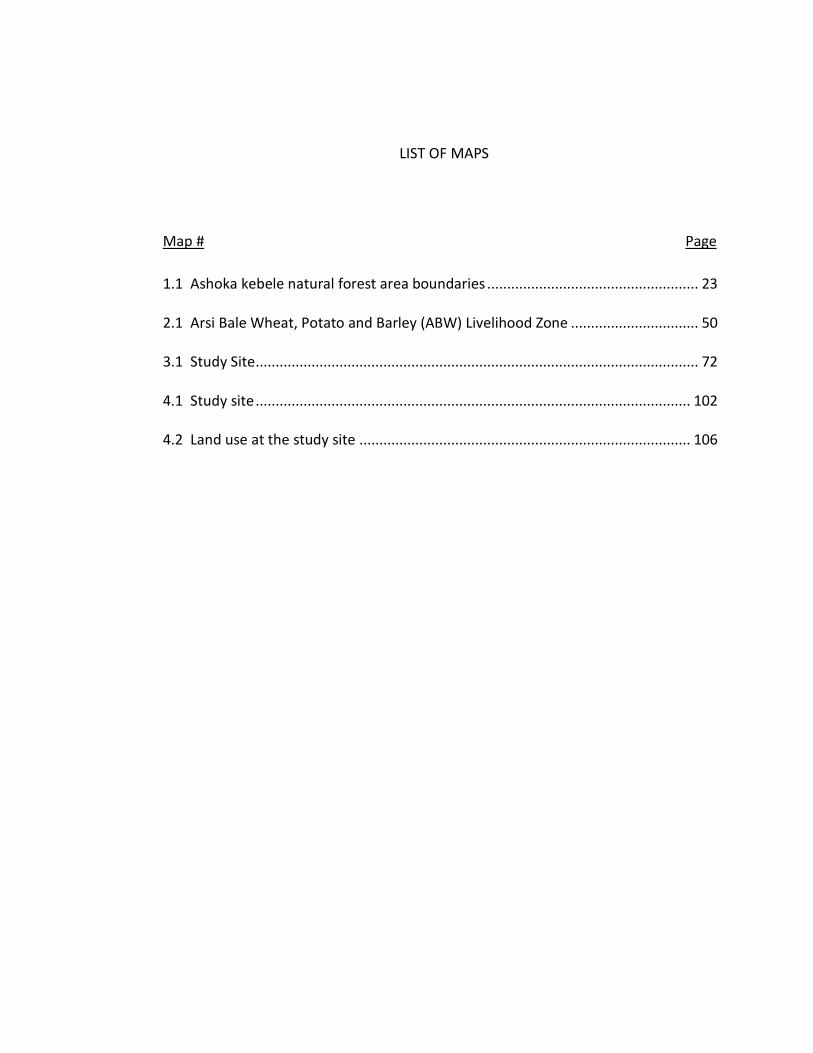
LIST OF MAPS
Map # Page
1.1 Ashoka kebele natural forest area boundaries ..................................................... 23
2.1 Arsi Bale Wheat, Potato and Barley (ABW) Livelihood Zone ................................ 50
3.1 Study Site ............................................................................................................... 72
4.1 Study site ............................................................................................................. 102
4.2 Land use at the study site ................................................................................... 106
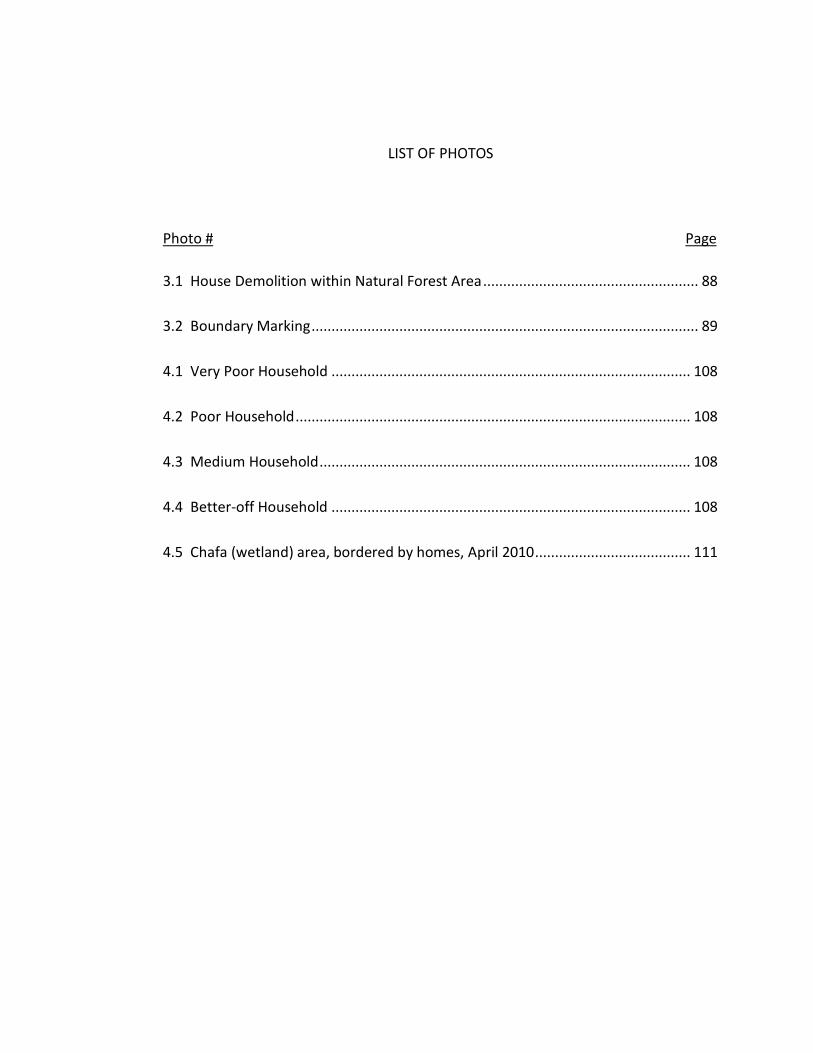
LIST OF PHOTOS
Photo # Page
3.1 House Demolition within Natural Forest Area ...................................................... 88
3.2 Boundary Marking ................................................................................................. 89
4.1 Very Poor Household .......................................................................................... 108
4.2 Poor Household ................................................................................................... 108
4.3 Medium Household ............................................................................................. 108
4.4 Better-off Household .......................................................................................... 108
4.5 Chafa (wetland) area, bordered by homes, April 2010....................................... 111
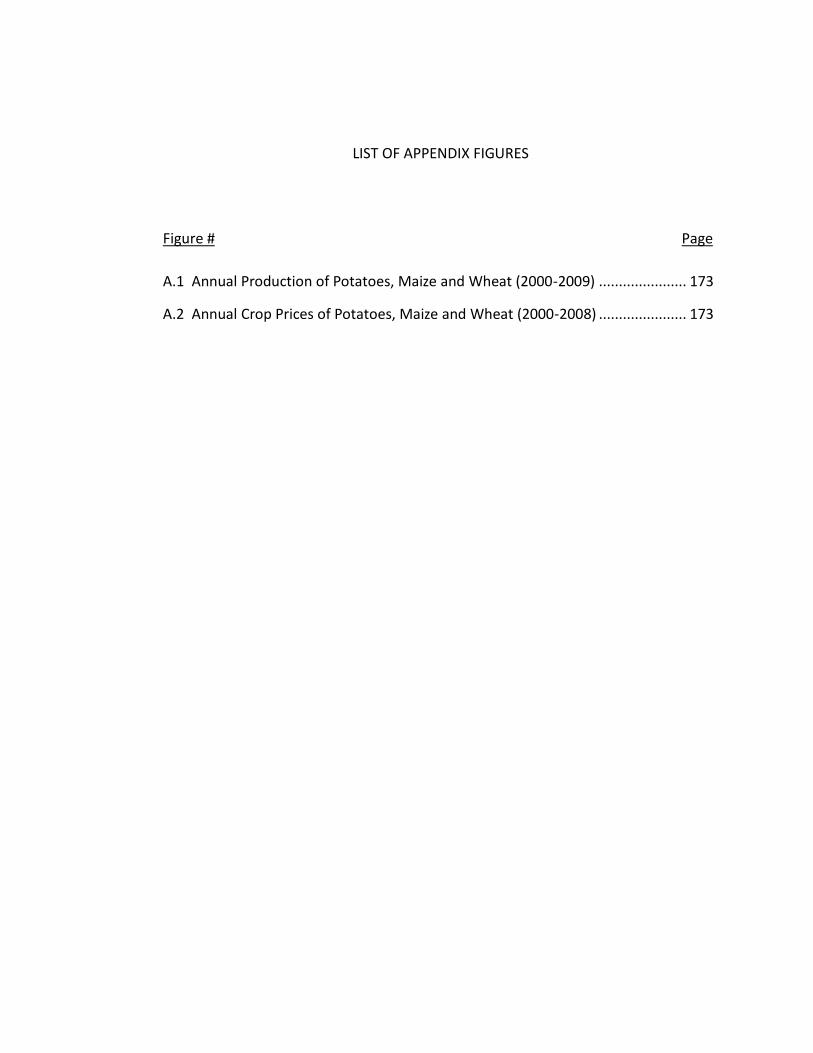
LIST OF APPENDIX FIGURES
Figure # Page
A.1 Annual Production of Potatoes, Maize and Wheat (2000-2009) ...................... 173
A.2 Annual Crop Prices of Potatoes, Maize and Wheat (2000-2008) ...................... 173
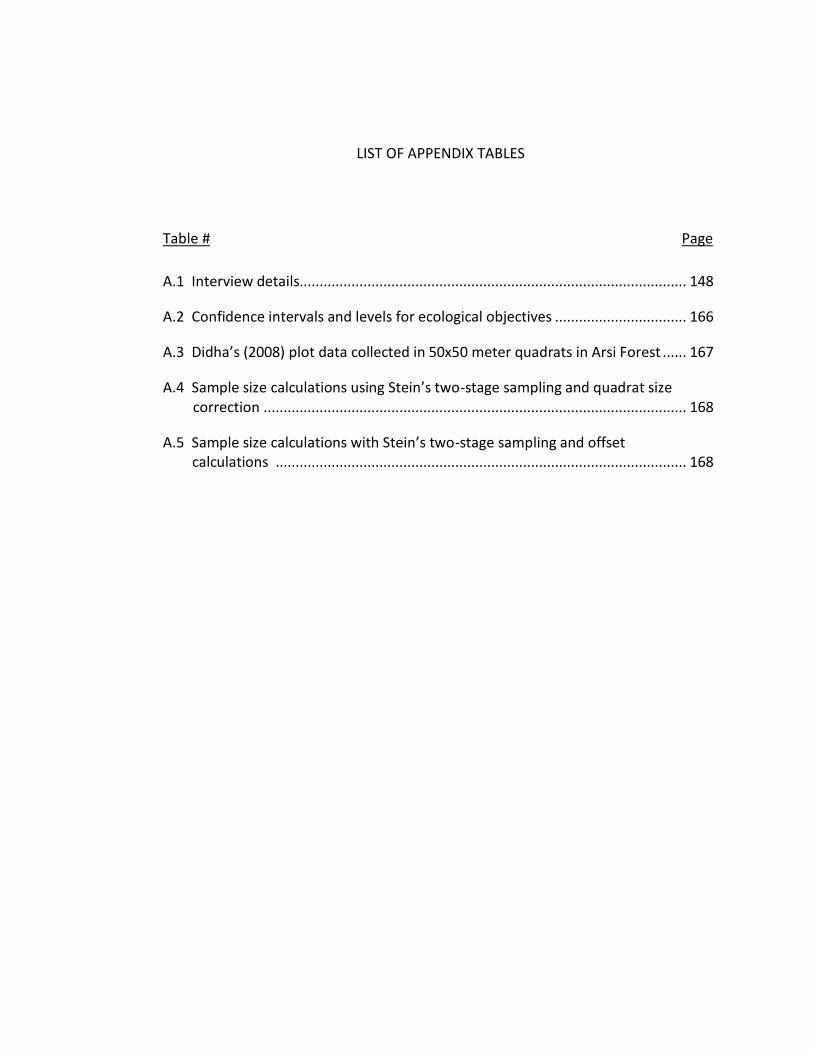
LIST OF APPENDIX TABLES
Table # Page
A.1 Interview details................................................................................................. 148
A.2 Confidence intervals and levels for ecological objectives ................................. 166
A.3 Didha’s (2008) plot data collected in 50x50 meter quadrats in Arsi Forest ...... 167
A.4 Sample size calculations using Stein’s two-stage sampling and quadrat size correction .......................................................................................................... 168
A.5 Sample size calculations with Stein’s two-stage sampling and offset calculations ....................................................................................................... 168
Livelihoods and Land Use Change in Highland Ethiopia
Chapter 1 - General Introduction
As forests change in size and composition, and as markets develop to exploit them in
new ways, communities whose livelihoods are integrated with forests transform in
response to shifting ecological, economic and policy landscapes. This dissertation
addresses two broad themes pertaining to livelihoods and land use change in a rural
community located at the forest periphery in highland Ethiopia. First, it investigates
the ways in which forest benefits are defined and distributed in a specific case. This
includes an emphasis on how ecological, social and political factors interact to shape
outcomes. It also includes attention to the changing nature of forest values over
time, as new forms of social and economic significance are ascribed to forests, and
new mechanisms are developed to make use of them. Second, it examines the
interplay between household vulnerability and forest access. Within communities,
households have unique capabilities and entitlements, based in part on
characteristics like gender and clan affiliation, and tend to rely upon forest-based
incomes in different ways. Contemporary policy approaches to forest management in
the global South are aimed at stemming both forest loss and human poverty, but are
typically formulated in the absence of thorough place-specific understandings of the
processes that underpin forest access.
This dissertation is based upon field research conducted from September 2009 to
May 2010 in a highland Oromo farming community comprised of approximately 7000
people. The community bordered a government-run plantation forestry operation
and a government-managed natural forest area that is part of a larger forest complex
known as the Arsi Forest. Plantation products served urban markets and local
livelihoods centered upon semi-subsistence farming, fuelwood sale and daily labor.
2
The community under study is located within close proximity (18 kilometers) to a
major fuelwood market that served largely urban and semi-urban consumers.
The three manuscripts presented in this dissertation illuminate livelihood-related
implications of forest access for local households. While evidence suggests that
vulnerability is the outcome of processes and policies created at local, regional,
national and international scales, interventions tend to focus on the household and
community scales. Chapter two addresses this deficiency by providing a multi scalar
approach to understanding household vulnerability. While it is difficult to 1) calculate
the degree to which forests contribute to local livelihoods and 2) understand how
forest benefits are distributed among community members, it is generally believed
that the economic contribution that forests make to rural livelihoods is
underestimated (Angelsen et al. 2011). This underestimation fuels a range of
emerging approaches to forest management that I investigate in chapters three and
four, including foreign investment and ecosystem service payment programs like
REDD+. Foreign investment in forests in places like Ethiopia is often touted in the
name of economic development, and yet economic benefits for local people are
highly uncertain (Li 2011; Daniel and Mittal 2010). The enumeration of the incomes
that ‘hidden harvests’ bring to local communities is important from a policy
perspective as different actors attempt to pencil out whether programs like REDD+
make financial sense. Ideally, the costs associated with needed livelihood and
conservation investments will be less than or equal to carbon payments. Fischer et al.
(2011) calculate implementation and opportunity costs associated with reducing
deforestation and forest degradation in a Tanzanian case. They find that
implementation costs exceed opportunity costs at current levels of agricultural
productivity but that under agricultural intensification (the doubling of agricultural
yields and increased adoption of fuel-efficient stoves) implementation is competitive.
The authors assert that:
3
[T]hose [REDD+ projects] that directly target the local drivers of deforestation will be far less prone to within-country and cross-border leakage, and hence will be more likely to lead to sustained emission reductions and hence greater carbon, biodiversity and social benefits (163).
This quote highlights a number of questionable claims common to REDD+ and
climate change discourses, including those surrounding: 1) deforestation drivers, 2)
leakage and 3) poverty. I present three sets of questions pointing to logical
inconsistencies that underpin these claims:
First, while poverty and encroachment are often listed as drivers of deforestation, a
careful examination of evidence suggests that this is a deeply flawed
characterization. Geist and Lambin’s (2002) analysis of proximate and underlying
causes of deforestation suggests that they are region-specific and “subject to
changing national – to global-scale economic opportunities and /or policies, as
mediated by local-scale institutional factors” (151). They propose the need for place-
specific investigations to identify appropriate approaches in each case. Evidence from
this case supports these calls.
Second, it is questionable whether the direct targeting of local drivers of
deforestation will make projects less prone to leakage. Local drivers might include
things like agricultural expansion and fuelwood demand, but these are linked to
changes associated with demographics and infrastructure, local, regional, national
and international markets (Shively and Pagiola 2004; DeFries et al. 2010; Cropper,
Griffiths, and Mani 1999; Ewers 2006; Lambin and Meyfroidt 2011) and a host of
other factors enumerated in Chapter 4. This research indicates that it is impossible to
meaningfully address deforestation without attention to multiple proximate and
underlying drivers.
4
Third, policymakers need to more critically engage with the question of what
constitutes a social benefit. The replacement of forest incomes with carbon incomes
and more efficient fuelwood stoves would likely do little, if anything, to alter local
conditions of poverty. This approach may make sense in light of larger-scale
ecological and economic goals, but does it qualify as a social benefit? What
opportunities do people have to pursue alternate livelihoods? What are their long
term aspirations for themselves and their children? Research also suggests that the
social costs of carbon are woefully underestimated. Valued at $21 per ton in 2010,
the actual social costs of carbon may be as high as nearly $900 per ton in 2010
(Ackerman and Stanton 2011).
Local social relations indicate that the formalization of payments would likely lead to
the exclusion of marginalized people such as female household heads. The natural
forest is to some degree an “equalizer” in that people’s access to it is limited
primarily by their own labor in their use of fuelwood to supplement incomes. Thus,
the enumeration of forest incomes as part of REDD+ feasibility assessments may
make some sense from an accounting perspective, but it obscures a fundamental
dilemma in terms of program sustainability and social justice. Inherent to these
calculations are assumptions of static rural livelihoods in which conservation
payments replace forest incomes but do not address persistent poverty. These
concerns all relate, at least in part, to power. Green (2006) describes how the
emphasis on poverty as the problem and the locus of analysis diverts attention from
the social relations that produce power. Poverty is “relational as well as categorical”
and “is likely to deepen when people are trapped in arrangements that limit their
power, which the World Bank defines as their ‘capacity to make choice effective’”
(Moncrieffe 2004, 7-8).
5
In the next section I illustrate some of the complexities of the case by introducing
two composite characters: Amiina and Madiina.
1.1 Livelihoods and Forests: The context for this study
Amiina is the mother of four children, all under the age of seven. Now in her mid-
thirties, she became a widow three years ago when her husband died from injuries
sustained from a tree that fell on him in the nearby forest1. Amiina did not want to
follow custom and marry her husband’s brother Mustafa, deciding that she preferred
to remain on her own. Still, the 0.4 hectares that she and her husband once farmed
was transferred to Mustafa. She now sustains her family by collecting fuelwood from
the forest. About four times per week, she walks into the forest, processes and ties
together a large bundle of wood with leather straps that she then lashes to her back
and carries home. Sometimes her eldest daughter Kadijaa, now six years old,
accompanies her and carries her own bundle of wood that is about one quarter the
size of her mother’s. Amiina used to bring her fuelwood to Arsi Negele, a town some
18 kilometers to the west, but for the past eleven months since her donkey died she
sells her wood locally for about half the price. She earns about 320 birr, or 25 dollars
per month, enough to buy some maize, salt, peppers and a small amount of sugar
and coffee.
Amiina and her neighbor Madiina are originally from the same community, which is
located about 15 kilometers to the southwest. Oromo custom dictates that people
marry outside of their clan, with the wife coming into the community from the
outside. As my translator described, the clan “tells a person who he is.” He explained
that “when you travel to another place, first people will ask your name, then your
father’s name, then your clan and then your place”. Clan members “help and
1 This section represents fictional composite characters based on community members in very poor and medium-wealth households.
6
protect” each other. Madiina has nine children and is in her late forties. Her husband
plants maize (Zea mays) and potatoes (Solanum tuberosum) on their 0.75 hectares
and she cultivates enset (Ensete ventricosum), onions (Allium sp.), cabbage (Brassica
oleracea) and a few herbs in a small garden plot adjacent to her home. Her pre-teen
daughters collect fuelwood and water when they are not in school. Each week, they
collect once for household use and twice for sale. Madiina brings the wood to market
in Arsi Negele on her two donkeys. She uses part of the money for things like soap,
sugar, lentils and coffee, and she invests 50 birr per week in an informal savings
group she participates in with six other women. Every seventh week, Madiina
receives the rotating pot of 300 birr. She might save this money for future expenses
such as a new donkey, or buy goat that she will fatten and resell, or give some money
to her two children who are in high school in Arsi Negele.
Amiina and Madiina live in a community that borders one of the few remaining
highland forest areas in Ethiopia. A century ago, their 18 kilometer walk to Arsi
Negele would have been shaded by large Croton macrostachys and Podocarpus
falcatus trees, reaching 25 to 35 meters into the sky, respectively. Today, a few
scattered trees and small eucalyptus groves remain on what is now largely farmland.
The natural forest remains in the more steeply sloped areas to the south, ranging in
elevation from 2100 to 2700 meters above sea level. This natural forest is also
significantly changed from a century ago, due to selective harvesting of high value
species, human settlement, fire suppression and livestock grazing. Still, a forest
remains and the 1200 hectare portion of it used by Amiina and Madiina’s community,
along with at six other communities, holds opportunity.
Though still largely undefined, this opportunity is discussed by local resource
managers and may someday materialize in the form of ecotourism revenues, carbon
7
payments or payments for ecosystem services such as water. This dissertation
addresses the nature and implications of these opportunities for local livelihoods.
Perhaps due to its moral and practical appeal, integrating forest livelihoods with
conservation objectives to offset poverty and forest degradation has been an
enduring approach for development, conservation and governmental organizations.
Communities located at the farm-forest periphery are commonly portrayed as the
agents of deforestation. As such, they are targeted for interventions aimed at
relieving human pressures on forests, often by reducing access to or eliminating local
forests uses deemed inappropriate in exchange for alternative revenue streams.
Contemporary climate change and food security concerns add another layer of
complexity to this dynamic. Climate change threatens agricultural production but
also has led to the development of new funding mechanisms like REDD+ (Reducing
Emissions from Deforestation and Forest Degradation).
These dynamics complicate assumptions about relationships between livelihoods and
forest conservation. This research investigates the following questions:
1) How will emerging investments in forests affect rural household livelihoods?
2) How can multi-scalar approaches inform global debates on deforestation and rural livelihoods and contribute to pro-poor policy formation?
The above questions relate directly to the two overarching themes that tie together
this research in that they they investigate the complications associated with defining
forest benefits and their distribution and attempt to understand the interplay
between household vulnerability and forest access.
8
1.2 Dissertation Structure
This dissertation investigates livelihood and land use change dynamics in a
community at the farm-forest periphery in highland Ethiopia and then places them in
the context of theoretical discussions of power and access. I use interviews and
livelihood assessment data to compare the strategies used by members of different
wealth groups to negotiate and maintain access to forest resources, and integrate
socioeconomic, bio-physical and spatially explicit data to examine dynamics of
changing land use and household vulnerability. This approach sheds new light on
poverty-environment relationships with implications for rural development policy.
This research focuses on one smallholder farming community located at the
periphery of the Arsi Forest in highland Ethiopia. It draws upon a range of data to
illustrate and triangulate findings. These data include the following:
1. A household livelihood survey which describes household expenditure, income patterns and forest use among different wealth groups. 2. Interviews which describe experiences and perspectives of community members and resource managers. 3. Secondary data which provides context to land use change and social change. 4. Forest measurements that describe the structure and composition of the forest area. 5. Mapping data that situates resources and communities spatially and describes boundaries.
Chapter two describes household livelihoods and increasing foreign investment
pressure in Ethiopia’s natural forests, with an emphasis on the history of forest
management and access in the study site. It describes processes of forest boundary
making and conflict in the study area. Chapter three describes household livelihoods
in the context of climate change adaptation. It illustrates how scale can enhance or
9
limit conceptions of vulnerability. Chapter four presents two scenarios that describe
the amount of agricultural land required to replace forest incomes in order to depict
opportunities and constraints to different livelihood trajectories. Chapter five draws
together unifying ideas, outlines policy recommendations and describes areas of
future research.
1.3 Study Design and Approach
This research is structured as a single case with multiple embedded units of analysis
(Figure 1.1). The case serves as an example of what Stake (1995) terms an
“instrumental case study” in that the objective is to gain insight into a set of research
questions through the exploration of a specific case. The researcher works to
understand “complicated problems *located+ within situations and contexts” (Stake
1995, 133). To Stake, the issues themselves play a key role in helping the researcher
define the data sources and methods. In this case, the phenomenon under study is
household vulnerability in the context of changing forest access. It involves
examination of a household livelihoods and vulnerability in a community at the farm
forest periphery. I investigate the implications of emerging opportunities for forest-
based revenue generation that would also restrict forest access.
Given these interests, I focus on human relations, land use change and household
livelihood dynamics and also incorporate meso and macro scale data on neighboring
communities, regional infrastructure and markets, global change and politico-
economic factors, as appropriate. This research seeks to investigate human-
environment relationships in their real world context (Yin 2003) and shed light on
broader “demographic, cultural, and institutional factors as important variables in
the poverty environmental degradation nexus” (Duraiappah 1998, 2169). This
10
research focuses on specific “people in places” (351) to illustrate the impacts macro-
level structures on local people (Zussman 2004).
Case study research is often referred to as “progressively focused” (Stake 1995),
meaning that the organizing concepts are adapted and modified in the course of the
research. This research began with a focus on household livelihoods, natural forest
management and power relations. At a coarse-grained perspective, the issues at the
center of the research have remained the same. These include an interest in
questions concerning how different actors gain and maintain access to forest
resources, how environmental crisis narratives figure in the development and
management of forest resources and how history and policy shape current
circumstances and limit or enhance future opportunities. As the research progressed,
I also became interested in the idea of the forest itself as an actor that shapes and
responds to power and access dynamics. The individuals and institutions in the
community under study and beyond have conceptions of the forest, take actions that
alter its structure and composition. In so doing, they altered the productive capacity
of the forest on economic, cultural, ecological, spiritual and political levels, with
implications for their families, communities and the region as a whole. I grew more
interested in incorporating ideas of how a forest as a unique resource and how its
specific temporal patterns of change and growth affect political, economic and social
opportunities.
Though natural resources provide the raw materials for wealth creation, livelihoods
also shape the values associated with natural resources. I adopt McCusker and Carr’s
conception of the relationship between land use change and livelihoods, which
places them in a dialogue with one another instead of suggesting that one precedes
the other:
11
Rather than searching for cause/effect relationships, we point out that envisioning land use and livelihoods as coproduced has led us to a place where we begin to see how patterns in the landscape reflect not deeper “driving forces”, but complex relations of meaning and materiality that manifest themselves in these patterns. (McCusker and Carr 2006, 801)
This framing emphasizes both critical realist perspectives and political economy-new
regional geography orientations (e.g. Neumann 2001, 2010). It steers away from
overly rigid or prescriptive descriptions of how land use and livelihoods are
interrelated, focusing instead on more nuanced understandings.
This in turn led me to investigate the theorization of “space”, in particular the work
of Henri Lefebvre. Lefebvre describes how space exists on multiple levels: it
represents the physical place and resources that people use for daily living and also
the social-political realities that define livelihood opportunities and decision-making
authority (Lefebvre 1991). Space is defined and transformed by society through
capitalism and becomes charged by competing interests and social relations. Forests
in particular illustrate these multiple dimensions of space. Lefebvre argues that,
through the logics of capitalism, space becomes “homogeneous, rationalized, and as
such constraining; yet at the same time utterly dislocated” (97). On the one hand
forests provide those who live within and near them with a range of physical
products used for a range of basic living requirements such as homes, tools, energy
for cooking, food for people and livestock and medicines for treating illness. On the
other, forest products are a globally traded commodity and “forest” is an
internationally-recognized land use classification that determines eligibility for
funding mechanisms like the Clean Development Mechanism and REDD+. Forests are
spaces of interest for conservationists and capitalists, and with the advent of
ecosystem service markets the two appear to be merging (McKenzie 2009; Igoe and
Brockington 2007). Forests have proven to be malleable resources for wealth
12
generation, from non timber forest products to carbon sequestration. This
malleability is made possible by changing social constructions of value and meaning.
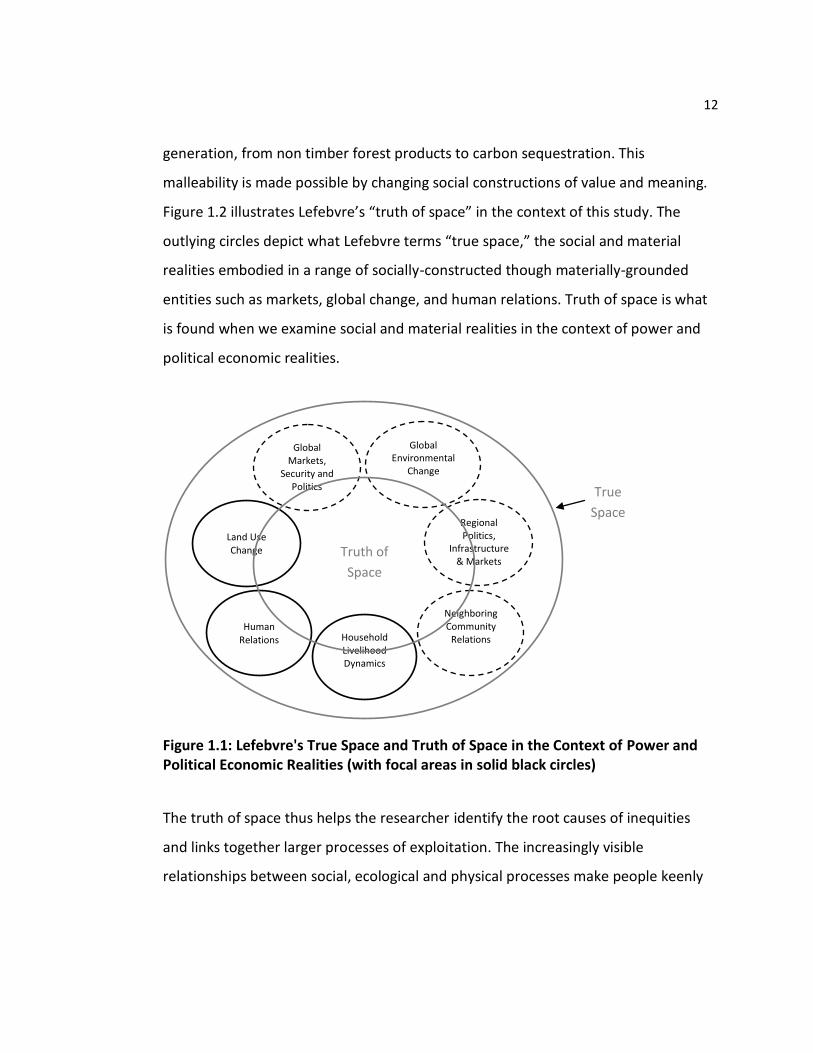
Figure 1.2 illustrates Lefebvre’s “truth of space” in the context of this study. The
outlying circles depict what Lefebvre terms “true space,” the social and material
realities embodied in a range of socially-constructed though materially-grounded
entities such as markets, global change, and human relations. Truth of space is what
is found when we examine social and material realities in the context of power and
political economic realities.
Figure 1.1: Lefebvre's True Space and Truth of Space in the Context of Power and Political Economic Realities (with focal areas in solid black circles)
The truth of space thus helps the researcher identify the root causes of inequities
and links together larger processes of exploitation. The increasingly visible
relationships between social, ecological and physical processes make people keenly
Global Environmental
Change
Global Markets,
Security and Politics
Human Relations
Neighboring Community
Relations Household Livelihood Dynamics
Land Use Change
Regional Politics,
Infrastructure & Markets
Truth of
Space
True
Space
13
aware of global connections as well as extremely localized phenomena (Leichenko
and O'Brien 2008).
This research draws together a number of disciplinary approaches, which is
appropriate to the investigation of complex problems and the desire to produce
results that are relevant to policy and practice (Hulme and Toye 2006; Borooah et al.
1994). This diversity of approaches also complements my theoretical grounding
because an interdisciplinary perspective can help unveil underlying social conditions
that construct and perpetuate inequitable resource management practices (Forsyth
2003) and shed light on management misconceptions (Turner, Lambin, and Reenberg
2007; Zimmerer 1994). Interdisciplinary approaches also reveal of how science and
policy co-produce one another (Keeley and Scoones 2003), a dynamic that can
further concentrate power among elite groups by promoting agendas that suit the
objectives of those in control (Jasanoff 2004).
My research questions, design and analysis are grounded in a political ecology
approach. Political ecology emphasizes power relations, examines uncertainty in
dominant discourses, and encourages historically and geographically-oriented
analysis. This helps the researcher identify the ways in which political economic
forces shape ecological realities and reinforce centralized control over resources and
decision-making (e.g. Dea and Scoones 2003; Gould, Schnaiberg, and Weinberg 1998;
Klooster 2006; McCarthy 2004). I find political ecology approaches compelling
because they draw upon multiple disciplines and methodologies, but also because
they commonly emphasize social justice concerns. Political ecology studies that
emphasize history address “how and why *society-nature+…relations have changed
(or not changed) over time and space, and the significance of those interpretations
for improving social justice and nature conservation” (Offen 2004, 21). Research in
Ethiopia suggests that crisis narratives may serve to conceal political factors that play
14
a significant role in human vulnerability and environmental degradation (Rahmato
1993; Hoben 1995; Keeley and Scoones 2003) making it an appropriate place for
political ecology research. Walker and Bulkeley (2006) describe how equity concerns
are necessary in the case of social-ecological questions that are so often dominated
by sustainability discourses: “Given that sustainable development provides the meta-
narrative for environmental concerns it is necessary to ask if the environmental
justice vocabulary and analytical lens adds anything useful to what is already in
place” (657).
My research also engages with critical realist approaches in that it merges “real”
physical elements of the case with analyses of how they are socially situated (Forsyth
2008). Critical realist theory shares a focus on the co-production of social and
ecological knowledge and builds upon postmodern developments in anthropology
and emerging applications of cultural ecology (Forsyth 2003). These concepts are
relevant to the present study because the rapidly changing nature of production
patterns and resource access in Ethiopia reflects observable micro- and macro level
changes in social and economic systems but are also imbedded in complex
relationships between actors that are often left unexamined. The examination of
local discourses with respect to their capacity to position actors in society and
reinforce power relations highlights the dynamic relationship between cognitive
structures and the outward expression of social structures (Bordieu 1984). My
research is also grounded in the idea that discourses, defined as shared
interpretations of a phenomenon (Adger et al. 2001), reflect collections of ideas and
practices that lend meaning to physical and social realities (Hajer 1995). These
narratives can play a significant role in framing global issues and positioning actors,
and therefore can serve as a vehicle for either reinforcing existing power relations or
promoting socio-political change (Davies and Harre 1990). Critical examinations of
15
“regional discursive formations” or the “modes of thought, logics, themes, styles of
expression, and typical metaphors [that] run through the discursive history of a
region” (Peet and Watts 2004, 230) can help unveil the power dynamics that
underpin them (Forsyth 2008). In the case of highland Ethiopia, regional discursive
formations surrounding deforestation, environmental degradation, food insecurity
and poverty are deeply entrenched in political, social, economic and ecological
discussions among and between domestic and international actors (Yeraswork 2000;
Keeley and Scoones 2000). These discursive formations underpin access to a range of
things like resources, aid and authority, that in turn confer power.
Peluso and Ribot (2003) define access as the ability to benefit from things, in contrast
to the formal right to do so. If an individual’s capacity to benefit from a resource does
not necessarily relate to a formal ownership claims, as is often the case in rural
contexts, then understanding the specific mechanisms of access will shed some light
on vulnerability dynamics. Access in the Ethiopian context is tied to enforcement of
formal and customary rules. Patterns of decentralization are also relevant to
understanding relations between actors. Decentralization is associated with
democratic reforms because it stimulates increased accountability, equity and
efficiency through the promotion of participation and competition (Ribot, Agrawal,
and Larson 2006). Ribot et al. (2006) use the degree to which local actors remain
accountable to the central government as a metric of decentralization. To the extent
that they remain tied, power is less decentralized because these ties tend to inhibit
the ability of local managers to exercise discretionary authority over public resources,
and thereby maintain downward accountability. At the other extreme, too much
discretionary authority can lead to local instability through the establishment of
insecure access or privileges that are insecure, unclear of indefensible
(Sivaramakrishnan 1999). Peters (2009) points to the “dangers of over-privileging
16
notions of flexibility and negotiability in the social relations around land in Africa, and
the need to assess ongoing processes of exclusion and the production of winners and
losers” (1322). These principles of access and decentralization inform my study,
which focuses attention on forest resources benefit distributions and the ability of
different actors to assert their interests.
1.4 Site Selection and Community Introduction
I arrived in Ethiopia in August 2009 and spent three weeks at the Wondo Genet
College of Forestry near Shashemene. While at Wondo Genet, I read completed
student theses available in the College library, met a number of academics and
researchers and was able to join a few of them on field visits. I was looking for an
appropriate field site to investigate the interplay between smallholder farming
household livelihoods and trees. Initially I imagined that I would be investigating on-
farm tree planting, but I learned that significant natural forests remained in the
region. I met a PhD student who had previously worked as an instructor at Wondo
Genet and who was planning to conduct his research in the Munessa Forest, near
what would become my research site. I visited the area with him four or five times
before deciding to relocate there and pursue the necessary research permissions.
The factors that influenced my decision to select this site included the: 1)
predominance of semi-subsistence agricultural livelihoods, 2) contribution of natural
forest products to livelihoods and 3) occurrence of a forest boundary demarcation
exercise by the Forest Enterprise that coincided with my term of field work. I
thought that this demarcation would provide me with opportunities to learn more
about the relationships between the government, Forest Enterprise and community
members in ways that I would be unable to otherwise observe. I was welcomed by
the Forest Enterprise, who had been engaged in discussions about natural forest
management alternatives and expressed enthusiasm about a livelihoods-oriented
17
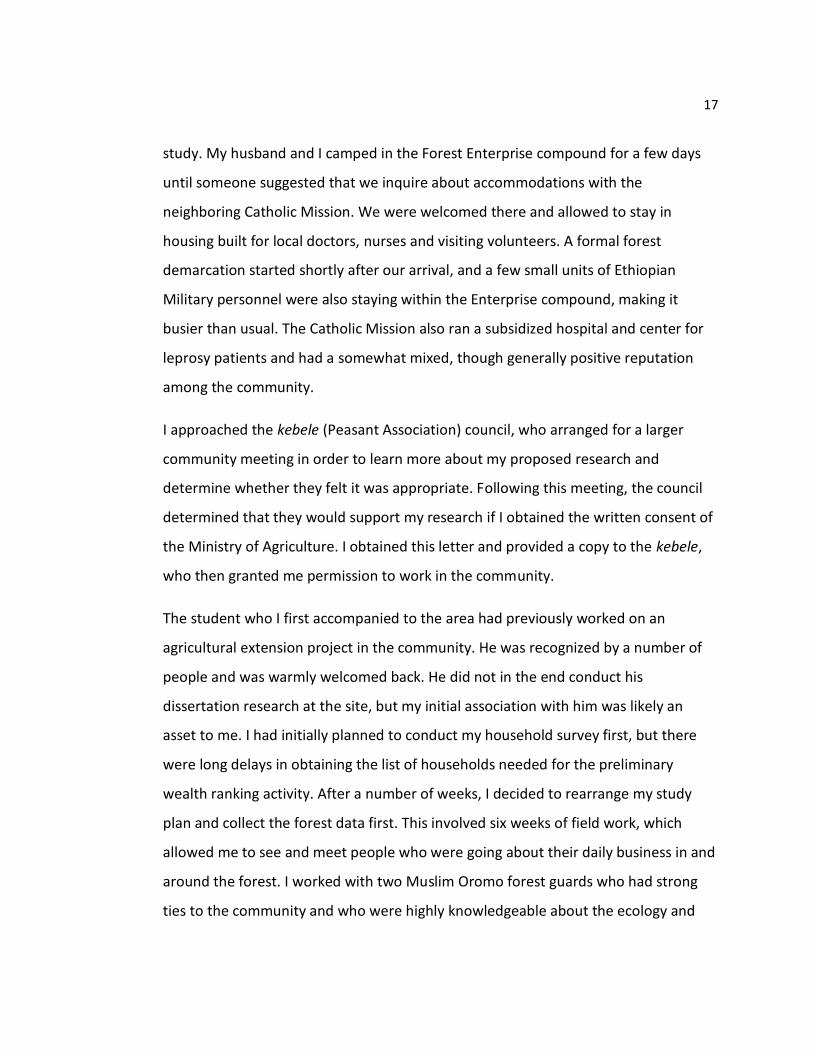
study. My husband and I camped in the Forest Enterprise compound for a few days
until someone suggested that we inquire about accommodations with the
neighboring Catholic Mission. We were welcomed there and allowed to stay in
housing built for local doctors, nurses and visiting volunteers. A formal forest
demarcation started shortly after our arrival, and a few small units of Ethiopian
Military personnel were also staying within the Enterprise compound, making it
busier than usual. The Catholic Mission also ran a subsidized hospital and center for
leprosy patients and had a somewhat mixed, though generally positive reputation
among the community.
I approached the kebele (Peasant Association) council, who arranged for a larger
community meeting in order to learn more about my proposed research and
determine whether they felt it was appropriate. Following this meeting, the council
determined that they would support my research if I obtained the written consent of
the Ministry of Agriculture. I obtained this letter and provided a copy to the kebele,
who then granted me permission to work in the community.
The student who I first accompanied to the area had previously worked on an
agricultural extension project in the community. He was recognized by a number of
people and was warmly welcomed back. He did not in the end conduct his
dissertation research at the site, but my initial association with him was likely an
asset to me. I had initially planned to conduct my household survey first, but there
were long delays in obtaining the list of households needed for the preliminary
wealth ranking activity. After a number of weeks, I decided to rearrange my study
plan and collect the forest data first. This involved six weeks of field work, which
allowed me to see and meet people who were going about their daily business in and
around the forest. I worked with two Muslim Oromo forest guards who had strong
ties to the community and who were highly knowledgeable about the ecology and
18
history of the forest. We walked long distances each day, allowing me to gain a
better sense of the landscape and to meet people from many of the neighboring
communities and learn some of the complexities of community forest access and
enforcement. The unintended reordering of the forest work in advance of the
household survey also likely had positive implications, as I was able to meet a
number of people for the first time while on foot in the forest, which turned out to
be a novel place for a foreigner to be, and often led to conversation about my
interests and purpose.
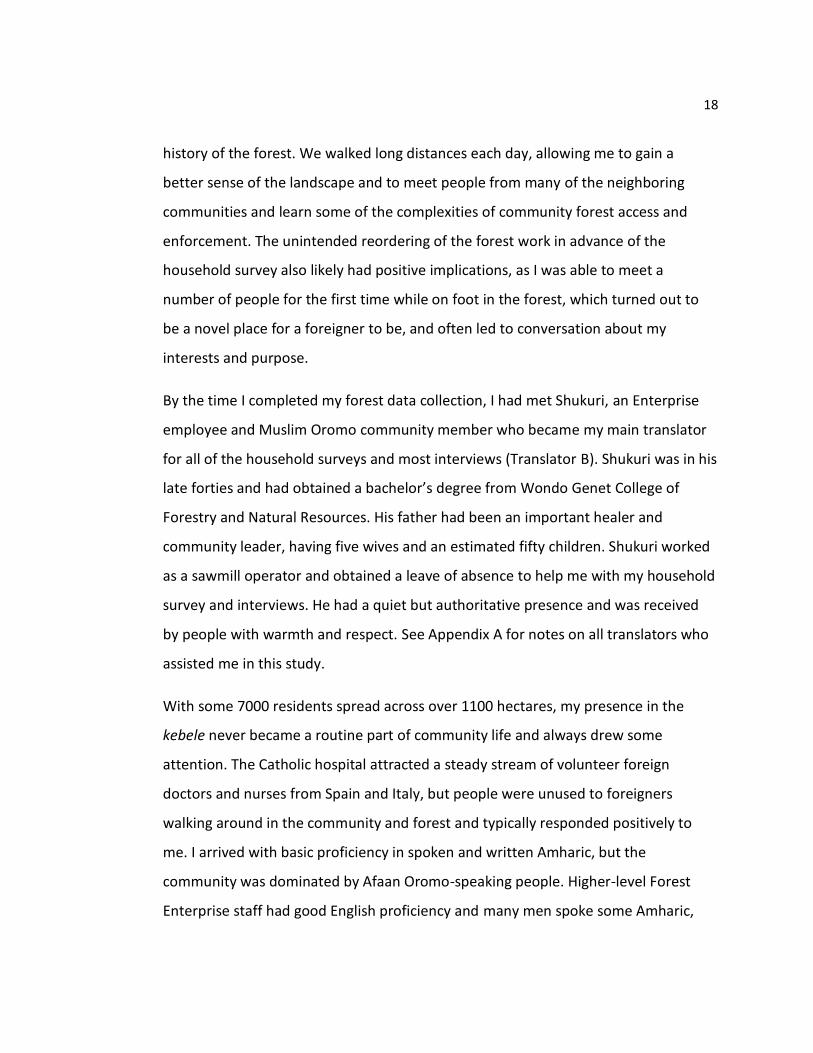
By the time I completed my forest data collection, I had met Shukuri, an Enterprise
employee and Muslim Oromo community member who became my main translator
for all of the household surveys and most interviews (Translator B). Shukuri was in his
late forties and had obtained a bachelor’s degree from Wondo Genet College of
Forestry and Natural Resources. His father had been an important healer and
community leader, having five wives and an estimated fifty children. Shukuri worked
as a sawmill operator and obtained a leave of absence to help me with my household
survey and interviews. He had a quiet but authoritative presence and was received
by people with warmth and respect. See Appendix A for notes on all translators who
assisted me in this study.
With some 7000 residents spread across over 1100 hectares, my presence in the
kebele never became a routine part of community life and always drew some
attention. The Catholic hospital attracted a steady stream of volunteer foreign
doctors and nurses from Spain and Italy, but people were unused to foreigners
walking around in the community and forest and typically responded positively to
me. I arrived with basic proficiency in spoken and written Amharic, but the
community was dominated by Afaan Oromo-speaking people. Higher-level Forest
Enterprise staff had good English proficiency and many men spoke some Amharic,
19
but Oromo was the primary language for daily communication. I gained sufficient
proficiency in daily greetings, pleasantries and in words and phrases relating to the
forest and farming, but my language limitations restricted my ability to integrate
more deeply in to the community. I believe that my loose association with a range of
actors and institutions including the Forest Enterprise, the Catholic Mission, and
Wondo Genet College of Forestry made me more accessible to a range of people.
Over time, people shared a range of perspectives on the work of these different
entities, making me believe that they did not view me as tightly affiliated with any
one institution.
1.5 Research Methods
Baerwald describes how contemporary “problems lie beyond the margins of existing
disciplines or…are much larger than any one discipline (495).” I used a variety of
methods in conducting this research, including interviews, a household livelihoods
survey, forest stand measurements and secondary literature review.
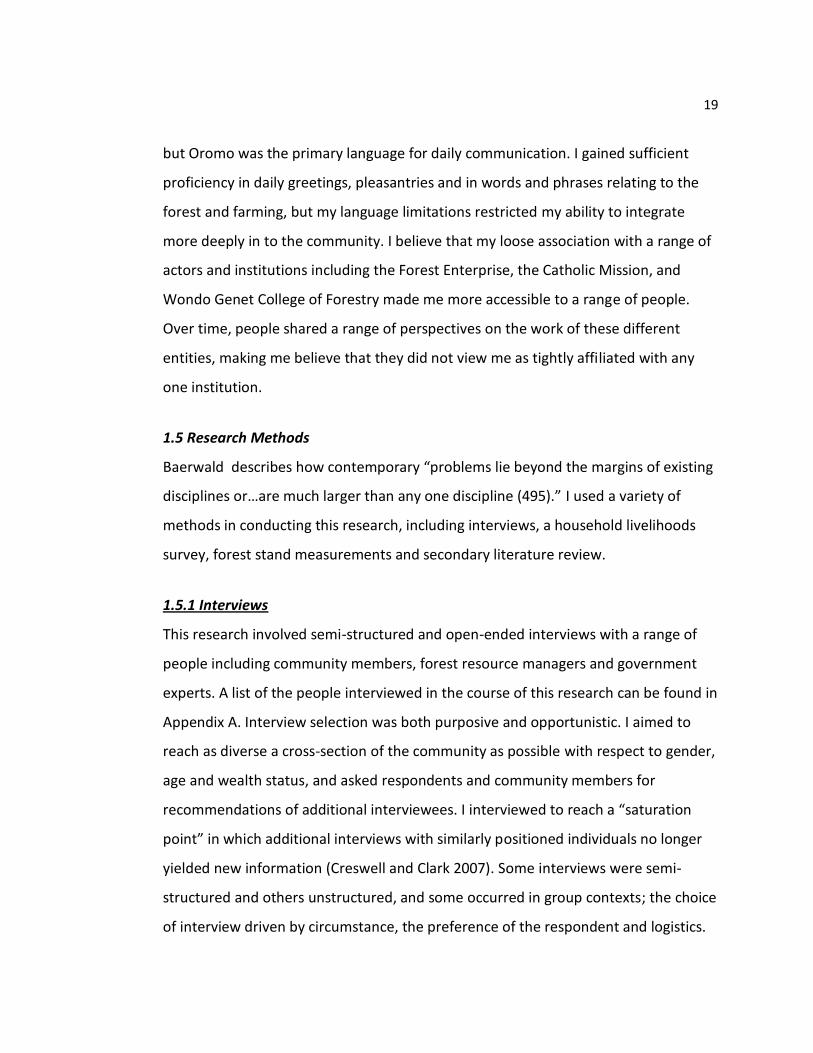
1.5.1 Interviews
This research involved semi-structured and open-ended interviews with a range of
people including community members, forest resource managers and government
experts. A list of the people interviewed in the course of this research can be found in
Appendix A. Interview selection was both purposive and opportunistic. I aimed to
reach as diverse a cross-section of the community as possible with respect to gender,
age and wealth status, and asked respondents and community members for
recommendations of additional interviewees. I interviewed to reach a “saturation
point” in which additional interviews with similarly positioned individuals no longer
yielded new information (Creswell and Clark 2007). Some interviews were semi-
structured and others unstructured, and some occurred in group contexts; the choice
of interview driven by circumstance, the preference of the respondent and logistics.
20
Interviews most often took place at the home of the interviewee, typically in the
grassy area in front of the home, lasting anywhere from fifteen minutes to four
hours. I transcribed interviews from hand-written notes, coded and then memoed to
explain and elaborate on themes developed in data analysis (Glaser and Strauss
1967). Translators were used for all interviews not conducted in English (see
Appendix A).
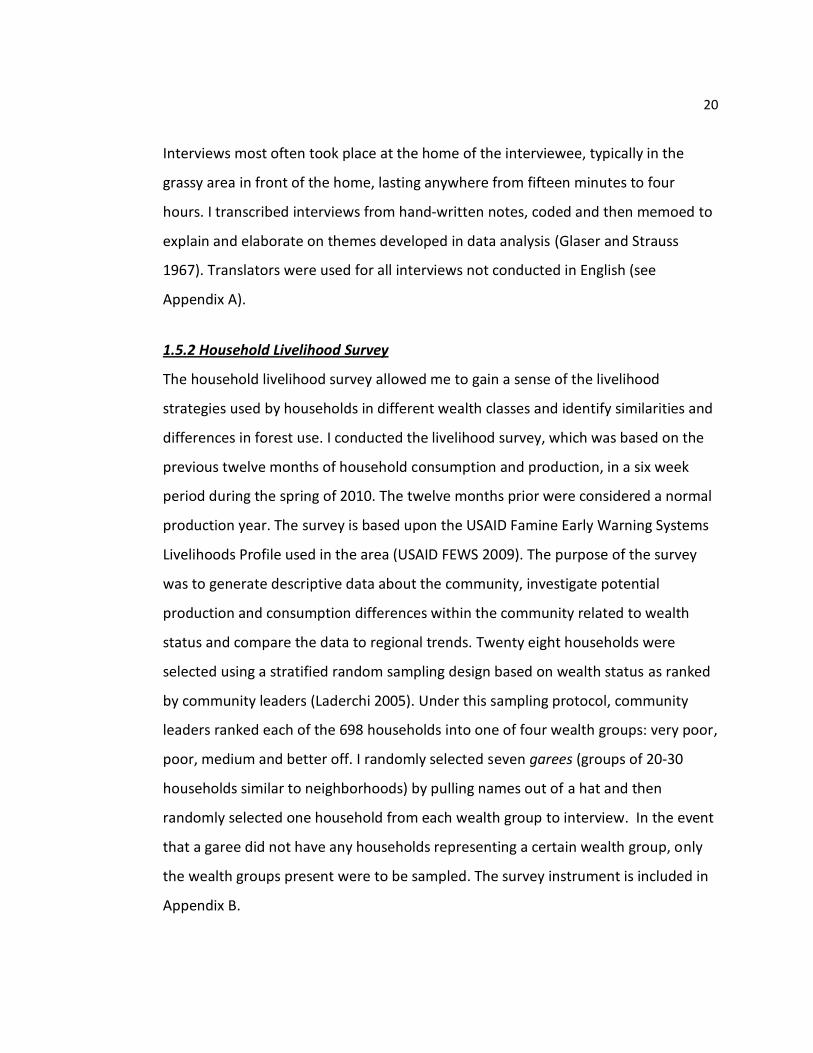
1.5.2 Household Livelihood Survey
The household livelihood survey allowed me to gain a sense of the livelihood
strategies used by households in different wealth classes and identify similarities and
differences in forest use. I conducted the livelihood survey, which was based on the
previous twelve months of household consumption and production, in a six week
period during the spring of 2010. The twelve months prior were considered a normal
production year. The survey is based upon the USAID Famine Early Warning Systems
Livelihoods Profile used in the area (USAID FEWS 2009). The purpose of the survey
was to generate descriptive data about the community, investigate potential
production and consumption differences within the community related to wealth
status and compare the data to regional trends. Twenty eight households were
selected using a stratified random sampling design based on wealth status as ranked
by community leaders (Laderchi 2005). Under this sampling protocol, community
leaders ranked each of the 698 households into one of four wealth groups: very poor,
poor, medium and better off. I randomly selected seven garees (groups of 20-30
households similar to neighborhoods) by pulling names out of a hat and then
randomly selected one household from each wealth group to interview. In the event
that a garee did not have any households representing a certain wealth group, only
the wealth groups present were to be sampled. The survey instrument is included in
Appendix B.
21
The survey was administered by the author with the help of a translator and in the
company of a member of the kebele council who resided near the garee. Each survey
took place at the household residence and lasted between 45 minutes and two and a
half hours. Twenty-four of the interviews were conducted with the male and female
head of household, with the male usually answering questions about crop production
and sale and the female usually answering questions about household expenditures.
Of the other four interviews, three took place with female-headed households and
one took place with women whose husband was not present. Between one and four
surveys were conducted per day of interviewing. Surveys were administered
between Monday and Thursday as schedules permitted to avoid conflicts with the
Friday market day in Arsi Negele. Interviews occurred between March and May 2011.
The “household” included co-resident and non-resident members who depended
upon the same financial and food resources. Non-resident household members
included high-school and college aged students who lived in urban or semi-urban
areas to attend school, but whose tuition and living expenses were paid for by
household heads. Supplementary food in the form of potatoes, vegetables and maize
was also often provided to non-residents. In the cases in which husbands had
multiple wives, households were considered distinct if they had separate residences
and incomes but the same if wives resided together and household members shared
the same incomes.
1.5.3 Natural Forest Inventory
The silvicultural assessment that is part of this study provides baseline data on the
structure and composition of the natural forest area. I use this data to understand
changes in the natural forest and to compare it with other similar studies in the
region. The process of data collection also served to familiarize me with the area,
allowed me to meet people and to observe normal daily patterns of forest use by the
22
people who use it. Data describing contemporary species composition and diameter
class distributions will hopefully allow the community and resource managers to
understand commercial and subsistence values of the forest, which can inform future
management decisions.
The data I collected describes the structure (specifically the stems per hectare and
diameter class distribution) and composition (species abundance and frequency) of
the 1209 hectare natural forest area adjacent to the Gambo Forest Enterprise using
methods adapted from Wilson (Wilson 2008). Native vegetation in the study area is
classified as dry afromontane evergreen forest. Common tree species include
Podocarpus falcatus and Croton macrostachys. The natural forest area under study is
part of a larger natural forest and plantation complex known as the Arsi Forest, which
extends over 21,513 hectares, some 28 percent of which is plantation forest.
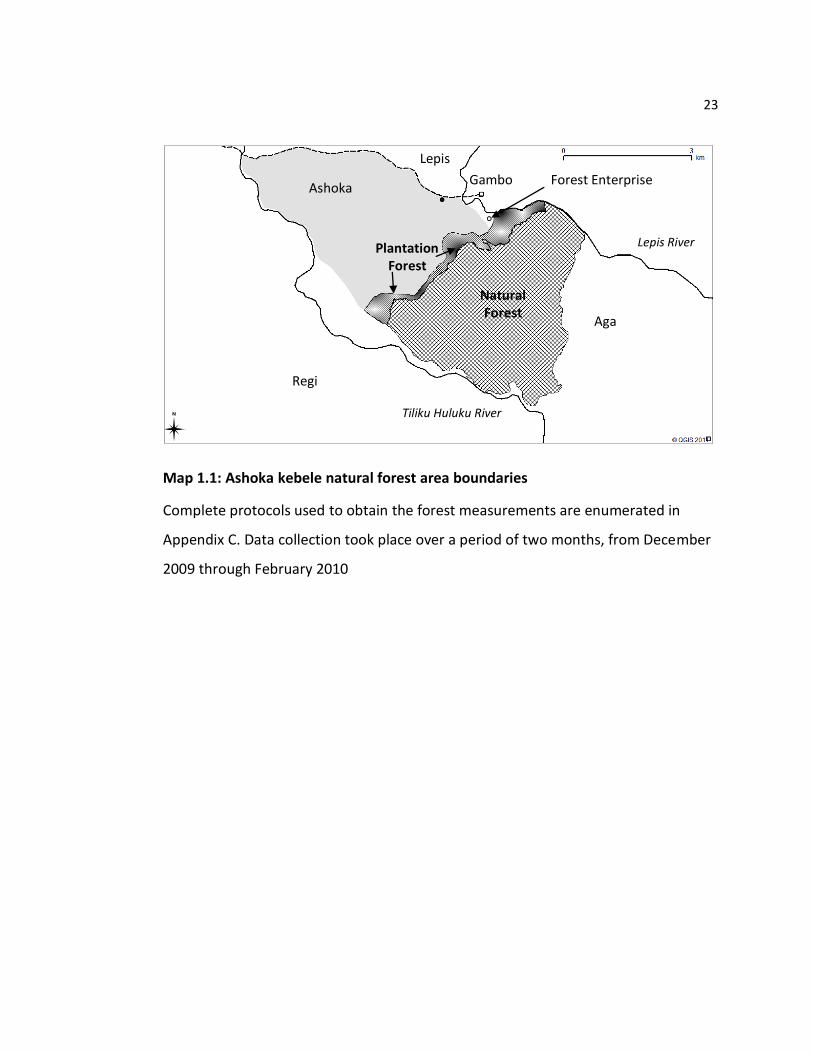
The statistical population under study consists of a 1,209-hectare forested area that
ranges in elevation from 2100 to 2700 meters above sea level (Map 1.1). To the west,
the study area is adjacent to the Ashoka kebele forest plantation, which extends from
northeast to southwest in a strip that also borders Ashoka kebele farms and
homesteads. The southern boundary of the forest is bordered by the Regi kebele
forest area and the Tiliku Huluku River. The southwest and western forest boundary
is adjacent to homes and farms in the Aga kebele. To the north, the forest area is
delineated by the Lepis River and Ashoka plantation forest.
23
Map 1.1: Ashoka kebele natural forest area boundaries
Complete protocols used to obtain the forest measurements are enumerated in
Appendix C. Data collection took place over a period of two months, from December
2009 through February 2010
Lepis
Kebele Gambo
Natural Forest
Plantation Forest
Aga
Ashoka
Tiliku Huluku River
Lepis River
Regi
Forest Enterprise
24
Chapter 2 - Understanding smallholder vulnerability through a multi-scalar perspective
Kathleen Guillozet and John Bliss
25
2.1 Introduction
While policymakers commonly reference the need for household vulnerability reduction
in the global South, conversations seldom reflect the complexity that characterizes
relationships between rural household livelihoods, natural resource access and
processes of global change. The conditions that create vulnerability are grounded in
multiple factors that exist across numerous scales. Yet researchers, who are often
constrained by time, funds, expertise and capacity, usually characterize vulnerability in
more discrete terms, focusing on interactions such as those between rainfall variability
and crop production or relationships between household asset holdings and resistance
to external shocks. This tendency can yield important findings but also may perpetuate
simplistic conceptions of vulnerability that reinforce the centralized systems of control
that often play a large role in perpetuating inequality and poverty. The challenge of
connecting place-specific aspects of vulnerability to the regional and global processes
that also shape local realities remains largely unattended.
This paper partially addresses this gap by using evidence from a case study of a farming
community in Ethiopia’s highland forest periphery to examine how vulnerability is
created and reproduced at multiple scales. It accomplishes this by: 1) presenting an
overview of vulnerability in the context of a rural community at the forest periphery 2)
describing why scale matters in terms of defining and addressing vulnerability and 3)
providing evidence from a specific case to shed light on relationships between
livelihoods, natural resources and vulnerability.
2.2 Background
2.2.1 Vulnerability
Amartya Sen’s entitlement approach (Sen 1976) has shaped contemporary research on
vulnerability. Sen described entitlements as “the set of alternative commodity bundles
26
that a person can command in a society using the totality of rights and opportunities
that he or she faces” (Sen 1984, 497). Vulnerability, then, can be seen as the risk that a
household’s entitlements are insufficient to buffer them against losses (Ribot 2010).
Global change scientists often describe vulnerability as having “an external dimension,
which is represented here by the ‘exposure’ of a system . . . as well as an internal
dimension, which comprises its ‘sensitivity’ and its ‘adaptive capacity’ to these
stressors” (Fussel and Klein 2006, 306). External dimensions relevant to the case
presented in this paper include political, social and policy dimensions in addition to
environmental ones. Internal dimensions include processes relating to resource access
or exclusion, social dynamics and political marginalization.
Vulnerability research pertains to the “magnitude of the threat of future poverty” and
its effects on decision-making and resource use (Calvo and Dercon 2005, 7).
Vulnerability approaches can reflect dimensions of household well-being that are not
captured by prevailing poverty indices (Bigsten and Shimeles 2008). They can
acknowledge risks obscured by other metrics such as GDP, akin to those that often
occur with shifts from staple to commodity crop production, as rising household
incomes are accompanied by overall increases in vulnerability (Block, Barrett, and
Maxwell 2005). Factors commonly cited as exacerbating household vulnerability in
Ethiopia include drought, commodity price fluctuation, crop pests, death and illness
(Calvo and Dercon 2005). Investigations by social scientists and others into the efficacy
of rural development programs have led to a gradual expansion in the types of factors
considered relevant to household vulnerability. While livelihood interventions tend to
focus on micro-level aspects of household economies, there are increasing calls to also
include “knowledge, politics, scale and dynamics” (Scoones 2009, 190), situating land
use and livelihood change as the outcome of social relations (McCusker and Carr 2006).
27
2.2.2 Vulnerability at the Forest Periphery
The case presented in this paper focuses on a smallholder farming community at the
forest periphery. Forests often contribute substantially to the incomes of the
households that live near them, sometimes also serving as safety nets during periods of
economic and environmental stress (Hobley 2005; Colfer, Sheil, and Kishi 2006). At the
same time, the multiple values that forests possess also make them areas of interest to
the state and to elite groups (Scott 1998; Scott 2009; Rudel 2007), a dynamic that can
drive access-related conflicts (Angelsen 2001; Donovan, deJong, and Abe 2007; Peluso
and Watts 2001). Forests are central elements of global strategies to offset climate
change, and the presence of forested and previously forested areas are key
determinants of country eligibility for funding opportunities such as Reducing Emissions
from Deforestation and Degradation (REDD+) and the Clean Development Mechanism
(CDM). This means that communities that live near forests may have a greater likelihood
of being the subjects of policy and economic interventions focused at vulnerability
reduction, for better or for worse. Mamo et al. (2007) suggest that “[g]reater local
participation in decision making, promotion of improved forest management practices,
and enhanced marketing infrastructure may contribute positively but will ultimately
have limited effect” on livelihoods (926), problematizing conventional approaches to
vulnerability reduction that tend to emphasize these factors.
2.2.3 Vulnerability at Multiple Scales
Vulnerability reduction is further complicated by the interconnectedness of economic,
political and ecological systems, as illustrated in the following three wide-ranging
examples: 1) Ecotourism development, which creates new opportunities for some
households, while constraining others (Roshetko, Lasco, and Angeles 2007); 2)
Agricultural intensification, which can make farmers more vulnerable through increased
reliance on commodity crops that are subject to dramatic price fluctuations (Eakin
28
2006); 3) Small-scale irrigation schemes, which can decrease the vulnerability of some
farmers, but lead to greater inequality (Tapela 2008) with direct impacts on vulnerability
(Tchouassi 2011; Adger et al. 2002). Vulnerability reduction is thus a value-based
decision-making process with associated costs and tradeoffs. The effects of policies
associated with globalization, such as the elimination of price protections for staple
commodities, can counter the positive impacts of strategies that increase production
(O'Brien and Leichenko 2000).
2.2.4 Vulnerability in Ethiopia
Vulnerability in Ethiopia is created and compounded by a host of factors. Rural
extension services are criticized for representing political interests and not adequately
reaching the most vulnerable members of communities (Belay and Abebaw 2004;
Pausewang 2009). Marginalized farming households tend to occupy the most
unproductive and erosion-prone land (Fliegel 1993) and are prone to significant asset
loss during periods of extreme hardship (Hobley 2005). These households often have
less power in their communities (Rocheleau 1995), less education, and are less likely to
adopt conservation strategies like tree planting (Zeleke 2009). Diminishing farm size is
noted throughout Ethiopia and much of Africa (Jayne, Yamano et al. 2003). However,
the relationship between farm size and productivity is context-specific (Place 2009).
Variables such as markets, opportunities for cash cropping and access to extension,
inputs and improved crop and livestock varieties play a large role in shaping the capacity
of farmers to intensify production in ways that maintain or enhance household well-
being. The role of investment flows, which are often directed towards medium and
large-scale agriculture in developing countries, may further disadvantage smallholder
farmers (Tschirley and Benfica 2001). The Ethiopian economy is described as “one of
several post-socialist economies undergoing an ambivalent transformation process
towards some kind of capitalist economy” (Crewett and Korf 2008, 203). Smallholder
29
farmers have struggled against government-driven market distortions such as those
governing fertilizer markets (Jayne, Govereh et al. 2003) and agricultural and food aid
programs that affect cereal crop production and pricing (Cline 2004). Farmers in Africa
pay more for fertilizers than those in other developing countries (Jayne, Govereh et al.
2003) and in Ethiopia, fertilizer importation, distribution, and pricing is concentrated
among two holding companies with close government relations (ibid). Distribution of
inputs at local levels is tightly associated with political affiliations, with non-party
members often excluded (HRW 2010).
2.3 Approach
Identifying the kinds of approaches that will impact smallholder vulnerability remains
difficult. Should vulnerability reduction efforts be directed at households, communities,
regions, nation-states, or all of the above? How can researchers develop a more
comprehensive picture of vulnerability in order to identify appropriate approaches? I
draw upon a theorization of space and scale in order to allow for a more critical
examination of these issues.
Henri Lefebvre (1991) asserted that our cognizance of social reality or space is largely
shaped by the state and by capitalism, and therefore people’s actions tend to
unconsciously reinforce centralized forms of power. He explained that one way to
transcend these limitations, and to see what he termed the “truth of space” is to
examine processes at multiple scales, including both the “macro-structures of politics
and economy on the one hand and everyday life on the other” (Molotch 1993, 891). This
strategy is grounded in the notion that the atomization of knowledge and understanding
tends to perpetuate simplistic narratives. Ribot (2010) presents a complementary
approach that places localized inventories of the “processes that shape vulnerability” as
the starting point for discussions on effective strategies to reduce household
vulnerability (72). His framework places livelihood loss as the outcome of political,
30
ecological and economic processes that exist at multiple scales. Ribot stresses the need
to identify areas of “active” vulnerability production, including exploitation, resource
access, political exclusion, market fluctuation, unstable policy, environmental change,
poor infrastructure, poor social security systems, and a lack of planning (61).
Lefebvre and Ribot both propose the need to identify active vulnerability production
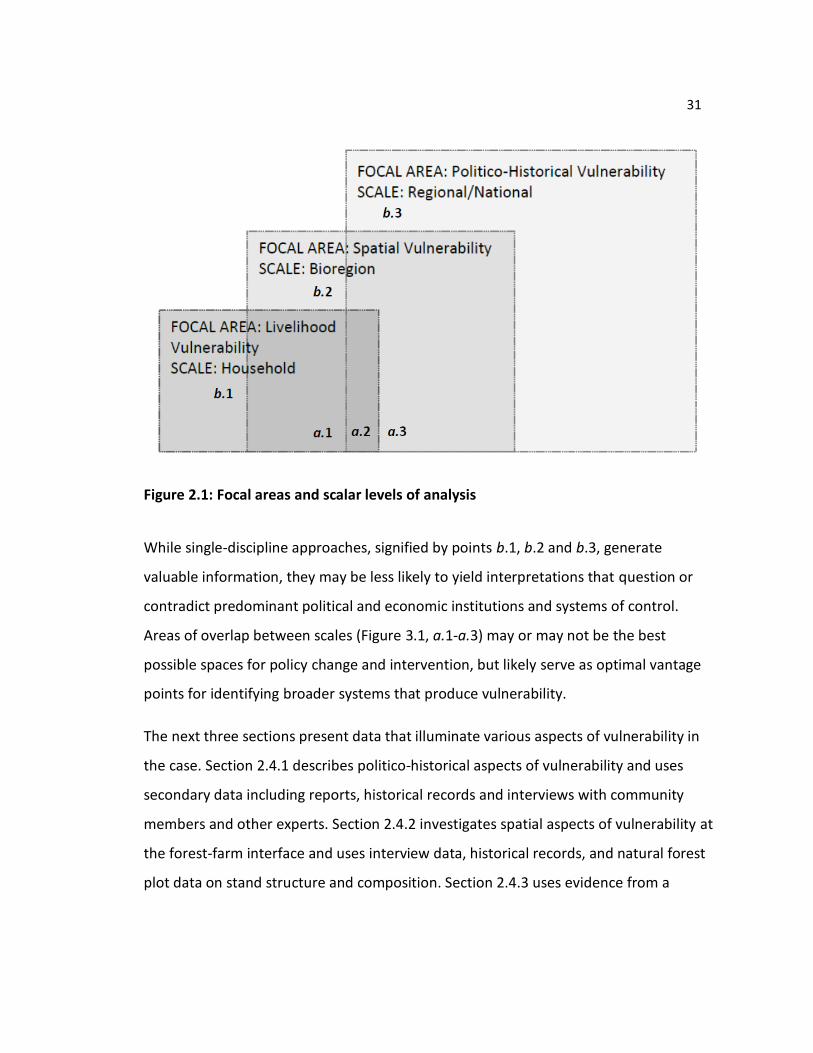
through multi-scalar approaches. This “truth of space” is represented in Figure 2.1 by
point a.2, where the three scales (household, bioregion and nation) and focal areas
(livelihood, spatial and politico-historical aspects of vulnerability) of my research
overlap. While the household is necessarily embedded in the local and regional, each
scale is also framed and understood partly in its own terms. The diversity of data types
makes them impossible to normalize across scales. Instead, I weave them loosely
together with the aim of developing a more comprehensive understanding of household
vulnerability. Researchers working in other contexts or with different interests and
expertise may identify different focal areas and scales that bear greater relevance to
their research questions. Figure 2.1 describes the focal areas and scales highlighted in
this research, and may be of utility to researchers who seek to identify the processes
that shape vulnerability.
31
Figure 2.1: Focal areas and scalar levels of analysis
While single-discipline approaches, signified by points b.1, b.2 and b.3, generate
valuable information, they may be less likely to yield interpretations that question or
contradict predominant political and economic institutions and systems of control.
Areas of overlap between scales (Figure 3.1, a.1-a.3) may or may not be the best
possible spaces for policy change and intervention, but likely serve as optimal vantage
points for identifying broader systems that produce vulnerability.
The next three sections present data that illuminate various aspects of vulnerability in
the case. Section 2.4.1 describes politico-historical aspects of vulnerability and uses
secondary data including reports, historical records and interviews with community
members and other experts. Section 2.4.2 investigates spatial aspects of vulnerability at
the forest-farm interface and uses interview data, historical records, and natural forest
plot data on stand structure and composition. Section 2.4.3 uses evidence from a
32
household livelihoods survey and interviews to illuminate aspects of household
vulnerability.
2.4 Findings
2.4.1 Politico-historic aspects of vulnerability in the Arsi Region
This section describes politico-historic aspects of vulnerability, situated at the regional
and national scale. While evidence focuses on the case, politico-historic aspects of
vulnerability are fundamentally driven by larger processes of state-making and capital
accumulation and therefore reside at the regional and national scale. This scale provides
broader context to livelihood changes relevant to vulnerability. Since many
contemporary vulnerability and risk reduction approaches operate under assumption
that “a good understanding of how people have survived in the past provides a sound
basis for projecting into the future”(FEG 2008, 20), knowledge of the history of
livelihood change and resource access will inform contemporary approaches to
vulnerability reduction. Because livelihoods in many places are characterized by change
rather than continuity, a historic grounding allows researchers a glimpse into the scope
and pace of change over time. Historical investigations may also provide insight into the
place-specific nature of livelihood change, which also affects vulnerability.
Data illustrating politico-historical aspects of vulnerability include secondary data such
as reports and historical accounts, augmented and triangulated through interviews with
purposively selected community members and resource managers. History is inherently
incomplete, and the information accessed in the course of this research is no exception.
Interviews were also opportunistic in nature, and therefore may not reflect the total
diversity of experiences and perspectives held in the community under study. Still, they
do provide insight into the nature of livelihood change and vulnerability over time.
33
The study site, located at the edge of a government-run plantation and natural forest
area, has been inhabited by Muslim Oromo people for over one hundred years.
Following conquest of the Arsi area at the end of the 19th century, all forests became the
property of the state. Concessions of land, with accompanying rights to local labor, were
granted by Emperor Haile Selassie, primarily to Amhara military officials, widows and
other extra-local elites (Poulsen 1973). These “were compounded by a host of illegal
impositions levied by the ruling class on the peasantry” associated with land rents and
labor obligations (Markakis 1987). The state has historically maintained tight control
over the area as it has seen fit to do so, as described in the following quote: “The
experience of Arsi’s inhabitants since Menelik’s conquest *in the 1880’s+ has been that
unless the writ of central government is followed, then the army and/or the police will
enforce it” (Cohen and Isaacson, 1987, 452 in de Waal 1991, 235).
Local access to forest benefits has diminished through the course of three political
regimes that have exercised strong state control of forest resources. Shrinking forest
resources and recent demands from a range of actors for conservation, ecotourism and
other forms of capital development mean that the existing use rights of local community
members are increasingly tenuous.
Local people used raw material from the forest for animal fodder, building, tool-making,
fuelwood, medicines and other cultural purposes. Extra-local elites have historically
used the forest for revenue generation from timber concessions. For example, elder
community members described an Italian logging company, Gino, which selectively
harvested Podocarpus falcatus during Haile Selassie’s reignand practiced “the infamous
‘cut out-get out’ principle of concessioners” (MoA 1990, 44). Extra-local elites and other
outsiders benefit from informal fuelwood harvest through their ability to purchase
below-market priced building materials and fuelwood.
34
Economic benefits extracted from the forest by the state include incomes from timber
harvest, plantations, bequests to patrons and tax revenues. Haile Selassie solidified ties
to military leaders and advisors by granting them forest concessions in the region, and
the Derg sought the allegiance of the peasantry through the clearing of forestland for
farm establishment. As Rahmato (2009) described:
The chief resource of the country still remains the land, and access to it has invariably been keenly sought by all concerned- the peasant, the privileged classes as well as the state- for the economic benefits this would confer as well as social and political dominance …With improvements in transportation and communication, and the role played by state controlled political parties which came to exercise influence in rural affairs during the Derg and at present, the strong arm of the state has been extended to the far reaches of the countryside, far more so than at any time in the past. (284-285)
In 2010, state benefits from the forest were largely obtained through the government-
run Forest Enterprise plantation system. In 2009, Arsi forest plantation landholdings and
timber were valued at $37,756,432 USD (Enterprise 2010).
Broad livelihood system changes have accompanied political changes in the area (Table
2.1). The rapid shift from sedentary grazing to rainfed mixed farming systems that has
occurred over the past few decades has also led to increased household vulnerability.
During Haile Haile Selassie’s reign, local Oromo people lived in sparse settlements and
relied mainly upon livestock for nutrition and asset holdings. As one elder described:
“Before there was no plowing, only many cattle. With the increase of farming the forest
was destroyed” (116, community elder). Oromo people were viewed by the ruling
Amhara as slaves and had no access to formal education. Under Derg rule, every
household was granted a small plot of farmland, community grazing areas were largely
settled and collective farms were established. Today, households practice what Seré and
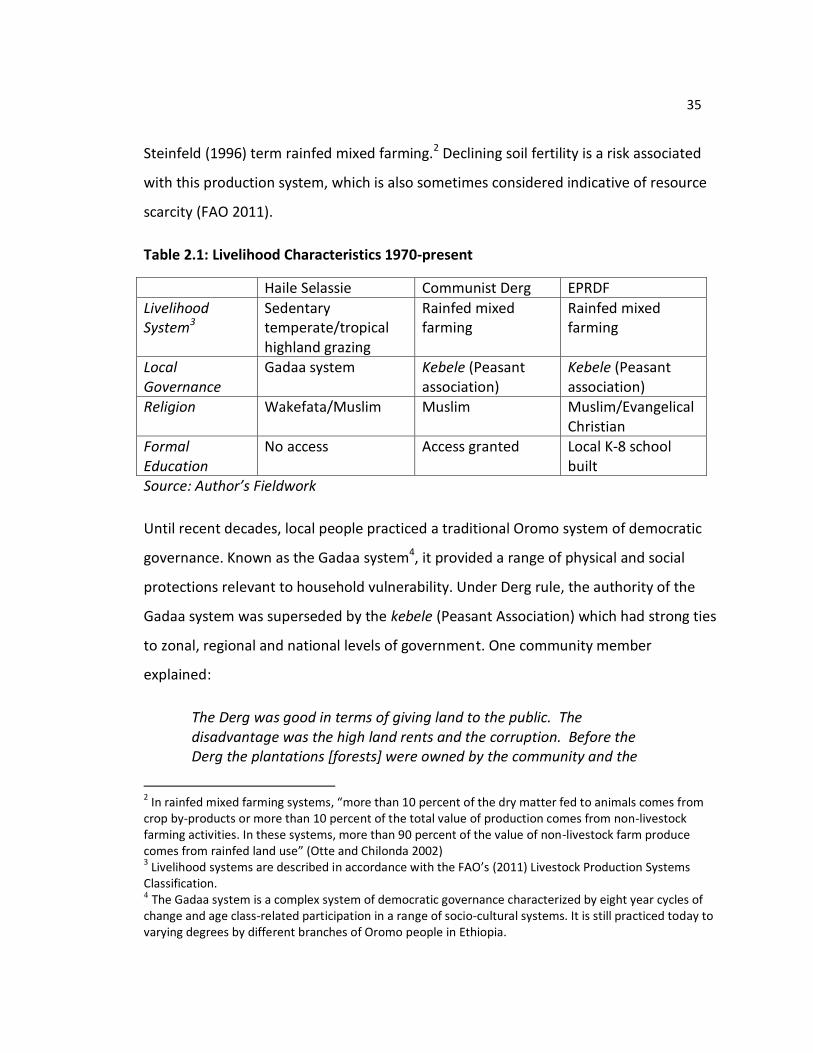
35
Steinfeld (1996) term rainfed mixed farming.2 Declining soil fertility is a risk associated
with this production system, which is also sometimes considered indicative of resource
scarcity (FAO 2011).
Table 2.1: Livelihood Characteristics 1970-present
Haile Selassie Communist Derg EPRDF
Livelihood System3
Sedentary temperate/tropical highland grazing
Rainfed mixed farming
Rainfed mixed farming
Local Governance
Gadaa system Kebele (Peasant association)
Kebele (Peasant association)
Religion Wakefata/Muslim Muslim Muslim/Evangelical Christian
Formal Education
No access Access granted Local K-8 school built
Source: Author’s Fieldwork
Until recent decades, local people practiced a traditional Oromo system of democratic
governance. Known as the Gadaa system4, it provided a range of physical and social
protections relevant to household vulnerability. Under Derg rule, the authority of the
Gadaa system was superseded by the kebele (Peasant Association) which had strong ties
to zonal, regional and national levels of government. One community member
explained:
The Derg was good in terms of giving land to the public. The disadvantage was the high land rents and the corruption. Before the Derg the plantations [forests] were owned by the community and the
2 In rainfed mixed farming systems, “more than 10 percent of the dry matter fed to animals comes from crop by-products or more than 10 percent of the total value of production comes from non-livestock farming activities. In these systems, more than 90 percent of the value of non-livestock farm produce comes from rainfed land use” (Otte and Chilonda 2002) 3 Livelihood systems are described in accordance with the FAO’s (2011) Livestock Production Systems Classification. 4 The Gadaa system is a complex system of democratic governance characterized by eight year cycles of
change and age class-related participation in a range of socio-cultural systems. It is still practiced today to varying degrees by different branches of Oromo people in Ethiopia.
36
Derg displaced people. [The] community had no power to resist the Derg and people were forced to release their land and move elsewhere or work as daily laborers. [Immediately after the fall of the Derg, the people were angry and wanted to destroy the hospital and the plantations. We had] two tools: the Gadaa system and the elders. [We held a meeting to] convince people about the value of the project and hospital and describe their future plans and objectives. We had the power to lead and show the people then. Now the Gadaa system has stopped. There is no Gadaa system anymore. Partly this is because of religious freedom. Now some people are Muslim, some people are Christian. During the Derg the Gadaa system is strong but we don’t have that understanding today. (101, Retired forest guard)
While community members did not technically own forestlands prior to the Derg, land
allocation was complex, and many households were settled in forested areas and paid
land taxes to the government. With the establishment of more formal state interest in
the forests under the Derg, forcible evictions and relocations as well as landholding
reductions were common. In 2010, most households occupied the same farm plots
granted to them by the Derg in the 1970’s and 1980’s. As described by de Waal (1991):
The land reform of 1975 gave the Dergue [sic] great political capital in the Oromo areas -- which it promptly began to deplete by heavily taxing the peasants and requisitioning food from them for the army and the towns. The land reform also set up Peasant Associations (PAs), with the initial aim of re-distributing land. PAs were given wider-ranging powers shortly afterwards (69).
Dessalegn Rahmato estimated that “by the end of the 1960’s average per capita
holdings in Arssi [sic] were between two-and-half to three hectares” (2009, 39). By
2010, landholdings at the study site averaged one hectare. Aside from a few community
grazing areas which were typically too wet to farm, there was no “surplus” farmland
available. Children gradually began to attend the local elementary school and parents
sent their children away to high school as they could afford to do so. Educated children
then competed for limited jobs, described further in the next sections. The kebele and
37
higher strata of government such as the Woreda and the Ministry of Agriculture
established during Derg rule remained intact and powerful (Pausewang 2009).
The politico-historic aspects of vulnerability that are illustrated in this section include
state-driven livelihood change that has proceeded over the past 100 years, forest
appropriations by the state and extra-local elites, increased access to education,
shrinking farm sizes and the decline of local institutions such as the Gadaa system. Each
of these processes has contributed to livelihood change with impacts on household
vulnerability that are difficult to measure but are nonetheless important.
2.3.2 Spatial aspects of vulnerability: Forest change
Assumptions about the behaviors and asset preferences of smallholder farmers in
Ethiopia are based largely on studies of households that lack forest access (e.g. Barrett,
Holden, and Clay 2004; Burg 2008; Dercon and Krishnan 2000). Customary forest uses
supplement local incomes and provide resource inputs to households. Shifts in resource
availability underscore the need to understand the unique livelihood dynamics of these
households. In this section I describe bioregional changes that have occurred in the
forest area surrounding the study site in order to ground the case in physical space and
describe the circumstances underlying historic land use change. These have a direct
bearing on vulnerability in three primary ways: 1) because households depend on
forests to fill household needs, the changing structure and composition of the natural
forest affects household vulnerability, 2) a historically-informed picture of land use
change shifts the burden of environmental degradation and deforestation off the
shoulders of the rural poor establishes more accurate chains of causality sensu Ribot
(2011), and it also 3) illustrates the social relations that underpin vulnerability, land use
and livelihood change.
38
Data used in this section include historic reports and forest assessments, interviews with
community members and forest measurements collected by the author in 66 randomly
assigned 25m x 25m plots using methods adapted from Wilson (2008).
The case study site is located in Ethiopia’s Arsi forest, an upper wet broad-leaved Afro-
montane rainforest. Today the Arsi forest extends over approximately 21,513 hectares,
some 28 percent of which is plantation forest. Natural forests persist largely in areas
that are steeply sloped and difficult to access, while flatter areas have been converted
to farmland (Poulsen 1973). The forest and surrounding villages are located in a
transition area between two agro-ecological zones, known as the Weina Dega or
Baddaa Dareetti (temperate, cool sub-humid highlands) located between 1,500-2,300
meters in elevation and the Dega or Badaa (cool and humid highlands) between 2,300-
3,200 meters in elevation (Aalbaek and Kide 1993).
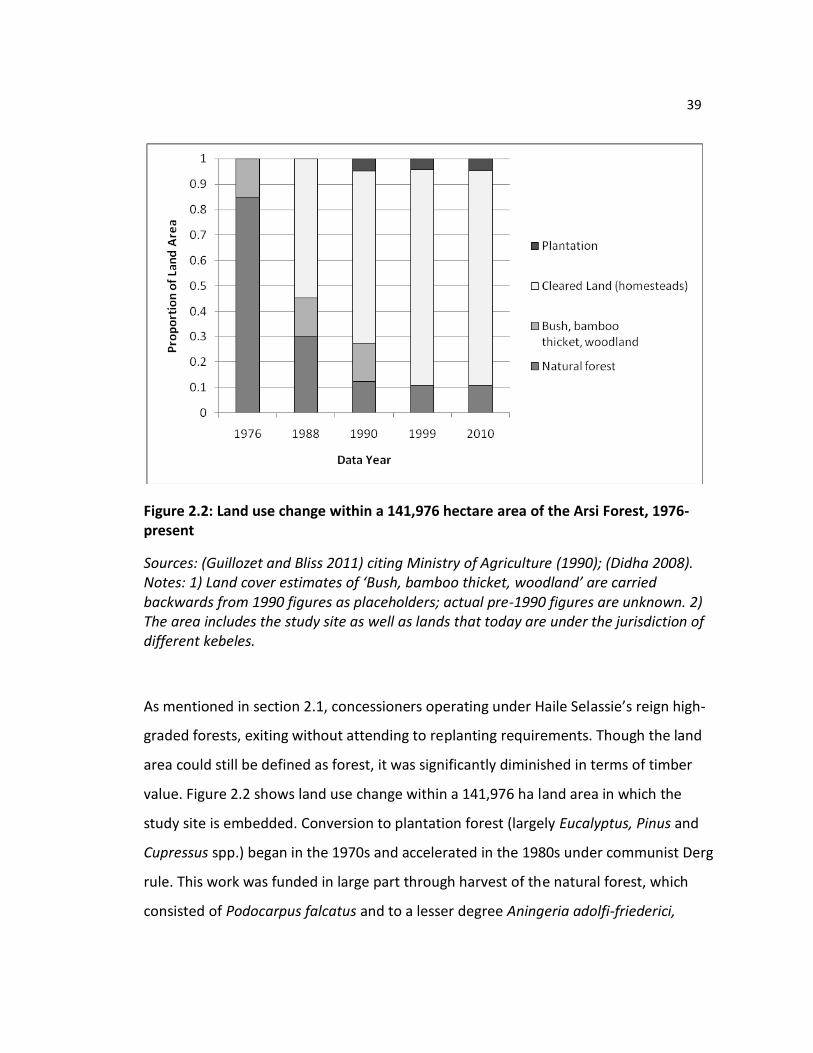
39
Figure 2.2: Land use change within a 141,976 hectare area of the Arsi Forest, 1976-present
Sources: (Guillozet and Bliss 2011) citing Ministry of Agriculture (1990); (Didha 2008). Notes: 1) Land cover estimates of ‘Bush, bamboo thicket, woodland’ are carried backwards from 1990 figures as placeholders; actual pre-1990 figures are unknown. 2) The area includes the study site as well as lands that today are under the jurisdiction of different kebeles.
As mentioned in section 2.1, concessioners operating under Haile Selassie’s reign high-
graded forests, exiting without attending to replanting requirements. Though the land
area could still be defined as forest, it was significantly diminished in terms of timber
value. Figure 2.2 shows land use change within a 141,976 ha land area in which the
study site is embedded. Conversion to plantation forest (largely Eucalyptus, Pinus and
Cupressus spp.) began in the 1970s and accelerated in the 1980s under communist Derg
rule. This work was funded in large part through harvest of the natural forest, which
consisted of Podocarpus falcatus and to a lesser degree Aningeria adolfi-friederici,
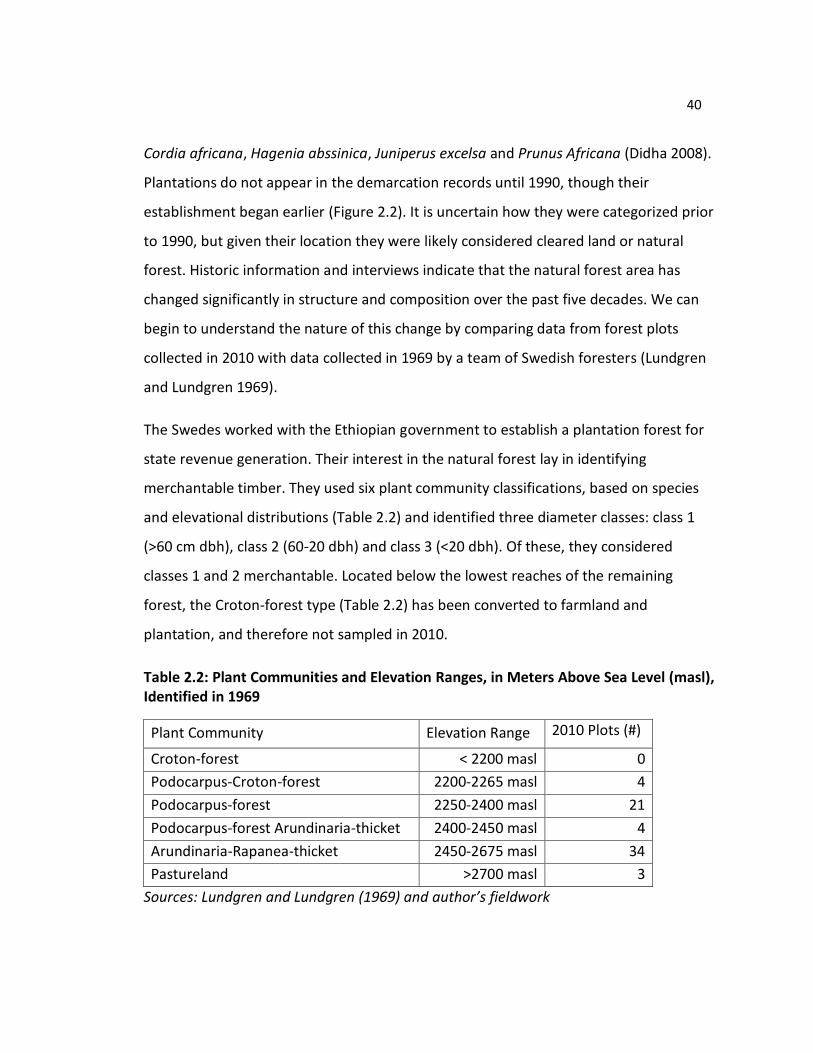
40
Cordia africana, Hagenia abssinica, Juniperus excelsa and Prunus Africana (Didha 2008).
Plantations do not appear in the demarcation records until 1990, though their
establishment began earlier (Figure 2.2). It is uncertain how they were categorized prior
to 1990, but given their location they were likely considered cleared land or natural
forest. Historic information and interviews indicate that the natural forest area has
changed significantly in structure and composition over the past five decades. We can
begin to understand the nature of this change by comparing data from forest plots
collected in 2010 with data collected in 1969 by a team of Swedish foresters (Lundgren
and Lundgren 1969).
The Swedes worked with the Ethiopian government to establish a plantation forest for
state revenue generation. Their interest in the natural forest lay in identifying
merchantable timber. They used six plant community classifications, based on species
and elevational distributions (Table 2.2) and identified three diameter classes: class 1
(>60 cm dbh), class 2 (60-20 dbh) and class 3 (<20 dbh). Of these, they considered
classes 1 and 2 merchantable. Located below the lowest reaches of the remaining
forest, the Croton-forest type (Table 2.2) has been converted to farmland and
plantation, and therefore not sampled in 2010.
Table 2.2: Plant Communities and Elevation Ranges, in Meters Above Sea Level (masl), Identified in 1969
Plant Community Elevation Range 2010 Plots (#)
Croton-forest < 2200 masl 0
Podocarpus-Croton-forest 2200-2265 masl 4
Podocarpus-forest 2250-2400 masl 21
Podocarpus-forest Arundinaria-thicket 2400-2450 masl 4
Arundinaria-Rapanea-thicket 2450-2675 masl 34
Pastureland >2700 masl 3
Sources: Lundgren and Lundgren (1969) and author’s fieldwork
41
Based on data from Lundgren and Lundgren’s 1969 report, I compare mean tree
diameter class distributions by plant community type to 2010 data (Figure 2.2). While I
do not have information about their sampling size and methods, the data are still useful
for descriptive comparison.
Lundgren and Lundgren’s report also contains descriptions of the contribution of
different species to stand basal area (SBA) by diameter class. Because of their interest in
merchantable timber, they only referenced species larger than 20 cm dbh. While there
are significant gaps in the 1969 data, a picture of the change in forest composition
emerges, nonetheless (Figure 2.3). Because the incomplete copy of Lundgren and
Lundgren’s report does not provide comprehensive data on all species present in each
diameter class, species not mentioned are left blank rather than assigned a “zero”.
While one might assume that Lundgren and Lundgren would have mentioned all
valuable species (indicated by an asterisk), this cannot be stated with certainty. Typical
heights in meters are shown, based on estimates by Bekele-Tesemma (2007b). For the
2010 data, all species comprising a minimum of three percent of SBA are listed, as are
valuable species.
The change in trees per hectare (TPH) from 1969 to 2010 is most notable in the Class 1
Podocarpus-Croton forest type, which was completely absent in 2010. The Podocarpus-
Croton forest type was located in closest proximity to the kebele (Peasant Association),
and the large diameter trees located here were accessible to the Forest Enterprise,
informal timber harvesters and fuelwood collectors. The mean number of trees per
hectare (TPH) in diameter class 2 in the Podocarpus-Croton type decreased by 75
percent, from 105 TPH in 1969 to 26 in 2010 (Figure 2.3). Mean TPH across all plant
community types declined by 61 percent in class 1 and 20 percent in class 2.
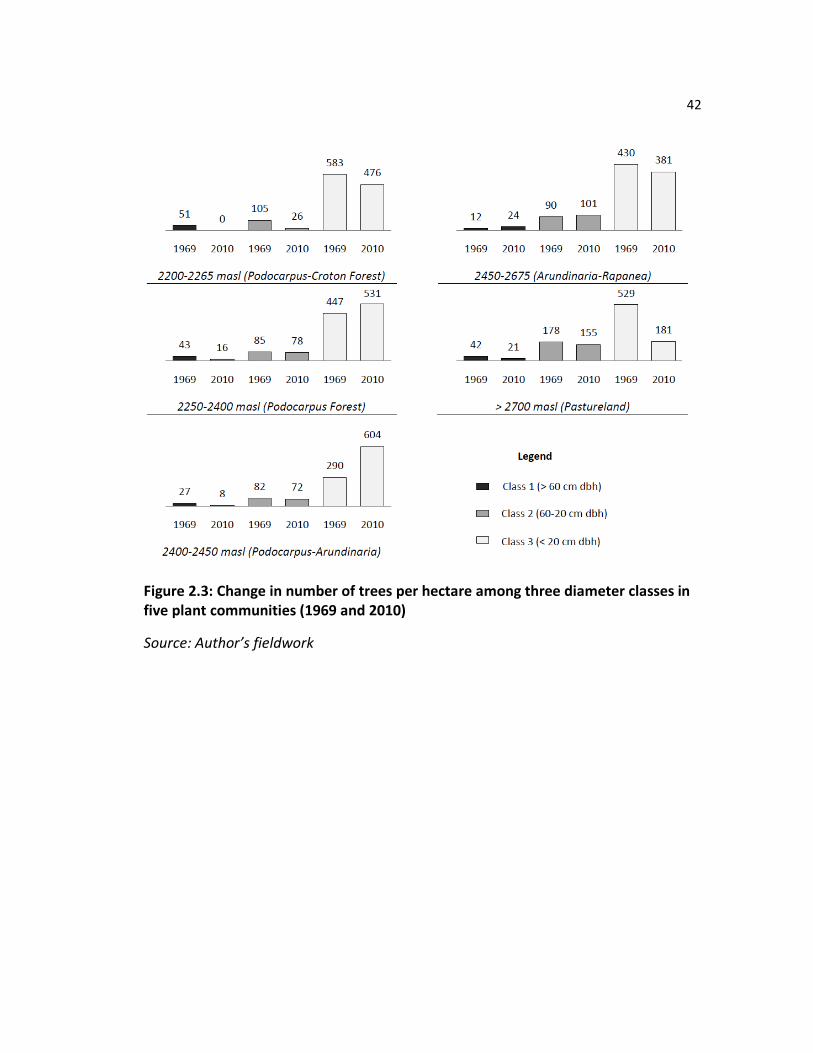
42
Figure 2.3: Change in number of trees per hectare among three diameter classes in five plant communities (1969 and 2010)
Source: Author’s fieldwork
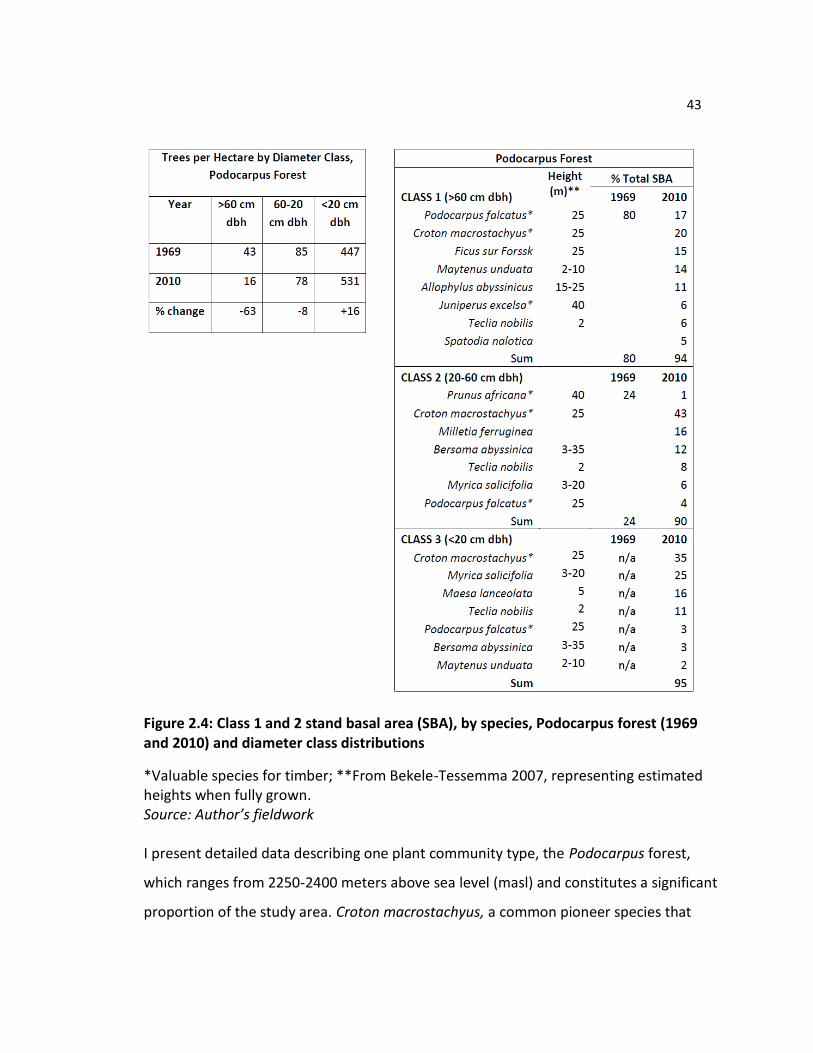
43
Figure 2.4: Class 1 and 2 stand basal area (SBA), by species, Podocarpus forest (1969 and 2010) and diameter class distributions
*Valuable species for timber; **From Bekele-Tessemma 2007, representing estimated heights when fully grown. Source: Author’s fieldwork I present detailed data describing one plant community type, the Podocarpus forest,
which ranges from 2250-2400 meters above sea level (masl) and constitutes a significant
proportion of the study area. Croton macrostachyus, a common pioneer species that
44
grows up to 25 meters tall and can be used for commercial laminates, fuelwood,
beehive construction and fodder, comprised a significant percentage of stand basal area
(SBA) among all diameter classes in 2010 (Figure 2.4). Podocarpus, valued for timber,
has declined by 79 percent since 1969, representing four percent of SBA in diameter
class 2. Prunus Africana, a species valued for its medicinal bark and high-density wood,
has declined in diameter class 2 by 96 percent.
Data describing the percentage of stand basal area by species shows that the
composition and distribution of species in the forest has changed since 1969, exhibiting
a general trend towards smaller stature trees. Over 25 years ago, an assessment
deemed 60% if the total area (17,200ha) as ‘severely disturbed’ and the remainder as
‘slightly disturbed’ (MoA 1990).
Mean TPH decreased for diameter class 1 and class 2 trees in all forest types except the
Podocarpus-Arundinaria forest (Figure 2.3). This exception may be the result of intensive
harvest prior to 1969, which opened the forest for regeneration and augmented the
growth rates of remaining trees. Alternatively, it may simply be too difficult for today’s
informal harvesters, who lack the equipment, resources and political capital held by the
companies that operated in the mid-twentieth century, to remove timber from this
area.
The broad changes in forest composition and diameter class distributions are attributed
to state-driven forest clearing, conversion to farms and tree plantations, sanctioned and
unsanctioned timber harvest for urban consumption, fuelwood collection (Didha 2008),
livestock grazing, trampling and fire suppression (Bussmann 2001). Despite this diversity
of causes, contemporary narratives often attribute loss of forestland simply to the
unregulated actions of local people. This view is even held by the local people
themselves:
45
The whole community regrets the degradation of the natural forest but the reason for it is the unlimited demand of the poor. One household has many children, when they grow, they need a house and more land to farm. They have full knowledge of what they are doing. Students learn about the importance of forests in school, from government officials and public education and training. People compare their lives to those people who have no forest near them and they know the effects of deforestation on rainfall and heat. They are forced by the problem of poverty to transfer the tree into money. They dislike forest degradation and if they have an alternative, they will do it. (135, Community member/farmer).
The above quote highlights a number of key ideas reiterated in other conversations with
community members. These include the following sentiments: 1) we recognize “the
unlimited demand of the poor”, 2) we recognize consequences of deforestation and 3)
we have few alternatives, but would use them if they were available. Local people have
certainly contributed to the changes in forest structure and composition noted over the
past four decades. Livestock grazing, particularly of cattle, inhibits seedling regeneration
and trampling can destroy seedlings. Fuelwood harvest is also significant. However,
some women explained that they targeted their fuelwood collection towards diseased
or dead trees and left smaller diameter trees to grow. As one woman stated, “we have
been protecting the land until now without any guards or payment” (109, fuelwood
collector) referring to the tendency to leave species that provide fodder, such as
Dombeya torridum or medicine, such as Pittosporum viridflorum and Hagenia
abyssinica. This indicates that people also see themselves as stewards managing the
forest to reflect certain goals. This further denotes the role of the forest in offsetting
household vulnerability, and describes how local people are managing it, albeit on a
limited scale, to supplement household resources.
Local people also distinguished between fuelwood collection and timber harvest, the
latter often associated with outsiders from the nearby town of Arsi Negele. One woman
46
described how “we know how to select the trees. We are not the same [as timber
collectors+ we cut the trees they leave” (112, fuelwood collector) referring to branches
and unused parts of trees left by pit sawyers. These comments shed light on the
complex social relations underpinning forest access, and offer a glimpse into how
different forest management scenarios might select for or exclude different interest
groups, with implications for household vulnerability.
Operating in parallel to these forest activities were farm activities. While forest and farm
represent two different land uses, local farming practices relied heavily on forest inputs,
in the form of land, raw materials for building, plow and tool making and fodder. Most
farmland in the area consisted of recently converted forestland that exhibited declining
soil fertility (Tolera et al. 2008), and farmers preferred recently converted fields to state-
identified relocation sites, leading them to return to the forest periphery to farm.
Over time, through a combination of population growth, in-migration and forest
harvest, households have undergone what Feldman and Geisler term “in situ
displacement,” the gradual process of “semi-invisible material deprivation” (Feldman
and Geisler 2011, 4) through which the pool of resources upon which households
depend contracts qualitatively and quantitatively. One farmer described:
Before the present we had wide land and many children. Now the land is less and the cattle is finished. There is no milk now. There are no good cattle, there is no grazing land. When we had grazing land one milk cow was enough for me and my neighbors, [the cow] was eating well and it was enough. In the future thanks to Allah the children are in school. (136, Community member/ farmer)
Animal fodder has similarly declined in quality and availability, leading to reduced milk
production per cow and increasing household dependency on the forest as a source for
fodder. While fertilizers and improved seeds had recently become available, farmers
expressed skepticism that inputs would be supplied on time and at fair prices.
47
Another spatial aspect of household vulnerability revealed at the bioregional scale
includes the lack of livelihood alternatives. This lack of alternatives combined with
resource constraints leads households to invested significant resources in their
children’s education, despite the lack of jobs that await them. As one community
member explained:
I have ten children. This is the challenge of my life. The land is not available for my children or my family for the future. I will send the children to school. They can get government work. For the future that is the best option. By that we can live, if God says. (134, community member/farmer).
Urban unemployment rates for men aged 15-30 hovered around 50 percent in Ethiopia
(Serneels 2004). The government sector has also been contracting, largely in response
to austerity measures imposed by international development agencies and a lack of
government investment in the job creation, leading to fewer opportunities available for
more people (Denu, Tekeste and van der Deij 2005). Women-headed households also
suffered from the lack of livelihood alternatives and were often relegated to fuelwood
collection and sale to support their children, a phenomenon described in greater detail
in the next section.
There have been a number of recent (ca. 2010) discussions in the Arsi Forest Enterprise
about the future of the natural forest area. The United States Agency for International
Development (USAID) is currently (ca. 2011) funding an ecotourism project with a
neighboring community that uses the same forest area. In general, communities located
in forest peripheries may reap benefits in the forms of livelihood diversification and
payments for ecosystem services via these kinds of programs. However, uncertainty
surrounding benefit distribution mechanisms and the effects of new forest access
restrictions on household vulnerability make the net effects of projects unclear.
Modified access arrangements will affect the ability of households to spread risk across
48
space and time. Contemporary livelihoods are shaped by the interplay between local
culture, historical land use and politics, and broader processes of political, economic and
ecological change. These dynamics are all grounded in the material world of farm and
forest, with feedback loops affecting cultural and social relations.
The bioregional aspects of spatial vulnerability presented in this section illustrate a
number of factors relevant to the nature of vulnerability in the case. First, in line with
the politico-historic elements of vulnerability described in the previous section, the
attribution of forest conversion and degradation to the rural poor is misleading. The
state and extra-local elites have played a large role in forest conversion and
compositional change. While this may not functionally affect household vulnerability, it
is important in terms of understanding causality, which can affect policy processes and
public sentiment. Second, evidence from interviews suggests that local people actively
managed the forest through targeted fuelwood harvest in response to other signals
such as declining grazing land availability. While the forest was highly degraded and
much of this harvest was technically illegal, local users still recognized it as an important
resource and tended to preserve fodder-producing, culturally important and medicinal
species. These forest products, though locally important, are easily overlooked by
natural resource managers and planners who see the forest as degraded and in need of
new forms of management. Careful attention should be paid to understanding
contemporary values and how they might be affected by new management regimes.
Third, in the face of declining resource availability, households actively shift their
investments towards the education of their children, a trend described in greater detail
in section 4.3. This is important for understanding household risk perception and
planning for the future and also in understanding farm-related decision making and
investment.
49
2.4.3 Livelihood aspects of vulnerability at the household scale
In this section, data from a household livelihood survey conducted in 2010 describe
household production, consumption and expenditure patterns among different wealth
groups in the community under study, revealing a number of trends that emerged in the
previous sections.
The livelihood survey was adapted from a livelihood baseline questionnaire developed
and used by the USAID Famine Early Warning System (2007). I used a stratified random
sampling design (n=28) based on wealth status (very poor, poor, medium and better
off). A group of local leaders participated in the wealth ranking exercise of all
households, which informed the wealth status stratification in the community, using an
approach described by Laderchi (2005).
The USAID FEWS Livelihood Baseline survey was designed to produce a quantifiable
description of household food production, income and expenditures over a 12-month
period. This reliance upon respondent recall of production, income and expenditures is
therefore subject to error, and production, income and expenditure figures are
estimates. The survey instrument was designed to reveal a snapshot in time, and
therefore does not capture important nuances relevant to variables including a host of
factors ranging from individual nutrition and long term economic development.
The study site is located on the eastern edge of what USAID terms the Arsi Bale Wheat,
Potato and Barley (ABW) Livelihood Zone (Map 2.1). Primary economic activities in this
livelihood zone include crop (wheat, barley, potatoes, pulses, maize) and livestock
(cattle, sheep and horse) production. Variations in wealth status are determined largely
by landholdings and the amounts of crops and livestock produced.
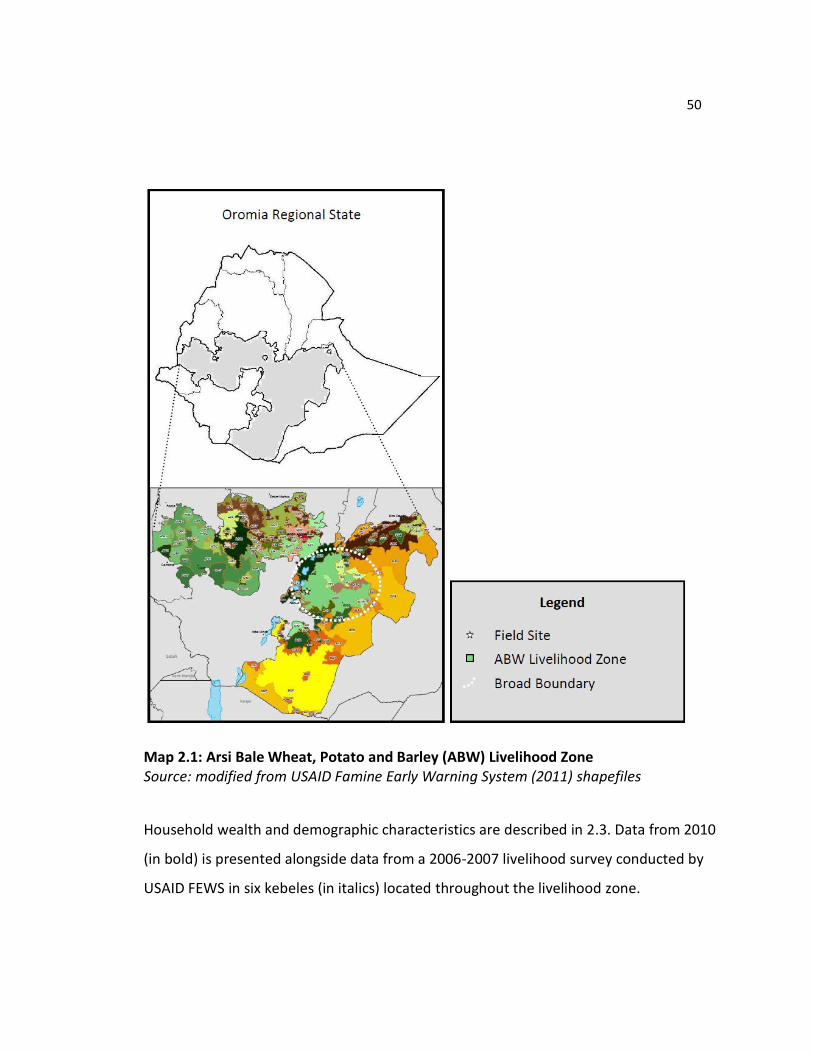
50
Map 2.1: Arsi Bale Wheat, Potato and Barley (ABW) Livelihood Zone Source: modified from USAID Famine Early Warning System (2011) shapefiles
Household wealth and demographic characteristics are described in 2.3. Data from 2010
(in bold) is presented alongside data from a 2006-2007 livelihood survey conducted by
USAID FEWS in six kebeles (in italics) located throughout the livelihood zone.
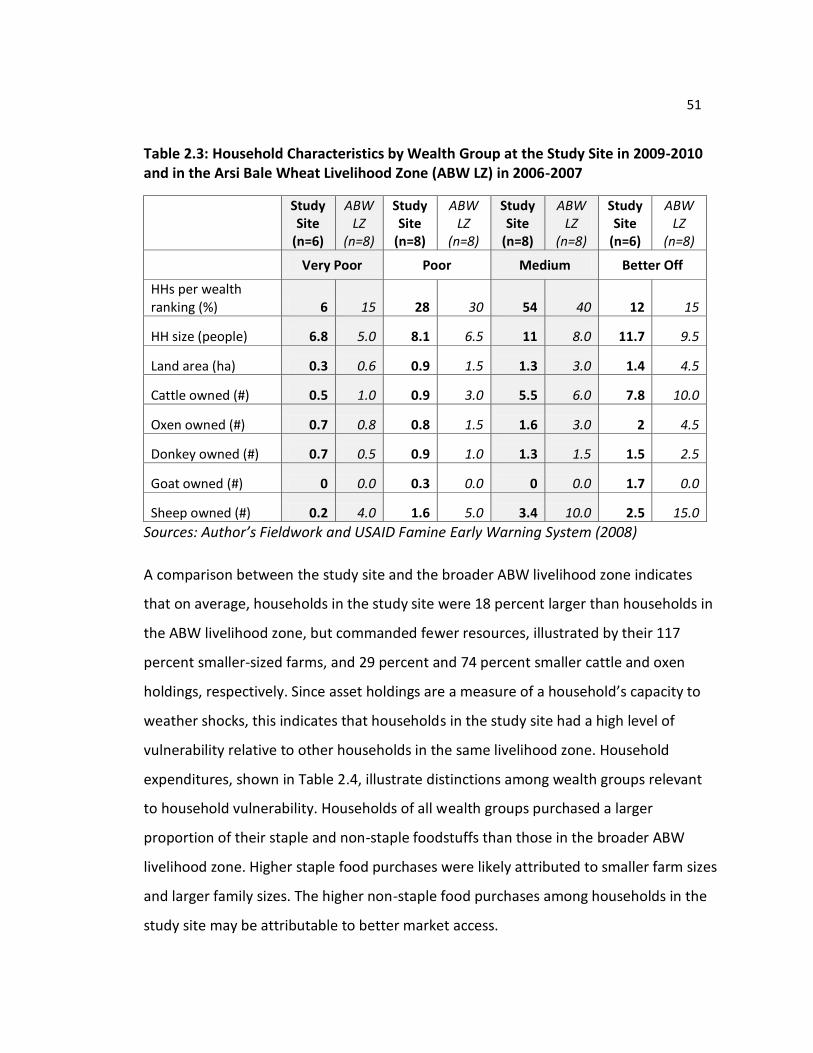
51
Table 2.3: Household Characteristics by Wealth Group at the Study Site in 2009-2010 and in the Arsi Bale Wheat Livelihood Zone (ABW LZ) in 2006-2007
Study Site
(n=6)
ABW LZ
(n=8)
Study Site
(n=8)
ABW LZ
(n=8)
Study Site
(n=8)
ABW LZ
(n=8)
Study Site
(n=6)
ABW LZ
(n=8)
Very Poor Poor Medium Better Off
HHs per wealth ranking (%) 6 15 28 30 54 40 12 15
HH size (people) 6.8 5.0 8.1 6.5 11 8.0 11.7 9.5
Land area (ha) 0.3 0.6 0.9 1.5 1.3 3.0 1.4 4.5
Cattle owned (#) 0.5 1.0 0.9 3.0 5.5 6.0 7.8 10.0
Oxen owned (#) 0.7 0.8 0.8 1.5 1.6 3.0 2 4.5
Donkey owned (#) 0.7 0.5 0.9 1.0 1.3 1.5 1.5 2.5
Goat owned (#) 0 0.0 0.3 0.0 0 0.0 1.7 0.0
Sheep owned (#) 0.2 4.0 1.6 5.0 3.4 10.0 2.5 15.0
Sources: Author’s Fieldwork and USAID Famine Early Warning System (2008)
A comparison between the study site and the broader ABW livelihood zone indicates
that on average, households in the study site were 18 percent larger than households in
the ABW livelihood zone, but commanded fewer resources, illustrated by their 117
percent smaller-sized farms, and 29 percent and 74 percent smaller cattle and oxen
holdings, respectively. Since asset holdings are a measure of a household’s capacity to
weather shocks, this indicates that households in the study site had a high level of
vulnerability relative to other households in the same livelihood zone. Household
expenditures, shown in Table 2.4, illustrate distinctions among wealth groups relevant
to household vulnerability. Households of all wealth groups purchased a larger
proportion of their staple and non-staple foodstuffs than those in the broader ABW
livelihood zone. Higher staple food purchases were likely attributed to smaller farm sizes
and larger family sizes. The higher non-staple food purchases among households in the
study site may be attributable to better market access.
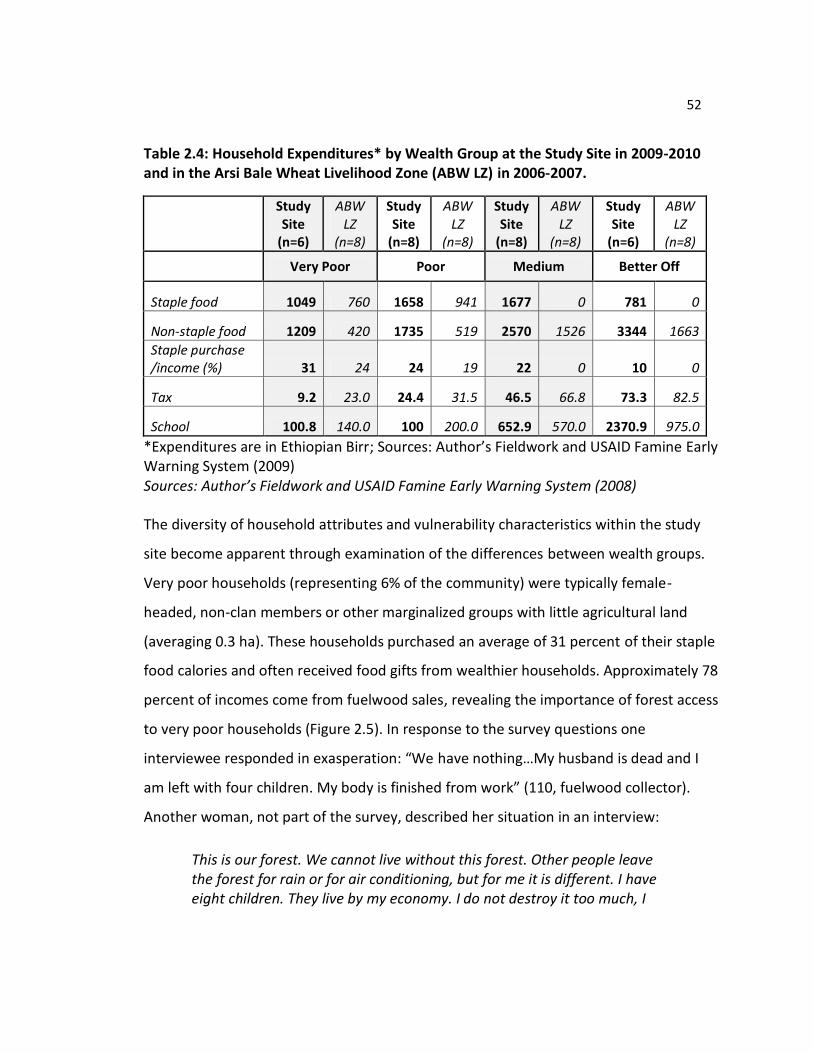
52
Table 2.4: Household Expenditures* by Wealth Group at the Study Site in 2009-2010 and in the Arsi Bale Wheat Livelihood Zone (ABW LZ) in 2006-2007.
Study Site
(n=6)
ABW LZ
(n=8)
Study Site
(n=8)
ABW LZ
(n=8)
Study Site
(n=8)
ABW LZ
(n=8)
Study Site
(n=6)
ABW LZ
(n=8)
Very Poor Poor Medium Better Off
Staple food 1049 760 1658 941 1677 0 781 0
Non-staple food 1209 420 1735 519 2570 1526 3344 1663
Staple purchase /income (%) 31 24 24 19 22 0 10 0
Tax 9.2 23.0 24.4 31.5 46.5 66.8 73.3 82.5
School 100.8 140.0 100 200.0 652.9 570.0 2370.9 975.0
*Expenditures are in Ethiopian Birr; Sources: Author’s Fieldwork and USAID Famine Early Warning System (2009) Sources: Author’s Fieldwork and USAID Famine Early Warning System (2008) The diversity of household attributes and vulnerability characteristics within the study
site become apparent through examination of the differences between wealth groups.
Very poor households (representing 6% of the community) were typically female-
headed, non-clan members or other marginalized groups with little agricultural land
(averaging 0.3 ha). These households purchased an average of 31 percent of their staple
food calories and often received food gifts from wealthier households. Approximately 78
percent of incomes come from fuelwood sales, revealing the importance of forest access
to very poor households (Figure 2.5). In response to the survey questions one
interviewee responded in exasperation: “We have nothing…My husband is dead and I
am left with four children. My body is finished from work” (110, fuelwood collector).
Another woman, not part of the survey, described her situation in an interview:
This is our forest. We cannot live without this forest. Other people leave the forest for rain or for air conditioning, but for me it is different. I have eight children. They live by my economy. I do not destroy it too much, I
53
keep it like a guard…my husband is lazy. We have less than 0.25 hectares. He was not born here and lost his land. (112, fuelwood collector)
She alluded to government sponsored education programs that taught people about the
effects of forests on freshwater resources and temperature moderation and
distinguished herself from those who can afford to make alternative livelihood choices.
Clan outsiders have reduced leverage in local level decision-making over land
allocations, underscoring relationships between social standing, resource access and
vulnerability.
Poor households (representing 28% of the community) were often unable to produce
enough food for the entire year due to insufficient landholdings and a lack of storage
capacity. These households typically purchased food in the lean time prior to harvest
when prices were highest. Their livestock assets were marginal. These households have
suffered most from the declining farm labor needs of wealthier households, whose
labor demands have fallen off as landholdings have decreased and household sizes have
increased. Very few households of any wealth status ate meat more than once per year.
One man declared that: “When we eat meat, we are poor” (134, community member,
farmer) indicating the toll meat consumption takes on livestock assets and the fact that,
outside of Ramadan, households typically only ate meat when an animal died.
Medium wealth households (representing 54% of the community) also lacked quality
storage capacity and replenished staple foods when prices were highest. These
households typically provided all labor for farm production. When asked whether he
used daily labor, one respondent laughed, “yes, I am a daily laborer for myself!” (137,
community member/farmer). Mean fuelwood sales for these households (2660 ETB)
were nearly equivalent to mean crop sales (2863 ETB). Ekubs, a form of traditional
cooperatives, were particularly important to women in medium-wealth households.
Through ekubs, small self-organized groups of women made monthly or weekly
54
contributions to a revolving fund that each woman received in turn. Women typically
met payment obligations through the collection and sale of fuelwood and commonly
used their funds to purchase a sheep or goat for fattening and resale, underscoring the
importance of forests to medium-wealth household economies.
Better-off households (12% of the community) had mean landholdings marginally larger
than medium-ranked households, but they typically owned higher quality land and
could invest capital in wheat production, which typically yielded higher profit margins
than maize or potatoes. Better-off households also typically had steel roofs that
enhanced storage capacity. These households could purchase supplementary maize
when prices were lowest and store it for consumption or resale during the lean seasons.
Still, even those better off households expressed frustration over declines in livestock
holdings and in the overall quality of food. One woman stated that “our milk is coffee”
(138, community member, housewife), referring to the fact that in the past her family
drank milk on its own, but now there is only enough to flavor coffee. Fuelwood sales
among better-off households contributed the least to incomes of any wealth group in
absolute and relative terms, though it still served as a significant source of income
(Figure 2.5). Wealthy households hired daily seasonal labor, but in lesser amounts
compared to other households in the ABW livelihood zone. While household size had a
partial leveling effect on the income increases felt as households move from very poor
to better-off, better-off households were able to leverage the timing of purchases both
to take advantage of cheaper food prices and to purchase inputs. Educational
expenditures were significant among better-off households, with most households
sending students to high school and, in some cases, college. By comparison, households
in the broader ABW livelihood zone spent 273 percent less on education (Table 2.4),
perhaps due to the proximity of the study site to high schools. It was also likely due to
the perception that farm livelihoods would not be feasible for most children, given land
and resource constraints.
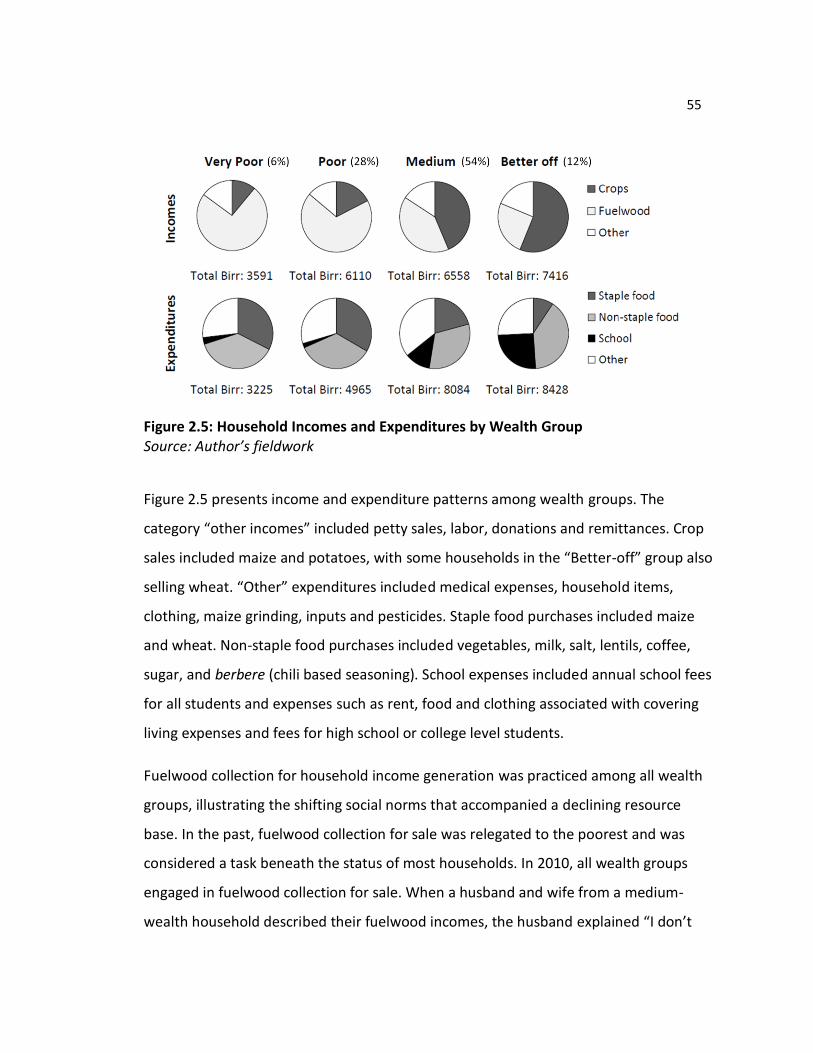
55
Figure 2.5: Household Incomes and Expenditures by Wealth Group Source: Author’s fieldwork
Figure 2.5 presents income and expenditure patterns among wealth groups. The
category “other incomes” included petty sales, labor, donations and remittances. Crop
sales included maize and potatoes, with some households in the “Better-off” group also
selling wheat. “Other” expenditures included medical expenses, household items,
clothing, maize grinding, inputs and pesticides. Staple food purchases included maize
and wheat. Non-staple food purchases included vegetables, milk, salt, lentils, coffee,
sugar, and berbere (chili based seasoning). School expenses included annual school fees
for all students and expenses such as rent, food and clothing associated with covering
living expenses and fees for high school or college level students.
Fuelwood collection for household income generation was practiced among all wealth
groups, illustrating the shifting social norms that accompanied a declining resource
base. In the past, fuelwood collection for sale was relegated to the poorest and was
considered a task beneath the status of most households. In 2010, all wealth groups
engaged in fuelwood collection for sale. When a husband and wife from a medium-
wealth household described their fuelwood incomes, the husband explained “I don’t
56
drink, I don’t use chaat [Catha edulis], I only use fuelwood for income” (137, community
member/farmer) in reference to the association of fuelwood incomes with
disenfranchisement and socially unacceptable behaviors.
Families respond to limited resources livelihood options in part by investing in the
education of their children, though professional jobs are limited, urban unemployment
is high and the public sector is shrinking. Non-professional off-farm employment rarely
provided surplus income, as one woman described: “I have one son in floriculture in
Ziway, but we don’t wait for his hand” (139, community member/housewife).
Elements of vulnerability at the household scale become apparent through a more
nuanced understanding of forest incomes. Fuelwood incomes are important for all
households. Marginalized households depend on fuelwood collection in the absence of
livelihood alternatives and limited land. Women in medium-wealth households leverage
fuelwood incomes through informal investment groups to generate more revenue for
household expenses. Wealthy households depend on fuelwood incomes to subsidize
educational expenses. Social norms surrounding fuelwood collection have shifted with
changing livelihood opportunities, growing more acceptable as resources become
increasingly limited.
2.5 Discussion
Brace and Geohegan’s (2011) characterization of climate change, as a “relational
phenomenon that needs to be understood on a local level, attending to its distinctive
spatialities and temporalities” (297) also serves as an apt descriptor of vulnerability.
While the data presented in this chapter reflect different scales and methodological
approaches, similar themes emerge. These themes hint at what Lefebvre terms the
“truth of space”, and can inform a process-based understanding of vulnerability. In the
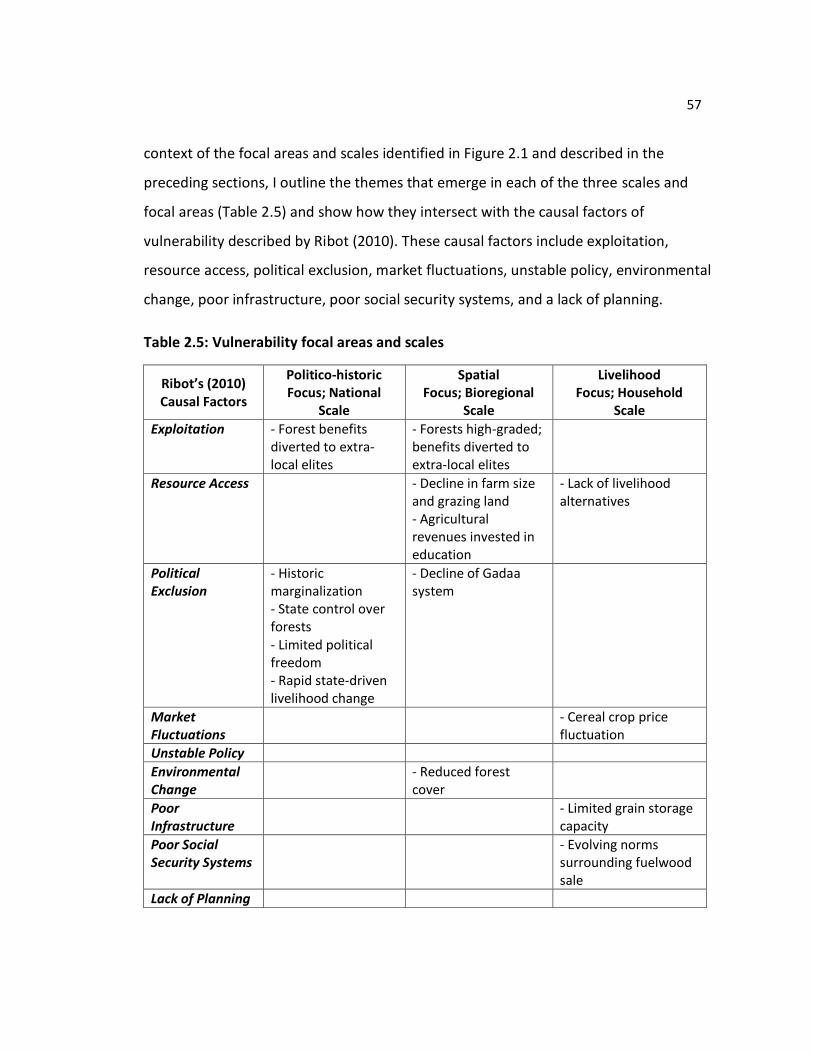
57
context of the focal areas and scales identified in Figure 2.1 and described in the
preceding sections, I outline the themes that emerge in each of the three scales and
focal areas (Table 2.5) and show how they intersect with the causal factors of
vulnerability described by Ribot (2010). These causal factors include exploitation,
resource access, political exclusion, market fluctuations, unstable policy, environmental
change, poor infrastructure, poor social security systems, and a lack of planning.
Table 2.5: Vulnerability focal areas and scales
Ribot’s (2010) Causal Factors
Politico-historic Focus; National
Scale
Spatial Focus; Bioregional
Scale
Livelihood Focus; Household
Scale
Exploitation - Forest benefits diverted to extra-local elites
- Forests high-graded; benefits diverted to extra-local elites
Resource Access - Decline in farm size and grazing land - Agricultural revenues invested in education
- Lack of livelihood alternatives
Political Exclusion
- Historic marginalization - State control over forests - Limited political freedom - Rapid state-driven livelihood change
- Decline of Gadaa system
Market Fluctuations
- Cereal crop price fluctuation
Unstable Policy
Environmental Change
- Reduced forest cover
Poor Infrastructure
- Limited grain storage capacity
Poor Social Security Systems
- Evolving norms surrounding fuelwood sale
Lack of Planning
58
The evidence presented in this case does not provide a definitive overview of all issues
of importance to all people in the community under study, but rather serves as a means
to identify active areas of vulnerability production. Many of the themes identified could
be housed under additional causal factors. For example, evolving norms surrounding
fuelwood sale are related to resource access and exploitation concerns. Others themes
are related to multiple processes, such as reduced forest cover, which reflects
environmental change as well as resource access and political exclusion. Unstable policy
and lack of planning did not emerge as active areas of vulnerability production in the
case. However, this is subject to change as policies, institutions and power relations
change, and as additional research highlights dynamics across new scales and focal
areas.
Predominant active areas of vulnerability production in the case include exploitation,
resource access and political exclusion (Table 2.5). Policymakers working to address
vulnerability concerns among communities at Ethiopia’s forest periphery will want to
consider how proposed changes address these three processes in particular.
Vulnerability is the outcome of social relations and resource access that operate across
multiple scales, often in a non-linear fashion. While the mechanisms of vulnerability
creation are location-specific and grounded in particular social, political, economic and
ecological realities, vulnerability is the outcome of processes of exclusion and access
that operate at many scales. This approach to understanding scalar aspects of
vulnerability can help researchers and policymakers move beyond confining narratives
to address the social, economic and ecological factors that create and perpetuate
vulnerability.
59
Chapter 3 - Household Livelihoods and Increasing Foreign Investment Pressure in Ethiopia’s Natural Forests
Kathleen Guillozet and John Bliss
60
3.1 Introduction
The Ethiopian government expressed renewed interest in attracting foreign investment
to the nation’s forestry sector through its Forest Development, Conservation and
Utilization Proclamation (Proclamation No. 542/2007). However, limited capacity to
manage administrative and regulatory elements of foreign investments, pervasive
tenure uncertainty and rural livelihood insecurity all point to the need for caution as the
government proceeds with land deals involving forests. This paper aims to clarify
discussions relating to foreign investment in Ethiopia’s forests by describing the nature
of these investments and outlining the challenges and opportunities associated with
implementing them. First, I describe issues relevant to foreign investment in forests
throughout Ethiopia. Second, I outline characteristics of households at the farm-forest
interface who are likely to be directly affected by new investments. Third, I use evidence
from a case study of a highland community located at the forest-farm interface to
highlight competing forest access claims in a specific context and outline
recommendations for addressing them.
Recent publications on agricultural land grabbing (e.g. Cotula et al. 2009; Rice 2009;
Daniel and Mittal 2010) have raised the visibility of concerns over equity and social
justice issues associated with contemporary foreign investments in natural resources in
the global South. Ethiopia’s economy is firmly grounded in the agricultural sector, with
an estimated 83 percent of the population engaged in agricultural livelihoods. The
government’s formal economic development approach, termed Agricultural
Development Led Industrialisation (ADLI), highlights the central position of agriculture in
economic planning and prioritization and heightens the significance of investments in
the country’s productive land base.
61
Foreign investments in the forestry sector are distinct from agricultural investments that
affect forests. The latter include forest clearing for farm establishment, a practice with a
decades-long history driven by a range of government policies affecting land use,
resettlement and investment incentives. Forest clearing for agricultural establishment is
a common practice in both highland and lowland regions of Ethiopia. In most
contemporary cases, forests are cleared with the use of fire, leaving forest products
largely unexploited (see, for example, the case of Bale Mountain described by Teshome,
Kinahan, and Randall 2010). The clearing of dryland deciduous woodlands for cash crop
production (primarily sesame, sugarcane and cotton) occurs frequently in lowland areas.
The prevalence of land conversion in the lowlands is linked to the resettlement of
highland agriculturalists into traditionally pastoral areas (Lemenih, Feleke, and Tadesse
2007) and to a climate of loosely regulated natural resource exploitation and weak
government influence in remote areas (140, scientist). Contemporary highland forest
clearing is typically the result of forest encroachment for agricultural expansion
including tea and coffee cultivation by both large-scale investors and rural people
(Reusing 2000; Agribusiness 2004). These actions are also affected by external markets
and government policies.
3.2 Processes driving forest investment in Ethiopia
Researchers commonly identify land and water scarcity as a primary driver of foreign
investment in the global South (e.g. Rice 2009; Deininger, Byerlee et al. 2011). Zoomers
(2010) emphasizes additional contemporary processes including increased foreign
demand for non-food crops (especially biofuels), conservation, tourism and land
purchases by retirees and Diaspora. In Ethiopia, investment trends affecting forests
reflect historic relations between governments, elites and international institutions
surrounding control over natural resource benefits.
62
An estimated 3.6 to 4.5 million hectares of land is currently available for commercial
investment in Ethiopia, some 1.2 million hectares of which is located in the Oromia
Regional State (Horne 2011). Foreign investors in Oromia, who are primarily from the
Gulf States and India, are mainly producing flowers, Jatropha species, oilseeds and
sugarcane on lowland concessions (ibid).
3.2.1 Narratives of under-exploitation and overexploitation
Ethiopian forestlands have long been characterized as under-exploited areas in need of
economic development or as overexploited areas in need of conservation-oriented
management. Over the past few decades, calls for increased foreign investment in
agricultural practices that involve forest clearing (under-exploitation) have paralleled
clearly articulated plans to halt deforestation and land degradation (overexploitation),
creating conflicting policy recommendations. This conflict is illustrated in the two quotes
juxtaposed below. The first is from a report issued by a United Nations Emergencies Unit
for Ethiopia (UNEUE) field officer commenting on strategies for incentivizing agricultural
investment by Ethiopian citizens returning after the fall of the Derg regime.
Land allocations for investment purposes is ongoing but government authorities need to be encouraged to move investors to hinterland areas and allocate the land located near the villages to returnees. This may require compensation to investors for clearing and infrastructure facility development (Shank 1994, 2).
The second quote is taken from the Ethiopian National Action Programme to Combat
Desertification, drafted in conjunction with a separate United Nations body, the
Convention to Combat Desertification (UNCCD).
The policy provisions contained in this draft…encourage the development of forests by individuals, organizations and government and the designation of protected forests and productive forests to be administered in accordance with laws to be enacted for each. The draft stresses the need to give security of ownership of forest
63
products to the developer and the importance of protecting every kind of forest from natural and man-made destruction (FDRE 1998, 62).
These quotes illustrate the lack of integration between forest conservation and market
liberalization that confound efforts to develop transparent and equitable strategies for
natural resource-based economic development. They also mirror patterns identified in
relationships between the state and private enterprise in peripheral resource-rich areas
throughout the world that have led to forest benefit divestment from rural people to
outside elites (Scott 1998; Scott 2009; Rudel 2007; Lunstrum 2009). Cursory references
to laws governing rights and restrictions over forest use like those mentioned in the
second quote are sufficient to propel processes forward, allowing forest benefits to be
extracted before specific rights, restrictions and responsibilities are articulated. The
often multi-decadal planning timelines that characterise forest management
endeavours compound challenges associated with ensuring that investors abide social
and ecological protections.
The absence of clear institutional authority and communication between agencies
further hampers transparency in forest management. For example, foreign investors
work primarily with the Ethiopian Investment Authority in establishing their business
operations, while government forestry specialists are housed in the Forestry Research
Centre, a subdivision of the Ministry of Agriculture. Forestry is marginalized by the
current government as evidenced by budgetary allocations. In 2010, these amounted to
approximately 6 million Ethiopian birr (£226,110) to the Forestry Research Centre, as
compared to the 90 million Ethiopian birr (£3,391,792) allocated to Agriculture. This
difference may be attributed to the political importance of agriculture. Annual crop
production figures are closely monitored, especially in election years, and high
production is associated with political success, compelling officials to use the means at
64
their disposal to favor agricultural output, sometimes at the expense of other land uses
like forestry or livestock grazing.
Forestry-based emissions reduction programs are approved and managed through a
different government office, the Environmental Protection Authority. Jurisdictional
separations make it difficult to identify and monitor investments that affect forests.
While forest investors must submit a Forest Management Plan to the Ministry of
Agriculture as part of their application process, only those projects that fall within the
forestry sector require these approvals. Agricultural projects that involve forest clearing
are seldom reviewed by forestry officials.
Integration across agencies is further hampered by financial benefits that are granted to
those who succeed in attracting foreign investors. Regional actors have incentive to
attract and retain foreign investors to their districts because it allows them to compete
more effectively for scarce regional development funds for infrastructure improvements
that bring status and additional economic development opportunities (142, government
worker). There exist a number of financially unattractive aspects of forest sector
investment in Ethiopia, but foreign investors are perceived as having securer rights in
comparison to domestic investors, giving them a comparative advantage:
There is unwillingness on the behalf of domestic investors to invest in forest resources for a number of reasons: length of time for return on investment, insecure land tenure, disputes with local people, problems in the courts because judges and police are subject to bribes. [Foreign investors are less vulnerable to these problems because] their interests are more visible (140, scientist).
Challenges associated with routine bribing of officials were also mentioned in
conversations with community members. The effects of foreign investors on these
dynamics are uncertain. On the one hand, foreign investors could bring about increased
transparency in enforcement and on the other they could aggravate the climate of
65
corruption if they participate in bribes. In the next section I outline additional challenges
and opportunities related to foreign investment in forests.
3.2.2 Forest Investment Challenges and Opportunities
Formally recognized private foreign investment in Ethiopia’s forestry sector, defined
here as activities involving afforestation, reforestation, and non-timber forest product
market development, is currently limited. Of the handful of foreigners who made
inquiries about investment opportunities to a government forestry official over the past
few years, only one was moving forward with developing a business plan and securing
appropriate permissions (141, government official). Concerns about feasibility, human
resources, security of long-term lease arrangements and perceptions of political
instability are commonly raised by foreign investors. The lack of investment is rooted in
ecological, socio-economic and institutional challenges outlined briefly below (Table 3.1)
and expanded upon in section 4. These challenges combine to create a climate of
uncertainty surrounding forest investment that favours illegal conversion of forested
lands to agriculture by government actors, large-scale investors and rural people,
threatening the livelihoods of households living at the forest-farm interface and limiting
future afforestation and reforestation possibilities.
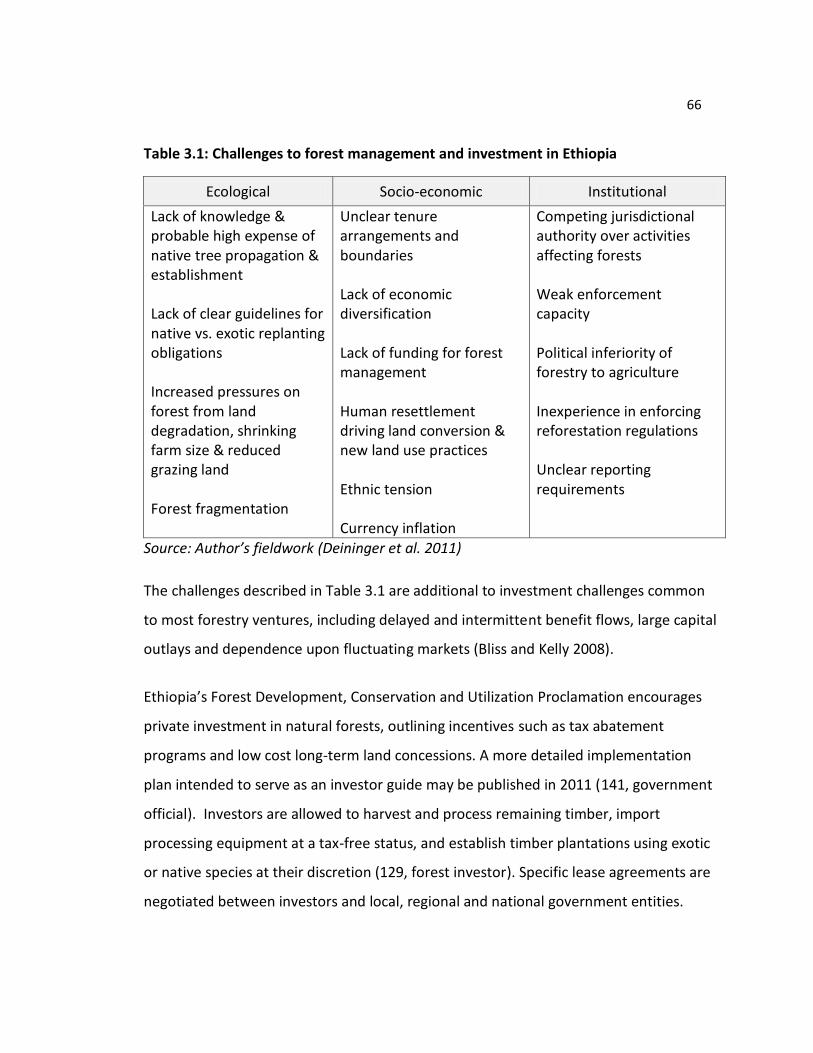
66
Table 3.1: Challenges to forest management and investment in Ethiopia
Ecological Socio-economic Institutional
Lack of knowledge & probable high expense of native tree propagation & establishment Lack of clear guidelines for native vs. exotic replanting obligations Increased pressures on forest from land degradation, shrinking farm size & reduced grazing land Forest fragmentation
Unclear tenure arrangements and boundaries Lack of economic diversification Lack of funding for forest management Human resettlement driving land conversion & new land use practices Ethnic tension Currency inflation
Competing jurisdictional authority over activities affecting forests Weak enforcement capacity Political inferiority of forestry to agriculture Inexperience in enforcing reforestation regulations Unclear reporting requirements
Source: Author’s fieldwork (Deininger et al. 2011)
The challenges described in Table 3.1 are additional to investment challenges common
to most forestry ventures, including delayed and intermittent benefit flows, large capital
outlays and dependence upon fluctuating markets (Bliss and Kelly 2008).
Ethiopia’s Forest Development, Conservation and Utilization Proclamation encourages
private investment in natural forests, outlining incentives such as tax abatement
programs and low cost long-term land concessions. A more detailed implementation
plan intended to serve as an investor guide may be published in 2011 (141, government
official). Investors are allowed to harvest and process remaining timber, import
processing equipment at a tax-free status, and establish timber plantations using exotic
or native species at their discretion (129, forest investor). Specific lease agreements are
negotiated between investors and local, regional and national government entities.
67
Some scientists envision increased foreign and domestic investment in Ethiopia’s
forestlands as a means to alleviate rural poverty and enhance forest ecosystem
protection and function (Bongers and Tennigkeit 2010). The high demand for wood
products in Ethiopia and neighbouring East African countries may justify increased
investment in the forestry sector (Bekele-Tesemma 2007a), but conditions described in
Table 3.1 have stifled investor confidence.
While a number of the challenges outlined above weigh heavily in the decision making
processes of foreign investors, others may not enter into typical cost-benefit analyses.
Project impacts that are perhaps least likely to be understood or acknowledged by
investors pertain to the rights of rural residents. The invocation of under-exploitation
and overexploitation narratives to describe forest utilization legitimizes foreign entry
into these markets, a point I return to later in the paper. Evidence from the agricultural
sector underscores three additional concerns pertaining to the broad affects of foreign
investor presence on forests and forest-dependent communities:
1. Aside from low-skilled and low-waged jobs, foreign investment may not yield many direct benefits to the rural poor and may leave the poorest more vulnerable (Melese and Helmsing 2010). A recent global assessment of the impacts of conservation programs on poverty found that timber harvest rarely benefits the poor, and non-timber forest product programs have low impacts in terms of poverty reduction (Leisher et al. 2010).
2. Forced human resettlement remains an issue of concern (Hammond 2008). It affects relationships between people within communities, land use practices and socio-political mobilization.
3. Inadequate domestic markets for agricultural inputs, outputs and financial services, which may be the most important limiting factors to smallholder income growth, are not necessarily improved by the entrance of large-scale investors into a sector (Hazell et al. 2010).
68
Increased foreign investment is associated with economic development and poverty
alleviation by many economists, development agencies and governments (Haile and
Assefa 2006). The rationale that it will “contribute significantly to development-through
the injection of capital, technology, management know-how and market access”
(UNCTAD 2000) may not hold true for most rural people, particularly given the
constraints surrounding free expression and market access (HRW 2010). In the following
sections I elaborate upon the potential implications of increased foreign investment for
rural livelihoods.
3.3 Communities at the Forest-Farm Interface
The forest-farm interface is the locus of investment attention in highland forests. This
area is home to rural households with unique livelihood characteristics and benefit
claims to forest resources that distinguish them from other agricultural households.
3.3.1 The forest-farm interface
The forest-farm interface is characterized by ecological, social and economic change.
Defined here as the zone within or near forests occupied by smallholder farmers, the
forest-farm interface is historically remote from markets and typically difficult to access
(Fisher and Hirsch 2008). It often includes both ambiguous lands, or lands cultivated by
people who do not have official use rights (Sato 2000), and legally cultivated lands.
Households located within Ethiopia’s forest-farm interface tend to be highly dependent
upon forest resources for fuelwood, livestock grazing and building materials (Mamo,
Sjaastad et al. 2007; Yemiru, Roos et al. 2010). I focus attention on these households
because they are at the greatest risk of livelihood loss under foreign investment in
highland forests.
69
Undisturbed highland forests represent a small fraction of remaining highland forests,
estimated at 0.2 percent of the land area in the late 1990s (Reusing 1998). National
Forest Priority Areas (NFPAs) were established in the late 1980s (Cheng et al. 1989)
giving the government control over the bulk of the remaining natural forest stands,
most of which are found in remote parts of the Gambella and Oromia regional states
(Reusing 2000). Natural forests are managed by the government through a system of 58
NFPAs. Thirteen of these are managed under integrated forest management systems
involving local communities. While most remaining forestlands are located within
NFPAs, less than 10 percent of state forest boundaries have been officially mapped
(Bank 2010), and boundary demarcation can be fraught with conflict.
According to an official in Ethiopia’s Forestry Research Centre (FRC), investment will be
directed towards ‘abandoned lands’ and places ‘where forests are being cleared or
encroached’ (141, government official). This statement references the dual narratives of
under-exploitation and overexploitation that are infused throughout discussions on
natural resource management in Ethiopia. It also summarizes government rationales for
land seizure in the lowlands and the highlands. Lands termed ‘abandoned’ are located
mainly in the lowlands, where pastoral livelihoods predominate. Widespread use of land
for seasonal grazing and shifting cultivation makes the categorizing of land as
‘abandoned’ questionable (Vermeulen and Cotula 2010; Cotula et al. 2009). Diffuse
infrastructure and institutional influence in the lowlands exist in contrast to the more
concentrated settlement and strong political networks found in the highlands. Here,
processes of dispossession centre on claims that people are encroaching rather than
that land is unused. Uncertainty over forest boundaries and the infusion of Northern
conservation values creates the political space necessary for the government to remove
encroaching farmers, thereby opening land for alternative uses.
70
3.3.2 Land Tenure
Land privatization is a topic of considerable dispute in Ethiopia (Crewett and Korf 2008;
Ali, Dercon, and Gautam 2011). The government owns all forest and agricultural land,
granting usufruct rights to citizens in the case of farmland and maintaining all
management authority in the case of forestlands. Farmland cannot be bought or sold,
but use rights can be transferred within families and people can lease their farmland for
limited periods of time. Contemporary farmland distribution is the outcome of complex
circumstances including tradition, allocation by the socialist Derg between 1974 and
1991, and local kebele-level (Peasant Association) decisions (Kebede 2002). Positioned
at the centre of contentious debates preceding the May 2010 elections, land
privatization was characterized as either the path to productivity and efficiency or as a
neoliberal conspiracy aimed at depriving rural people of land rights (Kidan 2010).
Econometric studies in Ethiopia have not provided definitive evidence that tenure issues
significantly affect people’s land use decisions, or that most people consider their
tenure status as insecure (Benin et al. 2005; Deininger and Jin 2006; Crewett and Korf
2008). Those who argue in favor of enacting policies to ensure more secure and
transferable land rights tend to approach the issue from the question of how to increase
long-term investments by farmers in their land (Ali, Dercon, and Gautam 2011) rather
than examining the potentially harmful implications of formalizing land transfer rights
for marginalized people. In the case of forests, access has been negotiated between
local actors and the state in processes that have unfolded over decades. Peters (2009)
describes such land relations as “open to interpretation…*and that+ careful attention has
to be paid to the specific meanings and constructions, including narratives and stories
placed by different social actors on the principles justifying access, use, and control”
(1322). This sentiment is central to concerns over the impacts of foreign investment in
forestry on landholders located at the forest-farm interface.
71
3.4 Case Study Evidence
I provide evidence to describe historic and contemporary land use change and forest
benefit distributions in a specific case. I investigate how these land relations inform
contemporary resource rights in a community located at the forest-farm interface and
emphasize the ecological, socio-economic and institutional challenges presented by the
new tenure arrangements that would likely accompany foreign investment.
3.4.1 Boundaries of the Case
Case study evidence is based upon field research conducted in Ethiopia in September
2009-May 2010 and December 2010 in a community and an adjacent natural forest area
managed by a government operated Forest Enterprise (referred to subsequently as the
Enterprise). Data include open-ended interviews with purposively selected experts and
community members, a household livelihoods survey, forest plot measurements,
ethnographic field notes and secondary sources. The household livelihoods survey uses
a stratified random sampling design and is based upon the USAID Famine Early Warning
System’s livelihood profile system (USAID 2008) modified to include non-marketed
extracted forest resources. The household wealth ranking and historical timeline group
interview is adapted from Laderchi (2005).
The forest area studied in the case covers approximately 1,220 hectares and is classified
as upper wet broad-leaved Afro-montane rainforest. This area is part of a larger natural
forest and plantation complex known as the Arsi Forest, which extends over 21,513
hectares, some 28 percent of which is plantation forest (Map 3.1). Natural forests
persist largely in areas that are steeply sloped and difficult to access, while flatter areas
have been converted to farmland (Poulsen 1973). The area has been inhabited by
Muslim Oromo agro-pastoralists for over one hundred years. The forest and
surrounding villages are located in a transition area between two agro-ecological zones,
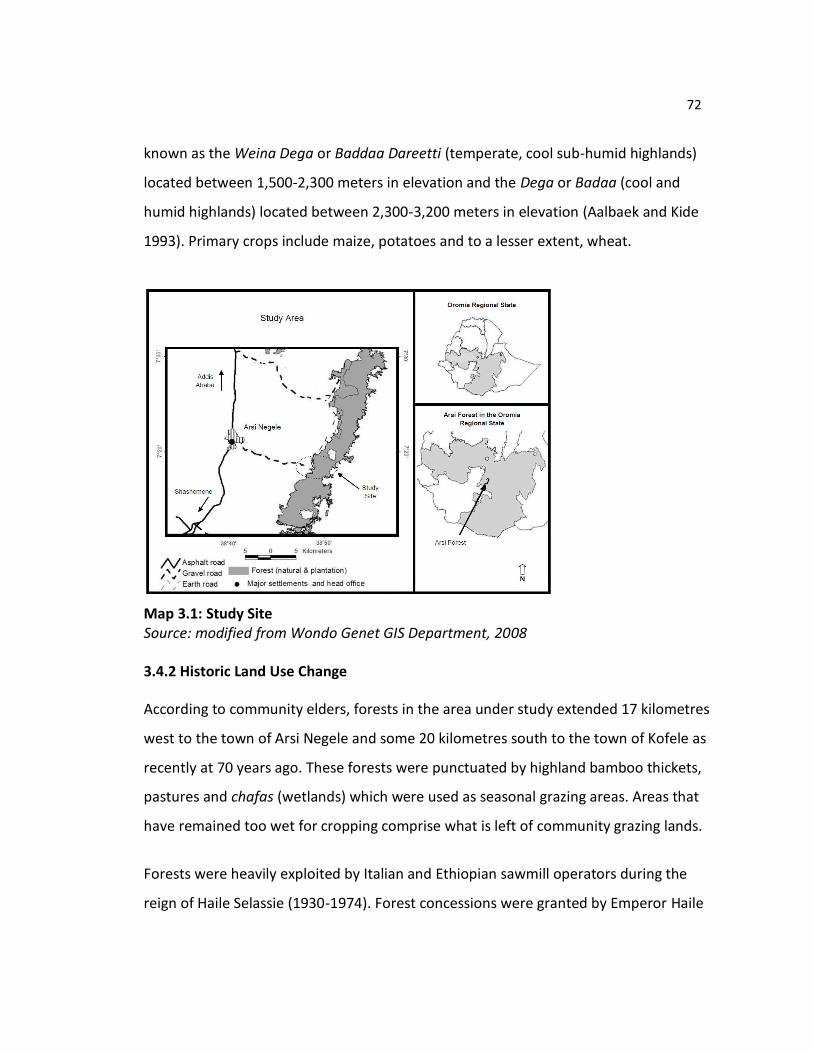
72
known as the Weina Dega or Baddaa Dareetti (temperate, cool sub-humid highlands)
located between 1,500-2,300 meters in elevation and the Dega or Badaa (cool and
humid highlands) located between 2,300-3,200 meters in elevation (Aalbaek and Kide
1993). Primary crops include maize, potatoes and to a lesser extent, wheat.
Map 3.1: Study Site Source: modified from Wondo Genet GIS Department, 2008
3.4.2 Historic Land Use Change
According to community elders, forests in the area under study extended 17 kilometres
west to the town of Arsi Negele and some 20 kilometres south to the town of Kofele as
recently at 70 years ago. These forests were punctuated by highland bamboo thickets,
pastures and chafas (wetlands) which were used as seasonal grazing areas. Areas that
have remained too wet for cropping comprise what is left of community grazing lands.
Forests were heavily exploited by Italian and Ethiopian sawmill operators during the
reign of Haile Selassie (1930-1974). Forest concessions were granted by Emperor Haile
73
Selassie to military officials, religious institutions and patrons. Concessions contracted to
sawmillers included mandatory replanting obligations, but regulations were not
enforced and companies neglected to follow them (Poulsen 1973). The Chilalo
Agricultural Development Unit (CADU), a joint Ethiopian-Swedish development program
was established in the late 1960s and outlined their mandate as follows:
An area of forest roughly estimated at 100,000 ha. seemed to be disintegrating annually and the almost total elimination of all real forest from the country seemed probable within 30 years at the most. Against this background, the urgent forestry needs within the Project area seemed to be:
– Protection and rational utilization of the remaining forests. – Increased reafforestation of erosion-prone slopes and other
areas available for planting. – Improved wood utilization (Poulsen 1970:3)
This approach is consistent with the sentiments expressed in the quote by the Ethiopian
Government and UNFCCC cited earlier in this paper. Both invoke under-utilization and
over-utilization narratives in calls for heightened protection from anthropogenic
destruction and greater efficiency and productivity in forest use.
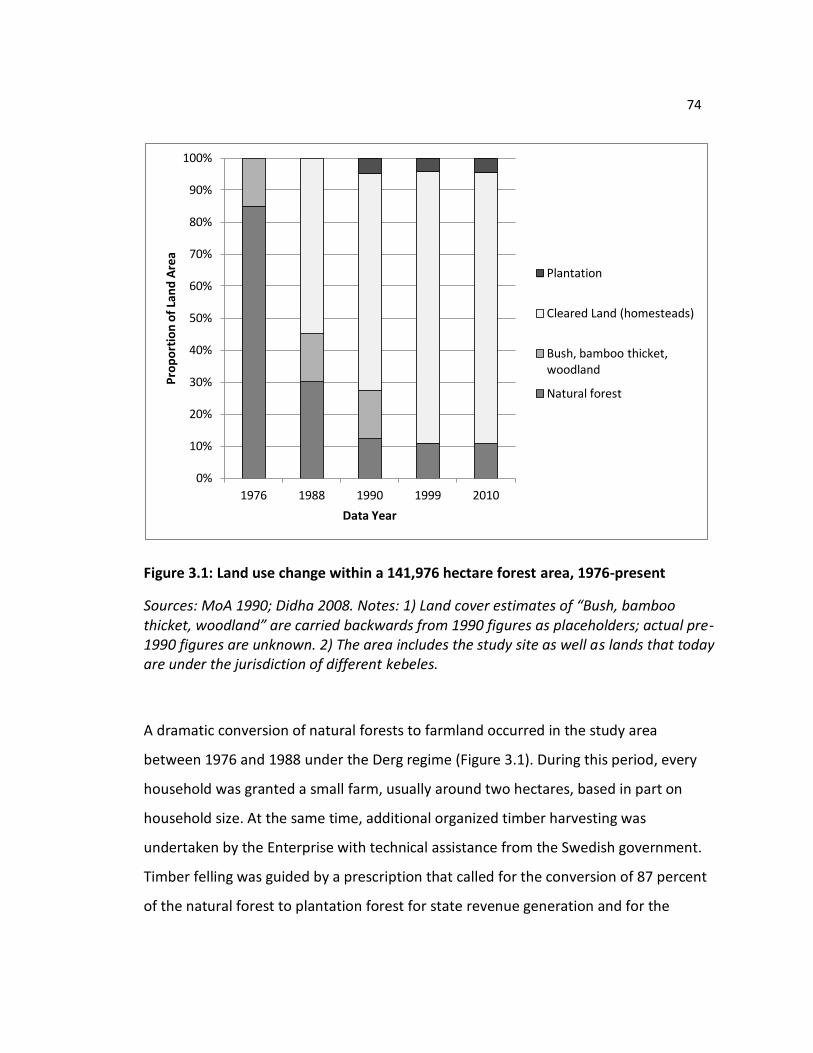
74
Figure 3.1: Land use change within a 141,976 hectare forest area, 1976-present
Sources: MoA 1990; Didha 2008. Notes: 1) Land cover estimates of “Bush, bamboo thicket, woodland” are carried backwards from 1990 figures as placeholders; actual pre-1990 figures are unknown. 2) The area includes the study site as well as lands that today are under the jurisdiction of different kebeles.
A dramatic conversion of natural forests to farmland occurred in the study area
between 1976 and 1988 under the Derg regime (Figure 3.1). During this period, every
household was granted a small farm, usually around two hectares, based in part on
household size. At the same time, additional organized timber harvesting was
undertaken by the Enterprise with technical assistance from the Swedish government.
Timber felling was guided by a prescription that called for the conversion of 87 percent
of the natural forest to plantation forest for state revenue generation and for the
0%
10%
20%
30%
40%
50%
60%
70%
80%
90%
100%
1976 1988 1990 1999 2010
Pro
po
rtio
n o
f La
nd
Are
a
Data Year
Plantation
Cleared Land (homesteads)
Bush, bamboo thicket, woodland
Natural forest
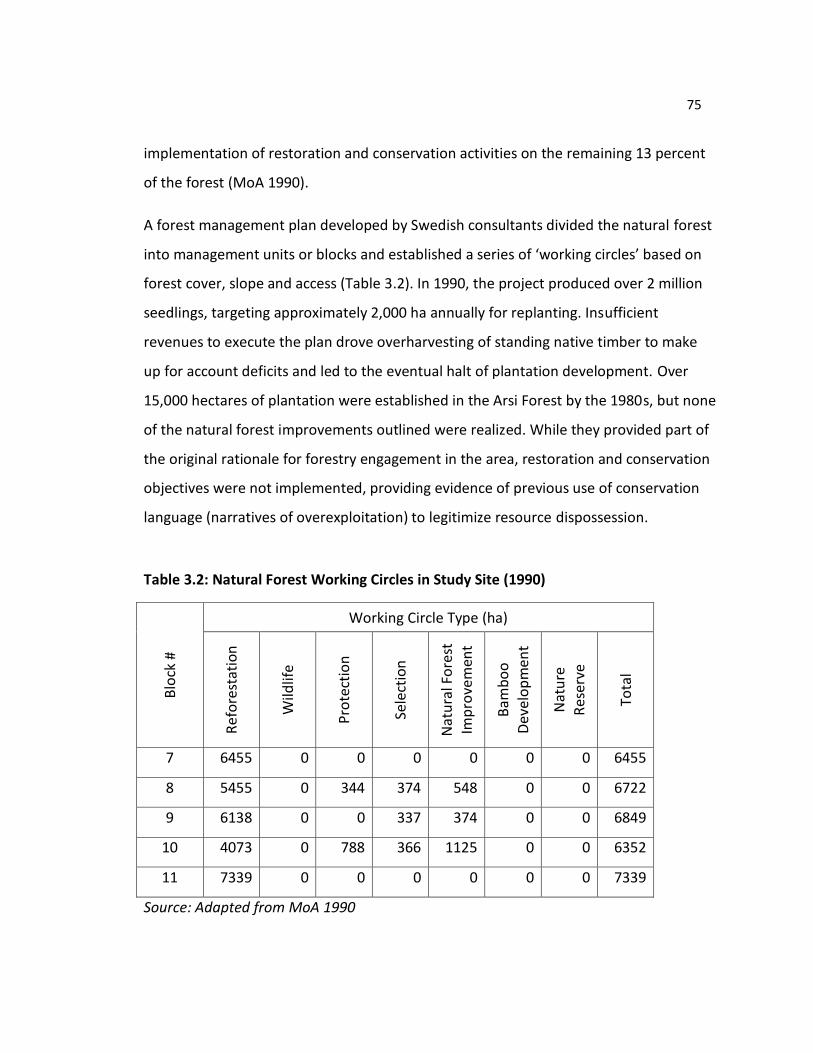
75
implementation of restoration and conservation activities on the remaining 13 percent
of the forest (MoA 1990).
A forest management plan developed by Swedish consultants divided the natural forest
into management units or blocks and established a series of ‘working circles’ based on
forest cover, slope and access (Table 3.2). In 1990, the project produced over 2 million
seedlings, targeting approximately 2,000 ha annually for replanting. Insufficient
revenues to execute the plan drove overharvesting of standing native timber to make
up for account deficits and led to the eventual halt of plantation development. Over
15,000 hectares of plantation were established in the Arsi Forest by the 1980s, but none
of the natural forest improvements outlined were realized. While they provided part of
the original rationale for forestry engagement in the area, restoration and conservation
objectives were not implemented, providing evidence of previous use of conservation
language (narratives of overexploitation) to legitimize resource dispossession.
Table 3.2: Natural Forest Working Circles in Study Site (1990)
Blo
ck #
Working Circle Type (ha)
Ref
ore
stat
ion
Wild
life
Pro
tect
ion
Sele
ctio
n
Nat
ura
l Fo
rest
Im
pro
vem
ent
Bam
bo
o
De
velo
pm
ent
Nat
ure
R
eser
ve
Tota
l
7 6455 0 0 0 0 0 0 6455
8 5455 0 344 374 548 0 0 6722
9 6138 0 0 337 374 0 0 6849
10 4073 0 788 366 1125 0 0 6352
11 7339 0 0 0 0 0 0 7339
Source: Adapted from MoA 1990
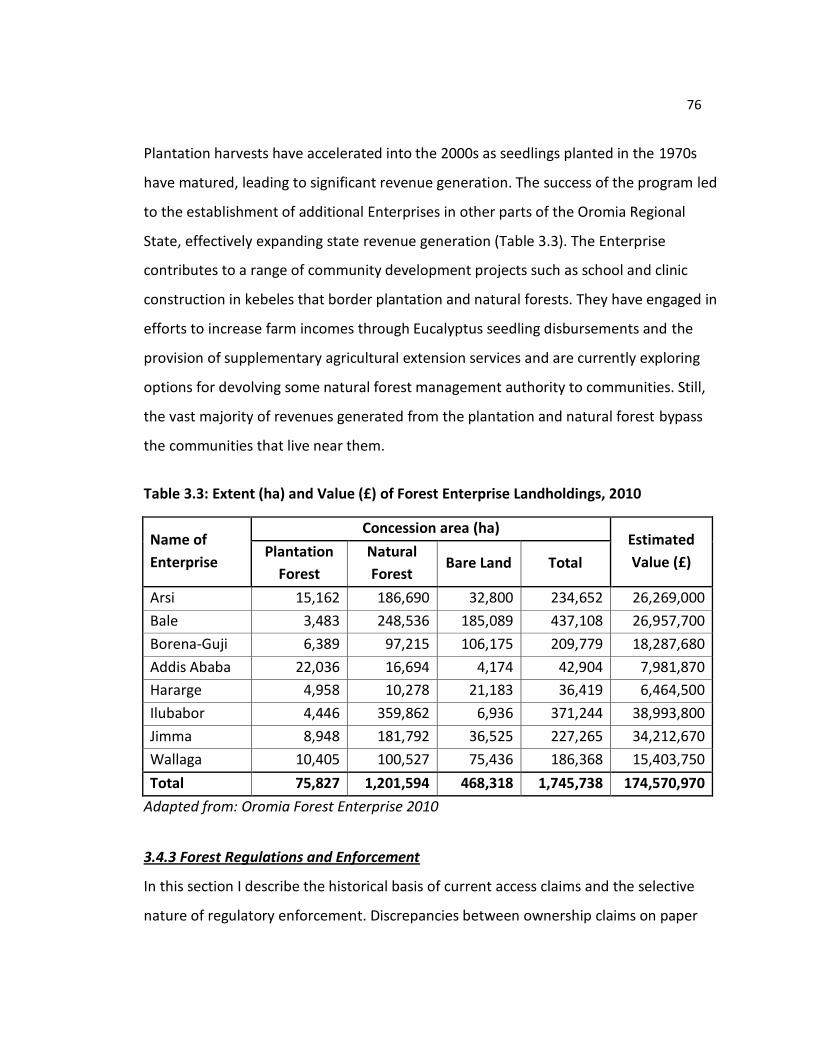
76
Plantation harvests have accelerated into the 2000s as seedlings planted in the 1970s
have matured, leading to significant revenue generation. The success of the program led
to the establishment of additional Enterprises in other parts of the Oromia Regional
State, effectively expanding state revenue generation (Table 3.3). The Enterprise
contributes to a range of community development projects such as school and clinic
construction in kebeles that border plantation and natural forests. They have engaged in
efforts to increase farm incomes through Eucalyptus seedling disbursements and the
provision of supplementary agricultural extension services and are currently exploring
options for devolving some natural forest management authority to communities. Still,
the vast majority of revenues generated from the plantation and natural forest bypass
the communities that live near them.
Table 3.3: Extent (ha) and Value (£) of Forest Enterprise Landholdings, 2010
Name of
Enterprise
Concession area (ha) Estimated
Value (£) Plantation
Forest
Natural
Forest Bare Land Total
Arsi 15,162 186,690 32,800 234,652 26,269,000
Bale 3,483 248,536 185,089 437,108 26,957,700
Borena-Guji 6,389 97,215 106,175 209,779 18,287,680
Addis Ababa 22,036 16,694 4,174 42,904 7,981,870
Hararge 4,958 10,278 21,183 36,419 6,464,500
Ilubabor 4,446 359,862 6,936 371,244 38,993,800
Jimma 8,948 181,792 36,525 227,265 34,212,670
Wallaga 10,405 100,527 75,436 186,368 15,403,750
Total 75,827 1,201,594 468,318 1,745,738 174,570,970
Adapted from: Oromia Forest Enterprise 2010
3.4.3 Forest Regulations and Enforcement
In this section I describe the historical basis of current access claims and the selective
nature of regulatory enforcement. Discrepancies between ownership claims on paper
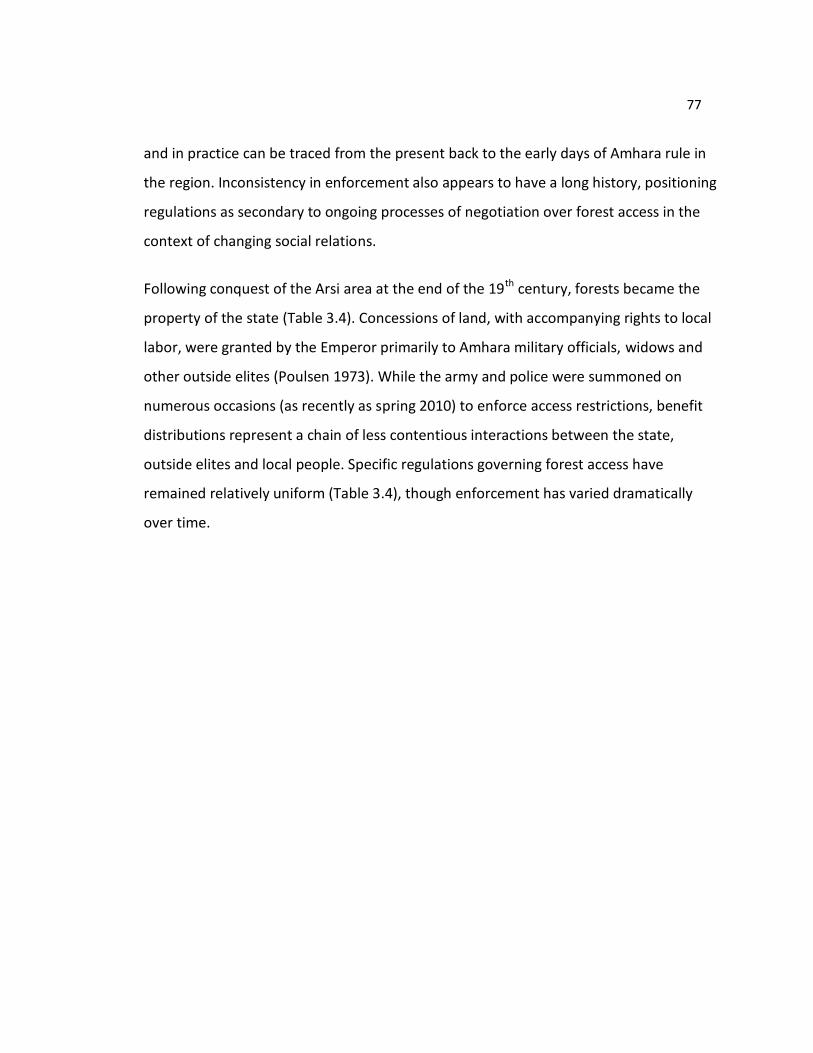
77
and in practice can be traced from the present back to the early days of Amhara rule in
the region. Inconsistency in enforcement also appears to have a long history, positioning
regulations as secondary to ongoing processes of negotiation over forest access in the
context of changing social relations.
Following conquest of the Arsi area at the end of the 19th century, forests became the
property of the state (Table 3.4). Concessions of land, with accompanying rights to local
labor, were granted by the Emperor primarily to Amhara military officials, widows and
other outside elites (Poulsen 1973). While the army and police were summoned on
numerous occasions (as recently as spring 2010) to enforce access restrictions, benefit
distributions represent a chain of less contentious interactions between the state,
outside elites and local people. Specific regulations governing forest access have
remained relatively uniform (Table 3.4), though enforcement has varied dramatically
over time.
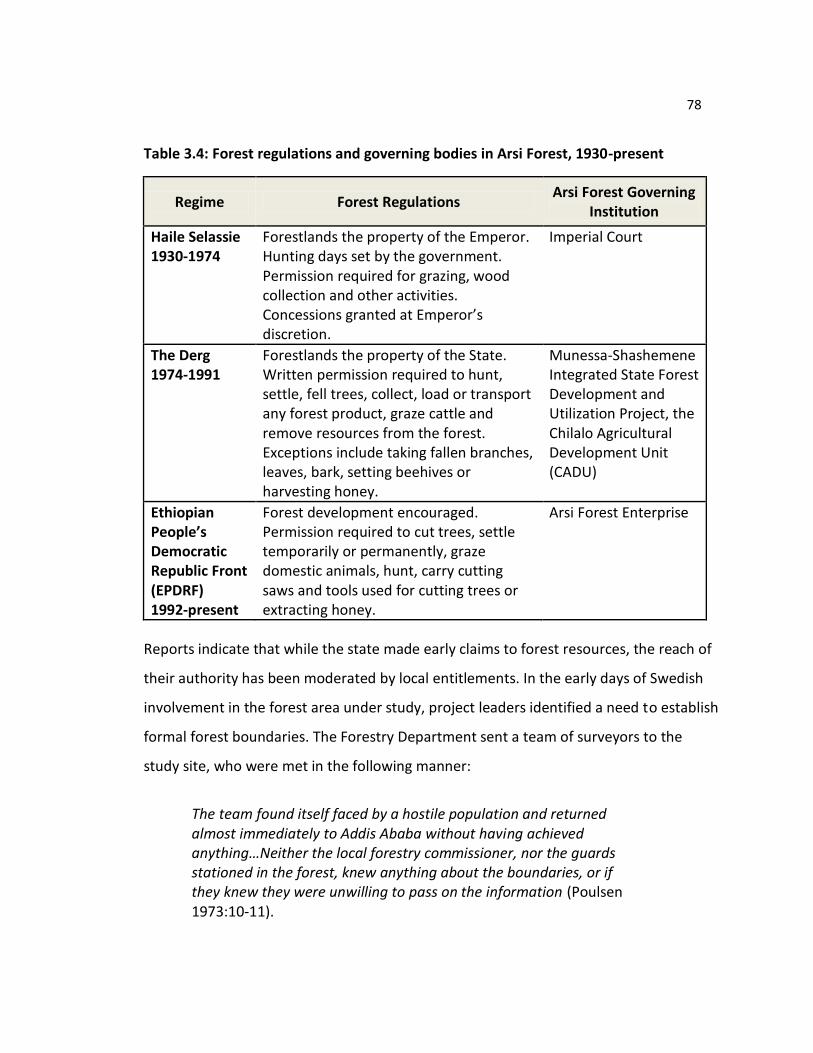
78
Table 3.4: Forest regulations and governing bodies in Arsi Forest, 1930-present
Regime Forest Regulations Arsi Forest Governing
Institution
Haile Selassie 1930-1974
Forestlands the property of the Emperor. Hunting days set by the government. Permission required for grazing, wood collection and other activities. Concessions granted at Emperor’s discretion.
Imperial Court
The Derg 1974-1991
Forestlands the property of the State. Written permission required to hunt, settle, fell trees, collect, load or transport any forest product, graze cattle and remove resources from the forest. Exceptions include taking fallen branches, leaves, bark, setting beehives or harvesting honey.
Munessa-Shashemene Integrated State Forest Development and Utilization Project, the Chilalo Agricultural Development Unit (CADU)
Ethiopian People’s Democratic Republic Front (EPDRF) 1992-present
Forest development encouraged. Permission required to cut trees, settle temporarily or permanently, graze domestic animals, hunt, carry cutting saws and tools used for cutting trees or extracting honey.
Arsi Forest Enterprise
Reports indicate that while the state made early claims to forest resources, the reach of
their authority has been moderated by local entitlements. In the early days of Swedish
involvement in the forest area under study, project leaders identified a need to establish
formal forest boundaries. The Forestry Department sent a team of surveyors to the
study site, who were met in the following manner:
The team found itself faced by a hostile population and returned almost immediately to Addis Ababa without having achieved anything…Neither the local forestry commissioner, nor the guards stationed in the forest, knew anything about the boundaries, or if they knew they were unwilling to pass on the information (Poulsen 1973:10-11).
79
This anecdote highlights the ill-defined nature of many access claims. While few may
have questioned the state’s right to levy taxes, further steps to establish a formal
presence in the area and exert additional controls over resources were met with
resistance.
During initial government efforts to establish plantations in the 1970s, seedlings were
uprooted by locals or trampled by livestock. Armed military were brought in to guard
plantations until local people eventually accepted them. Plantation establishment was
one aspect of the work of the Chilalo Agricultural Development Unit (CADU),
spearheaded by the Swedish government via its aid agency SIDA. Political scientist and
historian Dessalegn Rahmato describes the problematic nature of some of this work:
[T]he most serious failure of the project lay in the social consequences of its activities in Chilalo. In the first place, the main beneficiaries were the more prosperous peasants and those with secure tenure arrangements. The poor and a majority of the tenantry benefited the least. The issue of social equity came to weigh heavily on the main donor, Sida, which exerted considerable effort to have the government pass legislation to relieve the burden of those with unsecure tenures who were unable because of it to benefit from CADU programmes. Secondly, considerable peasant evictions from the land took place in the area particularly in the period when CADU was most active and when its programmes were beginning to pay off. Thirdly, the package of innovations offered to the participating peasantry was highly dependent on external economies, and consequently, from a cost-benefit point of view what was achieved would not in the long run be worth the cost or sustainable (2009, 57).
Contemporary community members describe regulations as being tightly enforced
under the Derg and loosely enforced under the current regime. The tight enforcement
of forest access restrictions by the Derg was viewed positively by interviewees in
hindsight. In a timeline exercise conducted with community elders, interviewees
described the early days of the Derg as a time of abundance, as exemplified in the
following quote: “At that time people were afraid and the Enterprise was keeping the
80
forest well. Many people used the forest for production of honey and the people said
‘the forest is our shade’ so it should not be touched.” Another interviewee stated: “the
forests were full and wide and every species was present. I used the forest for farming
equipment and grasses…all people were keeping the forests, even elders and youth”
(116, Community Elder). These quotes reveal that actors actively used forests in ways
that did not, in their perceptions, conflict with a climate of rigid enforcement and that
they saw themselves as forest managers and stewards. When examined in the context
of diminishing natural forests shown in Figure 3.1, the memories of abundance in the
late 1970s were also perhaps strongly shaped by higher forest cover and lower human
population densities that characterized the region at the time.
Today, plantations are considered well guarded in comparison to natural forests. With
the exceptions of limited grazing and periodic access to slash from plantation thinnings,
plantation production feeds urban rather than local markets. Community forest product
consumption goes largely unregulated in natural forests. Higher order offenses such as
timber harvest are sometimes brought to the attention of local police, but rarely result
in legal convictions. Corruption, insufficient manpower, a lack of commitment, authority
and politicking are all cited as undermining factors. The subjectivity of regulatory
enforcement contributes to a sense that forest access is politically and socially
negotiable.
Changing values and policies also shape perceptions of resource rights. When asked
about the selective harvest by local people of one species (Podocarpus falcatus) for
fuelwood, a guard explained that during the Derg, the government wanted to eradicate
large indigenous trees as part of its plan to convert the natural forest to plantation.
People were informally permitted to cut large indigenous species and over time came to
believe that this was their right (118, Forest Guard).
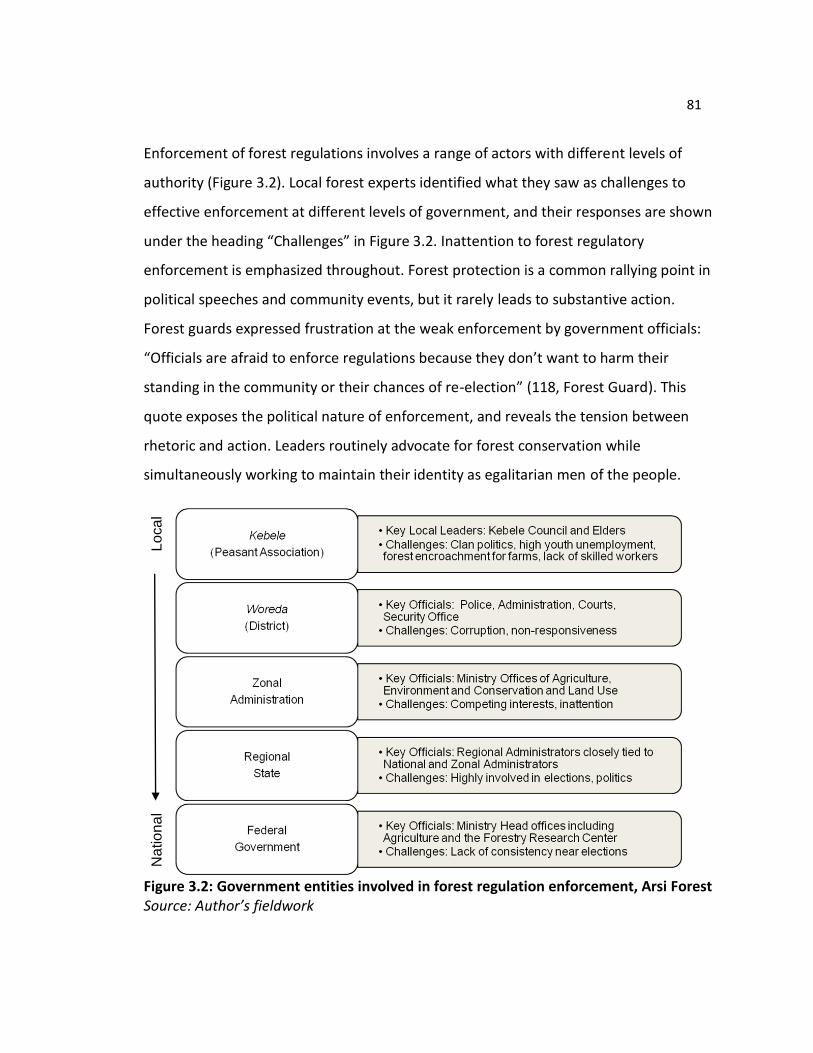
81
Enforcement of forest regulations involves a range of actors with different levels of
authority (Figure 3.2). Local forest experts identified what they saw as challenges to
effective enforcement at different levels of government, and their responses are shown
under the heading “Challenges” in Figure 3.2. Inattention to forest regulatory
enforcement is emphasized throughout. Forest protection is a common rallying point in
political speeches and community events, but it rarely leads to substantive action.
Forest guards expressed frustration at the weak enforcement by government officials:
“Officials are afraid to enforce regulations because they don’t want to harm their
standing in the community or their chances of re-election” (118, Forest Guard). This
quote exposes the political nature of enforcement, and reveals the tension between
rhetoric and action. Leaders routinely advocate for forest conservation while
simultaneously working to maintain their identity as egalitarian men of the people.
Figure 3.2: Government entities involved in forest regulation enforcement, Arsi Forest
Source: Author’s fieldwork
Na
tio
na
l L
oca
l
82
Enforcement patterns noted here also reflect broader trends relating to forest
management. In addition to the general willingness of the state to proceed with forest
exploitation before specific rights and responsibilities have been detailed, the difference
between regulations on paper and in practice shows how forest access is negotiable
between actors over time.
3.4.4 Forest Benefit Distributions
In this section I turn to an investigation of forest benefit distribution from the 1880s to
the present. I provide a general overview of the benefits, beneficiaries and effects of
forest exploitation in the study site. Beneficiaries are divided into three broad
categories: the state, outside elites and local people (Table 3.5). While these categories
are inherently limiting since they are comprised of individuals who are heterogeneous
and hold a range of entitlements and capabilities, this framing provides a coarse-grained
lens through which I assess forest benefit allocations.
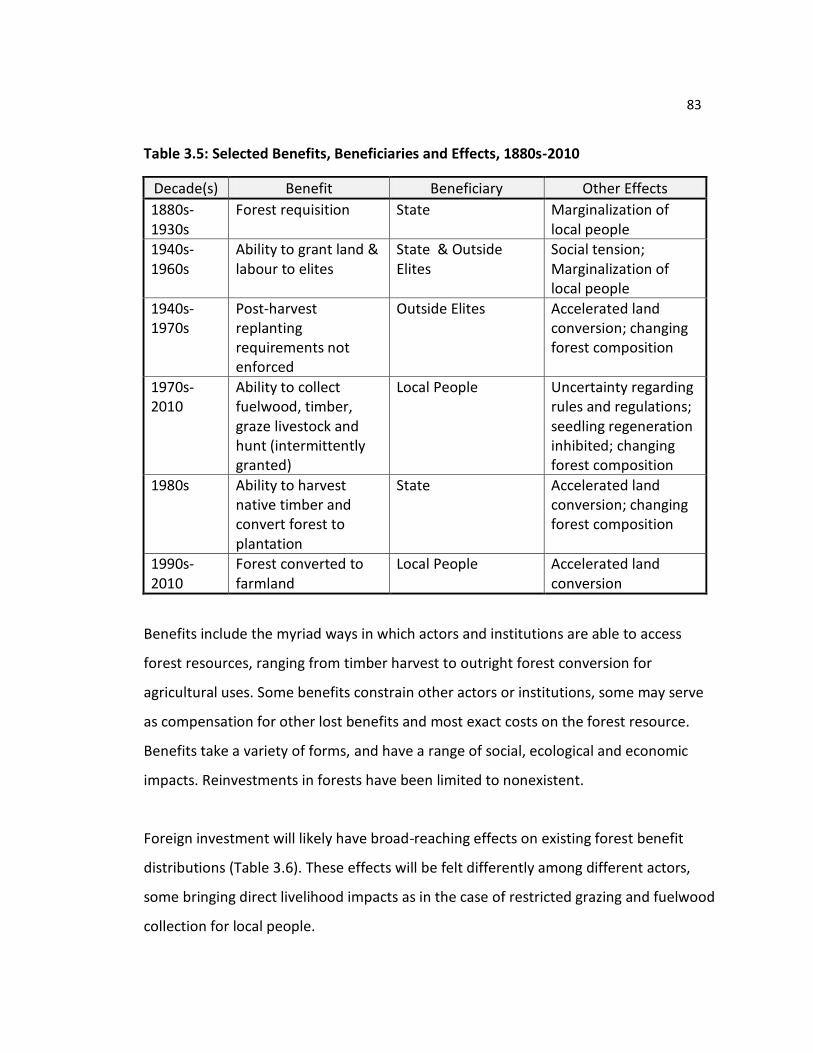
83
Table 3.5: Selected Benefits, Beneficiaries and Effects, 1880s-2010
Decade(s) Benefit Beneficiary Other Effects
1880s-1930s
Forest requisition State Marginalization of local people
1940s-1960s
Ability to grant land & labour to elites
State & Outside Elites
Social tension; Marginalization of local people
1940s-1970s
Post-harvest replanting requirements not enforced
Outside Elites Accelerated land conversion; changing forest composition
1970s-2010
Ability to collect fuelwood, timber, graze livestock and hunt (intermittently granted)
Local People Uncertainty regarding rules and regulations; seedling regeneration inhibited; changing forest composition
1980s Ability to harvest native timber and convert forest to plantation
State Accelerated land conversion; changing forest composition
1990s-2010
Forest converted to farmland
Local People Accelerated land conversion
Benefits include the myriad ways in which actors and institutions are able to access
forest resources, ranging from timber harvest to outright forest conversion for
agricultural uses. Some benefits constrain other actors or institutions, some may serve
as compensation for other lost benefits and most exact costs on the forest resource.
Benefits take a variety of forms, and have a range of social, ecological and economic
impacts. Reinvestments in forests have been limited to nonexistent.
Foreign investment will likely have broad-reaching effects on existing forest benefit
distributions (Table 3.6). These effects will be felt differently among different actors,
some bringing direct livelihood impacts as in the case of restricted grazing and fuelwood
collection for local people.
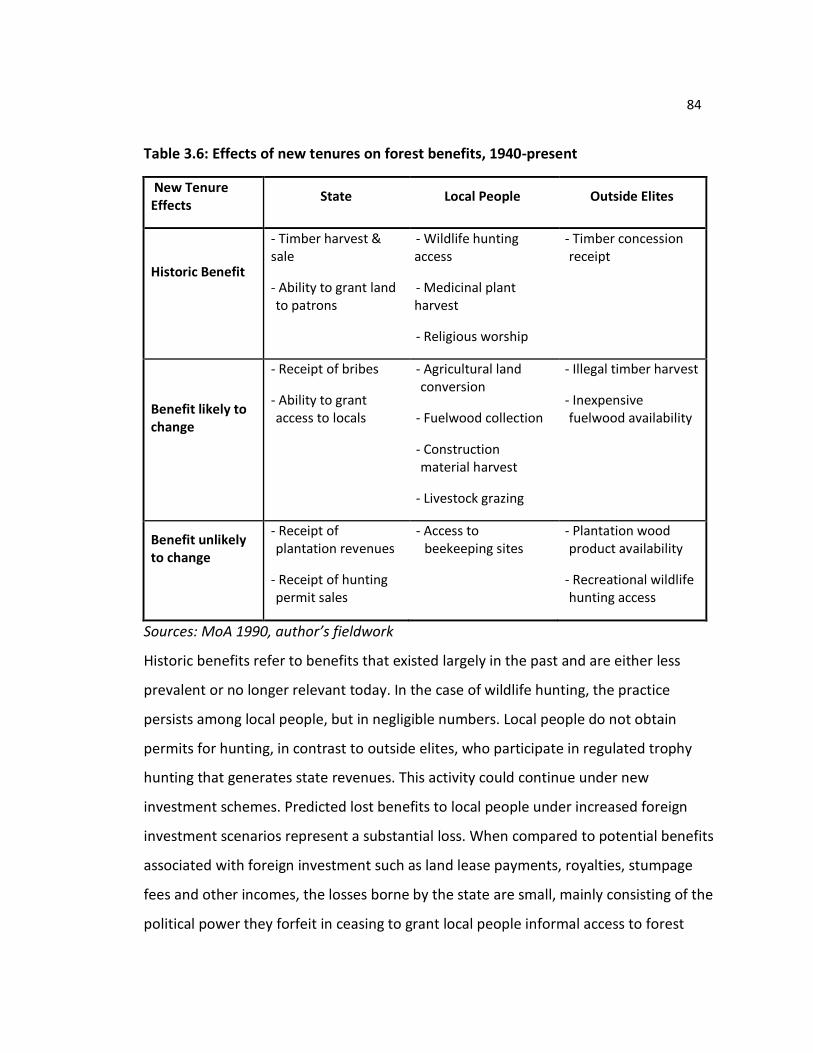
84
Table 3.6: Effects of new tenures on forest benefits, 1940-present
New Tenure Effects
State Local People Outside Elites
Historic Benefit
- Timber harvest & sale
- Ability to grant land to patrons
- Wildlife hunting access
- Medicinal plant harvest
- Religious worship
- Timber concession receipt
Benefit likely to change
- Receipt of bribes
- Ability to grant access to locals
- Agricultural land conversion
- Fuelwood collection
- Construction material harvest
- Livestock grazing
- Illegal timber harvest
- Inexpensive fuelwood availability
Benefit unlikely to change
- Receipt of plantation revenues
- Receipt of hunting permit sales
- Access to beekeeping sites
- Plantation wood product availability
- Recreational wildlife hunting access
Sources: MoA 1990, author’s fieldwork
Historic benefits refer to benefits that existed largely in the past and are either less
prevalent or no longer relevant today. In the case of wildlife hunting, the practice
persists among local people, but in negligible numbers. Local people do not obtain
permits for hunting, in contrast to outside elites, who participate in regulated trophy
hunting that generates state revenues. This activity could continue under new
investment schemes. Predicted lost benefits to local people under increased foreign
investment scenarios represent a substantial loss. When compared to potential benefits
associated with foreign investment such as land lease payments, royalties, stumpage
fees and other incomes, the losses borne by the state are small, mainly consisting of the
political power they forfeit in ceasing to grant local people informal access to forest
85
resources. The payment of bribes to checkpoint guards, police and judges is common.
The former occurs as forest products are transported along main roads and the latter
two occur when suspected violators, caught by guards, want to avoid punishment.
Bribes will likely continue, possibly shifting from the courts and checkpoints to other
recipients. The primary benefits that accrue to outside elites are provided through the
availability of wood through plantations and fuelwood sales. The former will be
unaffected by new investments.
3.5 Community Forest Benefits and the Potential for Conflict
The forest area under study provides the state, outside elites and local people with a
range of benefits. This section details the contribution of forest resources to household
livelihoods and explores the effects of forest tenure change on local communities. I
describe events from a recent forest boundary demarcation exercise in the area and
consider the potential for conflict that might accompany tenure changes.
3.5.1 Household livelihoods and forests
Data from a household livelihood survey highlights attributes of different wealth groups
as they relate to forest benefits (Table 3.7). Household attributes vary in terms of
average land and livestock holdings, which affect things like crop production and the
ability to withstand periods of livelihood stress associated with drought, crop failure or
currency devaluation. All wealth groups rely on forests to supplement their livelihoods.
Forest products provide households with livestock grazing land, homestead sites,
fuelwood, building materials and other non-timber forest products. Fuelwood sale is a
primary means by which households in the study site generate cash income. Fuelwood
demand in the area is high due in part to a thriving alcohol distillation industry in the
nearby town of Arsi Negele. Households with donkeys are able to capture more
revenues from fuelwood sales due to their ability to obtain higher prices closer to
market, to sell larger volumes of wood, and reduce transportation costs.

86
Table 3.7: Attributes by Wealth Ranking in Study Site, 2010
Household Attribute
Household Wealth Rank Weighted
Mean Very Poor (6%)
Poor (28%)
Medium (54%)
Better-off (12%)
Mean age of household head
43 37 49 41 44
Female-headed households (%)
33% 0% 0% 0% 3%
Mean number of people per household
6.8 8.1 11 12 10
Mean landholding size (ha)
0.3 .9 1.2 1.4 1.0
Mean Tropical Livestock Units5 (TLUs) per household
1.38 1.09 6.15 8.44 4.7
Mean staple food expenditures as a % of mean total income
31% 24% 22% 10% 22%
Mean fuelwood income as a % of mean cash income
78% 62% 36% 25% 45%
Mean number of donkeys per household
0.7 0.9 1.25 1.5 1.2
Source: Author’s fieldwork
Fuelwood accounts for 45 percent of mean household cash incomes in the community
under study. Studies in other parts of Ethiopia have found comparable forest incomes
as a percentage of total household cash incomes, at 39 percent in central Ethiopia
(Mamo, Sjaastad, and Vedeld 2007), 27 percent in northern Tigray, (Babulo et al. 2009)
and 34 to 53 percent in the Bale Mountains (Yemiru et al. 2010). Interviewees described
a social shift that has occurred in recent years in which the sale of fuelwood had
5 A tropical livestock unit is equivalent to roughly 250 kilograms of live animal weight. I use the following animal conversion factors: cattle = 0.7; oxen = 1.0; donkey = 0.5; horse = 0.8; sheep = 0.1; goat = 0.1; chicken = 0.01 (Jahnke 1982; FAO 1987)
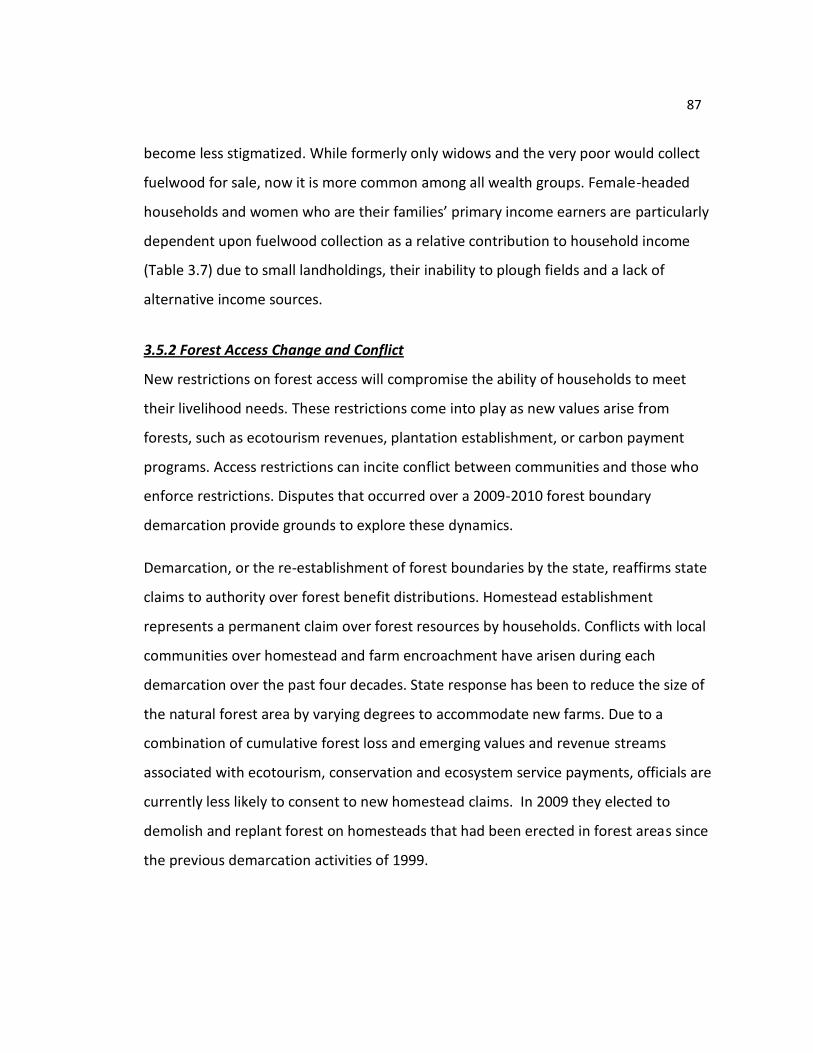
87
become less stigmatized. While formerly only widows and the very poor would collect
fuelwood for sale, now it is more common among all wealth groups. Female-headed
households and women who are their families’ primary income earners are particularly
dependent upon fuelwood collection as a relative contribution to household income
(Table 3.7) due to small landholdings, their inability to plough fields and a lack of
alternative income sources.
3.5.2 Forest Access Change and Conflict
New restrictions on forest access will compromise the ability of households to meet
their livelihood needs. These restrictions come into play as new values arise from
forests, such as ecotourism revenues, plantation establishment, or carbon payment
programs. Access restrictions can incite conflict between communities and those who
enforce restrictions. Disputes that occurred over a 2009-2010 forest boundary
demarcation provide grounds to explore these dynamics.
Demarcation, or the re-establishment of forest boundaries by the state, reaffirms state
claims to authority over forest benefit distributions. Homestead establishment
represents a permanent claim over forest resources by households. Conflicts with local
communities over homestead and farm encroachment have arisen during each
demarcation over the past four decades. State response has been to reduce the size of
the natural forest area by varying degrees to accommodate new farms. Due to a
combination of cumulative forest loss and emerging values and revenue streams
associated with ecotourism, conservation and ecosystem service payments, officials are
currently less likely to consent to new homestead claims. In 2009 they elected to
demolish and replant forest on homesteads that had been erected in forest areas since
the previous demarcation activities of 1999.
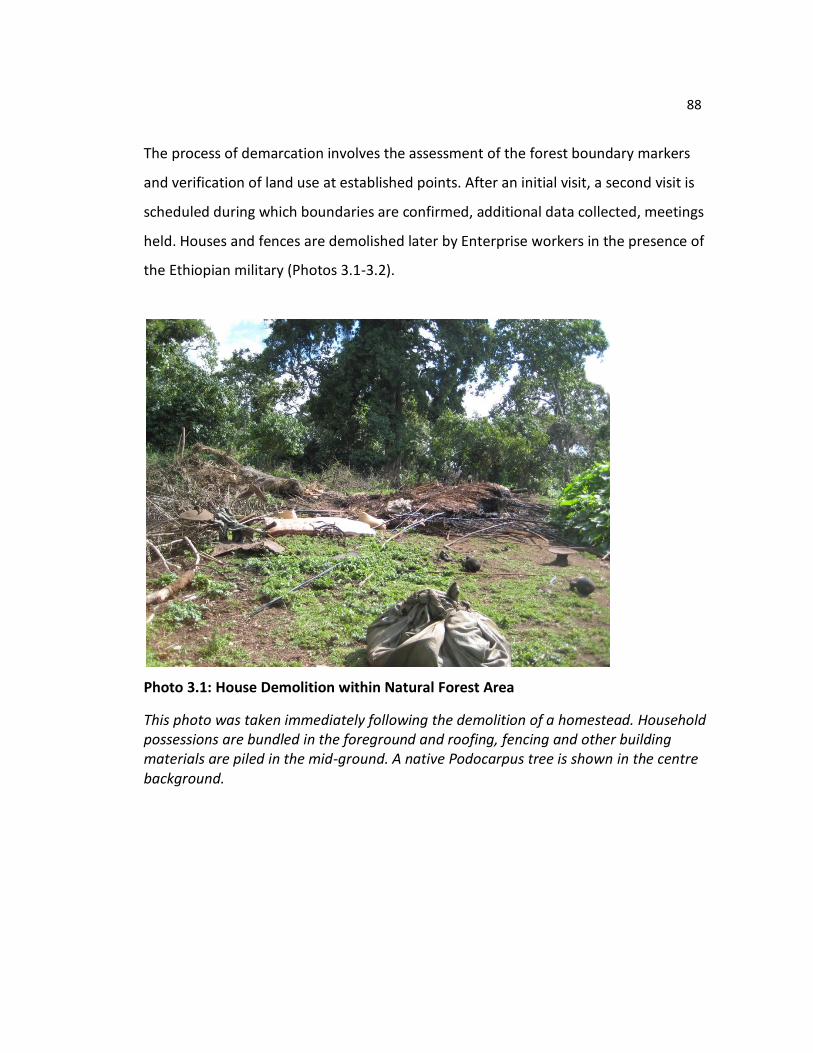
88
The process of demarcation involves the assessment of the forest boundary markers
and verification of land use at established points. After an initial visit, a second visit is
scheduled during which boundaries are confirmed, additional data collected, meetings
held. Houses and fences are demolished later by Enterprise workers in the presence of
the Ethiopian military (Photos 3.1-3.2).
Photo 3.1: House Demolition within Natural Forest Area
This photo was taken immediately following the demolition of a homestead. Household possessions are bundled in the foreground and roofing, fencing and other building materials are piled in the mid-ground. A native Podocarpus tree is shown in the centre background.
89
Photo 3.2: Boundary Marking
Following discussions, a forest guard marks a remnant Croton macrostachyus tree in the midst of crops to demarcate the official natural forest boundary
A demarcation exercise conducted by the Enterprise, local government authorities and
the Ethiopian military from the winter of 2009 through the spring of 2010 revealed that
54 households (eight percent of all households in the community) had expanded their
farms or established new homesteads (ranging in size from 0.25 to 11.25 hectares)
within the boundaries of the natural forest area under study.
In March 2010, demarcation activities resulted in violent conflict in a community
adjacent to the case under study. A group of five managerial staff and 43 guards and day
laborers from the Enterprise accompanied by six members of the Ethiopian military
arrived at a site to prepare already cleared areas for tree planting. An estimated 2,000
members of the local kebele descended upon the Enterprise employees with sticks,
rocks and traditional spears, leaving the military untouched. One man was hospitalized
90
and many sustained broken bones, cuts and other injuries. Planting activities were
halted and a series of community meetings followed.
The community, Enterprise and government authorities are still negotiating a resolution
to the conflict. Community grazing land located in a different part of the kebele was
identified by the government as a relocation site for households with no other
landholdings. Eight months later, in December 2010, most of the households had
returned to the forest plots because of superior soil conditions for cropping. The
decision to divide community grazing land to provide homestead plots to forest
encroachers was made by the government and had complex economic and social
implications for local communities. When asked about this process, an elder responded:
Why do you ask this question? We do not agree. The government is powerful. We are afraid. We have attended many meetings and separated without resolution. Our alternative is to educate our children for government work. (122, Elder)
Access claims described previously in the case emphasize negotiation between actors,
but local people have little recourse when higher level authorities are determined to
enforce restrictions. Peasant-state relations have been described as characterized by
“political marginalisation, heavy state intervention and highly extractive relations
between state and peasants” (Milas and Latif 2000, 363). An argument repeatedly
voiced against resettlement on community grazing land asserted that the land was
slated to be the future site of a mosque and school, representing an appeal to officials’
higher religious and familial values, though this was not successful. The focus of violence
on Enterprise employees while community members assiduously avoided harming
military personnel exposes the limits of dissent. In effect, households were saying to
Enterprise workers, who are for the most part neighbors living under shared
circumstances, “how can you deny us our basic subsistence rights?” Aside from other
91
challenges that would have likely ensued had people attacked soldiers, their moral
claims would not have resonated with the same force. These limits to protest may be
even more strongly felt as foreign investors enter contested spaces. Given the
preferential protections afforded foreign investors, local claims to forest resources may
be further marginalized as economic interests come to supersede historically negotiated
value-based claims.
Peluso and Ribot (2003) point out that ‘States often manage people as subjects to whom
privileges, rather than rights, are to be delegated’ (p. 163). Household-level forest
benefit claims are rooted in customary and historical access to forest resources and
local rights are woven into understandings of what constitutes legitimate use. These are
increasingly threatened with the emergence of new revenue-generating opportunities in
forest areas. Informal forest benefit distributions are not guaranteed since rights were
never formally devolved, leaving local people disadvantaged as they attempt to assert
their access claims.
3.6 Discussion
Evidence from the case reveals two broad areas of concern regarding increased foreign
investment in forests. The first area pertains to the widespread clearing of forests for
agriculture that is not subject to appropriate scrutiny. The impacts of this trend are
significant in terms of effects on local livelihoods, forests, and potential future
engagement in forest-based activities. The second area relates to the diminishing ability
of local people to make livelihood claims in the face of new tenures that draw their
legitimacy from markets rather than local values. The scope of the impact of foreign
investment in forestry is currently small. However, when broadened to incorporate
impacts of agricultural investments and potential future investments in forest-based
emissions reduction programs like the Clean Development Mechanism (CDM) and
92
Reducing Emissions from Deforestation and Forest Degradation (REDD), potential
effects on household livelihoods are tremendous. The “foreignisation of space”
(Zoomers 2010:433) holds few certain benefits for rural people. Narratives of under-
exploitation and overexploitation that have legitimized domestic and foreign
interventions into rural livelihoods have veiled contradictory policies and facilitated
forest benefit transfers to the state and outside elites.
Foreign investment in highland forests will affect rural livelihoods, due to the
interconnected nature of forest and agricultural incomes at the forest-farm interface. As
noted in studies on the devolution of forest management from the state to rural people,
calls for democratic institution-building can be problematic in the context of
institutional climates that do not hold ‘inclusion and equity as goals’ (Becker 2001, 506).
Competition between elite actors over resources stifles cooperation and the
development of transparent policies governing land tenure and investment (Gatzweiler,
Reichhuber, and Hein 2007). These realities mean that institutions capable of and
interested in protecting rural livelihoods and access claims will likely not materialize
without significant pressure from individuals and organizations with power to leverage
change.
The socio-political nature of access claims and enforcement highlights the need for a
formal process to establish livelihood claims and articulate workable tenure
arrangements at the community level. This process should also institute more
transparent application, approval and monitoring protocols for all land investments that
affect forests. As resources become more limited and as new markets evolve to
generate revenues from them, rural livelihood claims tend to be weighed in the context
emerging value systems rather that the ones in which established claims have evolved.
Equity considerations mandate that the narratives and histories that have shaped access

93
claims are documented so that rural people and advocates can make comprehensive
resource rights claims.
94
Chapter 4 - Land Use, Livelihoods and Deforestation: Connecting Case Study Evidence to Global Narratives
Kathleen Guillozet and John Bliss
95
4.1 Introduction
Most tropical deforestation results from trees being chopped down to generate space for crops and cattle. Reducing deforestation therefore means slowing down the expansion of agricultural land into forests…Are we then facing an unpleasant choice between ‘conserving the forests’ and ‘feeding the hungry’? (Angelsen 2010, 19639)
As exemplified above, development agencies, governments and popular media often
frame rural poverty and forest loss within the scales of household, community and
forest. A comparatively small contingency of geographers and social scientists
emphasizes the need to examine drivers of poverty and deforestation that extend well
beyond these local levels to include: national and global politics (Hecht et al. 2006),
history (Sivaramakrishnan 2000; Leach and Mearns 1996) trade and agricultural policies
(Wunder and Verbist 2003; Larson and Bromely 1991; Schmook and Vance 2009;
Dauvergne and Neville), state expansion (Angelsen 2001; Scott 2009), globalization
(Nygren 2000; Grauab, Aidec, and Gasparrid 2005), urbanization (Browder 2002; DeFries
et al.), market privatization (Rudel 2007; Klepeis and Vance 2003), and subsidies (Hecht
1993; Margulis 2004). Despite compelling evidence that rural poverty and deforestation
are linked to local, regional and global political and economic systems, simplistic
narratives that cast smallholder farmers as the primary agents of deforestation persist.
Lambin et al. (2001) critically assess the premise on which these narratives are founded,
asserting that they promote “prevalent worldviews, *suggest+ simple technical or
population control solutions, and may serve the interests of critical groups” (262). They
warn that these narratives lead to erroneous findings because they “rest on generalised
models of change which may be insecurely linked to the large body of case study reports
in the literature. Global scale assessments may therefore conflict with the findings of
micro- or meso-scale data sets which, because they are specific to time and place, do
96
not impact on the global debate” (262). This chapter addresses the following question
that flows from Lambin and Meyfroidt’s observations:
How can micro and meso-scale data sets better contribute to global debates on poverty, food security and deforestation?
These global debates span a range of issues, from macro-scale concerns over land use
change to micro-scale questions of household economy. This diversity makes it difficult
to retain a focus on all relevant scales. As described further in the next section, political
ecology studies that examine the production, distribution and marketing of specific
commodities illustrate an approach to linking macro and meso scale factors to local
realities. Global change scientists draw relationships between land use change trends to
national and international trade and income flows. I draw from each of these
approaches in this paper.
A key challenge to broadening poverty reduction and environmental conservation
narratives lies in moving beyond the trappings of familiar explanatory logics. Livelihood-
centered research tends to reference macro-scale concerns as background and then
shift to focus on household or community level interventions (e.g. Ansoms and McKay
2010). In contrast, studies that focus on the production of specific export commodities,
such as coffee and cotton, effectively link local case studies to macro-level processes
that produce inequality (e.g. Bassett; Richardson 2010; Valkila 2009; Bacon et al. 2008;
Jaffe 2007). They accomplish this by tracing the webs of relations that facilitate the
transfer of economic benefits from producers to outside actors and corporations. Global
change scientists present another powerful mode of inquiry by projecting near-future
implications of different land use scenarios in combination with economic and policy
data. For example, Liu et al. (2008) illustrate that while climate change may actually lead
to increased overall crop yields in Ethiopia, distribution effects and limited foreign
exchange in combination with population growth may lead to an overall increase in
hunger and malnutrition. This approach exposes flawed narratives and encourages
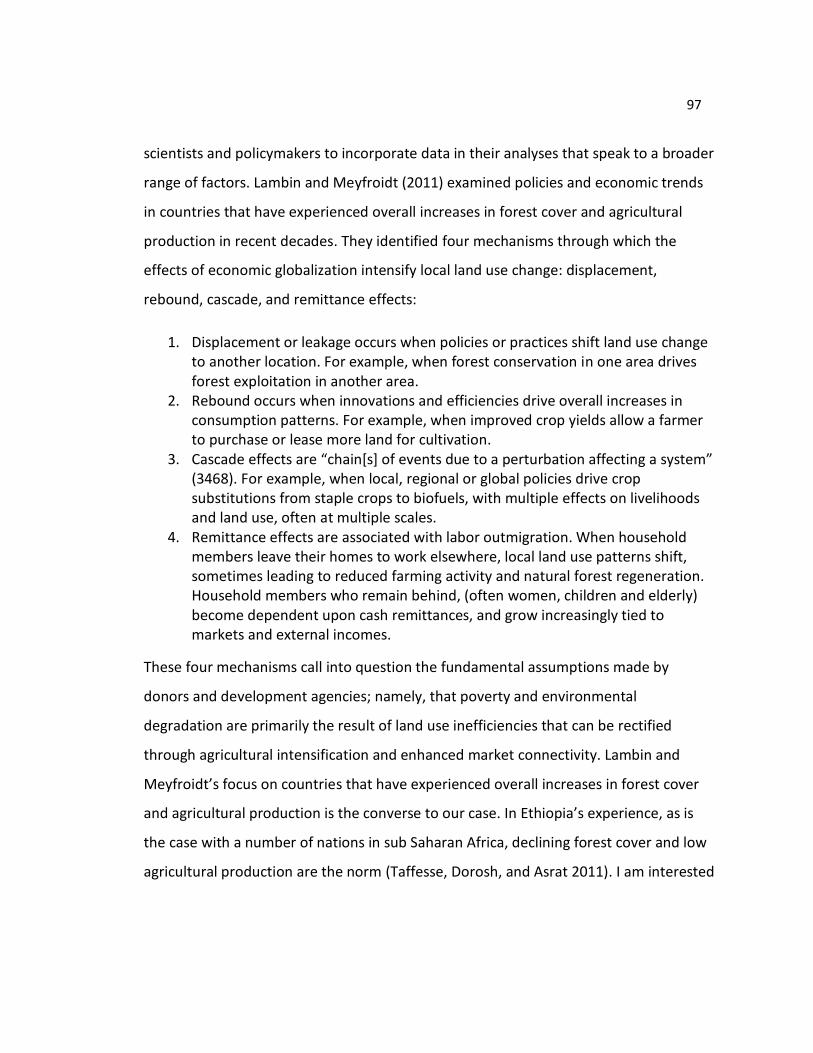
97
scientists and policymakers to incorporate data in their analyses that speak to a broader
range of factors. Lambin and Meyfroidt (2011) examined policies and economic trends
in countries that have experienced overall increases in forest cover and agricultural
production in recent decades. They identified four mechanisms through which the
effects of economic globalization intensify local land use change: displacement,
rebound, cascade, and remittance effects:
1. Displacement or leakage occurs when policies or practices shift land use change to another location. For example, when forest conservation in one area drives forest exploitation in another area.
2. Rebound occurs when innovations and efficiencies drive overall increases in consumption patterns. For example, when improved crop yields allow a farmer to purchase or lease more land for cultivation.
3. Cascade effects are “chain*s+ of events due to a perturbation affecting a system” (3468). For example, when local, regional or global policies drive crop substitutions from staple crops to biofuels, with multiple effects on livelihoods and land use, often at multiple scales.
4. Remittance effects are associated with labor outmigration. When household members leave their homes to work elsewhere, local land use patterns shift, sometimes leading to reduced farming activity and natural forest regeneration. Household members who remain behind, (often women, children and elderly) become dependent upon cash remittances, and grow increasingly tied to markets and external incomes.
These four mechanisms call into question the fundamental assumptions made by
donors and development agencies; namely, that poverty and environmental
degradation are primarily the result of land use inefficiencies that can be rectified
through agricultural intensification and enhanced market connectivity. Lambin and
Meyfroidt’s focus on countries that have experienced overall increases in forest cover
and agricultural production is the converse to our case. In Ethiopia’s experience, as is
the case with a number of nations in sub Saharan Africa, declining forest cover and low
agricultural production are the norm (Taffesse, Dorosh, and Asrat 2011). I am interested
98
in exploring whether the inclusion of micro and meso-scale data illuminates new policy
alternatives.
4.2 Background
I begin by exploring recent poverty reduction – environmental conservation framings. I
describe the shift among conservation organizations and governments from an
emphasis on poverty-conservation programs in the 1980s and 1990s to an orientation
towards carbon sequestration and smallholder farming. This shift reflects emerging
concerns over climate change and food security while retaining the focus of intervention
on rural households and communities, rather than on broader politico-economic
institutions.
Reducing human impacts on forests, in particular the impacts of rural people who live at
the forest margins, is central to the work of many conservation NGOs and development
agencies operating in the global South (Gorenflo and Brandon 2006; Fisher and Shively
2005). Approaches have taken a number of forms over the past few decades. Most
notably, they have sought to involve rural people who live at the forest-farm interface in
different forms of community-based conservation, including: forest buffer zone
livelihood enhancement programs (Wells and Brandon 1993; Prins and Wind 1993),
ecotourism and “people and parks” campaigns (Brandon 1995), integrated conservation
and development projects (Alpert 1996; Niemark and Hough 2000), eco-agriculture
(Scherr and McNeely 2007; Gorenflo and Brandon 2005; McNeely and Scherr 2002),
forest certification schemes (Klooster 2005; Jaffee, Kloppenburg Jr, and Monroy 2004)
and ecosystem service payments (Turner et al. 2007). These approaches each have their
advocates and critics6, but generally speaking have not delivered desired levels of
poverty reduction and forest conservation. Common reasons include insufficient local
6 See (Naughton-Treves, Holland, and Brandon 2005; Schwartzman et al. 2010) for successes, and see (Zhouri 2004; Chapin 2004) for failures.
99
involvement and authority, patriarchal approaches, inadequate planning and field
testing and a lack of attention to larger scale factors like logging, mining and industrial
agriculture (Sunderland, Ehringhaus, and Campbell 2007).
More recently, conversations have shifted to include emphases on climate change and
food security. In place of conservation-oriented appeals, the climate-mitigating
potential of forests has become their primary selling point (O'Connor 2008). Programs
such as Reducing Emissions from Deforestation and Environmental Degradation (REDD)
have captured the attention of policymakers and conservationists because of their
potential to serve as “win-win” solutions to poverty and climate change. However, REDD
poses a threat to local economies and food security by locking up large areas of
forestland that might otherwise contribute to livelihoods (Negra and Wollenberg 2010).
Policymakers have raised these concerns in the aftermath of the 2008 global food crisis,
when average food prices increased by 43 percent7, plunging millions of smallholder
farmers into deeper levels of vulnerability and poverty (USAID 2009). Researchers and
popular media further link these events to national security, connecting the “Arab
spring” of 2010-2011 to food price hikes and climate change (Johnstone and Mazo
2011; Brown 2011). The outcome is a growing focus on smallholder farmers in order to
promote food security while “protecting biodiversity, promoting sustainability and
advancing equity” (Alliance for a Green Revolution in Africa 2009, 2). Major funders
advertising this approach include the Bill and Melinda Gates Foundation (Gates 2011),
the United Nations, USAID and the World Bank (Lawder 2010). As exemplified in the
words of the United Nations Environment Program’s Executive Director, smallholder
farmers are increasingly viewed as “an ‘untapped resource’ in addressing food security
and today’s environmental challenges” (UN News Centre 2011).
7 See Appendix 2 for Maize, Potato and Wheat Prices in Ethiopia between 2000-2008.
100
This focus on smallholder farmers requires scrutiny because it diverts attention away
from macroeconomic factors, arriving at a time when “the extension and deepening of
the logics of capitalism to new geographical and ecological areas of the planet appears
to be unprecedented” (Newell 2011, 6). Food security is the outcome of availability,
access and utilization (Sen 1984; Lobell 2011). Food prices, which affect access and
utilization, are primarily determined by factors such as global production levels, climate
volatility, and trade policies (Hertel, Burke, and Lobell 2010), all of which are beyond the
control of smallholder households. Lambin and Meyfroidt (2011) take a fundamentally
different perspective in framing food security and forest loss:
A central challenge for sustainability is how to preserve forest ecosystems and the services that they provide us while enhancing food production. This challenge for developing countries confronts the forces of economic globalization, which seeks cropland that is shrinking in availability and triggers deforestation. (Lambin and Meyfroidt 2011, 3465)
While most policymakers and scientists designate farmers as the primary agents of
deforestation, Lambin and Meyfroidt place economic globalization front and center. This
orientation constitutes a significant shift in the prevailing logic regarding determinants
of land use change in the global South.
In the next section I use evidence from case study research in a community in highland
Ethiopia to explore ways in which micro-scale data can constructively complicate global
narratives. I describe community livelihood characteristics and project the effects of
forest income substitutions on land use, incorporating economic, policy, ecological and
social data. I explore the limitations of dominant narratives and propose alternative
approaches. I present this as a “thought experiment” to explore assumptions, costs,
benefits and tradeoffs associated with different land use and livelihood interventions.
Our experiment consists of: 1) a description of land uses and livelihoods within the study
101
site, and 2) a projection of the land area required to replace fuelwood incomes under
two hypothetical alternatives.
4.3 Case Study Evidence
4.3.1 Overview
The field research that informs this work was conducted from September 2009-May
2010 in a smallholder farming community located at the edge of Ethiopia’s Arsi Forest
(Map 4.1). Using data from a household livelihoods survey, interviews, GIS and
secondary data, I project the implications of forest income substitution on agricultural
land use requirements. Forest encroachment and illegal harvest of forest products,
especially fuelwood for income generation, are ongoing problems identified by Arsi
forest managers (102, Forest Enterprise staff). I describe constraints and opportunities
to agricultural intensification and illustrate how they suggest alternative interpretations
of local data to those espoused in dominant poverty reduction – environmental
conservation narratives.
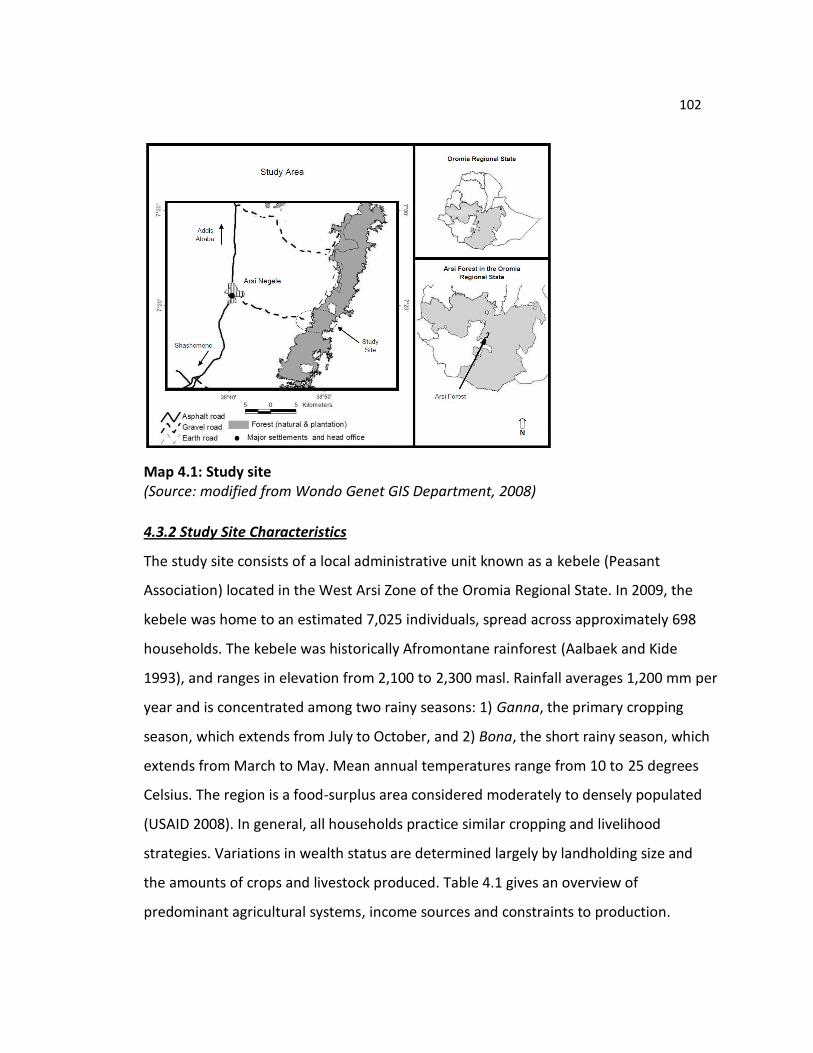
102
Map 4.1: Study site (Source: modified from Wondo Genet GIS Department, 2008)
4.3.2 Study Site Characteristics
The study site consists of a local administrative unit known as a kebele (Peasant
Association) located in the West Arsi Zone of the Oromia Regional State. In 2009, the
kebele was home to an estimated 7,025 individuals, spread across approximately 698
households. The kebele was historically Afromontane rainforest (Aalbaek and Kide
1993), and ranges in elevation from 2,100 to 2,300 masl. Rainfall averages 1,200 mm per
year and is concentrated among two rainy seasons: 1) Ganna, the primary cropping
season, which extends from July to October, and 2) Bona, the short rainy season, which
extends from March to May. Mean annual temperatures range from 10 to 25 degrees
Celsius. The region is a food-surplus area considered moderately to densely populated
(USAID 2008). In general, all households practice similar cropping and livelihood
strategies. Variations in wealth status are determined largely by landholding size and
the amounts of crops and livestock produced. Table 4.1 gives an overview of
predominant agricultural systems, income sources and constraints to production.
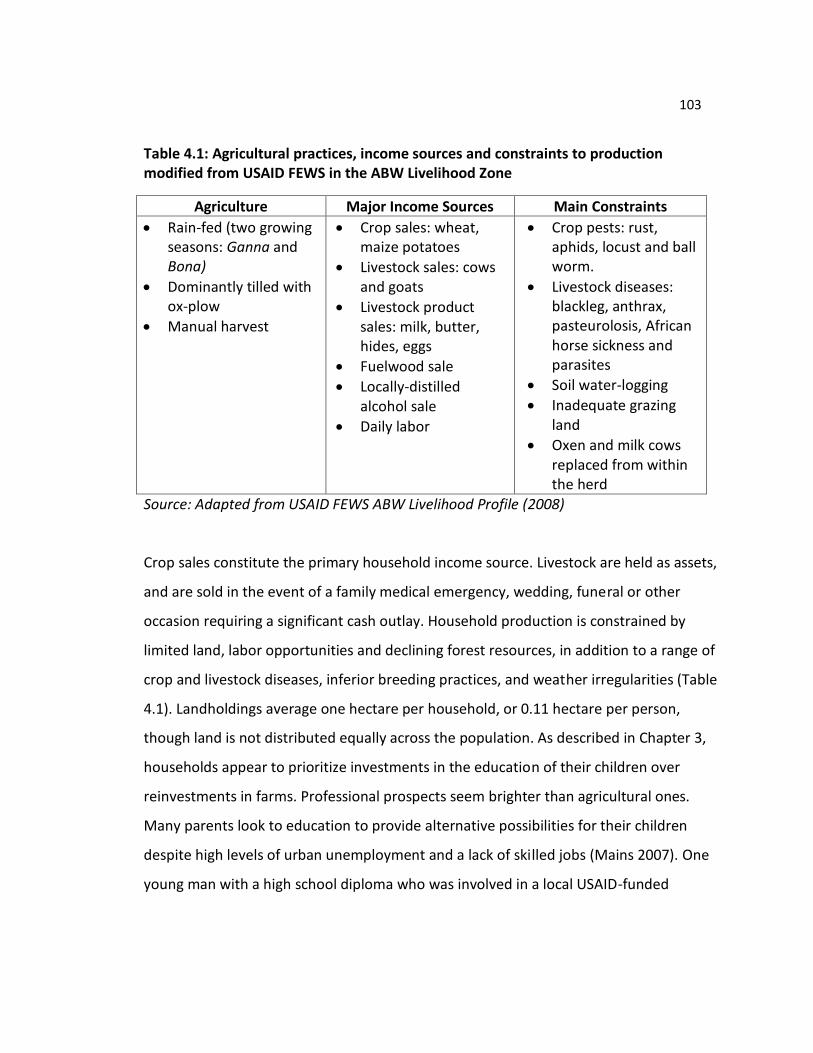
103
Table 4.1: Agricultural practices, income sources and constraints to production modified from USAID FEWS in the ABW Livelihood Zone
Agriculture Major Income Sources Main Constraints
Rain-fed (two growing seasons: Ganna and Bona)
Dominantly tilled with ox-plow
Manual harvest
Crop sales: wheat, maize potatoes
Livestock sales: cows and goats
Livestock product sales: milk, butter, hides, eggs
Fuelwood sale
Locally-distilled alcohol sale
Daily labor
Crop pests: rust, aphids, locust and ball worm.
Livestock diseases: blackleg, anthrax, pasteurolosis, African horse sickness and parasites
Soil water-logging
Inadequate grazing land
Oxen and milk cows replaced from within the herd
Source: Adapted from USAID FEWS ABW Livelihood Profile (2008)
Crop sales constitute the primary household income source. Livestock are held as assets,
and are sold in the event of a family medical emergency, wedding, funeral or other
occasion requiring a significant cash outlay. Household production is constrained by
limited land, labor opportunities and declining forest resources, in addition to a range of
crop and livestock diseases, inferior breeding practices, and weather irregularities (Table
4.1). Landholdings average one hectare per household, or 0.11 hectare per person,
though land is not distributed equally across the population. As described in Chapter 3,
households appear to prioritize investments in the education of their children over
reinvestments in farms. Professional prospects seem brighter than agricultural ones.
Many parents look to education to provide alternative possibilities for their children
despite high levels of urban unemployment and a lack of skilled jobs (Mains 2007). One
young man with a high school diploma who was involved in a local USAID-funded
104
ecotourism project described a different future for himself, his community and the
forest. He described:
“Society is in a challenging time. We are going to create work to change life. We want to improve the forest, but all people are not educated. I don’t know, it is not only a lack of education. It takes time to teach people but this is what I hope to do” (127, community youth).
People often expressed consternation over the disjuncture between aspirations,
opportunity and local realities. Anti-deforestation messages were integrated into school
lessons and government sponsored events, leading many to equate a lack of education
with fuelwood collection and other illegal forest activities. While ecotourism and other
poverty alleviation – environmental conservation programs have the potential to
diversify local livelihood opportunities, they are not always grounded in pragmatic
assessments of local livelihood requirements. A newspaper article describing the
aforementioned USAID ecotourism project termed the local natural forest area the
“little-known lush Lepis woodland” which “has the potential to transform the lives of
the 2,000 community members in its midst - if [the community] can successfully develop
a sustainable community tourism business…*w+ithout any facilities as of yet, the site is
one of the Rift Valley's best kept secrets” (Larson 2010). Actually, the site described is
quite well known to the thousands of local people who live in Lepis, the community
under study, and four additional kebeles that border it. For the project to succeed, the
cooperation of all local communities is necessary, and yet it is not clear how revenues
will be distributed, whether they will make up for lost fuelwood incomes or how
marginalized community members such as female headed households will benefit.
Reliance on the natural forest for fuelwood incomes is shaped by desperation rather
than a lack of education. As one woman stated:
To solve our problems, we sell wood. To solve our problems, we do a bad thing. It is not good for us. The government has problems, society has
105
problems. When I get some [alternative] income I will stop. For now, I sell [fuelwood] to buy coffee, salt and sugar (109, fuelwood collector).
Fuelwood collection and transport is physically taxing work and many women who
depend on fuelwood incomes complain of chronic pain and back injuries. However,
limited economic alternatives lead women to rely upon fuelwood sales despite
awareness of the ecological and personal costs.
The fuelwood that is collected and sold by local women feeds urban energy markets and
supports the distillation of a grain alcohol known as arake. Also produced by women,
arake is a regional specialty distilled in large quantities in the nearby town of Arsi
Negele. Production requires high fuelwood, time and labor inputs. Like fuelwood sale, it
is considered a difficult and undesirable way to make a living, but is among the few
livelihood options available to women. One relatively successful arake distiller in Arsi
Negele who has collaborated with university researchers on the development of fuel-
efficient stoves stated: “Show me an alternative to this work and I will gladly do it!”
(144, arake brewer) again underscoring the lack of livelihood alternatives.
The scenarios and interview data presented next provoke questions and concerns over
livelihood limitations. In particular, they call into question the extent to which poverty
reduction – environmental conservation interventions accurately represent and address
local realities and aspirations.
4.3.2 Current Land Use
The study site is located on the edge of a government-run forest plantation known as
the Forest Enterprise (Map 4.2). The natural forest, where the majority of fuelwood is
collected, is located to the east of this plantation. The northeast corner of the kebele is
marked by the Lepis River and Forest Enterprise compound. The northern boundary is
marked by a dirt and gravel road that leads to the town of Arsi Negele, located
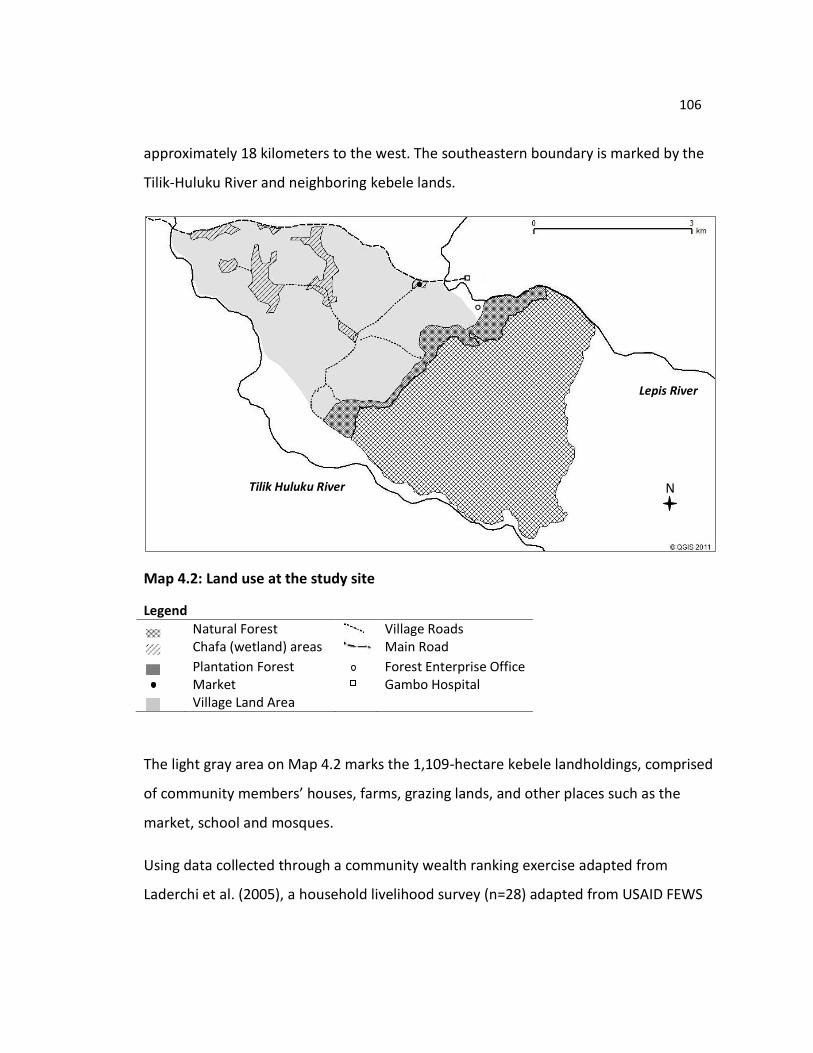
106
approximately 18 kilometers to the west. The southeastern boundary is marked by the
Tilik-Huluku River and neighboring kebele lands.
Map 4.2: Land use at the study site
Legend
Natural Forest Village Roads
Chafa (wetland) areas Main Road
Plantation Forest Forest Enterprise Office Market Gambo Hospital
Village Land Area
The light gray area on Map 4.2 marks the 1,109-hectare kebele landholdings, comprised
of community members’ houses, farms, grazing lands, and other places such as the
market, school and mosques.
Using data collected through a community wealth ranking exercise adapted from
Laderchi et al. (2005), a household livelihood survey (n=28) adapted from USAID FEWS
N
Lepis River
Tilik Huluku River
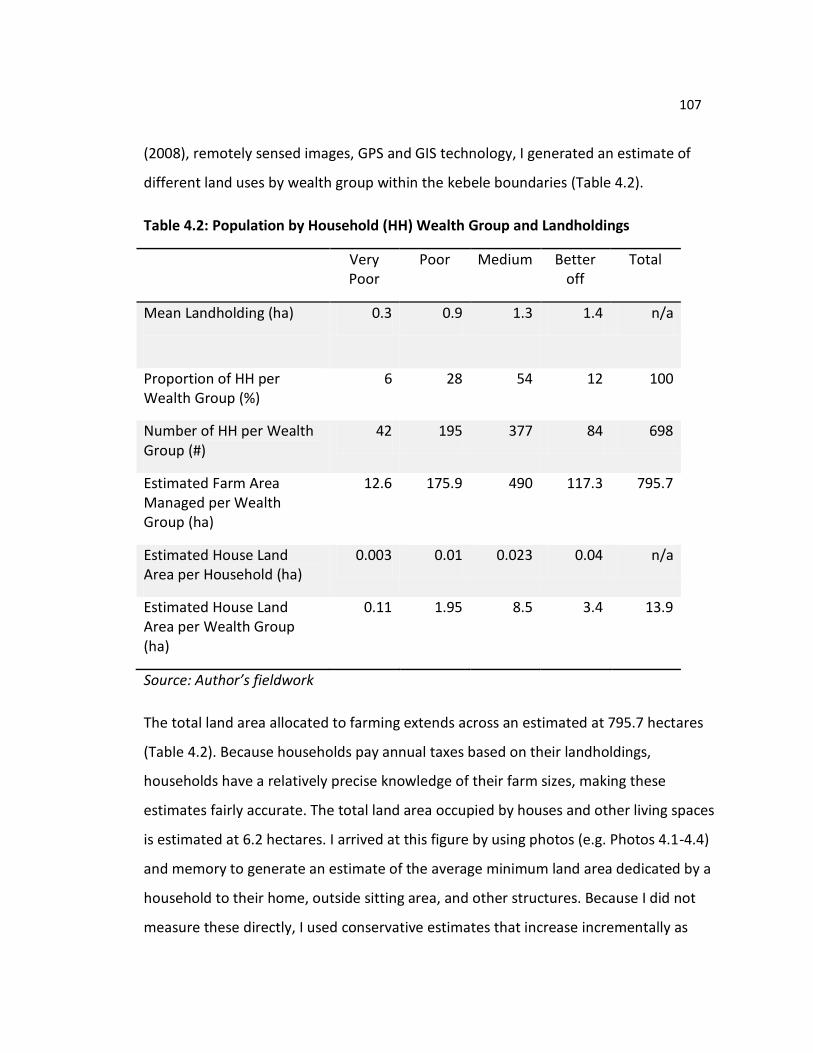
107
(2008), remotely sensed images, GPS and GIS technology, I generated an estimate of
different land uses by wealth group within the kebele boundaries (Table 4.2).
Table 4.2: Population by Household (HH) Wealth Group and Landholdings
Very Poor
Poor Medium Better off
Total
Mean Landholding (ha)
0.3 0.9 1.3 1.4 n/a
Proportion of HH per Wealth Group (%)
6 28 54 12 100
Number of HH per Wealth Group (#)
42 195 377 84 698
Estimated Farm Area Managed per Wealth Group (ha)
12.6 175.9 490 117.3 795.7
Estimated House Land Area per Household (ha)
0.003 0.01 0.023 0.04 n/a
Estimated House Land Area per Wealth Group (ha)
0.11 1.95 8.5 3.4 13.9
Source: Author’s fieldwork
The total land area allocated to farming extends across an estimated at 795.7 hectares
(Table 4.2). Because households pay annual taxes based on their landholdings,
households have a relatively precise knowledge of their farm sizes, making these
estimates fairly accurate. The total land area occupied by houses and other living spaces
is estimated at 6.2 hectares. I arrived at this figure by using photos (e.g. Photos 4.1-4.4)
and memory to generate an estimate of the average minimum land area dedicated by a
household to their home, outside sitting area, and other structures. Because I did not
measure these directly, I used conservative estimates that increase incrementally as
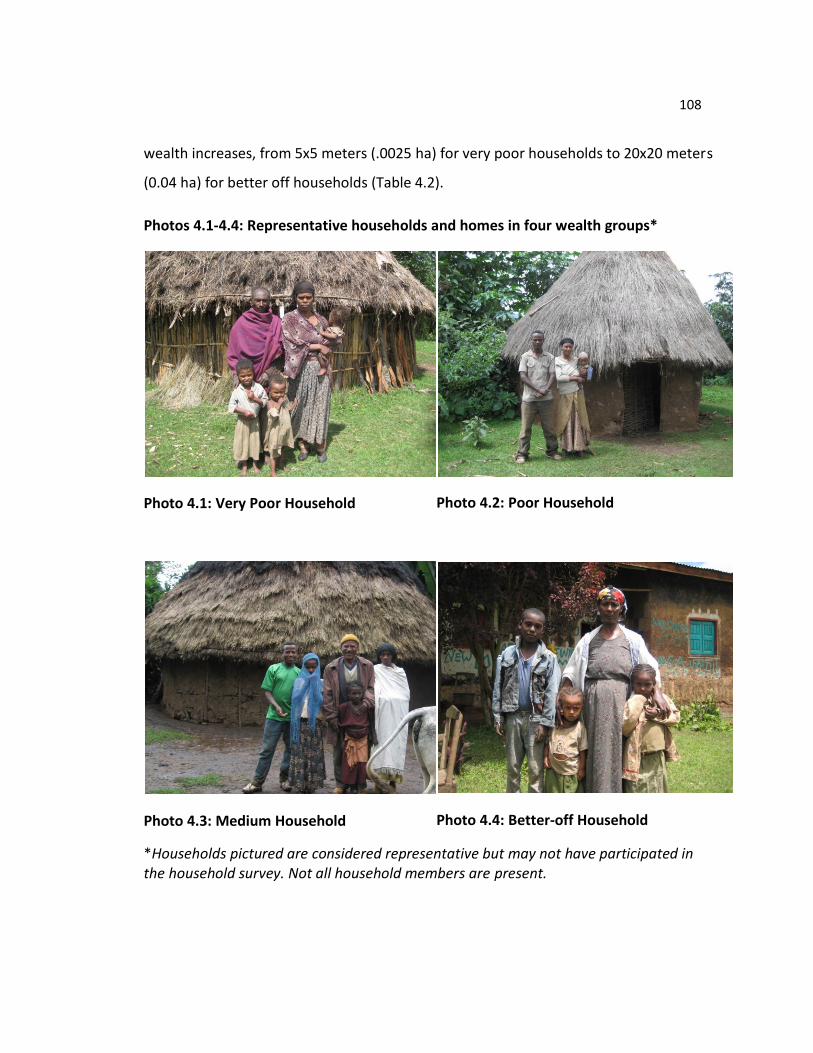
108
wealth increases, from 5x5 meters (.0025 ha) for very poor households to 20x20 meters
(0.04 ha) for better off households (Table 4.2).
Photos 4.1-4.4: Representative households and homes in four wealth groups*
Photo 4.1: Very Poor Household
Photo 4.2: Poor Household
Photo 4.3: Medium Household
Photo 4.4: Better-off Household
*Households pictured are considered representative but may not have participated in the household survey. Not all household members are present.
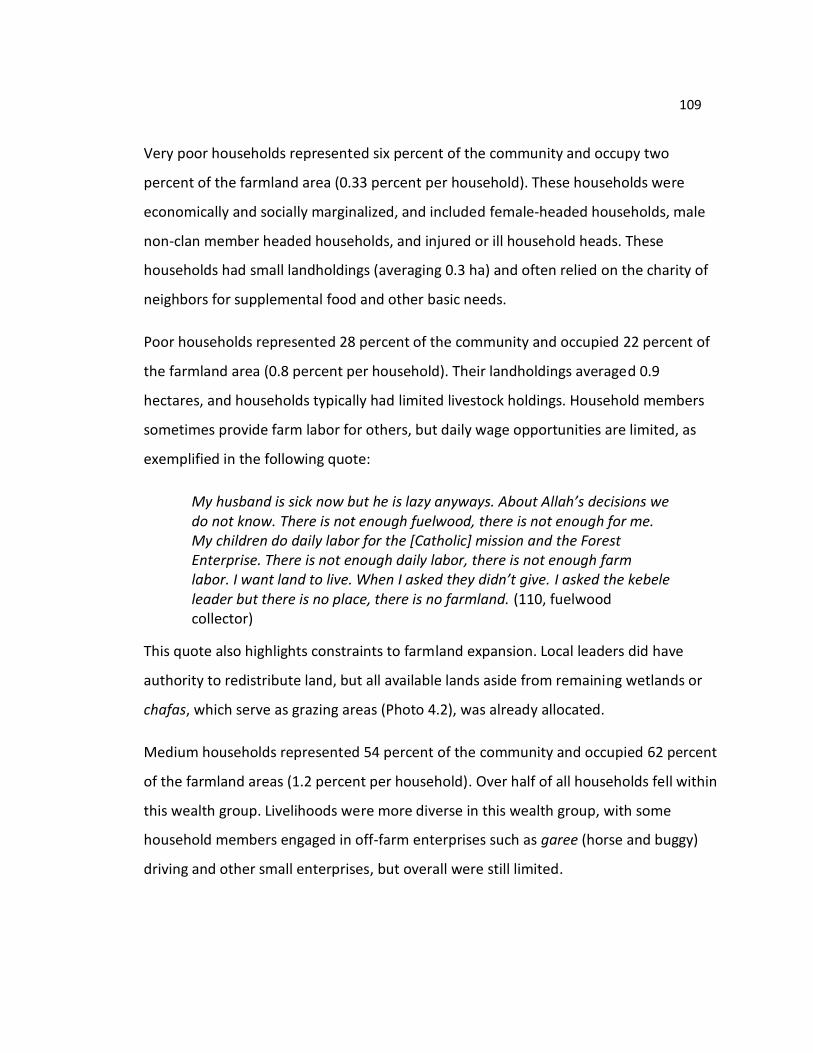
109
Very poor households represented six percent of the community and occupy two
percent of the farmland area (0.33 percent per household). These households were
economically and socially marginalized, and included female-headed households, male
non-clan member headed households, and injured or ill household heads. These
households had small landholdings (averaging 0.3 ha) and often relied on the charity of
neighbors for supplemental food and other basic needs.
Poor households represented 28 percent of the community and occupied 22 percent of
the farmland area (0.8 percent per household). Their landholdings averaged 0.9
hectares, and households typically had limited livestock holdings. Household members
sometimes provide farm labor for others, but daily wage opportunities are limited, as
exemplified in the following quote:
My husband is sick now but he is lazy anyways. About Allah’s decisions we do not know. There is not enough fuelwood, there is not enough for me. My children do daily labor for the [Catholic] mission and the Forest Enterprise. There is not enough daily labor, there is not enough farm labor. I want land to live. When I asked they didn’t give. I asked the kebele leader but there is no place, there is no farmland. (110, fuelwood collector)
This quote also highlights constraints to farmland expansion. Local leaders did have
authority to redistribute land, but all available lands aside from remaining wetlands or
chafas, which serve as grazing areas (Photo 4.2), was already allocated.
Medium households represented 54 percent of the community and occupied 62 percent
of the farmland areas (1.2 percent per household). Over half of all households fell within
this wealth group. Livelihoods were more diverse in this wealth group, with some
household members engaged in off-farm enterprises such as garee (horse and buggy)
driving and other small enterprises, but overall were still limited.
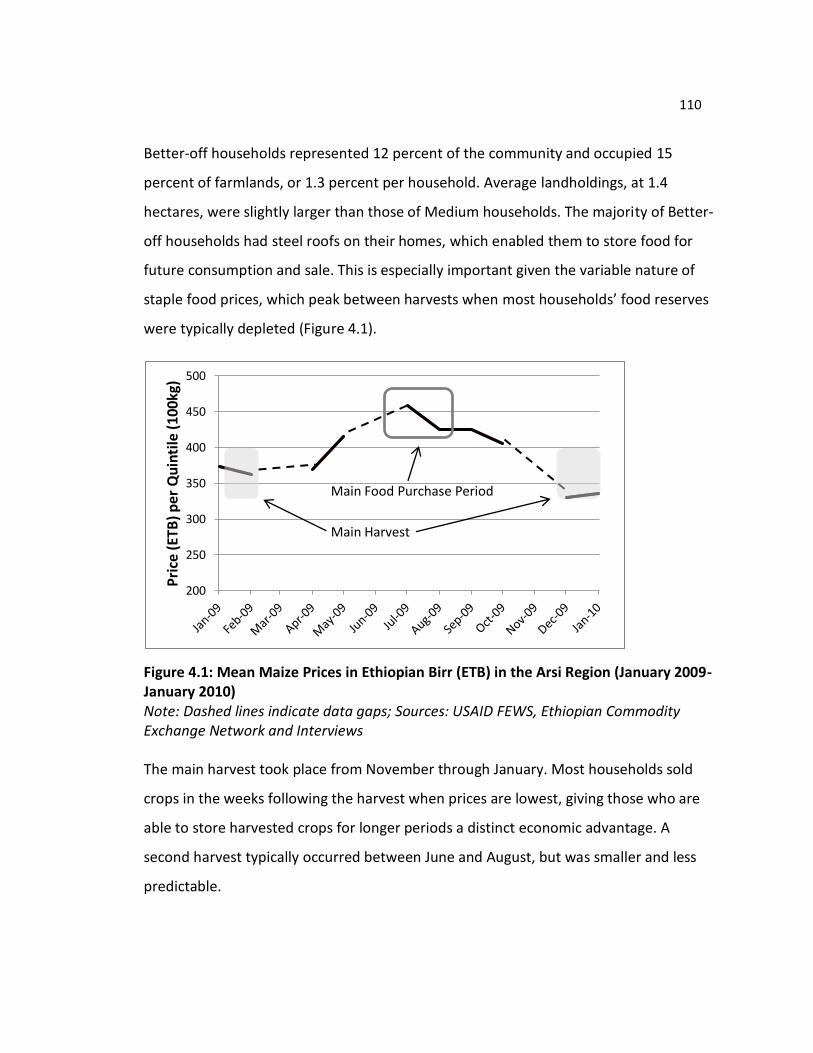
110
Better-off households represented 12 percent of the community and occupied 15
percent of farmlands, or 1.3 percent per household. Average landholdings, at 1.4
hectares, were slightly larger than those of Medium households. The majority of Better-
off households had steel roofs on their homes, which enabled them to store food for
future consumption and sale. This is especially important given the variable nature of
staple food prices, which peak between harvests when most households’ food reserves
were typically depleted (Figure 4.1).
Figure 4.1: Mean Maize Prices in Ethiopian Birr (ETB) in the Arsi Region (January 2009-January 2010) Note: Dashed lines indicate data gaps; Sources: USAID FEWS, Ethiopian Commodity Exchange Network and Interviews The main harvest took place from November through January. Most households sold
crops in the weeks following the harvest when prices are lowest, giving those who are
able to store harvested crops for longer periods a distinct economic advantage. A
second harvest typically occurred between June and August, but was smaller and less
predictable.
200
250
300
350
400
450
500
Pri
ce (
ETB
) p
er Q
uin
tile
(10
0kg)
Main Food Purchase Period
Main Harvest
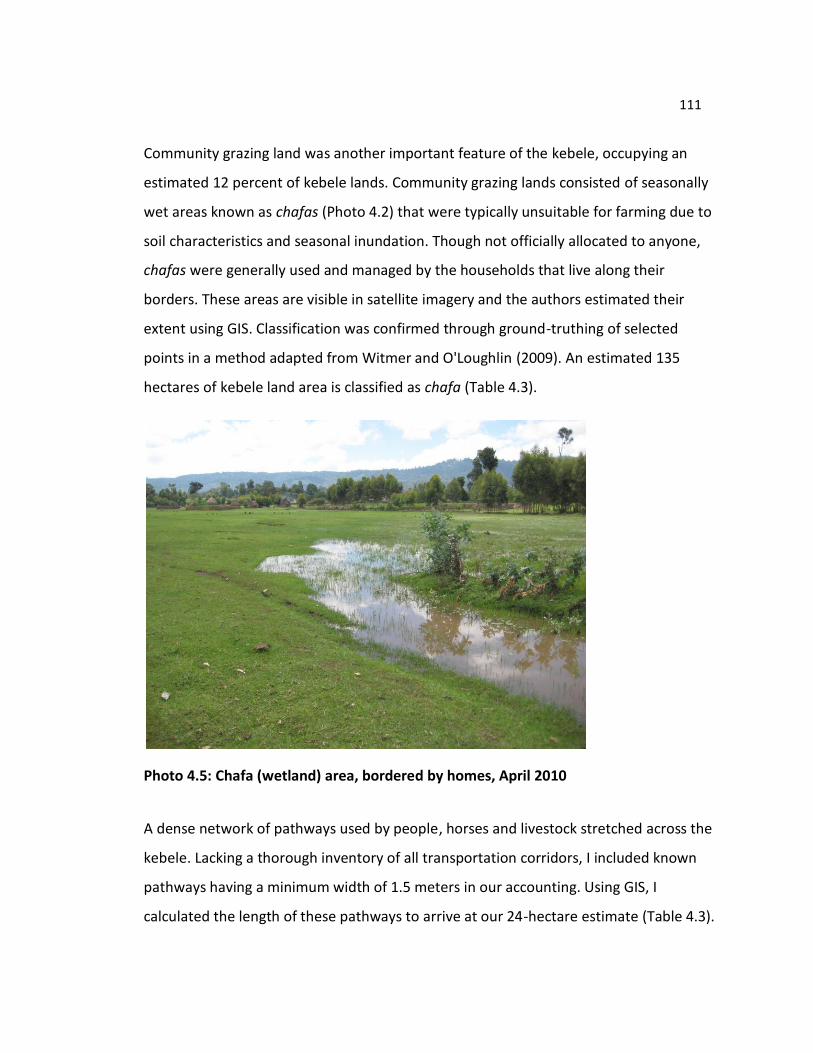
111
Community grazing land was another important feature of the kebele, occupying an
estimated 12 percent of kebele lands. Community grazing lands consisted of seasonally
wet areas known as chafas (Photo 4.2) that were typically unsuitable for farming due to
soil characteristics and seasonal inundation. Though not officially allocated to anyone,
chafas were generally used and managed by the households that live along their
borders. These areas are visible in satellite imagery and the authors estimated their
extent using GIS. Classification was confirmed through ground-truthing of selected
points in a method adapted from Witmer and O'Loughlin (2009). An estimated 135
hectares of kebele land area is classified as chafa (Table 4.3).
Photo 4.5: Chafa (wetland) area, bordered by homes, April 2010
A dense network of pathways used by people, horses and livestock stretched across the
kebele. Lacking a thorough inventory of all transportation corridors, I included known
pathways having a minimum width of 1.5 meters in our accounting. Using GIS, I
calculated the length of these pathways to arrive at our 24-hectare estimate (Table 4.3).
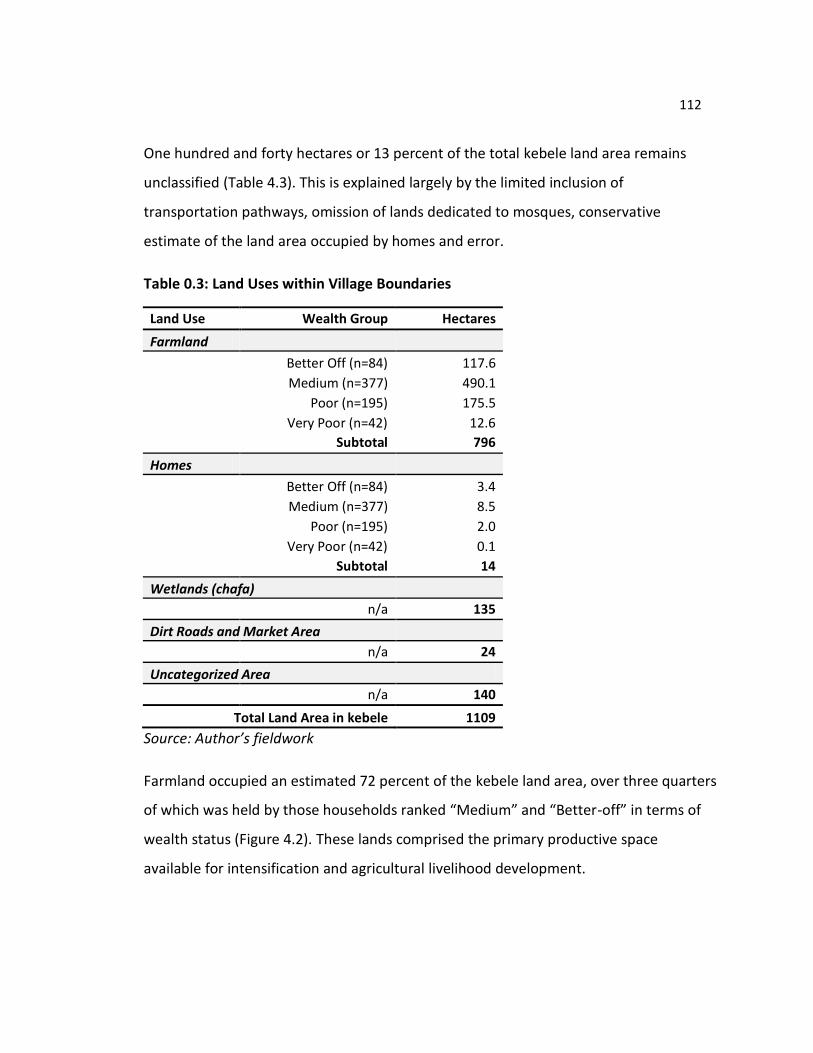
112
One hundred and forty hectares or 13 percent of the total kebele land area remains
unclassified (Table 4.3). This is explained largely by the limited inclusion of
transportation pathways, omission of lands dedicated to mosques, conservative
estimate of the land area occupied by homes and error.
Table 0.3: Land Uses within Village Boundaries
Land Use Wealth Group Hectares
Farmland Better Off (n=84) 117.6
Medium (n=377) 490.1 Poor (n=195) 175.5 Very Poor (n=42) 12.6
Subtotal 796
Homes Better Off (n=84) 3.4
Medium (n=377) 8.5 Poor (n=195) 2.0 Very Poor (n=42) 0.1
Subtotal 14
Wetlands (chafa) n/a 135
Dirt Roads and Market Area n/a 24
Uncategorized Area
n/a 140
Total Land Area in kebele 1109
Source: Author’s fieldwork
Farmland occupied an estimated 72 percent of the kebele land area, over three quarters
of which was held by those households ranked “Medium” and “Better-off” in terms of
wealth status (Figure 4.2). These lands comprised the primary productive space
available for intensification and agricultural livelihood development.
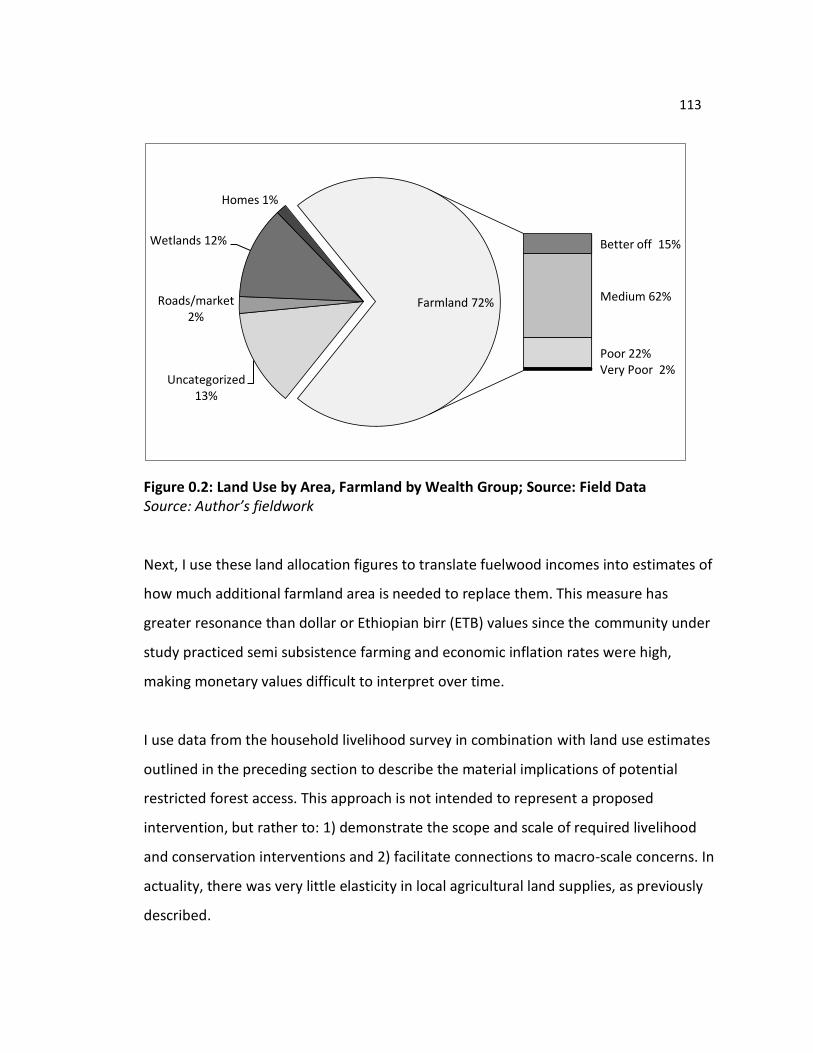
113
Figure 0.2: Land Use by Area, Farmland by Wealth Group; Source: Field Data Source: Author’s fieldwork
Next, I use these land allocation figures to translate fuelwood incomes into estimates of
how much additional farmland area is needed to replace them. This measure has
greater resonance than dollar or Ethiopian birr (ETB) values since the community under
study practiced semi subsistence farming and economic inflation rates were high,
making monetary values difficult to interpret over time.
I use data from the household livelihood survey in combination with land use estimates
outlined in the preceding section to describe the material implications of potential
restricted forest access. This approach is not intended to represent a proposed
intervention, but rather to: 1) demonstrate the scope and scale of required livelihood
and conservation interventions and 2) facilitate connections to macro-scale concerns. In
actuality, there was very little elasticity in local agricultural land supplies, as previously
described.
Uncategorized 13%
Roads/market 2%
Wetlands 12%
Homes 1%
Better off 15%
Medium 62%
Poor 22% Very Poor 2%
Farmland 72%
114
With the exception of wetland areas, there was no unoccupied land available for
additional cultivation. While most of the natural and plantation forest uses by
community members were technically illegal, forest products, in particular fuelwood,
contributed significantly to local livelihoods (See Chapters 2 and 3 for further detail).
4.3.3 Forest Incomes, Substitution Projections and Implications
In this section I explore potential implications of restricted forest access by presenting
two scenarios that enumerate the replacement costs of present day household
fuelwood incomes in terms of agricultural land. I use two hypothetical scenarios to
explore the cost of replacing fuelwood incomes with agricultural incomes. Fuelwood
income is translated into agricultural income, using additional agricultural land to
characterize the value of fuelwood incomes (i.e, income lost through restricted access to
fuelwood is expressed in equivalent units of agricultural production).
Yield projections are not adjusted for landholding size, wealth status, and other factors
that lower production. Scenarios represent minimum fuelwood replacement
requirements, and are therefore conservative in terms of the land area required to
make up for lost fuelwood incomes. Scenarios do not address the impacts of a number
of factors that constrain production in Ethiopia, including price fluctuations (Jayne,
Mather, and Mghenyi 2010), climate change (Thornton et al. 2011), the limited
availability of improved seed (Howard et al. 2003), unreliability of fertilizer delivery
(Spielman, Kelemwork, and Alemu 2011), and effects of political and social
marginalization on access to improved seeds and inputs (Pausewang 2009; HRW 2010).
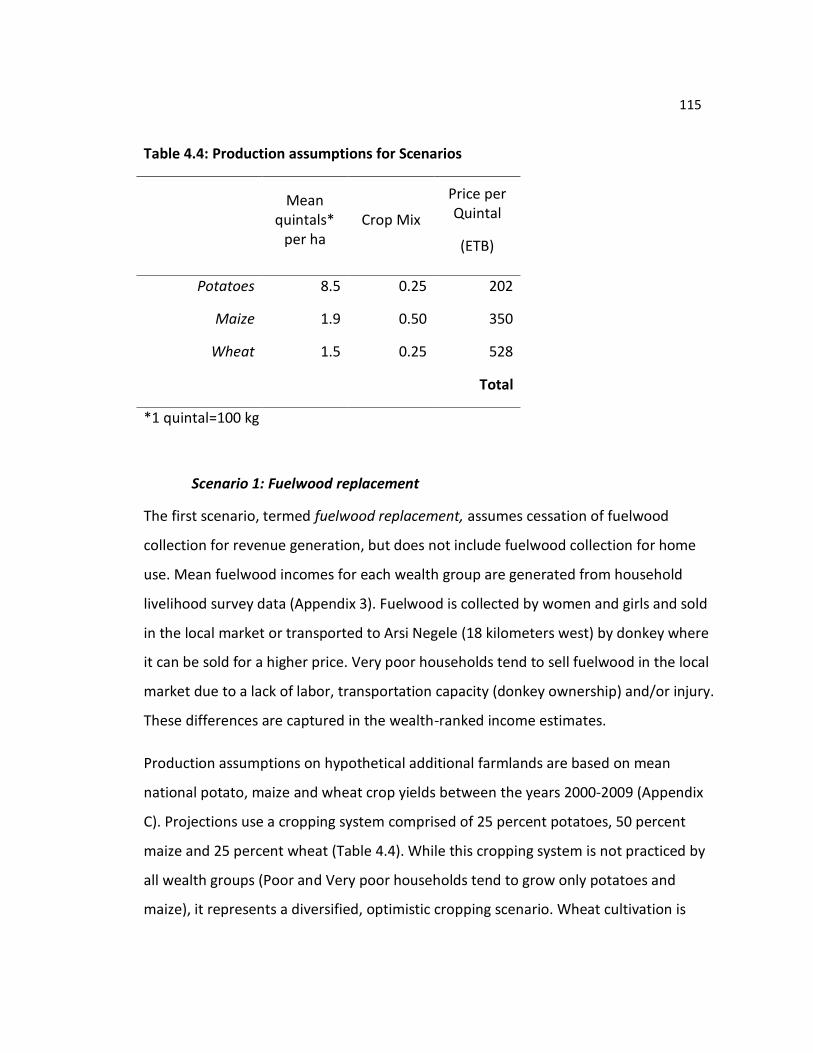
115
Table 4.4: Production assumptions for Scenarios
Mean quintals*
per ha Crop Mix
Price per Quintal
(ETB)
Potatoes 8.5 0.25 202
Maize 1.9 0.50 350
Wheat 1.5 0.25 528
Total
*1 quintal=100 kg
Scenario 1: Fuelwood replacement
The first scenario, termed fuelwood replacement, assumes cessation of fuelwood
collection for revenue generation, but does not include fuelwood collection for home
use. Mean fuelwood incomes for each wealth group are generated from household
livelihood survey data (Appendix 3). Fuelwood is collected by women and girls and sold
in the local market or transported to Arsi Negele (18 kilometers west) by donkey where
it can be sold for a higher price. Very poor households tend to sell fuelwood in the local
market due to a lack of labor, transportation capacity (donkey ownership) and/or injury.
These differences are captured in the wealth-ranked income estimates.
Production assumptions on hypothetical additional farmlands are based on mean
national potato, maize and wheat crop yields between the years 2000-2009 (Appendix
C). Projections use a cropping system comprised of 25 percent potatoes, 50 percent
maize and 25 percent wheat (Table 4.4). While this cropping system is not practiced by
all wealth groups (Poor and Very poor households tend to grow only potatoes and
maize), it represents a diversified, optimistic cropping scenario. Wheat cultivation is
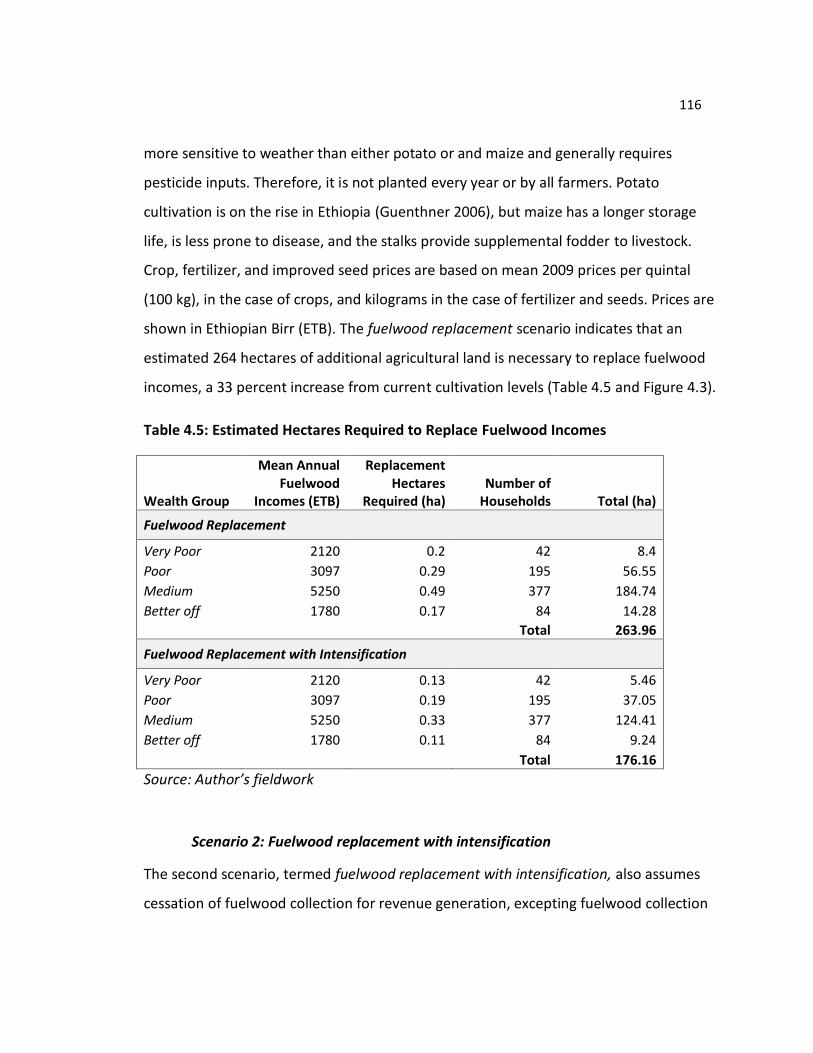
116
more sensitive to weather than either potato or and maize and generally requires
pesticide inputs. Therefore, it is not planted every year or by all farmers. Potato
cultivation is on the rise in Ethiopia (Guenthner 2006), but maize has a longer storage
life, is less prone to disease, and the stalks provide supplemental fodder to livestock.
Crop, fertilizer, and improved seed prices are based on mean 2009 prices per quintal
(100 kg), in the case of crops, and kilograms in the case of fertilizer and seeds. Prices are
shown in Ethiopian Birr (ETB). The fuelwood replacement scenario indicates that an
estimated 264 hectares of additional agricultural land is necessary to replace fuelwood
incomes, a 33 percent increase from current cultivation levels (Table 4.5 and Figure 4.3).
Table 4.5: Estimated Hectares Required to Replace Fuelwood Incomes
Wealth Group
Mean Annual Fuelwood
Incomes (ETB)
Replacement Hectares
Required (ha) Number of
Households Total (ha)
Fuelwood Replacement
Very Poor 2120 0.2 42 8.4
Poor 3097 0.29 195 56.55
Medium 5250 0.49 377 184.74
Better off 1780 0.17 84 14.28
Total 263.96
Fuelwood Replacement with Intensification
Very Poor 2120 0.13 42 5.46
Poor 3097 0.19 195 37.05
Medium 5250 0.33 377 124.41
Better off 1780 0.11 84 9.24
Total 176.16
Source: Author’s fieldwork
Scenario 2: Fuelwood replacement with intensification
The second scenario, termed fuelwood replacement with intensification, also assumes
cessation of fuelwood collection for revenue generation, excepting fuelwood collection
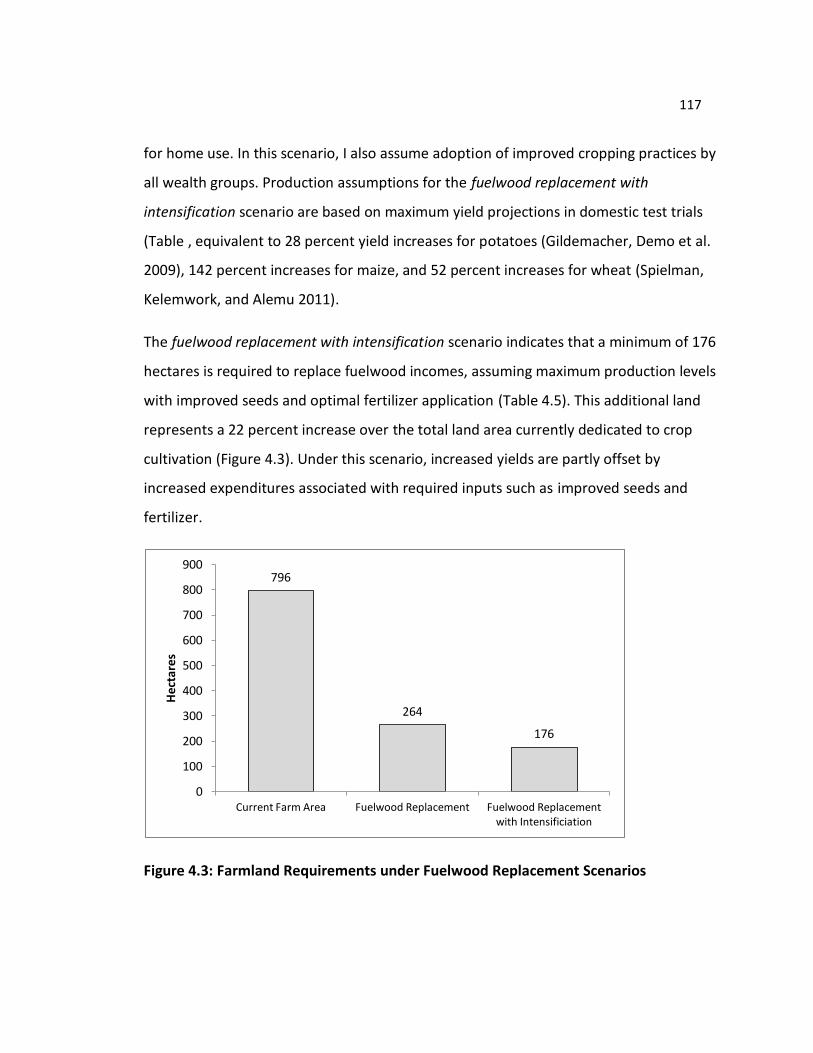
117
for home use. In this scenario, I also assume adoption of improved cropping practices by
all wealth groups. Production assumptions for the fuelwood replacement with
intensification scenario are based on maximum yield projections in domestic test trials
(Table , equivalent to 28 percent yield increases for potatoes (Gildemacher, Demo et al.
2009), 142 percent increases for maize, and 52 percent increases for wheat (Spielman,
Kelemwork, and Alemu 2011).
The fuelwood replacement with intensification scenario indicates that a minimum of 176
hectares is required to replace fuelwood incomes, assuming maximum production levels
with improved seeds and optimal fertilizer application (Table 4.5). This additional land
represents a 22 percent increase over the total land area currently dedicated to crop
cultivation (Figure 4.3). Under this scenario, increased yields are partly offset by
increased expenditures associated with required inputs such as improved seeds and
fertilizer.
Figure 4.3: Farmland Requirements under Fuelwood Replacement Scenarios
796
264
176
0
100
200
300
400
500
600
700
800
900
Current Farm Area Fuelwood Replacement Fuelwood Replacement with Intensificiation
Hec
tare
s
118
4.4 Discussion
“Allah says it is important to live with four things: trees, water, wisdom and leadership” (117, community elder)
The scenarios described in Section 4.3 represent an attempt to translate the
implications of reduced forest access into a measure that bears relevance across local,
national, and global scales. In the attempt to make this translation, I describe both the
magnitude of the contribution of fuelwood incomes to livelihoods and also the gaps
inherent to these kinds of approaches.
4.4.1 Poverty Alleviation
While these scenarios provide a tangible means to understand the value of fuelwood
incomes, they do not yet touch upon poverty alleviation goals. The minimum estimated
cost in terms of land area of bringing Very poor and Poor households up to the income
status of Medium-ranked households is an additional 182 hectares, assuming
production levels outlined in the fuelwood replacement scenario. This assessment in
turn raises the question of what constitutes an “acceptable” level of poverty, a thorny
question that underpins approaches that quantify tradeoffs. In order to be successful,
interventions aimed at reducing or eliminating human pressures on forests and
improving rural livelihoods must account for both lost forest incomes and needed
livelihood improvements. Accomplishing only the former fails to address poverty
concerns and will likely be unsustainable.
4.4.2 Resource Constraints
The scenarios presented suggest that rural economies in the study region face serious
development constraints. There is certainly room for agricultural intensification,
improved access to credit, storage facilities, and other interventions aimed at improving
farm incomes. Agricultural research in Ethiopia has yielded a wealth of information to
inform interventions directed at farmers, including: gaining access to improved seeds
119
(Poonyth and Hassan 2000; Tura et al. 2010; Feleke and Zegeye 2006; Howard et al.
2003), understanding production risks (Gildemacher, Demo et al. 2009; Gildemacher,
Kaguongo et al. 2009; Hirpa et al.), managing price risks (Fufa and Hassan 2006),
identifying problems and opportunities associated with agricultural extension (Alene
and Coulibaly 2009), and improving marketing strategies (Guenthner 2006; Bingen,
Serrano, and Howard 2003). Conservation-oriented livelihoods can also contribute to
livelihood development and diversification, but due diligence should be paid to
exploring the limits of proposed interventions. Approaches tend to emphasize “trees
and water” with less attention paid to “wisdom and leadership.” Critics assert that
interventions are grounded in erroneous notions of development trajectories8, a false
“fantasy” of eventual smallholder integration into global market economies, and
paternalistic assumptions that most smallholders aspire that they and their children will
remain in agriculture (Hall 2009; Li; Oya 2009). Hall asks:
“Where, for the World Bank, are agriculture and development supposed to be going?...This aversion to thinking about the future of ‘agrarian transition’ represents, perhaps, a characteristic tension in neoliberal policymaking: the combination of extremely detailed prescriptions for how life should be organized today with a resistance to any visions of the future” (2009, 607-608).
The contribution of forests to rural livelihoods is generally underestimated (Angelsen et
al. 2011). Still, most interventions fail to make even vague estimates of the degree to
which forests contribute to local livelihoods and how forest benefits are distributed
among community members. Predominant development perspectives reveal a lack of
commitment to the consideration of what diversified, viable livelihood futures might
look like. For many rural people facing declining resource access there is “no pathway
from country to city, agriculture to industry, or even a clear pathway into stable
8 Specifically, that there is a linear upward progression from farm-based to transitional and finally to urban-based livelihoods that in time, all people may access and that will lead to progressive improvements in the quality of life (Hall 2009).
120
plantation work that pays a living wage”(Li, 296). When faced with resource constraints,
policymakers tend to look down, towards intensification, rather than up, at the multiple
pathways available and at addressing how macro-economic factors perpetuate poverty.
The use of agricultural land as a proxy for fuelwood incomes also retains a connection to
physical space inherent to rural resource access, rather than presenting abstracted
monetary values. Policymakers can perhaps more easily disassociate dollar or birr
figures from local social, political, ecological and economic constraints, imagining new
income flows from hoped-for ecotourism, ecosystem service payment programs that
transcend the power and access disparities that characterize natural resource use and
livelihood alternatives. One scientist working for a large international environmental
organization in the Arsi forest described local forests as “precious environmental and
economic assets already under siege from encroachment and climactic factors” (140,
scientist). This statement places the onus on the shoulders of local people and on the
nebulous, apolitical phenomenon of climate change (Swyngedouw 2010). It suggests
that the predominant need is for interventions geared towards halting local forest
encroachment and combating climate change. This poverty alleviation-environmental
conservation narrative disconnects local realities from broader social and economic
factors.
In the context of climate change, agricultural intensification is not itself carbon neutral.
Agricultural intensification can also lead to increased greenhouse gas emissions (Melillo
et al. 2009). Yield-improving innovations and “precision” approaches are more efficient
than simple increases in fertilizer application (Burney, Davis, and Lobell 2010) but still
require high levels of technical capacity. Developing sustainable farming systems amidst
dense and growing human populations is among the major challenges identified by
contemporary agricultural scientists working in Africa (Tittonell et al. 2009, Zingore et al.
2009). In recognition of the trend towards increased competition for land among
121
African smallholder farmers, researchers have sought to identify ways to increase
production per unit of land area. Typically, proposed solutions involve input
intensification and “qualitative jumps” in the overall system state, typically brought
about through a combination of capital investment and livelihood diversification
(Thornton et al. 2007).
4.4.3 Problematic Assumptions
In examining the assumption associated with converting fuelwood incomes into
farmland incomes, we are confronted by the interrelated nature of local economies with
macro-scale processes. This dynamic is illustrated by fuelwood markets. In the absence
of a comprehensive energy plan that would establish fuelwood plantations or replace
charcoal and wood-based cooking with other forms of energy, the enforcement of
fuelwood collection restrictions might have 1) displacement effects and 2) disparate
economic impacts on women. With respect to displacement, informal fuelwood markets
in Arsi Negele are fed by highland Arsi forests and lowland acacia woodlands.
Governance and enforcement is generally weaker in lowland areas (Beyene 2009),
increasing the likelihood that the enforcement of fuelwood harvest restrictions in the
highlands would drive increased harvest in the lowlands.
Women of all wealth groups relied upon the forest as a total or partial income source.
New livelihoods, based in farms, ecotourism or other sources, will develop new
hierarchies of power and control. The ‘energy ladder’ concept, which states that
because of income and substitution effects, poorer households are most dependent on
forest fuels, has been shown to be flawed, because in many cases medium and better
off households actually harvest more forest products than poorer ones (Baland et al.
2007; Hobley 2005). Perhaps what is needed now is a ‘gender ladder’ approach that can
122
help policymakers and resource managers understand how replacement incomes affect
women’s access to livelihoods.
4.5 Conclusion
Concerns over climate change, food security and deforestation have refocused the
attention of governments and development agencies towards smallholder farmers.
Proposed interventions such as REDD+, that are designed to mitigate global climate
change though forest conservation and carbon payments, have also brought issues of
land use to the foreground. A review of poverty alleviation – environmental
conservation narratives, indicates that livelihoods and natural resource access are
imbedded in larger systems. In considering agricultural land area as a proxy for forest
fuelwood values, it becomes more difficult to disassociate solutions from local, regional
and national socio-economic systems. Dominant discourses tend to confine discussions
about poverty and deforestation to local levels, limiting our capacity to see how politics,
ecology, and economies interact at macro level scales to reproduce these conditions. As
previously mentioned, there is some room for agricultural intensification though this
will not be sufficient to offset poverty. Poverty is a condition as well as a product of
social and economic relations. A development “discourse that classifies and prioritizes
the deserving poor or that does not address the power relations that keep people poor
invariably (a) excludes significant segments and (b) fails to recognise [sic] and attack
some of the deep causes of poverty” (Moncrieffe 2004, 47).
The scenarios presented in this chapter suggest that restricting access to fuelwood
would generate need for alternative sources of income. Increasing agricultural
production (extensification) to levels sufficient to replace fuelwood income is not
feasible because of limited agricultural land. Intensification has associated economic
and ecological costs further complicated by additional political and social hurdles. In
123
some cases, agricultural extensification and intensification may not necessarily be viable
solutions to forest degradation.
While working with smallholder farmers to improve production will likely continue to be
an important aspect of livelihood security interventions, researchers and policymakers
increase attention to looking “upward” into macroeconomics, trade policy, and global
institutional reform for solutions. There are “multiple pathways” that can be explored,
specifically focused on information transparency, commodity markets, aid and
development delivery and growth.
124
Chapter 5 - Conclusion
The three preceding chapters describe relationships between household livelihoods and
land use change in a community located at highland Ethiopia’s farm-forest periphery.
These chapters provide a background for considering core questions about household
livelihoods in the context of historic and emerging forest values. In Chapter 1 I
introduced two composite characters, Amiina and Kadiija, whose experiences typify
those of many women in their community. For these and other women, forest products
serve as an integral part of household economies. A lack of livelihood alternatives for
themselves, their husbands and their children is a primary concern. Few opportunities
are available now or appear on the horizon, aside from nebulous hopes that if they can
provide their children with an education, they will be positioned to take advantage of
off-farm employment opportunities that do not exist in sufficient numbers. Households
have sought to find ways to manage livelihood requirements in the face of declining
resources and socio-political marginalization that are aggravated as populations grow
and competition increases for remaining natural resources. This typifies the context in
which many emerging economic development and conservation programs, including
ecotourism, REDD+ and CDM, are proposed and implemented, and partially explains
why many of them fail. Replacing forest incomes is not sufficient to lift households out
of poverty and does not address differential resource access of households within
communities or the active sources of vulnerability production that perpetuate poverty.
As described in Chapter 2, the conditions that make households vulnerable are
generated across space and time. Vulnerability is produced through historic and
contemporary processes including those associated with markets, environmental
change, policies, social security systems and planning. While the mechanisms of
vulnerability creation are location-specific and grounded in particular social, political,

125
economic and ecological realities, vulnerability is the outcome of processes of
marginalization that operate at many scales. Predominant areas of active vulnerability
production that emerged in the case include exploitation, resource access and political
exclusion. Because vulnerability is produced at local, regional, national and international
levels, a multi-scalar approach is necessary to understand how processes act across
scales to shape vulnerability.
Forests provide significant benefits to households that live at forest peripheries. As
described in Chapter 3, forest access regimes have developed over decades, and yet
households are vulnerable because of the informal nature of their claims and their
relatively weak socio-political influence. Inadequate scrutiny over the widespread
clearing of forests for agriculture negatively impacts local livelihoods, forests, and
potential future engagement in forest-based activities. Transparent processes for
dispute resolution are not in place. The ability of local people to make successful
livelihood claims will likely diminish in the face of new tenures that draw their legitimacy
from markets rather than local values. History has shown that the interests of more
powerful and wealthy actors such as investors and development agencies will likely
trump local concerns, underscoring the need for a comprehensive approach to securing
local resource rights that will require leverage from outside actors and organizations.
Historic forest benefit distributions are obscured by contemporary narratives that cast
smallholders as the lone agents of forest conversion and degradation. These
inaccuracies legitimize interventions that serve to further divest rural people of their
forest access claims while obscuring the role of the state and extra-local elites in land
use change. Serious attempts to alter the economic and ecological trajectories of the
rural poor require significant reinvestment in social and natural capital.
Contemporary solutions to rural poverty and household vulnerability often involve
agricultural intensification. Though likely a part of the solution in many places, I argue in
126
Chapter 4 that the potential for agricultural intensification to reduce rural vulnerability
is overstated, especially in the absence of comprehensive efforts address issues of
power and access. Successful market-based agricultural intensification depends on a
host of factors not limited to market access, reliable and affordable access to inputs and
knowledge. Areas of active vulnerability production highlighted in Chapter 2, including
exploitation, resource access and political exclusion, suggests that the need for social
and political reform may take precedence over market reform in Ethiopia. Chapter 4
also speaks to the potential for programs that propose to replace forest incomes with
alternative ones to reduce rural vulnerability. The approaches fail to account for 1) the
unique ability of forests to provide marginalized groups with income and 2) the need for
economic growth rather than merely income substitution.
The preceding three chapters support assertions by other researchers that programs
that restrict “access to forest resources may relegate rural people towards livelihood
deprivation” (Babulo et al. 2009, 117) and aggravate income inequalities (Kamanga,
Vedeld, and Sjaastad 2009). Together, these chapters paint a detailed picture of how
household livelihood dynamics interact with social, political, ecological and economic
factors. Next, I draw together unifying concepts, outline policy recommendations and
describe ideas for future research.
5.1 Unifying Concepts
The three chapters presented in this dissertation illuminate livelihood-related impacts of
historic, contemporary and potential future forest benefit distributions.
As described in Chapters three and four, the natural forest area under study has
diminished considerably in terms of extent and quality, but it still remains a forest, with
associated material (e.g. fuelwood and fodder), and categorical (e.g. eligibility for
payments for ecosystem service programs and reforestation projects) benefits. Chapter
127
four demonstrates how the repeated calls for smallholder agricultural intensification
may not be sufficient to alter the circumstances that produce rural poverty. This
research raises fundamental questions about what, and for whom, is a forest. The
transition from subsistence-based to global capitalist networks of production transforms
social relations as well as basic perceptions of how forests should and can be valued.
Associated with these shifts are changing ideas about how to make forests and people’s
lives “better”. What seem like simple interventions are, at closer inspection, often
intimately connected to broader economic and political systems that have profound
implications on social relations, hierarchies of power and livelihood opportunities at the
local scale. Meaningful shifts may only become possible through a reconsideration of
what equitable resource management looks like, and with attention to macro and meso
scale policies and programs that are not commonly associated with rural household
vulnerability. The historic focus of rural development on local-level interventions like
improved cropping techniques, livestock fattening and small scale water storage diverts
attention away from the macro and meso scale factors that play a large role in creating
the conditions that underpin insecure livelihoods in many parts of the world today.
5.2 Policy Recommendations
Policy recommendations are presented next and are organized by scale, including
household, bioregion, regional/national and international. While additional
recommendations stem from and relate to those listed below, I endeavor to keep the
list brief to highlight those most directly related to this research:
5.2.1 Household-level Policy Recommendations
This dissertation addresses the benefits and limitations associated with examining rural
poverty through the lens of the household. Households hold diverse capabilities and
entitlements, yet policies tend to represent the rural poor as relatively homogenous,
masking the social and political realities that shape resource access in practice. While
128
rural development experts and natural resource managers may endeavor to improve
household livelihoods, the conditions that create rural poverty often result from
processes that exist well beyond the scale of the household. It is thus necessary to
devise conceptual tools for retaining a focus of interest on households while
acknowledging and addressing the multiple factors that create vulnerability at regional,
national and international scales. Efforts to address household vulnerability will
necessarily need to pay attention to macro scale institutions, processes, policies and
power relations.
Given the precarious socio-economic position of marginalized groups including women-
headed households, livelihood diversification programs should expressly acknowledge
the subordinate position of women in decision-making. Since local social and political
systems often disfavor women and outsiders, a balance that emphasizes both
decentralized approaches and external advocacy is necessary. Equally important is
recognition of the fact that in many parts of the world including Ethiopia, rural people
may be broadly considered a marginalized group. Their access to information,
education, opportunity and capital is limited, and they often have little capacity to
improve their lives beyond cultivating hopes for favorable rains. They are often excluded
from formal processes to codify access rights, and have limited to no access to channels
through which they might express dissenting opinions or oppose the actions of those
who are more powerful. These realities speak directly to payment for ecosystem service
programs that propose to reduce human impacts on forests through cash payments or
ecotourism projects that impose access restrictions in exchange for economic benefits
that will accrue to selected households. Existing areas of active vulnerability production
including access, exploitation and political marginalization will not disappear through
the creating of a new funding mechanism. Other economic diversification programs
such as those related to ecotourism and foreign investment mechanisms similarly
require understanding of the fact that, unless explicitly addressed in policy and program
129
development, income diversification programs that increase management intensity will
be subject to the same processes that shape vulnerability and poverty among rural
households today.
5.2.2 Ecoregion-level Policy Recommendations
While there is a tendency among development organizations and governments to seek
broadly-applicable frameworks for program implementation, there is a need for
investment in the development of programs that support local forest values and
livelihood needs. Researchers will continue to refine valuation protocols for determining
the contribution of forests and other natural resources to local livelihoods, but can also
accept that they may never be fully understood, and will be subject to continuous
change. We can also consider more seriously the need to improve local livelihood
security by working with communities to steward the resources that have local
economic, cultural, spiritual and political value for them, rather than for carbon
sequestration, export or other external values. In some cases, managing forests for local
interests may increase the likelihood that forest benefits will be retained for local
purposes in the long term, rather than being captured by external elites for their high
value timber, carbon payments and ecotourism revenues.
Particularly in the context of foreign investment and payment for ecosystem service
programs that involve long-term land use commitments, there is a need to work with
communities to explore household and individual aspirations for the future, investigate
how they can be achieved, and promote transparency in understanding opportunities
and constraints to different livelihood trajectories. Alongside these efforts, attention
should be paid towards promoting transparency concerning the terms of engagement
for investors and other actors who seek to alter forest management and forest benefit
distributions.
130
5.2.3 Regional/National-level Policy Recommendations
Given the high costs of education relative to rural income, the revisiting of educational
fee structures may help re-route farm incomes back to farm-based asset building, which
is an important aspect of household vulnerability reduction. One study of 2,000 villages
across Ethiopia showed that the average travel time to a secondary school is five hours
(Burlando 2009). More investment in the construction of local high schools will help
ameliorate the costs borne by households to send children away to high school.
Programs that emphasize vocational training and business development may also
promote more diversified livelihoods.
Land tenure is a focal issue for many development experts and certainly needs attention
at regional and national levels. Instead of simply pointing to the need for more formal
land rights, I emphasize the importance of the establishment of a multi-stakeholder
process involving local people, zonal, regional and national actors and outsiders. More
formalized land tenure systems have the potential to exclude as well as include, and as
emphasized in Chapter two, the narratives and histories that have shaped access claims
need to be documented so that rural people and advocates can make comprehensive
resource rights claims in the face of emerging resource investments.
5.2.4 International-level Policy Recommendations
Simplistic narratives regarding the rural poor and deforestation have proven remarkably
resilient, and often serve to promote paternalistic, short-sighted solutions to problems.
Given population growth projections, fuelwood demand in rural and urban areas will
likely only increase in the absence of comprehensive rural electrification programs.
Whether in the form of large energy generation projects or small-scale alternative
energy production advances, significant planning and investment is needed to bring
stable and affordable sources of electric power to all people.
131
Large advances can be made in the area of information transparency to help 1) rural
people voice their opinions and gain access to information and resources, and 2)
outsiders advocate on behalf of rural rights through knowledge of corporate practices
and investment flows. For example, research from the Oakland Institute on Land Grabs
highlights to role of US-based private equity funds in driving land grabbing in Africa
(2011). This kind of research can help investors monitor the impacts of their
investments and in the long term inform the development of anticipated rates of return
on investments that do not exploit the rural poor.
An independent task force specifically geared towards understanding rural vulnerability
in the context of climate change, conservation and food security should be established
to monitor funding streams. A global tribunal that would provide a system of recourse
in the event of negligence or mis-implementation of programs affecting rural
livelihoods and natural resource access would also serve as an important avenue for
rural people to voice concerns and seek redress for exploitation and mismanagement.
5.3 Future Research
Following the need for multi-scalar approaches to household vulnerability reduction
described earlier in this chapter, the ideas for future research that I propose in this
section span a range of scales and institutions.
In the field of forestry, there is a need for additional research to develop protocols for
native tree propagation and establishment. Despite the existence of post-harvest
reforestation regulations in Ethiopia, there are few examples of successful native
projects. One challenge is a limited understanding of how to propagate and establish
native highland tree species. Research could focus on developing dependable protocols
for native tree and shrub propagation. There is also a need for native tree growth and
yield models, particularly as forest-based mitigation program expand in East Africa.
132
While there are growth and yield models available for common plantation species (e.g.
Teshome 1996; Ngugi, Mason, and Whyte 2000) they do not exist for most native tree
species. Growth and yield models for smaller stature trees that yield other benefits,
such as fodder and medicine, would be helpful for planning pro-poor carbon
sequestration projects.
The relationship between land use, livelihoods and food security is a recurrent theme in
contemporary research and policy development. Much of this research aims at
developing globally applicable indicators. Though important, this approach will likely be
inadequate to unearth active case-specific processes of vulnerability generation.
Additional case study research detailing relationships between land use, livelihoods and
food security could complement quantitative studies and help policymakers better
understand the complex relationships between them. Programs such as
the Consultative Group on International Agricultural Research’s (CGIAR) program on
Climate Change, Agriculture and Food Security (CCAFS) and the Center for International
Forestry Research’s (CIFOR) Poverty Environment Network have called for more
rigorous, globally applicable data collection methods to understand rural livelihoods.
Parallel research funded by the same programs should be undertaken to investigate
how to best generate locally applicable data and explore how it differs from global data
collection methods. While large datasets have obvious appeal, the diversity of social,
cultural, political, economic and historic realities mean that location-specific research
will always be critical to understanding livelihood security and land use change.
More research into the diverse vulnerability implications of economic development and
conservation programs should also be a priority. Communities are made up of
heterogeneous households with different entitlements and capabilities. These dynamics
need to be better understood and accounted for as programs proceed, in order to avoid
unintended political and economic exclusion. Researchers have developed strong
133
models for tracing the webs of relations that facilitate the transfer of economic benefits
from producers to outside actors and corporations in export commodity production.
However, few models exist to help researchers understand these dynamics in semi-
subsistence agricultural contexts. This is an area ripe for research and the development
of conceptual models since the majority of the rural poor are engaged in semi-
subsistence crop production.
The ideas mentioned in this section revolve around the need for increased attention to
1) the diversity of households in rural communities and 2) the connections between
rural vulnerability and larger social, political and economic processes.
134
BIBLIOGRAPHY
Aalbaek, A., and T. Kide. 1993. Seed Zones: Ethiopia and Eritrea. In Native Tree Project,
Ashoka in the Southeast Upper wet broad-leaved Afro-montane Rainforest. Addis Ababa: Ethiopian Mapping Authority.
Ackerman, F., and E. A. Stanton. 2011. Climate Risks and Carbon Prices: Revising the social cost of carbon, 1-30. Portland, OR: Economics for Equity and Environment.
Adger, W. N., T. A. Benjaminsen, K. Brown, and H. Svarstad. 2001. Advancing a Political Ecology of Global Environmental Discourses. Development & Change 32:681-715.
Adger, W. N., P. M. Kelly, A. Winkels, L. Q. Huy, and C. Locke. 2002. Migration, Remittances, Livelihood Trajectories, and Social Resilience. Ambio 31 (4):358-366.
AGRI Africa. 2009. Strategy for an African Green Revolution, 1-20. Nairobi: Alliance for a Green Revolution in Africa.
Agribusiness, T. 2004. Forest Rehabilitation and Natural Coffee Production Enhancement and Trade, 1-14. Addis Ababa: FARM Africa and SOS Sahel International/ UK Participatory Forest Management Programme (PFMP).
Alene, A. D., and O. Coulibaly. 2009. The impact of agricultural research on productivity and poverty in sub-Saharan Africa. Food Policy 34 (2):198-209.
Ali, D. A., S. Dercon, and M. Gautam. 2011. Property rights in a very poor country: tenure insecurity and investment in Ethiopia. Agricultural Economics 42 (1):75-86.
Alpert, P. 1996. Integrated Conservation and Development Projects: Examples from Africa. BioScience 46 (11):845-855
Angelsen, A. 2001. Playing Games in the Forest: State-Local Conflicts of Land Appropriation. Land Economics 77 (2):285-299.
———. 2010. Policies for reduced deforestation and their impact on agricultural production. Proceedings of the National Academy of Sciences 107 (46):19639-19644.
Angelsen, A., H. O. Larsen, J. F. Lund, C. Smith-Hall, and S. Wunder eds. 2011. Measuring Livelihoods and Environmental Dependence: Methods for Research and Fieldwork. London: Earthscan.
Ansoms, A., and A. McKay. 2010. A quantitative analysis of poverty and livelihood profiles: The case of rural Rwanda. Food Policy 35 (6):584-598.
Babulo, B., B. Muys, F. Nega, E. Tollens, J. Nyssen, J. Deckers, and E. Mathijs. 2009. The economic contribution of forest resource use to rural livelihoods in Tigray, Northern Ethiopia. Forest Policy and Economics 11 (2):109-117.
135
Bacon, C., V. E. Mendez, M. E. Flores Gomez, D. Stuart, and S. R. D. Flores. 2008. Are sustainable coffee certifications enough to secure farmer livelihoods? The millennium development goals and Nicaragua's Fair Trade cooperatives. Globalizations 5 (2):259-274.
Baerwald, T. J. 2010. Prospects for Geography as an Interdisciplinary Discipline. Annals of the Association of American Geographers 100 (3):493 - 501.
Baland, J.-M., P. Bardhan, S. Das, D. Mookherjee, and R. Sarkar. 2007. The Environmental Impact of Poverty: Evidence from Firewood Collection in Rural Nepal, b1-48.
Bassett, T. J. 2010. Slim pickings: Fairtrade cotton in West Africa. Geoforum 41 (1):44-55. Becker, L. C. 2001. Seeing Green in Mali's Woods: Colonial legacy, forest use and local
control. Annals of the Association of American Geographers 91 (3):504-526. Bekele-Tesemma, A. 2007a. Economic Significance of Industrial-Forest Cum Forest-
Industry Development Focus: Important Poverty Alleviation Opportunity Being Squandered In Ethiopia. Paper read at Economic and Institutional Aspect of Forestry in Ethiopia – Debub University, Wondo Genet College of Forestry.
———. 2007b. Useful trees and shrubs for Ethiopia: identification, propagation and management for 17 agroclimatic zones. Nairobi: World Agroforestry Centre.
Belay, K., and D. Abebaw. 2004. Challenges facing agricultural extension agents: A case study from south-western Ethiopia. African Development Review-Revue Africaine De Developpement 16 (1):139-168.
Beyene, F. 2009. Property rights conflict, customary institutions and the state: the case of agro-pastoralists in Mieso district, eastern Ethiopia. The Journal of Modern African Studies 47 (02):213-239.
Bigsten, A., and A. Shimeles. 2008. Poverty Transition and Persistence in Ethiopia: 1994-2004. World Development 36 (9):1559-1584.
Bingen, J., A. Serrano, and J. Howard. 2003. Linking farmers to markets: different approaches to human capital development. Food Policy 28 (4):405-419.
Bliss, J., and E. Kelly. 2008. Comparative Advantages of Small-Scale Forestry Among Emerging Forest Tenures. Small-scale Forestry 7:95-104.
Block, S. A., C. B. Barrett, and D. G. Maxwell. 2005. Food Aid After Fifty Years: Recasting its role. London: Routledge.
Bongers, F., and T. Tennigkeit eds. 2010. Degraded Forests in Eastern Africa: Management and Restoration. Washington, D.C.: Earthscan.
Bordieu, P. 1984. Distinction: A Social Critique of the Judgement of Taste. London: Routledge.
Brace, C., and H. Geoghegan. 2011. Human geographies of climate change: Landscape, temporality, and lay knowledges. Progress in Human Geography 35 (3):284-302.
Brandon, K. 1995. People, parks, forests or fields. A realistic view of tropical forest conservation. Land Use Policy 12 (2):137-144.
136
Browder, J. O. 2002. The urban-rural interface: Urbanization and tropical forest cover change. Urban Ecosystems 6 (1):21-41.
Brown, L. 2011. Egypt's Food Supply in Danger New York Times, June 1, 2011. Burlando, A. 2009. Does Malaria Reduce Education? Findings from the Ethiopian
Highlands, 1-29. Boston, MA: Boston University. Burney, J. A., S. J. Davis, and D. B. Lobell. 2010. Greenhouse gas mitigation by
agricultural intensification. Proceedings of the National Academy of Sciences 107 (26):12052-12057.
Bussmann, R. 2001. Succession and Regeneration Patterns of East African Mountain Forests. Systematics of Geography and Plants 71 (2):959-974.
Calvo, C., and S. Dercon. 2005. Measuring Individual Vulnerability. In Department of Economics Paper Discussion Series, 1-32. Oxford: University of Oxford.
Centre, U. N. 2011. Sustainable agriculture key to green growth, poverty reduction – UN officials: UN News Service.
Chapin, M. 2004. A Challenge to Conservationists. World Watch, 17-31. Cheng, S., Y. Hiwatashi, H. Imai, M. Naito, and T. Numata. 1989. Deforestation and
degradation of natural resources in Ethiopia: Forest management implications from a case study in the Belete-Gera Forest. Journal of Forest Research 3 (4):199-204.
Cline, W. R. 2004. Trade Policy and Global Poverty. Washington, DC: Center for Global Development, Institute for International Economics.
Colfer, C. J. P., D. Sheil, and M. Kishi. 2006. Forests and human health: assessing the evidence. In CIFOR Occasional Paper no. 45. Bogor, Indonesia: Center for International Forestry Research (CIFOR).
Cotula, L., S. Vermeulen, R. Leonard, and J. Keeley. 2009. Land grab or development opportunity? Agricultural investment and international land deals in Africa. London: FAO, IIED and IFAD.
Creswell, J. W., and V. P. Clark. 2007. Designing and Conducting Mixed Methods Research. Thousand Oaks, CA: Sage Publications
Crewett, W., and B. Korf. 2008. Ethiopia: Reforming Land Tenure. Review of African Political Economy 116 (203-220).
Cropper, M., C. Griffiths, and M. Mani. 1999. Roads, Population Pressures, and Deforestation in Thailand, 1976-1989. Land Economics 75 (1):58-73.
Daniel, S., and A. Mittal. 2010. (Mis)Investment in Agriculture: The Role of the International Finance Corporation in the Global Land Grab, 1-54. Oakland, CA: The Oakland Institute.
Dauvergne, P., and K. J. Neville. 2010. Forests, food, and fuel in the tropics: the uneven social and ecological consequences of the emerging political economy of biofuels. Journal of Peasant Studies 37 (4):631 - 660.
137
Davies, B., and R. Harre. 1990. Positioning: The discursive production of selves. Journal for the Theory of Social Behaviour 20 (1):43-63.
de Waal, A. 1991. Evil Days: 30 Years of War and Famine in Ethiopia. New York: Human Rights Watch.
DeFries, R. S., T. Rudel, M. Uriarte, and M. Hansen. 2010. Deforestation driven by urban population growth and agricultural trade in the twenty-first century. Nature Geoscience 3 (3):178-181.
Deininger, K., D. Byerlee, J. Lindsay, A. Norton, H. Selod, and M. Stickler. 2011. Rising Global Interest in Farmland: Can it Yield Sustainable and Equitable Benefits? In Agriculture and Rural Development, 1-264. Washington, DC: The World Bank.
Didha, D. A. 2008. Silvicultural Analysis of Natural Forest as a Basis for Silvicultural Planning in Munessa at Arsi Forest Enterprise Oromiya, Ethiopia. In Unpublished Thesis, 1-90. Hawassa: Hawassa University Wondo Genet College of Forestry and Natural Resources.
Donovan, D., W. deJong, and K.-I. Abe. 2007. Tropical Forests and Extreme Conflicts. In Extreme Conflict and Tropical Forests, eds. W. deJong, D. Donovan and K.-I. Abe. Dordrecht: Springer.
Duraiappah, A. K. 1998. Poverty and environmental degradation: A review and analysis of the nexus. World Development 26 (12):2169-2179.
Eakin, H. 2006. Weathering Risk in Rural Mexico: Climatic, Economic and Institutional Change. Tucson: University of Arizona Press.
Enterprise, A. F. 2010. New Established Forest Enterprises,1999 Arsi Negele, Ethiopia. Ewers, R. M. 2006. Interaction effects between economic development and forest cover
determine deforestation rates. Global Environmental Change 16 (2):161-169. FAO. 1987. ICS-data. Rome: Statistical Division, FAO. ———. 2011. Livestock and Environment Toolbox 2011 [cited August 2, 2011. Available
from http://www.fao.org/ag/againfo/programmes/en/lead/toolbox/Index.htm. FAOSTAT. 2011a. Food and Agricultural Commodities Production 2011 [cited June 2,
2011. Available from http://faostat.fao.org/site/339/default.aspx. ———. 2011b. PriceSTAT 2011 [cited May 8 2011]. Available from
http://faostat.fao.org/site/570/default.aspx#ancor. FDRE. 1998. National Action Programme to Combat Desertification, Ethiopia, ed. E. P.
Authority, 1-158. Addis Ababa. FEG. 2008. Livelihoods Integration Unit (LIU) Project, Household Economy: Conducting
the Baselines Training, Oromiya, 2008, 218. Addis Ababa: USAID, Government of Ethiopia.
Feldman, S., and C. Geisler. 2011. Land Grabbing in Bangladesh: In-Situ Displacement of Peasant Holdings. In International Conference on Global Land Grabbing, 1-15. Institute of Development Studies, University of Sussex, UK.
138
Feleke, S., and T. Zegeye. 2006. Adoption of improved maize varieties in Southern Ethiopia: Factors and strategy options. Food Policy 31:442–457.
FEWS. 2007. Oromiya Baseline Survey Phase 2, Version 10, ed. USAID. Addis Ababa. Fisher, B., S. L. Lewis, N. D. Burgess, R. E. Malimbwi, P. K. Munishi, R. D. Swetnam, R.
Kerry Turner, S. Willcock, and A. Balmford. 2011. Implementation and opportunity costs of reducing deforestation and forest degradation in Tanzania. Nature Clim. Change 1 (3):161-164.
Fisher, M., and G. Shively. 2005. Can income programs reduce tropical forest pressure? Income shocks and forest use in Malawi. World Development 33 (7):1115-1128.
Fisher, R., and P. Hirsch. 2008. Poverty and Agrarian-Forest Interactions in Thailand. Geographical Research 46 (1):74-84.
Fliegel, F. C. 1993. Diffusion Research in Rural Sociology: The record and prospects for the future. Westport: Greenwood Press.
Forsyth, T. 2003. Critical Political Ecology: the politics of environmental science. London; New York: Routledge.
———. 2008. Political ecology and the epistemology of social justice. Geoforum 39 (2):756-764.
Fufa, B., and R. M. Hassan. 2006. Income Risk and Crop Production Patterns of Small-Scale Farmers in Eastern Oromiya Region of Ethiopia. Eastern Africa Social Science Research Review 22 (1):87-101.
Fussel, H. M., and R. J. T. Klein. 2006. Climate change vulnerability assessments: An evolution of conceptual thinking. Climatic Change 75 (3):301-329.
Gates, B. 2011. Small Farmers Are the Answer In Bill and Melinda Gates Foundation: Foundation Blog, May 9, 2011. Seattle.
Gatzweiler, F., A. Reichhuber, and L. Hein. 2007. Why financial incentives can destroy economically valuable biodiversity in Ethiopia. ZEF-Discussion Papers on Development Policy (No.115):14 pp.
Geist, H., and E. Lambin. 2002. Proximate and Underlying Causes of Tropical Deforestation BioScience 52 (2):143-150.
Gildemacher, P., P. Demo, I. Barker, W. Kaguongo, G. Woldegiorgis, W. Wagoire, M. Wakahiu, C. Leeuwis, and P. Struik. 2009. A Description of Seed Potato Systems in Kenya, Uganda and Ethiopia. American Journal of Potato Research 86 (5):373-382.
Gildemacher, P., W. Kaguongo, O. Ortiz, A. Tesfaye, G. Woldegiorgis, W. W. Wagoire, R. Kakuhenzire, P. M. Kinyae, M. Nyongesa, P. C. Struik, and C. Leeuwis. 2009. Improving Potato Production in Kenya, Uganda and Ethiopia: A System Diagnosis. Potato Research 52:173-195.
Glaser, B. G., and A. L. Strauss. 1967. The Discovery of Grounded Theory: Strategies for Qualitative Research. Chicago: Aldine Publishing Company.
139
Gorenflo, L. J., and K. Brandon. 2005. Agricultural capacity and conservation in high biodiversity forest ecosystems. Ambio 34 (3):199-204.
———. 2006. Key human dimensions of gaps in global biodiversity conservation. BioScience 56 (9):723-731.
Grauab, H. R., T. M. Aidec, and N. I. Gasparrid. 2005. Globalization and Soybean Expansion into Semiarid Ecosystems of Argentina. Ambio: A Journal of the Human Environment 34 (3):265-266.
Green, M. 2006. Representing poverty and attacking representations: Perspectives on poverty from social anthropology. Journal of Development Studies 42 (7):1108-1129.
Guenthner, J. F. 2006. Development of On-Farm Potato Seed Tuber Production and Marketing Scheme: A Farmer-to-Farmer Volunteer Report. In Agricultural Economics Extension Series No. 06-01, 1-18. Moscow, Idaho: University of Idaho, Department of Agricultural Economics and Rural Sociology.
Guillozet, K., and J. Bliss. 2011. Household Livelihoods and Increasing Foreign Investment Pressure in Ethiopia’s Natural Forests. In LDPI Working Papers, No. 3, ed. R. Pointer, 1-25. Cape Town, South Africa: Land Deal Politics Initiative
Haile, G., and H. Assefa. 2006. Determinants of Foreign Direct Investment in Ethiopia: a timeseries analysis. In 4th International Conference on the Ethiopian Economy, 1-27. Addis Ababa.
Hajer, M. A. 1995. The Politics of Environmental Discourse: Ecological modernization and the policy process. Oxford: Clarendon Press.
Hall, D. 2009. The 2008 World Development Report and the political economy of Southeast Asian agriculture. Journal of Peasant Studies 36 (3):603 - 609.
Hammond, L. 2008. Journal of Refugee Studies: Strategies of Invisibilization: How Ethiopia's Resettlement Programme Hides the Poorest of the Poor. Journal of Refugee Studies 21 (4):517-536.
Hazell, P., C. Poulton, S. Wiggins, and A. Dorward. 2010. The Future of Small Farms: Trajectories and Policy Priorities. World Development 38 (10):1349-1361.
Hecht, S. B. 1993. The Logic of Livestock and Deforestation in Amazonia. BioScience 43 (10):687-695.
Hecht, S. B., S. Kandel, I. Gomes, N. Cuellar, and H. Rosa. 2006. Globalization, forest resurgence, and environmental politics in El Salvador. World Development 34 (2):308-323.
Hertel, T. W., M. B. Burke, and D. B. Lobell. 2010. The poverty implications of climate-induced crop yield changes by 2030. Global Environmental Change-Human and Policy Dimensions 20 (4):577-585.
Hirpa, A., M. Meuwissen, A. Tesfaye, W. Lommen, A. Oude Lansink, A. Tsegaye, and P. Struik. Analysis of Seed Potato Systems in Ethiopia. American Journal of Potato Research 87 (6):537-552.
140
Hobley, M. 2005. The Impacts of Degradation and Forest Loss on Human Well-Being and Its Social and Political Relevance for Restoration. In Forest Restoration in Landscapes: Beyond Planting Trees, eds. S. Mansourian, D. Vallauri and N. Dudley. New York: Springer.
Horne, F. 2011. Understanding Land Investment Deals in Africa Country Report: Ethiopia, eds. F. Mousseau and G. Sosnoff, 1-65. Oakland: The Oakland Institute.
Howard, J., E. Crawford, V. Kelly, M. Demeke, and J. J. Jeje. 2003. Promoting high-input maize technologies in Africa: the Sasakawa-Global 2000 experience in Ethiopia and Mozambique. Food Policy 28 (4):335-348.
HRW. 2010. Ethiopia, Development without Freedom: How Aid Underwrites Repression in Ethiopia, 1-111. New York, NY: Human Rights Watch.
Igoe, J., and D. Brockington. 2007. Neoliberal conservation: A brief introduction. Conservation and Society 5 (4):432-449.
Jaffe, D. 2007. Fair Trade Coffee, Sustainability, and Survival. Berkeley. Berkeley: University of California Press.
Jaffee, D., J. R. Kloppenburg Jr, and M. B. Monroy. 2004. Bringing the "Moral Charge" Home: Fair Trade within the North and within the South. Rural Sociology 69 (2):169-196.
Jahnke, H. E. 1982. Livestock Production Systems in Livestock Development in Tropical Africa: Kiel, FRG: Kieler Wissenschaftsverlag Vauk.
Jasanoff, S. 2004. States of Knowledge: the coproduction of science and sociel order. London: Routledge.
Jayne, T. S., J. Govereh, M. Wanzala, and M. Demeke. 2003. Fertilizer market development: a comparative analysis of Ethiopia, Kenya, and Zambia. Food Policy 28 (4):293-316.
Jayne, T. S., D. Mather, and E. Mghenyi. 2010. Principal Challenges Confronting Smallholder Agriculture in Sub-Saharan Africa. World Development 38 (10):1384-1398.
Jayne, T. S., T. Yamano, M. T. Weber, D. Tschirley, R. Benfica, A. Chapoto, and B. Zulu. 2003. Smallholder income and land distribution in Africa: implications for poverty reduction strategies. Food Policy 28 (3):253-275.
Johnstone, S., and J. Mazo. 2011. Global Warming and the Arab Spring. Survival: Global Politics and Strategy 53 (2):11-17.
Kamanga, P., P. Vedeld, and E. Sjaastad. 2009. Forest incomes and rural livelihoods in Chiradzulu District, Malawi. Ecological Economics 68 (3):613-624.
Kebede, B. 2002. Land tenure and common pool resources in rural Ethiopia: A study based on fifteen sites. African Development Review-Revue Africaine De Developpement 14 (1):113-149.
141
Keeley, J., and I. Scoones. 2000. Knowledge, power and politics: the environmental policymaking process in Ethiopia. Journal of Modern African Studies 38 (1):98-120.
———. Understanding environmental policy processes: cases from Africa. Earthscan, 2003 2003 [cited.
Kidan, T. 2010. Should we care about neoliberalism? Ethiopian Reporter, April 24, 2010. Klepeis, P., and C. Vance. 2003. Neoliberal Policy and Deforestation in Southeastern
Mexico: An Assessment of the PROCAMPO Program. Economic Geography 79 (3):221-240.
Klooster, D. 2005. Environmental certification of forests: The evolution of environmental governance in a commodity network. Journal of Rural Studies 21 (4):403-417.
Laderchi, C. R. 2005. Participatory Methods in the Analysis of Poverty. In Participatory Research and Development for Sustainable Agriculture and Natural Resource Management: A Sourcebook, eds. J. Gonsalves, T. Becker, A. Braun, D. Campilan, H. d. Chavez, E. Fajber, M. Kapiriri, J. Rivaca-Caminade and R. Vernooy. Ottawa: International Development Research Council.
Lambin, E. F., and P. Meyfroidt. 2011. Global land use change, economic globalization, and the looming land scarcity. Proceedings of the National Academy of Sciences 108 (9):3465–3472.
Larson, B. A., and D. W. Bromely. 1991. Natural resources prices, export policies, and deforestation: The case of Sudan. World Development 19 (10):1289-1297.
Larson, H. 2010. Ethiopia: Seeing Green - The Economic Potential of Ecotourism. Addis Fortune, March 30, 2010.
Lawder, D. 2010. US, others commit $880 mln in food security funds. Reuters, April 22, 2010.
Leach, G., and R. Mearns. 1996. The Lie of the Land: Challenging Received Wisdom on the African Environment. Oxford: James Currey Publishers.
Lefebvre, H. 1991. The Production of Space. Malden, MA: Wiley-Blackwell. Leichenko, R. M., and K. L. O'Brien. 2008. Environmental Change and Globalization:
Double Exposures. New York: Oxford University Press. Leisher, C., M. Sanjayan, J. Blockhus, A. Kontoleon, and S. N. Larsen. 2010. Does
Conserving Biodiversity Work to Reduce Poverty? A State of Knowledge Review. London: The Nature Conservancy, Cambridge University, IIED.
Lemenih, M., S. Feleke, and W. Tadesse. 2007. Constraints to smallholders production of frankincense in Metema district, North-western Ethiopia. Journal of Arid Environments 71 (4):393-403.
Li, T. M. 2010. Indigeneity, Capitalism, and the Management of Dispossession. Current Anthropology 51 (3):385-414.
———. 2011. Centering labor in the land grab debate. Journal of Peasant Studies 38 (2):281 - 298.
142
Liu, J., S. Fritz, C. F. A. v. Wesenbeeck, M. Fuchs, L. You, M. Obersteiner, and H. Yang. 2008. A spatially explicit assessment of current and future hotspots of hunger in Sub-Saharan Africa in the context of global change. Global and Planetary Change 64:222-235.
Lobell, D. 2011. Climate Change and Food Security. Paper read at Migration as Adaptation, April 29, 2011, at Stanford Institute for Research in the Social Sciences.
Lundgren, B., and L. Lundgren. 1969. The Munessa forest: A plant ecological study. In Minor research Tasks 2. Addis Ababa: CADU.
Mains, D. 2007. Neoliberal times: Progress, boredom, and shame among young men in urban Ethiopia. American Ethnologist 34 (4):659-673.
Mamo, G., E. Sjaastad, and P. Vedeld. 2007. Economic dependence on forest resources: A case from Dendi district, Ethiopia. Forest Policy and Economics 9 (8):916-927.
Margulis, S. 2004. Causes of deforestation of the Brazilian Amazon. Washington, D.C.: World Bank.
Markakis, J. 1987. National and Class Conflict in the Horn of Africa. Cambridge: Cambridge University Press.
McCusker, B., and E. R. Carr. 2006. The co-production of livelihoods and land use change: Case studies from South Africa and Ghana. Geoforum 37 (5):790-804.
McKenzie, D. 2009. Making Things the Same: Gases, Emission Rights and the Politics of Carbon Markets. Accounting, Organizations and Society 34:440-455.
McNeely, J. A., and S. J. Scherr. 2002. Ecoagriculture: Strategies To Feed The World And Save Wild Biodiversity. Washington, D.C.: Island Press.
Melese, A. T., and A. H. J. Helmsing. 2010. Endogenisation or enclave formation? The development of the Ethiopian cut flower industry. The Journal of Modern African Studies 8:35-66.
Melillo, J. M., J. M. Reilly, D. W. Kicklighter, A. C. Gurgel, T. W. Cronin, S. Paltsev, B. S. Felzer, X. Wang, A. P. Sokolov, and C. A. Schlosser. 2009. Indirect Emissions from Biofuels: How Important? Science 326 (5958):1397-1399.
Milas, S., and J. A. Latif. 2000. The Political Economy of Complex Emergency and Recovery in Northern Ethiopia. Disasters 24 (4):363.
MoA. 1990. Munessa Shashemene State Forest Project Management Plan, ed. F. M. P. D. /SFCDD/NRCDMD/MoA. Addis Ababa: Forest Management Planning Division.
Molotch, H. 1993. Review: The Space of Lefebvre. Theory and Society 22 (6):887-895. Moncrieffe, J. M. 2004. Power Relations, Inequality and Poverty: A concept paper for
the World Bank, ed. O. D. Institute, 1-51. London: World Bank. Naughton-Treves, L., M. B. Holland, and K. Brandon. 2005. The role of protected areas in
conserving biodiversity and sustaining local livelihoods. Annual Review of Environment and Resources 30:219-252.
143
Negra, C., and E. Wollenberg. 2010. Lessons from REDD+ for Agriculture, 1-66. Copenhagen, Denmark: The CGIAR Research Program, Climate Change, Agriculture and Food Security (CCAFS).
Neumann, R. P. 2001. Africa’s ‘last wilderness’: reordering space for political and economic control in colonial Africa Africa 71:641–665.
———. 2010. Political ecology II: theorizing region. Progress in Human Geography 34 (3):368–374.
Newell, P. 2011. The elephant in the room: Capitalism and global environmental change. Global Environmental Change 21:4-6.
Ngugi, M. R., E. G. Mason, and A. G. D. Whyte. 2000. New growth models for Cupressus lusitanica and Pinus patula in Kenya. Journal of Tropical Forest Science 12 (3):524-541.
Niemark, W. D., and J. L. Hough. 2000. Conserving Wildlife in Africa: Integrated Conservation and Development Projects and Beyond. BioScience 50 (7):585-592.
Nygren, A. 2000. Development discourses and peasant-forest relations: Natural resource utilization as social process. Development and Change 31 (1):11-34.
O'Brien, K. L., and R. M. Leichenko. 2000. Double exposure: assessing the impacts of climate change within the context of economic globalization. Global Environmental Change 10 (3):221-232.
O'Connor, D. 2008. Governing the global commons: Linking carbon sequestration and biodiversity conservation in tropical forests. Global Environmental Change 18 (3):368-374.
Offen, K. H. 2004. Historical Political Ecology: An Introduction. Historical Geography 32:19-42.
Otte, M. J., and P. Chilonda. 2002. Cattle and small ruminant production systems in sub-Saharan Africa: A systematic review, 13. Rome: Livestock Information Sector Analysis and Policy Branch, FAO Agriculture Department.
Oya, C. 2009. The World Development Report 2008: inconsistencies, silences, and the myth of ‘win-win’ scenarios. Journal of Peasant Studies 36 (3):593 - 601.
Pausewang, S. 2009. Exploring New Political Alternatives For The Oromo In Ethiopia: Report From Oromo Workshop And Its After-Effects 1-98. Bergen, Norway: Chr. Michelsen Institute.
Peet, R., and M. Watts. 2004. Liberation Ecologies: Environment, Development, Social Movement. London: Routledge.
Peluso, N. L., and J. C. Ribot. 2003. A Theory of Access. Rural Sociology 68 (2):153-181. Peluso, N. L., and M. Watts. 2001. Violent Environments. In Violent Environments, eds.
N. L. Peluso and M. Watts. Ithaca: Cornell University Press. Peters, P. 2009. Challenges in Land Tenure and Land Reform in Africa: Anthropological
Contributions. World Development 37 (8):1317-1325.
144
Poonyth, D., and R. M. Hassan. 2000. Determinant of Adoption an Intensity of use of Improved Maize Varieties in the Central Highlands of Ethiopia: A Tobit Analysis. Agrekon 39 (4):633-643.
Poulsen, G. 1973. CADU Forestry Activities, 1-144. Asela, Ethiopia: Chilalo Agricultural Development Unit.
Prins, H., and J. Wind. 1993. Research for nature conservation in south-east Asia. Biological Conservation (63):43-46.
Rahmato, D. 2009. The Peasant and the State: Studies in agrarian change in Ethiopia 1960-2000s. Addis Ababa: Addis Ababa University Press.
Reusing, M. 1998. Monitoring of Natural High Forests in Ethiopia, ed. D. G. f. T. Z. (GTZ). Addis Ababa.
———. 2000. Change Detection of Natural High Forests in Ethiopia Using Remote Sensing and GIS Techniques. In International Archives of Photogrammetry and Remote Sensing. Vol. XXXIII, Part B7, 1253-1258. Amsterdam.
Ribot, J. 2010. Vulnerability Does Not Fall from the Sky: Towards Multiscale, Pro-poor Climate Policy. In Social Dimensions of Climate Change: Equity and vulnerability in a warming world, eds. R. Mearns and A. Norton, 47-74. Washington, D.C.: World Bank.
Ribot, J., A. Agrawal, and A. Larson. 2006. Recentralizing While Decentralizing:How National Governments Reappropriate Forest Resources. World Development 34 (11):1864–1886.
Rice, A. 2009. Is There Such a Thing as Agro-Imperialism? New York Times Magazine, November 20, 2009.
Richardson, B. 2010. Big Sugar in southern Africa: rural development and the perverted potential of sugar/ethanol exports. Journal of Peasant Studies 37 (4):917 - 938.
Rocheleau, D. 1995. Maps, Numbers, Text and Context: Mixing Methods in Feminist Political Ecology. Professional Geographer 47 (4):458-466.
Roshetko, J. M., R. D. Lasco, and M. S. D. Angeles. 2007. Smallholder Agroforestry Systems for Carbon Storage. Mitigation and Adaptation Strategies for Global Change 12:219-242.
Rudel, T. K. 2007. Changing agents of deforestation: From state-initiated to enterprise driven processes, 1970–2000. Land Use Policy 24:35-41.
Sato, J. 2000. People in Between: Conversion and Conservation of Forest Lands in Thailand. Development & Change 31 (1):155.
Scherr, S. J., and J. A. McNeely. 2007. Farming With Nature: The Science and Practice of Ecoagriculture. Washington, D.C.: Island Press.
Schmook, B., and C. Vance. 2009. Agricultural Policy, Market Barriers, and Deforestation: The Case of Mexico's Southern Yucatán. World Development 37 (5):1015-1025.
145
Schwartzman, S., A. Alencar, H. Zarin, and A. P. S. Souza. 2010. Social Movements and Large-Scale Tropical Forest Protection on the Amazon Frontier: Conservation From Chaos Journal of Environment & Development 19 (3):274-299.
Scoones, I. 2009. Livelihoods perspectives and rural development. Journal of Peasant Studies 36 (1):171 - 196.
Scott, J. C. 1998. Seeing Like a State: How certain schemes to improve the human condition have failed. New Haven: Yale University Press.
———. 2009. The Art of Not Being Governed: An Anarchist History of Upland Southeast Asia. New Haven: Yale University Press.
Sen, A. 1976. Famines as failures of exchange entitlements. Economic and Political Weekly XI (31-33):1273-1280.
Sen, A. R., Values and Development (Oxford, Basil Blackwell). 1984. Resources, Values and Development Oxford: Basil Blackwell.
Seré, C., and H. Steinfeld. 1996. World livestock production systems: Current status, issues and trends. In FAO Animal Production and Health Paper, 127. Rome: FAO.
Serneels, P. 2004. The Nature of Unemployment in Ethiopia. Oxford: Center for the Study of African Economies.
Shank, R. 1994. Returnee Agricultural Crop and Land Assessment: a report based on the field trip conducted in early October to Metema and Humera returnee settlements in Regions 1 (Tigray) and 3 (Amhara), 1-14. Addis Ababa: United Nations Emergencies Unit for Ethiopia.
Shively, G., and S. Pagiola. 2004. Agricultural intensification, local labor markets, and deforestation in the Philippines. Environment and Development Economics 9:241-266.
Sivaramakrishnan, K. 1999. Modern Forests: Statemaking and Environmental Change in Colonial Eastern India. Stanford: Stanford University Press.
———. 2000. State Science and Development Histories: Encoding Local Forestry Knowledge in Bengal, India. Development & Change 31 (1):61-89.
Spielman, D. J., D. Kelemwork, and D. Alemu. 2011. Seed, Fertilizer, and Agricultural Extension in Ethiopia, Working Paper 020. In Ethiopia Strategy Support Program II (ESSP II), 40. Addis Ababa: Development Strategy and Governance Division, International Food Policy Research Institute.
Stake, R. 1995. The art of case study research. Thousand Oaks, CA: Sage Publications. Sunderland, T. C. H., C. Ehringhaus, and B. M. Campbell. 2007. Conservation and
development in tropical forest landscapes: a time to face the trade-offs? Environmental Conservation 34 (4):276-279.
Swyngedouw, E. 2010. Apocalypse Forever? Post-political Populism and the Spectre of Climate Change. Theory and Society 27 (2-3):213-232.
Taffesse, A. S., P. Dorosh, and S. Asrat. 2011. Crop Production in Ethiopia: Regional Patterns and Trends 32. Addis Ababa, Ethiopia: Development Strategy and
146
Governance Division, International Food Policy Research Institute, Ethiopia Strategy Support Program II.
Tapela, B. N. 2008. Livelihoods in the wake of agricultural commercialisation in South Africa's poverty nodes: insights from small-scale irrigation schemes in Limpopo Province. Development Southern Africa 25 (2):181-198.
Tchouassi, G. 2011. Microfinance, inequality and vulnerability: Empirical analysis from Central African countries. Journal of Development and Agricultural Economics 3 (4):150-156.
Teshome, E., A. Kinahan, and D. Randall. 2010. Land Cover Change Study of the Bale Mountain National Park 1-12. Robe, Ethiopia: Frankfurt Zoological Society and Bale Mountain National Park.
Teshome, T. 1996. A growth and yield model for Cupressus lusitanica in Munessa Shashemene State Forest Project (MSSFP), southwest Ethiopia. Hawassa, Ethiopia.
Thornton, P. K., R. B. Boone, K. A. Galvin, S. B. BurnSilver, M. M. Waithaka, J. Kuyiah, S. Karanja, E. González-Estrada, and M. Herrero. 2007. Coping strategies in livestock-dependent households in East and Southern Africa: A synthesis of four case studies. Human Ecology 35:461–476.
Thornton, P. K., P. G. Jones, P. J. Ericksen, and A. J. Challinor. 2011. Agriculture and food systems in sub-Saharan Africa in a 4 degrees C+ world. Philosophical Transactions of the Royal Society a-Mathematical Physical and Engineering Sciences 369 (1934):117-136.
Tolera, M., Z. Asfaw, M. Lemenih, and E. Karltun. 2008. Woody species diversity in a changing landscape in the south-central highlands of Ethiopia. Agriculture, Ecosystems and Environment. 128:52-58.
Tschirley, D. L., and R. Benfica. 2001. Smallholder agriculture, wage labour and rural poverty alleviation in land-abundant areas of Africa: evidence from Mozambique. The Journal of Modern African Studies 39 (02):333-358.
Tura, M., D. Aredo, W. Tsegaye, R. L. Rovere, G. Tesfahun, W. Mwangi, and G. Mwabu. 2010. Adoption and continued use of improved maize seeds: Case study of Central Ethiopia. African Journal of Agricultural Research 5 (17):2350-2358.
Turner, B. L., E. F. Lambin, and A. Reenberg. 2007. The emergence of land change science for global environmental change and sustainability. Proceedings of the National Academy of Sciences of the United States of America 104 (52):20666-20671.
Turner, W. R., K. Brandon, T. M. Brooks, R. Costanza, G. A. B. da Fonseca, and R. Portela. 2007. Global conservation of biodiversity and ecosystem services. BioScience 57 (10):868-873.
147
UNCTAD. 2000. An Investment Guide to Ethiopia: Opportunities and conditions, 1-72. New York and Geneva: United Nations Conference on Trade and Development, The International Chamber of Commerce and Price Waterhouse Cooper.
USAID. 2008. Livelihood Profile: Oromiya Region, Ethiopia Arsi, Bale Wheat and Barley (ABW) Livelihood Zone. Addis Ababa: Famine Early Warning System (FEWS).
———. 2009. USAID Responds to Global Food Crisis. Washington, DC: USAID. Valkila, J. 2009. Fair Trade organic coffee production in Nicaragua -- Sustainable
development or a poverty trap? Ecological Economics 68 (12):3018-3025. Vermeulen, S., and L. Cotula. 2010. Over the heads of local people: consultation,
consent, and recompense in large-scale land deals for biofuels projects in Afric. Journal of Peasant Studies 37 (4):899-916.
Walker, G., and H. Bulkeley. 2006. Geographies of environmental justice. Geoforum 37 (5):655-659.
Wells, M. P., and K. E. Brandon. 1993. The principles and practice of buffer zones and local participation in biodiversity conservation. Ambio 22 (2/3):157-162.
Wilson, M. 2008. Field Methods in Vegetation Science. Corvallis: University of Oregon. Witmer, F. D. W., and J. O'Loughlin. 2009. Satellite Data Methods and Application in the
Evaluation of War Outcomes: Abandoned Agricultural Land in Bosnia-Herzegovina after the 1992-1995 Conflict. Annals of the Association of American Geographers 99 (5):1033 - 1044.
World Bank. 2010. 10 Years of Experience in Carbon Finance: Insights from working with carbon markets for development & global greenhouse gas mitigation, 1-20. Washington, D.C.: World Bank.
Wunder, S., and B. Verbist. 2003. The impact of trade and macroeconomic policies on frontier deforestation. In Lecture Note 13. Nairobi: World Agroforestry Centre.
Yemiru, T., A. Roos, B. M. Campbell, and F. Bohlin. 2010. Forest incomes and poverty alleviation under participatory forest management in the Bale Highlands, Southern Ethiopia. International Forestry Review 12 (1):66-77.
Yeraswork, A. 2000. Twenty Years to Nowhere: Property Rights, Land Management and Conservation in Ethiopia. Lawrenceville: The Red Sea Press.
Yin, R. K. 2003. Case Study Research: Design and Methods. Thousand Oaks: Sage Publications.
Zhouri, A. 2004. Global–Local Amazon Politics: Conflicting Paradigms in the Rainforest Campaign. Theory Culture and Society 21 (2):69-89.
Zimmerer, K. S. 1994. Human Geography and the "New Ecology": the prospect and promise of integration. Annals of the Association of American Geographers 84 (1):108-125.
Zoomers, A. 2010. Globalisation and the foreignisation of space: seven processes driving the current global land grab. Journal of Peasant Studies 37 (2):429-447.
Zussman, R. 2004. People in Places. Qualitative Sociology 27:351-363.

148
APPENDICES
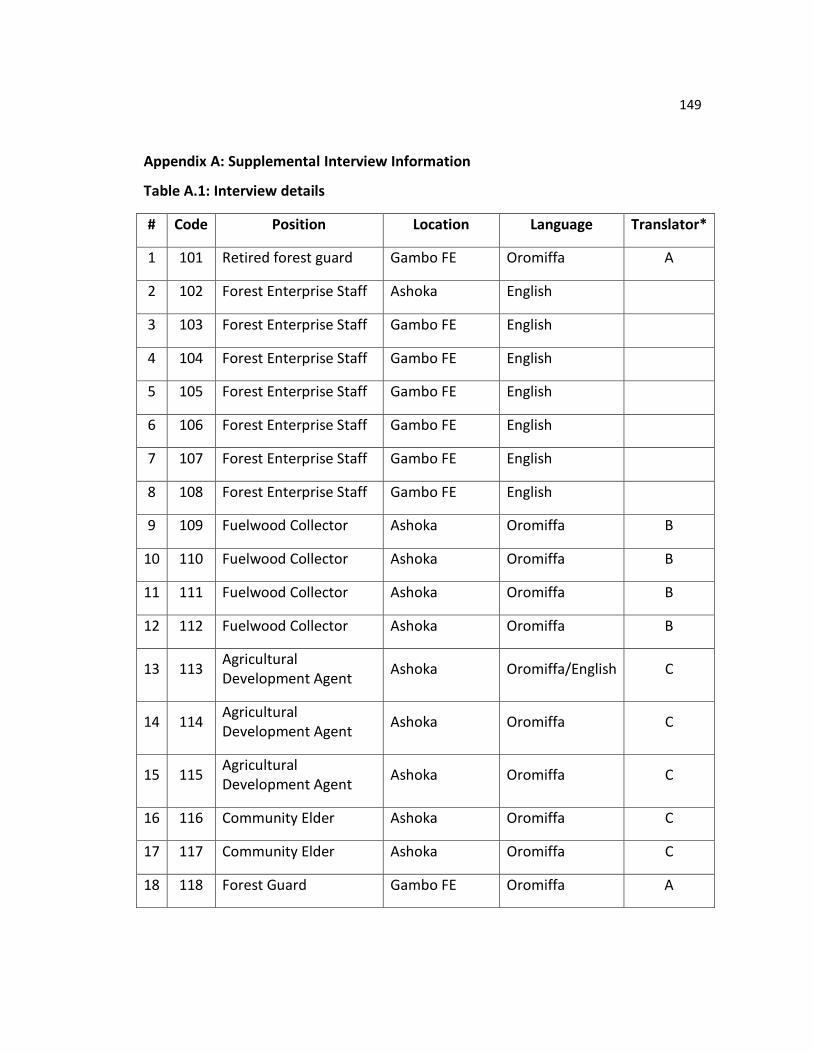
149
Appendix A: Supplemental Interview Information
Table A.1: Interview details
# Code Position Location Language Translator*
1 101 Retired forest guard Gambo FE Oromiffa A
2 102 Forest Enterprise Staff Ashoka English
3 103 Forest Enterprise Staff Gambo FE English
4 104 Forest Enterprise Staff Gambo FE English
5 105 Forest Enterprise Staff Gambo FE English
6 106 Forest Enterprise Staff Gambo FE English
7 107 Forest Enterprise Staff Gambo FE English
8 108 Forest Enterprise Staff Gambo FE English
9 109 Fuelwood Collector Ashoka Oromiffa B
10 110 Fuelwood Collector Ashoka Oromiffa B
11 111 Fuelwood Collector Ashoka Oromiffa B
12 112 Fuelwood Collector Ashoka Oromiffa B
13 113 Agricultural Development Agent
Ashoka Oromiffa/English C
14 114 Agricultural Development Agent
Ashoka Oromiffa C
15 115 Agricultural Development Agent
Ashoka Oromiffa C
16 116 Community Elder Ashoka Oromiffa C
17 117 Community Elder Ashoka Oromiffa C
18 118 Forest Guard Gambo FE Oromiffa A
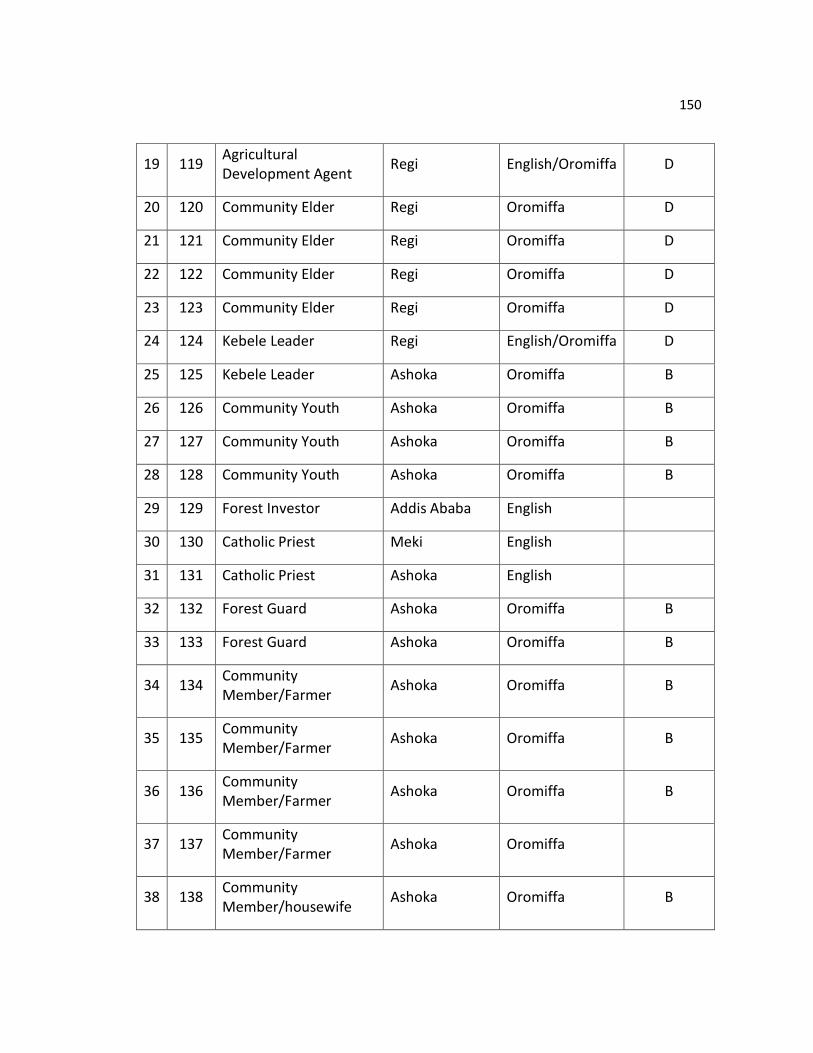
150
19 119 Agricultural Development Agent
Regi English/Oromiffa D
20 120 Community Elder Regi Oromiffa D
21 121 Community Elder Regi Oromiffa D
22 122 Community Elder Regi Oromiffa D
23 123 Community Elder Regi Oromiffa D
24 124 Kebele Leader Regi English/Oromiffa D
25 125 Kebele Leader Ashoka Oromiffa B
26 126 Community Youth Ashoka Oromiffa B
27 127 Community Youth Ashoka Oromiffa B
28 128 Community Youth Ashoka Oromiffa B
29 129 Forest Investor Addis Ababa English
30 130 Catholic Priest Meki English
31 131 Catholic Priest Ashoka English
32 132 Forest Guard Ashoka Oromiffa B
33 133 Forest Guard Ashoka Oromiffa B
34 134 Community Member/Farmer
Ashoka Oromiffa B
35 135 Community Member/Farmer
Ashoka Oromiffa B
36 136 Community Member/Farmer
Ashoka Oromiffa B
37 137 Community Member/Farmer
Ashoka Oromiffa
38 138 Community Member/housewife
Ashoka Oromiffa B
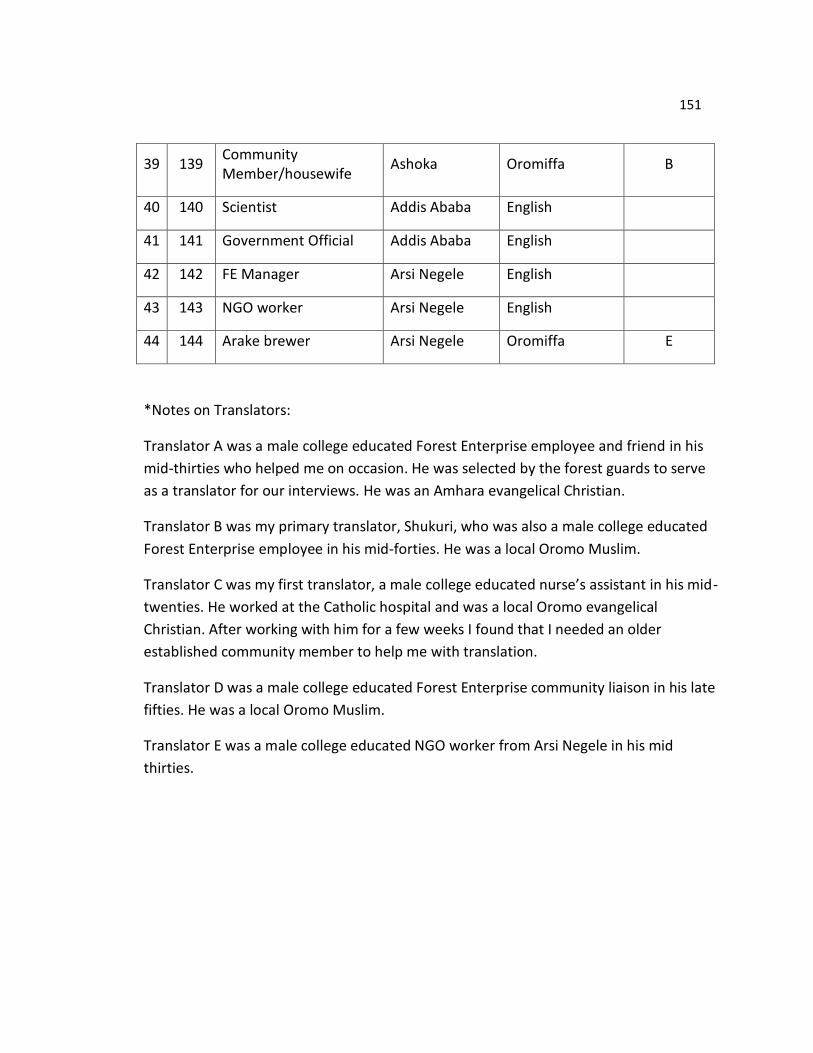
151
39 139 Community Member/housewife
Ashoka Oromiffa B
40 140 Scientist Addis Ababa English
41 141 Government Official Addis Ababa English
42 142 FE Manager Arsi Negele English
43 143 NGO worker Arsi Negele English
44 144 Arake brewer Arsi Negele Oromiffa E
*Notes on Translators:
Translator A was a male college educated Forest Enterprise employee and friend in his
mid-thirties who helped me on occasion. He was selected by the forest guards to serve
as a translator for our interviews. He was an Amhara evangelical Christian.
Translator B was my primary translator, Shukuri, who was also a male college educated
Forest Enterprise employee in his mid-forties. He was a local Oromo Muslim.
Translator C was my first translator, a male college educated nurse’s assistant in his mid-
twenties. He worked at the Catholic hospital and was a local Oromo evangelical
Christian. After working with him for a few weeks I found that I needed an older
established community member to help me with translation.
Translator D was a male college educated Forest Enterprise community liaison in his late
fifties. He was a local Oromo Muslim.
Translator E was a male college educated NGO worker from Arsi Negele in his mid
thirties.
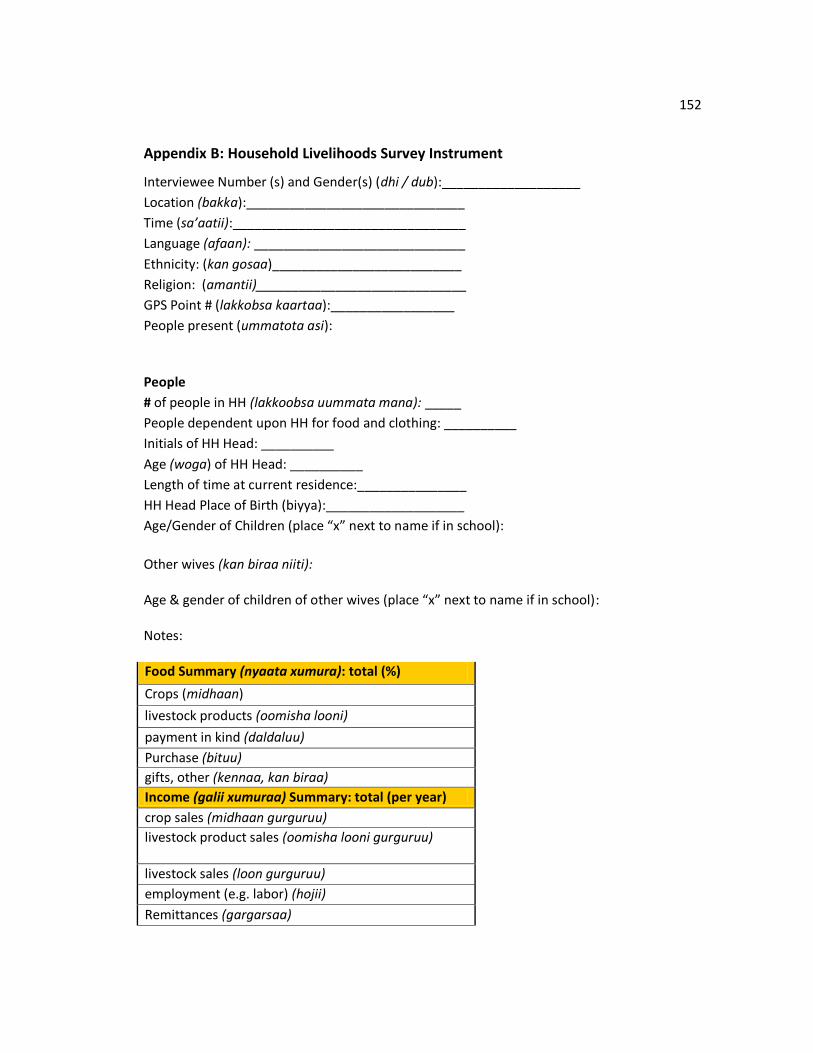
152
Appendix B: Household Livelihoods Survey Instrument
Interviewee Number (s) and Gender(s) (dhi / dub):___________________
Location (bakka):______________________________
Time (sa’aatii):________________________________
Language (afaan): _____________________________
Ethnicity: (kan gosaa)__________________________
Religion: (amantii)_____________________________
GPS Point # (lakkobsa kaartaa):_________________
People present (ummatota asi):
People
# of people in HH (lakkoobsa uummata mana): _____
People dependent upon HH for food and clothing: __________
Initials of HH Head: __________
Age (woga) of HH Head: __________
Length of time at current residence:_______________
HH Head Place of Birth (biyya):___________________
Age/Gender of Children (place “x” next to name if in school):
Other wives (kan biraa niiti): Age & gender of children of other wives (place “x” next to name if in school): Notes: Food Summary (nyaata xumura): total (%)
Crops (midhaan)
livestock products (oomisha looni)
payment in kind (daldaluu)
Purchase (bituu)
gifts, other (kennaa, kan biraa)
Income (galii xumuraa) Summary: total (per year)
crop sales (midhaan gurguruu)
livestock product sales (oomisha looni gurguruu)
livestock sales (loon gurguruu)
employment (e.g. labor) (hojii)
Remittances (gargarsaa)
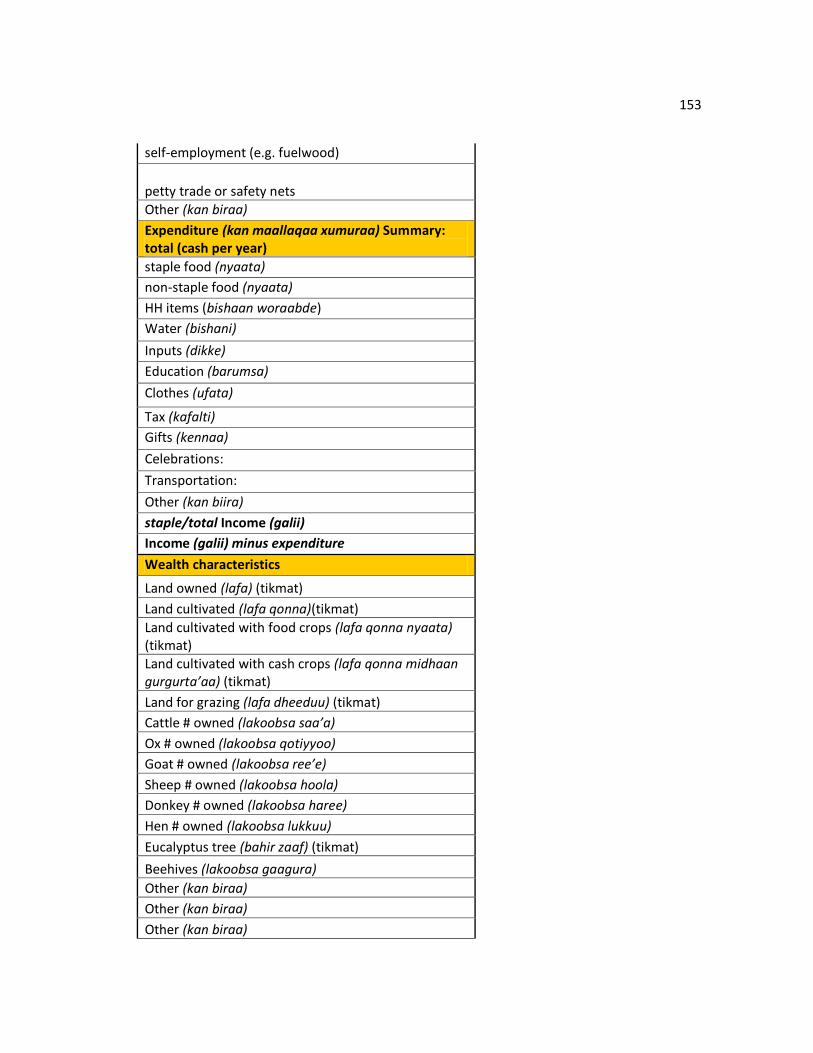
153
self-employment (e.g. fuelwood)
petty trade or safety nets
Other (kan biraa)
Expenditure (kan maallaqaa xumuraa) Summary: total (cash per year)
staple food (nyaata)
non-staple food (nyaata)
HH items (bishaan woraabde)
Water (bishani)
Inputs (dikke)
Education (barumsa)
Clothes (ufata)
Tax (kafalti)
Gifts (kennaa)
Celebrations:
Transportation:
Other (kan biira)
staple/total Income (galii)
Income (galii) minus expenditure
Wealth characteristics
Land owned (lafa) (tikmat)
Land cultivated (lafa qonna)(tikmat)
Land cultivated with food crops (lafa qonna nyaata) (tikmat)
Land cultivated with cash crops (lafa qonna midhaan gurgurta’aa) (tikmat)
Land for grazing (lafa dheeduu) (tikmat)
Cattle # owned (lakoobsa saa’a)
Ox # owned (lakoobsa qotiyyoo)
Goat # owned (lakoobsa ree’e)
Sheep # owned (lakoobsa hoola)
Donkey # owned (lakoobsa haree)
Hen # owned (lakoobsa lukkuu)
Eucalyptus tree (bahir zaaf) (tikmat)
Beehives (lakoobsa gaagura)
Other (kan biraa)
Other (kan biraa)
Other (kan biraa)
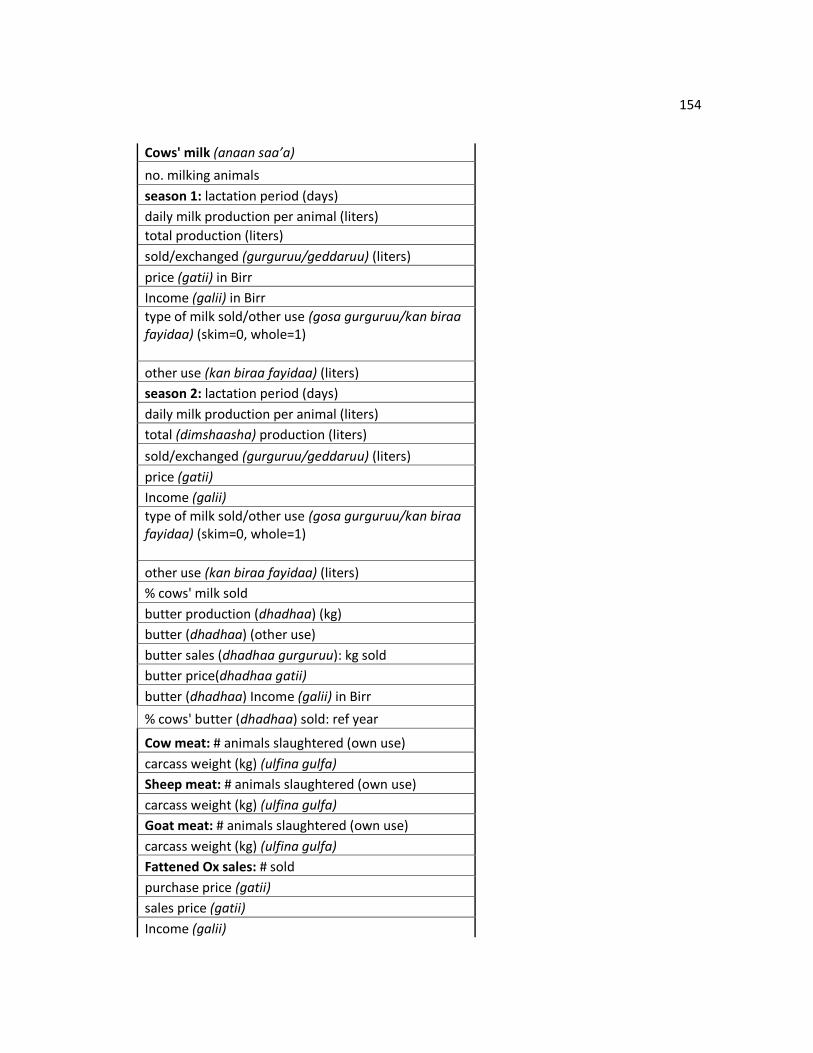
154
Cows' milk (anaan saa’a)
no. milking animals
season 1: lactation period (days)
daily milk production per animal (liters)
total production (liters)
sold/exchanged (gurguruu/geddaruu) (liters)
price (gatii) in Birr
Income (galii) in Birr
type of milk sold/other use (gosa gurguruu/kan biraa fayidaa) (skim=0, whole=1)
other use (kan biraa fayidaa) (liters)
season 2: lactation period (days)
daily milk production per animal (liters)
total (dimshaasha) production (liters)
sold/exchanged (gurguruu/geddaruu) (liters)
price (gatii)
Income (galii)
type of milk sold/other use (gosa gurguruu/kan biraa fayidaa) (skim=0, whole=1)
other use (kan biraa fayidaa) (liters)
% cows' milk sold
butter production (dhadhaa) (kg)
butter (dhadhaa) (other use)
butter sales (dhadhaa gurguruu): kg sold
butter price(dhadhaa gatii)
butter (dhadhaa) Income (galii) in Birr
% cows' butter (dhadhaa) sold: ref year
Cow meat: # animals slaughtered (own use)
carcass weight (kg) (ulfina gulfa)
Sheep meat: # animals slaughtered (own use)
carcass weight (kg) (ulfina gulfa)
Goat meat: # animals slaughtered (own use)
carcass weight (kg) (ulfina gulfa)
Fattened Ox sales: # sold
purchase price (gatii)
sales price (gatii)
Income (galii)
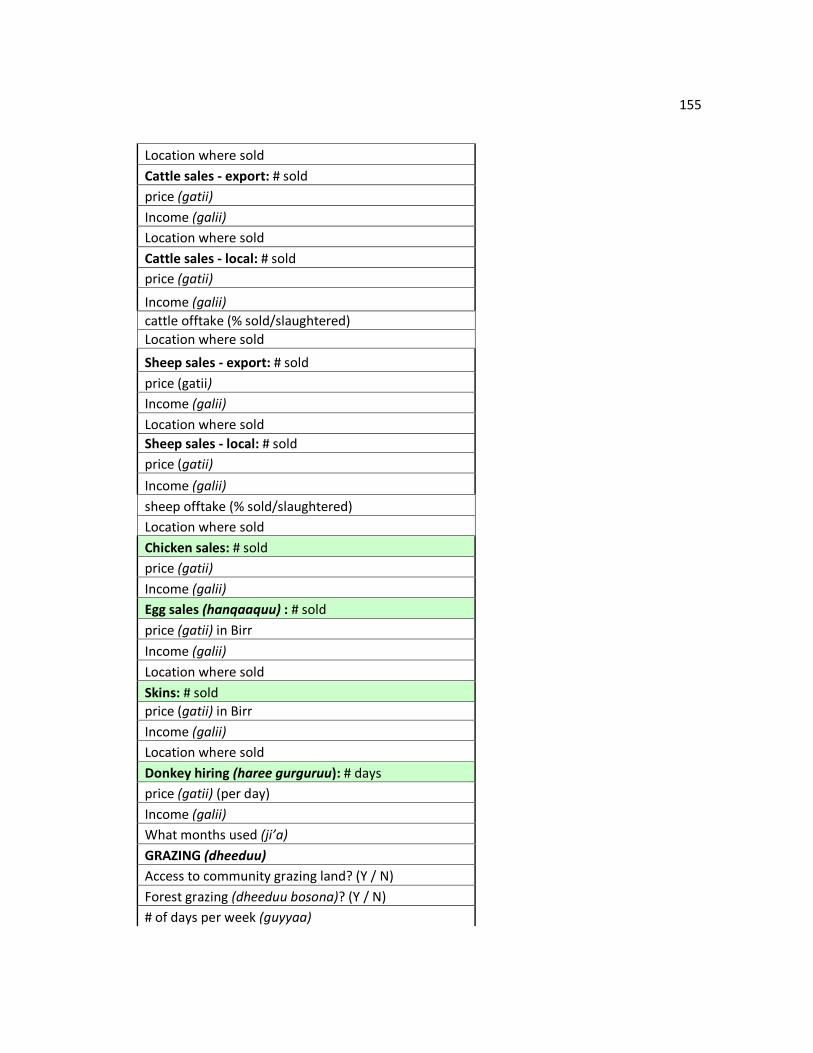
155
Location where sold
Cattle sales - export: # sold
price (gatii)
Income (galii)
Location where sold
Cattle sales - local: # sold
price (gatii)
Income (galii)
cattle offtake (% sold/slaughtered)
Location where sold
Sheep sales - export: # sold
price (gatii)
Income (galii)
Location where sold
Sheep sales - local: # sold
price (gatii)
Income (galii)
sheep offtake (% sold/slaughtered)
Location where sold
Chicken sales: # sold
price (gatii)
Income (galii)
Egg sales (hanqaaquu) : # sold
price (gatii) in Birr
Income (galii)
Location where sold
Skins: # sold
price (gatii) in Birr
Income (galii)
Location where sold
Donkey hiring (haree gurguruu): # days
price (gatii) (per day)
Income (galii)
What months used (ji’a)
GRAZING (dheeduu)
Access to community grazing land? (Y / N)
Forest grazing (dheeduu bosona)? (Y / N)
# of days per week (guyyaa)
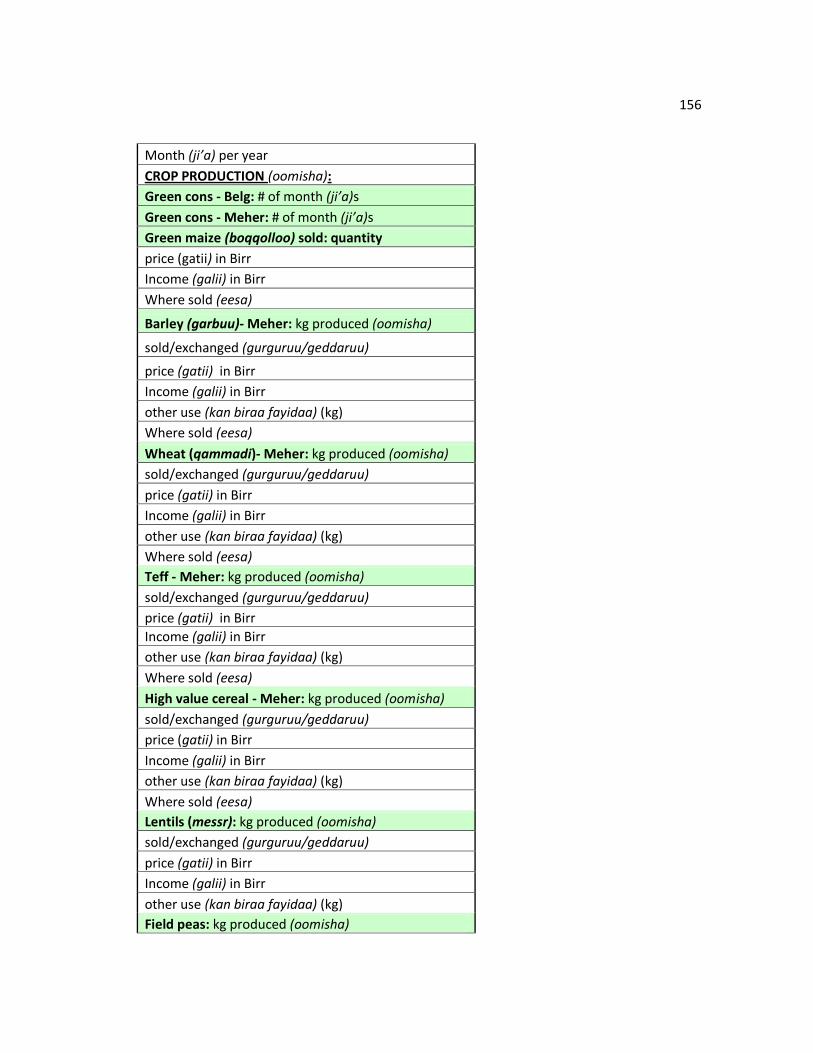
156
Month (ji’a) per year
CROP PRODUCTION (oomisha):
Green cons - Belg: # of month (ji’a)s
Green cons - Meher: # of month (ji’a)s
Green maize (boqqolloo) sold: quantity
price (gatii) in Birr
Income (galii) in Birr
Where sold (eesa)
Barley (garbuu)- Meher: kg produced (oomisha)
sold/exchanged (gurguruu/geddaruu)
price (gatii) in Birr
Income (galii) in Birr
other use (kan biraa fayidaa) (kg)
Where sold (eesa)
Wheat (qammadi)- Meher: kg produced (oomisha)
sold/exchanged (gurguruu/geddaruu)
price (gatii) in Birr
Income (galii) in Birr
other use (kan biraa fayidaa) (kg)
Where sold (eesa)
Teff - Meher: kg produced (oomisha)
sold/exchanged (gurguruu/geddaruu)
price (gatii) in Birr
Income (galii) in Birr
other use (kan biraa fayidaa) (kg)
Where sold (eesa)
High value cereal - Meher: kg produced (oomisha)
sold/exchanged (gurguruu/geddaruu)
price (gatii) in Birr
Income (galii) in Birr
other use (kan biraa fayidaa) (kg)
Where sold (eesa)
Lentils (messr): kg produced (oomisha)
sold/exchanged (gurguruu/geddaruu)
price (gatii) in Birr
Income (galii) in Birr
other use (kan biraa fayidaa) (kg)
Field peas: kg produced (oomisha)
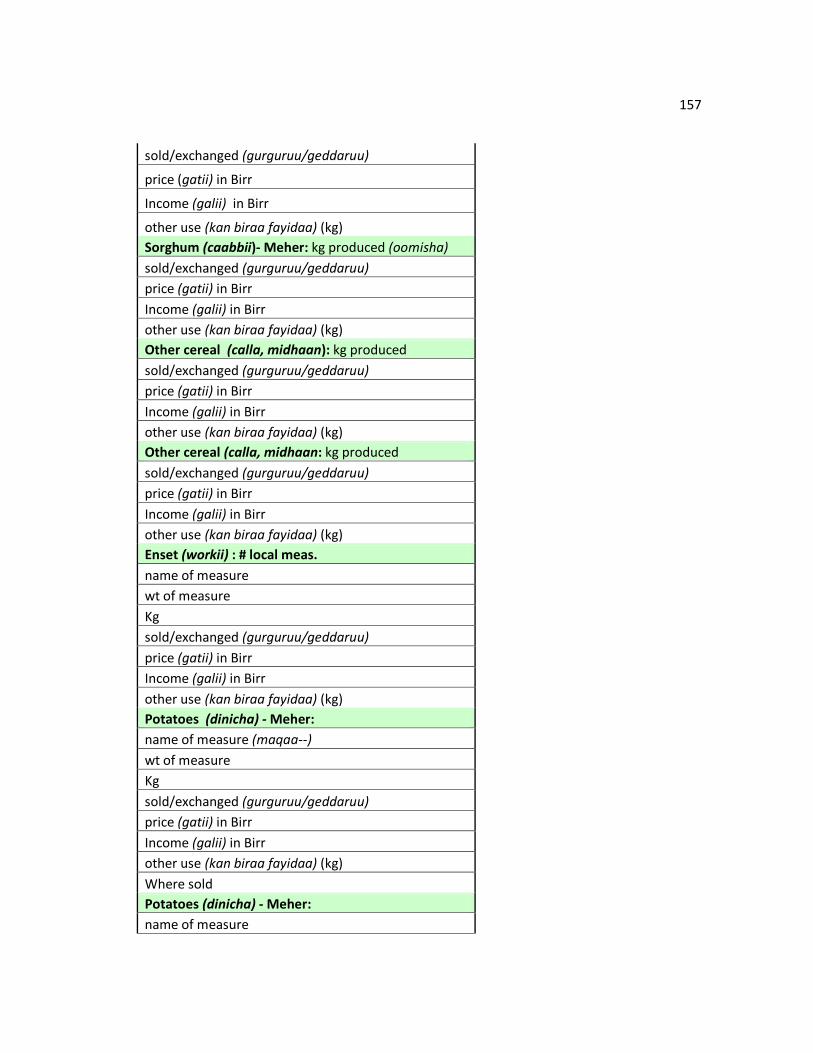
157
sold/exchanged (gurguruu/geddaruu)
price (gatii) in Birr
Income (galii) in Birr
other use (kan biraa fayidaa) (kg)
Sorghum (caabbii)- Meher: kg produced (oomisha)
sold/exchanged (gurguruu/geddaruu)
price (gatii) in Birr
Income (galii) in Birr
other use (kan biraa fayidaa) (kg)
Other cereal (calla, midhaan): kg produced
sold/exchanged (gurguruu/geddaruu)
price (gatii) in Birr
Income (galii) in Birr
other use (kan biraa fayidaa) (kg)
Other cereal (calla, midhaan: kg produced
sold/exchanged (gurguruu/geddaruu)
price (gatii) in Birr
Income (galii) in Birr
other use (kan biraa fayidaa) (kg)
Enset (workii) : # local meas.
name of measure
wt of measure
Kg
sold/exchanged (gurguruu/geddaruu)
price (gatii) in Birr
Income (galii) in Birr
other use (kan biraa fayidaa) (kg)
Potatoes (dinicha) - Meher:
name of measure (maqaa--)
wt of measure
Kg
sold/exchanged (gurguruu/geddaruu)
price (gatii) in Birr
Income (galii) in Birr
other use (kan biraa fayidaa) (kg)
Where sold
Potatoes (dinicha) - Meher:
name of measure
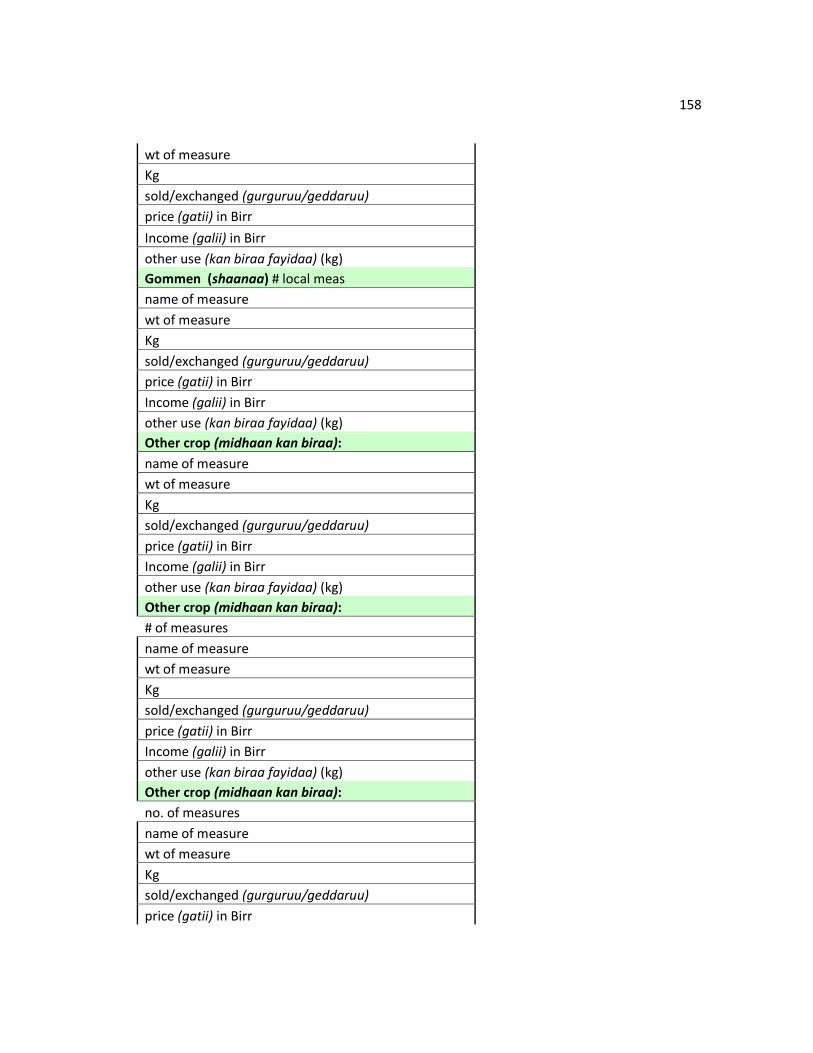
158
wt of measure
Kg
sold/exchanged (gurguruu/geddaruu)
price (gatii) in Birr
Income (galii) in Birr
other use (kan biraa fayidaa) (kg)
Gommen (shaanaa) # local meas
name of measure
wt of measure
Kg
sold/exchanged (gurguruu/geddaruu)
price (gatii) in Birr
Income (galii) in Birr
other use (kan biraa fayidaa) (kg)
Other crop (midhaan kan biraa):
name of measure
wt of measure
Kg
sold/exchanged (gurguruu/geddaruu)
price (gatii) in Birr
Income (galii) in Birr
other use (kan biraa fayidaa) (kg)
Other crop (midhaan kan biraa):
# of measures
name of measure
wt of measure
Kg
sold/exchanged (gurguruu/geddaruu)
price (gatii) in Birr
Income (galii) in Birr
other use (kan biraa fayidaa) (kg)
Other crop (midhaan kan biraa):
no. of measures
name of measure
wt of measure
Kg
sold/exchanged (gurguruu/geddaruu)
price (gatii) in Birr
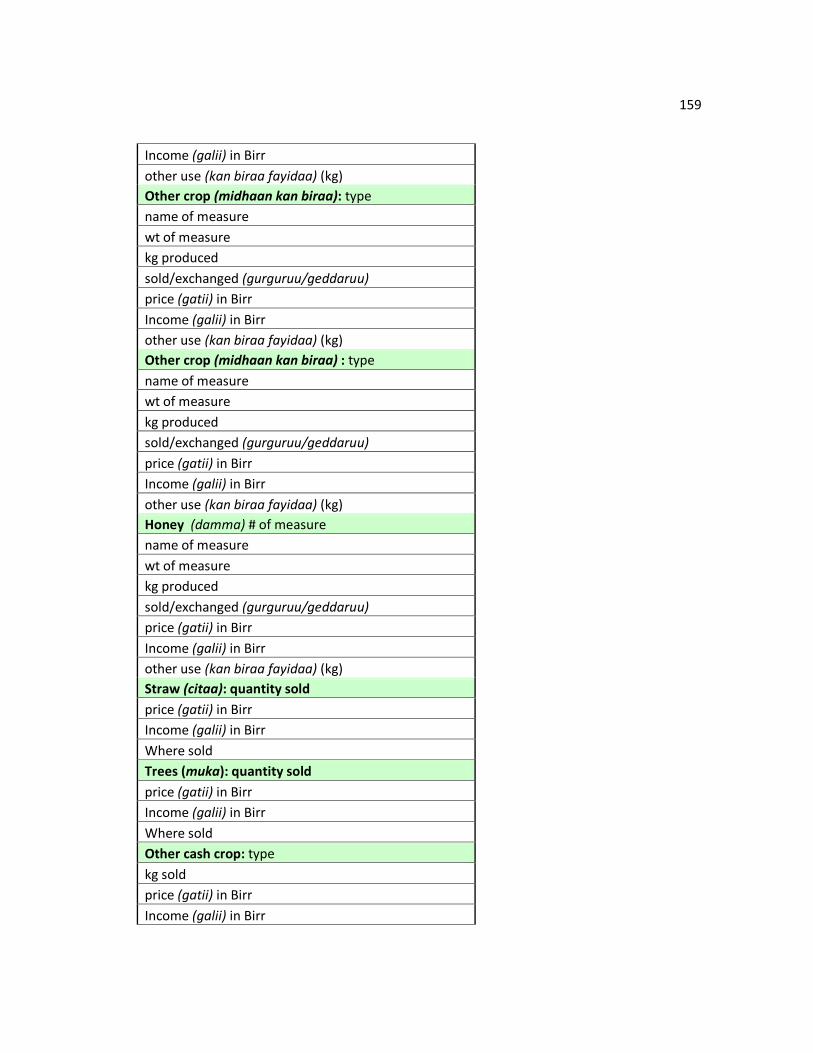
159
Income (galii) in Birr
other use (kan biraa fayidaa) (kg)
Other crop (midhaan kan biraa): type
name of measure
wt of measure
kg produced
sold/exchanged (gurguruu/geddaruu)
price (gatii) in Birr
Income (galii) in Birr
other use (kan biraa fayidaa) (kg)
Other crop (midhaan kan biraa) : type
name of measure
wt of measure
kg produced
sold/exchanged (gurguruu/geddaruu)
price (gatii) in Birr
Income (galii) in Birr
other use (kan biraa fayidaa) (kg)
Honey (damma) # of measure
name of measure
wt of measure
kg produced
sold/exchanged (gurguruu/geddaruu)
price (gatii) in Birr
Income (galii) in Birr
other use (kan biraa fayidaa) (kg)
Straw (citaa): quantity sold
price (gatii) in Birr
Income (galii) in Birr
Where sold
Trees (muka): quantity sold
price (gatii) in Birr
Income (galii) in Birr
Where sold
Other cash crop: type
kg sold
price (gatii) in Birr
Income (galii) in Birr
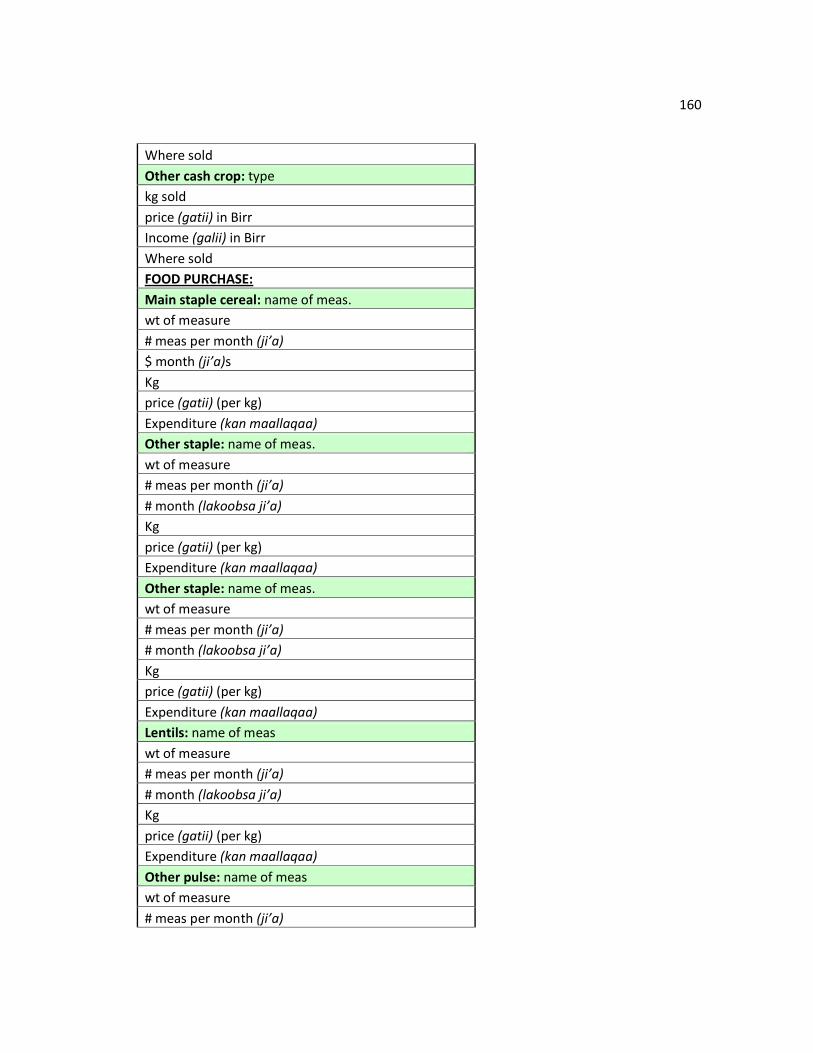
160
Where sold
Other cash crop: type
kg sold
price (gatii) in Birr
Income (galii) in Birr
Where sold
FOOD PURCHASE:
Main staple cereal: name of meas.
wt of measure
# meas per month (ji’a)
$ month (ji’a)s
Kg
price (gatii) (per kg)
Expenditure (kan maallaqaa)
Other staple: name of meas.
wt of measure
# meas per month (ji’a)
# month (lakoobsa ji’a)
Kg
price (gatii) (per kg)
Expenditure (kan maallaqaa)
Other staple: name of meas.
wt of measure
# meas per month (ji’a)
# month (lakoobsa ji’a)
Kg
price (gatii) (per kg)
Expenditure (kan maallaqaa)
Lentils: name of meas
wt of measure
# meas per month (ji’a)
# month (lakoobsa ji’a)
Kg
price (gatii) (per kg)
Expenditure (kan maallaqaa)
Other pulse: name of meas
wt of measure
# meas per month (ji’a)
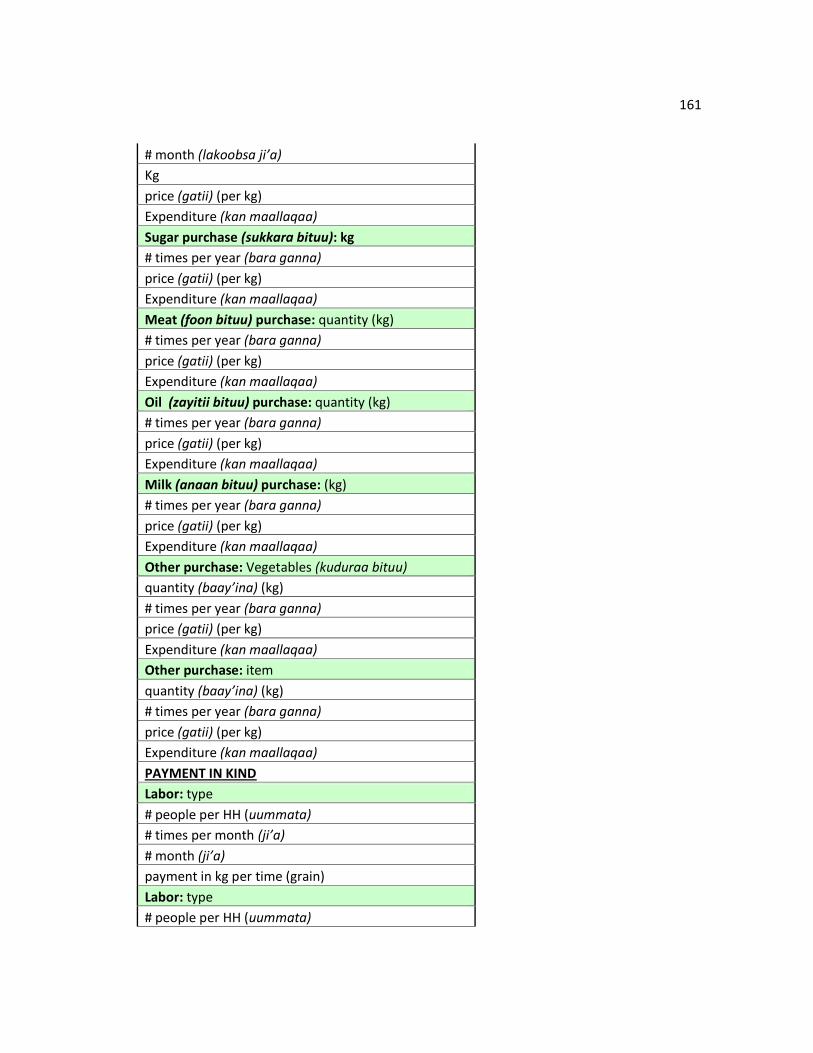
161
# month (lakoobsa ji’a)
Kg
price (gatii) (per kg)
Expenditure (kan maallaqaa)
Sugar purchase (sukkara bituu): kg
# times per year (bara ganna)
price (gatii) (per kg)
Expenditure (kan maallaqaa)
Meat (foon bituu) purchase: quantity (kg)
# times per year (bara ganna)
price (gatii) (per kg)
Expenditure (kan maallaqaa)
Oil (zayitii bituu) purchase: quantity (kg)
# times per year (bara ganna)
price (gatii) (per kg)
Expenditure (kan maallaqaa)
Milk (anaan bituu) purchase: (kg)
# times per year (bara ganna)
price (gatii) (per kg)
Expenditure (kan maallaqaa)
Other purchase: Vegetables (kuduraa bituu)
quantity (baay’ina) (kg)
# times per year (bara ganna)
price (gatii) (per kg)
Expenditure (kan maallaqaa)
Other purchase: item
quantity (baay’ina) (kg)
# times per year (bara ganna)
price (gatii) (per kg)
Expenditure (kan maallaqaa)
PAYMENT IN KIND
Labor: type
# people per HH (uummata)
# times per month (ji’a)
# month (ji’a)
payment in kg per time (grain)
Labor: type
# people per HH (uummata)
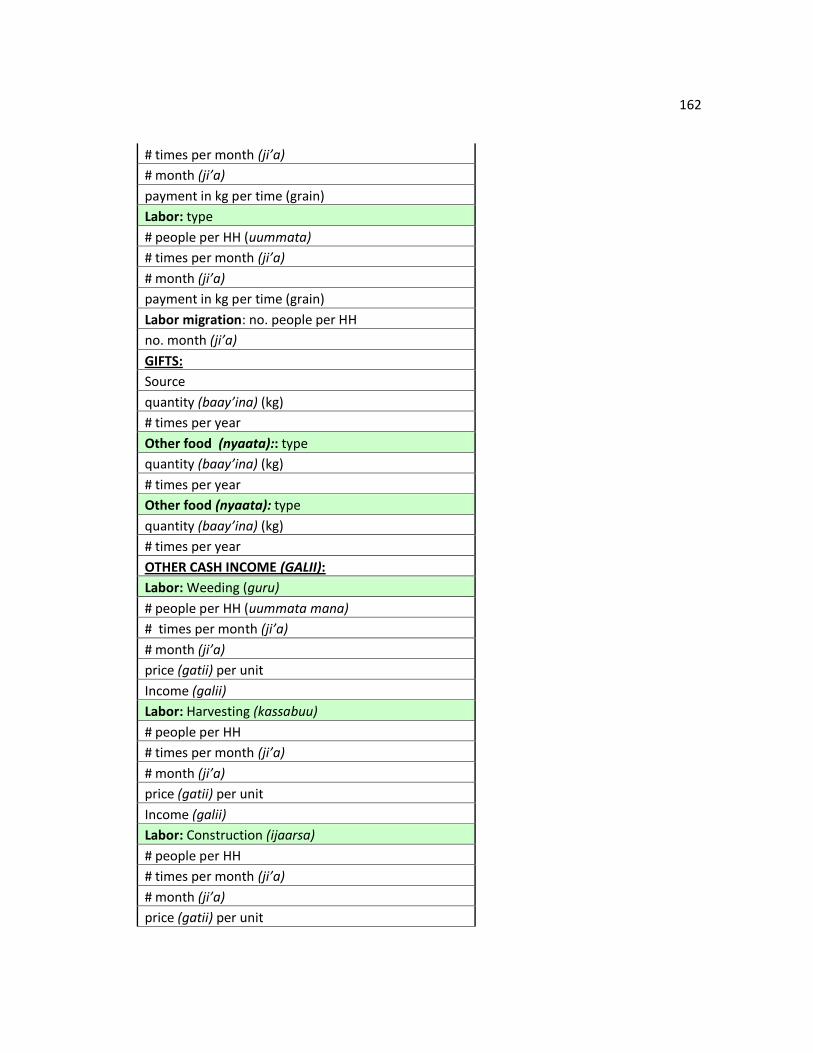
162
# times per month (ji’a)
# month (ji’a)
payment in kg per time (grain)
Labor: type
# people per HH (uummata)
# times per month (ji’a)
# month (ji’a)
payment in kg per time (grain)
Labor migration: no. people per HH
no. month (ji’a)
GIFTS:
Source
quantity (baay’ina) (kg)
# times per year
Other food (nyaata):: type
quantity (baay’ina) (kg)
# times per year
Other food (nyaata): type
quantity (baay’ina) (kg)
# times per year
OTHER CASH INCOME (GALII):
Labor: Weeding (guru)
# people per HH (uummata mana)
# times per month (ji’a)
# month (ji’a)
price (gatii) per unit
Income (galii)
Labor: Harvesting (kassabuu)
# people per HH
# times per month (ji’a)
# month (ji’a)
price (gatii) per unit
Income (galii)
Labor: Construction (ijaarsa)
# people per HH
# times per month (ji’a)
# month (ji’a)
price (gatii) per unit
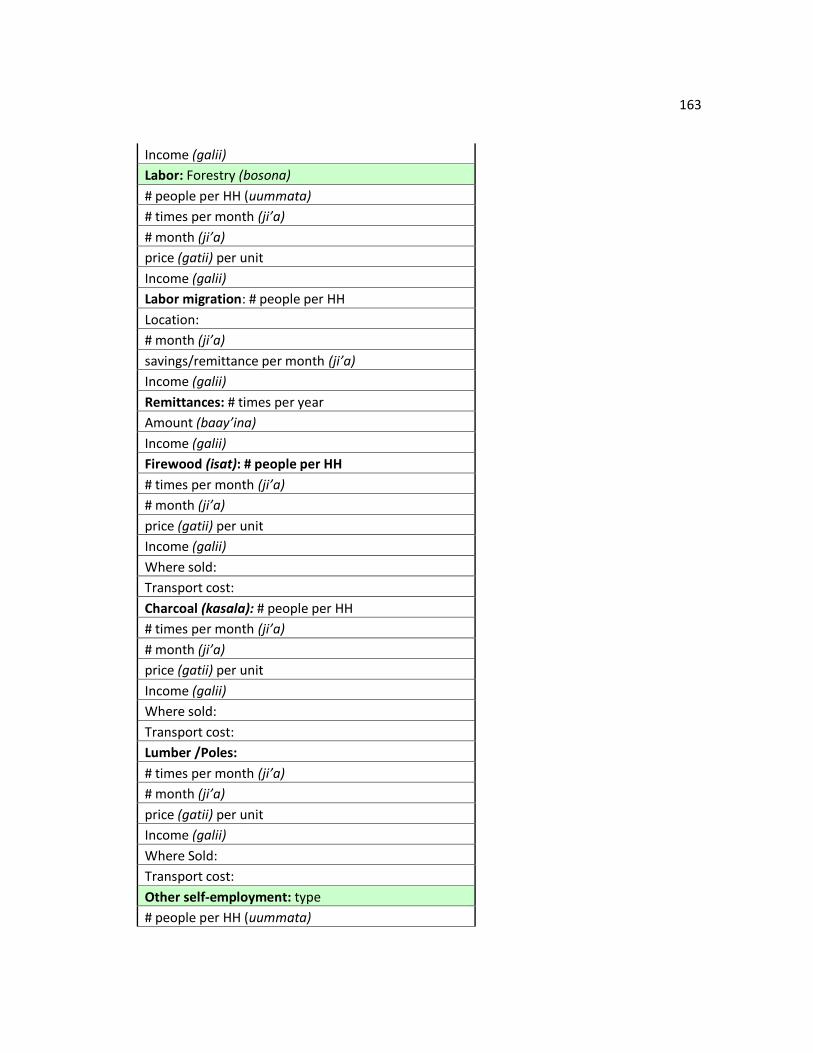
163
Income (galii)
Labor: Forestry (bosona)
# people per HH (uummata)
# times per month (ji’a)
# month (ji’a)
price (gatii) per unit
Income (galii)
Labor migration: # people per HH
Location:
# month (ji’a)
savings/remittance per month (ji’a)
Income (galii)
Remittances: # times per year
Amount (baay’ina)
Income (galii)
Firewood (isat): # people per HH
# times per month (ji’a)
# month (ji’a)
price (gatii) per unit
Income (galii)
Where sold:
Transport cost:
Charcoal (kasala): # people per HH
# times per month (ji’a)
# month (ji’a)
price (gatii) per unit
Income (galii)
Where sold:
Transport cost:
Lumber /Poles:
# times per month (ji’a)
# month (ji’a)
price (gatii) per unit
Income (galii)
Where Sold:
Transport cost:
Other self-employment: type
# people per HH (uummata)
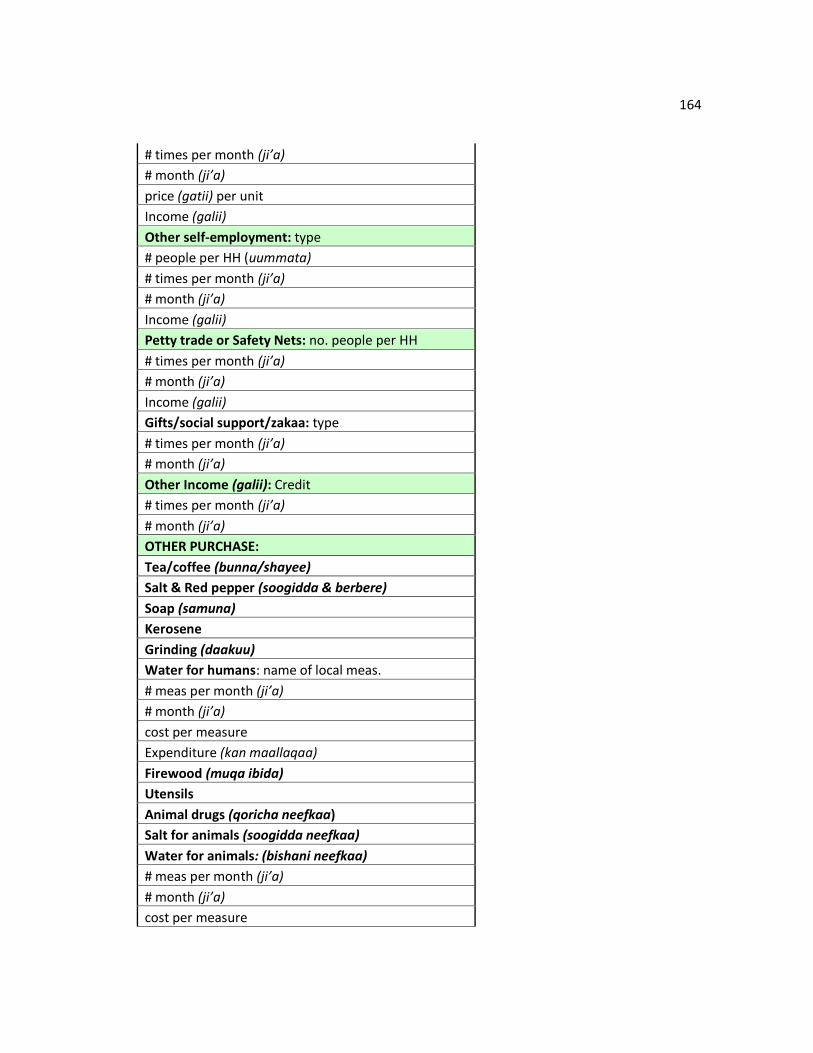
164
# times per month (ji’a)
# month (ji’a)
price (gatii) per unit
Income (galii)
Other self-employment: type
# people per HH (uummata)
# times per month (ji’a)
# month (ji’a)
Income (galii)
Petty trade or Safety Nets: no. people per HH
# times per month (ji’a)
# month (ji’a)
Income (galii)
Gifts/social support/zakaa: type
# times per month (ji’a)
# month (ji’a)
Other Income (galii): Credit
# times per month (ji’a)
# month (ji’a)
OTHER PURCHASE:
Tea/coffee (bunna/shayee)
Salt & Red pepper (soogidda & berbere)
Soap (samuna)
Kerosene
Grinding (daakuu)
Water for humans: name of local meas.
# meas per month (ji’a)
# month (ji’a)
cost per measure
Expenditure (kan maallaqaa)
Firewood (muqa ibida)
Utensils
Animal drugs (qoricha neefkaa)
Salt for animals (soogidda neefkaa)
Water for animals: (bishani neefkaa)
# meas per month (ji’a)
# month (ji’a)
cost per measure
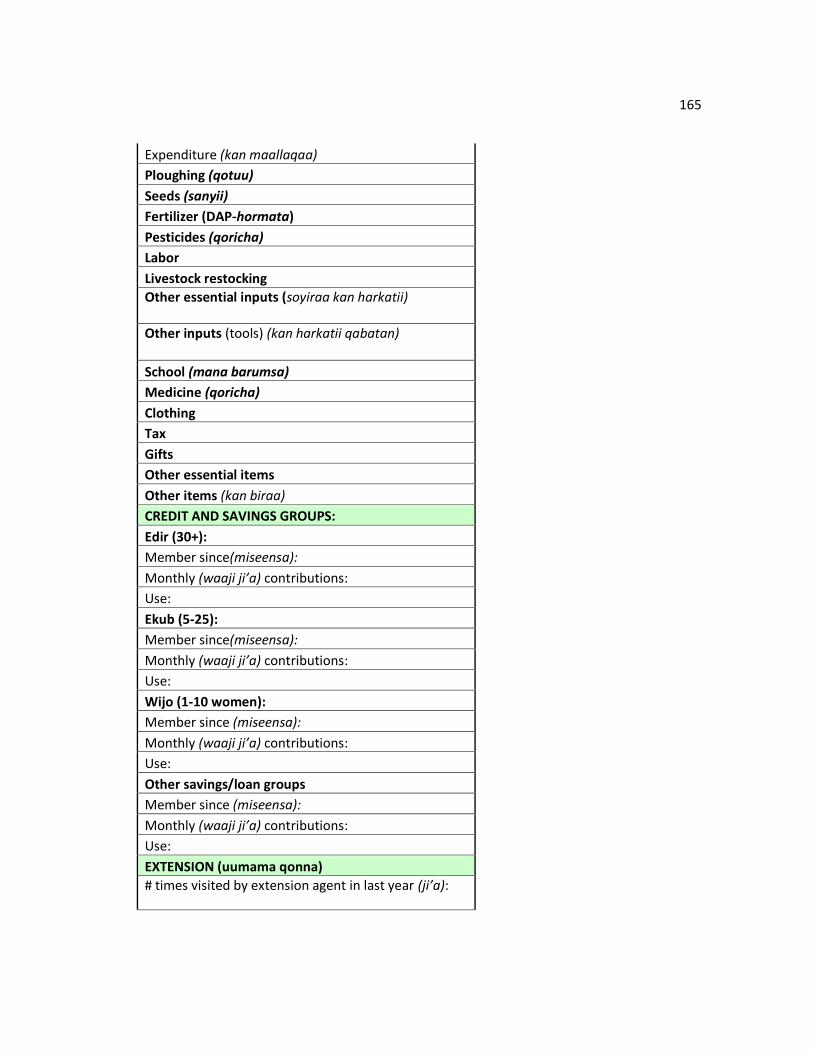
165
Expenditure (kan maallaqaa)
Ploughing (qotuu)
Seeds (sanyii)
Fertilizer (DAP-hormata)
Pesticides (qoricha)
Labor
Livestock restocking
Other essential inputs (soyiraa kan harkatii)
Other inputs (tools) (kan harkatii qabatan)
School (mana barumsa)
Medicine (qoricha)
Clothing
Tax
Gifts
Other essential items
Other items (kan biraa)
CREDIT AND SAVINGS GROUPS:
Edir (30+):
Member since(miseensa):
Monthly (waaji ji’a) contributions:
Use:
Ekub (5-25):
Member since(miseensa):
Monthly (waaji ji’a) contributions:
Use:
Wijo (1-10 women):
Member since (miseensa):
Monthly (waaji ji’a) contributions:
Use:
Other savings/loan groups
Member since (miseensa):
Monthly (waaji ji’a) contributions:
Use:
EXTENSION (uumama qonna)
# times visited by extension agent in last year (ji’a):
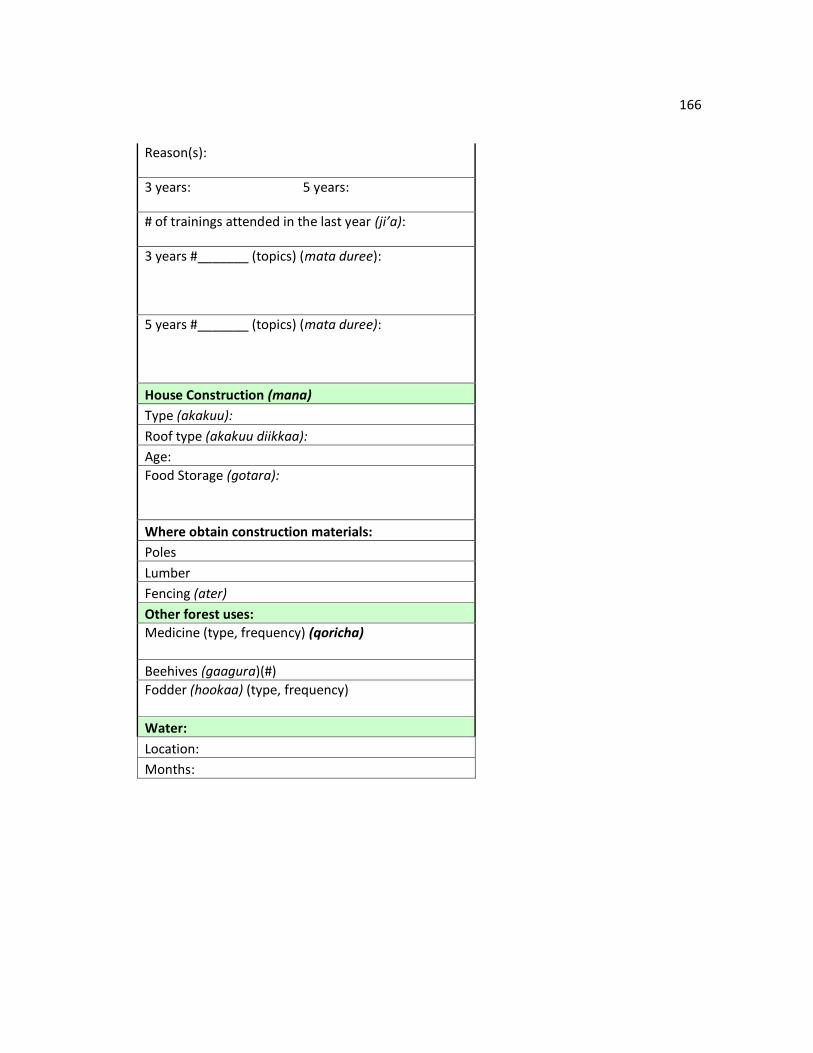
166
Reason(s):
3 years: 5 years:
# of trainings attended in the last year (ji’a):
3 years #_______ (topics) (mata duree):
5 years #_______ (topics) (mata duree):
House Construction (mana)
Type (akakuu):
Roof type (akakuu diikkaa):
Age:
Food Storage (gotara):
Where obtain construction materials:
Poles
Lumber
Fencing (ater)
Other forest uses:
Medicine (type, frequency) (qoricha)
Beehives (gaagura)(#)
Fodder (hookaa) (type, frequency)
Water:
Location:
Months:
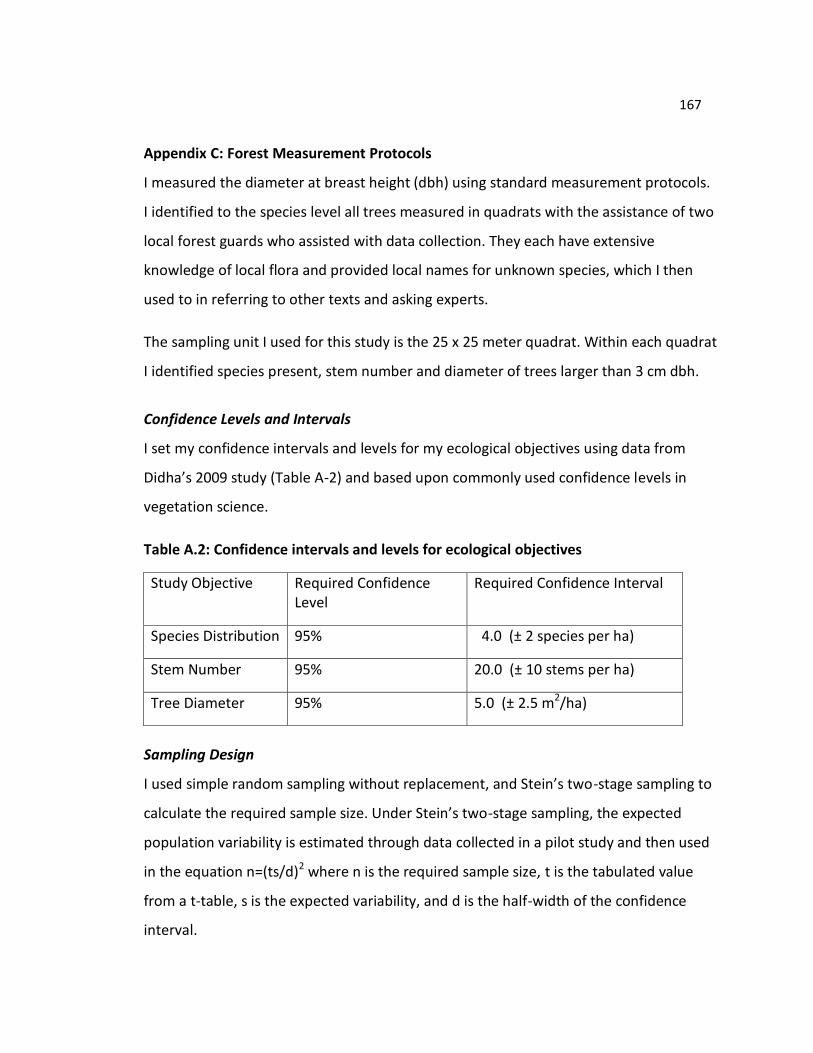
167
Appendix C: Forest Measurement Protocols
I measured the diameter at breast height (dbh) using standard measurement protocols.
I identified to the species level all trees measured in quadrats with the assistance of two
local forest guards who assisted with data collection. They each have extensive
knowledge of local flora and provided local names for unknown species, which I then
used to in referring to other texts and asking experts.
The sampling unit I used for this study is the 25 x 25 meter quadrat. Within each quadrat
I identified species present, stem number and diameter of trees larger than 3 cm dbh.
Confidence Levels and Intervals
I set my confidence intervals and levels for my ecological objectives using data from
Didha’s 2009 study (Table A-2) and based upon commonly used confidence levels in
vegetation science.
Table A.2: Confidence intervals and levels for ecological objectives
Study Objective Required Confidence Level
Required Confidence Interval
Species Distribution 95% 4.0 (± 2 species per ha)
Stem Number 95% 20.0 (± 10 stems per ha)
Tree Diameter 95% 5.0 (± 2.5 m2/ha)
Sampling Design
I used simple random sampling without replacement, and Stein’s two-stage sampling to
calculate the required sample size. Under Stein’s two-stage sampling, the expected
population variability is estimated through data collected in a pilot study and then used
in the equation n=(ts/d)2 where n is the required sample size, t is the tabulated value
from a t-table, s is the expected variability, and d is the half-width of the confidence
interval.
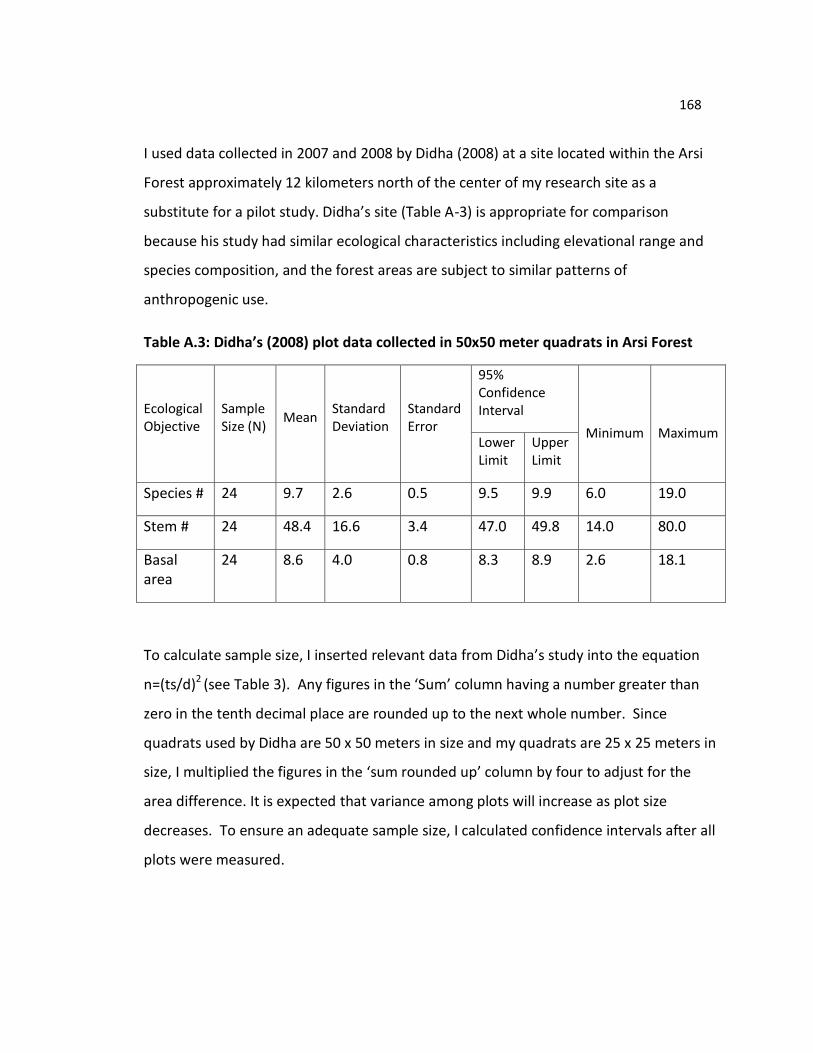
168
I used data collected in 2007 and 2008 by Didha (2008) at a site located within the Arsi
Forest approximately 12 kilometers north of the center of my research site as a
substitute for a pilot study. Didha’s site (Table A-3) is appropriate for comparison
because his study had similar ecological characteristics including elevational range and
species composition, and the forest areas are subject to similar patterns of
anthropogenic use.
Table A.3: Didha’s (2008) plot data collected in 50x50 meter quadrats in Arsi Forest
Ecological Objective
Sample Size (N)
Mean Standard Deviation
Standard Error
95% Confidence Interval
Minimum
Maximum Lower Limit
Upper Limit
Species # 24 9.7 2.6 0.5 9.5 9.9 6.0 19.0
Stem # 24 48.4 16.6 3.4 47.0 49.8 14.0 80.0
Basal area
24 8.6 4.0 0.8 8.3 8.9 2.6 18.1
To calculate sample size, I inserted relevant data from Didha’s study into the equation
n=(ts/d)2 (see Table 3). Any figures in the ‘Sum’ column having a number greater than
zero in the tenth decimal place are rounded up to the next whole number. Since
quadrats used by Didha are 50 x 50 meters in size and my quadrats are 25 x 25 meters in
size, I multiplied the figures in the ‘sum rounded up’ column by four to adjust for the
area difference. It is expected that variance among plots will increase as plot size
decreases. To ensure an adequate sample size, I calculated confidence intervals after all
plots were measured.
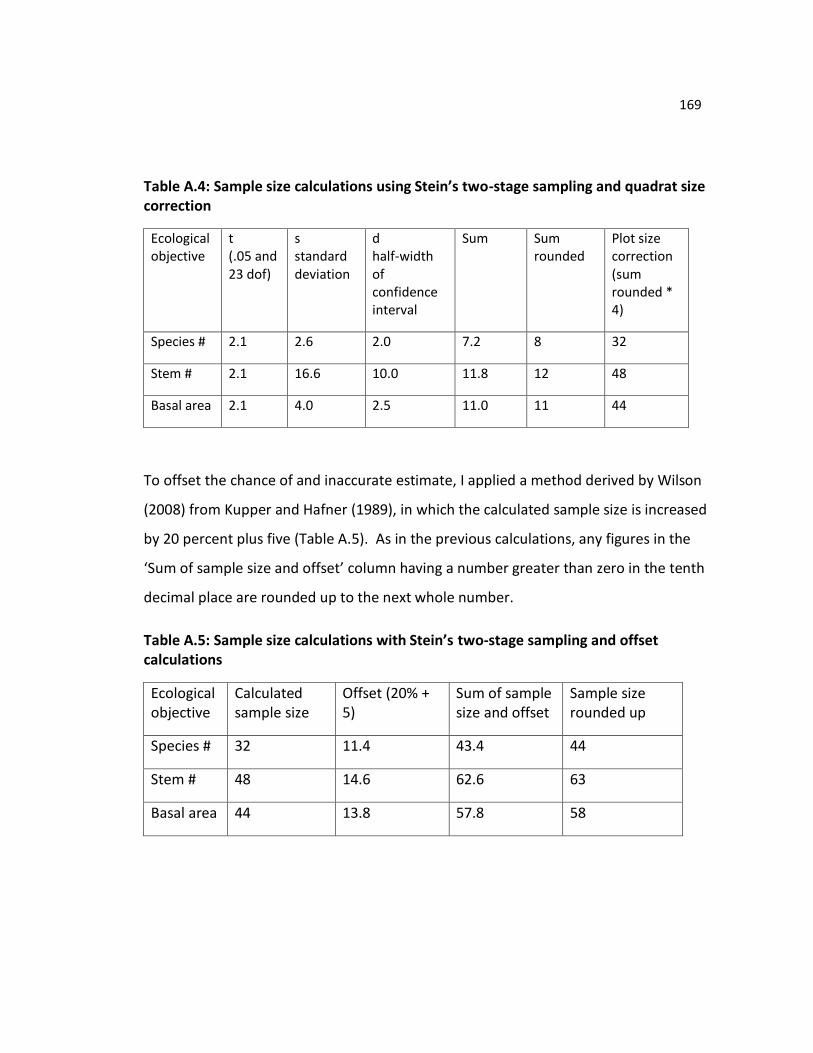
169
Table A.4: Sample size calculations using Stein’s two-stage sampling and quadrat size correction
Ecological objective
t (.05 and 23 dof)
s standard deviation
d half-width of confidence interval
Sum Sum rounded
Plot size correction (sum rounded * 4)
Species # 2.1 2.6 2.0 7.2 8 32
Stem # 2.1 16.6 10.0 11.8 12 48
Basal area 2.1 4.0 2.5 11.0 11 44
To offset the chance of and inaccurate estimate, I applied a method derived by Wilson
(2008) from Kupper and Hafner (1989), in which the calculated sample size is increased
by 20 percent plus five (Table A.5). As in the previous calculations, any figures in the
‘Sum of sample size and offset’ column having a number greater than zero in the tenth
decimal place are rounded up to the next whole number.
Table A.5: Sample size calculations with Stein’s two-stage sampling and offset calculations
Ecological objective
Calculated sample size
Offset (20% + 5)
Sum of sample size and offset
Sample size rounded up
Species # 32 11.4 43.4 44
Stem # 48 14.6 62.6 63
Basal area 44 13.8 57.8 58
170
Sample Area
The sample size calculations indicated that a minimum of 44 quadrats for species area,
63 quadrats for stem number and 58 quadrats for basal area would satisfy the
confidence levels and intervals that I have set. I collected data on each of the three
ecological objectives for all 63 quadrats so that I could move through the site
systematically rather than needing to follow the random points as they were selected.
The land area measured within the 66 25 x 25 meter quadrats is equivalent to 4.1
hectares, or 0.3 percent of the total study area.
Random Point Generation
I used a Garmin eTrex HC Series personal Global Positioning System (GPS) to mark the
boundaries of the Ashoka natural forest area. I accomplished this in one field day on
horseback with the assistance of two forest guards who have worked in the area for 17
and 20 years, respectively, and are familiar with the boundaries. I used the Minnesota
DNR Garmin Version 5.04.01 to convert the .gpx waypoint files to a shapefile and I
uploaded the shapefile into Quantum Geographic Information System (QGIS) version
1.3.0 Mimas. I generated 70 random points using the random point selection research
tool in Quantum GIS and uploaded them into my GPS unit (see Map 2). There are a few
areas within the site that are too dangerous to sample, such as the steep canyons
surrounding the Lepis waterfall. I will discard any points that fall within such locations
or that put portions of the quadrat beyond the edge of the study area. I will stop
sampling when I have sampled the required 63 quadrats. To ensure interspersion, I
determined before sampling that I would accept a sampling arrangement only if it had
at least two points in all four quarters of the study area. The first random point
selection that I generated met this criterion.
I used a compass, the GPS unit and proximity alarms to locate the points in the field. In
the event of drift with the GPS unit, I stopped the first time the GPS unit says that I have
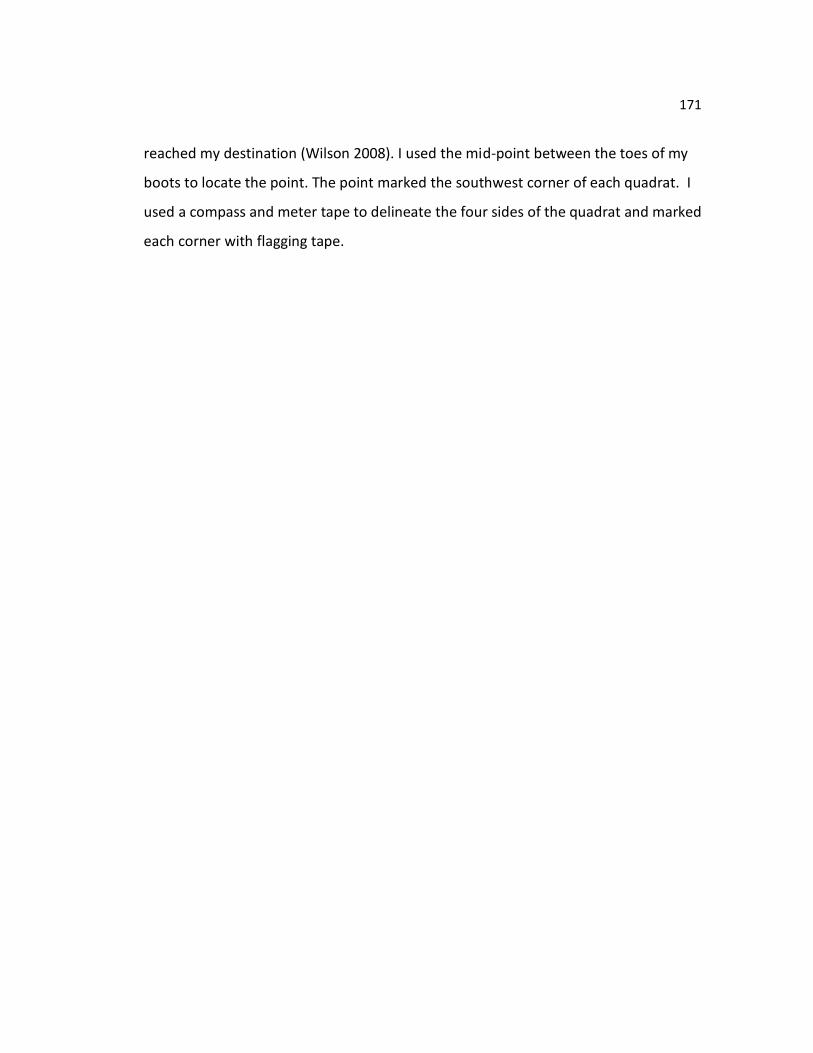
171
reached my destination (Wilson 2008). I used the mid-point between the toes of my
boots to locate the point. The point marked the southwest corner of each quadrat. I
used a compass and meter tape to delineate the four sides of the quadrat and marked
each corner with flagging tape.
172
Appendix D: Species List, 2010 Arsi Forest Plots
Latin name Family Local name
Allophylus abyssinicus Spindaceae Hirqammuu
Apodytes dimdiata Icacinaceae Arrab-dottessaa Arundunaria alpina Bambusaceae Lemana Bersama abyssinica Melianthceae Koraqqaa Buddleja polystachya Buddlejaceae Bulchaanaa Cassipurea malosana Hizophoraceae Xilloo Celtis africana Ulmaceae Amallaqa Croton macrostachyus Euphorbiaceae Bakkanisa
Dombiya torrida Sterculiaceae Dannisa Ekebergia capensis Meliaceae Somboo Erythrococca abyssinica Euphorbiaceae Gaalloo dhalaa Fagaropsis angolensis Rutaceae Sisaa Ficus sur Moraceae Harbuu Galiniera saxifraga Rubiaceae Koralla Hagenia abyssinica Rosaceae Koosoo
Juniperus excels Cupressaceae Hi’essa Maesa lanceolata Myrsinaceae Abbayyii Maytenus undata Celastraceae Kombolcha Milletia ferruginea Fabaceae Dhaadhatuu Myrica salicifolia Myricaceae Radjii Myrsine melanophloes Myrsinaceae Tula Nuxia congesta Loganiaceae Bixxannaa
Ochna holstii Ochnaceae Baabbee Olea europaea Oleaceae Ejersa
Pittosporum mannii Pittosporaceae Amshika Podocarpus falcatus Podocarpaceae Birbirsa Pouteria adolfi-friederici Sapotaceae Suduba Prunus africana Rosaceae Sukkee Spathodia nalotica Bignoniaceae
Syzygium guineense Myrtaceae Baddeessaa Teclia nobilis Rutaceae Hadheessaa
Sources: Didha (2008); Author’s fieldwork
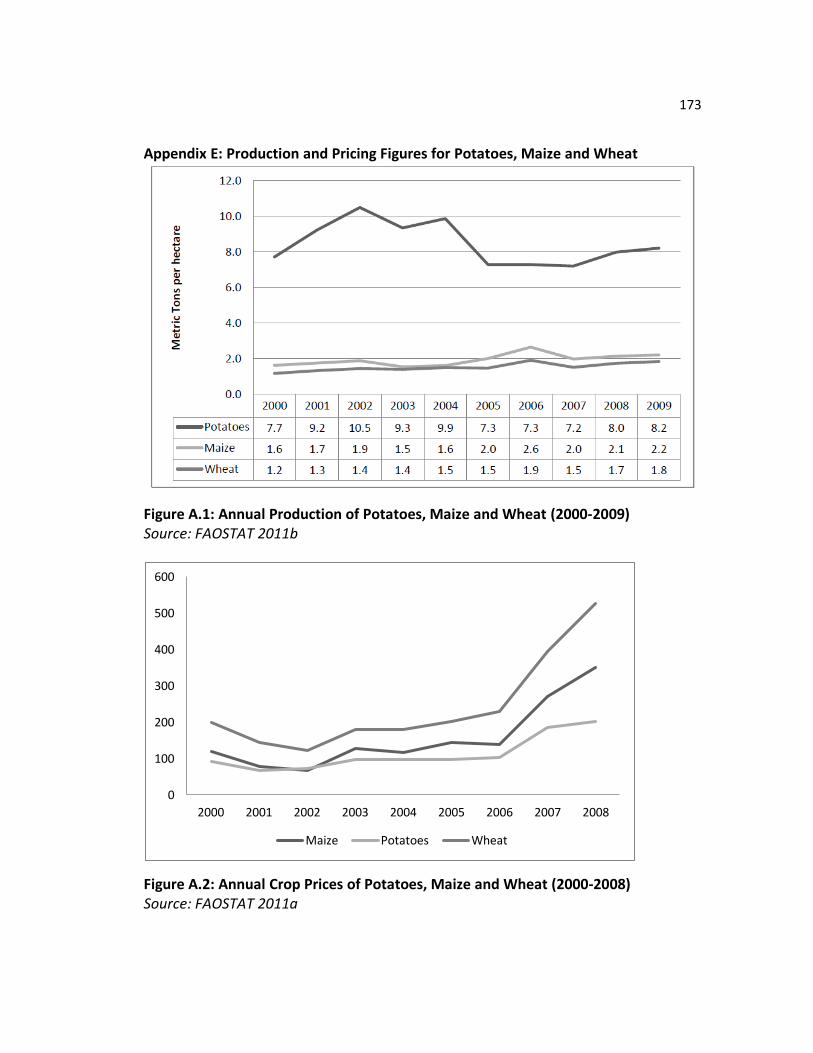
173
Appendix E: Production and Pricing Figures for Potatoes, Maize and Wheat
Figure A.1: Annual Production of Potatoes, Maize and Wheat (2000-2009) Source: FAOSTAT 2011b
Figure A.2: Annual Crop Prices of Potatoes, Maize and Wheat (2000-2008) Source: FAOSTAT 2011a
0
100
200
300
400
500
600
2000 2001 2002 2003 2004 2005 2006 2007 2008
Maize Potatoes Wheat