Embed Size (px)
Citation preview

HAL Id: inria-00070682https://hal.inria.fr/inria-00070682
Submitted on 19 May 2006
HAL is a multi-disciplinary open accessarchive for the deposit and dissemination of sci-entific research documents, whether they are pub-lished or not. The documents may come fromteaching and research institutions in France orabroad, or from public or private research centers.
L’archive ouverte pluridisciplinaire HAL, estdestinée au dépôt et à la diffusion de documentsscientifiques de niveau recherche, publiés ou non,émanant des établissements d’enseignement et derecherche français ou étrangers, des laboratoirespublics ou privés.
An a contrario approach to hierarchical clusteringvalidity assessment
Frédéric Cao, Julie Delon, Agnès Desolneux, Pablo Musé, Frédéric Sur
To cite this version:Frédéric Cao, Julie Delon, Agnès Desolneux, Pablo Musé, Frédéric Sur. An a contrario approach tohierarchical clustering validity assessment. [Research Report] RR-5318, INRIA. 2004, pp.15. �inria-00070682�
ISS
N 0
249-
6399
ISR
N IN
RIA
/RR
--53
18--
FR
+E
NG
appor t de r e ch er ch e
INSTITUT NATIONAL DE RECHERCHE EN INFORMATIQUE ET EN AUTOMATIQUE
An a contrario approach to hierarchical clusteringvalidity assessment
Frédéric Cao , Julie Delon , Agnès Desolneux , Pablo Musé , Frédéric Sur
N˚5318
Septembre 2004
Systèmes cognitifs


An a contrario approach to hierarchical clustering validity assessment
Frédéric Cao�
, Julie Delon�
, Agnès Desolneux�
, Pablo Musé�
, Frédéric Sur�
Systèmes cognitifsProjet Vista
Rapport de recherche n˚5318 — Septembre 2004 — 15 pages
Abstract: In this paper we present a method to detect natural groups in a data set, based on hierarchical clustering.A measure of the meaningfulness of clusters, derived from a background model assuming no class structure in thedata, provides a way to compare clusters, and leads to a cluster validity criterion. This criterion is applied to everycluster in the nested structure. While all clusters passing the validity test are meaningful in themselves, the set of all ofthem will probably provide a redundant data representation. By selecting a subset of the meaningful clusters, a gooddata representation, which also discards outliers, can be achieved. The strategy we propose combines a new mergingcriterion (also derived from the background model) with a selection of local maxima of the meaningfulness with respectto inclusion, in the nested hierarchical structure.
Key-words: hierarchical clustering, a contrario model, number of false alarms, Helmholtz Principle, maximality
(Résumé : tsvp)
�[email protected]�[email protected]�[email protected]�[email protected]@cmla.ens-cachan.fr
Unité de recherche INRIA RennesIRISA, Campus universitaire de Beaulieu, 35042 RENNES Cedex (France)
Téléphone : 02 99 84 71 00 - International : +33 2 99 84 71 00Télécopie : 02 99 84 71 71 - International : +33 2 99 84 71 71

Une approche a contrario de validation de clustering hiérarchique
Résumé : Une méthode de détection de groupes naturels basée sur une structure hiérarchique est présentée dans cetarticle. Une mesure de la significativité des clusters, déterminée à partir d’un modèle de fond et ne supposant aucunestructure dans les données, permet non seulement de comparer les clusters entre eux, mais aboutit également à un critèrede validation. Celui-ci est appliqué à tous les candidats de la structure hiérarchique. Tous les groupes réussissant le testsont significatifs, mais ils sont certainement aussi très redondants et ne reproduisent donc pas la structure des donnéesde manière satisfaisante. Nous proposons une stratégie permettant de sélectionner les «bons» groupes, grâce à un critèrede fusion (défini également à partir du même modèle de fond) et de la maximalité locale des clusters dans la structurehiérarchique.
Mots-clé : clustering hiérarchique, modèle a contrario, nombre de fausses alarmes, principe de Helmholtz, maximalité

A contrario clustering 3
1 Introduction
The unsupervised classification of data into groups is commonly referred as clustering. The aim of clustering is to dis-cover structure in a data set, by dividing it into its “natural” groups, so that data items within each cluster are more closelyrelated to one another than to data items assigned to different clusters. This paper considers clustering problems in whichdata are represented as patterns ( � -dimensional feature vectors) in a bounded subset � of R � . Hundreds of methods forfinding clusters in data have been reported in the literature. Most of the clustering methods are either partitional, eitherhierarchical methods [10]. Partitional methods identify the partition that optimizes a clustering criterion (e.g. minimumvariance partition). Hierarchical methods produce a hierarchical representation, in which each level of the hierarchy isitself a partition of the data. Hierarchial algorithms can be agglomerative or divisive; in the agglomerative case, thehierarchy is built by recursively merging the two closest clusters in the sense of a predefined proximity measure.
In general, the actual number of clusters which are present in the data is unknown. There may be possibly none.Even if this number is known in advance, the clusters produced by a particular clustering algorithm may not revealthe underlying structure of data. Consequently, cluster validation techniques have to be applied. There are differentvalidation approaches [5, 8], depending on the amount of prior information on the data. Internal validation tests consistin determining if the structure is intrinsically adapted to the data with no other information than the data themselves.In this work we will focus on the assessment and internal validation of clusters obtained by agglomerative hierarchicalprocedures. We will not discuss the choice of the clustering algorithm, since no method performs universally better thanthe other ones; depending on the cluster proximity measure and the clusters’ shape, different methods of clustering canbe more or less successful [6, 9, 10].
Hierarchical clustering can be represented by a dendrogram, where each node is a cluster in the hierarchical structure.Determining the partition that best fits the data amounts to cutting the dendrogram at a certain level. Rules for decidingthe appropriate level are known as stopping rules, because they can be seen as stopping the merging process. Typically, anindex based on the cohesion and/or the separation of clusters at each level is computed, and the level optimizing this indexis chosen. In general, stopping rules proposed in the literature are heuristic, ad hoc procedures, and lack of theoreticalfoundation [13]. This common approach for hierarchical clustering validation suffers from two main problems. First,since these indices have no absolute meaning, nothing ensures that clusters at the optimum level actually correspond tothe “natural” clusters. Second, noise or outliers cannot be rejected since every pattern is assigned to a cluster.
These considerations motivate the work which is presented in this paper. We propose a fully unsupervised method todetermine a set of relevant clusters within the hierarchical clustering structure, that suitably represents the data set. Theapproach is as follows:
1. Following [4], we define a measure of meaningfulness of a group of patterns: the “number of false alarms” ( ����� ).The lower the ����� is, the more the group is meaningful. This measure not only enables to rank the clusters inthe hierarchical clustering according to their relevance, but also to decide if a cluster is valid (i.e. represents a“natural” group in which outliers have been discarded) or not.
The definition of the ����� is based on the Helmholtz principle, which states that if an observed arrangement ofobjects is highly unlikely, the occurrence of such arrangement is significant and the objects should be groupedtogether into a single structure. This perceptual organization principle, also known as the principle of commoncause or of the coincidental explanation, was first stated in computer vision by Lowe [12]. Roughly speaking,a cluster or group of patterns is significant if its density is so high that such an arrangement is unlikely to bedue to randomness. In other words, there must be a better explanation for the observed cluster than randomness:the formation of causal relations. This qualitative definition can be made more precise in a hypothesis testingframework. In his founding paper, Bock [1] presents several significance tests for distinguishing between a nullhypothesis modeling the lack of structure in the data, and an alternative hypothesis involving clustering. Hence,clusters are detected a contrario to a null hypothesis or background model. The problem with these significancetests is that there is no intuitive rule to fix their significance level. Desolneux et al. [4] propose to bypass thisdifficulty by controlling the expected number of false alarms (the ����� ).
2. All clusters showing a small enough ����� are meaningful in themselves, when considered as isolated entities.However, since they are embedded in a hierarchical structure, the set of all of them will probably provide a veryredundant representation. In order to achieve a good data representation, a disjoint subset of meaningful clustershas to be selected. We propose a selection strategy which combines the ordering established by the ����� , theinclusion relations in the hierarchical structure, and a merging criterion for deciding whether two clusters should
RR n˚5318

4 Cao &Delon & Desolneux & Musé & Sur
be merged or not. The proposed merging criterion is based on the same a contrario approach: two clusters ���and ��� should be merged if, under the background model, their union is less likely to be observed than ��� and��� separately.
The plan of this article is as follows. In section 2 we recall classical issues in clustering validation and stopping rulesfor hierarchical classifications. In section 3 we present the notion of meaningful group of patterns, based on the workby Desolneux et al. [4]. We then propose a new merging criterion. This criterion, combined with the selection of localmaxima of the ����� with respect to inclusion, leads to a reasonable set of clusters that well represents the data. This isconfirmed by the experiments on synthetic and real data that we present in section 4. We conclude in section 5.
2 Cluster validity and stopping rules
The large variety of clustering methods that have been proposed in the recent past has been followed by an increasinginterest in clustering validation methods. In [8], a comprehensive study of these techniques is presented. Classical issuesin cluster validity analysis are the assessment of individual cluster validity, and the assessment of a whole partition. Inwhat follows we briefly summarize these two issues.
2.1 Partition validity assessment
A relevant question to address in order to assess the validity of a partition, is deriving the number of clusters [5], thatwe denote by � . Notice however that by solving this problem, it cannot be ensured that the � clusters are valid clusters.The most common approach to decide how many clusters are best consists in finding partitions for ������ � � ����������and optimizing a measure ������� of partition adequacy, which is usually based on the within-cluster and between-clustervariability. When applied to hierarchical clustering methods, these techniques are known as global stopping rules,because the choice of � can be seen as stopping the merging process (in the agglomerative case) at a certain level of thedendrogram. A popular stopping rule for assessing partitions was proposed by Calinski and Harabasz in [2]. They define������� as the ratio between the total within-cluster sum of squared distances to the centroids, and the total between-clustersum of squared distances. Since the index is based on the sum of squares criterion, it has a tendency to partition thedata into hyperspherical shaped clusters, having roughly equal numbers of patterns [8]. We can summarize the maindrawback of global stopping rules by quoting Bock [1]: “Some care is needed when applying any test for clustering,bearing in mind that different types of clusters may be present simultaneously in the data, and that the number of clustersis, in some sense, dependent on the intended level of information compression. Thus, a global application of a clustertest to a large or high-dimensional data set will not be advisable in most cases. However, a “local” application (...) toa specific part of the data will often be useful for providing evidence for or against a prospective clustering tendency”.
In agglomerative hierarchical classifications, local approaches can be conceived by deciding if two clusters should bemerged or not. Usually, the merging process is continued until it is decided, for the first time, that two clusters should notbe aggregated (see for instance Duda and Hart’s rule, [6] chapter 10.10). These strategies, referred to as local stoppingrules, present an inherent drawback: a global decision is inferred from a too much local information.
Comparative studies of stopping rules are presented by Milligan and Cooper in [13], or Dubes in [5]. A majorconclusion of their works is that the majority of the described stopping rules are based on heuristics and lack of theoreticalfoundation. Those derived from rigorous statistical techniques, assume in general hypotheses on the data which areunrealistic in most real applications (e.g. multivariate normal distribution for the patterns).
2.2 Validity assessment of individual clusters
Now we are concerned with the problem of deciding, among the candidate clusters furnished by the clustering procedure,which are the ones that correspond to “natural” clusters. But what does a “natural” cluster look like? As pointed outby Gordon [8], it may be difficult to specify a relevant definition of ideal cluster for a particular data set. However, wecan think of clusters as some structure in the data. Clustered data reveal then structure, that is perceived as opposite toa complete absence of structure. Thus, in order to decide whether the clusters we have found are significant, we canproceed by comparing our actual data with some appropriate random distribution. This leads to a general methodologyfor cluster validity analysis, based on the statistical approach of hypothesis testing [1, 7, 8], that we call a contrariostrategy. Following Bock [1], this framework consists in:
INRIA

A contrario clustering 5
1. Designing a null hypothesis � for the absence of class structure in the data (a background model, or null model),meaning that patterns are sampled from a “homogeneous” population. Then, “heterogeneity” or “clustering struc-ture” are involved in the alternative hypothesis � .
2. Defining a test statistic, which will be used as validity index to discriminate between � and � .
3. Rejecting the null hypothesis � in favor of � if, for a given significance level (error probability) � , the test statisticof the observed data exceeds the corresponding critical value ��� .
This general framework can be adapted for assessing the validity of individual clusters. A popular approach withinthis framework is Monte-Carlo validation, which is described in [8]. Assume one wants to assess the validity of anobserved cluster � having � patterns, in a data set having � patterns. In the Monte-Carlo validation method, data setsof � patterns are simulated under the background model, and classified using the same clustering procedure that wasused to classify the original data. The test statistic is computed for those clusters having � patterns, and the distributionof the test statistic is estimated. Then, using the value of the test statistic of � , one can compute the significance level ofrejecting � . Two popular test statistics are the maximum � test and the � statistic (see Bock [1] and Gordon [8]).
We have not addressed the choice of the null model yet. The specification of appropriate null models for data is thesubject of the study presented in [7]. These models, which specify the distribution of patterns in the absence of structurein the data, can be of two types:
– Standard (data-independent) null models. Two well known standard null models are the Poisson model and theUnimodal model [1]. The main problem with the Poisson model is the choice of the region � within which patternsare uniformly distributed (standard choices for normalized data are the unit hypercube and the unit hypersphere).The Unimodal model assumes that the joint distribution of the variables describing the patterns is unimodal, butthe choice of the distribution may not be easy.
– Data-influenced null models. Here the data are used to influence the specification of the null model. Examples ofthese null models are the Poisson model where � is chosen to be the convex hull of the data set, or the Ellipsoidalmodel, which is a multivariate normal distribution, whose mean and covariance matrix are given by the data set.
In [7], Gordon concludes that the results of the tests considerably depend on the choice of the null model, and that, ingeneral, the results based on data-influenced null models are more relevant than those obtained using a standard nullmodel.
In the following section we propose a method to detect valid clusters from an agglomerative hierarchical classifi-cation, that combines an individual cluster validity method and a merging criterion. The first step consists in deciding,a contrario to a data-influenced background model, whether a cluster is valid or not. All clusters in the hierarchicalstructure are examined. While all clusters passing the validity test are meaningful in themselves, the set of all of themdoes not necessarily reveal the structure of the data set. However, by selecting a subset of the meaningful clusters, agood data representation can be achieved. Hence, in the second step such a selection is performed, by means of a newmerging criterion, also derived from the background model. Unlike the classical hypothesis testing methods presented inthis section, the proposed method does not require to a priori fix an arbitrary significance level for deciding the validityof clusters.
3 Meaningful clusters
3.1 A contrario definition of meaningful groups
Let us suppose that a distribution function (which we call background law) is defined over the pattern space � . Inthe following, for every subset � of � , we will denote by ���� the probability � �������� (where � is the probabilitymeasure associated to ). This distribution function enables us to define a background process.
Definition 1 We call background process the stochastic process ����� � ���� ������� �! , where the � random vectors �"� (whosevalues are in � ) are independent and identically distributed, with distribution function .
RR n˚5318

6 Cao &Delon & Desolneux & Musé & Sur
Now, consider a set of � patterns. The cornerstone of the proposed methodology consists in the following assumption:
(A) the M-tuple ��� � � ���� ������� �! made of the � observed patterns is a realization of the background process.
The definition of the background law is problem specific. In general, it is given a priori, or can be empirically estimatedover the data.
Having a background model, we are in position to evaluate the probability of a given cluster of patterns as a real-ization of the background process. Hence, we are able to detect relevant clusters by Helmholtz principle: those clustersbeing unlikely to be observed by chance will be considered as meaningful groups. Let us give an example to illustrate thisidea. In Figure 1, we display two 2- � representations of a group of objects, as points in the (diameter, elongation) space,and in the space of coordinates, respectively. These two features have no reason to show such a special arrangement,one could therefore expect that, in general, they are uniformly distributed. Consequently, the “high density” cluster weobserve at the top left corner in the first 2- � representation reveals a conspicuous coincidence. Indeed, the probabilityof it being a realization of the background process should be very low, and one would expect it to be an exception torandomness. This cluster corresponds to the set of all the entire circles in the image. On the contrary, no cluster can beseen in the second representation, what means that we should not find groups with respect to these two features.
Figure 1: Left: image of geometrical objects. Center: 2- � representation of these objects in the space (diameter,elongation). Right: 2- � representation of these objects in the space of objects’ barycenter coordinates.
Let us make things more precise. For any region � in the feature space, we know how to compute the “region probability” � ��� , the probability that a pattern generated by the background process falls in � . Then, since patterns are mutuallyindependent, the probability that � contains at least
�patterns out of � under the background model is given by the tail
of the binomial probability distribution � � � � � � � � � � � ������� � � �� � � ��� ���
where � � ���� �� � � ����� � � � �� � ���� � ��� � �� � � � � � ��� ���� � ��� � For obvious algorithmic reasons, we cannot explicitly test all regions � in � . Hence, the next step prior to detectionis to define a set � of reasonable region candidates. For the sake of simplicity, � will consists in a finite set of hyper-rectangles. We may consider one of the most basic possibilities, which is the set of all hyper-rectangles of differentsizes within a given quantization grid of the (bounded) feature space � . Let us denote by � � the cardinality of � . Ifeach dimension of � is divided into ! bins, � � � � ! �"!$# ��% � � Definition 2 ( & -meaningful region) We say that a region � of � , containing
�patterns, is & -meaningful if� �(' � � � � � � � ��� � 6 &
INRIA

A contrario clustering 7
Proposition 1 The expected number of & -meaningful regions in � is less than & .Proof: Let us denote by � � the binary random variable equal to 1 if the region � in � is & -meaningful and 0 otherwise.Let � ��� � ��� � � be the random variable representing the number of & -meaningful regions in � .By linearity, the expectation of � is E � ������� � ��� E � � � � . Hence, since � � is a Bernoulli variable,
E � ��� � �� ���
� ��� � � �
Let us denote by�� � &�� the minimum number of points in � such that � is & -meaningful:� � &�� ������� � � N � � � � � � � � ��� � � 6
&� �
This number is well defined because� � � � � � � � � � is a decreasing function of
�. It follows that
� ��� � � �� � � � � >� ��&�� � � � � � � � � &���� � � � � 6
&� �
Thus,E � ��� 6 �
� ���&� � �
yielding E � ��� 6 & .Remark 1 The key point is that we control the expectation of � . Since dependencies between random variables � �are unknown, we are not able to compute the probability law of � . Nevertheless, linearity still allows to compute theexpectation.
The following definition provides a quality measure for a cluster or group of patterns in the feature space.
Definition 3 (Number of False Alarms) Given a group � of�
meaningful patterns among � , we call number of falsealarms of � the number
������� ��� � � � �(' � � � � � � ���� ���where � is the smallest region of � containing all
�patterns.
The number of false alarms of � is a measure of how likely it is that a group having at least�
meaningful patternsand a region probability � ��� , was generated “by chance”, as a realization of the background process. The lower is����� � ��� � , the less likely � is generated by the background, and hence, the more meaningful is � . In other words, if����� � ��� � is very small, elements in � certainly violate assumptions in (A), leading to an a contrario detection. Noticealso, from Proposition 1, that the only parameter that controls detections is & . This provides a handy way to control falsedetections: if we want to detect on the average at most one “non relevant cluster” among all & -meaningful clusters, wejust set &�� . From now on, we refer to -meaningful groups as “meaningful groups”.
3.2 Finding a suitable data representation: merging condition and maximality criterion
In section 3.1 we have defined the notion of meaningful groups of patterns, and proposed to restrict the space of teststo the smallest regions of � containing clusters from the dendrogram. While each meaningful group we detect will berelevant by itself, the whole set of meaningful groups will probably exhibit high redundancy in the sense that we willget many nested meaningful groups. In this section we describe a strategy to reduce this redundancy by combining theinclusion tree given by the hierarchical clustering procedure, and the measure of meaningfulness given by ����� � .Let us start this discussion by the following issue. At each step of the hierarchical clustering procedure, two clustersare merged. This merging is not necessarily a better data representation than the two separate clusters. By using thecomplete dendrogram (that we denote by � ) of
% � � clusters, we can decide a posteriori whether pairs of clustersshould be merged or not. Let us denote by � , � � and ��� the groups of patterns corresponding respectively to a node and
RR n˚5318

8 Cao &Delon & Desolneux & Musé & Sur
its two children nodes in � . Roughly speaking, we will accept merging if, under the a contrario model, the expectednumber of groups like � we would observe is smaller than the one of observing groups like ��� , ��� , or the pair ��� and��� . In this case, we will say that � satisfies the merging criterion. Before giving a precise merging criterion definition,let us define ����� � � ��� � � � � � , the number of false alarms of the pair ��� � � � � � :
����� � � ��� � � � � � � � � � � �(� �% ������� � ��� ��
� � ��� � � ��� � � � � � � � � � � � ��� � � � � (1)
where� � and
� � are the number of elements in ��� and ��� , and �� and � their associated region probabilities. � � ��� �denotes the trinomial coefficient. ����� � � ��� � ��� � � is an estimate of the number of occurrences, under the a contrariomodel, of the event � : “there are two disjoint groups � and � , with region probabilities � and � (resp.), containing atleast
� � and� � patterns (resp.) among � ”. Indeed, � � � � �(� � % is the number of pairs of clusters of � , and the
probability of event � is given by the joint tail of the trinomial probability distribution.
Definition 4 (Merging condition) Let � , � � and � � be the groups of patterns corresponding respectively to a nodeand its two children nodes in � . We say that � satisfies the merging condition if both following inequalities hold:
����� � ��� ��� ����� � ����� � ��������� ����� � ������� � � (2)
����� � ��� � 6 ������� � ����� �������� (3)
Eq. (2) corresponds to the condition that merging cannot be suitable if one of the child nodes is more meaningful thanthe father. Eq. (3) means that for � to be valid, it is necessary that its number of false alarms is lower than the numberof false alarms of the pair ��� � � � � � . The following lemma leads to a necessary condition for merging.
Lemma 1 For every� � and
� � in � � �� � � �� ��� , for every � and � in � � �� � , the following inequality stands:��� � � � ��� ��
� ��� � � ��� � � �� � � � � ���� � ��� ��� � � � 6� � � � � ��� ��� ' � � � � � � � � �� (4)
Proving lemma 1 directly by calculation is not trivial. Inequality (4) is a consequence of the negative dependenceamongst random variables � � and ��� , the number of patterns in two random clusters � and � . Intuitively, thisdependence (which is obvious because of the condition � � # ��� 6 � ) is negative in the sense that, if � � is “large”,��� is less likely to be “large”. The notion of negative dependence was introduced in [11], where the authors also provethat multinomial distributions are negatively associated.
Proposition 2 If � satisfies the merging condition, then ����� � ��� ��� �� ' ����� � ��� � � ' ����� � ��� � �� Proof: The result follows immediately from (1), definition 4 and lemma 1.
Proposition 2 is useful from the computational viewpoint, since in many cases one can avoid computing the tail ofthe trinomial distribution, by “filtering” those clusters that do not pass the necessary condition.
The union of all meaningful groups which satisfy the merging condition is not disjoint, and consequently, it does notprovide a compact representation of data. This consideration motivates the following definition.
Definition 5 (Maximal & -meaningful group) We say that a group of patterns G is a maximal & -meaningful group ifand only if:
1. ����� � ��� � 6 & ,2. � satisfies the merging condition (cf definition 4),
3. for all descendant � that satisfies the merging condition, ����� � � � ��� ����� � ��� � ,4. for all ancestor � that satisfies the merging condition, ����� � � � � > ����� � ��� � .Imposing items 3 and 4 ensures that two different maximal meaningful groups are disjoint. Indeed, since they are
nodes of the dendrogram, they cannot overlap, and because of points 3 and 4, they cannot be nested. Hence, maximalmeaningful groups define a set of groups on the data, which is optimal in the sense that these groups are maxima ofmeaningfulness with respect to inclusion, and where outliers have been automatically rejected.
INRIA

A contrario clustering 9
3.3 Influence of the merging condition
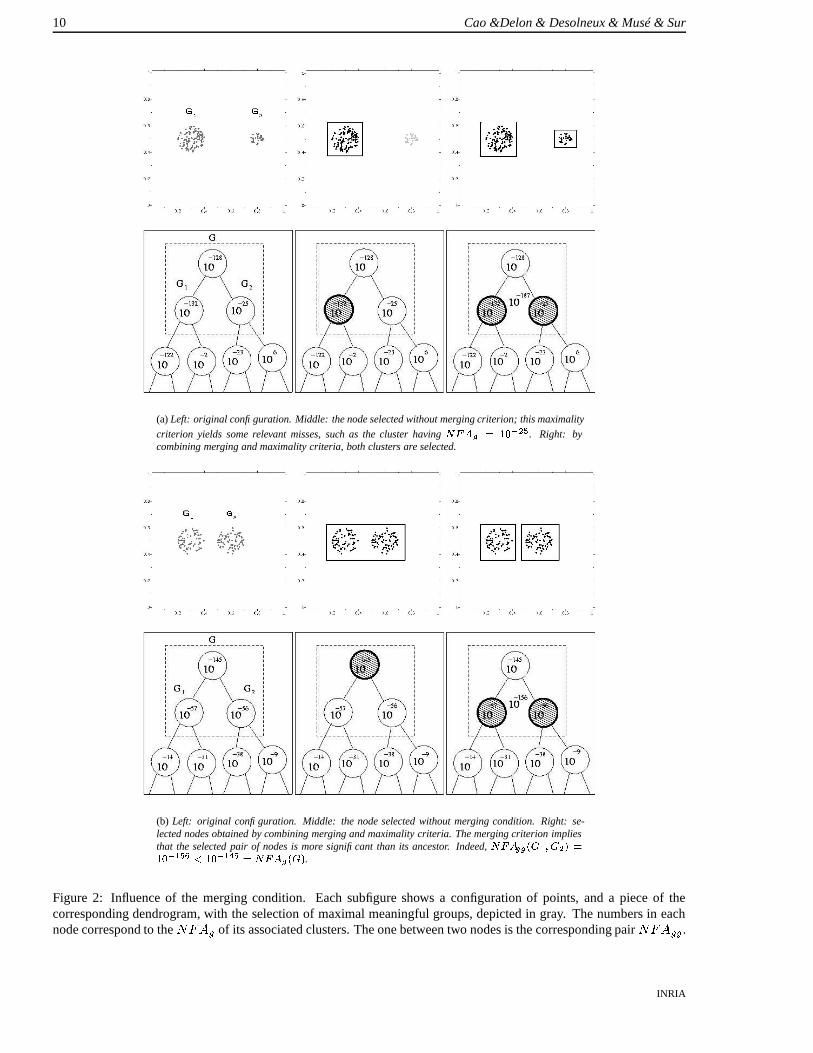
Let us illustrate the critical importance of the merging condition with two simple examples. The top of Figure 2 shows aconfiguration of 150 points, distributed on � � �� � � , and naturally grouped in two clusters � � and ��� . In the hierarchicalstructure, ��� and ��� are the children of � � ����� ��� . All three nodes are obviously meaningful, since their corre-sponding ������� are less than (and are all the lower since they represent very concentrated clusters of points). Their����� � are also lower than the other groups in the dendogram. Now, the following situation occurs:
����� � ��� � � � ����� � ��� � � ����� � ��� � �If we define the maximality in the tree without taking into account the merging condition (in this case, a group ismaximal meaningful if it is more meaningful than all the other groups in its branch), then � � will be considered asonly maximal meaningful cluster of the tree. Neither � nor � � will be selected, since ����� � ��� � � � ����� � ��� � and����� � ��� � � ����� � ��� � � . Now, it is clear that � � represents an informative part of the data that should be kept. Ithappens that ����� � � ��� � ��� � � � ����� � ��� � , which means that � does not satisfy the merging condition. Thus, ifwe add the merging condition in the maximality definition, � will not be taken into account in the maximality search.Consequently, � � is considered as a maximal group in its branch, and is also selected as a maximal meaningful group.
The second part of Figure 2 shows another typical configuration where the merging criterion is needed. In thisexample, the union � of two clusters � � and � � is more meaningful than each separate cluster. This implies that if wedo not take into account the merging condition in the maximality definition, � will be the only maximal meaningfulgroup selected. It would be coherent to represent the data by � if � � and � � were mixed enough. However, we seeon the figure that these two clusters are clearly separated by an empty space. It seems much more relevant here torepresent the set of points by two separate clusters than by � . The merging condition confirms this expectation, since����� � � ����� � ����� � ������� ��� � .
4 Some experiments
In this section, in order to illustrate the proposed method, we present some experiments based on synthetic data. In allthe experiments, we use the single-linkage algorithm [10, 6] (the nearest-neighbor points determine the nearest subsets)to build the hierarchical clustering structure. The set � of region candidates is the set of all hyper-rectangles supportedby the regular grid dividing each dimension of the feature space in ! � � � bins. Thus, in D-dimensions, the number oftests is � ! �"! # � % � � .
4.1 Synthetic data
2- � experiments. Figure 3 shows a realization of a process of 950 independent, uniformly distributed points in � � �� � � .Then, 25 points are added “by hand” in the neighborhood of � � � ��� � � , and 25 other points in the neighborhood of� � �� � � �� � . If we use as background model the uniform distribution on � � �� � � , two maximal meaningful groups arefound, corresponding approximately to the handmade clusters. They contain the added points and the points of theuniform background lying in the same area. The left group is composed of 32 points and its ����� is � ��� . The secondone is composed of 36 points and its ����� is � ��� � . As expected, no maximal meaningful group is found in the uniformbakground.Figure 4 shows another example, where 1000 points are distributed on � � �� � � , according to a distribution law, which is alinear combination of the uniform distribution and two gaussian laws (with different means and standard deviations). Ifwe use as background model the uniform distribution on � � �� � � , two maximal meaningful groups are found, correspond-ing approximately to the modes of the gaussians. The first one, corresponding to the gaussian of largest coefficient,contains 251 points, and its ����� is � � ���� . The second one contains 71 points and its ����� is � �� � . As we couldexpect, the groups are much more meaningful in this experiment. Notice that this example shows that we can detectgaussian modes without any a priori parametric model.
4.2 Object grouping based on elementary features.
Grouping phenomena are essential in human perception, since they are responsible for the organization of information.In vision, grouping has been especially studied by Gestalt psychologists like Wertheimer [14]. In these experiments,
RR n˚5318
10 Cao &Delon & Desolneux & Musé & Sur
(a) Left: original configuration. Middle: the node selected without merging criterion; this maximality
criterion yields some relevant misses, such as the cluster having ������������ ���� . Right: bycombining merging and maximality criteria, both clusters are selected.
(b) Left: original configuration. Middle: the node selected without merging condition. Right: se-lected nodes obtained by combining merging and maximality criteria. The merging criterion impliesthat the selected pair of nodes is more significant than its ancestor. Indeed, ����� ������������� ��� ���� � ���! "��� �$# �%�"����� �&��� � .
Figure 2: Influence of the merging condition. Each subfigure shows a configuration of points, and a piece of thecorresponding dendrogram, with the selection of maximal meaningful groups, depicted in gray. The numbers in eachnode correspond to the ����� � of its associated clusters. The one between two nodes is the corresponding pair ����� � � .
INRIA

A contrario clustering 11
Figure 3: Left: distribution of 1000 points on � � �� � � . Among them, 950 are uniformly distributed, and 50 are put “byhand” around �"� � � � � � and � � �� � � �� � . Right: two maximal meaningful groups are detected. The ����� of the right oneis � � � � , and � ��� for the other one.
Figure 4: Left: distribution of 1000 points on � � �� � � . The distribution law used here is a linear combination of theuniform distribution and of two gaussian laws. Right: two maximal meaningful groups are detected. Their ����� are � � ���� , for the largest one, and � ���� for the other one.
RR n˚5318

12 Cao &Delon & Desolneux & Musé & Sur
we aim at detecting the groups of objects in an image, that share some elementary features. The objects boundaries areextracted as some contrasted level lines in the image (see [3] for a full description of this extraction process). Oncethese objects are detected, say ������ �� � , we can compute for each of them a list of � features (grey level, position, orientation, etc...). If
�objects among � have one or several features in common, we wonder if it is happening by
chance or if it is enough to group them. In order to answer this question, we choose to normalize each feature in � � �� � ,and to represent the objects as points in the feature space � � �� � � . We can then look for maximal meaningful groups inthis space.
Segments. In this first example, groups are perceived as a result of the collaboration between two different features.Figure 5 shows 71 straight segments with different orientations, almost uniformly distributed in position. As expected,no maximal meaningful cluster is detected in the space of position coordinates. If we choose the orientation as onlyfeature ( � � ), 3 maximal meaningful groups are detected, corresponding to the most represented orientations. Noneof these clusters exhibits a very low ����� , and we can hardly perceive them. The other orientations do not createmeaningful groups because they are not enough represented.
Now, let us see what happens when considering two features ( � � % ). In the space ( � -coordinate, orientation), onlyone maximal meaningful cluster is found. This cluster corresponds to the group � of 11 central vertical segments. Its����� is equal to � ��� . Here, the conjonction of qualities reveals a much more meaningful coincidence than separatedfeatures. In the space ( � -coordinate, orientation), two maximal meaningful clusters are found. They correspond to thetwo lines of segments composing � . The first one, say � � , contains 6 segments and its ����� is � � �� . The second one,say � � contains 5 segments and its ����� is � � � � � . The role of the merging criterion is decisive here. In the space ( � -coordinate, orientation), the combination of the maximality and the merging criterion yields that it is more meaningfulto observe at the same time � � and � � than the whole � . This is coherent with the visual perception, since we actuallysee two lines of segments here. On the contrary, in the ( � -coordinate, orientation) space, the merging criterion indicatesthat observing � is more meaningful than observing simultaneously its children in the dendrogram. This decision isstill conform with observation: no particular group within � can be distinguished with regards to the � -coordinate. Thesame group is obtained in the space ( � -coordinate, � -coordinate, orientation), with an obviously lower ����� .
DNA image. The 80 objects in Figure 6 are more complex, in the sense that more features are needed in order torepresent them (diameter, elongation, orientation, etc.). It is clear that a projection on a single feature is not reallyenough to differentiate the objects. Globally, we see three groups of objects: the DNA marks, which share the sameform, size and orientation; the numbers, all on the same line, almost of the same size; finally the elements of the ruler,also on the same line and of similar diameters. The position appears to be decisive in the perceptive formation of thesegroups. In the space (diameter, � -coordinate), we find 6 maximal meaningful groups. Four correponds to the 4 linesof DNA marks (First line: 5 objects, ����� � � ����� . Second line: 6 objects, ����� � � ��� . Third line: 6 objects,����� � � ����� . Fourth line: 6 objects, ����� � � ���� � ), one to the group of numbers (22 objects, ����� � � ��� ),and one to the group of objects in the ruler (27 objects, � ��� ).
Now, assume that we do not consider the position information. Do we still see the DNA marks as a coherentgroup? By taking several other features into account, the DNA marks form an isolated and very meaningful group: thecombination of features (orientation, diameter, elongation, convexity coefficient) reveals the DNA marks as the only onemaximal meaningful cluster ( ����� � � ����� ). This means that an elementary form description is enough to perceptivelydistinguish the DNA group among all these objects, whatever their position.
5 Conclusion
Finding groups in data sets is a major problem in many fields of knowledge such as statistical pattern recognition, imageprocessing, or data mining. In this paper, we proposed a method to select the clusters in a hierarchical structure, whichsuitably represent the dataset. We introduced a quantitative measure of validity (the ����� ), inspired by Desolneuxet al.’s work [4], which aims at controlling the number of false alarms. This measure enables to detect the groups ofpatterns which are meaningful when considered as isolated entities. In order to obtain a non-redundant description ofthe data, and to discard outliers, we propose a selection strategy which combines the natural ordering induced by the����� in the tree, and a new merging criterion, which is consistent with the ����� measure. A generalization of thismerging rule, using multinomial distributions, can be applied to non-binary trees. Experiments in section 4 illustratethe good performances of the method concerning the previous claims. Moreover, as shown in the last experiment,
INRIA

A contrario clustering 13
(a)
(b)
(c)
Figure 5: (a) Image of segments and its maximal meaningful level lines ( & � � � � , 71 objects). (b) Maximal mean-ingful groups for orientation. The more meaningful one is the group of vertical lines ( ����� � � � �� , 9 objects). (c)Left: 2D-representation of the objects in the space ( � -coordinate,orientation). There is only one maximal meaningfulgroup, indicated by the rectangle. There is no maximal meaningful group for position only. Right: corresponding groupof objects ( ����� � � ��� , 11 objects).
RR n˚5318

14 Cao &Delon & Desolneux & Musé & Sur
(a)
(b)
Figure 6: (a) Left: DNA mage. Right: its maximal meaningful level lines ( &�� � � �� , 80 objects). (b) Maximal mean-ingful group ( ����� � � ��� � , 23 objects) for the following combination of qualities: diameter, orientation, elongation,convexity coefficient.
INRIA

A contrario clustering 15
the clustering validation method presented here, provides an appealing framework to the analysis of the collaborationbetween perceptive cues. An application of this method to shape recognition is being investigated by the authors.
References
[1] H.H. Bock. On some significance tests in cluster analysis. Journal of Classification, 2:77–108, 1985.
[2] T. Calinski and J. Harabasz. A dendrite method for cluster analysis. Communications in statistics, 3(1):1–27, 1974.
[3] A. Desolneux, L. Moisan, and J.-M. Morel. Edge detection by Helmholtz principle. Journal of MathematicalImaging and Vision, 14(3):271–284, 2001.
[4] A. Desolneux, L. Moisan, and J.-M. Morel. A grouping principle and four applications. IEEE Transactions onPattern Analysis and Machine Intelligence, 25(4):508–513, 2003.
[5] R . C. Dubes. How many clusters are best? – an experiment. Pattern Recognition, 20(6):645–663, 1987.
[6] R.O. Duda, P.E. Hart, and D.G. Stork. Pattern Classification. John Wiley and Sons, 2000.
[7] A.D. Gordon. Null models in cluster validation. In W. Gaul and D. Pfeifer, editors, From Data to Knowledge:Theoretical and Practical Aspects of Classification, Data Analysis, and Knowledge Organization, pages 32–44.Springer Verlag, 1996.
[8] A.D. Gordon. Classification. Monographs on Statistics and Applied Probability 82, Chapman & Hall, 1999.
[9] T. Hastie, R. Tibshirani, and J. Friedman. The Elements of Statistical Learning Data Mining, Inference, andPrediction. Springer Series in Statistics, 2001.
[10] A. K. Jain, M. N. Murty, and P. J. Flynn. Data clustering: a review. ACM Computing Surveys, 31(3):264–323,1999.
[11] K. Joag-Dev and F. Proschan. Negative association of random variables, with applications. Annals of Statistics,11(1):286–295, 1983.
[12] D.G. Lowe. Perceptual Organization and Visual Recognition. Kluwer Academic Publisher, 1985.
[13] G.W. Milligan and M.C. Cooper. An examination of procedures for determining the number of clusters in a dataset. Psychometrika, 50(2):159–179, 1985.
[14] M. Wertheimer. Untersuchungen zur Lehre der Gestalt, II. Psychologische Forschung, (4):301–350, 1923. Trans-lation published as Laws of Organization in Perceptual Forms, in Ellis, W. (1938). A source book of Gestaltpsychology (pp. 71-88). Routledge & Kegan Paul.
RR n˚5318

Unité de recherche INRIA Lorraine, Technopôle de Nancy-Brabois, Campus scientifique,615 rue du Jardin Botanique, BP 101, 54600 VILLERS LÈS NANCY
Unité de recherche INRIA Rennes, Irisa, Campus universitaire de Beaulieu, 35042 RENNES CedexUnité de recherche INRIA Rhône-Alpes, 655, avenue de l’Europe, 38330 MONTBONNOT ST MARTIN
Unité de recherche INRIA Rocquencourt, Domaine de Voluceau, Rocquencourt, BP 105, 78153 LE CHESNAY CedexUnité de recherche INRIA Sophia-Antipolis, 2004 route des Lucioles, BP 93, 06902 SOPHIA-ANTIPOLIS Cedex
ÉditeurINRIA, Domaine de Voluceau, Rocquencourt, BP 105, 78153 LE CHESNAY Cedex (France)
http://www.inria.frISSN 0249-6399


![THE KLEENE HIERARCHY CLASSIFICATION OF RECURSIVELY RANDOM ... · THE KLEENE HIERARCHY CLASSIFICATION OF RECURSIVELY RANDOM SEQUENCESO) BY D. W. LOVELAND Introduction. In [1], Church](https://img.pdfslide.us/doc/110x75/5c5dadff09d3f2dc448d2c35/the-kleene-hierarchy-classification-of-recursively-random-the-kleene-hierarchy.jpg)