Embed Size (px)
Citation preview

An 11-bp Insertion in Zea mays fatb Reduces the PalmiticAcid Content of Fatty Acids in Maize GrainLin Li1., Hui Li1., Qing Li1, Xiaohong Yang1, Debo Zheng1, Marilyn Warburton2, Yuchao Chai1, Pan
Zhang1, Yuqiu Guo1, Jianbing Yan1,3*, Jiansheng Li1*
1 National Maize Improvement Center of China, China Agricultural University, Beijing, China, 2 Corn Host Plant Resistance Research Unit, Agricultural Research Service,
United States Department of Agriculture, Starkville, Mississippi, United States of America, 3 Genetic Resources Program, International Maize and Wheat Improvement
Center, Mexico City, Mexico
Abstract
The ratio of saturated to unsaturated fatty acids in maize kernels strongly impacts human and livestock health, but is acomplex trait that is difficult to select based on phenotype. Map-based cloning of quantitative trait loci (QTL) is a powerfulbut time-consuming method for the dissection of complex traits. Here, we combine linkage and association analyses to finemap QTL-Pal9, a QTL influencing levels of palmitic acid, an important class of saturated fatty acid. QTL-Pal9 was mapped to a90-kb region, in which we identified a candidate gene, Zea mays fatb (Zmfatb), which encodes acyl-ACP thioesterase. An 11-bp insertion in the last exon of Zmfatb decreases palmitic acid content and concentration, leading to an optimization of theratio of saturated to unsaturated fatty acids while having no effect on total oil content. We used three-dimensional structureanalysis to explain the functional mechanism of the ZmFATB protein and confirmed the proposed model in vitro and in vivo.We measured the genetic effect of the functional site in 15 different genetic backgrounds and found a maximum change of4.57 mg/g palmitic acid content, which accounts for ,20–60% of the variation in the ratio of saturated to unsaturated fattyacids. A PCR-based marker for QTL-Pal9 was developed for marker-assisted selection of nutritionally healthier maize lines.The method presented here provides a new, efficient way to clone QTL, and the cloned palmitic acid QTL sheds lights onthe genetic mechanism of oil biosynthesis and targeted maize molecular breeding.
Citation: Li L, Li H, Li Q, Yang X, Zheng D, et al. (2011) An 11-bp Insertion in Zea mays fatb Reduces the Palmitic Acid Content of Fatty Acids in Maize Grain. PLoSONE 6(9): e24699. doi:10.1371/journal.pone.0024699
Editor: Hany A. El-Shemy, Cairo University, Egypt
Received April 9, 2011; Accepted August 18, 2011; Published September 13, 2011
This is an open-access article, free of all copyright, and may be freely reproduced, distributed, transmitted, modified, built upon, or otherwise used by anyone forany lawful purpose. The work is made available under the Creative Commons CC0 public domain dedication.
Funding: This research was supported by the National Natural Science Foundation of China, the National Hi-Tech Research and Development Program of Chinaand the Genetically Modified Varieties Breeding Science and Technology Projects of China. The funders had no role in study design, data collection and analysis,decision to publish, or preparation of the manuscript.
Competing Interests: The authors have declared that no competing interests exist.
* E-mail: [email protected] (JL); [email protected] (JY)
. These authors contributed equally to this work.
Introduction
The production of 817 million tons of maize in 2009 (http://
faostat.fao.org) makes it one of the most important crops in the
world, and it is projected to be the largest source of calories in the
human diet by 2020 [1]. Maize oil production in 2004 was ,2
million tons, a 54% increase from 1999 (http://faostat.fao.org).
The proper ratio of unsaturated to saturated fatty acids in maize
oil is necessary to maintain lower blood levels of serum cholesterol
and low density lipoproteins, and to avoid some immunological
diseases [2]. A high proportion of unsaturated fatty acids (.80%
in maize kernels) may exert potential curative effects on
inflammation and obesity [3]. As the major saturated fatty acid
in maize grain, palmitic acid plays an important role in achieving
an ideal saturated to unsaturated fatty acids ratio in corn oil.
Increasing the oil content of maize grain is an efficient
alternative to increasing total maize production to boost oil
supplies. High-oil maize lines are the product of long-term human
selection. The first high-oil stocks, IHO (Illinois High-Oil), were
created over 100 years of selection [4,5], and an additional set of
lines, BHO (Beijing High-Oil) reached the same kernel oil content
after only 18 generations of a more-directed selection [6].
Understanding the underlying mechanism that led to IHO and
BHO formation is very important for accelerating future high-oil
maize breeding [7]. Around 50 genes or QTLs (each with small
effects and mainly additive gene action) were observed underlying
the IHO oil concentration [8]. In contrast, five major (and
multiple minor) QTLs, with epistasis, were found to contribute to
maize kernel oil concentration in BHO lines [9]. The presence of
major QTLs was the main reason that the BHO population was
generated so quickly, in contrast with the creation of the IHO, in
which multiple minor (but no major) QTLs were found. The
functional genes that make up these five major QTLs in BHO are
not yet fully characterized. In fact, to date, very few functional
genes underlying the variation in levels and ratios of saturated fatty
acids have been reported in maize.
QTL mapping is still the most powerful tool for identifying the
genomic region that controls complex quantitative traits in animals
or plants. QTL fine mapping and cloning is, however, a logistical
challenge. Only a few QTLs have been cloned, and these
correspond to loci with major effects such as teosinte branched1 (tb1)
[10,11], vegetative to generative transition 1 (vgt1) [12], qHO6-DGAT1
(DGAT1) [13] and teosinte glume architecture1 (tga1) [14]. The
publication of the complete maize genomic sequence has made
PLoS ONE | www.plosone.org 1 September 2011 | Volume 6 | Issue 9 | e24699

association mapping based on linkage disequilibrium (LD) a more
efficient method for functional gene cloning and validation [15–
17]. There are, however, two major disadvantages in association
mapping analysis: false positives caused by population structure
and lower statistical power due to rare alleles present at low
frequencies [18–20]. The combination of linkage and association
analysis to identify and validate sequence variation (gene/QTL
fine mapping) that is associated with beneficial phenotypes allows
the exploitation of the advantages of both analyses while
overcoming the limitations of each.
In a previous study, we identified the major QTL-Pal9, on
maize chromosome 9, which accounts for 42% of the phenotypic
variation of palmitic acid content in maize grain in a bi-parental
segregating population [9]. The objectives of this study were to
fine map QTL-Pal9 to the level of a single gene using linkage and
association analysis; to characterize the candidate gene and
identify the functional variation; to verify the association in
different genetic backgrounds; and to validate the functional
sequence variation using in vivo gene expression profiling and in
vitro complementation studies. A model explaining the underlying
gene function and a PCR-based marker for marker-assisted
selection of fatty acid composition in maize kernels are also
presented here. These findings provide useful insights for
understanding the genetic mechanism of oil biosynthesis, and
targeted, efficient maize molecular breeding.
Results
Primary QTL mapping of Pal9 using BC1S1:2 and BC2S2:3
populationsLine RIL129 was chosen from the recombinant inbred line
(RIL) population derived from B73, a normal-oil inbred line, and
By804, a high-oil inbred line [9]. It has the By804 allele in the
target QTL and displays a high level of palmitic acid. In a BC1S1:2
backcrossing population derived from RIL129 and B73 (recurrent
parent) and segregating for the QTL-Pal9 region, a major QTL
linked to palmitic acid levels was mapped between markers LB52
and umc2213 on chromosome 9 using 129 individuals. The
confidence interval around QTL-Pal9 is 11.5 cM with a maximal
logarithm of odds (LOD) score of 9.10. It explains 15%–28% of
the phenotypic variation for palmitic acid content (C16:0) and
concentration (C16:0/ALL), the ratio of saturated fatty acids
(SFA/ALL), the ratio of unsaturated fatty acids (UFA/ALL) and
the ratio of saturated fatty acids to unsaturated fatty acids (SFA/
UFA) (Table 1). The BC1S1 population was backcrossed and selfed
to create a BC2S2:3 population with 135 individuals. Fifty-six
markers scattered along the target region (Contig373; http://
www.maizesequence.org/) were developed based on the predicted
gene sequences (Table S1). These markers, along with 211
background markers that segregated in the parents of the original
RIL population, were mapped in these 135 individuals. A QTL
affecting the same traits was detected in the BC2S2:3 population,
and the genomic region containing the QTL was narrowed down
to 6 cM between LB52 and LD42, which contains ,1,400 kb.
The maximum LOD score increased to 47, and R2 varied from 43
to 83% for palmitic acid content and related traits (Table S2).
Development of informative recombinant lines and QTLfine mapping via combined linkage and associationmapping
A larger mapping population containing 877 lines was created
in the BC2S1 generation to further fine map the region included in
QTL-Pal9. This population was genotyped using nine markers
residing in the target region between LB52 and umc2213. A
number of By804 fragments overlapping introgression lines
containing recombination events in the target genomic region
were identified (Figure 1A).
Meanwhile, a subset of 74 elite inbred lines (including 40
normal and 34 high-oil inbred lines) was chosen from a Chinese
Association Mapping Panel (CAM155) [21]. This subset contains a
relatively narrow genetic background and a LD decay distance of
,100 kb (r2 $0.1) in the target QTL region (Figure S1). Using
bioinformatics analysis, 14 PCR-based markers (Table S1) were
developed based on the annotated genes within QTL-Pal9. All the
developed markers were used to genotype the association panel
and seek associations. One marker, LD42, which was developed
from maize fingerprint map BAC AC218168 (http://www.
maizesequence.org/), showed significant statistical association
(P = 5.0E214) in the panel for C16:0 (Figure 1B). It was assumed
that the underlying gene of QTL-Pal9 is located in the region near
LD42. According to the results of linkage and association analyses,
two lines (07HL50-6 and 07HL40-3; Figure 1A) were selfed and
backcrossed to B73 to develop BC3S1 populations. Following the
screening of the two BC3S1 populations (149 individuals derived
from 07HL50-6 and 371 individuals from 07HL40-3), three useful
recombinants (08BL245-6, 08BL248-2 and 08BL168-7; Figure 1C)
were identified and selfed to develop BC3S2 populations for
progeny validation.
Fifty-four individuals of the BC3S2:3 population from 08BL245-
6, which contains the downstream fragment introgression from
By804 in the target genomic region, were significantly different
(P = 5.16E216) for C16:0/ALL among the three genotype classes
(homozygous for B73, homozygous for By804 and heterozygous;
Figure 2A; Table S3). The mean value of C16:0 increased from
5.92 to 7.17 mg/g (21%), and C16:0/ALL from 13.7 to 16.3%
(19%). A large difference (P = 5.25E210) for C16:0/ALL was also
observed in the BC3S2:3 population derived from 08BL248-2
containing the upstream introgression fragments of By804
(Figure 2A; Table S3). The mean C16:0 and C16:0/ALL values
in the individuals homozygous for the B73 allele were 5.79 mg/g
and 14.5%, respectively; these values increased to 6.88 mg/g and
16.8% in the individuals homozygous for the By804 allele, an
increase of 19% and 16%, respectively. A significant difference
(P = 6.68E212) of C16:0/ALL was also observed in the BC3S2:3
population derived from 08BL168-7, which contains only the 90-
kb introgression from By804. Increases from 5.92 to 7.12 mg/g in
C16:0 and from 13.9 to 16.9% in C16:0/ALL were observed
between individuals homozygous for the B73 allele and individuals
homozygous for the By804 allele, increases of 20% and 22%,
respectively (Table S3). This locus also significantly co-segregated
Table 1. QTL mapping results from a BC1S1:2 population with129 individuals.
Traita Ab Left Marker Right Marker LOD R2 (%)
C16:0 (mg/g) 0.87 LB52 umc2213 4.05 15
C16:0/ALL (%) 1.28 LB52 umc2213 9.10 28
SFA/ALL (%) 1.16 LB52 umc2213 4.74 16
UFA/ALL (%) 21.18 LB52 umc2213 5.92 20
SFA/UFA (%) 2.03 LB52 umc2213 6.44 21
A major QTL between markers LB52 and umc2213 was found to be linked to allthese traits using Windows QTL Cartographer with 1,000 permutations at asignificance level of 0.05.aTrait abbreviations can be found in the main text.bThe additive effect of the By804 allele.doi:10.1371/journal.pone.0024699.t001
Genetic Analysis of Fatty Acids in Maize Grain
PLoS ONE | www.plosone.org 2 September 2011 | Volume 6 | Issue 9 | e24699

with the phenotypic variation of traits SFA/ALL, UFA/ALL and
SFA/UFA in the above mentioned populations (Table S3).
Progeny testing using BC3S2:4 populations with larger sample
sizes confirmed the significant differences between the homozy-
gous allele classes and the heterozygous genotype (Table S4).
Thus, QTL-Pal9 was narrowed down to a 90-kb genomic region
between LB262 and LB268 within AC218168 (Figure 2A).
As a final mapping step, a BC4S2:3 population with 132
individuals derived from a BC4S1 line with only the 90-kb genomic
region introgression from By804 between markers LB262 and
LB268 (08BL168-7; Figure 2A) was developed for progeny testing
and QTL fine mapping. QTL-Pal9 explained 33% and 69% of the
phenotypic variation for C16:0 and C16:0/ALL, respectively, in
this population. The maximum LOD was 35 and 77% of the
phenotypic variation was explained by the QTL-Pal9 locus in
these BC4S2:4 populations (Table S5 and Figure S2). These results
further indicate that the 90-kb genomic region contains the
underlying gene for QTL-Pal9.
Zmfatb is the gene underlying QTL-Pal9Only one protein-coding gene was found in the target 90-kb
genomic region, as all other sequences were determined to be
repetitive sequences using multiple bioinformatics analysis meth-
ods (as detailed in the Materials and Methods). This gene is highly
similar to FATB (AT1G08510) in Arabidopsis, which encodes the
acyl-ACP thioesterase. Mutagenesis analysis of FATB in Arabidopsis
has shown that the deficiency of FATB results in much lower
palmitic acid content in leaves and leads to a smaller plant [22].
Analysis of the sequence and functional domain indicates that the
candidate gene mined in this study has the same gene structure (6
exons and 5 introns) as FATB and a similar acyl-ACP thioesterase
domain. Thus, we named the candidate gene reported here Zmfatb
(GRMZM5G829544) and deduced that it is the gene underlying
QTL-Pal9 (Figure 2B). The markers developed within the Zmfatb
sequence, LD42 and LD64, have the most highly significant
association with the measured phenotypes (Figures 2A and 2B),
which gives additional evidence that Zmfatb is the right candidate
gene for QTL-Pal9.
An 11-bp insertion/deletion is the functional site ofZmfatb
The Zmfatb gene was sequenced in the entire association panel
of 155 lines (CAM155) assembled by Yang et al. [21] (Figure 3B).
In total, 16 InDels and 135 single-nucleotide polymorphisms
(SNPs) were identified over a 3,796 bp sequenced gene region.
Linkage disequilibrium within Zmfatb decayed relatively quickly
(Figure S3). The average r2 dropped sharply to 0.2 within only
500 bp and decayed to below 0.1 within ,3.5 kb; this is a
convenient LD decay rate for efficient association analysis of this
sequence in this panel. Meanwhile, fatty acids were measured in
three environments, and a broad range of variation was observed
in the CAM155 panel [21], of which palmitic acid content
ranged from 4.4 mg/g to 16.3 mg/g and had high heritability
(96.6%).
Figure 1. Informative recombinants identification combining association and linkage analyses. (A) Useful recombinants identified in theBC2S1 population for nine markers falling within the previously identified QTL-Pal9. 2/2 and 2/+ is the homozygous allele of B73, allele that areheterozygous at the target loci, respectively. (B) Association mapping results based on 14 markers in the target genomic region for the variation ofpalmitic acid content in maize kernels based on association mapping in three subsets. (C) Three useful recombinants identified from two BC3S1
populations. 08BL245-6 and 08BL248-2 are from a BC3S1 population with 149 individuals of 07HL50-6. 08BL168-7 is from a BC3S1 population with 371individuals of 07HL40-3 (lines presented in Figure 1A). 2/2 and 2/+ is the homozygous allele of B73, allele that are heterozygous at the target loci,respectively.doi:10.1371/journal.pone.0024699.g001
Genetic Analysis of Fatty Acids in Maize Grain
PLoS ONE | www.plosone.org 3 September 2011 | Volume 6 | Issue 9 | e24699

The mixed linear model (MLM) controlling for population
structure and kinship [23] was used to test associations between
the detected polymorphisms and variation in five target traits
(C16:0, C16:0/ALL, SFA/ALL, UFA/ALL and SFA/UFA)
measured in three environments. Complete results from the
MLM analysis can be found in Figure 3, Table 2 and Table S6.
Seventeen polymorphic loci were highly associated with variation
of the five target traits in CAM155 at P,1.0E203 level
(Figure 3A). Among the 17 significant associations, two loci
(S_752 and S_768) are located in the 59 untranslated region
Figure 2. Narrowing down of QTL-Pal9 to a 90-kb genomic region. (A) Progeny tests in BC3S2:3 of three lines to compare the threerecombinant classes that delimited QTL-Pal9 to the region between LB262 and LB268. Progeny tests compared palmitic acid concentrations (C16:0/ALL) using ANOVA to find significant differences between the three genotype classes. The black thicker lines represent BAC clones with theiraccession number in NCBI. 2/2, 2/+ and +/+ is the homozygous allele of B73, allele that are heterozygous for B73 and By804 and homozygous alleleof By804, respectively. (B) Bioinformatics analysis of the target region, which contains only one gene, Zmfatb (the black arrow). The grey boxesrepresent repetitive sequences.doi:10.1371/journal.pone.0024699.g002
Figure 3. Association mapping results in CAM155 and graph of pairwise LD between significantly associated polymorphic sites ofZmfatb. (A) Sites that were significantly associated with variation in the palmitic acid composition in Hainan, 2007. (B) The structure and functionaldomain of Zmfatb. Filled black boxes represent exons, open boxes indicate the UTR and the gray dashed boxes mark the region sequenced in thisstudy. And the grey ellipse represents the acyl-ACP thioesterase domain encoded by the third, fourth, fifth and sixth exons. (C) A representation ofthe pair-wise r2 among the significantly associated sites, where darker shading of each box corresponds to a higher r2. The red stars and black dashedlines represent the most significant polymorphic loci.doi:10.1371/journal.pone.0024699.g003
Genetic Analysis of Fatty Acids in Maize Grain
PLoS ONE | www.plosone.org 4 September 2011 | Volume 6 | Issue 9 | e24699

(UTR), one (S_4409) is located in the 39 UTR, and all others are
in introns or exons. None of the polymorphisms in the exons cause
amino acid changes except S_4294, which is an 11-bp InDel in the
sixth exon. S_3543 and S_4294 had the highest and most stable
associations in all phenotypic datasets and are located in the same
LD block (r2 = 0.96; Figure 3C). The polymorphism at S_3543
occurred in an exonic region located in the functional domain but
is a synonymous mutation that does not cause amino acid
sequence changes. In contrast, the polymorphism at S_4294
results in an early stop codon in the protein. The S_752 and S_768
polymorphisms in the 59 UTR are in LD with S_4294 (r2 = 0.8),
and had some significant associations in many phenotypic datasets
(P = 1.0E205). No significance was, however, detected in some
environments for S_752 and S_768. Similarly, S_4409, which is
located in the 39 UTR and is in moderate LD with S_4294, shows
significant association in some environments, but no significance in
others. Based on these data, S_4294 in exon 6 was predicted to be
the functional mutation of Zmfatb that causes the observed
phenotypic changes in palmitic acid-related traits.
The B73 allele of the S_4294 InDel is 11-bp longer than the
By804 allele, leading to an early stop translation in B73. Using the
Swiss-Model homology modeling server and PyMOL, the three-
dimensional protein structure of the ZmFATB protein was
predicted based on an structural template, 2OWN, from Joint
Center for Structural Genomics (not published, x-ray resolution,
2.0 A; Figure 4A). 2OWN consists of two parts of acyl-ACP
thioesterase domain in different chains A and B, which display
‘‘hot dog folds’’ [24]. ZmFATB shared 51% sequence identity with
2OWN (Figure S4). In maize, the catalytic domain of chain A and
B span in residues 12 to 259, and Asn-17, Ser-141, Val-181 and
Arg-259 together form the catalytic sites. The polymorphism at
S_4294 in B73 is an 11-bp insertion (Figure 4B) that can result in
an addition of 5 amino acids and a difference of 14 amino acids in
the C-terminal region as compared with the By804 allele
(Figure 4C and Figure S4). The different amino acids between
the B73 and By804 alleles are located after residue 260 which do
not reside in the acyl-ACP thioesterase domain. This may explain
why the 11-bp InDel did not cause extreme phenotypic variation
but only a quantitative change. The homology modeling analysis
suggested that the protein fragment at the 11-bp InDel plays an
important role as a portal or ‘‘door’’, which controls the quantity
of substrate entering into the reaction vessel ‘‘hot dog fold’’. The
B73 allele (increased by 5 amino acids) makes the portal smaller,
which is thus less accessible to the substrate, leading to the
observed decrease in palmitic acid content and variation in related
traits as well (Figure 4D).
Validation of the 11-bp InDel functional site in a largerassociation panel
An easy-to-use PCR-based marker for Zmfatb was developed
from the sequence containing the 11-bp InDel (Figure 4B and
Table S1) and was used to genotype a larger and more diverse
association mapping panel with 527 lines (AM500) developed by
Yang et al. [25]. Five hundred and two inbred lines were
successfully genotyped for this polymorphism, of which 470 were
homozygous and 32 were heterozygous. Only two alleles (B73 and
By804) were identified with a minor allele frequency (MAF)
$0.05, but one other allele with an even longer deletion and a
frequency of 0.02 was identified. The B73 allele was present in the
association mapping panel at a frequency of 0.17, and the By804
allele at 0.74. In the whole panel, the 11-bp InDel was significantly
associated with the five target traits. The phenotypic variation
explained by this InDel varied from 5% for UFA/ALL to 16% for
C16:0/ALL (Table 2). This provides strong additional evidence
that the 11-bp InDel in the sixth exon of Zmfatb is the causal
polymorphism of QTL-Pal9.
In vivo Zmfatb expression analysisTwenty days after pollination (DAP) is an important stage for
fatty acid biosynthesis. Many functional lipid metabolism genes in
the maize embryo are expressed at higher levels from 15 to 25
DAP; the oil percentage in the embryo increases quickly from 15
to 20 DAP in both high- and normal-oil lines [26]. As Zmfatb plays
an important role in the early stages of fatty acid biosynthesis and
because initial experiments showed some variation in Zmfatb
expression at 20 DAP using a single individual for each near-
isogenic line (NIL) genotype (Figure S5), we chose 20 DAP for
gene expression profiling and further analyses.
An analysis of Zmfatb mRNA expression was carried out in 32
individuals in the heterozygous and both homozygous classes (B73
and By804) in the 90-kb fragment introgression NIL background
(the BC4 generation). There were no differences in expression
levels in maize kernels among the three different genotypes
(Figure 5A). An additional expression test was run for a collection
of over 20 inbred lines that segregate at the 11-bp InDel
(Figure 5B). No difference in expression levels in maize embryos
was found among the three classes of alleles over two years
(P = 0.70, N = 22 in 2008 and P = 0.78, N = 20 in 2009). In
addition, the correlation coefficients between the variation of
Zmfatb expression and palmitic acid content are very low
(R = 20.09 and 20.18 in 2008 and 2009, respectively), making
it unlikely that the variation of kernel palmitic acid content is
regulated by differences in transcript levels. In addition, S_752 and
S_768, found in the 59 UTR and segregating in the inbred lines,
are also uncorrelated with Zmfatb expression variation (P = 0.25,
N = 22 in 2008 and P = 0.63, N = 20 in 2009). Thus, in vivo
expression analysis excludes the possibility that the variation seen
in target phenotypes are caused by expression variation and that
S_752 and S_768 are also functional sites. It does, however, give
Table 2. Associations between palmitic acid-related traitsand the 11-bp InDel of Zmfatb.
PanelMAF(%)a Traitsb P value
Zmfatb2/2 Zmfatb +/+
R2
(%)c
CAM155 39d/82e C16:0 (mg/g) 3.09E206 7.9662.15 9.8762.67 11
C16:0/ALL (%) 4.69E209 13.9362.4 17.0262.43 25
SFA/ALL (%) 2.17E208 15.7862.42 18.8162.26 27
UFA/ALL (%) 2.91E208 84.1262.44 81.1162.26 26
SFA/UFA (%) 5.22E208 18.7563.27 23.1963.03 23
AM500 87d/370e C16:0 (mg/g) 1.05E205 6.0661.82 7.1661.85 6
C16:0/ALL (%) 2.77E209 15.0262.00 16.961.74 16
SFA/ALL (%) 4.57E208 17.1261.98 18.9861.79 15
UFA/ALL (%) 8.87E207 81.1062.13 79.2061.90 5
SFA/UFA (%) 2.45E205 21.106 0.03 23.9663.21 14
aMAF, minor allele frequency.bTrait abbreviations can be found in the main text.cR2 was calculated via ANOVA using the 2007 Hainan phenotypic data from theChinese Association Mapping Panel, which contains 155 maize inbred lines(CAM155) [21] and 2009 phenotypic data from the Association Mapping Panel,which contains 527 maize inbred lines (AM500) [25].
dThe number of inbred lines with the 11-bp insertion at the functional site.eThe number of inbred lines with the 11-bp deletion at the functional site. 2/2and +/+ is the homozygous allele of B73 and homozygous allele of By804based on the 11-bp InDel, respectively.
doi:10.1371/journal.pone.0024699.t002
Genetic Analysis of Fatty Acids in Maize Grain
PLoS ONE | www.plosone.org 5 September 2011 | Volume 6 | Issue 9 | e24699

further indirect evidence that the 11-bp InDel causing the amino
acid variation is the functional site.
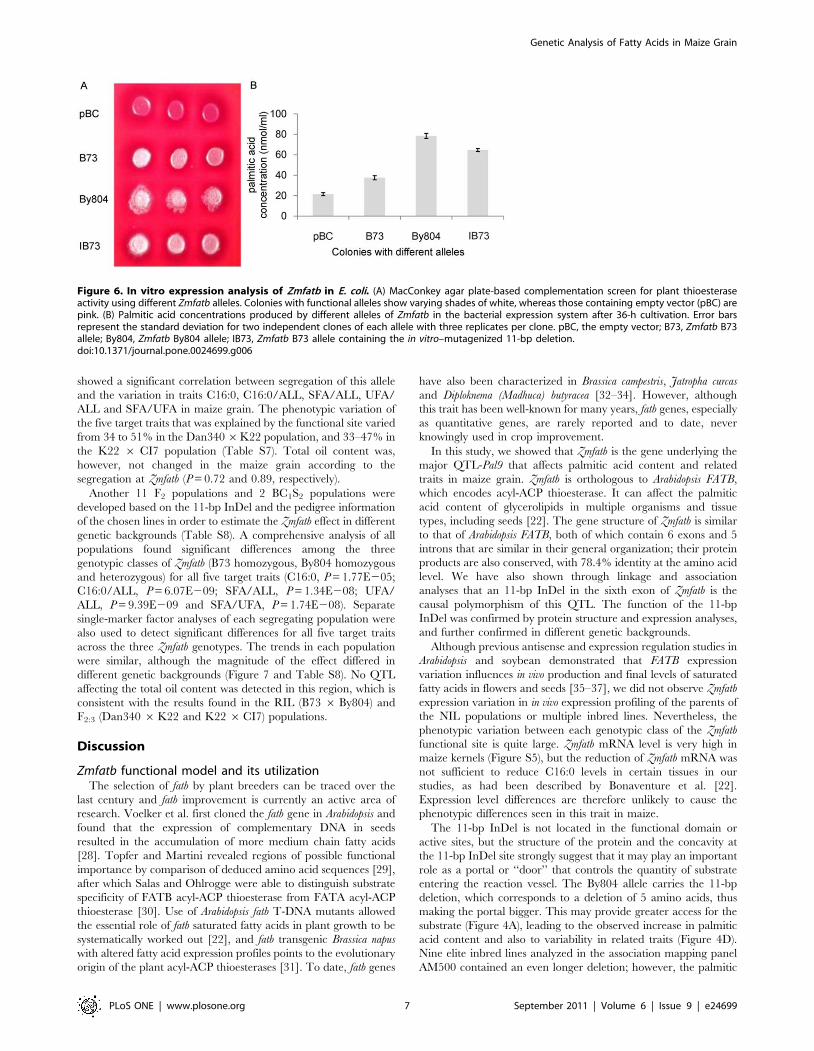
In vitro expression analysis of Zmfatb in E. coliTo further verify that the 11-bp InDel at S_4294 is the
functional site, a range of Zmfatb alleles was transformed into a
bacterial expression system that allows determination of enzyme
activity by measuring the free fatty acid released into the medium
[27]. Except for the empty vector, pBC, all Zmfatb alleles (B73
allele with 11-bp insertion, By804 allele with 11-bp deletion and
IB73, which carries the B73 allele but with 11-bp deletion created
by site-directed mutation) express active plant acyl-ACP Thioes-
terase (Figure 6A). Two colonies of each allele were randomly
selected and tested for thioesterase activity. Preliminary experi-
ments showed that fatty acid accumulation in the medium was
significantly different between the B73 and IB73 alleles after 18 h
and these differences were clearest at 36 h (Figure S6).
Consequently, we picked the 36-h time point to analyze the
function of the 11-bp InDel. As expected, the colonies containing
the By804 allele produced the most palmitic acid; colonies
containing the B73 allele produced the least palmitic acid; and
IB73 had significantly higher palmitic acid than did the colonies
with the unaltered B73 allele (Figure 6B). The IB73 allele
improved thioesterase activity by ,72% as compared with that
of the B73 allele, and this again confirms that the 11-bp InDel is
the functional polymorphism of Zmfatb and can affect the activity
of plant acyl-ACP thioesterase.
Validation of the Zmfatb effect in different geneticbackgrounds
Two F2:3 populations (Dan340 6K22 with 202 individuals and
K226CI7 with 227 individuals) that segregate at the 11-bp InDel
Figure 4. The 11-bp InDel is the functional polymorphism of Zmfatb. (A) Three-dimensional protein structure of ZmFATB, in which green lineindicates the acyl-thioesterase N-terminal domain (Acyl-thio_N), blue line indicates the acyl-ACP thioesterase C-terminal domain (Acyl-thio_C), andthe 11-bp functional site is shown in pink circles. (B) Gel image of the co-dominant marker based on the 11-bp functional site. (C) Amino acid changesin B73 and By804 caused by the 11-bp InDel. (D) Variation in palmitic acid content between the BC4S3 lines carrying the 11-bp deletion and their near-isogenic parent (B73) carrying the other haplotype of the InDel.doi:10.1371/journal.pone.0024699.g004
Figure 5. Relationship between Zmfatb expression level andpalmitic acid content. (A) Expression analysis in BC4S2:3 NIL with the11-bp insertion (allelic to B73, 2/2; N = 11), the 11-bp deletion (allelicto By804, +/+; N = 10) and heterozygous allele, (B73 6NIL, 2/+; N = 11).RQ is the abbreviation of relative quantity. (B) Correlation analysisbetween Zmfatb expression level and palmitic acid content in diverseelite inbred lines in embryos collected at 20 days after pollination in2008 (left) and 2009 (right). The grey boxes and black diamondsrepresent individuals that contain and lack the 11-bp fragment,respectively. P values were derived from t-tests; R values representthe correlation coefficient. RQ is the abbreviation of relative quantity.doi:10.1371/journal.pone.0024699.g005
Genetic Analysis of Fatty Acids in Maize Grain
PLoS ONE | www.plosone.org 6 September 2011 | Volume 6 | Issue 9 | e24699
showed a significant correlation between segregation of this allele
and the variation in traits C16:0, C16:0/ALL, SFA/ALL, UFA/
ALL and SFA/UFA in maize grain. The phenotypic variation of
the five target traits that was explained by the functional site varied
from 34 to 51% in the Dan3406K22 population, and 33–47% in
the K22 6 CI7 population (Table S7). Total oil content was,
however, not changed in the maize grain according to the
segregation at Zmfatb (P = 0.72 and 0.89, respectively).
Another 11 F2 populations and 2 BC1S2 populations were
developed based on the 11-bp InDel and the pedigree information
of the chosen lines in order to estimate the Zmfatb effect in different
genetic backgrounds (Table S8). A comprehensive analysis of all
populations found significant differences among the three
genotypic classes of Zmfatb (B73 homozygous, By804 homozygous
and heterozygous) for all five target traits (C16:0, P = 1.77E205;
C16:0/ALL, P = 6.07E209; SFA/ALL, P = 1.34E208; UFA/
ALL, P = 9.39E209 and SFA/UFA, P = 1.74E208). Separate
single-marker factor analyses of each segregating population were
also used to detect significant differences for all five target traits
across the three Zmfatb genotypes. The trends in each population
were similar, although the magnitude of the effect differed in
different genetic backgrounds (Figure 7 and Table S8). No QTL
affecting the total oil content was detected in this region, which is
consistent with the results found in the RIL (B73 6 By804) and
F2:3 (Dan340 6K22 and K22 6CI7) populations.
Discussion
Zmfatb functional model and its utilizationThe selection of fatb by plant breeders can be traced over the
last century and fatb improvement is currently an active area of
research. Voelker et al. first cloned the fatb gene in Arabidopsis and
found that the expression of complementary DNA in seeds
resulted in the accumulation of more medium chain fatty acids
[28]. Topfer and Martini revealed regions of possible functional
importance by comparison of deduced amino acid sequences [29],
after which Salas and Ohlrogge were able to distinguish substrate
specificity of FATB acyl-ACP thioesterase from FATA acyl-ACP
thioesterase [30]. Use of Arabidopsis fatb T-DNA mutants allowed
the essential role of fatb saturated fatty acids in plant growth to be
systematically worked out [22], and fatb transgenic Brassica napus
with altered fatty acid expression profiles points to the evolutionary
origin of the plant acyl-ACP thioesterases [31]. To date, fatb genes
have also been characterized in Brassica campestris, Jatropha curcas
and Diploknema (Madhuca) butyracea [32–34]. However, although
this trait has been well-known for many years, fatb genes, especially
as quantitative genes, are rarely reported and to date, never
knowingly used in crop improvement.
In this study, we showed that Zmfatb is the gene underlying the
major QTL-Pal9 that affects palmitic acid content and related
traits in maize grain. Zmfatb is orthologous to Arabidopsis FATB,
which encodes acyl-ACP thioesterase. It can affect the palmitic
acid content of glycerolipids in multiple organisms and tissue
types, including seeds [22]. The gene structure of Zmfatb is similar
to that of Arabidopsis FATB, both of which contain 6 exons and 5
introns that are similar in their general organization; their protein
products are also conserved, with 78.4% identity at the amino acid
level. We have also shown through linkage and association
analyses that an 11-bp InDel in the sixth exon of Zmfatb is the
causal polymorphism of this QTL. The function of the 11-bp
InDel was confirmed by protein structure and expression analyses,
and further confirmed in different genetic backgrounds.
Although previous antisense and expression regulation studies in
Arabidopsis and soybean demonstrated that FATB expression
variation influences in vivo production and final levels of saturated
fatty acids in flowers and seeds [35–37], we did not observe Zmfatb
expression variation in in vivo expression profiling of the parents of
the NIL populations or multiple inbred lines. Nevertheless, the
phenotypic variation between each genotypic class of the Zmfatb
functional site is quite large. Zmfatb mRNA level is very high in
maize kernels (Figure S5), but the reduction of Zmfatb mRNA was
not sufficient to reduce C16:0 levels in certain tissues in our
studies, as had been described by Bonaventure et al. [22].
Expression level differences are therefore unlikely to cause the
phenotypic differences seen in this trait in maize.
The 11-bp InDel is not located in the functional domain or
active sites, but the structure of the protein and the concavity at
the 11-bp InDel site strongly suggest that it may play an important
role as a portal or ‘‘door’’ that controls the quantity of substrate
entering the reaction vessel. The By804 allele carries the 11-bp
deletion, which corresponds to a deletion of 5 amino acids, thus
making the portal bigger. This may provide greater access for the
substrate (Figure 4A), leading to the observed increase in palmitic
acid content and also to variability in related traits (Figure 4D).
Nine elite inbred lines analyzed in the association mapping panel
AM500 contained an even longer deletion; however, the palmitic
Figure 6. In vitro expression analysis of Zmfatb in E. coli. (A) MacConkey agar plate-based complementation screen for plant thioesteraseactivity using different Zmfatb alleles. Colonies with functional alleles show varying shades of white, whereas those containing empty vector (pBC) arepink. (B) Palmitic acid concentrations produced by different alleles of Zmfatb in the bacterial expression system after 36-h cultivation. Error barsrepresent the standard deviation for two independent clones of each allele with three replicates per clone. pBC, the empty vector; B73, Zmfatb B73allele; By804, Zmfatb By804 allele; IB73, Zmfatb B73 allele containing the in vitro–mutagenized 11-bp deletion.doi:10.1371/journal.pone.0024699.g006
Genetic Analysis of Fatty Acids in Maize Grain
PLoS ONE | www.plosone.org 7 September 2011 | Volume 6 | Issue 9 | e24699

acid content associated with this allele was not significantly
different (P = 0.76) compared to lines with the By804 allele. Since
the longer deletion allele is rare in this panel (MAF = 0.02), we
could not estimate the genetic effect accurately, and whether or
not the longer deletion further improves the accessibility for the
substrate must be the target of a new study.
The deletion of 11 base pairs (and 5 amino acids) is concomitant
with a change in 14 amino acids downstream of the deletion in the
By804 allele. The in vitro E. coli complementation test further
confirmed that these changes result in an increase in palmitic acid
levels. The enzyme encoded by the By804 allele has a stronger
enzymatic activity compared with the enzyme encoded by B73
allele (containing the 11-bp insertion, Figure S6).
As a functional gene underlying quantitative trait variation, the
11-bp InDel in the last exon of Zmfatb does not result in extreme
phenotypic variation, possibly because the mutation did not occur
in the functional domain and only affects the substrate access to
the encoding enzyme (as explained above). On the other hand,
there may also be other fatb iso-enzymes at work as well. In maize,
there are two copies of fatb [38]; the second is located on
chromosome 6 and also underlies a major palmitic acid content
QTL[9]. The locus on chromosome 6 may alleviate the functional
defect of QTL-Pal9; however, the gene effects of Zmfatb in the NIL
population and the E. coli complementary test (some, but not all of
which, contain a working copy of the chromosome 6 fatb) are
almost identical. This suggests that the majority of the quantitative
phenotypic variation is not caused by the complementary effect of
other iso-enzymes.
Increasing the unsaturated fatty acid concentration (by
decreasing the palmitic acid content) without changing the total
oil content in maize grain would increase the nutritional value of
the oil. Fatty acid content is currently quantified using gas
chromatography, which is very expensive and inaccessible to many
small laboratories and breeders from developing countries. PCR-
based, user friendly markers developed from well-validated genes
that underlie QTLs could be cheaply and quickly used for marker-
assisted selection, even in small breeding programs [39,40]. Here,
we identified the gene and functional mutation underlying a major
QTL in maize for saturated fatty acid composition that does not
affect the total oil content, which will be very useful for the
improvement of high-oil maize lines with a high ratio of
unsaturated to saturated fatty acids. The effect of the 11-bp InDel
is stable across different genetic backgrounds (Table S8) and the
insertion can reduce palmitic acid levels (C16:0) by an average of
1 mg/g, and palmitic acid concentration (C16:0/ALL) by 20%.
The 11-bp InDel at Zmfatb has no measured effects on other
Figure 7. Genetic effects of the 11-bp InDel for the five palmitic acid–related traits in 13 different genetic backgrounds. The y axisrepresents the variation in levels of C16:0, C16:0/ALL, SFA/ALL, UFA/ALL and SFA/UFA. The different segregating populations are shown along the xaxis (1–11, F2 populations; 12 and 13, BC1S2 populations): 1, 7784-4Ht 6 832; 2, 7784-4Ht 6 Sy1035; 3, Mo17 6 Ji63; 4, By4839 6Mo17; 5, 832 6Shen5003; 6, Shen50036U8112; 7, By8136By804; 8, By48396By815; 9, 4F16By4839; 10, By8156By804; 11, By8046By815; 12, (7784-4Ht6832)67784-4Ht and 13, (By804 6 By815) 6By804. Blue, red and Green lines represent the homozygous allele of B73, the heterozygous allele, and thehomozygous allele of By804 based on the 11-bp InDel, respectively.doi:10.1371/journal.pone.0024699.g007
Genetic Analysis of Fatty Acids in Maize Grain
PLoS ONE | www.plosone.org 8 September 2011 | Volume 6 | Issue 9 | e24699

agronomic traits including total kernel oil content, kernel width
and kernel length (data not shown). Thus, the user-friendly PCR-
based marker developed from Zmfatb (Figure 4B) can be efficiently
used to improve oil quality in maize breeding programs.
Combining linkage and association mapping can speedQTL fine mapping and cloning
Although it is not difficult to map a QTL to a 5- to 10-cM
interval, cloning the underlying gene from an interval this large is
still a very big challenge [41]. Here we present a comprehensive
protocol combining linkage and association mapping that takes
advantage of current and historical recombination events for QTL
cloning in those species with an available reference genome. We
recommend four steps when using this strategy, as follows:
(1) Map the target QTL to a small region (,5–10 cM) using
primary segregating populations (such as BC1, BC2, F2, F2:3, etc).
(2) Choose a small association mapping panel with a narrow
genetic background and develop markers based on annotation
information for genes in the target QTL region for association
analysis. The use of 74 Chinese elite inbred lines with an LD
decay of about 100 kb in the present study allowed the
candidate gene region to be narrowed down to ,100 kb. This
required the use of only one or two markers per 100-kb
region, and only those markers that segregate in the original
QTL mapping population should be used, thus increasing the
efficiency of finding the target gene. With the development of
next generation sequencing techniques [42] and the associated
cost decrease over traditional sequencing, two alternatives
should be considered for this step: a number of appropriate
fragments in the target genomic region can be sequenced in
the small panel (rather than developing markers from these
loci), which provides more markers per sequenced gene for
the association analysis; or the entire target region can be
sequenced by sequence capture technologies [43], which
allows the use of all polymorphisms in the region for the
association analysis.
(3) Significant associations can be used to score the primary
segregating populations to identify useful recombinants for
validation (for example, the three overlapping recombinants
in this study). Advanced backcrossed populations (BC4, BC5
or higher) are generally needed to homogenize the genetic
background for QTL fine mapping and cloning; however,
these populations may miss some of the informative
recombinants from the early generations. In this study, one
recombinant in the target genomic region was identified using
only 135 individuals from the BC2S2 population, whereas
4,732 individuals from the BC4S2 population were needed to
find one recombinant between the same two markers. The
underlying mechanism for the variation of recombinant
classes among different generations is still not very clear but
may be controlled by genetic factors [44,45].
(4) Once the target QTL is mapped to a small region (in this case,
90 kb), the candidate gene may be identified via bioinformatic
analysis. The function of the candidate gene(s) can then be
validated using association mapping with a bigger and more
diverse panel, which will also aid in the determination of the
functional polymorphism(s). The decay of LD in diverse elite
inbred lines in maize can be as small as 1–5 kb [46], a
resolution that will quickly and efficiently bring us to the level
of an individual gene. Other validation methods (expression,
transformation, etc.) may be used as appropriate with the
most promising gene(s).
Materials and Methods
Construction of the NIL populationThe advanced backcross NIL population was developed as shown
in Figure S7. A RIL population was constructed from a cross
between B73 (low kernel oil content) and By804 (high kernel oil
content) by single-seed descent [9]. RIL129 from this population,
which derived 44.5% of its genetic background from B73, was the
high-palmitic acid donor parent, whereas B73 was the recurrent
parent. Starting from the BC1 population, 211 simple sequence
repeat markers were used to analyze the genetic background in the
backcross populations. Meanwhile, association analysis [23] using
simple sequence repeat markers in the target genomic region in a
natural population of 74 selected Chinese elite inbred lines was
employed to select informative recombinations. The selected lines
with the lowest amount of similarity to By804 in their background
and carrying useful recombination events in the target genomic
region were selfed for progeny validation and backcrossed to B73 to
create the NIL population. Map positions used throughout this
paper were based on the genetic maps created from the B73 6By804 RIL population [9] or the BC1S1:2 populations. The details
of NIL construction, genotyping and traits measurements for each
generation can be found in the Method S1.
Candidate gene miningThe gene prediction software Genscan (http://genes.mit.edu/
GENSCAN.html) and Fgenesh (http://mendel.cs.rhul.ac.uk/mendel.
php?topic = fgen-file) and the maize EST and plant protein
databases (http://www.ncbi.nlm.nih.gov/) were used for candi-
date gene mining. For validation of the gene prediction, the
program CENSOR (http://www.girinst.org/censor/index.php)
was applied iteratively by a 10-kb increment for repetitive sequence
annotation. Gene functions were predicted through Interproscan
[47], KEGG [48] and Blast2GO using GO annotation [49].
Association mapping of ZmfatbThe whole Zmfatb gene was sequenced across a panel of 155
Chinese elite inbred lines [21] (CAM155; Figure S8). All primer
sequences used in this study are presented in Table S1. The
alignment of all sequences for polymorphism identification was
done using the multiple sequence alignment program MUSCLE
[50], and was refined manually using BioEdit [51]; refined
sequences were exported to Phylip [52] for further analysis.
Nucleotide polymorphisms including SNPs and InDels were
identified in TASSEL 2.0.1 [53] for all polymorphisms present
at a frequency of $0.05. TASSEL 2.0.1 was also used to calculate
r2 among Zmfatb polymorphisms with 1,000 permutations, and F-
tests were applied to measure the significance of LD between each
pair of polymorphic loci. A co-dominant PCR marker based on
the 11-bp InDel in Zmfatb was applied to genotype the larger panel
of AM500 representing global maize diversity [25] for validation.
The CAM155 [21] were grown and evaluated at the Agronomy
Farm in Beijing in the springs of 2006 and 2007 and in Hainan in
the winter of 2007. The AM500 [25] was planted in Yunnan (YN,
E 102u419, N 25u019) during the spring of 2009. Kernels from at
least three mature ears with the same genotype were pooled and
measured for fatty acid content according to Yang et al. [9]. The
mixed linear model [23] controlling both population structure (the
Q matrix) and relative kinship (the K matrix) was used to test for
statistical association between phenotype and genotype in the two
association panels using TASSEL 2.0.1 [53]. The genetic effects
explaining the phenotypic variation were calculated through the
analysis of variance between groups (ANOVA) in Excel 2007 for
each locus and haplotype.
Genetic Analysis of Fatty Acids in Maize Grain
PLoS ONE | www.plosone.org 9 September 2011 | Volume 6 | Issue 9 | e24699

qRT-PCR analysis of Zmfatb in B73, By804, NILs and theassociation panel
Plant tissues were collected from embryos at 20 DAP from more
than 20 Chinese elite inbred lines that were planted in the springs
of 2008 and 2009 in Beijing. In addition, we collected embryos at
20 DAP from 32 NILs (heterozygous or homozygous for B73 or
By804 at the target locus) at the BC4S2 stage in the spring of 2009
(Beijing). Harvested tissues were frozen in liquid nitrogen and
stored at 270uC until use. Total RNA was isolated using TRIzol
reagent (Invitrogen) and digested with RNase-free DNase
(Promega) as manufacturers’ instructions. RNA was subjected to
complementary DNA (cDNA) synthesis using AMV reverse
transcriptase and an oligo (dT) primer (Promega). qRT-PCR for
Zmfatb expression profiling was conducted with Ex Taq premix
(Takara Shuzo). The 2–DDCT method [54] with three replicates
was used to calculate average expression levels and standard
deviations of Zmfatb. A maize housekeeping gene (actin) was used
as an internal control. All primer sequences are listed in Table S1.
Complementation test of Zmfatb in E. coli mutant strainK27
The coding sequences of the B73 (11-bp insertion) and By804
(11-bp deletion) Zmfatb alleles were amplified with primers FatBF
and FatBR, and the IB73 allele, which contains the B73 allele but
with the 11-bp insertion site-directed mutated to 11-bp deletion,
was amplified with primers FatBF and I73R, from maize
embryonic cDNA. Primer sequences are listed in Table S1. These
amplified sequences were cloned into the pBC SK2 phagemid
(Stratagene) using the SacI and XbaI restriction sites. This resulted
in a translational fusion between the N-terminal coding region of
lacZ and coding region of Zmfatb.
PCR reactions contained 1 ml 10 mM of each primer, 4 ml
2.5 mM dNTPs, 1.25 U PrimeSTAR HS DNA polymerase
(Takara Shuzo) and 25 ml 26PrimeSTAR GC buffer (Mg2+ plus).
Thirty cycles of 98uC for 10 s, 58uC for 25 s, and 72uC for 2 min
were performed. The acquired ,1.5-kb band and pBC plasmid
were cut with SacI and XbaI restriction enzymes (Fermentas Life
Science) and the bands were gel purified (PureLinkTM Quick Gel
Extraction Kit, TIANGEN) and ligated into the pBC plasmid
(Stratagene). The ligation mixtures were used to transform
electrocompetent K27 cells (CGSC #5478; The Coli Genetic
Stock Center at Yale). The transformation mixtures were spread
on LB plates containing 30 mg/ml chloramphenicol and placed at
30uC overnight. Six colonies for each vector were sequenced to
ensure that the coding sequence ligated to pBC was correct and in
the same frame with the lacZ coding sequence.
To validate the difference in the thioesterase activity of different
Zmfatb alleles, the fatty acid content in the BTNA medium (10 g/L
NZ-amine and 5 g/L NaCl, pH 7.0) was measured for every
Zmfatb allele along with accumulation over time. To ensure that
the OD values of every bacterial suspension were equal at each
time point, the OD values of the initial bacterial suspension were
consistent, and the inoculum was added in accordance with the
volume ratio of 1:100. All time points were measured three times
for two independent samples of each variant to calculate the
standard deviation and repeatability of the expression (Figure S6).
Two samples of each variant with the same OD value and equal
inoculum volume were cultivated in conical flasks containing
600 ml of BTNA medium with 30 mg/ml chloramphenicol at
30uC for 36 h, and then the fatty acid content in the BTNA
medium was measured for every Zmfatb allele variant. Fatty acid
content of the growing medium around various cell cultures was
determined by the production and measurement of fatty acid
methyl esters [27]. Briefly, 22 ml of glacial acetic acid and 1 ml of
1:1 (vol/vol) chloroform/methanol supplemented with 0.01 mg of
C19:0 (Sigma) as an internal standard were added to 0.5 ml of
medium from pelleted cells corrected to give an equivalent cell
density based on the OD600. After mixing by inversion, the phases
were separated by centrifugation, and the lower phase was
transferred to a fresh glass tube. The chloroform was evaporated
with a stream of nitrogen, and the pellet was resuspended in 1 ml
of 2% H2SO4 in methanol, after which the samples were heated to
90uC for 1 h. Samples were extracted once with 1 ml of 0.9%
NaCl and 2 ml of hexane. The organic phase was transferred to a
fresh tube and dried under nitrogen and then was resuspended in
400 ml of hexane. Samples (3 ml each) were analyzed on a gas
chromatography for fatty acid methyl ester contact.
Evaluation of the genetic effect of Zmfatb in differentgenetic backgrounds
The 155 elite Chinese inbred lines cluster into four major
genetic groups: Beijing high-oil (BHO), Lancaster, Reid and Reid
high-oil (RHO) lines [21]. From each group, two lines with the
B73 allele (11-bp insertion) and two lines with the By804 allele (11-
bp deletion) were chosen and crossed reciprocally. Thus, a total of
sixteen elite inbred lines from both high-oil and normal-oil lines
were crossed to develop segregating populations to estimate the
effect of Zmfatb in different genetic backgrounds. Because some
crosses didn’t produce enough seeds, only 11 crosses from 12
unique lines were obtained (Table S9). S1 seeds from the 11
segregating populations were planted in the winter of 2008 in
Hainan and selfed to create S2 ears. S1 plants from 2 segregating
populations were backcrossed to one of their respective parents
and the BC1S1 were planted in the spring of 2009 and selfed to
create the BC1S2 segregating populations. Mature ears from these
11 S2 and 2 BC1S2 populations were harvested, and single kernels
were genotyped using LD42, the PCR marker developed from the
11-bp InDel (Table S1). The classified kernels from each
background were grouped according to the genotypes (B73 allele,
heterozygous allele or By804 allele). Each group was randomly
divided into three to six samples (depending on the number of
successfully genotyped seeds) for fatty acid extraction, and each
sample was measured in triplicate. A paired t-test comparing the
B73 allele and the By804 allele in 13 segregating populations and
an ANOVA for each population were used in Excel 2007 to
determine the Zmfatb gene effect in different genetic backgrounds.
Meanwhile, two F2:3 populations (derived from Dan340 6K22
and K22 6CI7) with 202 and 227 individuals, respectively, were
genotyped according to the 11-bp InDel and measured for their
grain lipid concentration. Single-marker factor analysis was done
in the two populations for the validation of the genetic effect of
Zmfatb on the variation of C16:0, C16:0/ALL, SFA/ALL, UFA/
ALL and SFA/UFA.
Prediction of three-dimensional structure for ZmFATBWe submitted the B73 ZmFATB protein sequence to the Swiss-
Model homology modeling server (http://swissmodel.expasy.org/
SWISS-MODEL.html) to obtain the most homologous three-
dimensional model using the automatic modeling mode [55].
PyMOL (http://www.pymol.org/) was used to view the three-
dimensional structure of ZmFATB.
Supporting Information
Figure S1 Linkage Disequilibrium decay in the genomicregion of QTL-Pal9, with a window size = 5 kb. A total of
442 SNPs spaced along the target region (Contig 373, www.
Genetic Analysis of Fatty Acids in Maize Grain
PLoS ONE | www.plosone.org 10 September 2011 | Volume 6 | Issue 9 | e24699

maizesequence.org) was employed to calculate r2 in three
association mapping populations, including ‘‘Total lines’’, 74
randomly selected elite inbred lines; ‘‘High-oil lines’’, a subset of
34 high-oil lines; and ‘‘Normal-oil lines’’, a subset of 40 normal
elite lines. The calculations were performed in Tassel 2.0.1 with
1,000 permutations.
(TIF)
Figure S2 QTL mapping results in BC4S2:3 (A) andBC4S2:4 (B) populations containing only the 90-kbintrogression between LB262 and LB268. Trait abbrevia-
tions can be found in Table S2. Images in both populations were
generated by Windows QTL Cartographer.
(TIF)
Figure S3 LD decays in Zmfatb. One hundred and fifty one
polymorphic sites (SNPs and InDels) distributed along the
sequence of Zmfatb were used to calculate r2 in 155 lines of the
Chinese Association Mapping Panel using TASSEL 2.0.1 with
1,000 permutations.
(TIF)
Figure S4 Sequence alignment among 2OWN, ZmFATBin B73 and By804 and AtFATB in Arabidopsis. 2OWN
consisting of two chains A and B was obtained as the structural
template by screening the Protein data bank. The alignment was
first obtained from the MUSCLE program and then refined using
ESPript. Secondary structure elements are presented on top:
helices with squiggles, beta strands with arrows and turns with TT
letters. Conserved residues are written in red in sequences block.
Accessibility of 2OWN is rendered by a bar below: blue is
accessible, cyan is intermediate, white is buried. The catalytic
residues interacting with the substrate oxygen are labeled with
black pentacles.
(TIF)
Figure S5 Schematic diagram of Zmfatb gene expres-sion profiling in NILs with the 90-kb introgression fromBy804. Leaf, ear, 20P and 20R represent the leaf nearest to the
ear, the un-pollinated ear, embryos 20 DAP and endosperms 20
DAP, respectively. All tissues were extracted from a single plant.
2/2, +/2 and +/+ is the homozygous allele of B73, allele that
are heterozygous for B73 and By804 and homozygous allele of
By804 based on the 11-bp InDel, respectively. RQ is the
abbreviation of relative quantity.
(TIF)
Figure S6 Time-courses accumulation of fatty acid foreach allele of Zmfatb in E.coli system. pBC represents the
empty vector. B73, By804 are Zmfatb alleles of B73, By804,
respectively, and IB73 represents Zmfatb allele of B73 containing
the directly mutated 11-bp deletion.
(TIF)
Figure S7 The schematic diagram of NIL populationdevelopment for QTL-Pal9 fine-mapping and cloning. In
this population, RIL129, a recombinant inbred line consisting of
44.5% genetic background from B73 and 55.5% from high-oil
parental line By804, is the donor parent and B73 is the recurrent
parent. Marker screening was applied from the BC1 generation
and the useful recombination events in the target region were
selected by association mapping and validated by progeny tests.
(TIF)
Figure S8 Sequenced region of Zmfatb. Filled black boxes
represent exons, open boxes indicate the untranslated regions
(UTR), and grey dashed dot box marks the region sequenced in
this study. Colored arrows are the forward and reverse primers for
sequencing. Primers (FatB7F/FatB7R, LD63F/LD49R, LD49F/
LD51R and FatB2F/FatB2R) were overlapped for the sequencing.
(TIF)
Method S1.
(PDF)
Table S1 Primers used in this study.(PDF)
Table S2 QTL mapping results in a BC2S2:3 population.(PDF)
Table S3 Phenotypic segregation of BC3S2:3 populationsderived from three introgression lines containing over-lapping recombination events of QTL-Pal9.(PDF)
Table S4 Phenotypic segregation of BC3S2:4 populationsderived from three introgression lines containing over-lapping recombination events of QTL-Pal9.(PDF)
Table S5 Phenotypic segregation in BC4S2:3 and BC4S2:4
populations containing the 90-kb target genomic intro-gression.(PDF)
Table S6 Associations between palmitic acid relatedtraits and polymorphism sites of Zmfatb at threeenvironments in CAM155.(PDF)
Table S7 QTL Mapping results in F2:3 populationsderived from Dan340 6K22 and K22 6CI7.(PDF)
Table S8 Effect estimation of Zmfatb in differentgenetic backgrounds.(PDF)
Table S9 Information for elite inbred lines selected forthe gene effect validation of Zmfatb.(PDF)
Acknowledgments
The authors would like to thank Drs. D. Skinner and Z. Zhang for their
thoughtful pre-submission reviews.
Author Contributions
Conceived and designed the experiments: JL JY LL. Performed the
experiments: LL HL QL XY DZ YC. Analyzed the data: LL HL.
Contributed reagents/materials/analysis tools: PZ YG. Wrote the paper:
LL JY MW. Checked the manuscript for important intellectual content:
HL JL QL XY.
References
1. Rosegrant MW, Paisner MS, Meijer S, Witcover J (2001) Global food
projections to 2020: Emerging trends and alternative futures. Washington, D.
C: International Food Policy Research Institute.
2. Burlingame B, Nishida C, Uauy R, Weisell R (2009) Fats and fatty acids in
human nutrition: introduction. Ann Nutr Metab 55: 1–3.
3. Oh DY, Talukdar S, Bae EJ, Imamura T, Morinaga H, et al. (2010) GPR120 is
an omega-3 fatty acid receptor mediating potent anti-inflammatory and insulin-
sensitizing effects. Cell 142(5): 687–698.
4. Dudley JW, Lambert RJ (2004) 100 generations of selection for oil and protein in
corn. Plant Breed Rev 24: 79–110.
Genetic Analysis of Fatty Acids in Maize Grain
PLoS ONE | www.plosone.org 11 September 2011 | Volume 6 | Issue 9 | e24699
5. Hill WG (2005) A century of corn selection. Science 307: 683–684.
6. Song TM, Chen SJ (2004) Long term selection for oil concentration in five maize
populations. Maydica 49: 9–14.
7. Moose SP, Dudley JW, Rocheford TR (2004) Maize selection passes the century
mark, a unique resource for 21st century genomics. Trends Plant Sci 9: 358–364.
8. Laurie CC, Chasalow SD, LeDeaux JR, McCarroll R, Bush D, et al. (2004) The
genetic architecture of response to long-term artificial selection for oilconcentration in the maize kernel. Genetics 168(4): 2141–2155.
9. Yang XH, Guo YQ, Yan JB, Zhang J, Song TM, et al. (2010) Major and minor
QTL and epistasis contribute to fatty acid composition and oil content in high-
oil maize. Theor Appl Genet 120: 665–678.
10. Doebley J, Stec A, Gustus C (1995) Teosinte branched1 and the origin of maize,evidence for epistasis and the evolution of dominance. Genetics 141: 333–346.
11. Doebley J, Stec A, Hubbard L (1997) The evolution of apical dominance inmaize. Nature 386: 485–488.
12. Salvi S, Sponza G, Morgante M, Tomes D, Niu XM, et al. (2007) Conserved
noncoding genomic sequences associated with a flowering-time quantitative trait
locus in maize. Proc Natl Acad Sci U S A 104: 11376–11381.
13. Zheng PZ, Allen WB, Roesler K, Williams ME, Zhang S, et al. (2008) Aphenylalanine in DGAT is a key determinant of oil content and composition in
maize. Nat Genet 40: 367–372.
14. Wang H, Nussbaum-Wagler T, Li BL, Zhao Q, Vigouroux Y, et al. (2005) The
origin of the naked grains of maize. Nature 436(7051): 714–719.
15. Thornsberry JM, Goodman MM, Doebley J, Kresovich S, Nielsen D, et al.(2001) Dwarf8 polymorphisms associate with variation in flowering time. Nat
Genet 28: 286–289.
16. Remington DL, Thornsberry JM, Matsuoka Y, Wilson LM, Whitt SR, et al.
(2001) Structure of linkage disequilibrium and phenotypic associations in themaize genome. Proc Natl Acad Sci U S A 98(20): 11479–11484.
17. Schnable PS, Ware D, Fulton RS, Stein JC, Wei FS, et al. (2009) The B73 maizegenome: complexity, diversity, and dynamics. Science 326(5956): 1112–1115.
18. Buckler ES, Gaut BS, Mcmullen MD (2006) Molecular and functional diversity
of maize. Curr Opin Plant Biol 9: 172–176.
19. Yu JM, Zhang ZW, Zhu CS, Tabanao DA, Pressoir G, et al. (2008) Simulation
appraisal of the adequacy of number of background markers for relationshipestimation in association mapping. Plant genome 2(1): 63–77.
20. Yan JB, Warburton M, Crouch J (2011) Association mapping for enhancingmaize genetic improvement. Crop Sci 51: 433–449.
21. Yang XH, Yan JB, Shah T, Warburton ML, Li Q, Li L, et al. (2010) Genetic
analysis and characterization of a new maize association mapping panel for
quantitative trait loci dissection. Theor Appl Genet 121(3): 417–431.
22. Bonaventure G, Salas JJ, Pollard MR, Ohlrogge JB (2003) Disruption of theFATB gene in Arabidopsis demonstrates an essential role of saturated fatty acids in
plant growth. Plant Cell 15(4): 1020–1033.
23. Yu JM, Pressoir G, Briggs WH, Bi IV, Yamasaki M, et al. (2006) A unified
mixed-model method for association mapping that accounts for multiple levels ofrelatedness. Nat Genet 38(2): 203–208.
24. Mayer KM, Shanklin J (2005) A structural model of the plant acyl-acyl carrierprotein thioesterase FatB comprises two helix/4-stranded sheet domains, the N-
terminal domain containing residues that affect specificity and the C-terminaldomain containing catalytic residues. J Biol Chem 280: 3621–3627.
25. Yang XH, Gao SB, Xu ST, Zhang ZX, Prasanna BM, et al. (2010)
Characterization of a global germplasm collection and its potential utilization
for analysis of complex quantitative traits in maize. Mol Breeding. DOI:10.1007/s11032-010-9500-7.
26. Liu ZJ, Yang XH, Fu ZY, Zhang Y, Yan JB, et al. (2009) Proteomic analysis of
early germs with high-oil and normal inbred lines in maize. Mol Biol Rep 36(4):
813–821.
27. Mayer KM, Shanklin J (2007) Identification of amino acid residues involved insubstrate specificity of plant acyl-ACP thioesterases using a bioinformatics-
guided approach. BMC Plant Biol 7: 1.
28. Voelker TA, Worrell AM, Anderson L, Bleibaum J, Fan C, et al. (1992) Fatty
acid biosynthesis redirected to medium chains in transgenic oilseed plants.Science 257: 72–74.
29. Topfer R, Martini N (1994) Molecular cloning of cDNAs or genes encodingproteins involved in de novo fatty acid biosynthesis in plants. J Plant Physiol 143:
416–425.
30. Salas JJ, Ohlrogge JB (2002) Characterization of substrate specificity of plant
FatA and FatB acyl-ACP thioesterases. Arch Biochem Biophys 403: 25–34.
31. Jones A, Davies HM, Voelker TA (1995) Palmitoyl-acyl carrier protein (ACP)
thioesterase and the evolutionary origin of plant acyl-ACP thioesterases. PlantCell 7: 359–371.
32. Pathaka MK, Bhattacharjee A, Ghosh D, Ghosh S (2004) Acyl–acyl carrier
protein (ACP)-thioesterase from developing seeds of Brassica campestris cv. B-54
(Agrani). Plant Sci 166: 191–198.
33. Jha JK, Maiti MK, Bhattacharjee A, Basu A, Sen PC, et al. (2006) Cloning andfunctional expression of an acyl-ACP thioesterase FatB type from Diploknema
(Madhuca) butyracea seeds in Escherichia coli. Plant Physiol Biochem 44: 645–655.
34. Srikanta Dani KG, Hatti KS, Ravikumar P, Kush A (2011) Structural andfunctional analyses of a saturated acyl ACP thioesterase, type B from immature
seed tissue of Jatropha curcas. Plant Biol 13: 453–461.35. Dormann P, Voelker TA, Ohlrogge JB (2000) Accumulation of palmitate in
Arabidopsis mediated by the acyl-acyl carrier protein thioesterase FATB1. PlantPhysiol 123(2): 637–644.
36. Wilson RF, Marquardt TC, Novitzky WP, Burton JW, Wilcox JR, et al. (2001)
Metabolic mechanisms associated with alleles governing the 16:0 concentrationof soybean oil. J Am Oil Chem Soc 78: 335–340.
37. Buhr T, Sato S, Ebrahim F, Xing A, Zhou Y, et al. (2002) Ribozymetermination of RNA transcripts down-regulate seed fatty acid genes in transgenic
soybean. Plant J 30: 155–163.
38. Li L, Li H, Li JY, Xu ST, Yang XH, et al. (2010) A genome-wide survey ofmaize lipid-related genes: candidate genes mining, digital gene expression
profiling and co-location with QTL for maize kernel oil. Sci China Life Sci 53(6):690–700.
39. Harjes CE, Rocheford TR, Bai L, Brutnell TP, Kandianis CB, et al. (2008)Natural genetic variation in lycopene epsilon cyclase tapped for maize
biofortification. Science 319(5861): 330–333.
40. Yan JB, Kandianis CB, Harjes CE, Bai L, Kim EH, et al. (2010) Rare geneticvariation at Zea mays crtRB1 increases b-carotene in maize grain. Nat Genet
42(4): 322–327.41. Salvi S, Tuberosa R (2005) To clone or not to clone plant QTLs: present and
future challenges. Trends Plant Sci 10(6): 297–304.
42. Schuster SC (2008) Next-generation sequencing transforms today’s biology. NatMethods 5: 16–18.
43. Fu Y, Springer NM, Gerhardt DJ, Ying K, Yeh CT, et al. (2010) Repeatsubtraction-mediated sequence capture from a complex genome. Plant J 62(5):
898–909.44. Esch E, Szymaniak JM, Yates H, Pawlowski WP, Buckler ES (2007) Using
crossover breakpoints in recombinant inbred lines to identify quantitative trait
loci controlling the global recombination frequency. Genetics 177(3):1851–1858.
45. Dooner HK, He LM (2008) Maize genome structure variation: interplaybetween retrotransposon polymorphisms and genic recombination. Plant Cell
20: 249–258.
46. Yan JB, Shah T, Warburton ML, Buckler ES, McMullen MD, et al. (2009)Genetic characterization and linkage disequilibrium estimation of a global maize
collection using SNP markers. PLoS ONE 4(12): e8451.47. Zdobnov EM, Apweiler R (2001) InterProScan - an integration platform for the
signature-recognition methods in InterPro. Bioinformatics 17(9): 847–848.48. Kanehisa M, Goto S, Hattori M, Aoki-Kinoshita KF, Itoh M, et al. (2006) From
genomics to chemical genomics: new developments in KEGG. Nucleic Acids
Res 34: 354–357.49. Gotz S, Garcıa-Gomez JM, Terol J, Williams TD, Nagaraj SH, et al. (2008)
High-throughput functional annotation and data mining with the Blast2GOsuite. Nucleic Acids Res. 36(10): 3420–3435.
50. Edgar RC (2004) MUSCLE: multiple sequence alignment with high accuracy
and high throughput. Nucl Acid Res 32(5): 1792–1797.51. Hall TA (1999) BioEdit: a user-friendly biological sequence alignment editor and
analysis program for Windows 95/98/NT. Nucl Acids Symp Ser 41: 95–98.52. Felsenstein J (1989) PHYLIP - phylogeny inference package (version 3.2).
Cladistics 5: 164–166.
53. Bradbury PJ, Zhang ZW, Kroon DE, Casstevens TM, Ramdoss Y, et al. (2007)TASSEL: software for association mapping of complex traits in diverse samples.
Bioinformatics 23(19): 2633–2635.54. Livak KJ, Schmittgen TD (2001) Analysis of relative gene expression data using
real-time quantitative PCR and the 22DDCT method. Methods 25: 402–408.55. Arnold K, Bordoli L, Kopp J, Schwede T (2006) The SWISS-MODEL
workspace: A web-based environment for protein structure homology modeling.
Bioinformatics 22: 195–201.
Genetic Analysis of Fatty Acids in Maize Grain
PLoS ONE | www.plosone.org 12 September 2011 | Volume 6 | Issue 9 | e24699