Embed Size (px)
Citation preview

Amyloid Histology Stain for Rapid Bacterial Endospore Imaging 1
2
Bing Xia,a Srigokul Upadhyayula,
b,c Vicente Nuñez,
b Pavel Landsman,
a 3
Samuel Lam,c Harbani Malik,
b Sharad Gupta,
b Mohammad Sarshar,
b Jingqiu Hu,
a 4
Bahman Anvari,b Guilford Jones,
a and Valentine I. Vullev
b,c,d,* 5
6
a Department of Chemistry and Photonics Center, Boston University, Boston, MA 02215. 7
b Department of Bioengineering and Center for Bioengineering Research, University of 8
California, Riverside, CA 92521. 9
c Department of Biochemistry, University of California, Riverside, CA 92521. 10
d Department of Chemistry, University of California, Riverside, CA 92521. 11
12
13
14
* Address all correspondence to: Valentine I. Vullev, Department of Bioengineering, 15
University of California, Riverside, 900 University Avenue, Riverside, CA 92521; 16
ph: +1-951-827-6239; FAX +1-951-827-6416; e-mail: [email protected] ; 17
URL: http://www.vullevgroup.ucr.edu/ 18
19
Running title: Amyloid Stain for Endospore Imaging20
Copyright © 2011, American Society for Microbiology and/or the Listed Authors/Institutions. All Rights Reserved.J. Clin. Microbiol. doi:10.1128/JCM.02285-10 JCM Accepts, published online ahead of print on 8 June 2011
on February 28, 2018 by guest
http://jcm.asm
.org/D
ownloaded from
2
Abstract 21
Bacterial endospores are some of the most resilient forms of life known to us, with their 22
persistent survival capability resulting from a complex and effective structural organization. The 23
outer membrane of the endospores is surrounded by the densely packed endospore coat and 24
exosporium, containing amyloid or amyloid-like proteins. In fact, it is the impenetrable 25
composition of the endospore coat and the exosporium that makes staining methodologies for 26
endospore detection complex and challenging. Therefore, a plausible strategy for facile and 27
expedient staining would be to target components of the protective surface layers of the 28
endospores. That is, instead of targeting endogenous markers encapsulated in the spores, here we 29
demonstrated staining of these dormant life entities that target the amyloid domains: i.e., the very 30
surface components that make the coats of these species impenetrable. Using an amyloid staining 31
dye, thioflavin T (ThT), we examined this strategy. Short incubation of bacilli endospore 32
suspensions with ThT, under ambient conditions, resulted in: (i) an enhancement of the 33
fluorescence of ThT; and (ii) accumulation of ThT in the endospores, affording fluorescence 34
images with excellent contrast ratios. Fluorescence images revealed that ThT tends to 35
accumulate in the surface regions of the endospores. The observed fluorescence enhancement 36
and dye accumulation, coupled with the sensitivity of emission techniques, provide an effective 37
and rapid means of staining endospores without the inconvenience of pre- or post-treatment of 38
samples. 39
40
Key words: β-sheet, spores, distribution coefficient, thioflavin, ThT, viscosity, quantum yield, 41
signal to noise, blood serum, humic acid, DNA 42
on February 28, 2018 by guest
http://jcm.asm
.org/D
ownloaded from
3
Introduction 43
44
This article describes the use of a benzothiazole dye, thioflavin T (ThT) (Scheme 1), for 45
expedient and facile fluorescence staining of bacilli endospores. Using fluorescence microscopy 46
and spectroscopy, we examined the capabilities of ThT to stain the endospores of four bacterial 47
species. Our findings showed that the observed efficient staining resulted from: (i) an increase in 48
the emission quantum yield of ThT upon its uptake by endospores; and (ii) a high propensity of 49
ThT to accumulate in the endospores. 50
Bacterial endospores are some of the most resilient living entities known (8, 14, 57). 51
Although the majority of the sporulating species are not virulent, spore-forming bacteria produce 52
the most potent toxins known to humans, such as botulinum toxin (2, 55). This potential threat of 53
highly virulent biohazards, along with their resistance to treatment, places a demand for rapid 54
and simple bioanalytical methods for detection of bacterial endospores. Such robust bioanalytical 55
methods are not only essential for biodefense, but also relevant to clinical and microbiological 56
applications (1, 29, 66, 71). 57
The classical technique of endospore detection uses malachite green dye to stain the 58
endospore coat via thermal treatment or long incubation periods (72). Genetic bioassays have 59
since evolved utilizing polymerase chain reaction (PCR) to provide the specificity required for 60
identification of certain sporulating pathogens (5, 19, 52, 69). Employing these techniques for 61
detection of bacterial endospores, however, is a multistep process and requires prior sequence 62
knowledge for the design of the primer (30, 44, 88). 63
Other signal-amplification techniques, such as enzyme-linked immunosorbent assay 64
(ELISA), provide sensitivity for detection of endospore pathogens with potentially high 65
specificity, without tedious sample pretreatment (78, 81). Endospore immunoassays, however, 66
on February 28, 2018 by guest
http://jcm.asm
.org/D
ownloaded from
4
require: (i) identification of a protein or another biomarker at the surface of the endospore 67
particles; and (ii) development of immunoglobulins (i.e., antibodies) for that surface biomarker 68
(30, 65, 88). In order to reliably identify endospores, the immunoassays often require several fold 69
higher concentration than the infectious dose or several distinct antibodies to detect one of 70
several strains of the same sporulating pathogenic species (18, 48, 65, 96). 71
A variety of optical and mass-spectrometry techniques have been explored for detection of 72
bacterial endospores without requiring signal-amplification biochemical reactions. For example, 73
surface-enhanced Raman spectroscopy (SERS) brings the detection to relatively low spore count, 74
and even to a single-spore level (64, 100). Mass spectrometry provides means for identification 75
of macromolecular markers based on their exact masses (6, 79). The specialized equipment 76
needed, along with the complexity of the data analysis, has proven prohibitive for the wide 77
deployment of such bioanalytical methodologies into the clinical field. 78
For the last decade, dipicolinic acid (DPA) has gained considerable popularity as a marker 79
for detection of bacterial endospores (16, 22, 25, 59, 67, 84, 93, 98). Emission-enhancement 80
assays for DPA and bacterial endospores, utilizing lanthanide ions, were developed in Army 81
Research Laboratory in the end of the 20th
century (59, 68) and recently improved by a research 82
team in the Jet Propulsion Laboratory (9, 10). Up to about 20% of the weight of bacterial 83
endospores can be attributed to calcium dipicolinate: i.e., DPA is a natural product observed 84
solely in sporulated bacterial species (76, 77). Furthermore, DPA has high affinity for chelating 85
lanthanide metal ions, such as terbium (III) (36, 37). Excitation of the DPA ligands at about 270 86
nm to 280 nm, at which the lanthanides do not have allowed spectral transitions, permits 87
selective photoexcitation of the DPA-chelated ions. This selective photoexcitation of DPA, 88
on February 28, 2018 by guest
http://jcm.asm
.org/D
ownloaded from
5
followed by a fast energy transfer from the DPA ligands to the chelated ions, results in 89
luminescence predominantly from the lanthanides that are in a complex with DPA. 90
These lanthanide emission assays are general for all bacterial endospores and do not 91
provide discernibility between virulent and benign sporulated species. The simplicity, cost 92
efficiency and relative sensitivity, however, make these emission-enhancement techniques a 93
preferred choice for the first line of defense: i.e., for monitoring the environmental endospore 94
content. Abnormal fluctuations, i.e., an increase in the spore count in the environment would call 95
for deployment of more costly bioanalytical technologies with higher specificity. Due to the 96
expedience and relative simplicity, lanthanide emission-enhancement approaches are also 97
deployed for assaying alternative biomarkers with clinical importance (16). 98
The use of DPA as an endogenous biomarker requires sample pretreatment to lyse the 99
endospores for extracting their content without chemically deteriorating it. The resilience of 100
bacterial endospores, however, makes the DPA extraction step, which requires heat treatment, 101
surfactant additives, or microwaving, a source of potential irreproducibility in the quantification 102
of the results. Furthermore, the lysing of the endospores, as a pre-treatment for extraction of the 103
DPA, makes this bioanalytical approach unfeasible for imaging applications. 104
Alternative biomarkers, which are in abundance on the surface of the endospore 105
particulates, will provide venues for facile detection without requirement for lysing pretreatment 106
of the samples. High-resolution scanning-probe images, for example, revealed significant 107
abundance of β-sheet amyloid-like proteins on the surface of bacterial endospores (60-63). 108
Amyloid folds are, indeed, intricate components of bacterial cell walls and of endospore coatings 109
(17, 20, 23, 42, 60-63). 110
on February 28, 2018 by guest
http://jcm.asm
.org/D
ownloaded from
6
Amyloid fibrils are aggregated filamentous protein structures found in more than 20 111
diseases, including the amyloidosis and several neurodegenerative disorders, such as 112
Alzheimer’s disease and Parkinson’s disease (13, 23, 31, 51, 97). The structural properties of 113
amyloid fibrils and the kinetics of their formation have been objects of intensive investigation. 114
Among techniques developed in the field, amyloid fluorescence stains served as the dominant 115
method. Among the amyloid stains, thioflavin T (ThT) is the most widely used (7). Furthermore, 116
ThT does not interact with folded or partially folded monomeric proteins, soluble oligomers, or 117
amorphous aggregates (49). Changes in ThT fluorescence are imperceptible even if interactions 118
with such impurities in the sample occur (43, 45, 49, 53, 56, 58, 90). 119
Due to the relatively high inherent sensitivity of emission techniques, fluorescence staining 120
and imaging are the foundation for widely preferred bioanalytical methodologies (47, 50). 121
Herein, we explored the possibility for fluorescence staining of bacterial endospores with ThT 122
(Scheme 1). For this study we focused on Bacillus subtilis (B. subtilis) and Bacillus globigii (B. 123
globigii), which are phylogenetically related organisms and are frequently explored as models 124
for virulent bacilli. In addition, we also used Bacillus atrophaeus (B. atrophaeus) and 125
Geobacillus stearothermophilus (G. stearothermophilus), which form relatively large 126
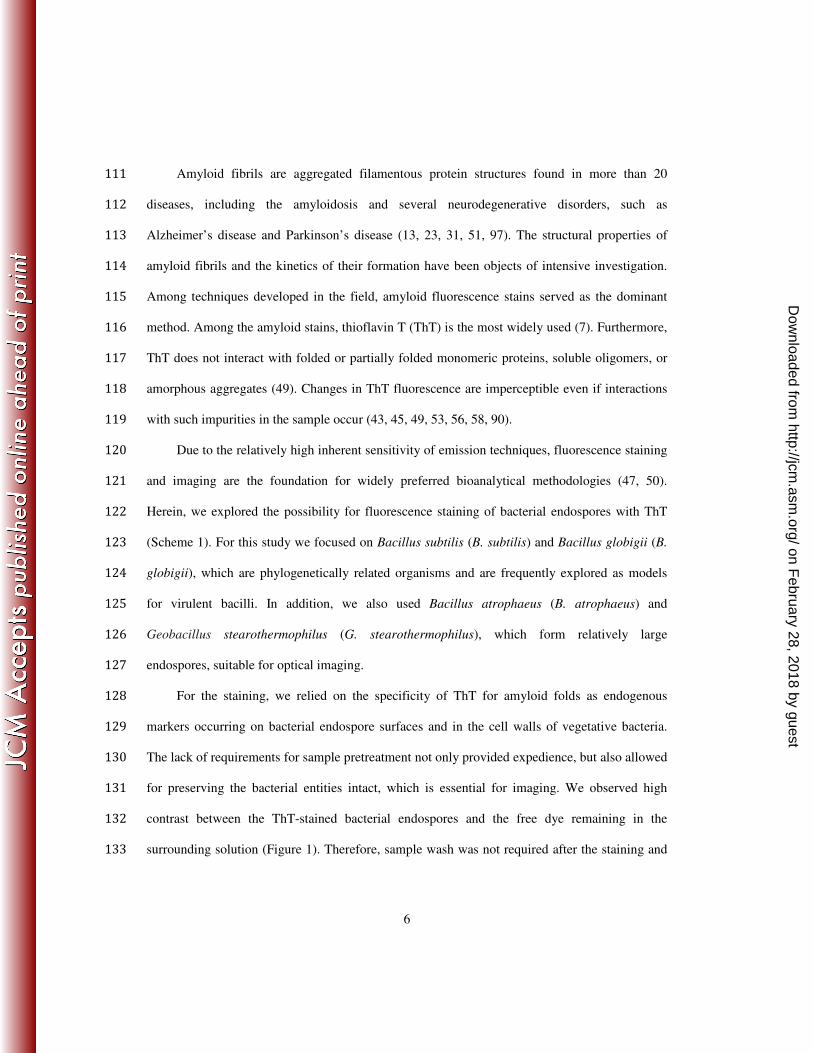
endospores, suitable for optical imaging. 127
For the staining, we relied on the specificity of ThT for amyloid folds as endogenous 128
markers occurring on bacterial endospore surfaces and in the cell walls of vegetative bacteria. 129
The lack of requirements for sample pretreatment not only provided expedience, but also allowed 130
for preserving the bacterial entities intact, which is essential for imaging. We observed high 131
contrast between the ThT-stained bacterial endospores and the free dye remaining in the 132
surrounding solution (Figure 1). Therefore, sample wash was not required after the staining and 133
on February 28, 2018 by guest
http://jcm.asm
.org/D
ownloaded from
7
prior to imaging, which was another important factor contributing to the expedience of this 134
approach. Our analysis revealed that the reasons for the observed high contrast of the 135
fluorescence images of the bacterial species are: (i) an increase in emission quantum yield of 136
ThT upon binding to bacterial endospores; and (ii) high-affinity of ThT for components of the 137
examined bacterial species, leading to accumulation of the dye in the imaged bacteria: i.e., the 138
concentration of ThT in the stained endospores was more than three orders of magnitude larger 139
than the concentration of ThT in the surrounding staining solution. 140
141
Materials and Methods 142
143
Materials. The reagents and solvents (spectroscopic grade) were purchased from VWR, 144
Fisher Scientific and Sigma-Aldrich. Bacterial endospore cultures: (i) B. subtilis, B. globigii and 145
Bacillus thuringiensis (B. thuringiensis) were obtained from U.S. Army Research Laboratory 146
facility, as desiccated powders. (ii) B. atrophaeus and G. stearothermophilus were purchased 147
from SPS Medical (Rush, NY) in the form of 20% ethanol aqueous suspension. Vegetative 148
bacteria cultures: Escherichia coli (E. coli), TOP 10 cells, were obtained from Invitrogen 149
(Carlsbad, CA); and wild type B. subtilis were obtained from ATCC (Manassas, VA). (Details on 150
sample preparation and handling are available in the supplemental material.) 151
152
Optical imaging. Bright field and fluorescence images were acquired using a Nikon Ti-153
U inverted microscope (Nikon Inc., Melville, NY), equipped with a 100× Nikon oil immersion 154
objective (N.A. = 1.49, WD = 120 µm) and a Hamamatsu EM-CCD digital camera (model 155
C9100-13, Hamamatsu Corp., Bridgewater, NJ). Image analysis of the gray-scale distribution 156
on February 28, 2018 by guest
http://jcm.asm
.org/D
ownloaded from
8
was performed using Igor Pro software v.6.02A (Wavemetrics) installed on Windows and Mac 157
OS workstations as we have previously demonstrated (11, 27, 54, 85, 86). (For details, see 158
supplemental material.) 159
160
Spectroscopy. Absorption spectra were recorded using JASCO V-670 UV/Vis/NIR 161
spectrophotometer and DU-640B Beckman spectrophotometer. Steady-state emission spectra 162
were recorded using Fluorolog-3-22 spectrofluorometer (Horiba Jobin Yvon) using slit widths 163
between 2 and 5 nm and Felix/Timemaster spectrofluorometer (Photon Technology 164
International, Inc.), using slit width 10 nm (32-35, 38, 40, 92). The thioflavin T concentrations 165
for all samples were estimated from its apparent molar absorption coefficient at peak wavelength 166
412 nm (36,000 ± 500 M–1
cm–1
) (21). (Further experimental details are available in the 167
supplemental material.) 168
169
Results 170
171
Staining of bacterial endospores with ThT. Treatment of bacterial samples with ThT 172
allows for visualization of the endospores via fluorescence microscopy, employing excitation 173
wavelength shorter than about 450 nm (Figure 1). For the staining, which tends to complete in 174
less than five minutes as we previously reported (87), we incubated the bacterial samples in dye 175
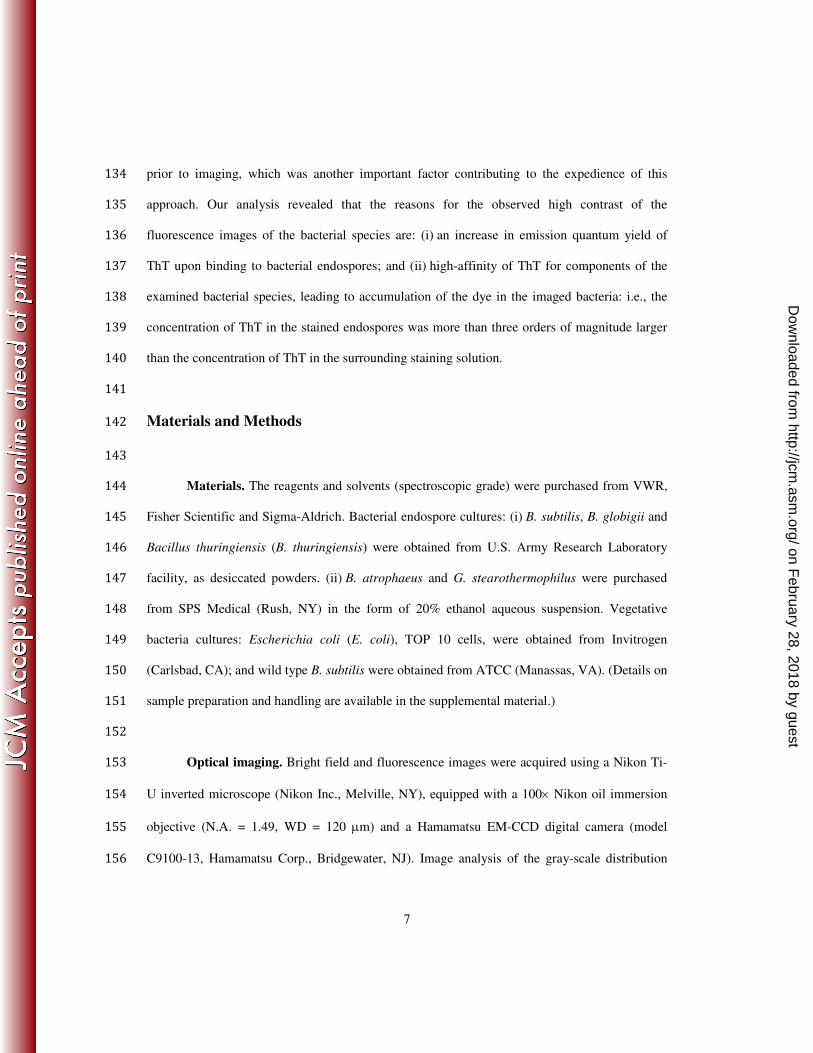
solutions with micromolar concentrations. The background fluorescence from the ThT (free in 176
solution) was significantly less intense in comparison with the fluorescence from the stained 177
endospores (Figure 2). Therefore, no washing of the staining dye, which was left over in the 178
sample solution, was required in order to attain good quality images. 179
on February 28, 2018 by guest
http://jcm.asm
.org/D
ownloaded from

9
In fluorescence microscope images, the noise has direct current, DC, and alternative 180
current, AC, components. The AC and DC contributions to S/N were estimated separately using 181
the noise amplitudes and the average heights, ⟨h⟩, of the peaks on the traces crossing over imaged 182
spores (Figure 2): 183
184
S /NDC[dB] = 20 lgh
ADC
(1a) 185
(1b) 186
187
where the multiple of 10 in front of the logarithms converts the units to dB; and ⟨∆h⟩ = ⟨h⟩ – ADC. 188
Signal-to-noise analysis revealed key trends in the quality of the images recorded under 189
different settings and staining conditions. As expected, S/N increased with the prolongation of 190
the exposure time, i.e., S / N ∝ exposure time . A five-fold increase in the exposure time 191
doubled S/NDC and caused about a 30% increase in S/NAC of images of spores suspended in 100 192
µM ThT (see supplemental material). 193
Imaging of relatively large bacterial endospores (i.e., endospores larger than about 1 µm) 194
revealed their contours and provided information about their shapes and dimensions (Figure 1). 195
For organisms that form endospores with sub-micrometer dimensions, however, the size of the 196
imaged endospores approached the diffraction-limit of optical microscopy and their shapes and 197
dimensions could not be always extracted with sufficient precision (Figure 3). 198
Examination of the fluorescence images of the stained bacterial endospores, which were 199
large enough for visualizing their shapes via optical microscopy, revealed (Figure 1): 200
(i) consistently bright pixels following the contours of the endospores; and (ii) bright spots 201
on February 28, 2018 by guest
http://jcm.asm
.org/D
ownloaded from
10
distributed throughout the endospore images. The latter observation suggested a heterogeneous 202
distribution of the endogenous biomarkers (e.g., β-sheet proteins) that are targeted by the 203
amyloid-stain. The former finding suggested that the coating layers of the endospores had a 204
pronounced propensity for accumulating the staining dye. Our observation for surface 205
accumulation of ThT was consistent with the abundance of β-sheet proteins found on the 206
endospore surfaces (23, 60-63). 207
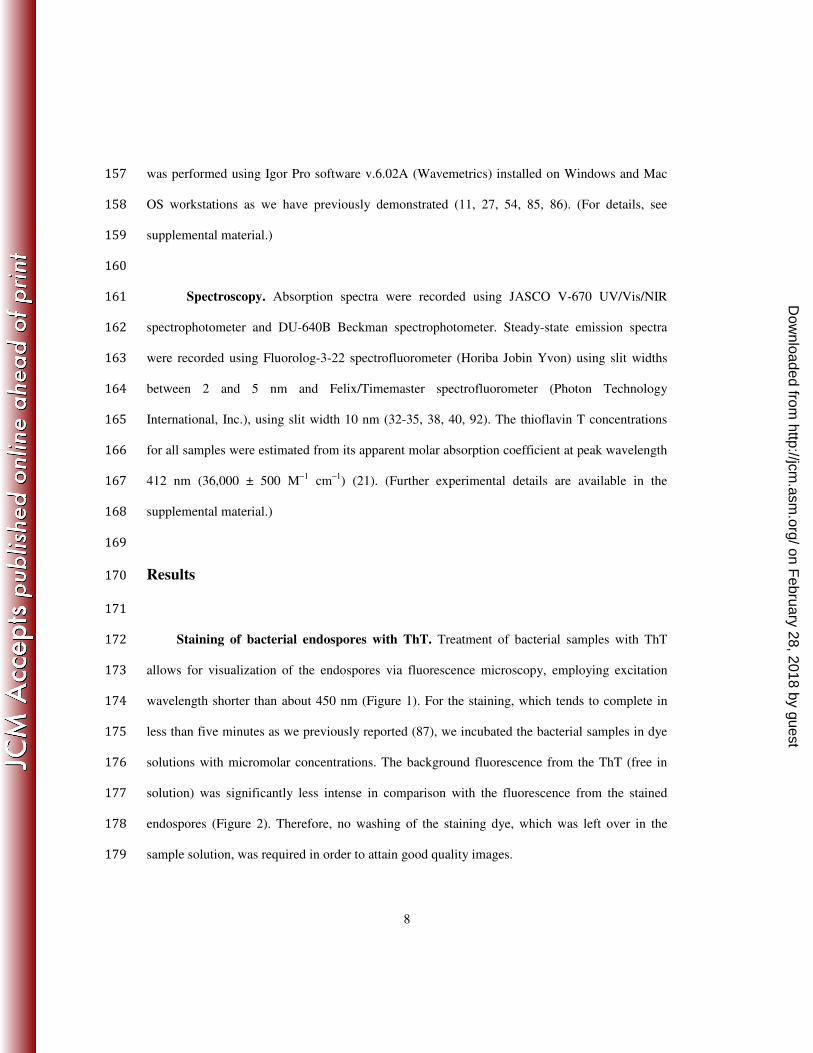
Amyloid type proteins, however, are native not only to the endospore surfaces but also to 208
the cell walls of vegetative bacteria (including the Gram-positive spore-forming species) (17, 20, 209
23, 42). While ThT provided an excellent basis for staining bacterial endospores with 210
considerable ease (at ambient temperature and with no sample pre-treatment or post-treatment), 211
it also stained vegetative bacteria: Gram positive (Figure 3c) and Gram negative (Figure 3e and 212
f). The morphologies of vegetative bacterial cells and their endospores, however, are quite 213
different and they can be readily discerned from each other by comparing their shapes and sizes 214
even when they are in the same sample (Figure 3d, sporulating bacteria). 215
216
Spore-induced emission enhancement of ThT. The brightness of a fluorescence image 217
depends on the number of dye molecules at the focal plane (or in the vicinity of the focal plane), 218
and on the emission quantum yield of the dye. The number of molecules within the focal volume 219
of illumination (i.e., the local concentration of the dye) determines how much of the excitation 220
light is absorbed. Concurrently, the emission quantum yield determines how much of the 221
absorbed light is emitted by the dye (at wavelengths longer than the excitation wavelength, λex). 222
Therefore, potential reasons for the observed fluorescence staining of the bacterial endospores 223
on February 28, 2018 by guest
http://jcm.asm
.org/D
ownloaded from

11
with ThT include: (i) an increase in the emission quantum yield of ThT upon binding to the 224
endospores; and (ii) accumulation of ThT in the endospores. 225
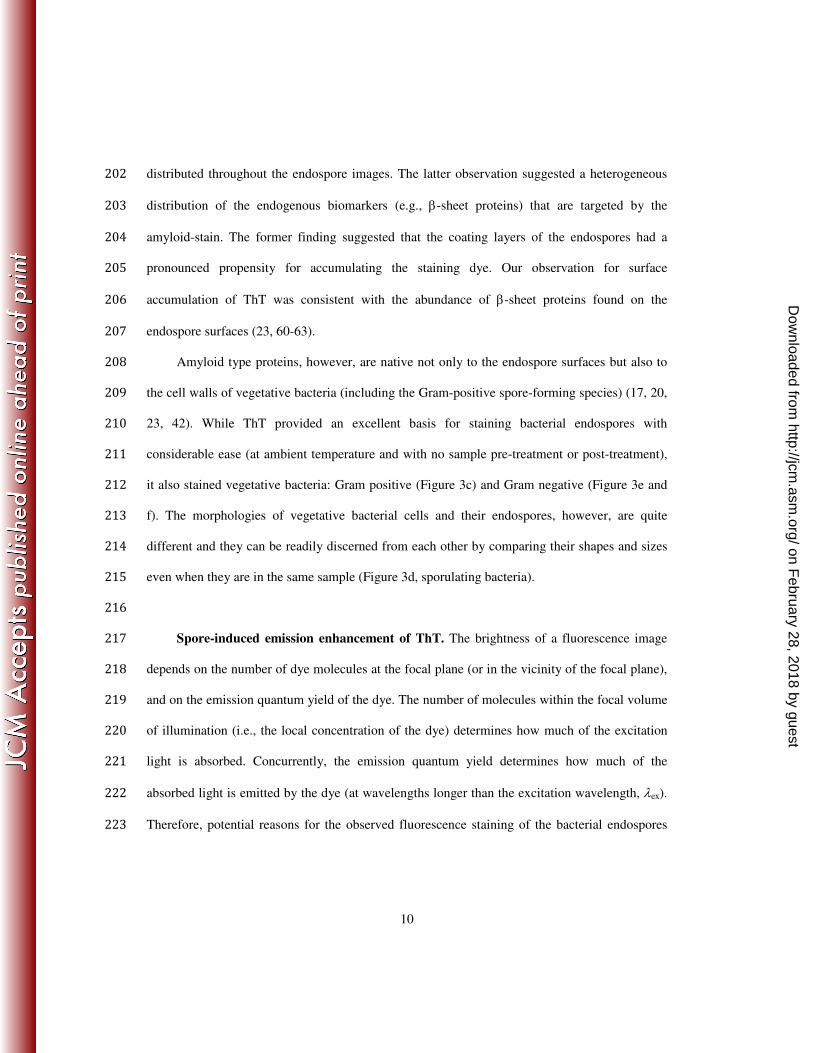
Upon addition of endospores to ThT solution, we observed an increase in its emission 226
intensity without significant change in its optical density at the excitation wavelength (Figure 4). 227
This finding was indicative that an increase in the ThT emission quantum yield was one of the 228
factors governing the observed emission enhancement upon endospore uptake of the dye. 229
The observed emission enhancement phenomenon, induced by the endospore uptake, is 230
consistent with the sensitivity of the photo-physical properties of ThT to the viscosity of the 231
environment: i.e., the emission quantum yield of ThT increases with the increase in the medium 232
viscosity (73, 75, 82, 83, 89, 91). Due to the single carbon-carbon bond between the two ring 233
systems and the single carbon nitrogen bond between the phenyl ring and the dimethyl amine 234
(Scheme 1) ThT is a molecular rotor (24, 74, 75, 82). Similar to other chromophores that are 235
molecular rotors (3, 4, 28, 39), within the lifetime of the lowest singlet-excited state of the dye, 236
viscous microenvironment slows down and/or completely restrains the attainment of ThT 237
conformers (i.e., rotamers) that have the density of vibrational states allowing efficient internal 238
conversion to the ground state. Such viscosity-induced suppression of efficient non-radiative 239
deactivation, indeed, results in an increase in the emission quantum yield of ThT, as 240
demonstrated by photophysical studies of this staining agent for solvent media with varying 241
viscosity (83). Binding of ThT to protein aggregates (or other macromolecular assemblies) has 242
restrictive effect on its modes of molecular motion that is similar to the effect of increased 243
medium viscosity: i.e., the binding sites provide microenvironment with relatively large effective 244
viscosity and causes an increase in the fluorescence quantum yield of ThT (83). 245
on February 28, 2018 by guest
http://jcm.asm
.org/D
ownloaded from
12
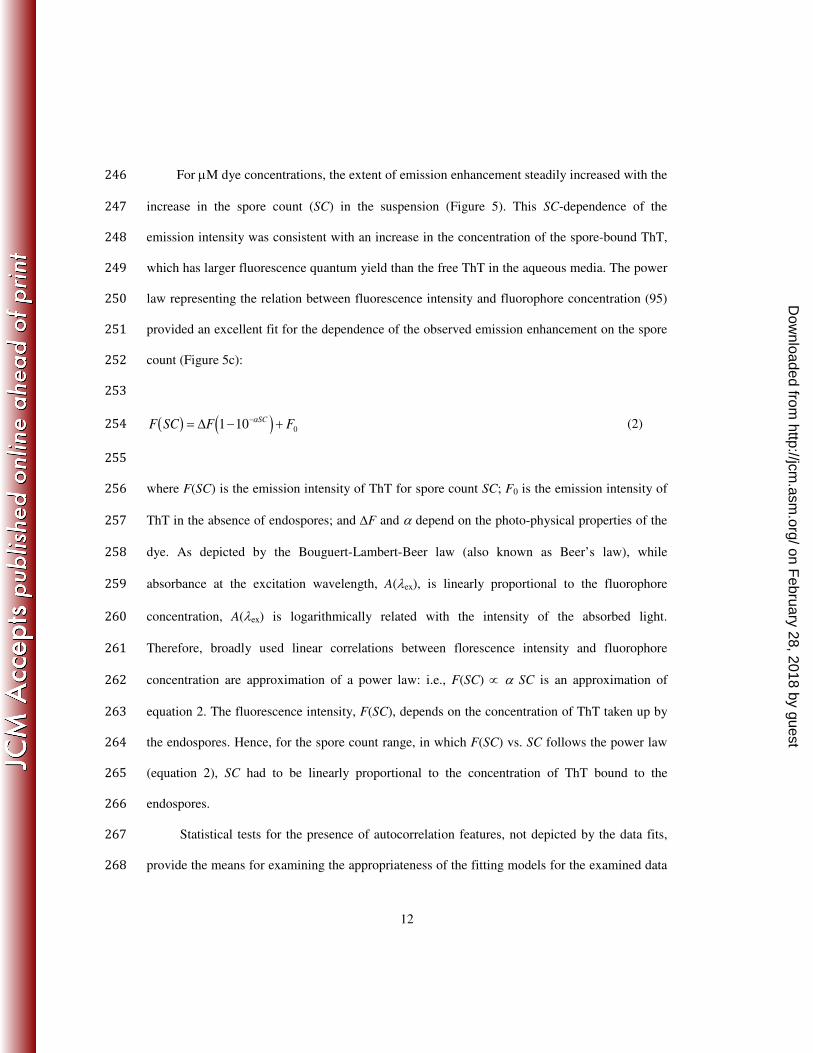
For µM dye concentrations, the extent of emission enhancement steadily increased with the 246
increase in the spore count (SC) in the suspension (Figure 5). This SC-dependence of the 247
emission intensity was consistent with an increase in the concentration of the spore-bound ThT, 248
which has larger fluorescence quantum yield than the free ThT in the aqueous media. The power 249
law representing the relation between fluorescence intensity and fluorophore concentration (95) 250
provided an excellent fit for the dependence of the observed emission enhancement on the spore 251
count (Figure 5c): 252
253
F SC( ) = ∆F 1 −10−αSC( ) + F0 (2) 254
255
where F(SC) is the emission intensity of ThT for spore count SC; F0 is the emission intensity of 256
ThT in the absence of endospores; and ∆F and α depend on the photo-physical properties of the 257
dye. As depicted by the Bouguert-Lambert-Beer law (also known as Beer’s law), while 258
absorbance at the excitation wavelength, A(λex), is linearly proportional to the fluorophore 259
concentration, A(λex) is logarithmically related with the intensity of the absorbed light. 260
Therefore, broadly used linear correlations between florescence intensity and fluorophore 261
concentration are approximation of a power law: i.e., F(SC) ∝ α SC is an approximation of 262
equation 2. The fluorescence intensity, F(SC), depends on the concentration of ThT taken up by 263
the endospores. Hence, for the spore count range, in which F(SC) vs. SC follows the power law 264
(equation 2), SC had to be linearly proportional to the concentration of ThT bound to the 265
endospores. 266
Statistical tests for the presence of autocorrelation features, not depicted by the data fits, 267
provide the means for examining the appropriateness of the fitting models for the examined data 268
on February 28, 2018 by guest
http://jcm.asm
.org/D
ownloaded from

13
sets. An ideal model for data analysis results in random distribution of the data points around the 269
regressed values for the data-fit function: i.e., the data-fit residuals should not exhibit 270
autocorrelation. Durbin-Watson statistics, DW, provides the means for examining the presence of 271
autocorrelation. DW can assume values between 0 and 4, and DW close to 2 signifies no 272
autocorrelation, DW close to 0 indicates for positive autocorrelation (15, 26, 70, 94). In 273
particular, DW smaller than a critical value with statistical significance α, dwLα,k, indicates for 274
positive autocorrelation in the residuals from data fits with k regression parameters in addition to 275
the intercept. Concurrently, DW > dwUα,k indicates for no autocorrelation. For linear fits, k = 1, 276
and for the nonlinear power-function fits (equation 2), k = 2. (The critical values dwLα,k and 277
dwUα,k are obtained from Durbin-Watson significance tables for α, k, and for the number of 278
examined data points n.) For the data set presented on Figure 5b and 5c, for α = 0.01 and n = 9, 279
dwL0.01,1 = 0.554 and dwU0.01,1 = 0.998 (for linear fits); and dwL0.01,2 = 0.408 and dwU0.01,2 = 280
1.39. For linear analysis, DW = 0.841 (Figure 5b) and dwL0.01,1 < DW < dwU0.01,1 indicated for 281
inconclusiveness in rejecting the presence of autocorrelation. Employing nonlinear analysis 282
yielded DW = 1.75 (Figure 5c) and DW > dwU0.01,2 proving a lack of autocorrelation with at least 283
99% certainty. This statistical analysis demonstrated the preferred feasibility for using a power 284
law (equation 2), instead of linear relation, for correlating emission intensity with chromophore 285
concentration. 286
287
Binding affinity of ThT for endospores. In addition to the increase in the emission 288
quantum yield of ThT upon binding to the endospores, accumulation of the dye in the endospores 289
will also enhance the imaging contrast of the fluorescently stained species. The distribution 290
on February 28, 2018 by guest
http://jcm.asm
.org/D
ownloaded from

14
coefficient, KD, for ThT allowed us to quantify the propensity of the dye to accumulate in 291
bacterial endospores: 292
293
KD =CSPORE
CSOLUTION
(3) 294
295
where CSPORE and CSOLUTION are the concentrations of ThT in the endospore and in the aqueous 296
solution, respectively, after completion of the staining process. 297
We incubated known amounts of endospores in ThT solutions with preset concentrations 298
and absorbance (Figure 6a). After the incubation, we centrifuged the endospores and collected 299
the supernatant. From the absorbance of the supernatant we determined CSOLUTION (Figure 6a). 300
The difference between the absorbance of the ThT prior to the endospore treatment and the 301
absorbance of the supernatant allowed us to estimate the amount of dye that was bound to the 302
endospores and removed from the solution via the centrifugation step. Therefore, CSPORE = nThT / 303
nS VS, where nThT is the moles of ThT bound to the endospores, nS is the number of endospores, 304
and VS is the volume of a single endospore estimated from their images. 305
For B. globigii, we obtained KD = 4×10³ (Figure 6a). For G. stearothermophilus, a similar 306
approach of incubating 2×10⁷ spore ml
–1 in 17 µM solution of ThT, yielded KD = 7×10
3. The 307
measured distribution coefficient, KD, however, exhibited dependence on the spore count, SC, 308
and on the initial dye contrition, CThT(0)
, in which the spores were incubated. An increase in 309
CThT(0)
and a decrease in SC caused an increase in KD (Figure 6b). This concentration dependence 310
of KD reflected the fact that a two-state/two-phase model (equation 3) did not encompass the 311
complexity of the dye uptake by the endospores. Nevertheless, the estimated KD ranged between 312
about 103 and 10
4, and these values were indicative for the high propensity of ThT to accumulate 313
on February 28, 2018 by guest
http://jcm.asm
.org/D
ownloaded from
15
in bacterial endospores: i.e., the average concentration of ThT in the endospores exceeded three 314
orders of magnitude the dye concentration in the surrounding aqueous media. Therefore, the 315
fluorescence staining of endospores with ThT is driven not only by the increase in the emission 316
quantum yield of ThT upon uptake, but also by the high propensity of endospores to uptake ThT. 317
318
Imaging in the presence of contaminants. Despite the established pronounced affinity of 319
ThT for β-amyloid types of protein structures prevalent in endospores and in the cell walls of 320
vegetative bacteria (17, 20, 42, 60-63), binding of the positively charged chromophore (Scheme 321
1) to a range of other macromolecular structures presents a limitation for employing ThT as a 322
stain for biomedical and environmental samples. 323
We examined the capability of ThT to selectively stain bacterial endospores in the presence 324
of: a biochemical contaminant, deoxyribonucleic acid, DNA; a biomedical contaminant, fetal 325
bovine serum, FBS; and an environmental contaminant, humic acid, HA (41, 80). The presence 326
of these contaminants, indeed, increased the level of background fluorescence as reflected by the 327
decrease in the DC component of the signal-to-noise ratios (equation 1a): i.e., S/NDC was 5.5 dB 328
± 1.7 dB, 2.5 dB ± 0.2 dB and 1.8 dB ± 1.5 dB for the endospore containing DNS, FBA and HA 329
samples, respectively (see supplemental material). 330
While phase-contrast and differential interference contrast (DIC) microscopy provide 331
means for visualization of bacterial endospores in relatively pure samples (12, 46, 99), they fail 332
when substantial amounts of particulate contaminants are present. Fluorescence microscopy of 333
ThT-stained samples, on the other hand, appears to have the potential for visualizing bacterial 334
endospores even when such contaminants are prevalently present. 335
336
on February 28, 2018 by guest
http://jcm.asm
.org/D
ownloaded from
16
Discussion 337
338
In this study, we hypothesized that an amyloid histology stain, thioflavin T (Scheme 1), 339
allows for visualization of bacterial endospores via the means of fluorescence imaging. To test 340
this hypothesis, we employed a range optical spectroscopy and microscopy techniques. The 341
experimental evidence not only allows for accepting the hypothesis, but also elucidates some of 342
the governing processes leading to the desirable staining outcomes. 343
What is the relationship between the observations from the three different techniques: i.e., 344
between spectroscopy, imaging, and dye-distribution analysis? To answer this question, it is 345
essential to consider the heterogeneous nature of the samples. The fluorescence spectra present 346
the intensity of the light emitted from all dye molecules that are in the sample volume 347
illuminated by the excitation beam. Therefore, the spectra encompass the emission from the 348
weakly fluorescent ThT free in solution and from the strongly fluorescent ThT taken up by the 349
endospores. By far, most of the dye molecules in the stained samples are free in solution (Figure 350
6). As previously reported, an increase in the medium viscosity causes an increase in the ThT 351
fluorescence quantum yield (83), which is expected for the properties of chromophores, such as 352
ThT, classified as molecular rotors (4, 82). A viscosity-induced increase in the emission quantum 353
yield of ThT amounts to about three orders of magnitude (83). Therefore, due to the relatively 354
viscous microenvironment of the dye molecules bound within the endospores, the free ThT in the 355
aqueous media has emission quantum yield that is about two-to-three orders of magnitude 356
smaller than the quantum yield of ThT taken up by the spores. 357
For example, in samples containing 106 spore ml
–1, the total volume of the spores is about 358
106 times smaller than the volume of the aqueous media (i.e., a volume of a single spores is in 359
on February 28, 2018 by guest
http://jcm.asm
.org/D
ownloaded from
17
the order of a femtoliter). Considering the measured distribution coefficients, KD, of about 103 –360
104, indicates that in such samples, only about 0.1% to 1% of the dye is taken up by the 361
endospores. While the number of dye molecules in the aqueous media is about 100 to 1,000 362
larger than the number of dye molecules in the endospores, the dye in the aqueous media has 363
about two to three orders of magnitude smaller fluorescence quantum yield than the endospore-364
bound dye, which explains the relatively “moderate” emission enhancement (less than an order 365
of magnitude for 106 spore ml
–1) spectroscopically observed (Figure 4 and 5). For this 366
discussion, we considered negligible perturbation in the absorption of ThT when binding to the 367
spores (as evident from the absorption and excitation spectra, Figure 4a and 5a, respectively), 368
and we did not include the multiple pathways of excitation and emitted light due to the scattering 369
nature of the samples. 370
Because an increase in CThT(0)
(within the µM range) tends to decrease KD (Figure 6b), the 371
endospore-induced enhancement of the emission of ThT is more pronounced for lower dye 372
concentrations (Figure 4b vs. Figure 5b and 5c). Diluting the ThT staining solutions, thus, tends 373
to improve the extent of the endospore-induced emission enhancement essential for 374
spectroscopic and imaging applications. The sensitivity of the measurements, the background 375
emission from endogenous fluorophores (no matter how weak it might be), the photostability of 376
ThT, and the upper limit of KD, imposes limitations on how low CThT(0)
feasibly can be. 377
We readily imaged endospores using 1 nM ThT (see supplemental material), and we 378
demonstrated excellent correlations between spore count and emission intensity for 1 µM ThT 379
(Figure 5b). These findings demonstrate an immensely wide working range of ThT 380
concentrations, providing the basis for a broad applicability and optimization for each specific 381
application that might resort to ThT-aided spectrofluorometry and imaging. 382
on February 28, 2018 by guest
http://jcm.asm
.org/D
ownloaded from

18
How do the images relate to the spectroscopic findings? The imaged contrast ratio between 383
the fluorescence intensity corresponding to ThT-stained endospores, ⟨∆h⟩ + ∆I, and the emission 384
intensity from the free ThT in the background, ∆I (Figure 2), considerably exceeds one and even 385
two orders of magnitude. The endospores, however, occupy only a few percent (or less) of the 386
total area of the images. As a result, the cumulative intensity from the pixels corresponding to the 387
stained endospores does not exceed with more than about an order of magnitude the cumulative 388
intensity from the pixels corresponding to the image background. This trend is, indeed, in 389
agreement with the fluorescence enhancement observed from the spectral data. 390
Overall, the accumulation of ThT in the bacterial endospores increases the dye local 391
concentration, followed by increasing the amount of light absorbed and emitted by the stained 392
endospores. The increase in the ThT emission quantum yield upon endospore uptake further 393
enhances the intensity of the emitted light from the stained regions. The synergy between these 394
two effects is essential for attaining images with sufficiently large signal-to-noise ratios, essential 395
for visualization of bacterial endospores with acceptable contrast, especially when the 396
background autofluorescence signal is prevalent. 397
Where does ThT bind? This study does not provide a direct answer. Indeed, ThT targets β-398
amyloid-type proteins with high affinity (43), and bacterial endospores are coated with β-strand 399
proteins as evident, for example, from high-resolution AFM images (60-63). These facts provide 400
the rational of this study for staining endospores with ThT targeting their endogenous protein 401
structures. The images of the ThT-stained endospores showed bright contours outlining their 402
elliptical shapes, which is consistent with the dye collecting in the surface regions of the spores 403
(where the high β-protein content has been demonstrated (60-63)), and with an increase in the 404
fluorescence quantum yield of the dye bound to these endospores surface regions. Our evidence 405
on February 28, 2018 by guest
http://jcm.asm
.org/D
ownloaded from
19
does not rule out the possibility for weakly fluorescent ThT present in the interior of the stained 406
endospores. The pronounced density of intact endospores, however, suppresses facile diffusion 407
of molecular species with the size of ThT into their interior (contributing to the resilience of 408
these dormant species). Furthermore, unless endogenous fluorescence quenchers are present, the 409
rigid interior of endospores entrapping the dye and restraining its molecular motions will cause 410
an increase in its fluorescence quantum yield (83). Therefore, most probably, the emission 411
intensity of the ThT-stained endospore images represents the dye distribution throughout these 412
dormant bacterial entities. 413
Furthermore, ThT staining did not noticeably affect the viability of bacterial endospores. 414
Cell-culture tests of endospores incubated in various concentrations of ThT revealed that staining 415
with this dye does not compromise their ability to germinate (see supplemental material). Thus, 416
ThT either does not bind to key components of the endospores essential for their germination, or 417
does not negatively affect these molecular components even if it binds to them. 418
What are the practical implications of the endospore-induced ThT fluorescence 419
enhancement? The tight correlations between the emission enhancement and the spore count 420
(Figure 4b and 5b) illustrate the applicability for the use of ThT for spectroscopic quantification 421
of endospore suspensions. Such spectroscopic measurements, however, are immensely 422
susceptible to the presence of contaminants, such as vegetative bacterial cells, environmental 423
polymers and blood proteins. Such restrictions, therefore, limits the ThT spectrofluorometry to 424
pure endospore samples. 425
For imaging, on the other hand, ThT presents unexplored potentials. Based on their 426
morphology, ThT-stained bacterial endospores are readily discernible in the presence of 427
vegetative bacterial cells (Figure 3). Debris of lysed cells (due to sporulation, for example) does 428
on February 28, 2018 by guest
http://jcm.asm
.org/D
ownloaded from

20
not compromise the visualization of the endospores (Figure 3d). Furthermore, staining with ThT 429
provides means for facile visualization of bacterial endospores in the presence of 430
macromolecular contaminants that not only enhance the ThT fluorescence, but also contribute to 431
the autofluorescence of the sample (see supplemental material). 432
Speed and ease are the principal advantages of using amyloid stains for imaging bacterial 433
endospores. The mild ambient conditions, under which the administration of such stains is 434
conducted along with the absence of any pre- and/or post-treatment steps, provide important and 435
unique capabilities for this approach of fluorescence imaging. Therefore, while classical methods 436
for staining endospores, such as Schaeffer-Fulton stain, require a series of thermal fixing and 437
wash steps, mixing of ThT solution with the bacterial sample without any further treatment 438
allowed for simultaneous staining of vegetative bacteria and endospores during sporulation, for 439
example (Figure 2d). ThT amyloid stain, indeed, provides an unprecedented facility for 440
fluorescence imaging of bacterial endospores. 441
442
Conclusions 443
444
The ability of ThT to stain bacterial endospores was driven by its binding affinity, and by 445
the increase in its fluorescence quantum yield upon uptake. While a variety of stains for 446
vegetative cells are available for bioanalytical assays and imaging with minimal treatment, the 447
choice of methodologies for enhancement and visualization of bacterial endospores is somewhat 448
limited. Our demonstration of fluorescence imaging with an amyloid histology stain exhibits 449
venues for utilization of alternative endogenous markers (such as β-folded protein aggregates) 450
on February 28, 2018 by guest
http://jcm.asm
.org/D
ownloaded from

21
for facile and expedient bioanalytical applications targeting bacterial endospores, known for their 451
resilience and structural stability. 452
453
Acknowledgements: Funding for this research was provided by the U. S. Army Research 454
Laboratory (for G.J.), by the National Science Foundation (CBET 0935995, for V.I.V.), by the 455
U. C. Regents Faculty Development Award (for V.I.V.) and by the National Institute of Health 456
(2R01-DC02775-06, for B.A.). We also extend our gratitude to Dr. B. Hyle Park for the 457
discussions on image analysis. 458
459
References 460
1. Ankolekar, C., T. Rahmati, and R. G. Labbe. 2009. Detection of toxigenic Bacillus cereus and Bacillus 461
thuringiensis spores in us rice. Int. J. Food Microbiol. 128:460-466. 462
2. Arnon, S. S., R. Schechter, T. V. Inglesby, D. A. Henderson, J. G. Bartlett, M. S. Ascher, E. Eitzen, A. D. 463
Fine, J. Hauer, M. Layton, S. Lillibridge, M. T. Osterholm, T. O'Toole, G. Parker, T. M. Perl, P. K. 464
Russell, D. L. Swerdlow, K. Tonat, and W. G. C. Biodefense. 2001. Botulinum toxin as a biological weapon 465
- medical and public health management. JAMA-Journal of the American Medical Association 285:1059-1070. 466
3. Bao, D., B. Millare, W. Xia, B. G. Steyer, A. A. Gerasimenko, A. Ferreira, A. Contreras, and V. I. Vullev. 467
2009. Electrochemical oxidation of ferrocene: A strong dependence on the concentration of the supporting 468
electrolyte for nonpolar solvents. J. Phys. Chem. A 113:1259-1267. 469
4. Bao, D., S. Ramu, A. Contreras, S. Upadhyayula, J. M. Vasquez, G. Beran, and V. I. Vullev. 2010. 470
Electrochemical reduction of quinones: Interfacing experiment and theory for defining effective radii of redox 471
moieties. J. Phys. Chem. B 114:14467-14479. 472
5. Belgrader, P., W. Benett, D. Hadley, J. Richards, P. Stratton, R. Mariella, Jr., and F. Milanovich. 1999. 473
PCR detection of bacteria in seven minutes. Science 284:449-450. 474
6. Beverly, M. B., K. J. Voorhees, T. L. Hadfield, and R. B. Cody. 2000. Electron monochromator mass 475
spectrometry far the analysis of whole bacteria and bacterial spores. Anal. Chem. 72:2428-2432. 476
7. Biancalana, M., and S. Koide. 2010. Molecular mechanism of thioflavin-T binding to amyloid fibrils. BBA-477
Proteins Proteom. 1804:1405-1412. 478
8. Bisset, K. A. 1950. Evolution in bacteria and the significance of the bacterial spore. Nature 166:431-432. 479
9. Cable, M. L., J. P. Kirby, D. J. Levine, M. J. Manary, H. B. Gray, and A. Ponce. 2009. Detection of 480
bacterial spores with lanthanide-macrocycle binary complexes. J. Am. Chem. Soc. 131:9562-9570. 481
10. Cable, M. L., J. P. Kirby, K. Sorasaenee, H. B. Gray, and A. Ponce. 2007. Bacterial spore detection by 482
[Tb3+
(macrocycle)(dipicolinate)] luminescence. J. Am. Chem. Soc. 129:1474-1475. 483
11. Chau, K., B. Millare, A. Lin, S. Upadhyayula, V. Nuñez, H. Xu, and V. I. Vullev. 2011. Dependence of the 484
quality of adhesion between poly(dimethylsiloxane) and glass surfaces on the composition of the oxidizing 485
plasma. Microfluid. Nanofluid. 10:907-917. 486
12. Chen, D., S. S. Huang, and Y. Q. Li. 2006. Real-time detection of kinetic germination and heterogeneity of 487
single bacillus spores by laser tweezers raman spectroscopy. Anal. Chem. 78:6936-6941. 488
13. Dobson, C. M. 2003. Protein folding and misfolding. Nature 426:884-890. 489
14. Driks, A. 2003. The dynamic spore. Proc. Natl. Acad. Sci. U. S. A. 100:3007-3009. 490
on February 28, 2018 by guest
http://jcm.asm
.org/D
ownloaded from

22
15. Eaton, D. F. 1990. Recommended methods for fluorescence decay analysis. Pure and Applied Chemistry 491
62:1631-1648. 492
16. Fichtel, J., J. Koester, J. Rullkoetter, and H. Sass. 2007. Spore dipicolinic acid contents used for estimating 493
the number of endospores in sediments. FEMS Microbiology Ecology 61:522-532. 494
17. Fowler, D. M., A. V. Koulov, W. E. Balch, and J. W. Kelly. 2007. Functional amyloid - from bacteria to 495
humans. Trends in Biochemical Sciences 32:217-224. 496
18. Franz, D. R., P. B. Jahrling, A. M. Friedlander, D. J. McClain, D. L. Hoover, W. R. Bryne, J. A. Pavlin, 497
C. W. Christopher, and E. M. Eitzen. 1997. Clinical recognition and management of patients exposed to 498
biological warfare agents. JAMA-Journal of the American Medical Association 278:399-411. 499
19. Fykse, E. M., B. Langseth, J. S. Olsen, G. Skogan, and J. M. Blatny. 2008. Detection of bioterror agents in 500
air samples using real-time PCR. J. Appl. Microbiol. 105:351-358. 501
20. Gebbink, M. F. B. G., D. Claessen, B. Bouma, L. Dijkhuizen, and H. A. B. Wosten. 2005. Amyloids - a 502
functional coat for microorganisms. Nat. Rev. Microbiol. 3:333-341. 503
21. Groenning, M., M. Norrman, J. M. Flink, M. van de Weert, J. T. Bukrinsky, G. Schluckebier, and S. 504
Frokjaer. 2007. Binding mode of thioflavin T in insulin amyloid fibrils. J. Struct. Biol. 159:483-497. 505
22. Gueltekin, A., A. Ersoez, N. Y. Sarioezlue, A. Denizli, and R. Say. 2010. Nanosensors having dipicolinic 506
acid imprinted nanoshell for bacillus cereus spores detection. Journal of Nanoparticle Research 12:2069-2079. 507
23. Hammer, N. D., X. Wang, B. A. McGuffie, and M. R. Chapman. 2008. Amyloids: Friend or foe? Journal of 508
Alzheimer's Disease 13:407-419. 509
24. Harel, M., L. K. Sonoda, I. Silman, J. L. Sussman, and T. L. Rosenberry. 2008. Crystal structure of 510
thioflavin T bound to the peripheral site of torpedo californica acetylcholinesterase reveals how thioflavin T 511
acts as a sensitive fluorescent reporter of ligand binding to the acylation site. J. Am. Chem. Soc. 130:7856-512
7861. 513
25. Hindle, A. A., and E. A. H. Hall. 1999. Dipicolinic acid (dpa) assay revisited and appraised for spore 514
detection. Analyst 124:1599-1604. 515
26. Hisamatsu, H., and K. Maekawa. 1994. The distribution of the durbin-watson statistic in integrated and near-516
integrated models. J. Econometrics 61:367-382. 517
27. Hong, C., D. Bao, M. S. Thomas, J. M. Clift, and V. I. Vullev. 2008. Print-and-peel fabrication of 518
microelectrodes. Langmuir 24:8439-8442. 519
28. Hu, J., B. Xia, D. Bao, A. Ferreira, J. Wan, G. Jones, and V. I. Vullev. 2009. Long-lived photogenerated 520
states of alpha-oligothiophene-acridinium dyads have triplet character. J. Phys. Chem. A 113:3096-3107. 521
29. Inglesby, T. V., T. O'Toole, A. Henderson Donald, G. Bartlett John, S. Ascher Michael, E. Eitzen, M. 522
Friedlander Arthur, J. Gerberding, J. Hauer, J. Hughes, J. McDade, T. Osterholm Michael, G. Parker, 523
M. Perl Trish, K. Russell Philip, and K. Tonat. 2002. Anthrax as a biological weapon, 2002: Updated 524
recommendations for management. JAMA : the Journal of the American Medical Association 287:2236-2252. 525
30. Iqbal, S. S., M. W. Mayo, J. G. Bruno, B. V. Bronk, C. A. Batt, and J. P. Chambers. 2000. A review of 526
molecular recognition technologies for detection of biological threat agents. Biosens. Bioelectron. 15:549-578. 527
31. Jakob-Roetne, R., and H. Jacobsen. 2009. Alzheimer's disease: From pathology to therapeutic approaches. 528
Angew. Chem. Int. Edit. 48:3030-3059. 529
32. Jones, G., II, L. N. Lu, V. Vullev, D. Gosztola, S. Greenfield, and M. Wasielewski. 1995. Photoactive 530
peptides. 6. Photoinduced electron transfer for pyrenesulfonamide conjugates of tryptophan-containing 531
peptides. Mitigation of fluoroprobe behavior in N-terminal labeling experiments. Bioorganic & Medicinal 532
Chemistry Letters 5:2385-2390. 533
33. Jones, G., II, V. Vullev, E. H. Braswell, and D. Zhu. 2000. Multistep photoinduced electron transfer in a de 534
novo helix bundle: Multimer self-assembly of peptide chains including a chromophore special pair. J. Am. 535
Chem. Soc. 122:388-389. 536
34. Jones, G., II, and V. I. Vullev. 2001. Contribution of a pyrene fluorescence probe to the aggregation 537
propensity of polypeptides. Organic Letters 3:2457-2460. 538
35. Jones, G., II, and V. I. Vullev. 2001. Ground- and excited-state aggregation properties of a pyrene derivative 539
in aqueous media. J. Phys. Chem. A 105:6402-6406. 540
36. Jones, G., II, and V. I. Vullev. 2002. Medium effects on the photophysical properties of terbium(iii) 541
complexes with pyridine-2,6-dicarboxylate. Photochemical & Photobiological Sciences 1:925-933. 542
on February 28, 2018 by guest
http://jcm.asm
.org/D
ownloaded from
23
37. Jones, G., II, and V. I. Vullev. 2002. Medium effects on the stability of terbium(III) complexes with pyridine-543
2,6-dicarboxylate. J. Phys. Chem. A 106:8213-8222. 544
38. Jones, G., II, and V. I. Vullev. 2002. Photoinduced electron transfer between non-native donor-acceptor 545
moieties incorporated in synthetic polypeptide aggregates. Organic Letters 4:4001-4004. 546
39. Jones, G., II, D. Yan, J. Hu, J. Wan, B. Xia, and V. I. Vullev. 2007. Photoinduced electron transfer in 547
arylacridinium conjugates in a solid glass matrix. J. Phys. Chem. B 111:6921-6929. 548
40. Jones, G., II, X. Zhou, and V. I. Vullev. 2003. Photoinduced electron transfer in alpha-helical polypeptides: 549
Dependence on conformation and electron donor-acceptor distance. Photochemical & Photobiological Sciences 550
2:1080-1087. 551
41. Jones, G., and G. L. Indig. 1996. Spectroscopic and chemical binding properties of humic acids in water. New 552
J. Chem. 20:221-232. 553
42. Jordal, P. B., M. S. Dueholm, P. Larsen, S. V. Petersen, J. J. Enghild, G. Christiansen, P. Hojrup, P. H. 554
Nielsen, and D. E. Otzen. 2009. Widespread abundance of functional bacterial amyloid in mycolata and other 555
Gram-positive bacteria. Appl. Environ. Microb. 75:4101-4110. 556
43. Khurana, R., C. Coleman, C. Ionescu-Zanetti, S. A. Carter, V. Krishna, R. K. Grover, R. Roy, and S. 557
Singh. 2005. Mechanism of thioflavin T binding to amyloid fibrils. J. Struct. Biol. 151:229-238. 558
44. Kim, K., J. Seo, K. Wheeler, C. Park, D. Kim, S. Park, W. Kim, S. I. Chung, and T. Leighton. 2005. Rapid 559
genotypic detection of Bacillus anthracis and the Bacillus cereus group by multiplex real-time PCR melting 560
curve analysis. FEMS Immunology and Medical Microbiology 43:301-310. 561
45. Klunk, W. E., Y. M. Wang, G. F. Huang, M. L. Debnath, D. P. Holt, and C. A. Mathis. 2001. Uncharged 562
thioflavin-T derivatives bind to amyloid-beta protein with high affinity and readily enter the brain. Life Sci. 563
69:1471-1484. 564
46. Kong, L. B., P. F. Zhang, P. Setlow, and Y. Q. Li. 2010. Characterization of bacterial spore germination using 565
integrated phase contrast microscopy, raman spectroscopy, and optical tweezers. Analytical Chemistry 82:3840-566
3847. 567
47. Kricka, L. J., and P. Fortina. 2009. Analytical ancestry: "Firsts" in fluorescent labeling of nucleosides, 568
nucleotides, and nucleic acids. Clin. Chem. 55:670-683. 569
48. Kukreja, R. V., S. K. Sharma, and B. R. Singh. 2010. Molecular basis of activation of endopeptidase activity 570
of botulinum neurotoxin type E. Biochemistry 49:2510-2519. 571
49. LeVine, H., 3rd. 1993. Thioflavine T interaction with synthetic Alzheimer's disease beta-amyloid peptides: 572
Detection of amyloid aggregation in solution. Protein Sci 2:404-410. 573
50. Ljosa, V., and A. E. Carpenter. 2008. High-throughput screens for fluorescent dye discovery. Trends in 574
Biotechnology 26:527-530. 575
51. Maji, S. K., M. H. Perrin, M. R. Sawaya, S. Jessberger, K. Vadodaria, R. A. Rissman, P. S. Singru, K. P. 576
R. Nilsson, R. Simon, D. Schubert, D. Eisenberg, J. Rivier, P. Sawchenko, W. Vale, and R. Riek. 2009. 577
Functional amyloids as natural storage of peptide hormones in pituitary secretory granules. Science 325:328-578
332. 579
52. Makino, S., and H. Cheun. 2003. Application of the real-time PCR for the detection of airborne microbial 580
pathogens in reference to the anthrax spores. J. Microbiol. Meth. 53:141-147. 581
53. Maskevich, A. A., V. I. Stsiapura, V. A. Kuzmitsky, I. M. Kuznetsova, O. I. Povarova, V. N. Uversky, and 582
K. K. Turoverov. 2007. Spectral properties of thioflavin T in solvents with different dielectric properties and in 583
a fibril-incorporated form. Journal of Proteome Research 6:1392-1401. 584
54. Millare, B., M. Thomas, A. Ferreira, H. Xu, M. Holesinger, and V. I. Vullev. 2008. Dependence of the 585
quality of adhesion between polydimethyl siloxane and glass surfaces on the conditions of treatment with 586
oxygen plasma. Langmuir 24:13218-13224. 587
55. Montecucco, C., and J. Molgo. 2005. Botulinal neurotoxins: Revival of an old killer. Current Opinion in 588
Pharmacology 5:274-279. 589
56. Naiki, H., K. Higuchi, M. Hosokawa, and T. Takeda. 1989. Fluorometric-determination of amyloid fibrils 590
invitro using the fluorescent dye, thioflavine-T. Anal. Biochem. 177:244-249. 591
57. Nicholson, W. L., N. Munakata, G. Horneck, H. J. Melosh, and P. Setlow. 2000. Resistance of bacillus 592
endospores to extreme terrestrial and extraterrestrial environments. Microbiol. Mol. Biol. Rev. 64:548-572. 593
on February 28, 2018 by guest
http://jcm.asm
.org/D
ownloaded from

24
58. Ohhashi, Y., M. Kihara, H. Naiki, and Y. Goto. 2005. Ultrasonication-induced amyloid fibril formation of 594
beta(2)-microglobulin. Journal of Biological Chemistry 280:32843-32848. 595
59. Pellegrino, P. M., N. F. Fell, Jr., D. L. Rosen, and J. B. Gillespie. 1998. Bacterial endospore detection using 596
terbium dipicolinate photoluminescence in the presence of chemical and biological materials. Anal. Chem. 597
70:1755-1760. 598
60. Plomp, M., T. J. Leighton, K. E. Wheeler, H. D. Hill, and A. J. Malkin. 2007. In vitro high-resolution 599
structural dynamics of single germinating bacterial spores. Proc. Natl. Acad. Sci. U. S. A. 104:9644-9649. 600
61. Plomp, M., T. J. Leighton, K. E. Wheeler, and A. J. Malkin. 2005. Architecture and high-resolution 601
structure of Bacillus thuringiensis and Bacillus cereus spore coat surfaces. Langmuir 21:7892-7898. 602
62. Plomp, M., T. J. Leighton, K. E. Wheeler, M. E. Pitesky, and A. J. Malkin. 2005. Bacillus atrophaeus outer 603
spore coat assembly and ultrastructure. Langmuir 21:10710-10716. 604
63. Plomp, M., and A. J. Malkin. 2009. Mapping of proteomic composition on the surfaces of bacillus spores by 605
atomic force microscopy-based immunolabeling. Langmuir 25:403-409. 606
64. Premasiri, W. R., D. T. Moir, M. S. Klempner, N. Krieger, G. Jones, and L. D. Ziegler. 2005. 607
Characterization of the surface enhanced raman scattering (SERS) of bacteria. J. Phys. Chem. B 109:312-320. 608
65. Rao, S. S., K. V. K. Mohan, and C. D. Atreya. 2010. Detection technologies for Bacillus anthracis: Prospects 609
and challenges. J. Microbiol. Meth. 82:1-10. 610
66. Rosen, D. L. 1999. Bacterial endospore detection using photoluminescence from terbium dipicolinate. Rev. 611
Anal. Chem. 18:1-21. 612
67. Rosen, D. L. 1999. Bacterial endospore detection using photoluminescence from terbium dipicolinate. Rev. 613
Anal. Chem. 18:1-21. 614
68. Rosen, D. L., C. Sharpless, and L. B. McGown. 1997. Bacterial spore detection and determination by use of 615
terbium dipicolinate photoluminescence. Anal. Chem. 69:1082-1085. 616
69. Rueckert, A., R. S. Ronimus, and H. W. Morgan. 2005. Development of a rapid detection and enumeration 617
method for thermophilic bacilli in milk powders. J. Microbiol. Meth. 60:155-167. 618
70. Rutledge, D. N., and A. S. Barros. 2002. Durbin-watson statistic as a morphological estimator of information 619
content. Anal. Chim. Acta 454:277-295. 620
71. Sadik, O. A., W. H. Land, and J. Wang. 2003. Targeting chemical and biological warfare agents at the 621
molecular level. Electroanal. 15:1149-1159. 622
72. Schaeffer, A., and M. D. Fulton. 1933. A simplified method of staining endospores. Science 77:194. 623
73. Singh, P. K., M. Kumbhakar, H. Pal, and S. Nath. 2010. Ultrafast bond twisting dynamics in amyloid fibril 624
sensor. J. Phys. Chem. B 114:2541-2546. 625
74. Singh, P. K., M. Kumbhakar, H. Pal, and S. Nath. 2009. Ultrafast torsional dynamics of protein binding dye 626
thioflavin-T in nanoconfined water pool. J. Phys. Chem. B 113:8532-8538. 627
75. Singh, P. K., M. Kumbhakar, H. Pal, and S. Nath. 2010. Viscosity effect on the ultrafast bond twisting 628
dynamics in an amyloid fibril sensor: Thioflavin-T. J. Phys. Chem. B 114:5920-5927. 629
76. Slieman, T. A., and W. L. Nicholson. 2001. Role of dipicolinic acid in survival of bacillus subtilis spores 630
exposed to artificial and solar uv radiation. Appl. Environ. Microbiol. 67:1274-1279. 631
77. Snyder, A. P., A. Tripathi, J. P. Dworzanski, W. M. Maswadeh, and C. H. Wick. 2005. Characterization of 632
microorganisms by thermogravimetric analysis-mass spectrometry. Anal. Chim. Acta 536:283-293. 633
78. Song, J. M., M. Culha, P. A. Kasili, G. D. Griffin, and T. Vo-Dinh. 2005. A compact cmos biochip 634
immunosensor towards the detection of a single bacteria. Biosens. Bioelectron. 20:2203-2209. 635
79. Steele, P. T., A. Srivastava, M. E. Pitesky, D. P. Fergenson, H. J. Tobias, E. E. Gard, and M. Frank. 2005. 636
Desorption/ionization fluence thresholds and improved mass spectral consistency measured using a flattop laser 637
profile in the bioaerosol mass spectrometry of single bacillus endospores. Anal. Chem. 77:7448-7454. 638
80. Steinberg, C. E. W., T. Meinelt, M. A. Timofeyev, M. Bittner, and R. Menzel. 2008. Humic substances. 639
Environ Sci. Pollut. Res. 15:128-135. 640
81. Stratis-Cullum, D. N., G. D. Griffin, J. Mobley, A. A. Vass, and T. Vo-Dinh. 2003. A miniature biochip 641
system for detection of aerosolized bacillus globigii spores. Anal. Chem. 75:275-280. 642
82. Stsiapura, V. I., A. A. Maskevich, V. A. Kuzmitsky, V. N. Uversky, I. M. Kuznetsova, and K. K. 643
Turoverov. 2008. Thioflavin T as a molecular rotor: Fluorescent properties of thioflavin T in solvents with 644
different viscosity. J. Phys. Chem. B 112:15893-15902. 645
on February 28, 2018 by guest
http://jcm.asm
.org/D
ownloaded from
25
83. Sulatskaya, A. I., A. Maskevich Alexander, M. Kuznetsova Irina, N. Uversky Vladimir, and K. 646
Turoverov Konstantin. 2010. Fluorescence quantum yield of thioflavin T in rigid isotropic solution and 647
incorporated into the amyloid fibrils. PLoS one 5:e15385. 648
84. Taylor, K. M. L., and W. Lin. 2009. Hybrid silica nanoparticles for luminescent spore detection. Journal of 649
Materials Chemistry 19:6418-6422. 650
85. Thomas, M. S., J. M. Clift, B. Millare, and V. I. Vullev. 2010. Print-and-peel fabricated passive micromixers. 651
Langmuir 26:2951-2957. 652
86. Thomas, M. S., B. Millare, J. M. Clift, D. Bao, C. Hong, and V. I. Vullev. 2010. Print-and-peel fabrication 653
for microfluidics: What's in it for biomedical applications? Annals of Biomedical Engineering 38:21-32. 654
87. Thomas, M. S., V. Nuñez, S. Upadhyayula, E. R. Zielins, D. Bao, J. M. Vasquez, B. Bahmani, and V. I. 655
Vullev. 2010. Kinetics of bacterial fluorescence staining with 3,3'-diethylthiacyanine. Langmuir 26:9756-9765. 656
88. Uithoven, K. A., J. C. Schmidt, and M. E. Ballman. 2000. Rapid identification of biological warfare agents 657
using an instrument employing a light addressable potentiometric sensor and a flow-through immunofiltration-658
enzyme assay system. Biosens. Bioelectron. 14:761-770. 659
89. Vasquez, J. M., A. Vu, J. S. Schultz, and V. I. Vullev. 2009. Fluorescence enhancement of warfarin induced 660
by interaction with beta-cyclodextrin. Biotechnology Progress 25:906-914. 661
90. Vetri, V., C. Canale, A. Relini, F. Librizzi, V. Militello, A. Gliozzi, and M. Leone. 2007. Amyloid fibrils 662
formation and amorphous aggregation in concanavalin A. Biophys. Chem. 125:184-190. 663
91. Voropai, E. S., M. P. Samtsov, K. N. Kaplevskii, A. A. Maskevich, V. I. Stepuro, O. I. Povarova, I. M. 664
Kuznetsova, K. K. Turoverov, A. L. Fink, and V. N. Uverskii. 2003. Spectral properties of thioflavin T and 665
its complexes with amyloid fibrils. Journal of Applied Spectroscopy (Translation of Журнал Прикладной 666
Спектроскопии) 70:868-874. 667
92. Vullev, V. I., and G. Jones. 2002. Photoinduced electron transfer in alkanoylpyrene aggregates in conjugated 668
polypeptides. Tetrahedron Letters 43:8611-8615. 669
93. Vullev, V. I., J. Wan, V. Heinrich, P. Landsman, P. E. Bower, B. Xia, B. Millare, and G. Jones, II. 2006. 670
Nonlithographic fabrication of microfluidic devices. J. Am. Chem. Soc. 128:16062-16072. 671
94. Wan, J., A. Ferreira, W. Xia, C. H. Chow, K. Takechi, P. V. Kamat, G. Jones, and V. I. Vullev. 2008. 672
Solvent dependence of the charge-transfer properties of a quaterthiophene-anthraquinone dyad. Journal of 673
Photochemistry and Photobiology, A: Chemistry 197:364-374. 674
95. Wan, J., M. S. Thomas, S. Guthrie, and V. I. Vullev. 2009. Surface-bound proteins with preserved 675
functionality. Annals of Бiomedical Еngineering 37:1190-1205. 676
96. Wictome, M., K. Newton, K. Jameson, B. Hallis, P. Dunnigan, E. Mackay, S. Clarke, R. Taylor, J. Gaze, 677
K. Foster, and C. Shone. 1999. Development of an in vitro bioassay for Clostridium botulinum type B 678
neurotoxin in foods that is more sensitive than the mouse bioassay. Appl. Environ. Microb. 65:3787-3792. 679
97. Xing, Y., and K. Higuchi. 2002. Amyloid fibril proteins. Mechanisms of Ageing and Development 123:1625-680
1636. 681
98. Yang, W.-W., and A. Ponce. 2009. Rapid endospore viability assay of Clostridium sporogenes spores. Int. J. 682
Food Microbiol. 133:213-216. 683
99. Zhang, P. F., L. B. Kong, G. W. Wang, P. Setlow, and Y. Q. Li. 2010. Combination of raman tweezers and 684
quantitative differential interference contrast microscopy for measurement of dynamics and heterogeneity 685
during the germination of individual bacterial spores. J. Biomed. Opt. 15:056010-1 - 056010-9. 686
100. Zhang, X. Y., M. A. Young, O. Lyandres, and R. P. Van Duyne. 2005. Rapid detection of an anthrax 687
biomarker by surface-enhanced raman spectroscopy. J. Am. Chem. Soc. 127:4484-4489. 688
689
on February 28, 2018 by guest
http://jcm.asm
.org/D
ownloaded from

26
690
691
692
693
694
Scheme 1. Thioflavin T (ThT). 695
696
697
698
699
on February 28, 2018 by guest
http://jcm.asm
.org/D
ownloaded from

27
700
701
702
703
704
Figure 1. Epifluorescence microscopy images of bacterial endospores, (a, b) B. atrophaeus and 705
(c) G. stearothermophilus. All endospore samples were imaged while suspended in 150 µM ThT 706
aqueous solution (2 mM Tris buffer, pH 8.5, exposure time = 5 s). The spores were incubated in 707
the ThT solution for 10 min prior to imaging. 708
709
on February 28, 2018 by guest
http://jcm.asm
.org/D
ownloaded from

28
c d e f 710
Figure 2. Gray-scale analysis (85) of epifluorescence microscopy images of B. atrophaeus 711
endospores suspended in solutions with various concentrations of ThT (2 mM Tris buffer, pH 712
8.5). (a, b) Fluorescence images (exposure time = 5 s): (a) in the presence of 1 µM ThT and 713
(b) with no dye present. (c, d) Traces from images of spores suspended in different 714
concentrations of ThT recorded at exposure time = (c) 1 s, and (d) 5 s. (e, f) The same traces 715
plotted against expanded ordinates, demonstrating the differences between the baselines of the 716
images with and without dye, ∆I. ∆I represents the contribution of the fluorescence from the free 717
ThT to the backgrounds of the microscope images, ADC. (∆I = 490, 240, 60 and <20 for 100 µM, 718
25 µM, 5 µM and 1 µM ThT at exposure time = 1 s; and ∆I = 4,100, 3,300, 460 and <50 for 100 719
µM, 25 µM, 5 µM and 1 µM ThT at exposure time = 5 s.) The peak signals corresponding to the 720
spores labeled with ThT (i.e., to the dye taken up by the spores) exceed the background 721
fluorescence, ∆I, by more than an order of magnitude: i.e., (⟨∆h⟩ + ∆I) / ∆I > 10. For 1-s 722
exposure time, the baseline RMS = 35, 24, 32, 25 and 35 for 0 µM, 1 µM, 5 µM, 25 µM and 100 723
µM ThT; and for 5-s exposure time, RMS = 75, 65, 92, 96 and 120 for 0 µM, 1 µM, 5 µM, 25 724
µM and 100 µM ThT. 725
a
b
on February 28, 2018 by guest
http://jcm.asm
.org/D
ownloaded from
29
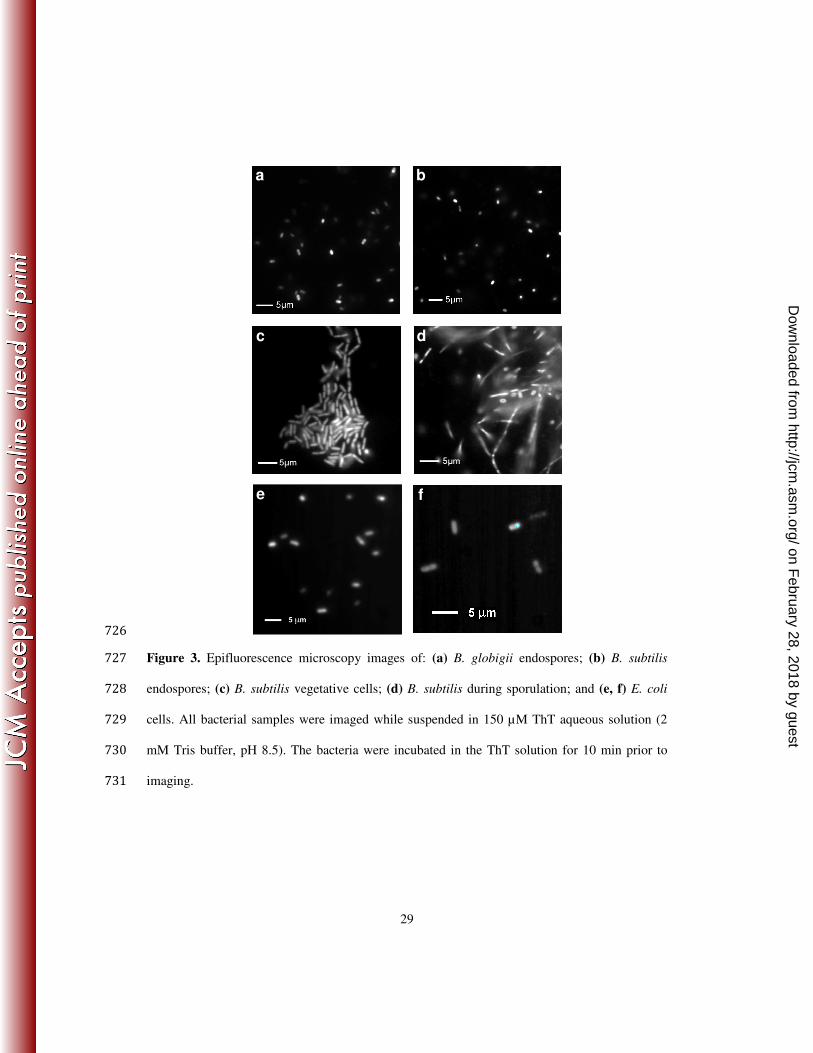
726
Figure 3. Epifluorescence microscopy images of: (a) B. globigii endospores; (b) B. subtilis 727
endospores; (c) B. subtilis vegetative cells; (d) B. subtilis during sporulation; and (e, f) E. coli 728
cells. All bacterial samples were imaged while suspended in 150 µM ThT aqueous solution (2 729
mM Tris buffer, pH 8.5). The bacteria were incubated in the ThT solution for 10 min prior to 730
imaging. 731
a
A
c d
b
A
f e
on February 28, 2018 by guest
http://jcm.asm
.org/D
ownloaded from
30
732
a 733
b c 734
735
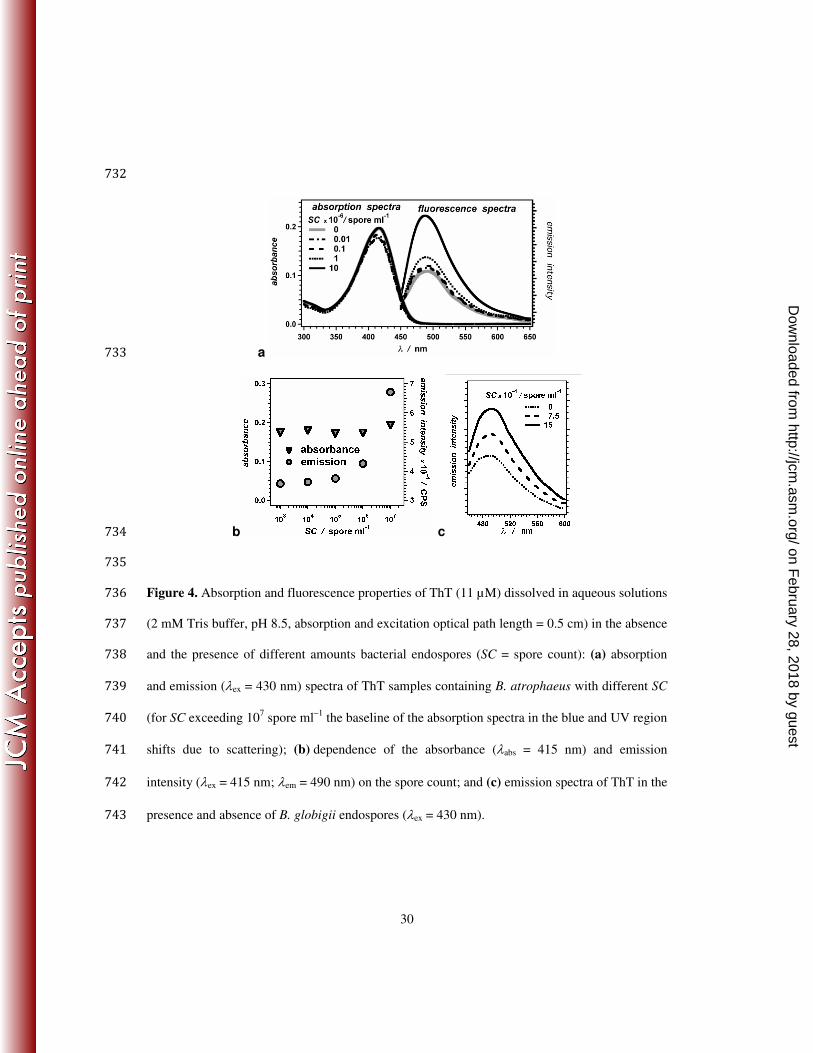
Figure 4. Absorption and fluorescence properties of ThT (11 µM) dissolved in aqueous solutions 736
(2 mM Tris buffer, pH 8.5, absorption and excitation optical path length = 0.5 cm) in the absence 737
and the presence of different amounts bacterial endospores (SC = spore count): (a) absorption 738
and emission (λex = 430 nm) spectra of ThT samples containing B. atrophaeus with different SC 739
(for SC exceeding 107 spore ml
–1 the baseline of the absorption spectra in the blue and UV region 740
shifts due to scattering); (b) dependence of the absorbance (λabs = 415 nm) and emission 741
intensity (λex = 415 nm; λem = 490 nm) on the spore count; and (c) emission spectra of ThT in the 742
presence and absence of B. globigii endospores (λex = 430 nm). 743
on February 28, 2018 by guest
http://jcm.asm
.org/D
ownloaded from

31
a 744
b c 745
Figure 5. Fluorescence properties of ThT (1 µM) dissolved in aqueous solution (4 mM glycine 746
buffer, pH 9.0) in the presence of different amounts of B. subtilis endospores: (a) excitation (λem 747
= 480 nm) and emission (λex = 430 nm) spectra; and (b, c) dependence of the emission intensity 748
(λex = 430 nm) on the spore count (SC). The circles represent the emission intensity at 480 nm, 749
and the dotted lines are data fits. The residuals from the data fits are plotted against a separate 750
ordinate above the data. (b) Linear analysis of the fluorescence dependence on the spore count: 751
F(SC) = F0 + ∆F SC. (c) Nonlinear analysis employing a power-law function (equation 2) to fit 752
the fluorescence dependence on SC. The appropriateness of the function used for data fits was 753
examined using the Durbin-Watson test statistics: DW =δ i −δ i−1( )
2
i=2
n
∑δ i
2
i=1
n
∑, where δi are the 754
residual values at data points i, and n is the total number of data points. 755
on February 28, 2018 by guest
http://jcm.asm
.org/D
ownloaded from
32
a b 756
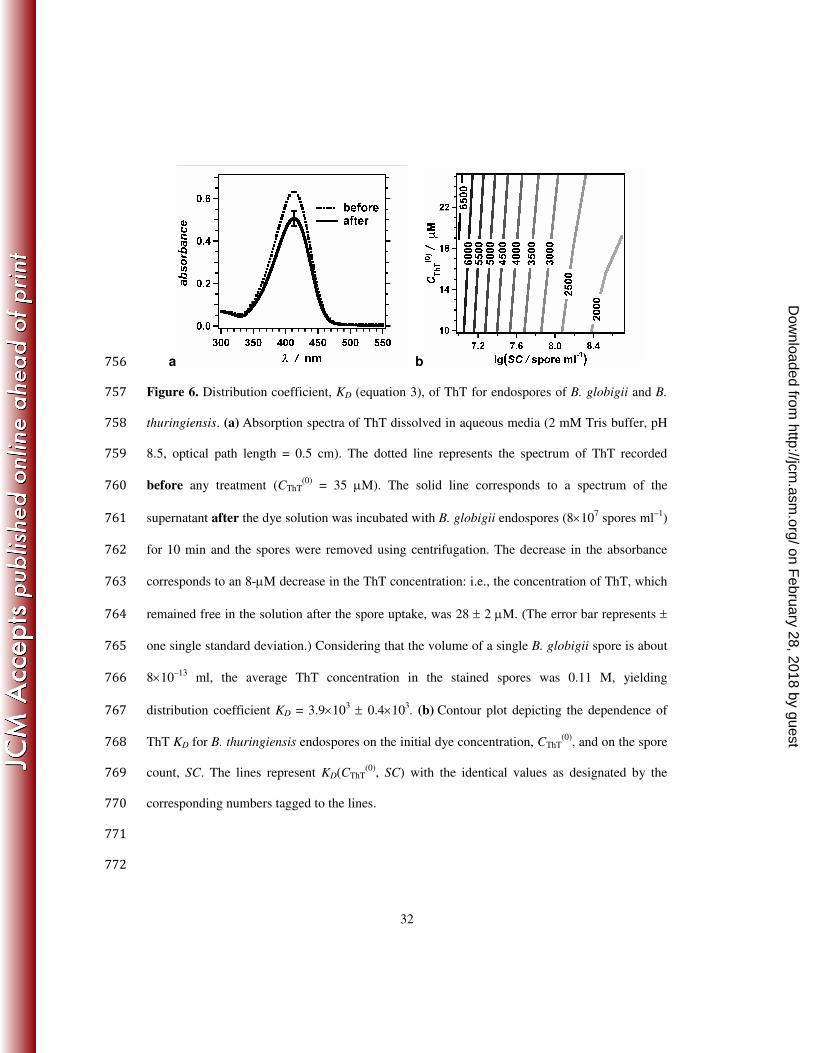
Figure 6. Distribution coefficient, KD (equation 3), of ThT for endospores of B. globigii and B. 757
thuringiensis. (a) Absorption spectra of ThT dissolved in aqueous media (2 mM Tris buffer, pH 758
8.5, optical path length = 0.5 cm). The dotted line represents the spectrum of ThT recorded 759
before any treatment (CThT(0)
= 35 µM). The solid line corresponds to a spectrum of the 760
supernatant after the dye solution was incubated with B. globigii endospores (8×10⁷ spores ml
–1) 761
for 10 min and the spores were removed using centrifugation. The decrease in the absorbance 762
corresponds to an 8-µM decrease in the ThT concentration: i.e., the concentration of ThT, which 763
remained free in the solution after the spore uptake, was 28 ± 2 µM. (The error bar represents ± 764
one single standard deviation.) Considering that the volume of a single B. globigii spore is about 765
8×10–13
ml, the average ThT concentration in the stained spores was 0.11 M, yielding 766
distribution coefficient KD = 3.9×10³ ± 0.4×10
3. (b) Contour plot depicting the dependence of 767
ThT KD for B. thuringiensis endospores on the initial dye concentration, CThT(0)
, and on the spore 768
count, SC. The lines represent KD(CThT(0)
, SC) with the identical values as designated by the 769
corresponding numbers tagged to the lines. 770
771
772
on February 28, 2018 by guest
http://jcm.asm
.org/D
ownloaded from