Embed Size (px)
Citation preview
Amusement Park Physics With a NASA Twist EG–2003–03–010–GRC
1
National Aeronautics andSpace Administration
Educational Product
Teachersand Students Grades 5–9
A Middle School Guidefor Amusement Park Physics Day
Amusement Park Physics Witha NASA Twist
EG–2003–03–010 GRC
Amusement Park Physics With a NASA Twist EG–2003–03–010–GRC
2
Amusement Park Physics With a NASA Twist is available in electronicformat through NASA Spacelink—one of the Agency’s electronic resourcesdeveloped for use by the educational community. This publication and othereducational products may be accessed at the following address: http://spacelink.nasa.gov/products
About the cover: This picture of the Corkscrew was taken at Cedar Point in Sandusky, Ohio.Used with permission. ©1995 Joe Schwartz www.joyrides.com
Amusement Park Physics With a NASA Twist EG–2003–03–010–GRC
3
Amusement Park PhysicsWith a NASA Twist
A Middle School Guidefor Amusement Park Physics Day
National Aeronautics and Space Administration
NASA Glenn Research CenterMicrogravity Science Division
National Center for Microgravity Research on Fluids and CombustionOffice of Educational Programs
NASA HeadquartersOffice of Biological and Physical Research
This publication is in the public domain and is not protected by copyright.Permission is not required for duplication for classroom use.
For all other uses, please give credit to NASA and the authors.
EG–2003–03–010–GRC
B–1073Apr 03

Amusement Park Physics With a NASA Twist EG–2003–03–010–GRC
4
The K–12 Educational Program group at the National Center for Microgravity Research on Fluidsand Combustion developed this educator guide at the NASA Glenn Research Center in Cleveland,Ohio. This publication is a product of 4 years of development and testing with over 1500 students atSix Flags and Cedar Point in Ohio. Special thanks go to the teachers who formally piloted thisprogram with over 900 students. Their feedback was invaluable.
Project manager: Pilot teachers:Carla B. RosenbergNational Center for MicrogravityResearch on Fluids and CombustionCleveland, Ohio
Contributing authors:Carol Hodanbosi, Ph.D.Carla B. RosenbergNational Center for MicrogravityResearch on Fluids and CombustionCleveland, Ohio
Samantha BeresChimayo, New Mexico
Melissa J. B. RogersMacedonia, Ohio
Ann SchwartzEmerson Middle SchoolLakewood, Ohio
Reviewers/editorsRichard DeLombardNASA Glenn Research CenterCleveland, Ohio
Thomas JacobsonNational Center for MicrogravityResearch on Fluids and CombustionCleveland, Ohio
John FellensteinMax Hayes Vocational High SchoolCleveland, Ohio
Acknowledgments
William AltmanHorace Mann Middle SchoolLakewood, Ohio
Megan BolvinRoosevelt Middle SchoolSpringfield, Ohio
Wendy BoothFairport Harbor High SchoolFairport Harbor, Ohio
Matthew BrodaErwine Middle SchoolAkron, Ohio
Rick ChieraBolich Middle SchoolCuyahoga Falls, Ohio
Debbie DobneyMcCormick Middle SchoolWellington, Ohio
Michael EierGlenwood Middle SchoolFindlay, Ohio
Cindy MastEmerson Middle SchoolLakewood, Ohio
James NoldHudson Middle SchoolHudson, Ohio
Elaine PeduzziFord Middle SchoolBrook Park, Ohio
Karen RaylWickliffe Middle SchoolWickliffe, Ohio
Michelle SmithHillside Middle SchoolSeven Hills, Ohio
Special thanks to photographer Joe Schwartz for his permission to use his ©1995 pictures on the following pages:7, 9, 15 (2), 37, 38, 64, 65, 67, 68 (2), 69, 71 (3), 73, 78, 80 (2), 82, 83 (2), 85, 86, 95, 112, 121.
Amusement Park Physics With a NASA Twist EG–2003–03–010–GRC
5
Table of Contents
Introduction ................................................................................................................................ 7Correlation to National Education Standards........................................................................... 11Background .............................................................................................................................. 14Basic Skills ............................................................................................................................... 26
Time .................................................................................................................................. 26Distance ............................................................................................................................ 26Eye Level Height ............................................................................................................... 27Altitude Tracker .................................................................................................................. 28Altitude Tracker Template .................................................................................................. 29Altitude Estimation Methods .............................................................................................. 31 Scale Drawing Method .................................................................................................. 31Altitude Tracker Worksheet ................................................................................................ 32Flagpole Height Worksheet ............................................................................................... 34Structure Estimation .......................................................................................................... 35Structure Estimation Worksheet ........................................................................................ 37Accelerometer ................................................................................................................... 39Errors in Measurement ...................................................................................................... 41
Classroom Activities ................................................................................................................. 43Pendulums—Part 1 ........................................................................................................... 45Pendulums—Part 2 ........................................................................................................... 47Collisions—Part 1 .............................................................................................................. 49Collisions—Part 2 .............................................................................................................. 50Marble Run—Part 1........................................................................................................... 52Marble Run—Part 2........................................................................................................... 53Marble Run—Part 3........................................................................................................... 55Marble Run—Part 4........................................................................................................... 57
NASA Connection .................................................................................................................... 59Student Reading Guide ..................................................................................................... 61Student Reading Guide Answer Key ................................................................................. 62Free-Fall Rides .................................................................................................................. 64Roller Coasters.................................................................................................................. 65Bumper Cars ..................................................................................................................... 66Carousels .......................................................................................................................... 67Roller Coasters—Loops .................................................................................................... 68Pendulum Rides ................................................................................................................ 69
Ride Work Book ....................................................................................................................... 71Free-Fall Rides .................................................................................................................. 73Roller Coasters—Initial Hill ............................................................................................... 75Bumper Cars ..................................................................................................................... 77Roller Coasters—Floater Hills ........................................................................................... 79Carousels .......................................................................................................................... 81Roller Coasters—Loops .................................................................................................... 82Pendulum Rides ................................................................................................................ 84Worksheets for Nonattending Students............................................................................. 86
Amusement Park Physics With a NASA Twist EG–2003–03–010–GRC
6
Answer Key .............................................................................................................................. 98Pendulums—Part 1 ........................................................................................................... 98Pendulums—Part 2 ......................................................................................................... 100Collisions—Part 1 ............................................................................................................ 102Collisions—Part 2 ............................................................................................................ 103Marble Run—Part 1......................................................................................................... 105Marble Run—Part 2......................................................................................................... 106Marble Run—Part 3......................................................................................................... 108Marble Run—Part 4......................................................................................................... 110Free-Fall Rides ................................................................................................................ 112Roller Coasters—Initial Hill ............................................................................................. 114Bumper Cars ................................................................................................................... 116Roller Coasters—Floater Hills ......................................................................................... 118Carousels ........................................................................................................................ 120Roller Coaster—Loops .................................................................................................... 121Pendulum Rides .............................................................................................................. 122
Tests ....................................................................................................................................... 125Pretest ............................................................................................................................. 127Pretest Answer Key ......................................................................................................... 128Post Test .......................................................................................................................... 129Post Test Answer Key ...................................................................................................... 130
Forms and Extras ................................................................................................................... 131Announcement and Contract .......................................................................................... 133Permission, Emergency Information, and Refusal of Consent ....................................... 134Ride Station Rotation Chart ............................................................................................ 135Eye Level Height and Stepping Estimation Record ........................................................ 136Classroom Master Materials List ..................................................................................... 137Amusement Park Day Master Materials List ................................................................... 138Bus List ............................................................................................................................ 139Ride Attendance Form .................................................................................................... 140
Resources .............................................................................................................................. 141Vocabulary ....................................................................................................................... 143List of Formulas ............................................................................................................... 144Amusement Park Physics and Related Web Sites.......................................................... 145NASA Resources for Educators ...................................................................................... 146
Amusement Park Physics With a NASA Twist EG–2003–03–010–GRC
7
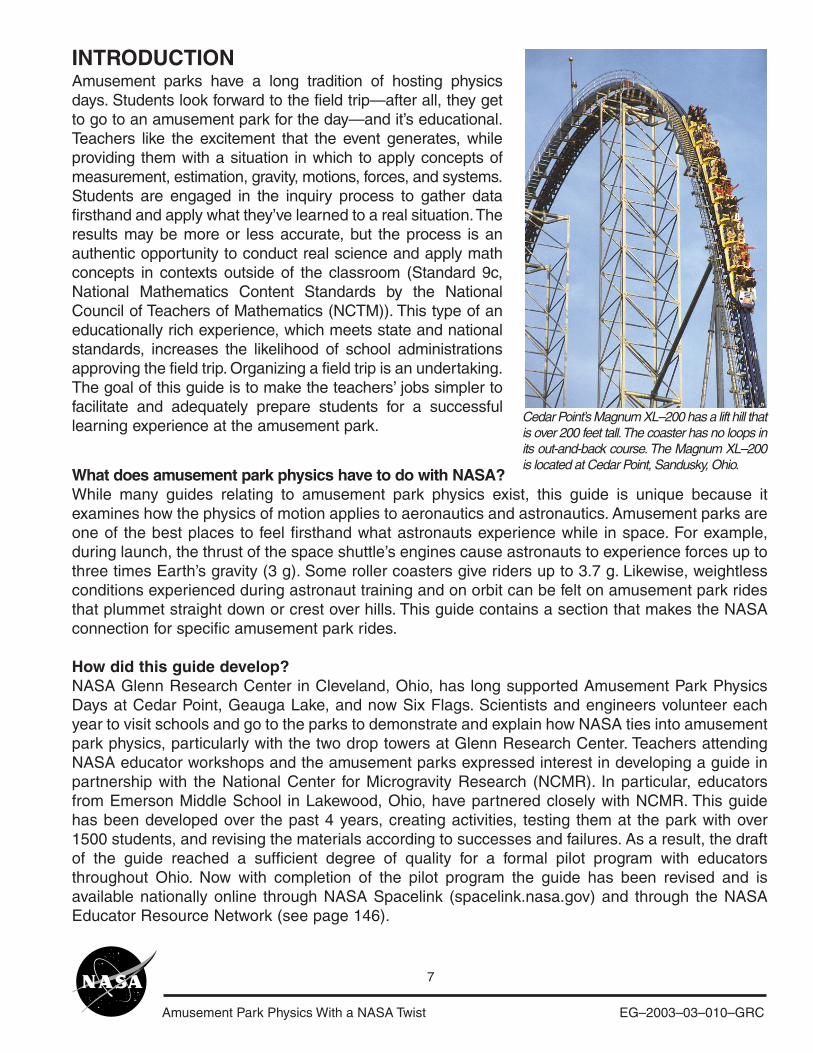
What does amusement park physics have to do with NASA?While many guides relating to amusement park physics exist, this guide is unique because itexamines how the physics of motion applies to aeronautics and astronautics. Amusement parks areone of the best places to feel firsthand what astronauts experience while in space. For example,during launch, the thrust of the space shuttle’s engines cause astronauts to experience forces up tothree times Earth’s gravity (3 g). Some roller coasters give riders up to 3.7 g. Likewise, weightlessconditions experienced during astronaut training and on orbit can be felt on amusement park ridesthat plummet straight down or crest over hills. This guide contains a section that makes the NASAconnection for specific amusement park rides.
How did this guide develop?NASA Glenn Research Center in Cleveland, Ohio, has long supported Amusement Park PhysicsDays at Cedar Point, Geauga Lake, and now Six Flags. Scientists and engineers volunteer eachyear to visit schools and go to the parks to demonstrate and explain how NASA ties into amusementpark physics, particularly with the two drop towers at Glenn Research Center. Teachers attendingNASA educator workshops and the amusement parks expressed interest in developing a guide inpartnership with the National Center for Microgravity Research (NCMR). In particular, educatorsfrom Emerson Middle School in Lakewood, Ohio, have partnered closely with NCMR. This guidehas been developed over the past 4 years, creating activities, testing them at the park with over1500 students, and revising the materials according to successes and failures. As a result, the draftof the guide reached a sufficient degree of quality for a formal pilot program with educatorsthroughout Ohio. Now with completion of the pilot program the guide has been revised and isavailable nationally online through NASA Spacelink (spacelink.nasa.gov) and through the NASAEducator Resource Network (see page 146).
Cedar Point’s Magnum XL–200 has a lift hill thatis over 200 feet tall. The coaster has no loops inits out-and-back course. The Magnum XL–200is located at Cedar Point, Sandusky, Ohio.
INTRODUCTIONAmusement parks have a long tradition of hosting physicsdays. Students look forward to the field trip—after all, they getto go to an amusement park for the day—and it’s educational.Teachers like the excitement that the event generates, whileproviding them with a situation in which to apply concepts ofmeasurement, estimation, gravity, motions, forces, and systems.Students are engaged in the inquiry process to gather datafirsthand and apply what they’ve learned to a real situation. Theresults may be more or less accurate, but the process is anauthentic opportunity to conduct real science and apply mathconcepts in contexts outside of the classroom (Standard 9c,National Mathematics Content Standards by the NationalCouncil of Teachers of Mathematics (NCTM)). This type of aneducationally rich experience, which meets state and nationalstandards, increases the likelihood of school administrationsapproving the field trip. Organizing a field trip is an undertaking.The goal of this guide is to make the teachers’ jobs simpler tofacilitate and adequately prepare students for a successfullearning experience at the amusement park.
Amusement Park Physics With a NASA Twist EG–2003–03–010–GRC
8
For what grades is this guide appropriate?Many amusement park physics guides are geared toward high school level science andmathematics classes. This guide does not require knowledge of trigonometry or calculus. Theintended audience is primarily students in seventh through ninth grades. Since high school levelmathematics are not used and the measurement tools are fairly low-end technologies, and notterribly accurate, the emphasis is less on getting the “correct” answer and more about makingreasonable estimations and the thinking process. Note, upper elementary school teachers havefound this guide to be appropriate for classes for gifted and talented students. However, this agegroup may lack the necessary motor skills to operate stop watches and take consistent altitudetracker readings.
How is this amusement park guide different from other guides?Most amusement park physics guides focus primarily on problem sets and are geared towardsusing trigonometry and calculus. This is a middle school guide that makes the NASA connection tothe rides. All of the activities are centered on preparing students to complete worksheets for specificrides. The science and mathematics teachers can prepare students to use a single method orseveral methods for gathering the data. In addition, the guide is geared to help plan and run asuccessful field trip. After having many amusement park field trips, in all types of weather, with alltypes of students, and involving teachers of many different subjects, we have learned a lot aboutwhat works and what does not. Included in this guide you will find what the teachers found to bemost essential in preparing and running this field trip.
How to use this guideThe sections found in the guide include
• Background Information—covers amusement park physics, gravity, forces and motion, and microgravity. This information is for the teacher, but may also be given out to the students.
• Basic Skills—discusses skills needed to do classroom activities and ride work sheets at the amusement park. Skills involve using a stopwatch, walking baselines, taking altimeter
readings, calculating heights and speeds, and making and using accelerometers.• Classroom Activities—contains 2 weeks worth of activities designed to provide students
with skills needed to complete ride worksheets at the park.• NASA Connections—makes the NASA tie-in with each amusement park ride.• Ride Worksheets—can be used as a workbook for specific rides at the amusement park.• Answer Key—gives approximate answers for each of the classroom activities and
ride worksheets.• Tests—provides a pretest and post test to show students and teachers how much they have
learned from this unit on motion and forces.• Forms and Extras—includes tips and forms to help get the trip organized and methods for
facilitating a successful experience at the park.• Resources—covers vocabulary, formula list, Web sites, and other useful NASA resources for
educators.
Amusement Park Physics With a NASA Twist EG–2003–03–010–GRC
9
To get a sense of the scope of the content, read through the Ride Worksheets and Answer Keysections first. Remember that for middle school students, the emphasis is less on getting a “correct”answer than using the problem-solving process. The measurement tools are not highly accurate,but if used correctly can provide comparative values. The basic skills and classroom activitiesprepare students to successfully complete the ride worksheets at the park. If you or your students needmore science and math information related to forces and motion, consult the background information.The Background Information section can be used as a student handout or as a teacher reference.
Plan on spending at least 2 weeks prior to the spring field trip working on the classroom activities.Ideally, the science and mathematics teachers should work closely together to coordinate teachingbasic skills. One option is to begin the unit with the pretest to see what students know about motionand forces. Then give the post test after the field trip to see what the students have learned. TheEnglish teacher can assist in the preparation process too by reinforcing or even introducing theNASA Connections section with a worksheet activity.
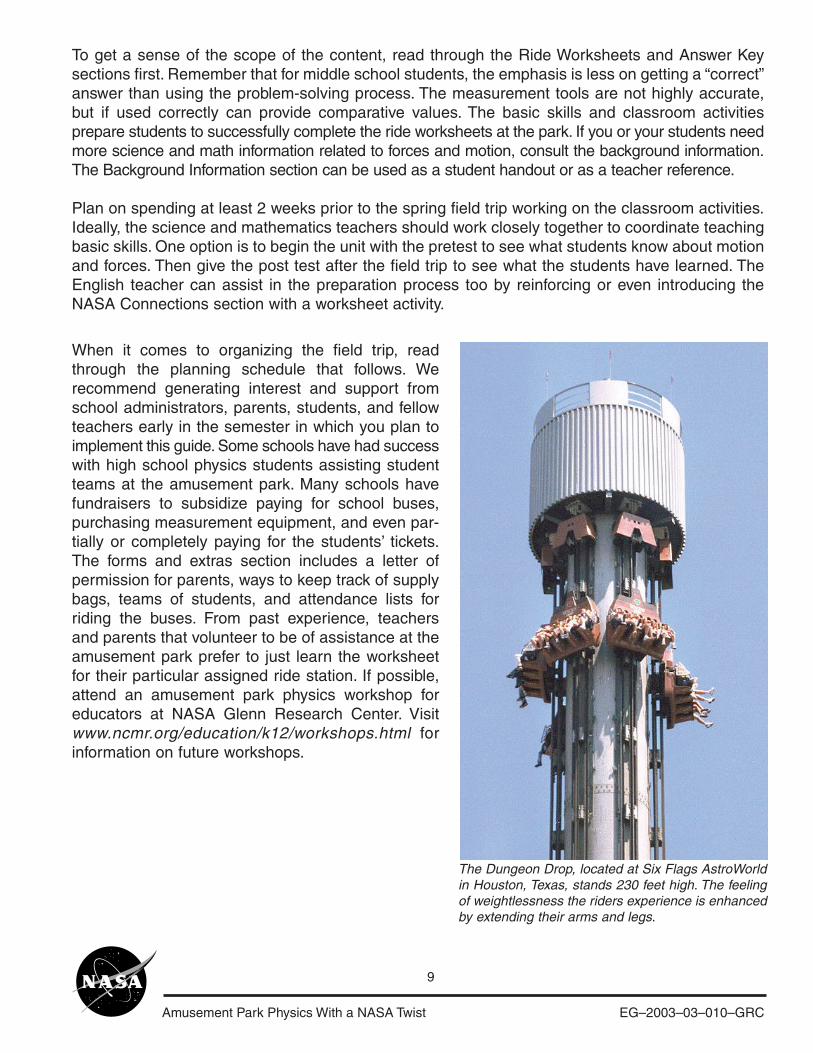
The Dungeon Drop, located at Six Flags AstroWorldin Houston, Texas, stands 230 feet high. The feelingof weightlessness the riders experience is enhancedby extending their arms and legs.
When it comes to organizing the field trip, readthrough the planning schedule that follows. Werecommend generating interest and support fromschool administrators, parents, students, and fellowteachers early in the semester in which you plan toimplement this guide. Some schools have had successwith high school physics students assisting studentteams at the amusement park. Many schools havefundraisers to subsidize paying for school buses,purchasing measurement equipment, and even par-tially or completely paying for the students’ tickets.The forms and extras section includes a letter ofpermission for parents, ways to keep track of supplybags, teams of students, and attendance lists forriding the buses. From past experience, teachersand parents that volunteer to be of assistance at theamusement park prefer to just learn the worksheetfor their particular assigned ride station. If possible,attend an amusement park physics workshop foreducators at NASA Glenn Research Center. Visitwww.ncmr.org/education/k12/workshops.html forinformation on future workshops.
Amusement Park Physics With a NASA Twist EG–2003–03–010–GRC
10
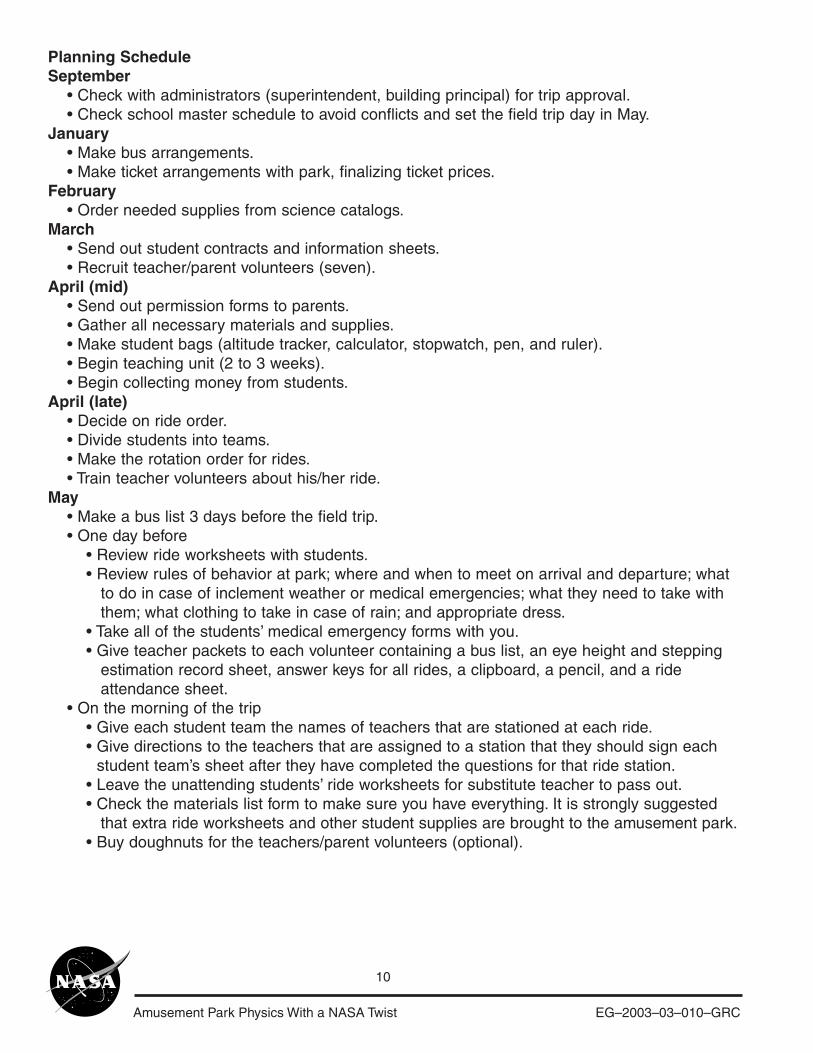
Planning ScheduleSeptember
• Check with administrators (superintendent, building principal) for trip approval.• Check school master schedule to avoid conflicts and set the field trip day in May.
January• Make bus arrangements.• Make ticket arrangements with park, finalizing ticket prices.
February• Order needed supplies from science catalogs.
March• Send out student contracts and information sheets.• Recruit teacher/parent volunteers (seven).
April (mid)• Send out permission forms to parents.• Gather all necessary materials and supplies.• Make student bags (altitude tracker, calculator, stopwatch, pen, and ruler).• Begin teaching unit (2 to 3 weeks).• Begin collecting money from students.
April (late)• Decide on ride order.• Divide students into teams.• Make the rotation order for rides.• Train teacher volunteers about his/her ride.
May• Make a bus list 3 days before the field trip.• One day before
• Review ride worksheets with students.• Review rules of behavior at park; where and when to meet on arrival and departure; what
to do in case of inclement weather or medical emergencies; what they need to take with them; what clothing to take in case of rain; and appropriate dress.
• Take all of the students’ medical emergency forms with you.• Give teacher packets to each volunteer containing a bus list, an eye height and stepping
estimation record sheet, answer keys for all rides, a clipboard, a pencil, and a ride attendance sheet.
• On the morning of the trip• Give each student team the names of teachers that are stationed at each ride.• Give directions to the teachers that are assigned to a station that they should sign each
student team’s sheet after they have completed the questions for that ride station.• Leave the unattending students’ ride worksheets for substitute teacher to pass out.• Check the materials list form to make sure you have everything. It is strongly suggested
that extra ride worksheets and other student supplies are brought to the amusement park.• Buy doughnuts for the teachers/parent volunteers (optional).

Amusement Park Physics With a NASA Twist EG–2003–03–010–GRC
11
National Science Education Standards, Grades 5–8by the National Research Council, 1996
Mathematics Principles and Standards for Schools, Grades 5–8by the National Council of Teachers of Mathematics, 2000
Science Standard
Basic Skills
Altimeterangles
Flagpoleheight
Structureestimation
NASAconnection
Unifying Concept and Processes Evidence, models, and organization Change, constancy, and explanationScience as Inquiry Abilities necessary to do scientific inquiry Understanding scientific inquiryPhysical Science Motions and forces Transfer of energyScience and Technology Understanding science and technologyScience in Personal and Social Perspectives Risk and benefits Science and technology in societyHistory and Nature of Science Nature of science History of science
Mathematics Standard
Basic Skills
Altimeterangles
Flagpoleheight
Structureestimation
NASAconnection
Number and Operations Representing numbers Meanings of operations Compute fluentlyAlgebra Mathematical modelsGeometry Apply transformation Use visualizationMeasurement Measurable attributes Appropriate techniques, tools, formulasProblemsolving Build new math knowledge Solve problems that arise Apply appropriate strategiesConnections Apply math in contexts outside of mathRepresentation Use representations to model world phenomena
Amusement Park Physics With a NASA Twist EG–2003–03–010–GRC
12
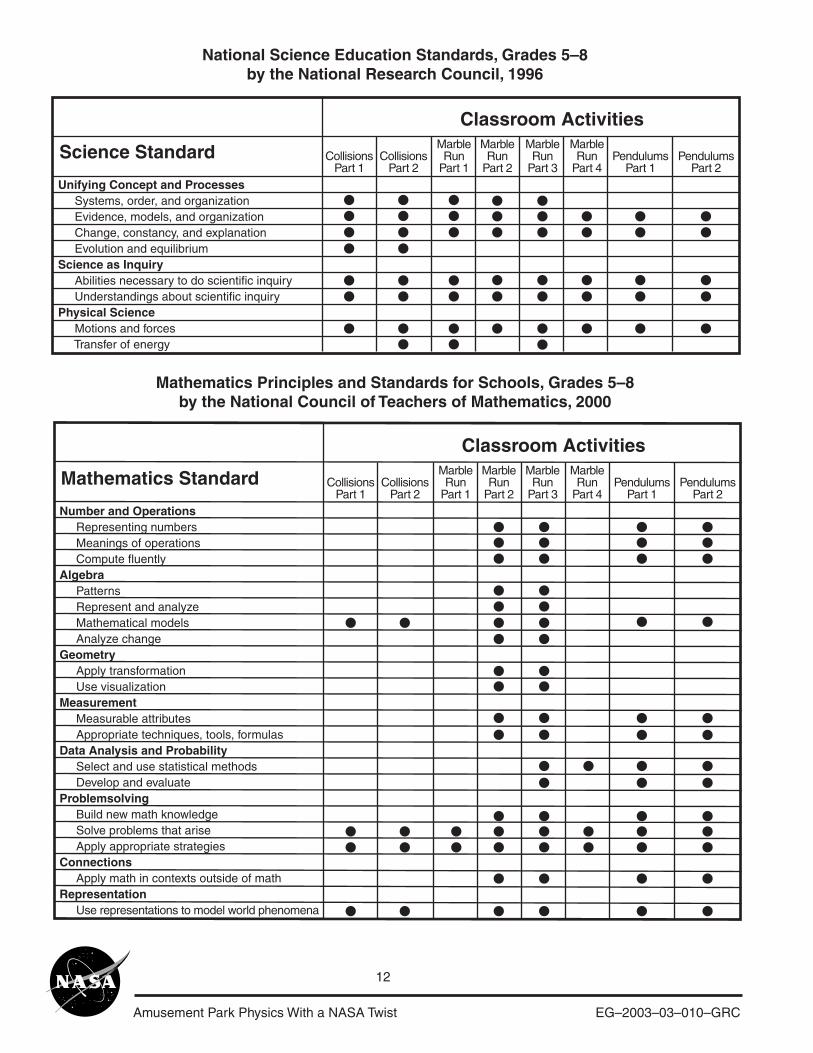
National Science Education Standards, Grades 5–8by the National Research Council, 1996
Mathematics Principles and Standards for Schools, Grades 5–8by the National Council of Teachers of Mathematics, 2000
Science Standard
Classroom Activities
CollisionsPart 1
CollisionsPart 2
PendulumsPart 1
PendulumsPart 2
MarbleRun
Part 1
MarbleRun
Part 2
MarbleRun
Part 3
MarbleRun
Part 4Unifying Concept and Processes Systems, order, and organization Evidence, models, and organization Change, constancy, and explanation Evolution and equilibriumScience as Inquiry Abilities necessary to do scientific inquiry Understandings about scientific inquiryPhysical Science Motions and forces Transfer of energy
Mathematics Standard
Classroom Activities
CollisionsPart 1
CollisionsPart 2
PendulumsPart 1
PendulumsPart 2
MarbleRun
Part 1
MarbleRun
Part 2Number and Operations Representing numbers Meanings of operations Compute fluentlyAlgebra Patterns Represent and analyze Mathematical models Analyze changeGeometry Apply transformation Use visualizationMeasurement Measurable attributes Appropriate techniques, tools, formulasData Analysis and Probability Select and use statistical methods Develop and evaluateProblemsolving Build new math knowledge Solve problems that arise Apply appropriate strategiesConnections Apply math in contexts outside of mathRepresentation Use representations to model world phenomena
MarbleRun
Part 3
MarbleRun
Part 4

Amusement Park Physics With a NASA Twist EG–2003–03–010–GRC
13
National Science Education Standards, Grades 5–8by the National Research Council, 1996
Mathematics Principles and Standards for Schools, Grades 5–8by the National Council of Teachers of Mathematics, 2000
Science Standard
Ride WorksheetsBumperCars:
Collisions CarouselFree-Fall
RidePendulum
Ride
RollerCoaster:
Floater Hills
RollerCoaster:
Loop
RollerCoaster:Initial Hill
Unifying Concept and Processes Systems, order, and organization Evidence, models, and organization Change, constancy, and explanationScience as Inquiry Abilities necessary to do scientific inquiry Understanding scientific inquiryPhysical Science Motions and forces Transfer of energy
Mathematics Standard
Number and Operations Representing numbers Meanings of operations Compute fluentlyAlgebra Patterns Represent and analyze Mathematical models Analyze changeGeometry Apply transformation Use visualizationMeasurement Measurable attributes Appropriate techniques, tools, formulasData Analysis and Probability Select and use statistical methodsProblemsolving Build new math knowledge Solve problems that arise Apply appropriate strategiesConnections Apply math in contexts outside of mathRepresentation Use representations to model world phenomena
Ride WorksheetsBumperCars:
Collisions CarouselFree-Fall
RidePendulum
Ride
RollerCoaster:
Floater Hills
RollerCoaster:
Loop
RollerCoaster:Initial Hill
Amusement Park Physics With a NASA Twist EG–2003–03–010–GRC
14
BACKGROUNDWhy are amusement park rides so much fun? The rollercoasters, free-fall, and pendulum rides are exhilarating, if notterrifying. Think about how the motion of a ride heightensone’s senses. The roller coaster creeps to the top of a hillslowly. Anticipation builds. As it crests the hill, the car seemssuspended for a moment before it thunders down and the carand rider are falling fast. It feels like one might fly out of thecar if not for the safety restraints. The boat ride that swingslike a pendulum looks harmless, but as it swings higher andhigher in its arc, the rider comes off his or her seat. One feelssuspended in midair just long enough to give one’s stomach aflutter.
Believe it or not, science explains the thrills one experienceson the roller coaster and other rides. An amusement park is agreat place to study motions and forces, and somethingdifferent called microgravity.
MicrogravityMicrogravity is not what it sounds like. Although “micro”means small, “microgravity” does not mean a little bit ofgravity; it means that some of the effects of gravity areminimized. Amusement park rides provide brief glimpses ofwhat astronauts experience in the microgravity of orbit—asense of weightlessness. The gravitational pull in an amuse-ment park does not change from place to place, but one willexperience a sensation of feeling heavier, lighter, evenweightless, on some rides.
Motion Makes All the CommotionAmusement park rides are exciting because of a commonelement that they all share. What do merry-go-rounds, ferriswheels, flume rides, and bumper cars have in common? Allthese rides have motion. What would a roller coaster bewithout motion? It is the motion of a ride that can move one insuch a way that one feels heavy, as if gravity becamestronger. The motion can also let one fall for a second ormore, making one feel light or weightless. Motions canchange the effect that gravity has on one’s body, enough tocreate a microgravity environment.
Three types of motion found at amusement parks relate to thesensations one feels—linear motion, curved motion, andcircular motion. Linear motion describes an object that movesin a straight line. Bumper cars move in a horizontal, linear
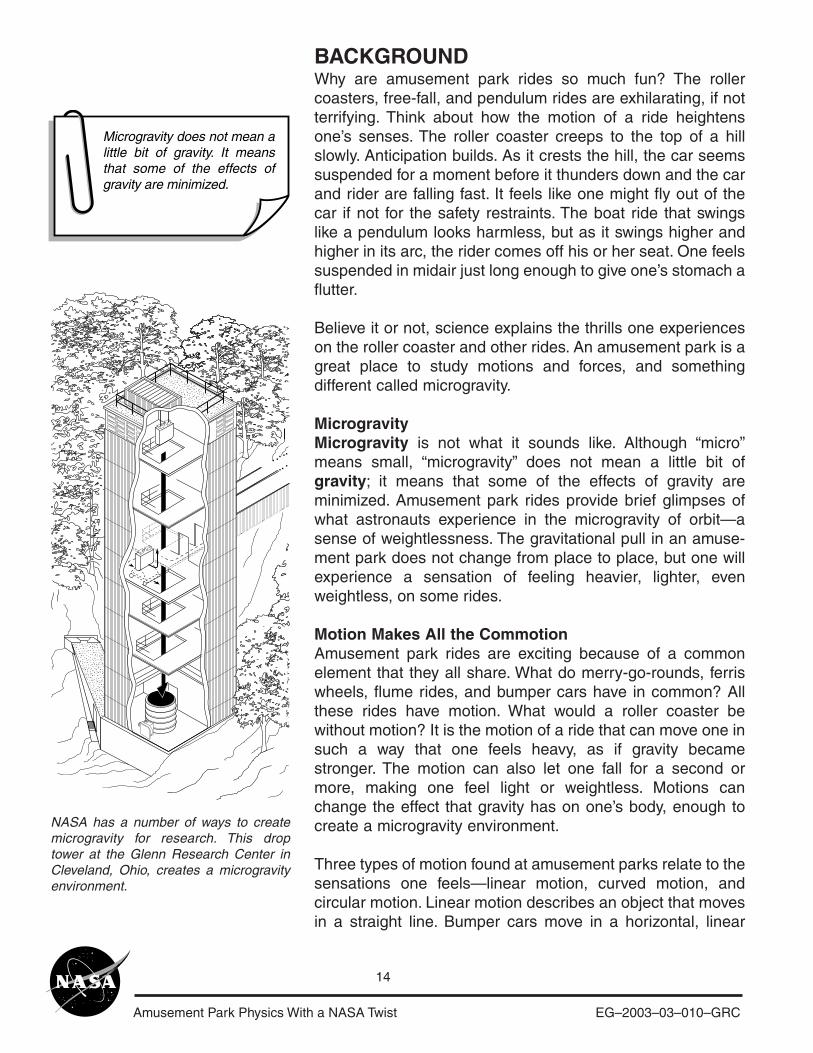
NASA has a number of ways to createmicrogravity for research. This droptower at the Glenn Research Center inCleveland, Ohio, creates a microgravityenvironment.
Microgravity does not mean a little bit of gravity. It means that some of the effects of gravity are minimized.
Amusement Park Physics With a NASA Twist EG–2003–03–010–GRC
15
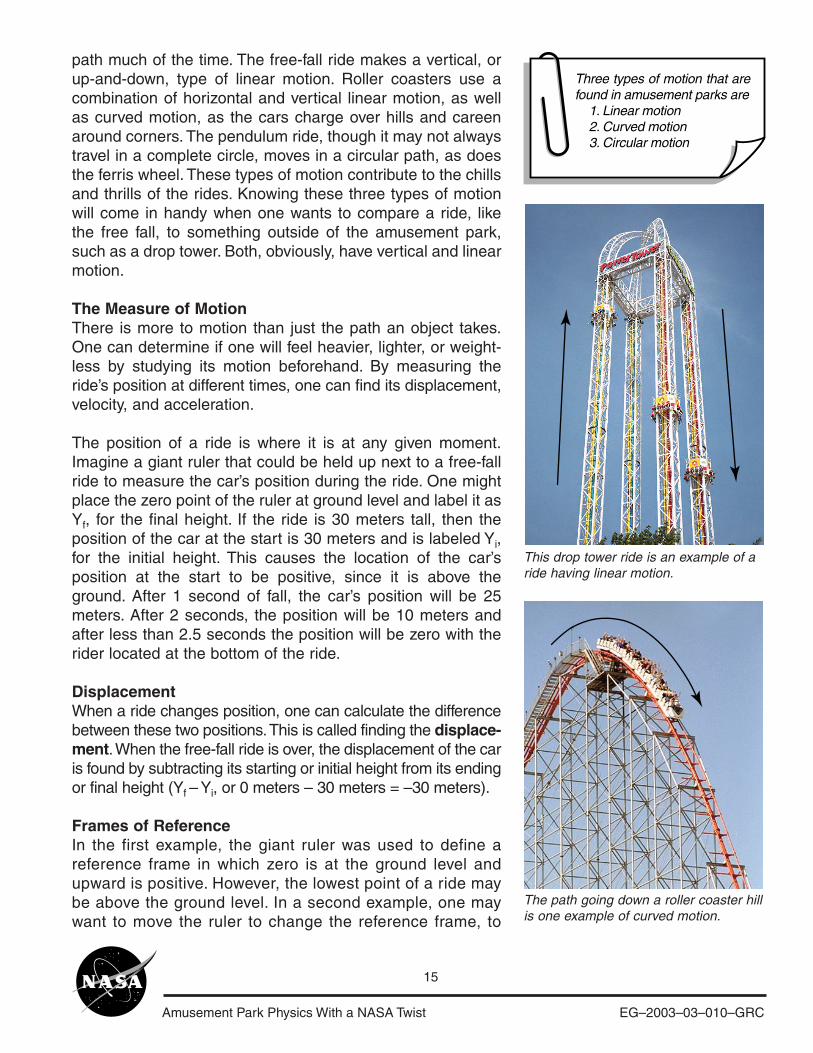
path much of the time. The free-fall ride makes a vertical, orup-and-down, type of linear motion. Roller coasters use acombination of horizontal and vertical linear motion, as wellas curved motion, as the cars charge over hills and careenaround corners. The pendulum ride, though it may not alwaystravel in a complete circle, moves in a circular path, as doesthe ferris wheel. These types of motion contribute to the chillsand thrills of the rides. Knowing these three types of motionwill come in handy when one wants to compare a ride, likethe free fall, to something outside of the amusement park,such as a drop tower. Both, obviously, have vertical and linearmotion.
The Measure of MotionThere is more to motion than just the path an object takes.One can determine if one will feel heavier, lighter, or weight-less by studying its motion beforehand. By measuring theride’s position at different times, one can find its displacement,velocity, and acceleration.
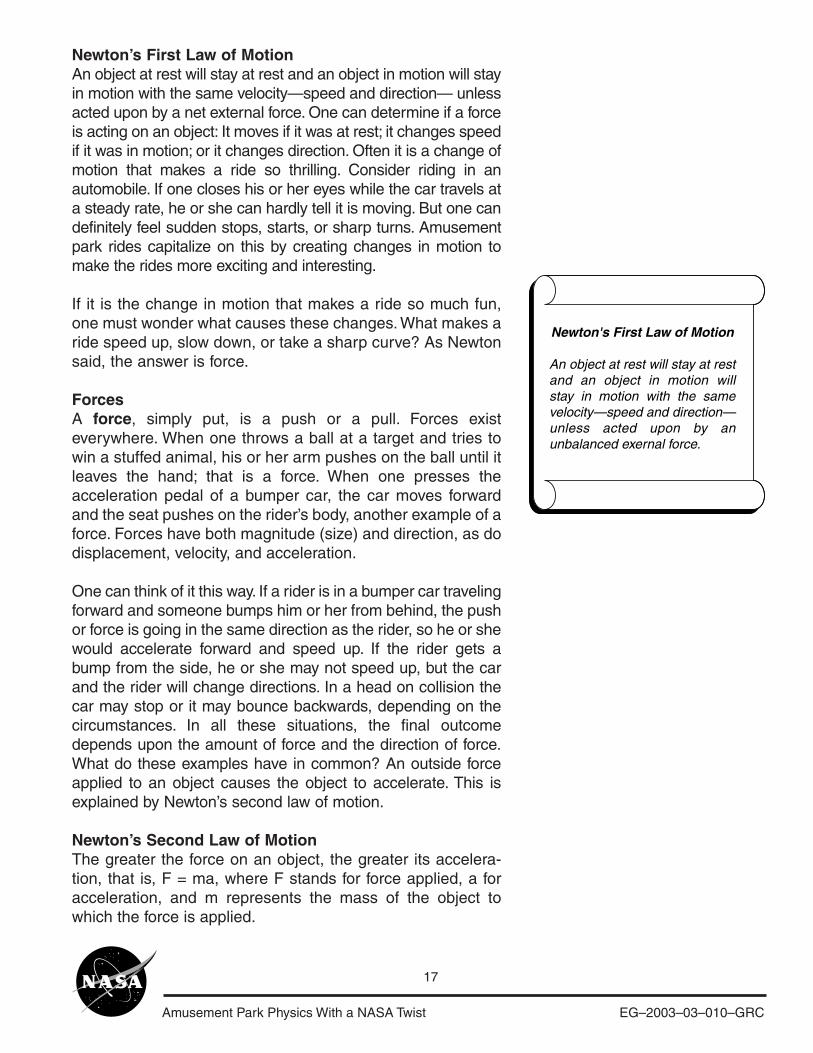
The position of a ride is where it is at any given moment.Imagine a giant ruler that could be held up next to a free-fallride to measure the car’s position during the ride. One mightplace the zero point of the ruler at ground level and label it asYf, for the final height. If the ride is 30 meters tall, then theposition of the car at the start is 30 meters and is labeled Yi,for the initial height. This causes the location of the car’sposition at the start to be positive, since it is above theground. After 1 second of fall, the car’s position will be 25meters. After 2 seconds, the position will be 10 meters andafter less than 2.5 seconds the position will be zero with therider located at the bottom of the ride.
DisplacementWhen a ride changes position, one can calculate the differencebetween these two positions. This is called finding the displace-ment. When the free-fall ride is over, the displacement of the caris found by subtracting its starting or initial height from its endingor final height (Yf – Yi, or 0 meters – 30 meters = –30 meters).
Frames of ReferenceIn the first example, the giant ruler was used to define areference frame in which zero is at the ground level andupward is positive. However, the lowest point of a ride maybe above the ground level. In a second example, one maywant to move the ruler to change the reference frame, to
Three types of motion that are found in amusement parks are 1. Linear motion 2. Curved motion 3. Circular motion
This drop tower ride is an example of aride having linear motion.
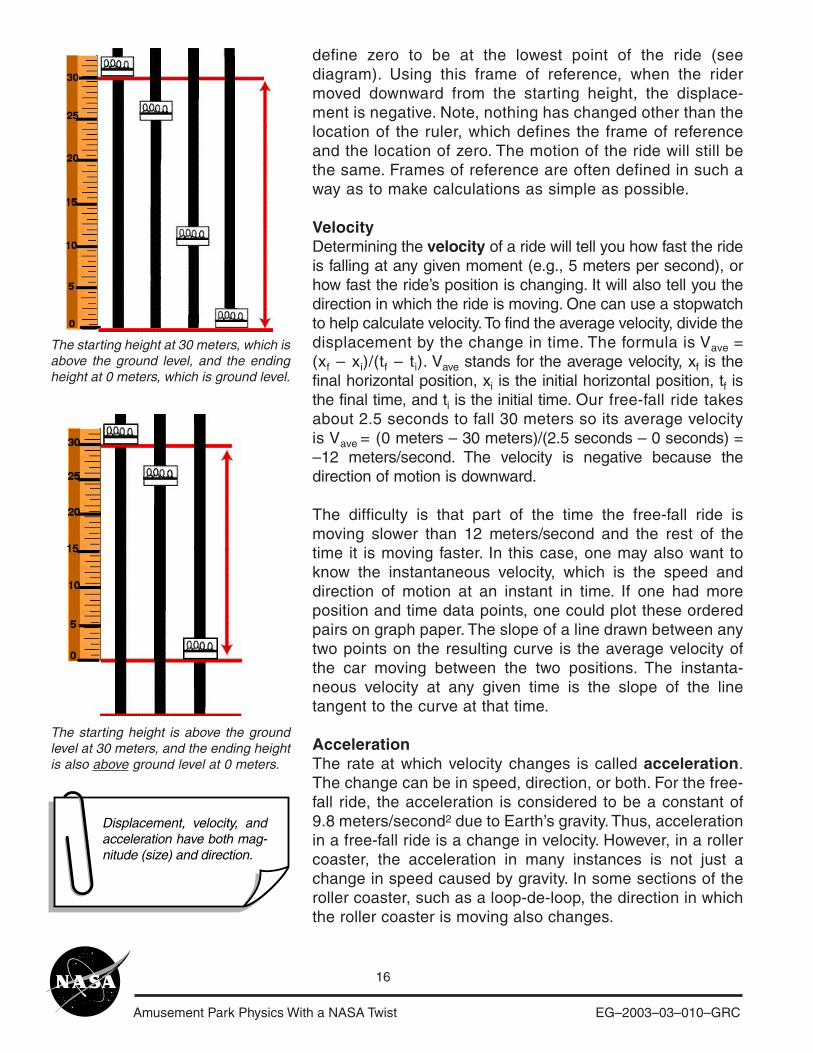
The path going down a roller coaster hillis one example of curved motion.
Amusement Park Physics With a NASA Twist EG–2003–03–010–GRC
16
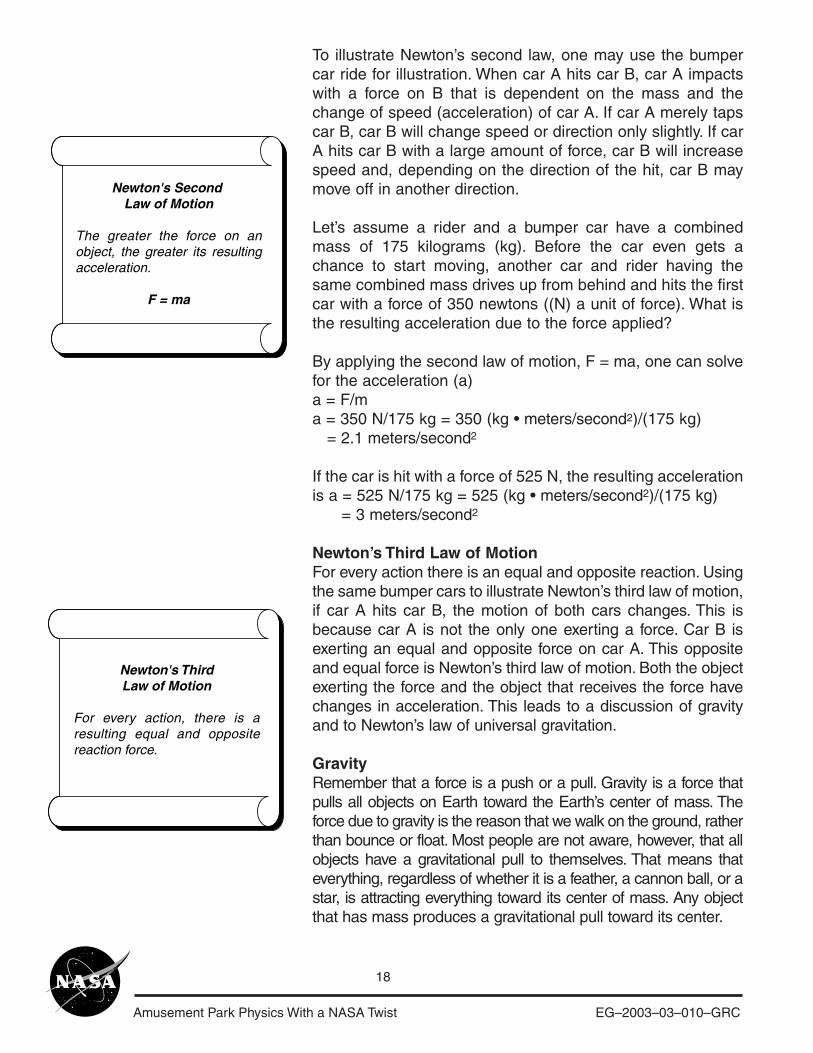
define zero to be at the lowest point of the ride (seediagram). Using this frame of reference, when the ridermoved downward from the starting height, the displace-ment is negative. Note, nothing has changed other than thelocation of the ruler, which defines the frame of referenceand the location of zero. The motion of the ride will still bethe same. Frames of reference are often defined in such away as to make calculations as simple as possible.
VelocityDetermining the velocity of a ride will tell you how fast the rideis falling at any given moment (e.g., 5 meters per second), orhow fast the ride’s position is changing. It will also tell you thedirection in which the ride is moving. One can use a stopwatchto help calculate velocity. To find the average velocity, divide thedisplacement by the change in time. The formula is Vave =(xf – xi)/(tf – ti). Vave stands for the average velocity, xf is thefinal horizontal position, xi is the initial horizontal position, tf isthe final time, and ti is the initial time. Our free-fall ride takesabout 2.5 seconds to fall 30 meters so its average velocityis Vave
= (0 meters – 30 meters)/(2.5 seconds – 0 seconds) =–12 meters/second. The velocity is negative because thedirection of motion is downward.
The difficulty is that part of the time the free-fall ride ismoving slower than 12 meters/second and the rest of thetime it is moving faster. In this case, one may also want toknow the instantaneous velocity, which is the speed anddirection of motion at an instant in time. If one had moreposition and time data points, one could plot these orderedpairs on graph paper. The slope of a line drawn between anytwo points on the resulting curve is the average velocity ofthe car moving between the two positions. The instanta-neous velocity at any given time is the slope of the linetangent to the curve at that time.
AccelerationThe rate at which velocity changes is called acceleration.The change can be in speed, direction, or both. For the free-fall ride, the acceleration is considered to be a constant of9.8 meters/second2 due to Earth’s gravity. Thus, accelerationin a free-fall ride is a change in velocity. However, in a rollercoaster, the acceleration in many instances is not just achange in speed caused by gravity. In some sections of theroller coaster, such as a loop-de-loop, the direction in whichthe roller coaster is moving also changes.
Displacement, velocity, and acceleration have both mag-nitude (size) and direction.
The starting height is above the groundlevel at 30 meters, and the ending heightis also above ground level at 0 meters.
The starting height at 30 meters, which isabove the ground level, and the endingheight at 0 meters, which is ground level.
Amusement Park Physics With a NASA Twist EG–2003–03–010–GRC
17
Newton’s First Law of MotionAn object at rest will stay at rest and an object in motion will stayin motion with the same velocity—speed and direction— unlessacted upon by a net external force. One can determine if a forceis acting on an object: It moves if it was at rest; it changes speedif it was in motion; or it changes direction. Often it is a change ofmotion that makes a ride so thrilling. Consider riding in anautomobile. If one closes his or her eyes while the car travels ata steady rate, he or she can hardly tell it is moving. But one candefinitely feel sudden stops, starts, or sharp turns. Amusementpark rides capitalize on this by creating changes in motion tomake the rides more exciting and interesting.
If it is the change in motion that makes a ride so much fun,one must wonder what causes these changes. What makes aride speed up, slow down, or take a sharp curve? As Newtonsaid, the answer is force.
ForcesA force, simply put, is a push or a pull. Forces existeverywhere. When one throws a ball at a target and tries towin a stuffed animal, his or her arm pushes on the ball until itleaves the hand; that is a force. When one presses theacceleration pedal of a bumper car, the car moves forwardand the seat pushes on the rider’s body, another example of aforce. Forces have both magnitude (size) and direction, as dodisplacement, velocity, and acceleration.
One can think of it this way. If a rider is in a bumper car travelingforward and someone bumps him or her from behind, the pushor force is going in the same direction as the rider, so he or shewould accelerate forward and speed up. If the rider gets abump from the side, he or she may not speed up, but the carand the rider will change directions. In a head on collision thecar may stop or it may bounce backwards, depending on thecircumstances. In all these situations, the final outcomedepends upon the amount of force and the direction of force.What do these examples have in common? An outside forceapplied to an object causes the object to accelerate. This isexplained by Newton’s second law of motion.
Newton’s Second Law of MotionThe greater the force on an object, the greater its accelera-tion, that is, F = ma, where F stands for force applied, a foracceleration, and m represents the mass of the object towhich the force is applied.
Newton's First Law of Motion
An object at rest will stay at rest and an object in motion will stay in motion with the same velocity—speed and direction— unless acted upon by an unbalanced exernal force.
Amusement Park Physics With a NASA Twist EG–2003–03–010–GRC
18
To illustrate Newton’s second law, one may use the bumpercar ride for illustration. When car A hits car B, car A impactswith a force on B that is dependent on the mass and thechange of speed (acceleration) of car A. If car A merely tapscar B, car B will change speed or direction only slightly. If carA hits car B with a large amount of force, car B will increasespeed and, depending on the direction of the hit, car B maymove off in another direction.
Let’s assume a rider and a bumper car have a combinedmass of 175 kilograms (kg). Before the car even gets achance to start moving, another car and rider having thesame combined mass drives up from behind and hits the firstcar with a force of 350 newtons ((N) a unit of force). What isthe resulting acceleration due to the force applied?
By applying the second law of motion, F = ma, one can solvefor the acceleration (a)a = F/ma = 350 N/175 kg = 350 (kg • meters/second2)/(175 kg) = 2.1 meters/second2
If the car is hit with a force of 525 N, the resulting accelerationis a = 525 N/175 kg = 525 (kg • meters/second2)/(175 kg) = 3 meters/second2
Newton’s Third Law of MotionFor every action there is an equal and opposite reaction. Usingthe same bumper cars to illustrate Newton’s third law of motion,if car A hits car B, the motion of both cars changes. This isbecause car A is not the only one exerting a force. Car B isexerting an equal and opposite force on car A. This oppositeand equal force is Newton’s third law of motion. Both the objectexerting the force and the object that receives the force havechanges in acceleration. This leads to a discussion of gravityand to Newton’s law of universal gravitation.
GravityRemember that a force is a push or a pull. Gravity is a force thatpulls all objects on Earth toward the Earth’s center of mass. Theforce due to gravity is the reason that we walk on the ground, ratherthan bounce or float. Most people are not aware, however, that allobjects have a gravitational pull to themselves. That means thateverything, regardless of whether it is a feather, a cannon ball, or astar, is attracting everything toward its center of mass. Any objectthat has mass produces a gravitational pull toward its center.
Newton's Second Law of Motion
The greater the force on an object, the greater its resulting acceleration.
F = ma
Newton's ThirdLaw of Motion
For every action, there is a resulting equal and opposite reaction force.
Amusement Park Physics With a NASA Twist EG–2003–03–010–GRC
19
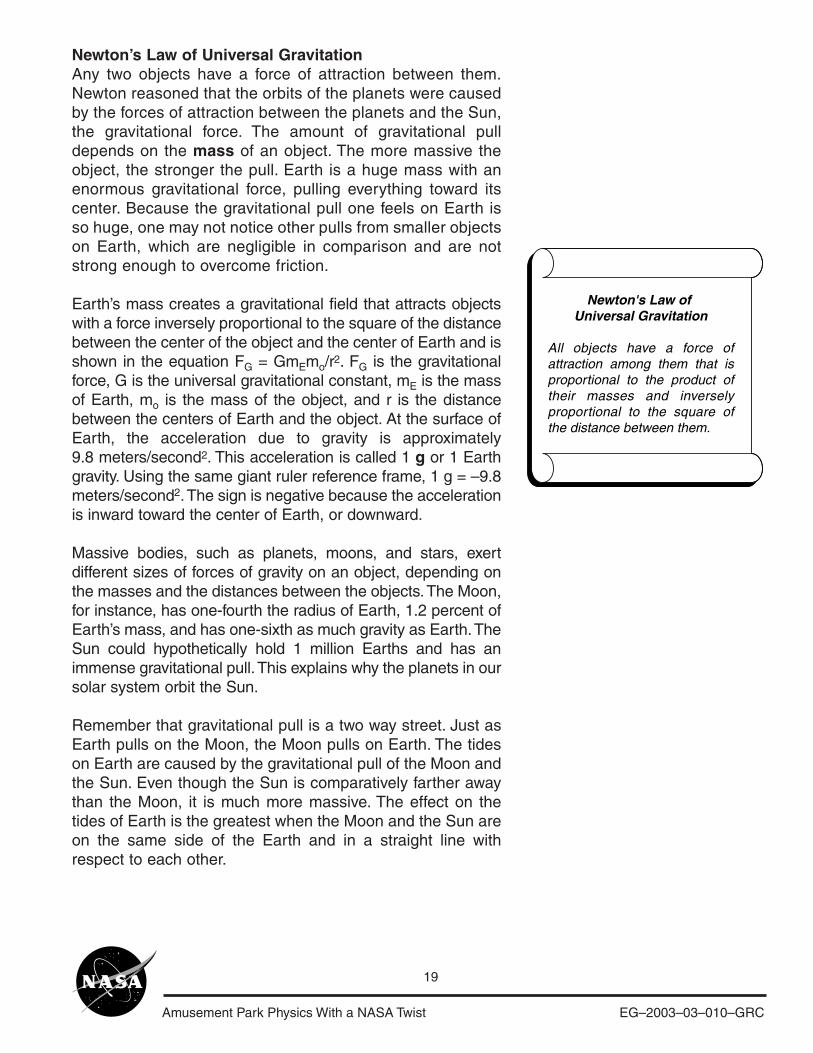
Newton’s Law of Universal GravitationAny two objects have a force of attraction between them.Newton reasoned that the orbits of the planets were causedby the forces of attraction between the planets and the Sun,the gravitational force. The amount of gravitational pulldepends on the mass of an object. The more massive theobject, the stronger the pull. Earth is a huge mass with anenormous gravitational force, pulling everything toward itscenter. Because the gravitational pull one feels on Earth isso huge, one may not notice other pulls from smaller objectson Earth, which are negligible in comparison and are notstrong enough to overcome friction.
Earth’s mass creates a gravitational field that attracts objectswith a force inversely proportional to the square of the distancebetween the center of the object and the center of Earth and isshown in the equation FG = GmEmo/r2. FG is the gravitationalforce, G is the universal gravitational constant, mE is the massof Earth, mo is the mass of the object, and r is the distancebetween the centers of Earth and the object. At the surface ofEarth, the acceleration due to gravity is approximately9.8 meters/second2. This acceleration is called 1 g or 1 Earthgravity. Using the same giant ruler reference frame, 1 g = –9.8meters/second2. The sign is negative because the accelerationis inward toward the center of Earth, or downward.
Massive bodies, such as planets, moons, and stars, exertdifferent sizes of forces of gravity on an object, depending onthe masses and the distances between the objects. The Moon,for instance, has one-fourth the radius of Earth, 1.2 percent ofEarth’s mass, and has one-sixth as much gravity as Earth. TheSun could hypothetically hold 1 million Earths and has animmense gravitational pull. This explains why the planets in oursolar system orbit the Sun.
Remember that gravitational pull is a two way street. Just asEarth pulls on the Moon, the Moon pulls on Earth. The tideson Earth are caused by the gravitational pull of the Moon andthe Sun. Even though the Sun is comparatively farther awaythan the Moon, it is much more massive. The effect on thetides of Earth is the greatest when the Moon and the Sun areon the same side of the Earth and in a straight line withrespect to each other.
Newton's Law of Universal Gravitation
All objects have a force of attraction among them that is proportional to the product of their masses and inversely proportional to the square of the distance between them.
Amusement Park Physics With a NASA Twist EG–2003–03–010–GRC
20
Weighing in on GravityAs a rider plummets to the ground on a free-fall ride, he or shemay feel like he or she weighs less than usual, without anychange of body size. How is this explained? Understanding thedifference between weight and mass is an important next step.
Mass is a fundamental property of all matter and can bethought of as the amount of “stuff” that makes up an object. Twoscoops of ice cream could be exactly the same size, but one ofthem could have more mass than the other. The ice cream withmore mass is made of more stuff, or molecules. It could haveless air mixed in with it, or have thick, dense fudge swirledthrough it to give it more mass than the other scoop.
For any given object, mass is constant but weight is not.Weight is affected by both the mass and the gravitational pull.When people weigh themselves, they step on a scale,compressing a spring or other device inside. It compressesbecause gravity is attracting and pulling the person down-ward, creating a push on the spring. The more massive aperson is, the more the person weighs, therefore causing thespring to compress more than for less massive people. If thegravitational pull of Earth suddenly became weaker, everyoneand everything would weigh less. That is because the springinside the scale would compress less. This happens eventhough their masses have not changed. Weight is both ameasure of gravitational force and the amount of mass of theobject. The actual weight is a result of the force that theexisting gravity imparts onto you.
If an object were weighed on the Moon, the weight wouldappear to be one-sixth of what it is on Earth, although its masswould not have changed. The Moon has one-sixth the amountof Earth’s gravity. Therefore, a 445-newton (100-pound) personwould weigh 74.2 newtons or 16.6 pounds on the Moon.
So, even though one may feel lighter on a certain ride, it is notbecause the gravitational pull of Earth is changing. The rider’sactual weight is not changing, but his or her apparent weightis changing. One’s apparent weight may be either larger orsmaller than the actual weight.
The Earth’s gravity, for small distances above and below theEarth’s surface, can be considered constant. Also, one’smass, for the most part, does not change, at least not duringthe time one spends at the amusement park. Of course, a
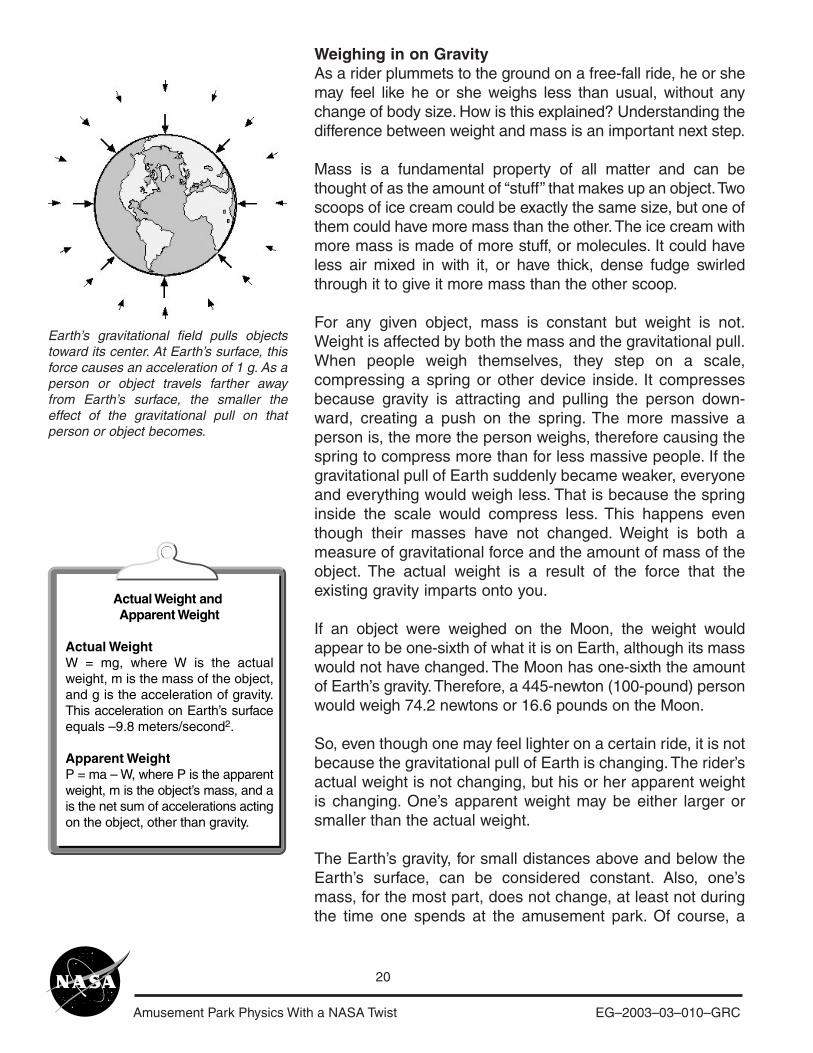
Earth’s gravitational field pulls objectstoward its center. At Earth’s surface, thisforce causes an acceleration of 1 g. As aperson or object travels farther awayfrom Earth’s surface, the smaller theeffect of the gravitational pull on thatperson or object becomes.
Actual Weight and Apparent Weight
Actual Weight W = mg, where W is the actual weight, m is the mass of the object, and g is the acceleration of gravity. This acceleration on Earth’s surface equals –9.8 meters/second2.
Apparent Weight P = ma – W, where P is the apparent weight, m is the object’s mass, and a is the net sum of accelerations acting on the object, other than gravity.
Amusement Park Physics With a NASA Twist EG–2003–03–010–GRC
21
huge intake of food items can change one’s mass slightly.Then, what causes a person to be pressed sharply into his orher seat on a roller coaster (greater than one’s actual weight),or to feel lighter on a ride (less than one’s actual weight)? Thereason that one’s apparent weight changes may be due to avariety of forces acting on the person or object.
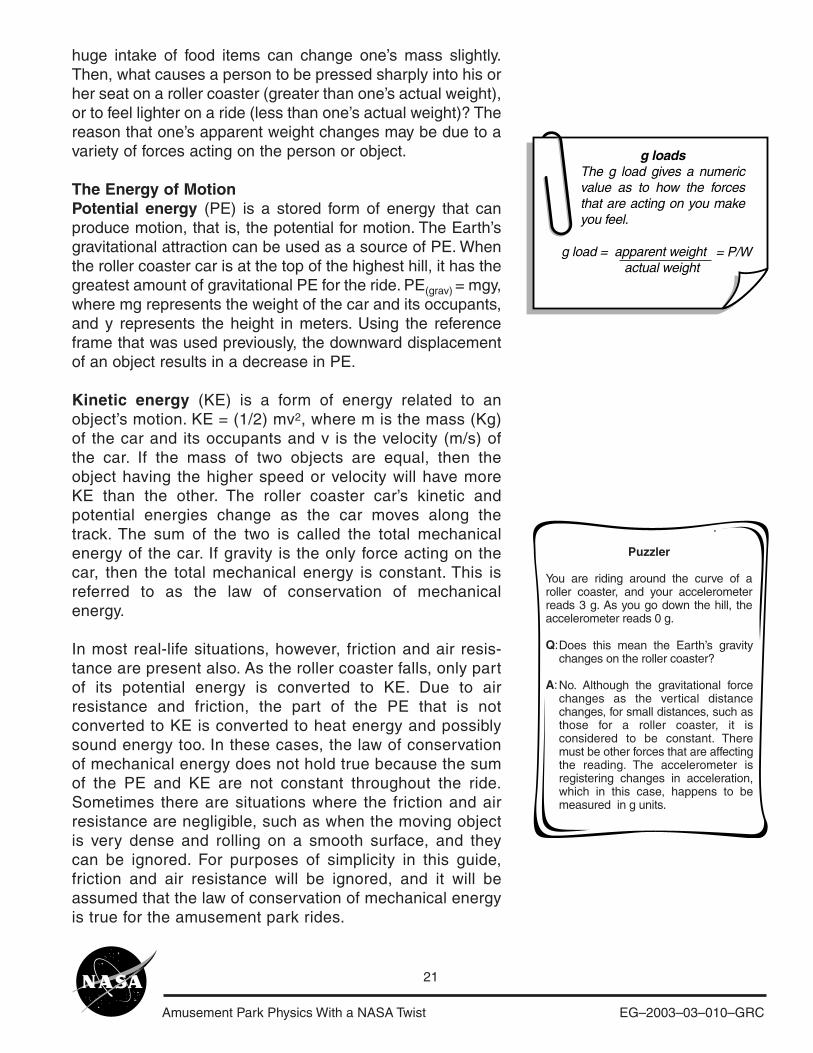
The Energy of MotionPotential energy (PE) is a stored form of energy that canproduce motion, that is, the potential for motion. The Earth’sgravitational attraction can be used as a source of PE. Whenthe roller coaster car is at the top of the highest hill, it has thegreatest amount of gravitational PE for the ride. PE(grav) = mgy,where mg represents the weight of the car and its occupants,and y represents the height in meters. Using the referenceframe that was used previously, the downward displacementof an object results in a decrease in PE.
Kinetic energy (KE) is a form of energy related to anobject’s motion. KE = (1/2) mv2, where m is the mass (Kg)of the car and its occupants and v is the velocity (m/s) ofthe car. If the mass of two objects are equal, then theobject having the higher speed or velocity will have moreKE than the other. The roller coaster car’s kinetic andpotential energies change as the car moves along thetrack. The sum of the two is called the total mechanicalenergy of the car. If gravity is the only force acting on thecar, then the total mechanical energy is constant. This isreferred to as the law of conservation of mechanicalenergy.
In most real-life situations, however, friction and air resis-tance are present also. As the roller coaster falls, only partof its potential energy is converted to KE. Due to airresistance and friction, the part of the PE that is notconverted to KE is converted to heat energy and possiblysound energy too. In these cases, the law of conservationof mechanical energy does not hold true because the sumof the PE and KE are not constant throughout the ride.Sometimes there are situations where the friction and airresistance are negligible, such as when the moving objectis very dense and rolling on a smooth surface, and theycan be ignored. For purposes of simplicity in this guide,friction and air resistance will be ignored, and it will beassumed that the law of conservation of mechanical energyis true for the amusement park rides.
g loadsThe g load gives a numeric value as to how the forces that are acting on you make you feel.
= P/Wg load = apparent weight actual weight
Puzzler
You are riding around the curve of a roller coaster, and your accelerometer reads 3 g. As you go down the hill, the accelerometer reads 0 g. Q:
A:
Does this mean the Earth’s gravity changes on the roller coaster?
No. Although the gravitational force changes as the vertical distance changes, for small distances, such as those for a roller coaster, it is considered to be constant. There must be other forces that are affecting the reading. The accelerometer is registering changes in acceleration, which in this case, happens to be measured in g units.
Amusement Park Physics With a NASA Twist EG–2003–03–010–GRC
22
Microgravity at the Amusement ParkYou will definitely feel microgravity conditions at the amusement park, because your apparentweight may feel less than your actual weight at times. The sudden changes in motion create thiseffect. We can now define microgravity more precisely than we did previously to be “an environmentwhere your apparent weight is less than your actual weight.” At the park the key to this condition isfree fall. Think of a steep roller coaster hill. Gravity pulls the coaster car down towards the center ofEarth. When not in the state of free fall, between the coaster and the ground is a rail that pushesup on the car to keep the coaster from falling to the ground. When it is in free fall, however, thereis no vertical support needed. As long as the rail is curved in a parabolic shape and the car ismoving at the correct speed, the car and its riders are in free fall.
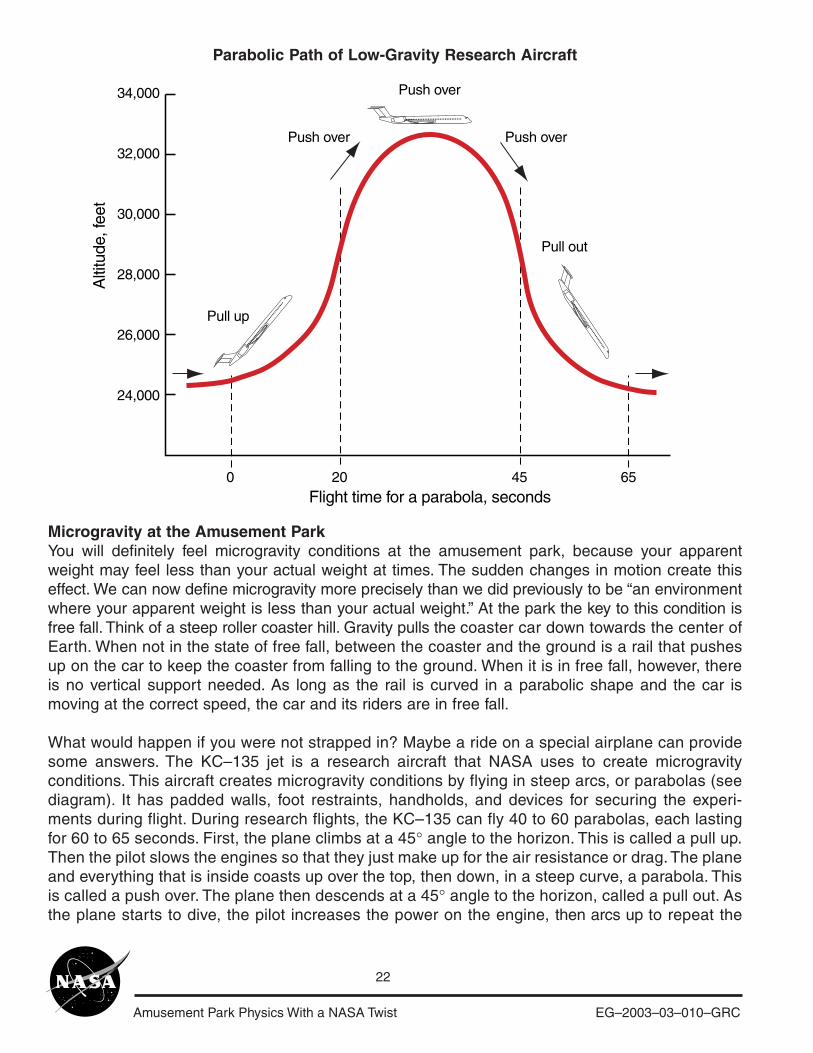
What would happen if you were not strapped in? Maybe a ride on a special airplane can providesome answers. The KC–135 jet is a research aircraft that NASA uses to create microgravityconditions. This aircraft creates microgravity conditions by flying in steep arcs, or parabolas (seediagram). It has padded walls, foot restraints, handholds, and devices for securing the experi-ments during flight. During research flights, the KC–135 can fly 40 to 60 parabolas, each lastingfor 60 to 65 seconds. First, the plane climbs at a 45° angle to the horizon. This is called a pull up.Then the pilot slows the engines so that they just make up for the air resistance or drag. The planeand everything that is inside coasts up over the top, then down, in a steep curve, a parabola. Thisis called a push over. The plane then descends at a 45° angle to the horizon, called a pull out. Asthe plane starts to dive, the pilot increases the power on the engine, then arcs up to repeat the
Parabolic Path of Low-Gravity Research Aircraft
34,000
32,000
30,000
28,000
26,000
24,000
0
Pull up
Push over Push over
Push over
Pull out
20 45 65
Alti
tude
, fee
t
Flight time for a parabola, seconds
Amusement Park Physics With a NASA Twist EG–2003–03–010–GRC
23
process. During the pull-up and pull-out segments, the crew and the experiments experienceaccelerations of about 2 g. During the parabola trace, the net accelerations drop as low as 0.015g (nearly 0 g) for about 20 to 25 seconds. Reduced-gravity conditions created by the same type ofparabolic motion can be experienced on “floater” hills of roller coaster rides.
Low g or MicrogravityMicrogravity conditions can be due to a reduction of gravitational forces or an acceleration towardthe Earth’s surface. The first method is not an option if we are staying on Earth.
A free-fall ride, however, can provide a rider a great on-Earth microgravity experience. If onecould stand or sit on a scale during this ride, it would show that he or she would weigh less thannormal. Remember the spring in the scale? In order for the scale to read a person’s weight, thespring must be compressed by a force. Because the scale would be falling right along with therider as the car is falling, there would be no downward force to compress the spring even if it weredirectly underneath the person. Instead of using a scale to register weight, a vertical accelerom-eter can be used to measure the g loads experienced during the ride.
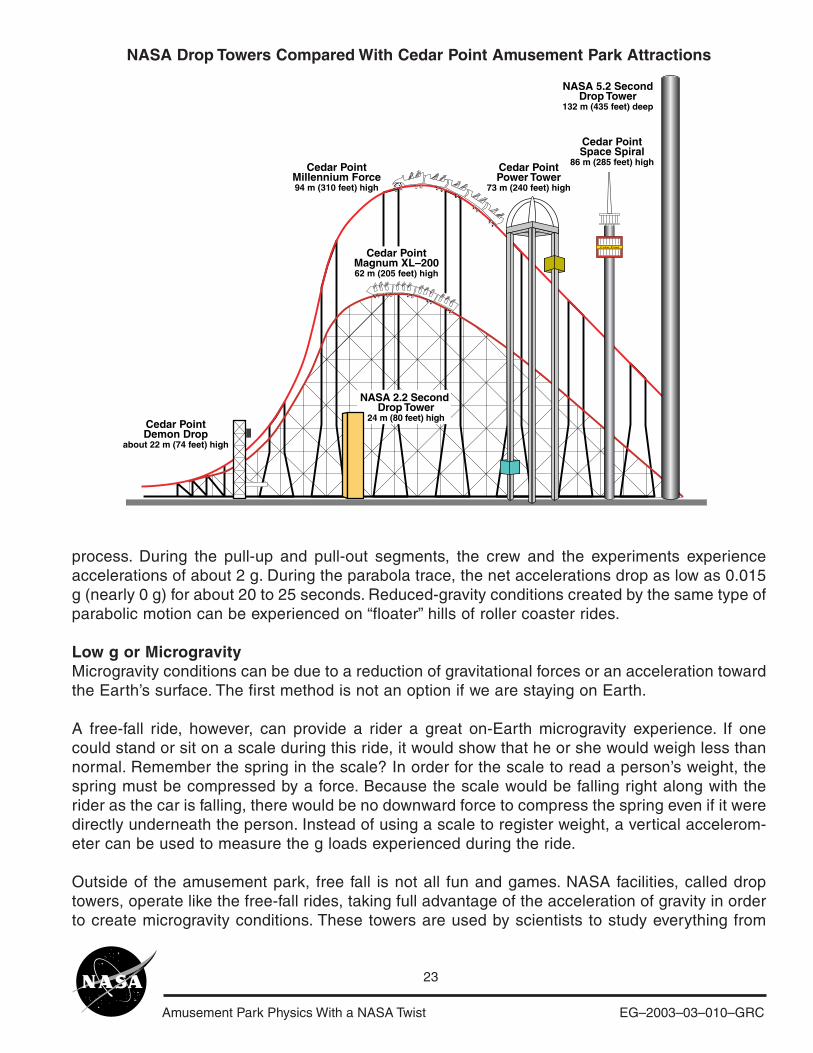
Outside of the amusement park, free fall is not all fun and games. NASA facilities, called droptowers, operate like the free-fall rides, taking full advantage of the acceleration of gravity in orderto create microgravity conditions. These towers are used by scientists to study everything from
NASA Drop Towers Compared With Cedar Point Amusement Park Attractions
Cedar PointMillennium Force94 m (310 feet) high
Cedar PointPower Tower
73 m (240 feet) high
Cedar PointSpace Spiral
86 m (285 feet) high
Cedar PointMagnum XL–20062 m (205 feet) high
Cedar PointDemon Drop
about 22 m (74 feet) high
NASA 2.2 Second Drop Tower
24 m (80 feet) high
Cedar Point
NASA 5.2 SecondDrop Tower
132 m (435 feet) deep
Amusement Park Physics With a NASA Twist EG–2003–03–010–GRC
24
combustion to fluids, to experimental designs. The NASAGlenn Research Center has two drop facilities. One providesa 132-meter drop into a hole in the ground creating amicrogravity environment for 5.2 seconds. The other facility, a24-meter tower, allows for 2.2 seconds of microgravity. Onecan experience falling by riding on drop rides such as theDemon Drop (22 meters high) and the Power Tower (73meters high). Both of these rides are at the Cedar PointAmusement Park in Sandusky, Ohio.
The longest drop time available to researchers at this time is10 seconds, achieved at a 490-meter underground drop shaftin Japan. This drop tower, which is deeper than the EmpireState Building is tall, has a drop distance of 381 meters or1250 feet!
An ideal microgravity environment for research is in theEarth’s orbit. A main difference between an orbiting space-craft, such as the space shuttle, the International SpaceStation, and the drop towers is the length of time for themicrogravity condition. The similarity is that the microgravitycondition is achieved the same way in orbit as it is in the droptowers or even the drop rides at the amusement park—byfree fall. It is a common misconception that astronauts floataround in the shuttle because there is no gravity in space.What really makes them float is the fact that spacecraft, andthe astronauts in it, are falling around Earth.
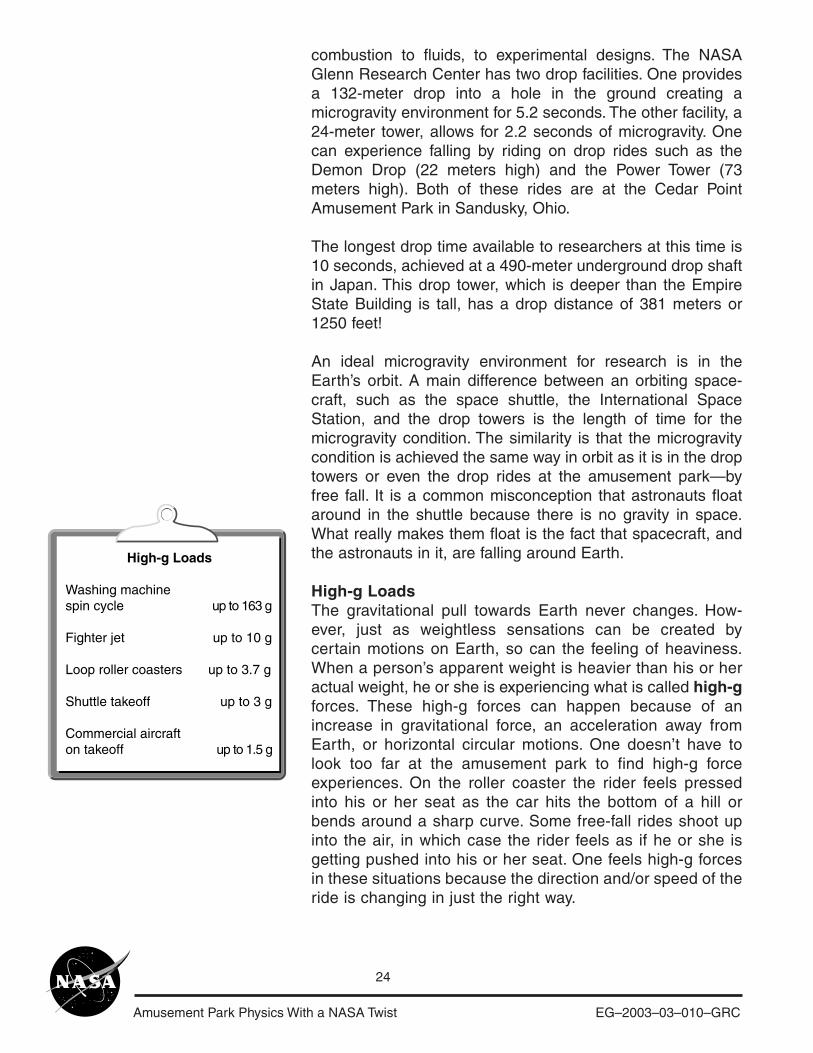
High-g LoadsThe gravitational pull towards Earth never changes. How-ever, just as weightless sensations can be created bycertain motions on Earth, so can the feeling of heaviness.When a person’s apparent weight is heavier than his or heractual weight, he or she is experiencing what is called high-gforces. These high-g forces can happen because of anincrease in gravitational force, an acceleration away fromEarth, or horizontal circular motions. One doesn’t have tolook too far at the amusement park to find high-g forceexperiences. On the roller coaster the rider feels pressedinto his or her seat as the car hits the bottom of a hill orbends around a sharp curve. Some free-fall rides shoot upinto the air, in which case the rider feels as if he or she isgetting pushed into his or her seat. One feels high-g forcesin these situations because the direction and/or speed of theride is changing in just the right way.
High-g Loads
Washing machine spin cycle up to 163 g
Fighter jet up to 10 g
Loop roller coasters up to 3.7 g
Shuttle takeoff up to 3 g
Commercial aircrafton takeoff up to 1.5 g
Amusement Park Physics With a NASA Twist EG–2003–03–010–GRC
25
Loop-de-loop coasters rarely exceed 3.7 g. This may sound like fun, but for most people these gloads are more than enough excitement. Accelerating at 9 or 10 g in the wrong direction cancause the blood (which carries needed oxygen) to drain from a person’s head resulting in tunnelvision and unconsciousness. If the curves of a roller coaster can make you feel weighted down,imagine flying a military high-speed aircraft. These jets are built to withstand up to 10 g. Pilotstrain to pull 4 to 5 g. Sometimes fighter pilots must handle as many as 10-g loads. How do theyavoid passing out? Fighter plane seats are inclined back to prevent blood from draining from thehead. Pilots also wear vests and leg straps with rubber air bladders that automatically inflate tocreate pressure on the body to force blood back to the brain. Also, grunting by the pilots tightensthe stomach muscles which helps to bring oxygen back to the brain.
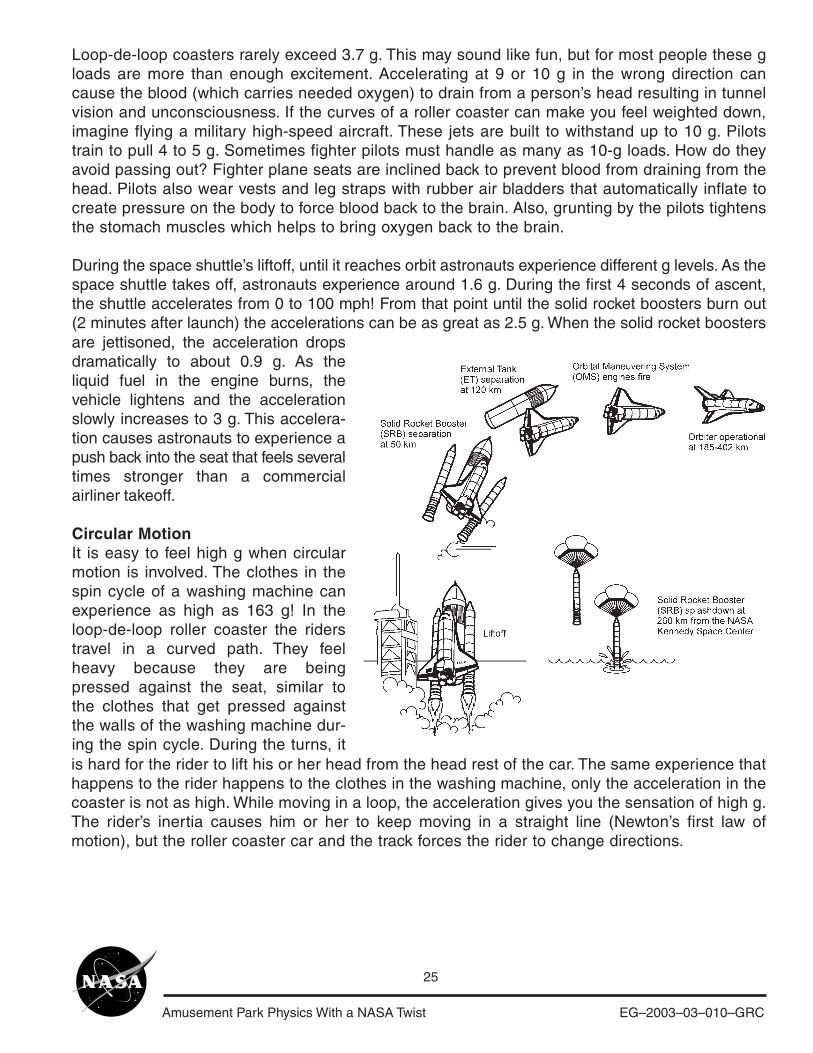
During the space shuttle’s liftoff, until it reaches orbit astronauts experience different g levels. As thespace shuttle takes off, astronauts experience around 1.6 g. During the first 4 seconds of ascent,the shuttle accelerates from 0 to 100 mph! From that point until the solid rocket boosters burn out(2 minutes after launch) the accelerations can be as great as 2.5 g. When the solid rocket boostersare jettisoned, the acceleration dropsdramatically to about 0.9 g. As theliquid fuel in the engine burns, thevehicle lightens and the accelerationslowly increases to 3 g. This accelera-tion causes astronauts to experience apush back into the seat that feels severaltimes stronger than a commercialairliner takeoff.
Circular MotionIt is easy to feel high g when circularmotion is involved. The clothes in thespin cycle of a washing machine canexperience as high as 163 g! In theloop-de-loop roller coaster the riderstravel in a curved path. They feelheavy because they are beingpressed against the seat, similar tothe clothes that get pressed againstthe walls of the washing machine dur-ing the spin cycle. During the turns, itis hard for the rider to lift his or her head from the head rest of the car. The same experience thathappens to the rider happens to the clothes in the washing machine, only the acceleration in thecoaster is not as high. While moving in a loop, the acceleration gives you the sensation of high g.The rider’s inertia causes him or her to keep moving in a straight line (Newton’s first law ofmotion), but the roller coaster car and the track forces the rider to change directions.
Amusement Park Physics With a NASA Twist EG–2003–03–010–GRC
26
Basic SkillsStudents who go to the park without mastering the followingskills have difficulty completing the ride worksheets in thenext section. To have a successful physics day experience atthe amusement park, students need to
1. Practice and successfully use a stopwatch to time rides.2. Know how many average steps to take to walk 30 meters.3. Measure eye level height.4. Practice using the altitude tracker and accelerometer.5. Practice and master two methods for estimating heights.6. Review how to calculate average times, average speed, how to correctly use the Pythagorean theorem, and how to use the equation for finding the period of a pendulum.
TimeTime is an important measurement for calculating speed andacceleration. Students can use stopwatches to time a ride’sduration, portions of rides, or a series of movements tocalculate the average ride speeds. Stopwatches and digitalwatches with stopwatch features are the best. Digital andanalog watches with second hands may work well with highschool students. Students need practice taking several read-ings to improve accuracy and get practice calculating averagetimes and speeds.
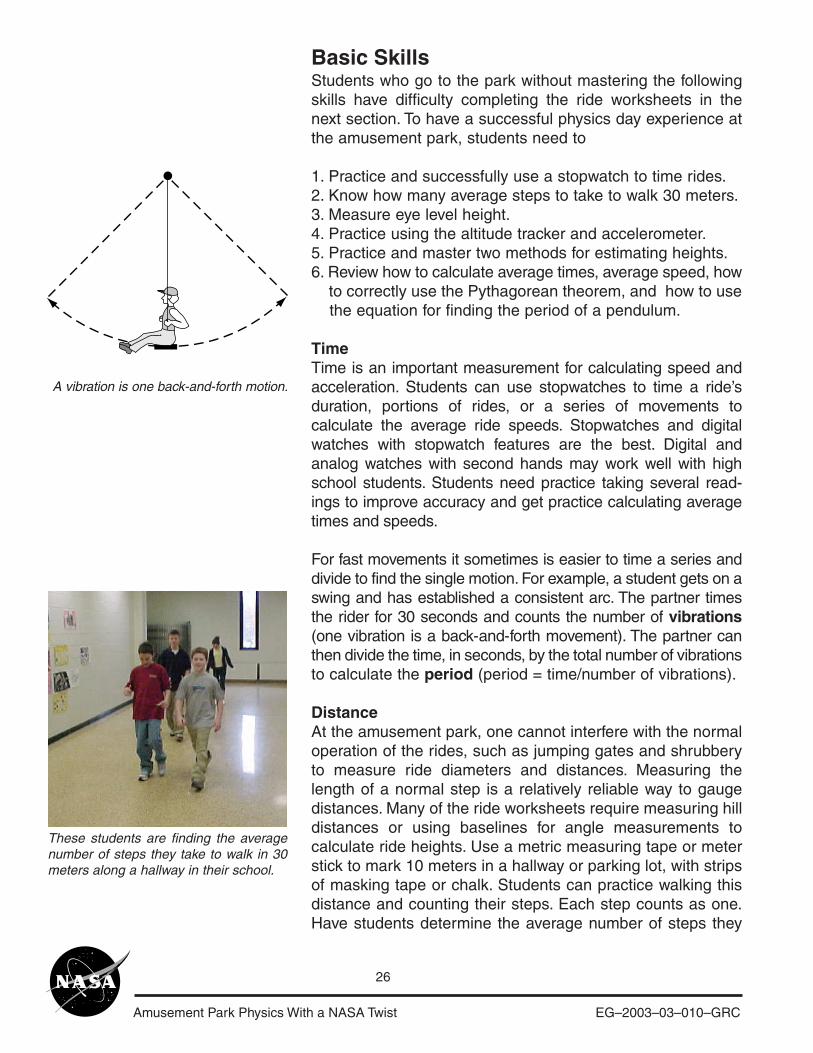
For fast movements it sometimes is easier to time a series anddivide to find the single motion. For example, a student gets on aswing and has established a consistent arc. The partner timesthe rider for 30 seconds and counts the number of vibrations(one vibration is a back-and-forth movement). The partner canthen divide the time, in seconds, by the total number of vibrationsto calculate the period (period = time/number of vibrations).
DistanceAt the amusement park, one cannot interfere with the normaloperation of the rides, such as jumping gates and shrubberyto measure ride diameters and distances. Measuring thelength of a normal step is a relatively reliable way to gaugedistances. Many of the ride worksheets require measuring hilldistances or using baselines for angle measurements tocalculate ride heights. Use a metric measuring tape or meterstick to mark 10 meters in a hallway or parking lot, with stripsof masking tape or chalk. Students can practice walking thisdistance and counting their steps. Each step counts as one.Have students determine the average number of steps they
A vibration is one back-and-forth motion.
These students are finding the averagenumber of steps they take to walk in 30meters along a hallway in their school.
Amusement Park Physics With a NASA Twist EG–2003–03–010–GRC
27
take after three or four trials. As a class, review how manysteps they would need to take to walk 10 meters and what todo to calculate 30 meters. Students should record thisnumber in a safe place so they do not forget. See the Formsand Extras section for the Eye Level Height and SteppingEstimation Record.
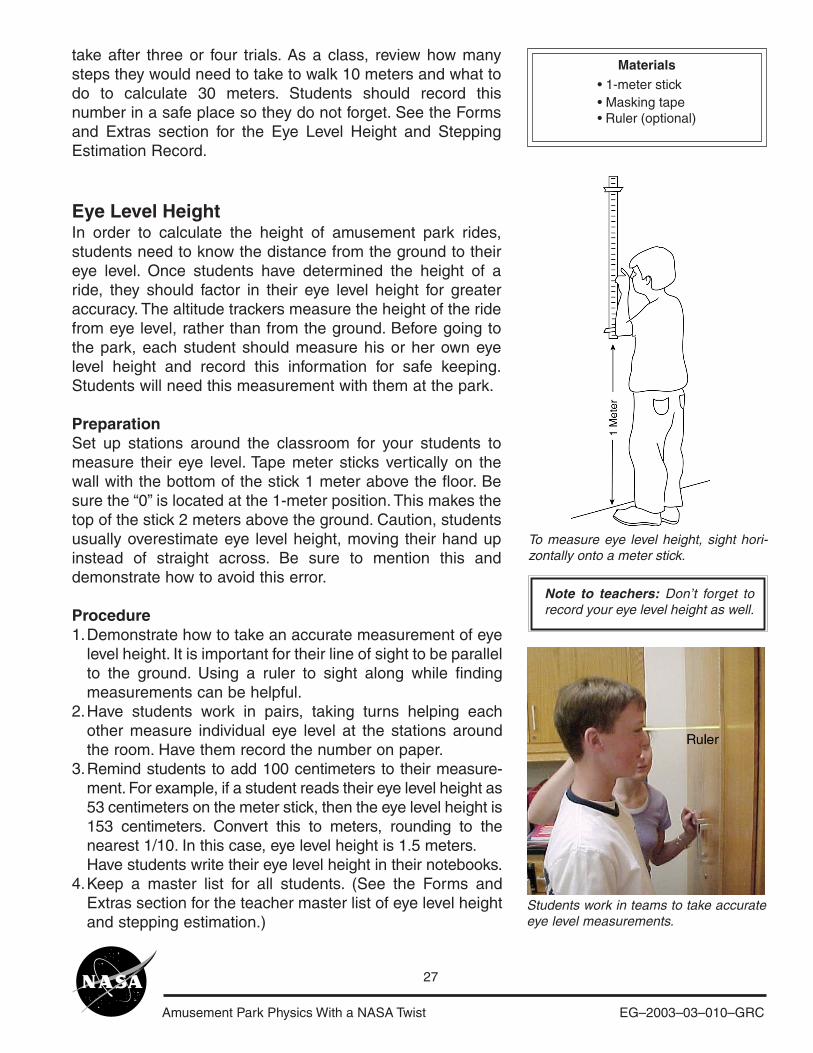
Eye Level HeightIn order to calculate the height of amusement park rides,students need to know the distance from the ground to theireye level. Once students have determined the height of aride, they should factor in their eye level height for greateraccuracy. The altitude trackers measure the height of the ridefrom eye level, rather than from the ground. Before going tothe park, each student should measure his or her own eyelevel height and record this information for safe keeping.Students will need this measurement with them at the park.
PreparationSet up stations around the classroom for your students tomeasure their eye level. Tape meter sticks vertically on thewall with the bottom of the stick 1 meter above the floor. Besure the “0” is located at the 1-meter position. This makes thetop of the stick 2 meters above the ground. Caution, studentsusually overestimate eye level height, moving their hand upinstead of straight across. Be sure to mention this anddemonstrate how to avoid this error.
Procedure1.
2.
3.
4.
To measure eye level height, sight hori-zontally onto a meter stick.
Note to teachers: Don’t forget torecord your eye level height as well.
Materials• 1-meter stick• Masking tape• Ruler (optional)
Demonstrate how to take an accurate measurement of eyelevel height. It is important for their line of sight to be parallelto the ground. Using a ruler to sight along while findingmeasurements can be helpful.Have students work in pairs, taking turns helping eachother measure individual eye level at the stations aroundthe room. Have them record the number on paper.Remind students to add 100 centimeters to their measure-ment. For example, if a student reads their eye level height as53 centimeters on the meter stick, then the eye level height is153 centimeters. Convert this to meters, rounding to thenearest 1/10. In this case, eye level height is 1.5 meters.Have students write their eye level height in their notebooks.Keep a master list for all students. (See the Forms andExtras section for the teacher master list of eye level heightand stepping estimation.)
Students work in teams to take accurateeye level measurements.
Amusement Park Physics With a NASA Twist EG–2003–03–010–GRC
28
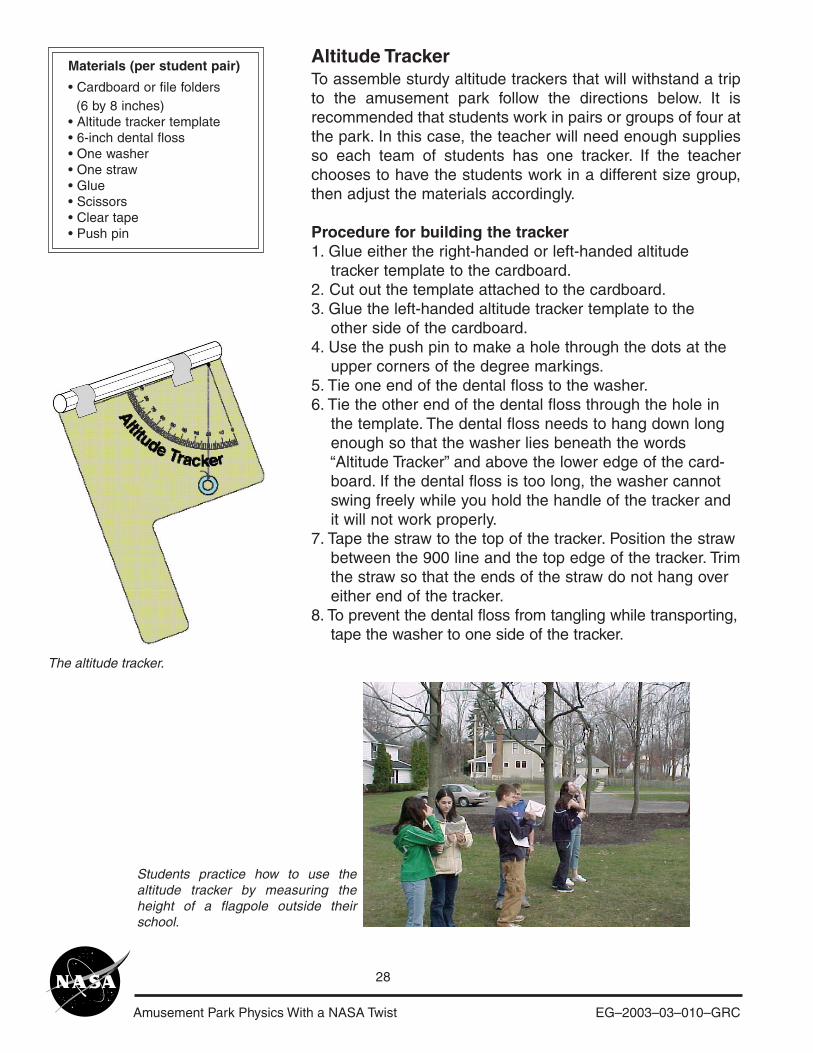
To assemble sturdy altitude trackers that will withstand a tripto the amusement park follow the directions below. It isrecommended that students work in pairs or groups of four atthe park. In this case, the teacher will need enough suppliesso each team of students has one tracker. If the teacherchooses to have the students work in a different size group,then adjust the materials accordingly.
Procedure for building the tracker1. Glue either the right-handed or left-handed altitude tracker template to the cardboard.2. Cut out the template attached to the cardboard.3. Glue the left-handed altitude tracker template to the other side of the cardboard.4. Use the push pin to make a hole through the dots at the upper corners of the degree markings.5. Tie one end of the dental floss to the washer.6. Tie the other end of the dental floss through the hole in the template. The dental floss needs to hang down long enough so that the washer lies beneath the words “Altitude Tracker” and above the lower edge of the card- board. If the dental floss is too long, the washer cannot swing freely while you hold the handle of the tracker and it will not work properly.7. Tape the straw to the top of the tracker. Position the straw between the 900 line and the top edge of the tracker. Trim the straw so that the ends of the straw do not hang over either end of the tracker.8. To prevent the dental floss from tangling while transporting, tape the washer to one side of the tracker.
Altitude TrackerMaterials (per student pair)
• Cardboard or file folders (6 by 8 inches)• Altitude tracker template• 6-inch dental floss• One washer• One straw• Glue• Scissors• Clear tape• Push pin
The altitude tracker.
Students practice how to use thealtitude tracker by measuring theheight of a flagpole outside theirschool.
Amusement Park Physics With a NASA Twist EG–2003–03–010–GRC
29
Altitude
Tracker90°
80°70°
60°50°
40°30°
20°10° 0°
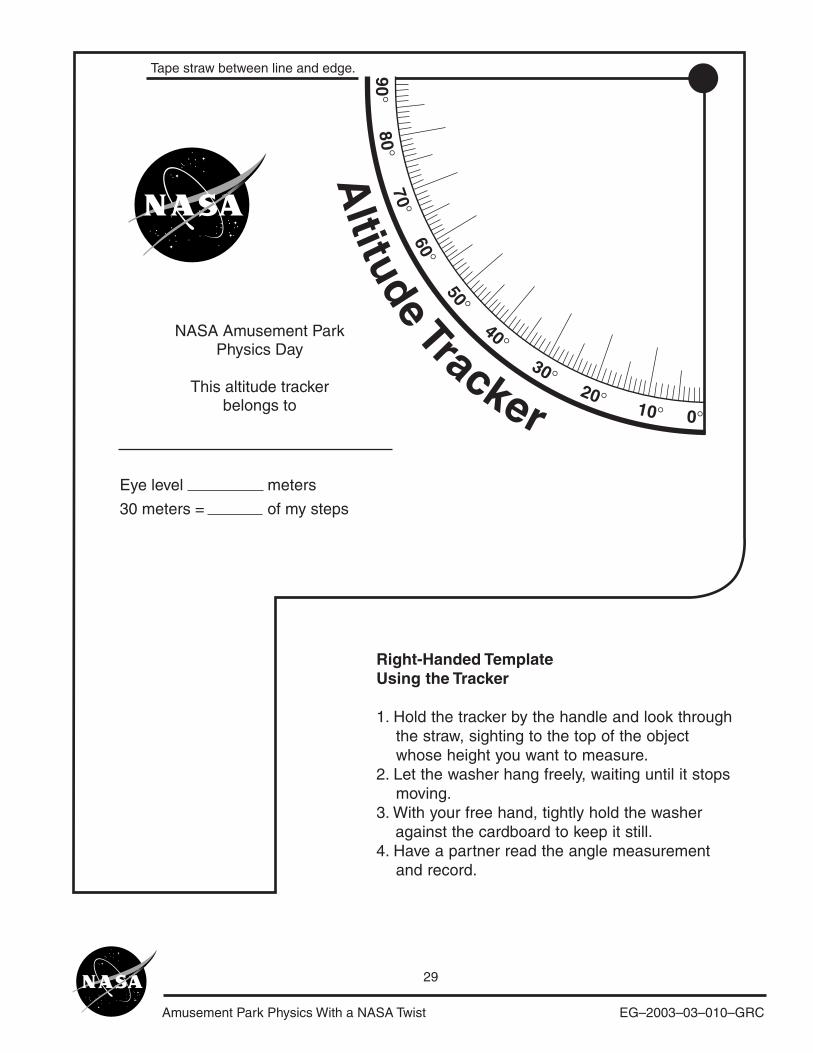
Tape straw between line and edge.
NASA Amusement ParkPhysics Day
This altitude trackerbelongs to
Eye level meters
30 meters = of my steps
Right-Handed TemplateUsing the Tracker
1. Hold the tracker by the handle and look through the straw, sighting to the top of the object whose height you want to measure.2. Let the washer hang freely, waiting until it stops moving.3. With your free hand, tightly hold the washer against the cardboard to keep it still.4. Have a partner read the angle measurement and record.
Amusement Park Physics With a NASA Twist EG–2003–03–010–GRC
30
Altitude Tr
acke
r0° 10°
20°30°
40°
50°
60°
70°
80°
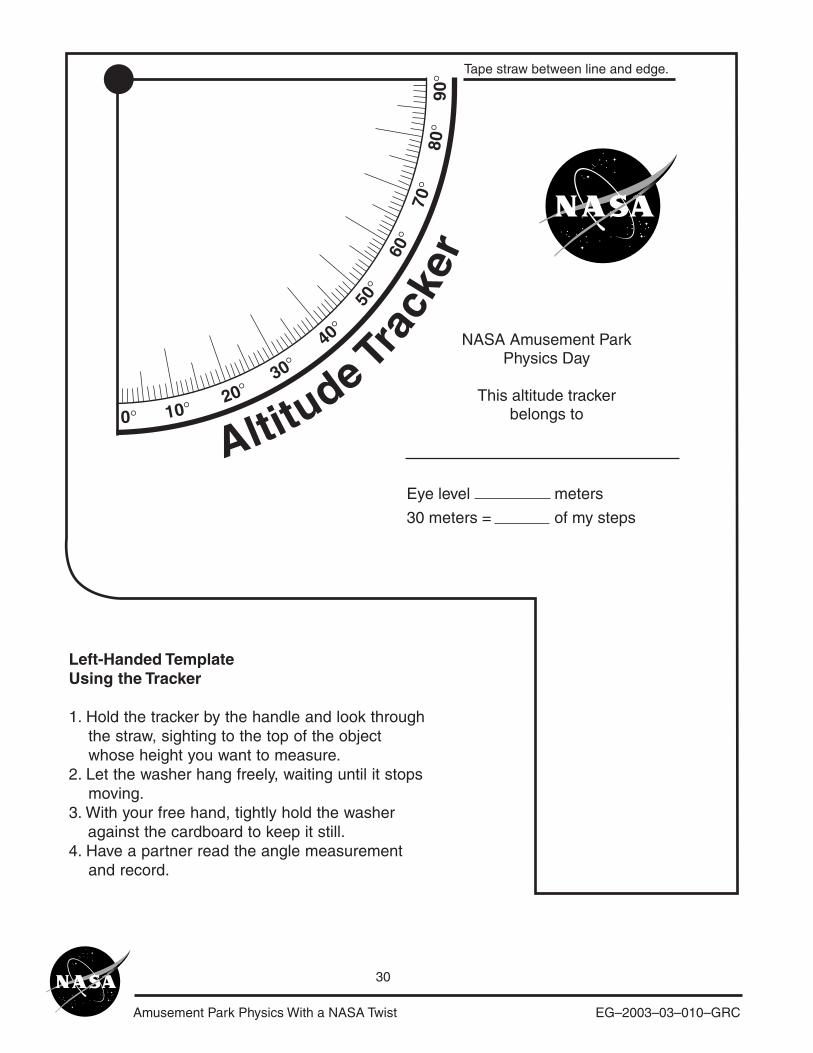
90° Tape straw between line and edge.
NASA Amusement ParkPhysics Day
This altitude trackerbelongs to
Eye level meters
30 meters = of my steps
Left-Handed TemplateUsing the Tracker
1. Hold the tracker by the handle and look through the straw, sighting to the top of the object whose height you want to measure.2. Let the washer hang freely, waiting until it stops moving.3. With your free hand, tightly hold the washer against the cardboard to keep it still.4. Have a partner read the angle measurement and record.
Amusement Park Physics With a NASA Twist EG–2003–03–010–GRC
31
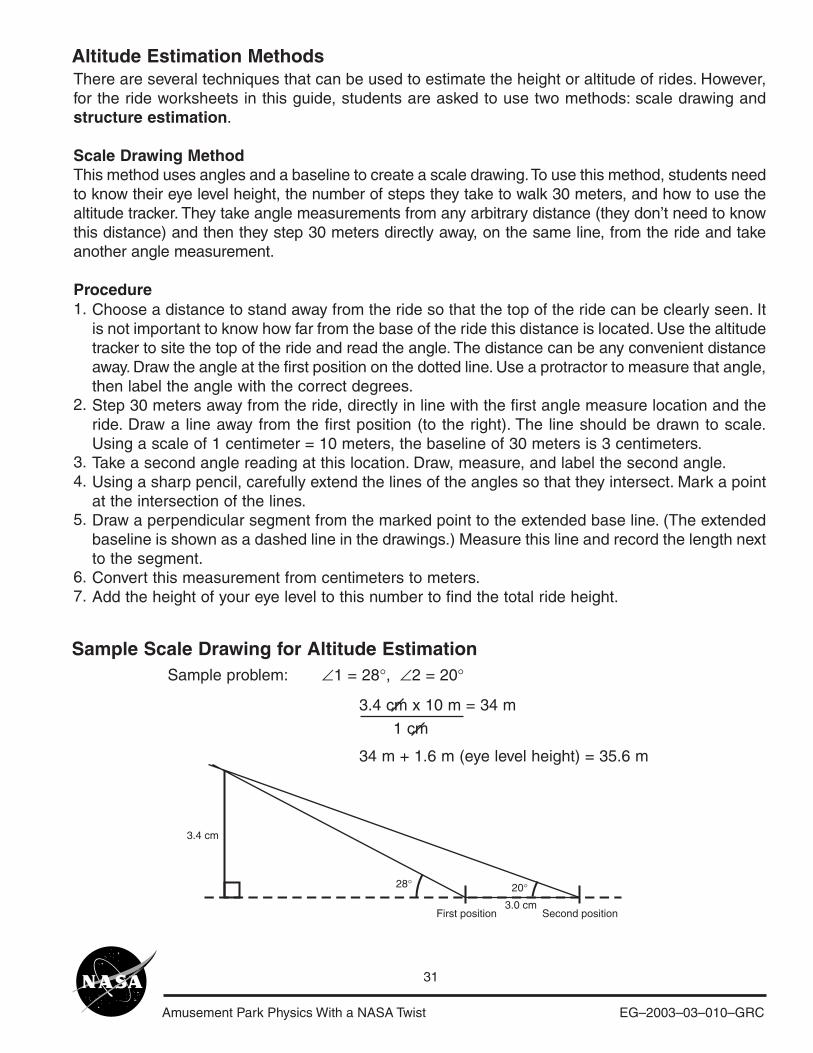
There are several techniques that can be used to estimate the height or altitude of rides. However,for the ride worksheets in this guide, students are asked to use two methods: scale drawing andstructure estimation.
Scale Drawing MethodThis method uses angles and a baseline to create a scale drawing. To use this method, students needto know their eye level height, the number of steps they take to walk 30 meters, and how to use thealtitude tracker. They take angle measurements from any arbitrary distance (they don’t need to knowthis distance) and then they step 30 meters directly away, on the same line, from the ride and takeanother angle measurement.
Procedure1.
2.
3.4.
5.
6.7.
Altitude Estimation Methods
Sample Scale Drawing for Altitude EstimationSample problem: ∠1 = 28°, ∠2 = 20°
3.4 cm x 10 m = 34 m
1 cm
34 m + 1.6 m (eye level height) = 35.6 m
3.4 cm
3.0 cm
28°
First position Second position
20°
Choose a distance to stand away from the ride so that the top of the ride can be clearly seen. Itis not important to know how far from the base of the ride this distance is located. Use the altitudetracker to site the top of the ride and read the angle. The distance can be any convenient distanceaway. Draw the angle at the first position on the dotted line. Use a protractor to measure that angle,then label the angle with the correct degrees.Step 30 meters away from the ride, directly in line with the first angle measure location and theride. Draw a line away from the first position (to the right). The line should be drawn to scale.Using a scale of 1 centimeter = 10 meters, the baseline of 30 meters is 3 centimeters.Take a second angle reading at this location. Draw, measure, and label the second angle.Using a sharp pencil, carefully extend the lines of the angles so that they intersect. Mark a pointat the intersection of the lines.Draw a perpendicular segment from the marked point to the extended base line. (The extendedbaseline is shown as a dashed line in the drawings.) Measure this line and record the length nextto the segment.Convert this measurement from centimeters to meters.Add the height of your eye level to this number to find the total ride height.
Amusement Park Physics With a NASA Twist EG–2003–03–010–GRC
32
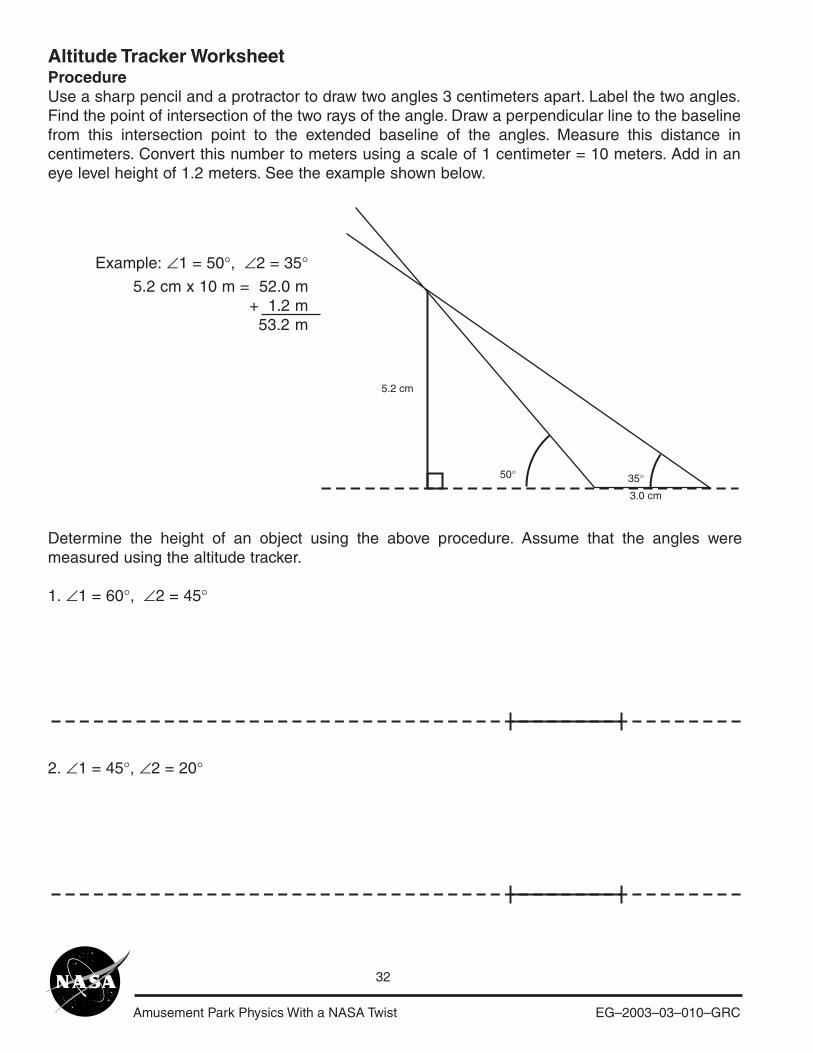
Altitude Tracker WorksheetProcedureUse a sharp pencil and a protractor to draw two angles 3 centimeters apart. Label the two angles.Find the point of intersection of the two rays of the angle. Draw a perpendicular line to the baselinefrom this intersection point to the extended baseline of the angles. Measure this distance incentimeters. Convert this number to meters using a scale of 1 centimeter = 10 meters. Add in aneye level height of 1.2 meters. See the example shown below.
5.2 cm
3.0 cm
50° 35°
Example: ∠1 = 50°, ∠2 = 35°5.2 cm x 10 m = 52.0 m
+ 1.2 m53.2 m
Determine the height of an object using the above procedure. Assume that the angles weremeasured using the altitude tracker.
1. ∠1 = 60°, ∠2 = 45°
2. ∠1 = 45°, ∠2 = 20°
Amusement Park Physics With a NASA Twist EG–2003–03–010–GRC
33
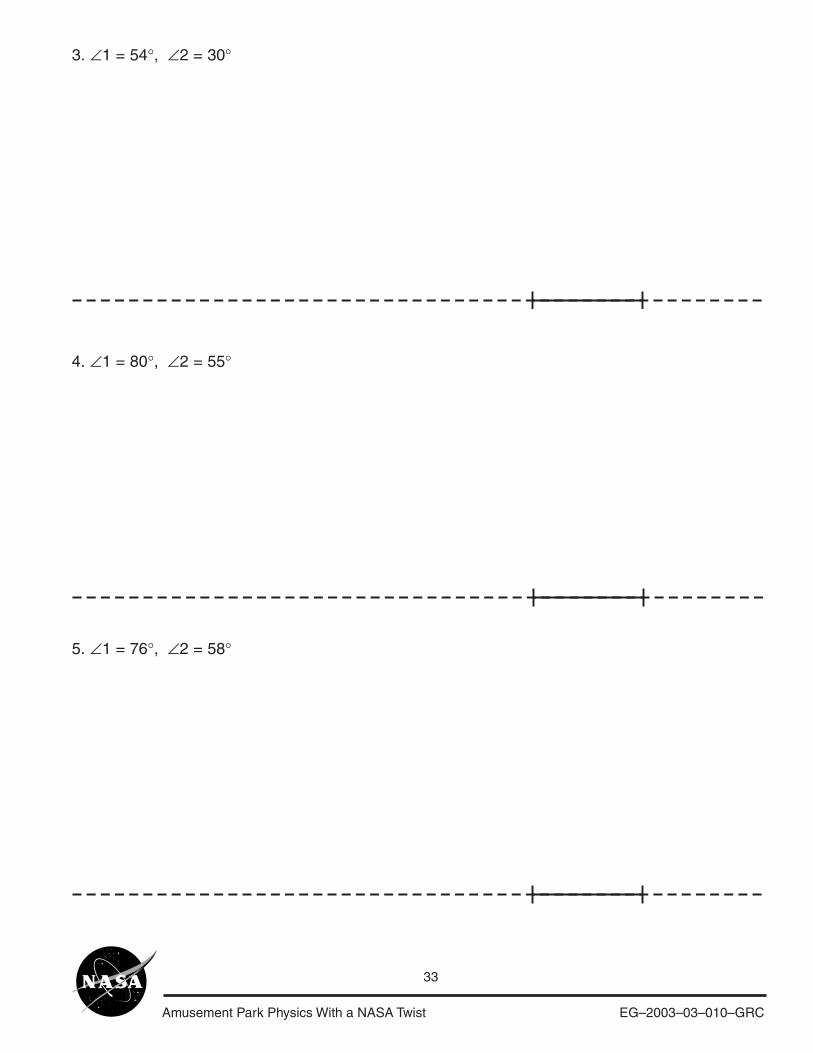
3. ∠1 = 54°, ∠2 = 30°
4. ∠1 = 80°, ∠2 = 55°
5. ∠1 = 76°, ∠2 = 58°
Amusement Park Physics With a NASA Twist EG–2003–03–010–GRC
34
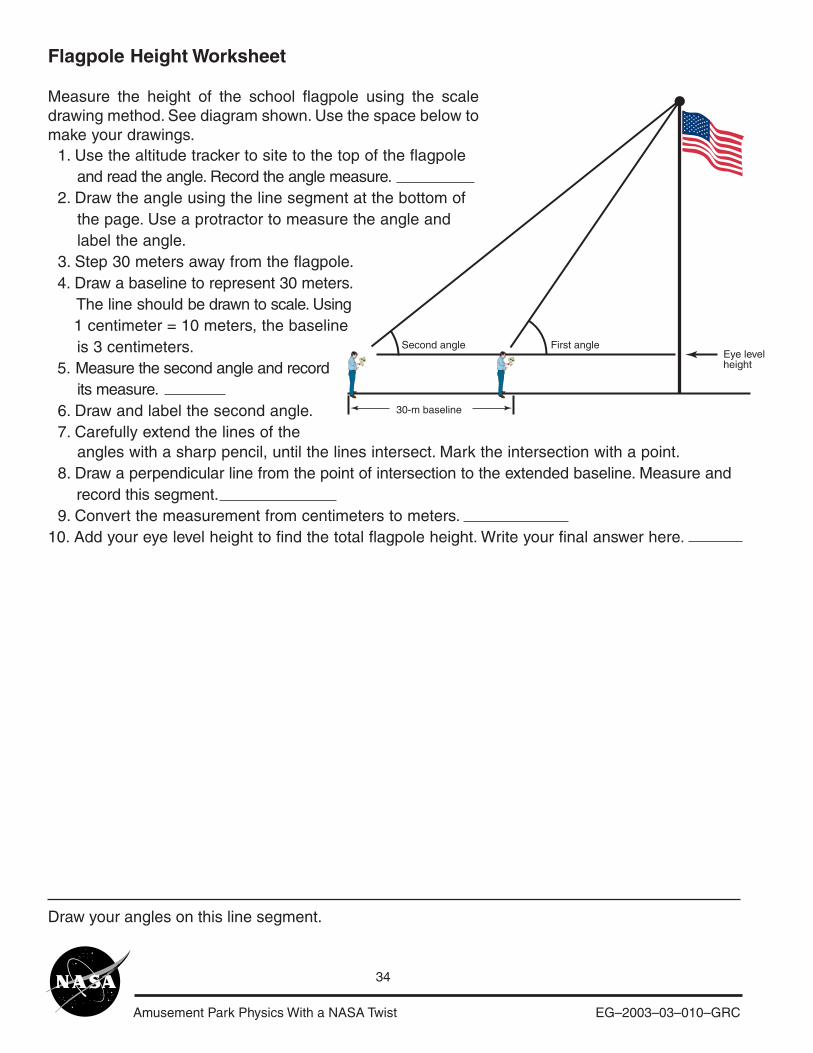
angles with a sharp pencil, until the lines intersect. Mark the intersection with a point. 8. Draw a perpendicular line from the point of intersection to the extended baseline. Measure and record this segment. 9. Convert the measurement from centimeters to meters.10. Add your eye level height to find the total flagpole height. Write your final answer here.
Flagpole Height Worksheet
Measure the height of the school flagpole using the scaledrawing method. See diagram shown. Use the space below tomake your drawings. 1. Use the altitude tracker to site to the top of the flagpole and read the angle. Record the angle measure. 2. Draw the angle using the line segment at the bottom of the page. Use a protractor to measure the angle and label the angle. 3. Step 30 meters away from the flagpole. 4. Draw a baseline to represent 30 meters. The line should be drawn to scale. Using 1 centimeter = 10 meters, the baseline is 3 centimeters. 5. Measure the second angle and record its measure. 6. Draw and label the second angle. 7. Carefully extend the lines of the
30-m baseline
First angleEye levelheight
Second angle
Draw your angles on this line segment.
Amusement Park Physics With a NASA Twist EG–2003–03–010–GRC
35
Structure Estimation
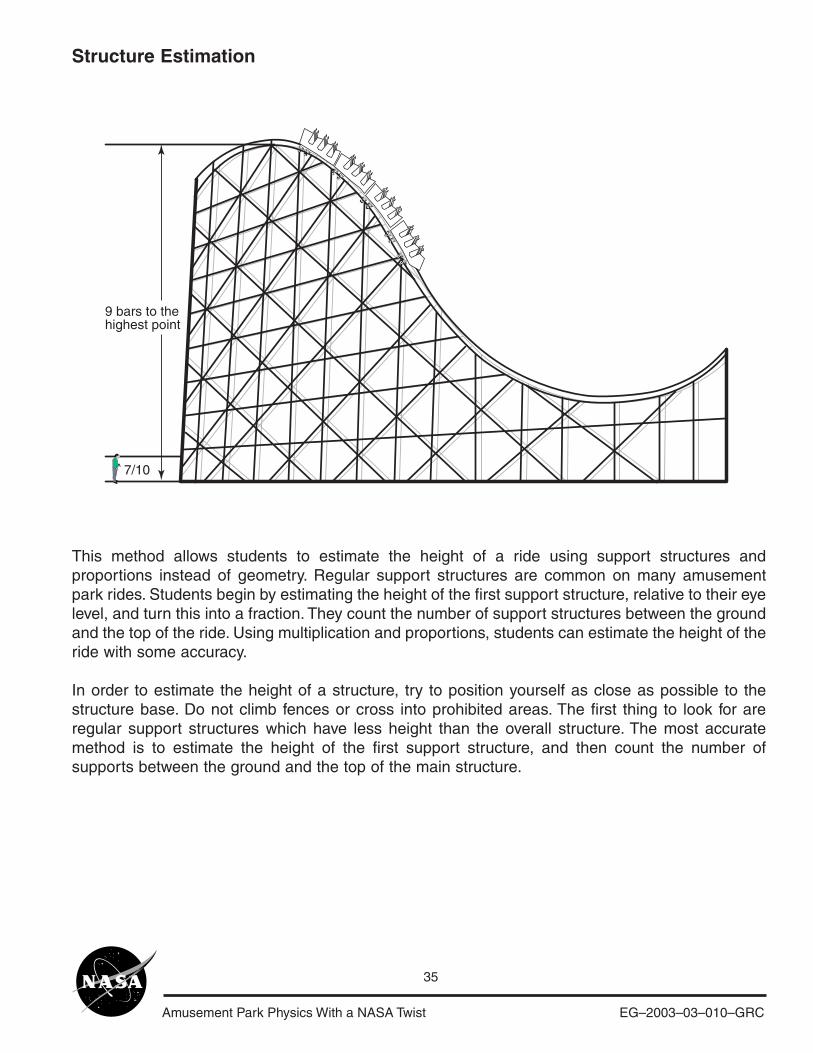
This method allows students to estimate the height of a ride using support structures andproportions instead of geometry. Regular support structures are common on many amusementpark rides. Students begin by estimating the height of the first support structure, relative to their eyelevel, and turn this into a fraction. They count the number of support structures between the groundand the top of the ride. Using multiplication and proportions, students can estimate the height of theride with some accuracy.
In order to estimate the height of a structure, try to position yourself as close as possible to thestructure base. Do not climb fences or cross into prohibited areas. The first thing to look for areregular support structures which have less height than the overall structure. The most accuratemethod is to estimate the height of the first support structure, and then count the number ofsupports between the ground and the top of the main structure.
9 bars to thehighest point
7/10
Amusement Park Physics With a NASA Twist EG–2003–03–010–GRC
36
Procedure1.
2.
3.
4.
Summarizing the measurements in the above example:The overall height of the ride = number of structures � H
= number of structures � eye level height/span fraction
= 9 � (1.4 meters/0.7) = 9 � 2 meters = 18 meters
Note: When calculating distances, students often progressthrough the steps without considering whether their finalanswer is reasonable. One might consider having themestimate the height of the school building by counting rows ofbricks, and multiplying this number by the height of eachbrick. Have them compare this height to the height theycomputed for the flagpole. Ask them to determine, based ontheir calculations, which is taller, the school building or theflagpole? Is this a reasonable outcome?
Sight the height of your eye level to a target point on the firststructure nearest the ground using the sighting tube on thealtitude tracker. Be sure to hold the altitude tracker levelaligned horizontally while doing this. Make note of the targetpoint on the structure. This target point is your eye levelheight. See diagram shown.Estimate the fraction of the target point to the height of the firstsupport structure, to the nearest 1/10. This may take somepractice to be able to do accurately. For example, in the diagramshown, a good estimate would be 7/10 the height of the firstsupport structure. This fraction is called the span fraction.Use formula H (support structure) = eye level height/spanfraction to estimate the overall height of the support struc-ture. In this example, if your eye level height was 1.4 meters,then H = 1.4 meters/0.7 = 2 meters, then you would haveestimated the support structure to be 2 meters.Count the number of these structures to the highest pointand multiply the height, or H, by the number of structures.In this example, you would multiply 2 meters by 9 to get18 meters in height.
Amusement Park Physics With a NASA Twist EG–2003–03–010–GRC
37
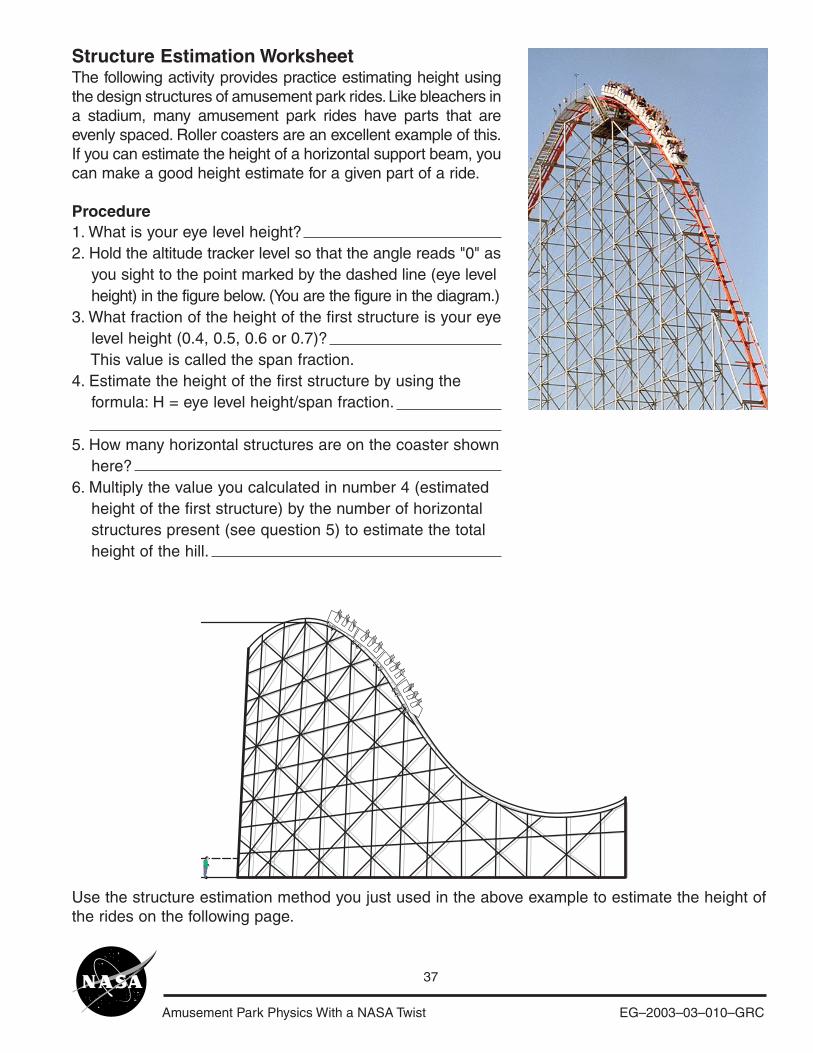
Structure Estimation WorksheetThe following activity provides practice estimating height usingthe design structures of amusement park rides. Like bleachers ina stadium, many amusement park rides have parts that areevenly spaced. Roller coasters are an excellent example of this.If you can estimate the height of a horizontal support beam, youcan make a good height estimate for a given part of a ride.
Procedure1. What is your eye level height?2. Hold the altitude tracker level so that the angle reads "0" as you sight to the point marked by the dashed line (eye level height) in the figure below. (You are the figure in the diagram.)3. What fraction of the height of the first structure is your eye level height (0.4, 0.5, 0.6 or 0.7)? This value is called the span fraction.4. Estimate the height of the first structure by using the formula: H = eye level height/span fraction.
5. How many horizontal structures are on the coaster shown here?6. Multiply the value you calculated in number 4 (estimated height of the first structure) by the number of horizontal structures present (see question 5) to estimate the total height of the hill.
Use the structure estimation method you just used in the above example to estimate the height ofthe rides on the following page.
Amusement Park Physics With a NASA Twist EG–2003–03–010–GRC
38
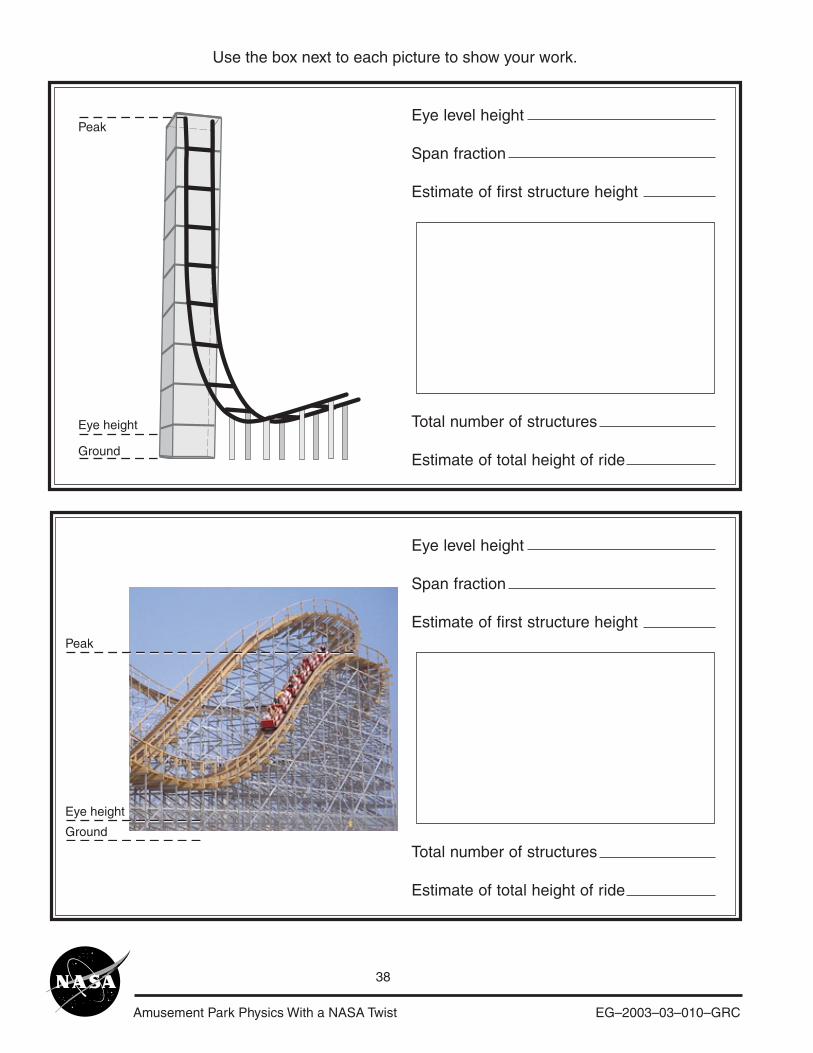
Eye level height
Span fraction
Estimate of first structure height
Total number of structures
Estimate of total height of ride
Use the box next to each picture to show your work.
Peak
Eye height
Ground
Peak
Eye height
Ground
Eye level height
Span fraction
Estimate of first structure height
Total number of structures
Estimate of total height of ride
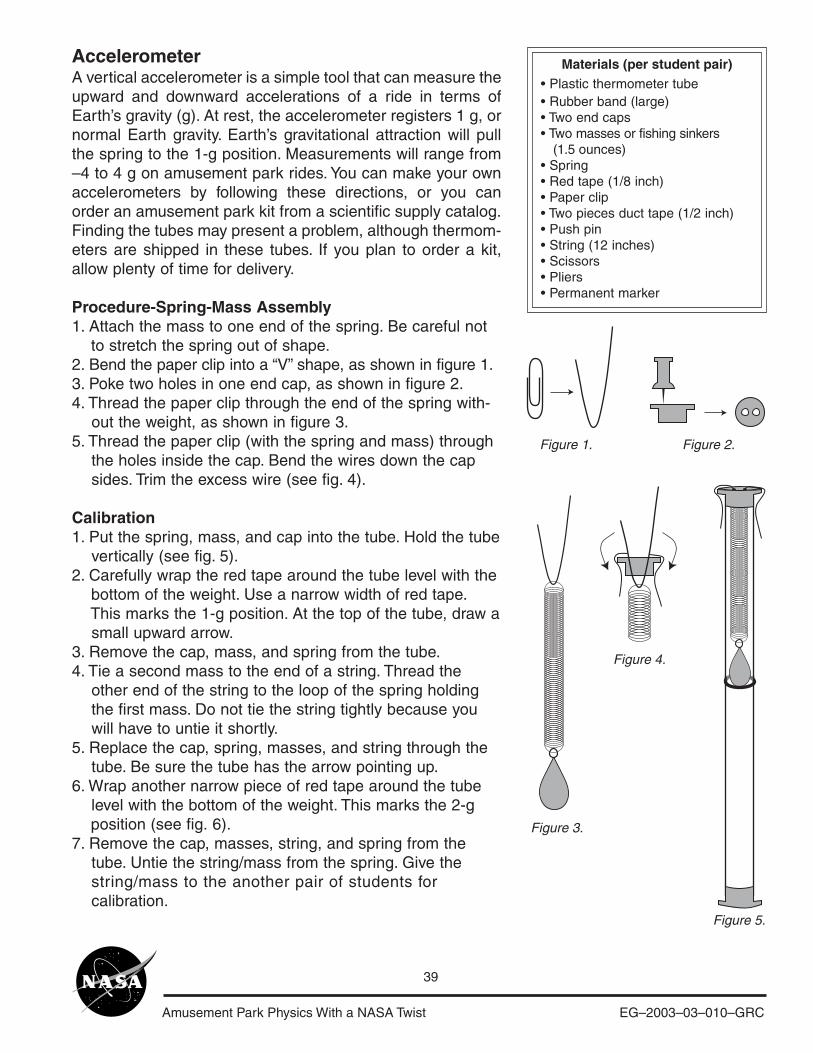
Amusement Park Physics With a NASA Twist EG–2003–03–010–GRC
39
AccelerometerA vertical accelerometer is a simple tool that can measure theupward and downward accelerations of a ride in terms ofEarth’s gravity (g). At rest, the accelerometer registers 1 g, ornormal Earth gravity. Earth’s gravitational attraction will pullthe spring to the 1-g position. Measurements will range from–4 to 4 g on amusement park rides. You can make your ownaccelerometers by following these directions, or you canorder an amusement park kit from a scientific supply catalog.Finding the tubes may present a problem, although thermom-eters are shipped in these tubes. If you plan to order a kit,allow plenty of time for delivery.
Procedure-Spring-Mass Assembly1. Attach the mass to one end of the spring. Be careful not to stretch the spring out of shape.2. Bend the paper clip into a “V” shape, as shown in figure 1.3. Poke two holes in one end cap, as shown in figure 2.4. Thread the paper clip through the end of the spring with- out the weight, as shown in figure 3.5. Thread the paper clip (with the spring and mass) through the holes inside the cap. Bend the wires down the cap sides. Trim the excess wire (see fig. 4).
Calibration1. Put the spring, mass, and cap into the tube. Hold the tube vertically (see fig. 5).2. Carefully wrap the red tape around the tube level with the bottom of the weight. Use a narrow width of red tape. This marks the 1-g position. At the top of the tube, draw a small upward arrow.3. Remove the cap, mass, and spring from the tube.4. Tie a second mass to the end of a string. Thread the other end of the string to the loop of the spring holding the first mass. Do not tie the string tightly because you will have to untie it shortly.5. Replace the cap, spring, masses, and string through the tube. Be sure the tube has the arrow pointing up.6. Wrap another narrow piece of red tape around the tube level with the bottom of the weight. This marks the 2-g position (see fig. 6).7. Remove the cap, masses, string, and spring from the tube. Untie the string/mass from the spring. Give the string/mass to the another pair of students for calibration.
Materials (per student pair)• Plastic thermometer tube• Rubber band (large)• Two end caps• Two masses or fishing sinkers (1.5 ounces)• Spring• Red tape (1/8 inch)• Paper clip• Two pieces duct tape (1/2 inch)• Push pin• String (12 inches)• Scissors• Pliers• Permanent marker
Figure 1. Figure 2.
Figure 3.
Figure 4.
Figure 5.
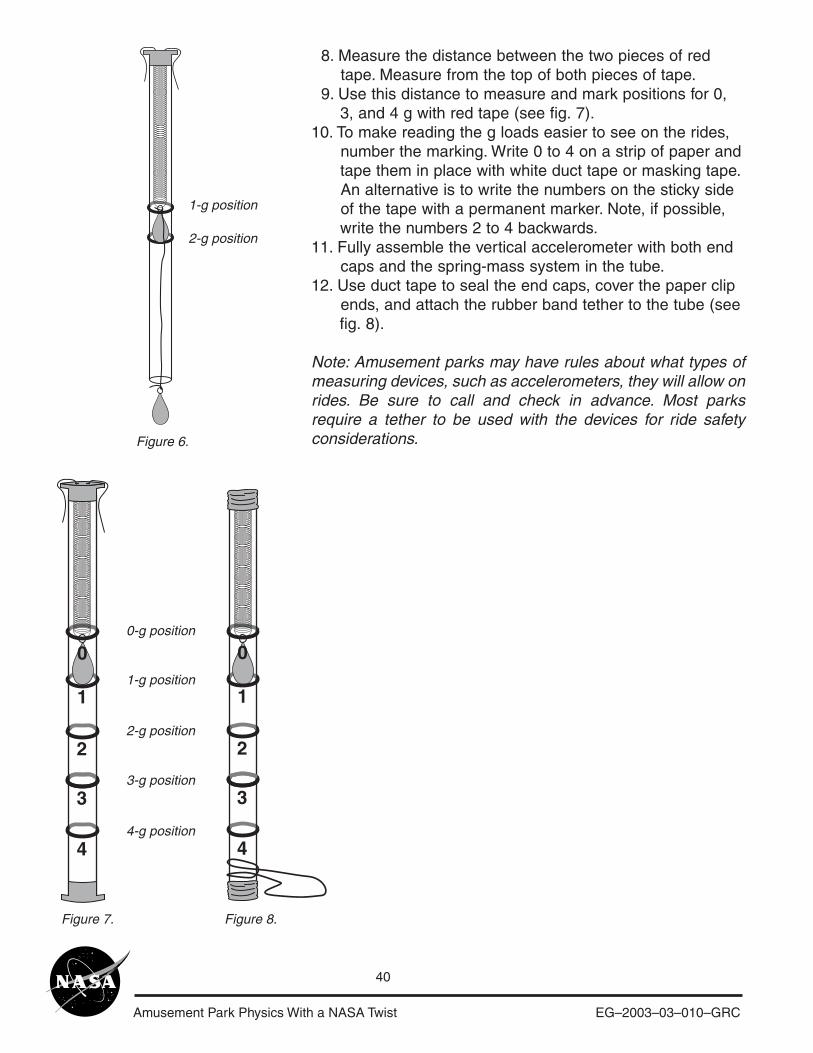
Amusement Park Physics With a NASA Twist EG–2003–03–010–GRC
40
8. Measure the distance between the two pieces of red tape. Measure from the top of both pieces of tape. 9. Use this distance to measure and mark positions for 0, 3, and 4 g with red tape (see fig. 7).10. To make reading the g loads easier to see on the rides, number the marking. Write 0 to 4 on a strip of paper and tape them in place with white duct tape or masking tape. An alternative is to write the numbers on the sticky side of the tape with a permanent marker. Note, if possible, write the numbers 2 to 4 backwards.11. Fully assemble the vertical accelerometer with both end caps and the spring-mass system in the tube.12. Use duct tape to seal the end caps, cover the paper clip ends, and attach the rubber band tether to the tube (see fig. 8).
Note: Amusement parks may have rules about what types ofmeasuring devices, such as accelerometers, they will allow onrides. Be sure to call and check in advance. Most parksrequire a tether to be used with the devices for ride safetyconsiderations.
4
3
2
1
0
4
3
2
1
0
Figure 8.Figure 7.
Figure 6.
1-g position
2-g position
1-g position
2-g position
3-g position
4-g position
0-g position
Amusement Park Physics With a NASA Twist EG–2003–03–010–GRC
41
Errors in MeasurementWhenever something such as the thickness of a book or the length of a table is measured, there isalways error involved in the measurement process. It doesn’t mean that the person performing themeasuring has measured it wrong. It is inherent in the measuring process. No measuring device is orcan be 100 percent precise. For example, if one is using a ruler to measure length, and the smallestdivision on the ruler is 1/8 of an inch, the precision of that ruler is 1/8 of an inch. If the smallest division is1/16 of an inch, then the precision is 1/16 of an inch. Notice that by dividing the ruler into more divisions,the greater the precision, but it can never measure anything perfectly. This is not possible for anymeasurement tool. For this to be so, the tool would have to have an infinite number of divisions. Becausewe are always limited to finite-scale measuring instruments, there will always be an associateduncertainty called error. Also, remember that if your ruler only measures with a precision of 1/8 of aninch, you cannot state that you found a length to the nearest 1/16. Your measurement device will notallow you to have that high of a precision.
Since some tools have more divisions than others, some are more precise than others. Using moreprecise tools means that one’s answer is a better estimate of the actual length, but it is still an estimate.At the amusement park, the tools used to perform these activities are not very precise. They only give arough estimate of the actual measurements allowing the student to make observations and predictionsbased on patterns. The answer key and the measures and values that are found are also not exact. Theteacher should expect to have answers that are in the range of those found in the key.
In some instances the student will be pacing to find some distances, using estimation of structures, andusing eye level for height. Because they will not be using a standardized measurement device, such asa ruler, expect a large amount of error. Every time the student records a measurement, consider thepossible sources of error. By increasing the number of times that he or she takes a measurement, theaverage or mean value of these measurements will more closely resemble the actual value of thequantity he or she is trying to measure assuming that the student used the tool correctly. This is becausehe or she is just as likely to measure a value that is slightly too high as one that is too low, therefore,these errors will “average themselves out.”
If a value that is recorded involves an estimate that is to be multiplied with another estimated value, theerror is multiplied also. This is called error propagation, and it can be significant especially when thereare several steps of measurements multiplied within a problem. It cannot be avoided, but be aware thatalong with the measurements, the error continues to be multiplied and it is inherent in the final value.
As an example, if the students want to measure the base of a roller coaster hill, they would pace off thedistance, using their pacing distance. If they estimate that two of their steps is about a meter in length,there is some error in this measurement. Also, they may not take the same size steps each time. Sowhen they walk a 30-meter baseline, this error increases. However, the longer the distance, the morelikely the short and long steps will average themselves out, thus giving them a better overall estimate.The use of the altitude tracker to measure the height of a structure can allow for more errors. Did theylook through the same part of the hole; did they sight to the top of the structure at the same point eachtime—in other words, were they consistent when taking their measurements? This gives the studentsome idea of why there is no “exact” answer when taking measurements. Scientists and researchersalways try to reduce the error as much as possible, but some error is always present.

Amusement Park Physics With a NASA Twist EG–2003–03–010–GRC
42
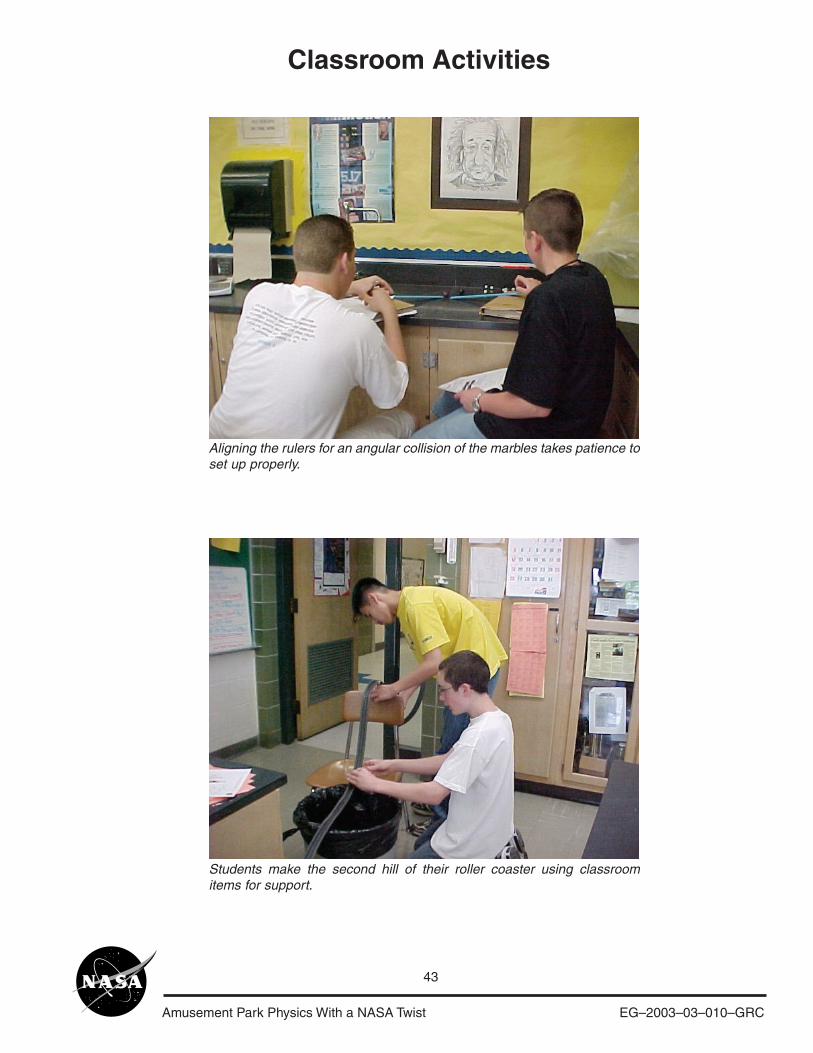
Amusement Park Physics With a NASA Twist EG–2003–03–010–GRC
43
Classroom Activities
Aligning the rulers for an angular collision of the marbles takes patience toset up properly.
Students make the second hill of their roller coaster using classroomitems for support.

Amusement Park Physics With a NASA Twist EG–2003–03–010–GRC
44
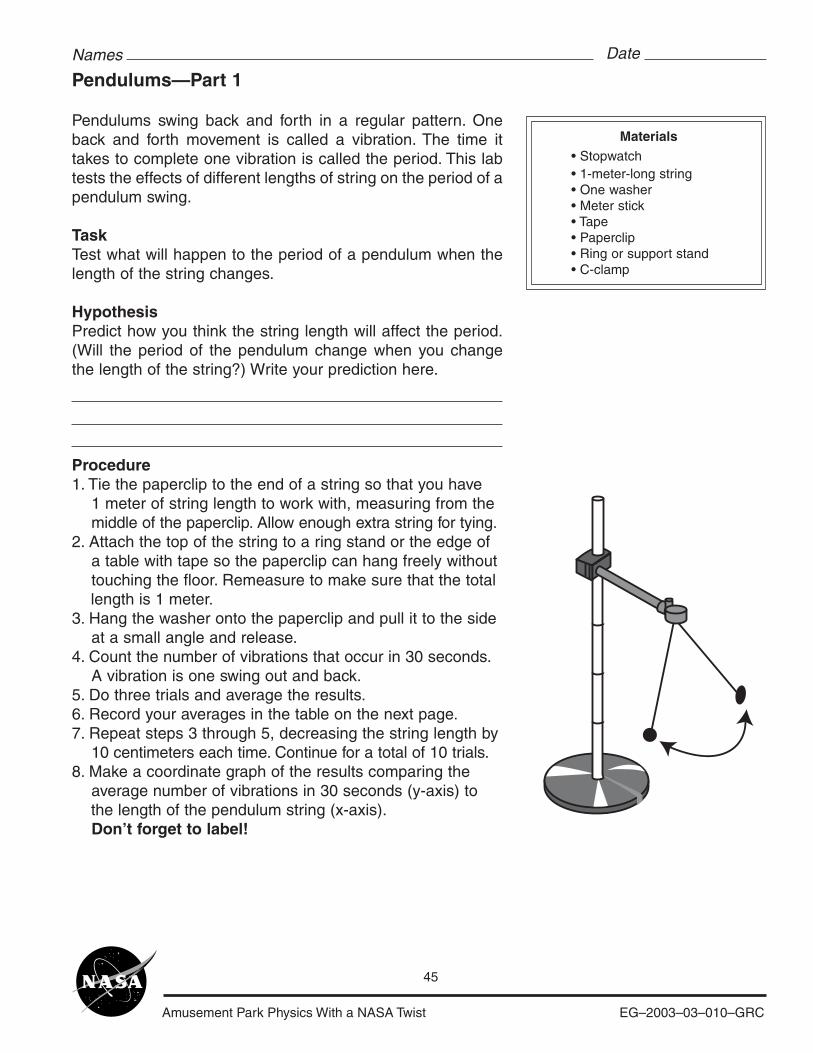
Amusement Park Physics With a NASA Twist EG–2003–03–010–GRC
45
Pendulums—Part 1
Pendulums swing back and forth in a regular pattern. Oneback and forth movement is called a vibration. The time ittakes to complete one vibration is called the period. This labtests the effects of different lengths of string on the period of apendulum swing.
TaskTest what will happen to the period of a pendulum when thelength of the string changes.
HypothesisPredict how you think the string length will affect the period.(Will the period of the pendulum change when you changethe length of the string?) Write your prediction here.
Procedure1. Tie the paperclip to the end of a string so that you have 1 meter of string length to work with, measuring from the middle of the paperclip. Allow enough extra string for tying.2. Attach the top of the string to a ring stand or the edge of a table with tape so the paperclip can hang freely without touching the floor. Remeasure to make sure that the total length is 1 meter.3. Hang the washer onto the paperclip and pull it to the side at a small angle and release.4. Count the number of vibrations that occur in 30 seconds. A vibration is one swing out and back.5. Do three trials and average the results.6. Record your averages in the table on the next page.7. Repeat steps 3 through 5, decreasing the string length by 10 centimeters each time. Continue for a total of 10 trials.8. Make a coordinate graph of the results comparing the average number of vibrations in 30 seconds (y-axis) to the length of the pendulum string (x-axis). Don’t forget to label!
Materials• Stopwatch• 1-meter-long string• One washer• Meter stick• Tape• Paperclip• Ring or support stand• C-clamp
Names Date
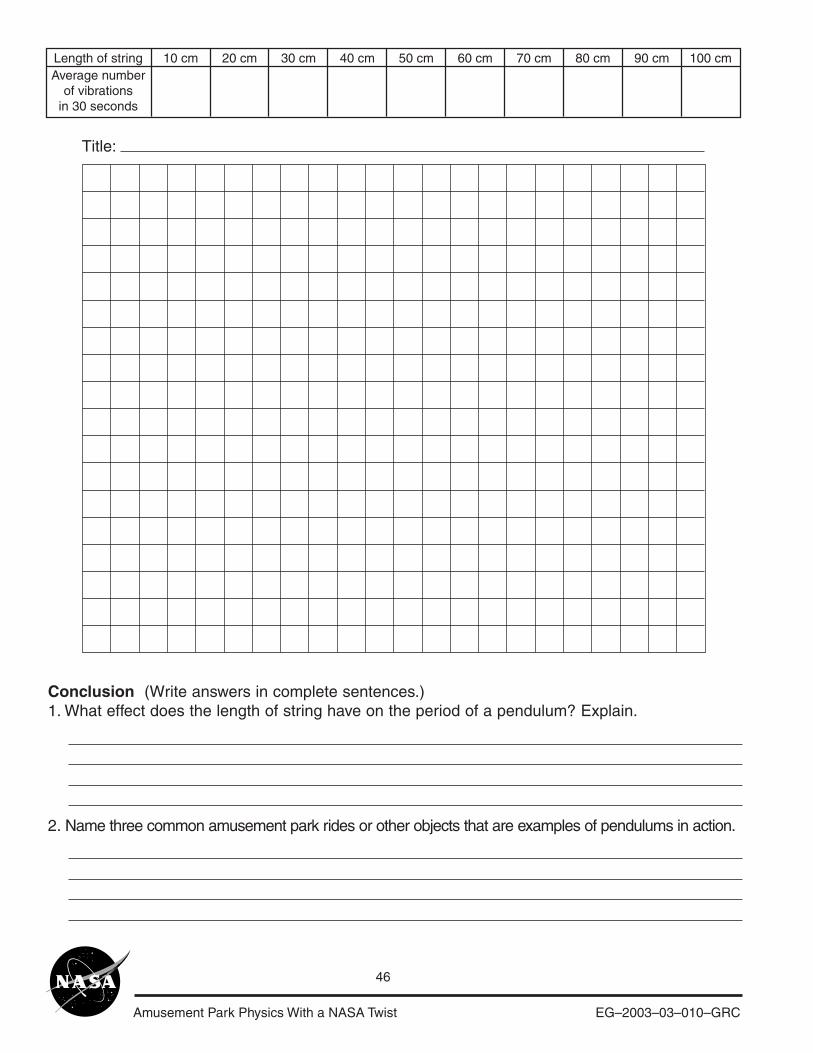
Amusement Park Physics With a NASA Twist EG–2003–03–010–GRC
46
Length of string 10 cm 20 cm 30 cm 40 cm 50 cm 60 cm 70 cm 80 cm 90 cm 100 cmAverage number
of vibrationsin 30 seconds
Conclusion (Write answers in complete sentences.)1. What effect does the length of string have on the period of a pendulum? Explain.
2. Name three common amusement park rides or other objects that are examples of pendulums in action.
Title:
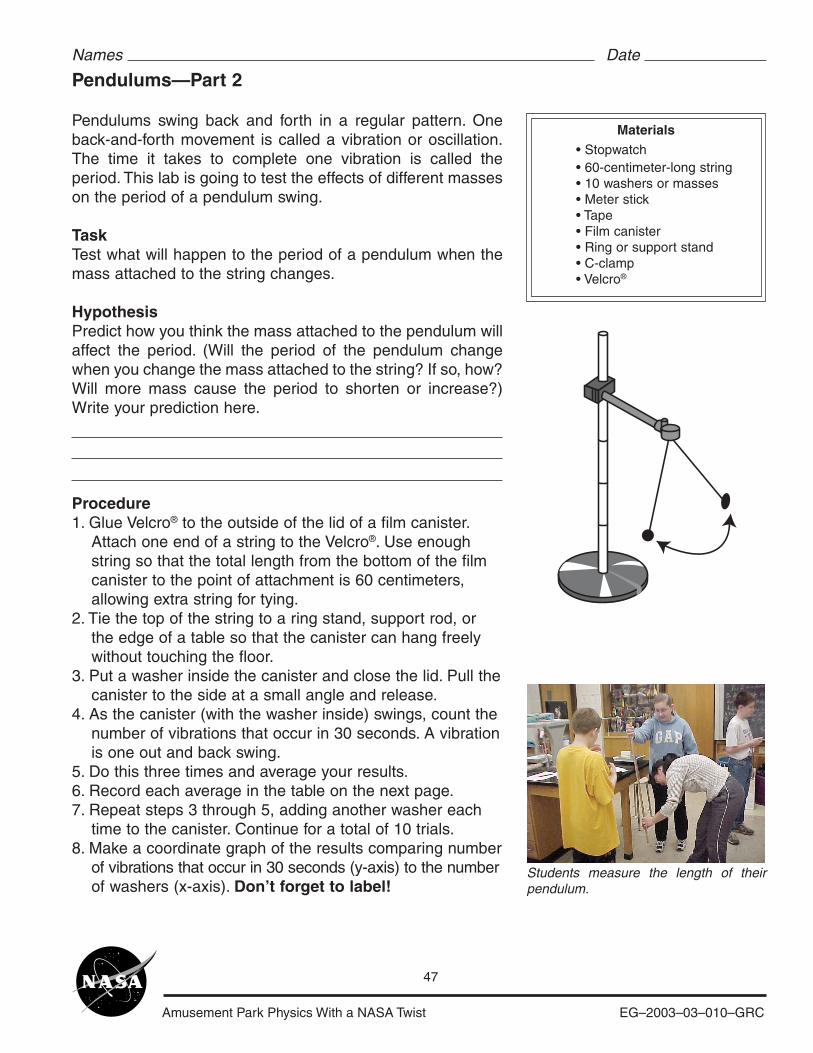
Amusement Park Physics With a NASA Twist EG–2003–03–010–GRC
47
Pendulums—Part 2
Pendulums swing back and forth in a regular pattern. Oneback-and-forth movement is called a vibration or oscillation.The time it takes to complete one vibration is called theperiod. This lab is going to test the effects of different masseson the period of a pendulum swing.
TaskTest what will happen to the period of a pendulum when themass attached to the string changes.
HypothesisPredict how you think the mass attached to the pendulum willaffect the period. (Will the period of the pendulum changewhen you change the mass attached to the string? If so, how?Will more mass cause the period to shorten or increase?)Write your prediction here.
Procedure1. Glue Velcro® to the outside of the lid of a film canister. Attach one end of a string to the Velcro®. Use enough string so that the total length from the bottom of the film canister to the point of attachment is 60 centimeters, allowing extra string for tying.2. Tie the top of the string to a ring stand, support rod, or the edge of a table so that the canister can hang freely without touching the floor.3. Put a washer inside the canister and close the lid. Pull the canister to the side at a small angle and release.4. As the canister (with the washer inside) swings, count the number of vibrations that occur in 30 seconds. A vibration is one out and back swing.5. Do this three times and average your results.6. Record each average in the table on the next page.7. Repeat steps 3 through 5, adding another washer each time to the canister. Continue for a total of 10 trials.8. Make a coordinate graph of the results comparing number of vibrations that occur in 30 seconds (y-axis) to the number of washers (x-axis). Don’t forget to label!
Materials• Stopwatch• 60-centimeter-long string• 10 washers or masses• Meter stick• Tape• Film canister• Ring or support stand• C-clamp• Velcro®
Names Date
Students measure the length of theirpendulum.
Amusement Park Physics With a NASA Twist EG–2003–03–010–GRC
48
Conclusion (Write answers in complete sentences.)1. What effect does the mass attached to the string have on the period of a pendulum?
2. Two grandfather clocks are built at factories across town from each other. One is made of bronze and one is made of plastic. Is it possible for the two clocks to keep the same time? Explain.
Title:
Number of washers 1 2 3 4 5 6 7 8 9 10Average number
of vibrationsin 30 seconds
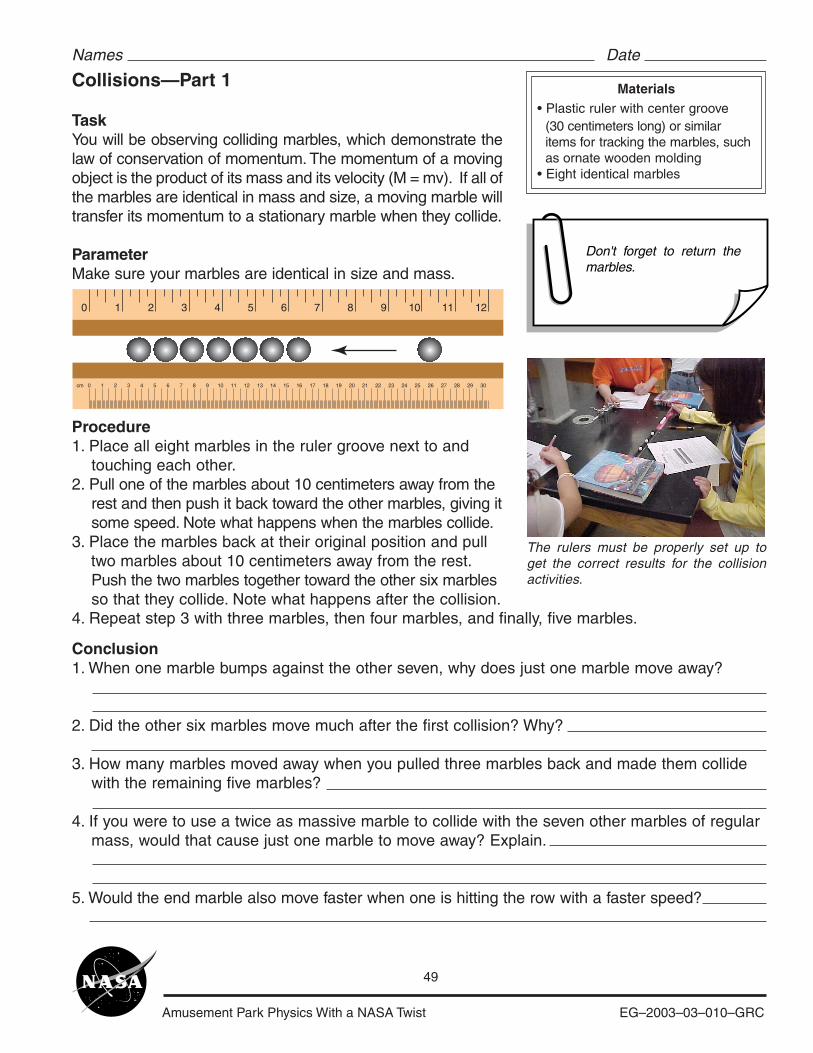
Amusement Park Physics With a NASA Twist EG–2003–03–010–GRC
49
Collisions—Part 1
TaskYou will be observing colliding marbles, which demonstrate thelaw of conservation of momentum. The momentum of a movingobject is the product of its mass and its velocity (M = mv). If all ofthe marbles are identical in mass and size, a moving marble willtransfer its momentum to a stationary marble when they collide.
ParameterMake sure your marbles are identical in size and mass.
Procedure1. Place all eight marbles in the ruler groove next to and touching each other.2. Pull one of the marbles about 10 centimeters away from the rest and then push it back toward the other marbles, giving it some speed. Note what happens when the marbles collide.3. Place the marbles back at their original position and pull two marbles about 10 centimeters away from the rest. Push the two marbles together toward the other six marbles so that they collide. Note what happens after the collision.
Names Date
10
10cm 2 3 4 5 6 7 8 9 10 11 12 13 14 15 16 17 18 19 20 21 22 23 24 25 26 27 28 29 30
2 3 4 5 6 7 8 9 10 11 12
Materials• Plastic ruler with center groove (30 centimeters long) or similar items for tracking the marbles, such as ornate wooden molding• Eight identical marbles
Don't forget to return the marbles.
The rulers must be properly set up toget the correct results for the collisionactivities.
Conclusion1. When one marble bumps against the other seven, why does just one marble move away?
2. Did the other six marbles move much after the first collision? Why?
3. How many marbles moved away when you pulled three marbles back and made them collide with the remaining five marbles?
4. If you were to use a twice as massive marble to collide with the seven other marbles of regular mass, would that cause just one marble to move away? Explain.
5. Would the end marble also move faster when one is hitting the row with a faster speed?
4. Repeat step 3 with three marbles, then four marbles, and finally, five marbles.
Amusement Park Physics With a NASA Twist EG–2003–03–010–GRC
50
Collisions—Part 2
TaskYou will cause two moving marbles to collide and observe thedirection of the movement after collision.
ParametersMake sure your marbles are identical in size and mass.
Procedure1. Make a ramp using each of the rulers and a support, such as a board or a book.2. Place the ends of the rulers that are resting on the table facing each other separated by a 10-centimeter distance, as shown in figure 1.3. Place a marble at the top of each ruler and then release the marbles at the same time. Note and record the direction of movement after the marbles collide.
4. Move the rulers farther apart so that there is 20 centimeters between them. Place a marble at the top of each ruler. Give one of the marbles a push, and let the other marble roll without a push (one fast-moving, one slow-moving). Note and record the differences between this collision and the collision in the previous step.
5. Place one marble on the table 10 centimeters from the base end of one ruler to be a target. Place the other marble at the top of the ruler ramp, releasing it to hit the target marble. Note and record the direction of movement after the marbles collide (see fig. 2).
6. Change the direction of the rulers so that they will collide and hit perpendicular to each other. Note and record the direction of movement after the marbles collide (see fig. 3).
Names Date
Materials• Plastic ruler with center groove (30 centimeters long) or similar items for tracking the marbles, such as ornate wooden molding• Two identical marbles• Two identical books or boards to use as ramp supports
Figure 1.
Figure 2.
Figure 3.
10 cm
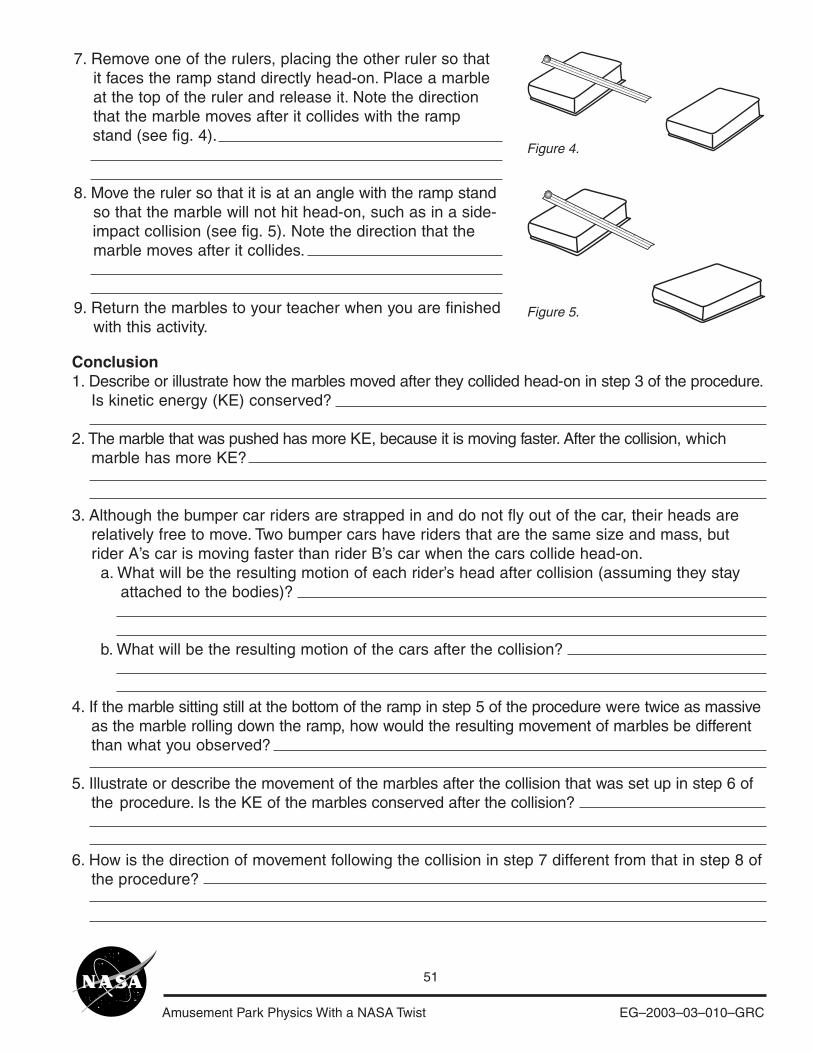
Amusement Park Physics With a NASA Twist EG–2003–03–010–GRC
51
Conclusion1. Describe or illustrate how the marbles moved after they collided head-on in step 3 of the procedure. Is kinetic energy (KE) conserved?
2. The marble that was pushed has more KE, because it is moving faster. After the collision, which marble has more KE?
3. Although the bumper car riders are strapped in and do not fly out of the car, their heads are relatively free to move. Two bumper cars have riders that are the same size and mass, but rider A’s car is moving faster than rider B’s car when the cars collide head-on.
a. What will be the resulting motion of each rider’s head after collision (assuming they stay attached to the bodies)?
b. What will be the resulting motion of the cars after the collision?
4. If the marble sitting still at the bottom of the ramp in step 5 of the procedure were twice as massive as the marble rolling down the ramp, how would the resulting movement of marbles be different than what you observed?
5. Illustrate or describe the movement of the marbles after the collision that was set up in step 6 of the procedure. Is the KE of the marbles conserved after the collision?
6. How is the direction of movement following the collision in step 7 different from that in step 8 of the procedure?
7. Remove one of the rulers, placing the other ruler so that it faces the ramp stand directly head-on. Place a marble at the top of the ruler and release it. Note the direction that the marble moves after it collides with the ramp stand (see fig. 4).
8. Move the ruler so that it is at an angle with the ramp stand so that the marble will not hit head-on, such as in a side- impact collision (see fig. 5). Note the direction that the marble moves after it collides.
9. Return the marbles to your teacher when you are finished with this activity.
Figure 4.
Figure 5.
Amusement Park Physics With a NASA Twist EG–2003–03–010–GRC
52
Marble Run—Part 1
TaskTo work as a group to build a roller coaster and to diagram theforces of motion and energy transformations that apply to the track.
Parameters1. Use 5.49 meters (18 feet) of copper pipe insulation for the track.2. Select any type of marble, but only one marble. You will be able to make one switch if you want to change marble type.3. Avoid putting tape on the surface of the track on which the marble rides.4. This is not a race, so take time to enjoy it.
Procedure1. As a group, build a roller coaster that has
• An initial hill and one additional hill• A complete loop• A gap where two pieces of track do not touch each other• A run that a marble can roll the entire distance of the track (except at the gap)
2. Time five complete marble runs.3. Sketch the shape of the coaster below.4. Label the forces that are present during the marble run (include gravitational, centripetal, and frictional).5. Label energy transformations in your diagram where the potential energy and kinetic energy increases or decreases.
Names Date
Materials• Three half pieces of copper pipe insulation (gray, spongy); each piece 1.83 meters or 6 feet• Masking tape• One marble• Stopwatch• Meter stick
Don't forget to label!
Roller Coaster Diagram Average time for 5 trials
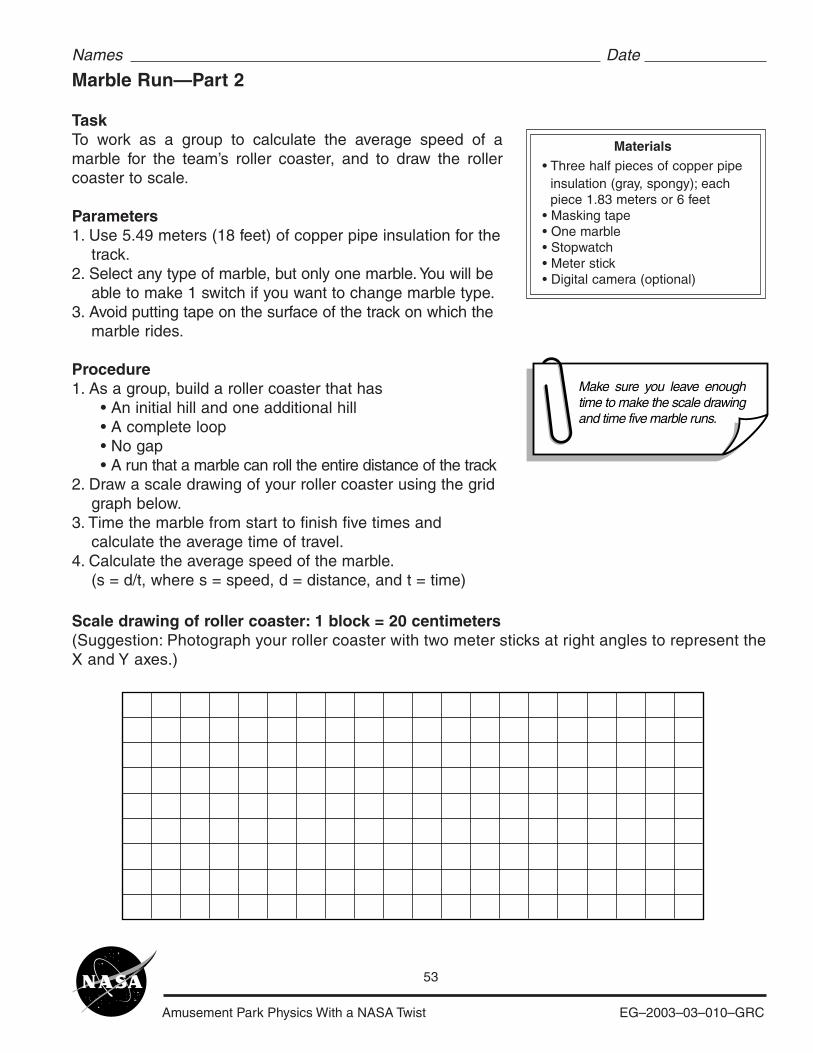
Amusement Park Physics With a NASA Twist EG–2003–03–010–GRC
53
Scale drawing of roller coaster: 1 block = 20 centimeters(Suggestion: Photograph your roller coaster with two meter sticks at right angles to represent theX and Y axes.)
Names Date
Materials• Three half pieces of copper pipe insulation (gray, spongy); each piece 1.83 meters or 6 feet• Masking tape• One marble• Stopwatch• Meter stick• Digital camera (optional)
Make sure you leave enough time to make the scale drawing and time five marble runs.
Marble Run—Part 2
TaskTo work as a group to calculate the average speed of amarble for the team’s roller coaster, and to draw the rollercoaster to scale.
Parameters1. Use 5.49 meters (18 feet) of copper pipe insulation for the track.2. Select any type of marble, but only one marble. You will be able to make 1 switch if you want to change marble type.3. Avoid putting tape on the surface of the track on which the marble rides.
Procedure1. As a group, build a roller coaster that has
• An initial hill and one additional hill• A complete loop• No gap• A run that a marble can roll the entire distance of the track
2. Draw a scale drawing of your roller coaster using the grid graph below.3. Time the marble from start to finish five times and calculate the average time of travel.4. Calculate the average speed of the marble. (s = d/t, where s = speed, d = distance, and t = time)
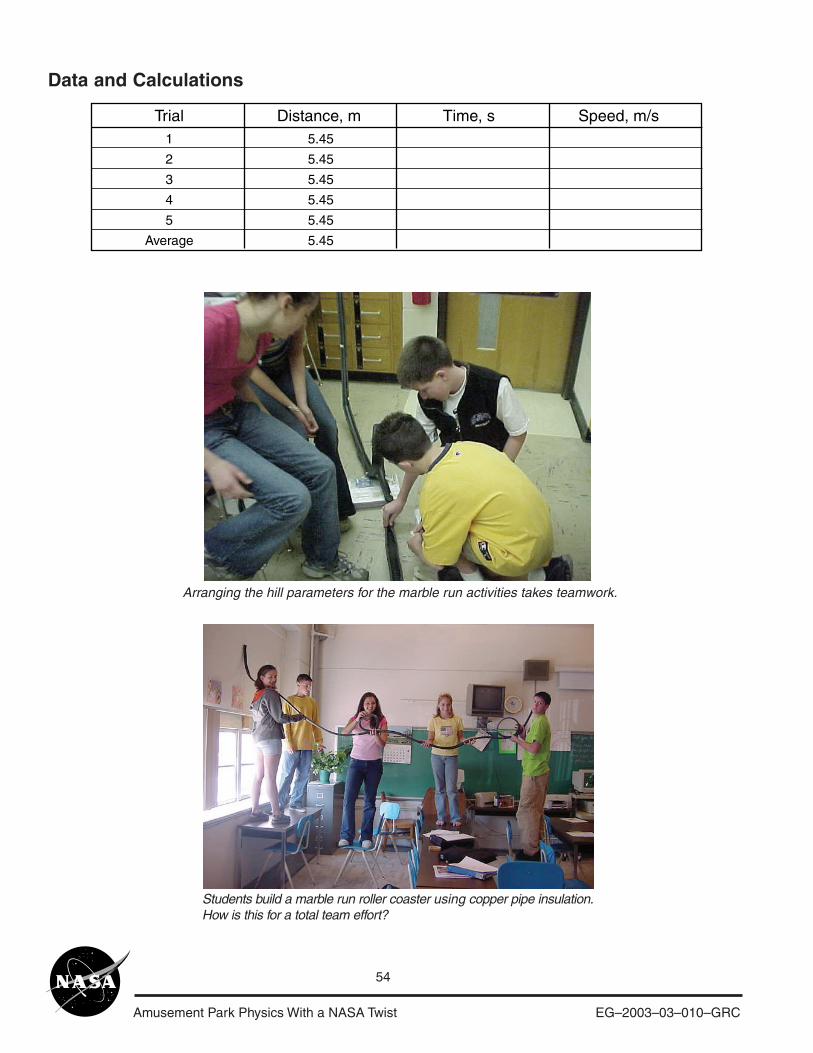
Amusement Park Physics With a NASA Twist EG–2003–03–010–GRC
54
Data and Calculations
Trial1
2
3
4
5
Average
5.45
5.45
5.45
5.45
5.45
5.45
Distance, m Time, s Speed, m/s
Arranging the hill parameters for the marble run activities takes teamwork.
Students build a marble run roller coaster using copper pipe insulation.How is this for a total team effort?
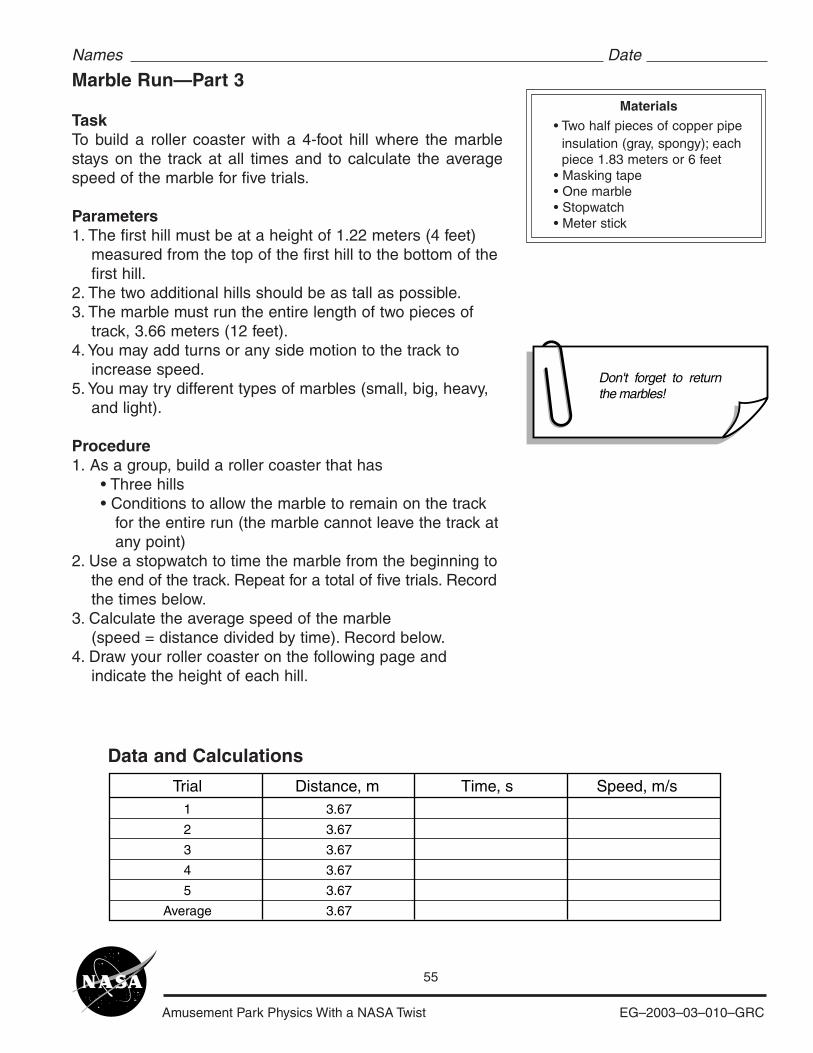
Amusement Park Physics With a NASA Twist EG–2003–03–010–GRC
55
Names Date
Materials• Two half pieces of copper pipe insulation (gray, spongy); each piece 1.83 meters or 6 feet• Masking tape• One marble• Stopwatch• Meter stick
Marble Run—Part 3
TaskTo build a roller coaster with a 4-foot hill where the marblestays on the track at all times and to calculate the averagespeed of the marble for five trials.
Parameters1. The first hill must be at a height of 1.22 meters (4 feet) measured from the top of the first hill to the bottom of the first hill.2. The two additional hills should be as tall as possible.3. The marble must run the entire length of two pieces of track, 3.66 meters (12 feet).4. You may add turns or any side motion to the track to increase speed.5. You may try different types of marbles (small, big, heavy, and light).
Procedure1. As a group, build a roller coaster that has
• Three hills• Conditions to allow the marble to remain on the track for the entire run (the marble cannot leave the track at any point)
2. Use a stopwatch to time the marble from the beginning to the end of the track. Repeat for a total of five trials. Record the times below.3. Calculate the average speed of the marble (speed = distance divided by time). Record below.4. Draw your roller coaster on the following page and indicate the height of each hill.
Don't forget to return the marbles!
Trial1
2
3
4
5
Average
3.67
3.67
3.67
3.67
3.67
3.67
Distance, m Time, s Speed, m/s
Data and Calculations
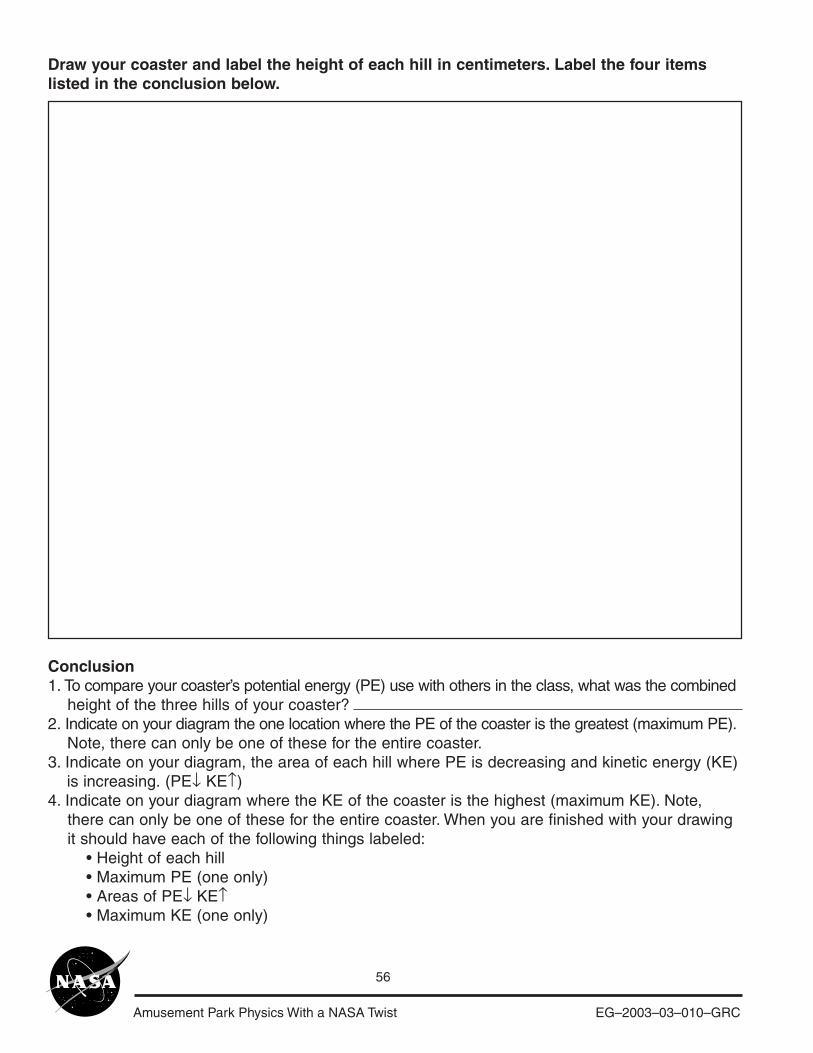
Amusement Park Physics With a NASA Twist EG–2003–03–010–GRC
56
Draw your coaster and label the height of each hill in centimeters. Label the four itemslisted in the conclusion below.
Conclusion1. To compare your coaster’s potential energy (PE) use with others in the class, what was the combined height of the three hills of your coaster?2. Indicate on your diagram the one location where the PE of the coaster is the greatest (maximum PE). Note, there can only be one of these for the entire coaster.3. Indicate on your diagram, the area of each hill where PE is decreasing and kinetic energy (KE) is increasing. (PE↓ KE↑)4. Indicate on your diagram where the KE of the coaster is the highest (maximum KE). Note, there can only be one of these for the entire coaster. When you are finished with your drawing it should have each of the following things labeled:
• Height of each hill• Maximum PE (one only)• Areas of PE↓ KE↑• Maximum KE (one only)
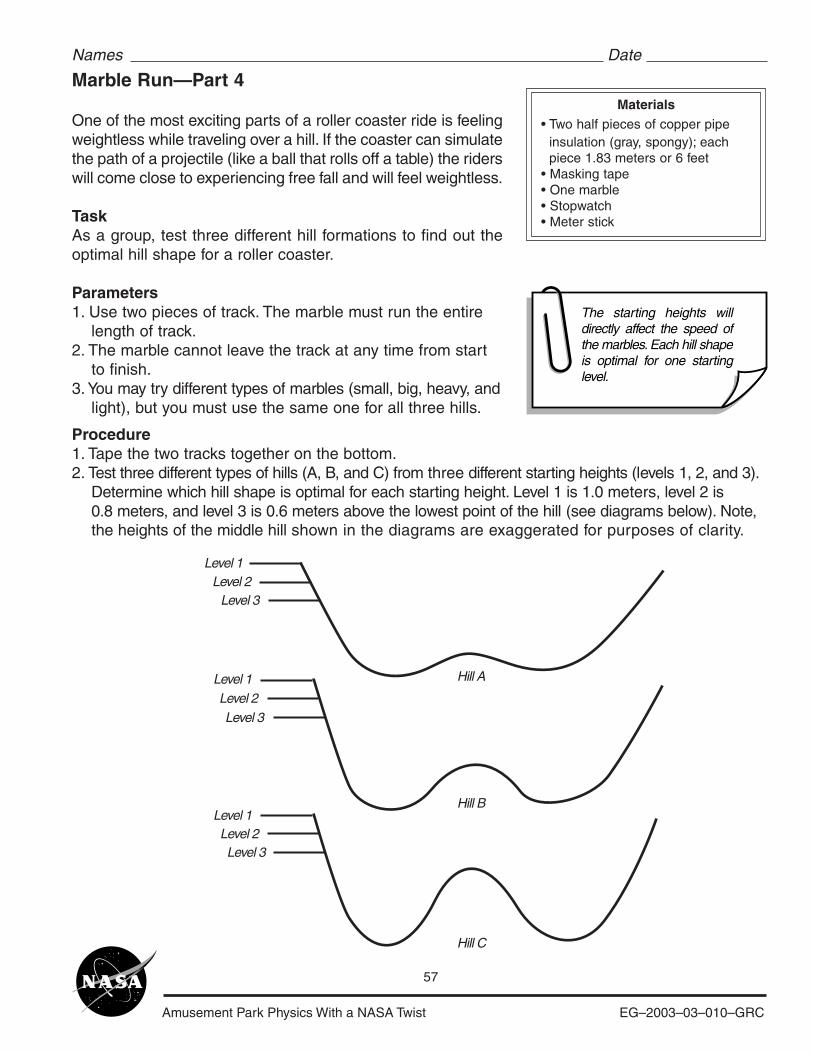
Amusement Park Physics With a NASA Twist EG–2003–03–010–GRC
57
Names Date
Materials• Two half pieces of copper pipe insulation (gray, spongy); each piece 1.83 meters or 6 feet• Masking tape• One marble• Stopwatch• Meter stick
Marble Run—Part 4
One of the most exciting parts of a roller coaster ride is feelingweightless while traveling over a hill. If the coaster can simulatethe path of a projectile (like a ball that rolls off a table) the riderswill come close to experiencing free fall and will feel weightless.
TaskAs a group, test three different hill formations to find out theoptimal hill shape for a roller coaster.
Parameters1. Use two pieces of track. The marble must run the entire length of track.2. The marble cannot leave the track at any time from start to finish.3. You may try different types of marbles (small, big, heavy, and light), but you must use the same one for all three hills.
The starting heights will directly affect the speed of the marbles. Each hill shape is optimal for one starting level.
Level 1Level 2
Level 3
Level 1Level 2Level 3
Level 1Level 2Level 3
Hill A
Hill B
Hill C
Procedure1. Tape the two tracks together on the bottom.2. Test three different types of hills (A, B, and C) from three different starting heights (levels 1, 2, and 3). Determine which hill shape is optimal for each starting height. Level 1 is 1.0 meters, level 2 is 0.8 meters, and level 3 is 0.6 meters above the lowest point of the hill (see diagrams below). Note, the heights of the middle hill shown in the diagrams are exaggerated for purposes of clarity.
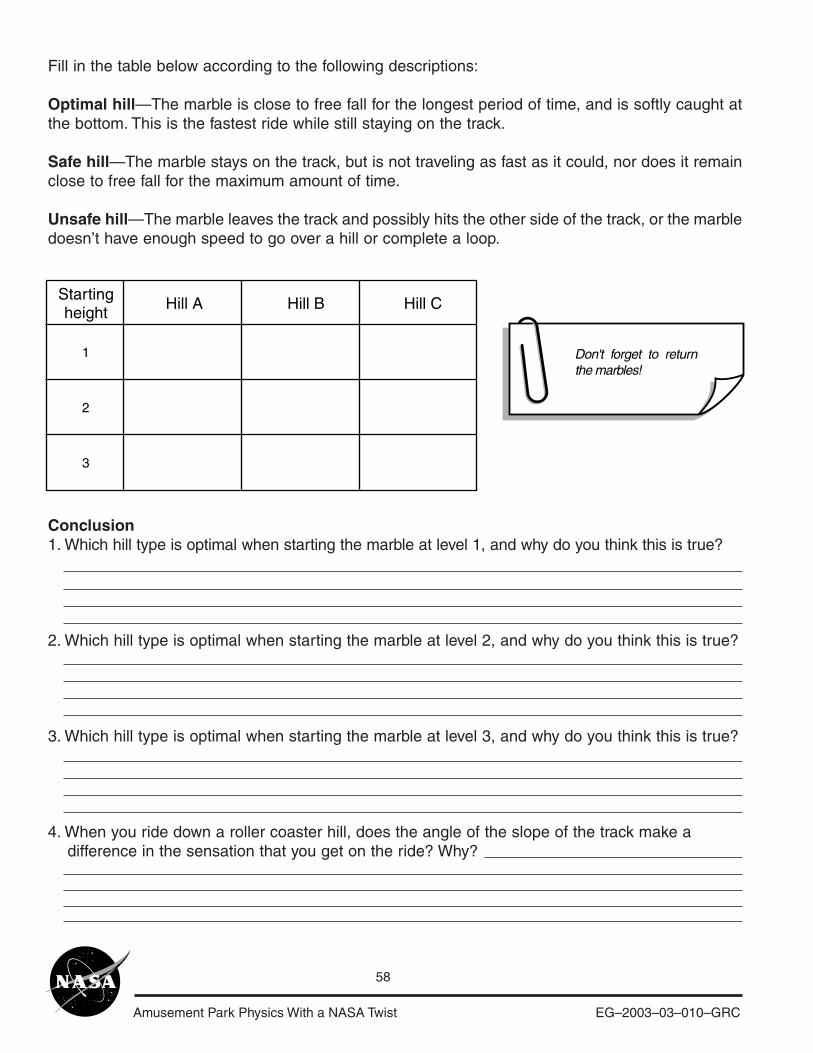
Amusement Park Physics With a NASA Twist EG–2003–03–010–GRC
58
Fill in the table below according to the following descriptions:
Optimal hill—The marble is close to free fall for the longest period of time, and is softly caught atthe bottom. This is the fastest ride while still staying on the track.
Safe hill—The marble stays on the track, but is not traveling as fast as it could, nor does it remainclose to free fall for the maximum amount of time.
Unsafe hill—The marble leaves the track and possibly hits the other side of the track, or the marbledoesn’t have enough speed to go over a hill or complete a loop.
Don't forget to return the marbles!
Startingheight
Hill A Hill B Hill C
1
2
3
Conclusion1. Which hill type is optimal when starting the marble at level 1, and why do you think this is true?
2. Which hill type is optimal when starting the marble at level 2, and why do you think this is true?
3. Which hill type is optimal when starting the marble at level 3, and why do you think this is true?
4. When you ride down a roller coaster hill, does the angle of the slope of the track make a difference in the sensation that you get on the ride? Why?
Amusement Park Physics With a NASA Twist EG–2003–03–010–GRC
59
NASA Connection—Student Reading Guide

Amusement Park Physics With a NASA Twist EG–2003–03–010–GRC
60
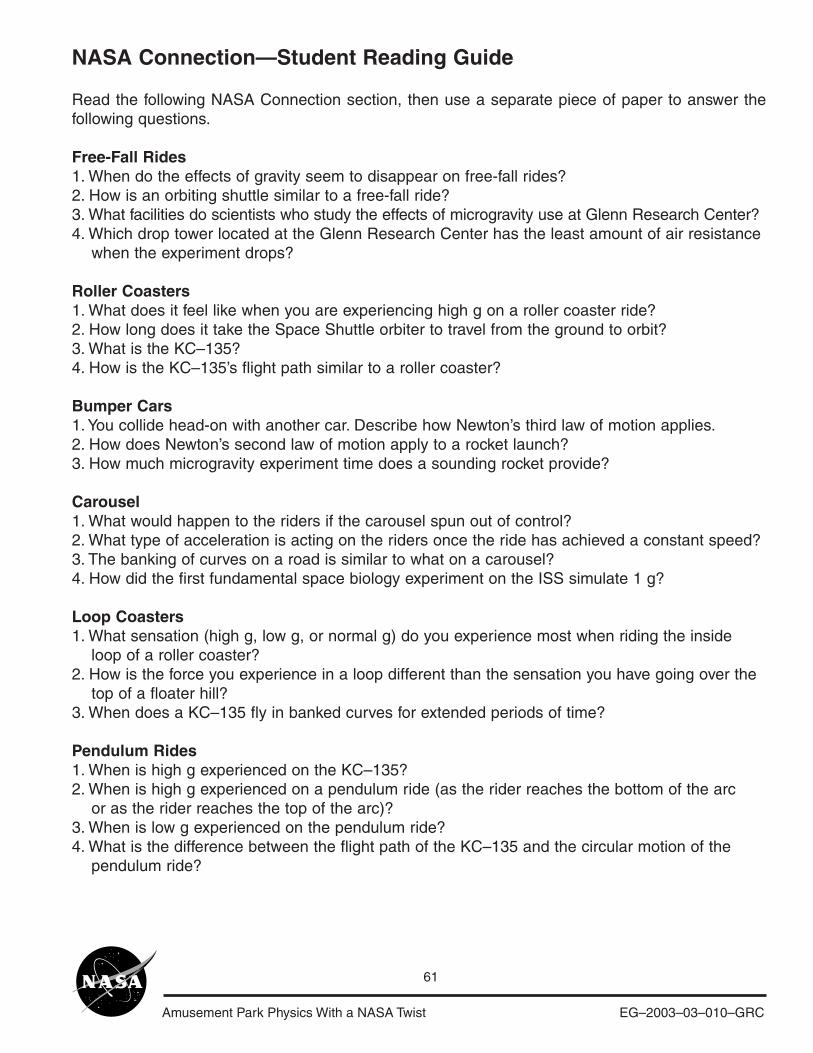
Amusement Park Physics With a NASA Twist EG–2003–03–010–GRC
61
NASA Connection—Student Reading Guide
Read the following NASA Connection section, then use a separate piece of paper to answer thefollowing questions.
Free-Fall Rides1. When do the effects of gravity seem to disappear on free-fall rides?2. How is an orbiting shuttle similar to a free-fall ride?3. What facilities do scientists who study the effects of microgravity use at Glenn Research Center?4. Which drop tower located at the Glenn Research Center has the least amount of air resistance when the experiment drops?
Roller Coasters1. What does it feel like when you are experiencing high g on a roller coaster ride?2. How long does it take the Space Shuttle orbiter to travel from the ground to orbit?3. What is the KC–135?4. How is the KC–135’s flight path similar to a roller coaster?
Bumper Cars1. You collide head-on with another car. Describe how Newton’s third law of motion applies.2. How does Newton’s second law of motion apply to a rocket launch?3. How much microgravity experiment time does a sounding rocket provide?
Carousel1. What would happen to the riders if the carousel spun out of control?2. What type of acceleration is acting on the riders once the ride has achieved a constant speed?3. The banking of curves on a road is similar to what on a carousel?4. How did the first fundamental space biology experiment on the ISS simulate 1 g?
Loop Coasters1. What sensation (high g, low g, or normal g) do you experience most when riding the inside loop of a roller coaster?2. How is the force you experience in a loop different than the sensation you have going over the top of a floater hill?3. When does a KC–135 fly in banked curves for extended periods of time?
Pendulum Rides1. When is high g experienced on the KC–135?2. When is high g experienced on a pendulum ride (as the rider reaches the bottom of the arc or as the rider reaches the top of the arc)?3. When is low g experienced on the pendulum ride?4. What is the difference between the flight path of the KC–135 and the circular motion of the pendulum ride?
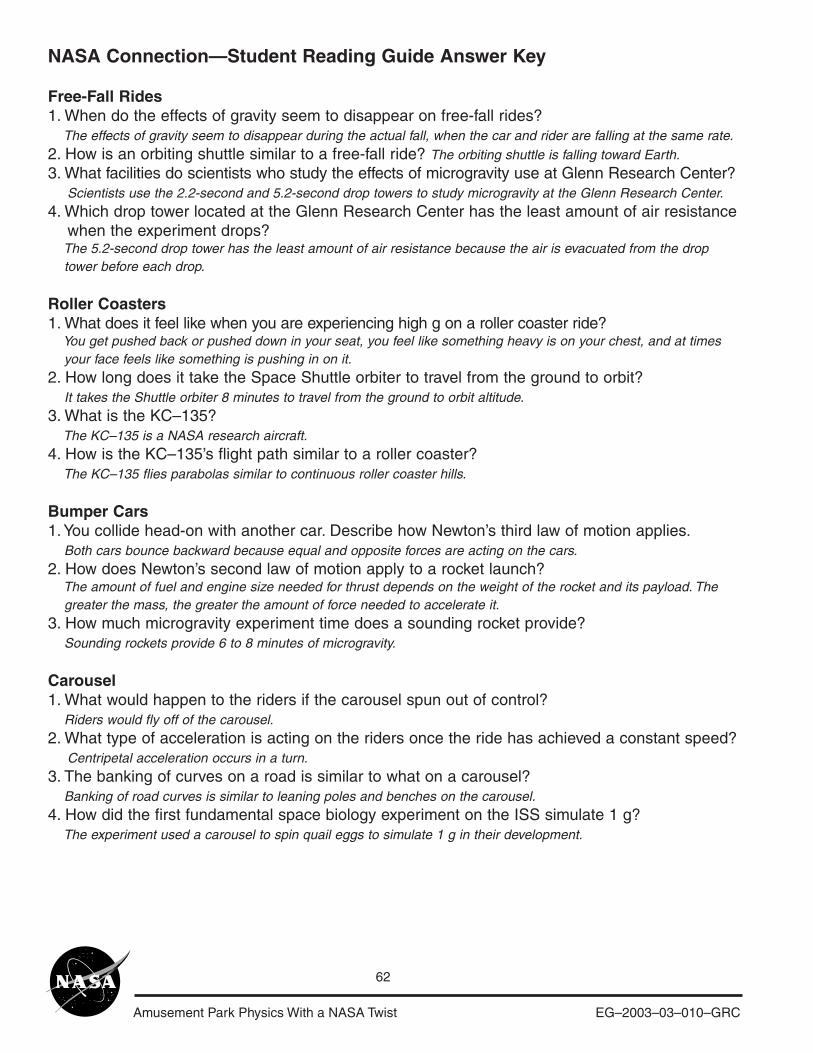
Amusement Park Physics With a NASA Twist EG–2003–03–010–GRC
62
NASA Connection—Student Reading Guide Answer Key
Free-Fall Rides1. When do the effects of gravity seem to disappear on free-fall rides? The effects of gravity seem to disappear during the actual fall, when the car and rider are falling at the same rate.2. How is an orbiting shuttle similar to a free-fall ride? The orbiting shuttle is falling toward Earth.3. What facilities do scientists who study the effects of microgravity use at Glenn Research Center? Scientists use the 2.2-second and 5.2-second drop towers to study microgravity at the Glenn Research Center.4. Which drop tower located at the Glenn Research Center has the least amount of air resistance when the experiment drops? The 5.2-second drop tower has the least amount of air resistance because the air is evacuated from the drop tower before each drop.
Roller Coasters1. What does it feel like when you are experiencing high g on a roller coaster ride? You get pushed back or pushed down in your seat, you feel like something heavy is on your chest, and at times your face feels like something is pushing in on it.2. How long does it take the Space Shuttle orbiter to travel from the ground to orbit? It takes the Shuttle orbiter 8 minutes to travel from the ground to orbit altitude.3. What is the KC–135? The KC–135 is a NASA research aircraft.4. How is the KC–135’s flight path similar to a roller coaster? The KC–135 flies parabolas similar to continuous roller coaster hills.
Bumper Cars1. You collide head-on with another car. Describe how Newton’s third law of motion applies. Both cars bounce backward because equal and opposite forces are acting on the cars.2. How does Newton’s second law of motion apply to a rocket launch? The amount of fuel and engine size needed for thrust depends on the weight of the rocket and its payload. The greater the mass, the greater the amount of force needed to accelerate it.3. How much microgravity experiment time does a sounding rocket provide? Sounding rockets provide 6 to 8 minutes of microgravity.
Carousel1. What would happen to the riders if the carousel spun out of control? Riders would fly off of the carousel.2. What type of acceleration is acting on the riders once the ride has achieved a constant speed? Centripetal acceleration occurs in a turn.3. The banking of curves on a road is similar to what on a carousel? Banking of road curves is similar to leaning poles and benches on the carousel.4. How did the first fundamental space biology experiment on the ISS simulate 1 g? The experiment used a carousel to spin quail eggs to simulate 1 g in their development.
Amusement Park Physics With a NASA Twist EG–2003–03–010–GRC
63
Loop Coasters1. What sensation (high g, low g, or normal g) do you experience most when riding the inside loop of a roller coaster? Most of the time the rider experiences high g in a loop. Depending on the geometry of the track and many other ride conditions, one may experience a range from low to normal to high g at the top of the loop.2. How is the force you experience in a loop different than the sensation you have going over the top of a floater hill? You feel pushed into your seat in the loop and you feel like you are flying out of your seat when going over the top of a floater hill.3. When does a KC–135 fly in banked curves for extended periods of time? The KC–135 flies in banked curves for extended periods of time if researchers want to study the effects of high g on experiments.
Pendulum Rides1. When is high g experienced on the KC–135? High g is felt when the KC–135 pulls up and out of the parabola.2. When is high g experienced on a pendulum ride (as the rider reaches the bottom of the arc or as the rider reaches the top of the arc)? High g is felt on the pendulum ride as the rider reaches the bottom of the arc.3. When is low g experienced on the pendulum ride? Low g is experienced when the riders reach the top of the arc.4. What is the difference between the flight path of the KC–135 and the circular motion of the pendulum ride? The flight path of the KC–135 is a parabola path and the pendulum ride is a circular path.
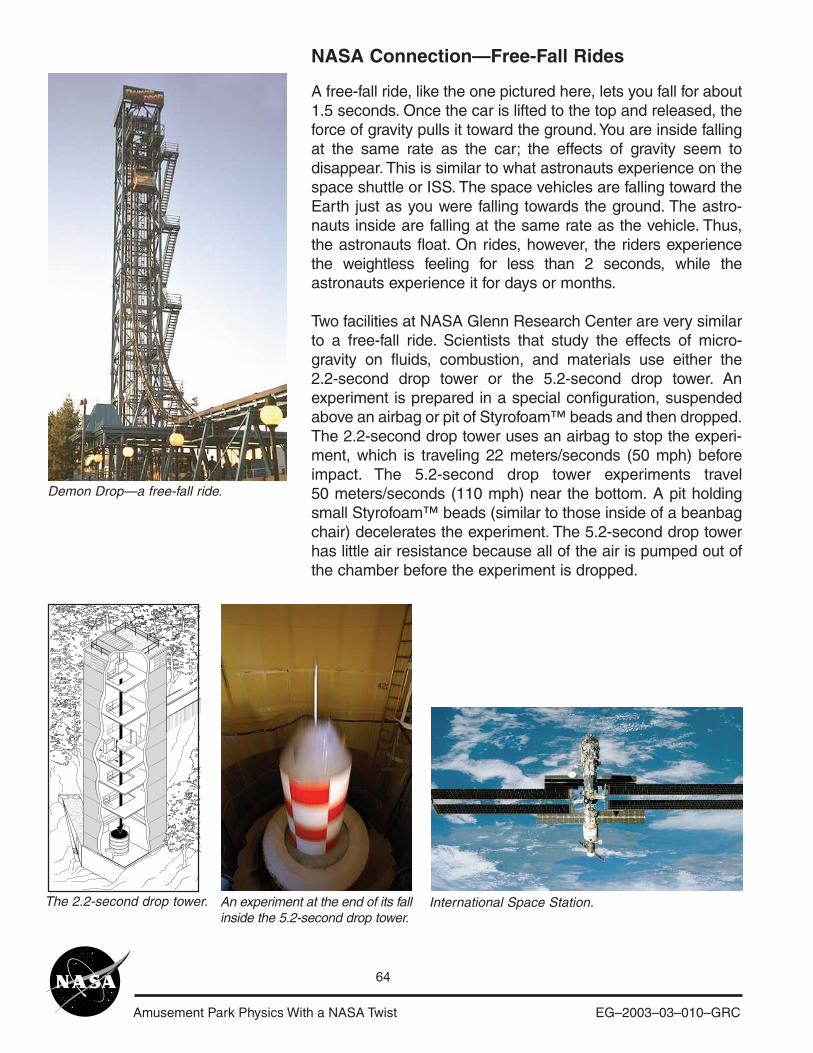
Amusement Park Physics With a NASA Twist EG–2003–03–010–GRC
64
NASA Connection—Free-Fall Rides
A free-fall ride, like the one pictured here, lets you fall for about1.5 seconds. Once the car is lifted to the top and released, theforce of gravity pulls it toward the ground. You are inside fallingat the same rate as the car; the effects of gravity seem todisappear. This is similar to what astronauts experience on thespace shuttle or ISS. The space vehicles are falling toward theEarth just as you were falling towards the ground. The astro-nauts inside are falling at the same rate as the vehicle. Thus,the astronauts float. On rides, however, the riders experiencethe weightless feeling for less than 2 seconds, while theastronauts experience it for days or months.
Two facilities at NASA Glenn Research Center are very similarto a free-fall ride. Scientists that study the effects of micro-gravity on fluids, combustion, and materials use either the2.2-second drop tower or the 5.2-second drop tower. Anexperiment is prepared in a special configuration, suspendedabove an airbag or pit of Styrofoam™ beads and then dropped.The 2.2-second drop tower uses an airbag to stop the experi-ment, which is traveling 22 meters/seconds (50 mph) beforeimpact. The 5.2-second drop tower experiments travel50 meters/seconds (110 mph) near the bottom. A pit holdingsmall Styrofoam™ beads (similar to those inside of a beanbagchair) decelerates the experiment. The 5.2-second drop towerhas little air resistance because all of the air is pumped out ofthe chamber before the experiment is dropped.
Demon Drop—a free-fall ride.
An experiment at the end of its fallinside the 5.2-second drop tower.
The 2.2-second drop tower. International Space Station.
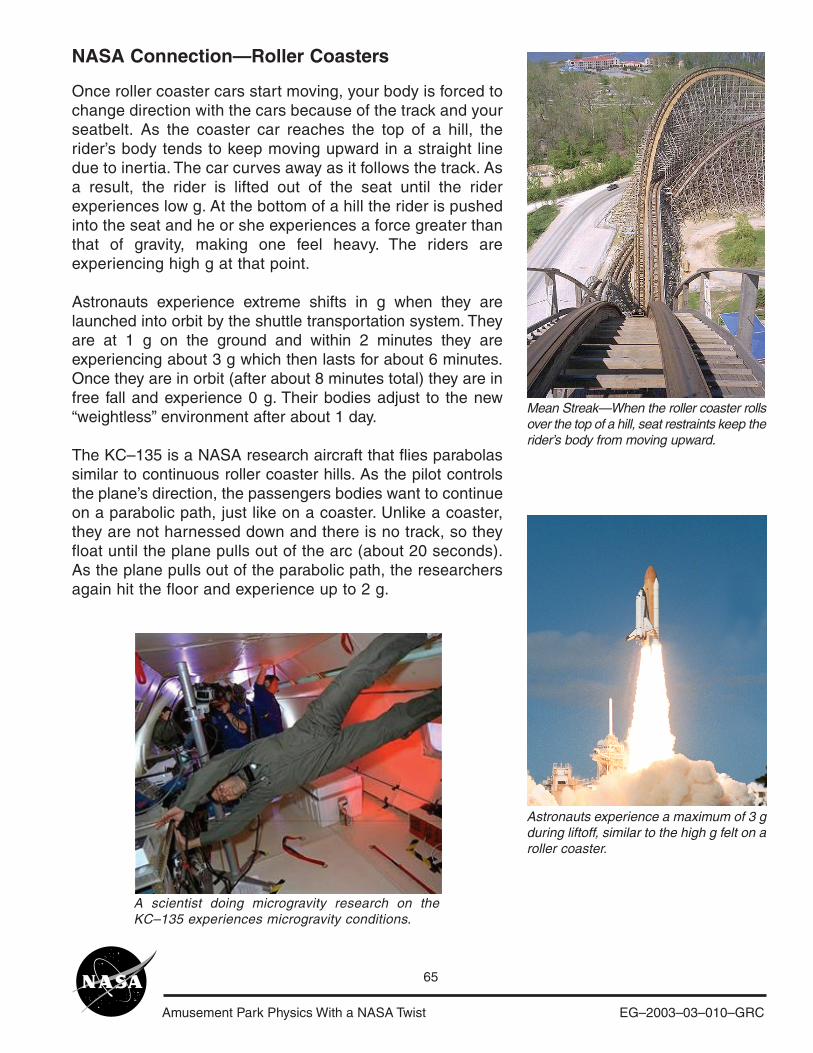
Amusement Park Physics With a NASA Twist EG–2003–03–010–GRC
65
NASA Connection—Roller Coasters
Once roller coaster cars start moving, your body is forced tochange direction with the cars because of the track and yourseatbelt. As the coaster car reaches the top of a hill, therider’s body tends to keep moving upward in a straight linedue to inertia. The car curves away as it follows the track. Asa result, the rider is lifted out of the seat until the riderexperiences low g. At the bottom of a hill the rider is pushedinto the seat and he or she experiences a force greater thanthat of gravity, making one feel heavy. The riders areexperiencing high g at that point.
Astronauts experience extreme shifts in g when they arelaunched into orbit by the shuttle transportation system. Theyare at 1 g on the ground and within 2 minutes they areexperiencing about 3 g which then lasts for about 6 minutes.Once they are in orbit (after about 8 minutes total) they are infree fall and experience 0 g. Their bodies adjust to the new“weightless” environment after about 1 day.
The KC–135 is a NASA research aircraft that flies parabolassimilar to continuous roller coaster hills. As the pilot controlsthe plane’s direction, the passengers bodies want to continueon a parabolic path, just like on a coaster. Unlike a coaster,they are not harnessed down and there is no track, so theyfloat until the plane pulls out of the arc (about 20 seconds).As the plane pulls out of the parabolic path, the researchersagain hit the floor and experience up to 2 g.
Mean Streak—When the roller coaster rollsover the top of a hill, seat restraints keep therider’s body from moving upward.
Astronauts experience a maximum of 3 gduring liftoff, similar to the high g felt on aroller coaster.
A scientist doing microgravity research on theKC–135 experiences microgravity conditions.
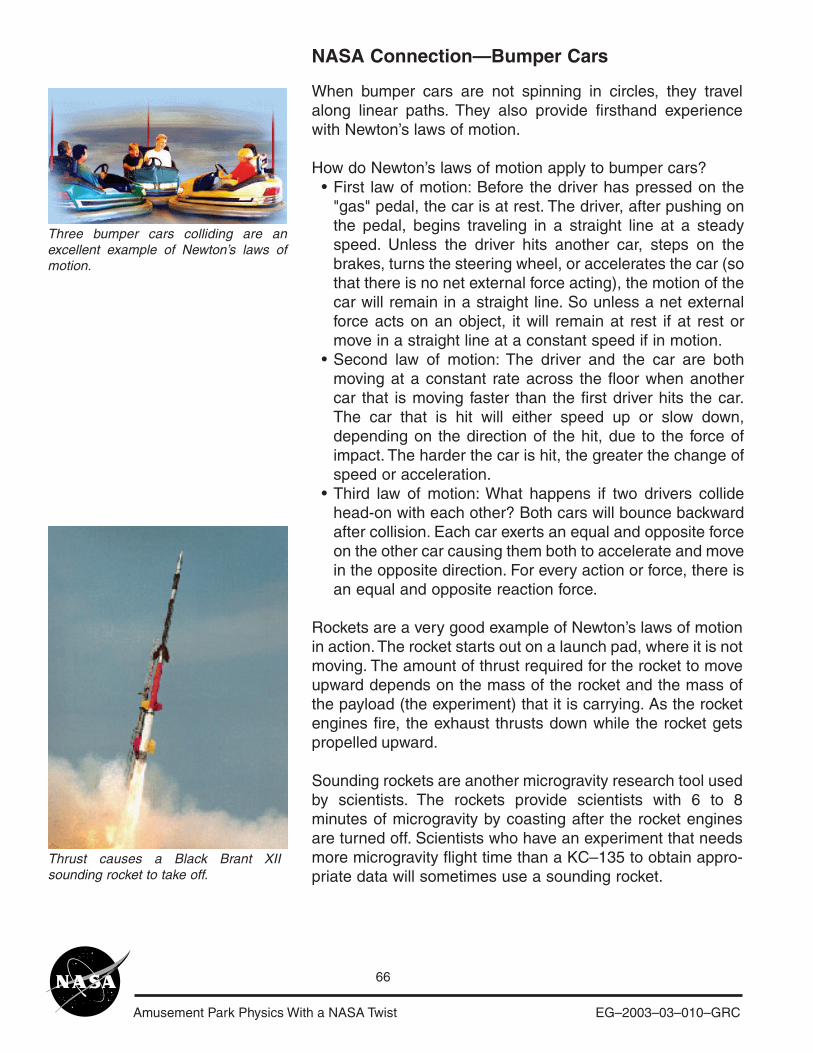
Amusement Park Physics With a NASA Twist EG–2003–03–010–GRC
66
NASA Connection—Bumper Cars
When bumper cars are not spinning in circles, they travelalong linear paths. They also provide firsthand experiencewith Newton’s laws of motion.
How do Newton’s laws of motion apply to bumper cars? •
•
•
Rockets are a very good example of Newton’s laws of motionin action. The rocket starts out on a launch pad, where it is notmoving. The amount of thrust required for the rocket to moveupward depends on the mass of the rocket and the mass ofthe payload (the experiment) that it is carrying. As the rocketengines fire, the exhaust thrusts down while the rocket getspropelled upward.
Sounding rockets are another microgravity research tool usedby scientists. The rockets provide scientists with 6 to 8minutes of microgravity by coasting after the rocket enginesare turned off. Scientists who have an experiment that needsmore microgravity flight time than a KC–135 to obtain appro-priate data will sometimes use a sounding rocket.
First law of motion: Before the driver has pressed on the"gas" pedal, the car is at rest. The driver, after pushing onthe pedal, begins traveling in a straight line at a steadyspeed. Unless the driver hits another car, steps on thebrakes, turns the steering wheel, or accelerates the car (sothat there is no net external force acting), the motion of thecar will remain in a straight line. So unless a net externalforce acts on an object, it will remain at rest if at rest ormove in a straight line at a constant speed if in motion.Second law of motion: The driver and the car are bothmoving at a constant rate across the floor when anothercar that is moving faster than the first driver hits the car.The car that is hit will either speed up or slow down,depending on the direction of the hit, due to the force ofimpact. The harder the car is hit, the greater the change ofspeed or acceleration.Third law of motion: What happens if two drivers collidehead-on with each other? Both cars will bounce backwardafter collision. Each car exerts an equal and opposite forceon the other car causing them both to accelerate and movein the opposite direction. For every action or force, there isan equal and opposite reaction force.
Three bumper cars colliding are anexcellent example of Newton’s laws ofmotion.
Thrust causes a Black Brant XIIsounding rocket to take off.
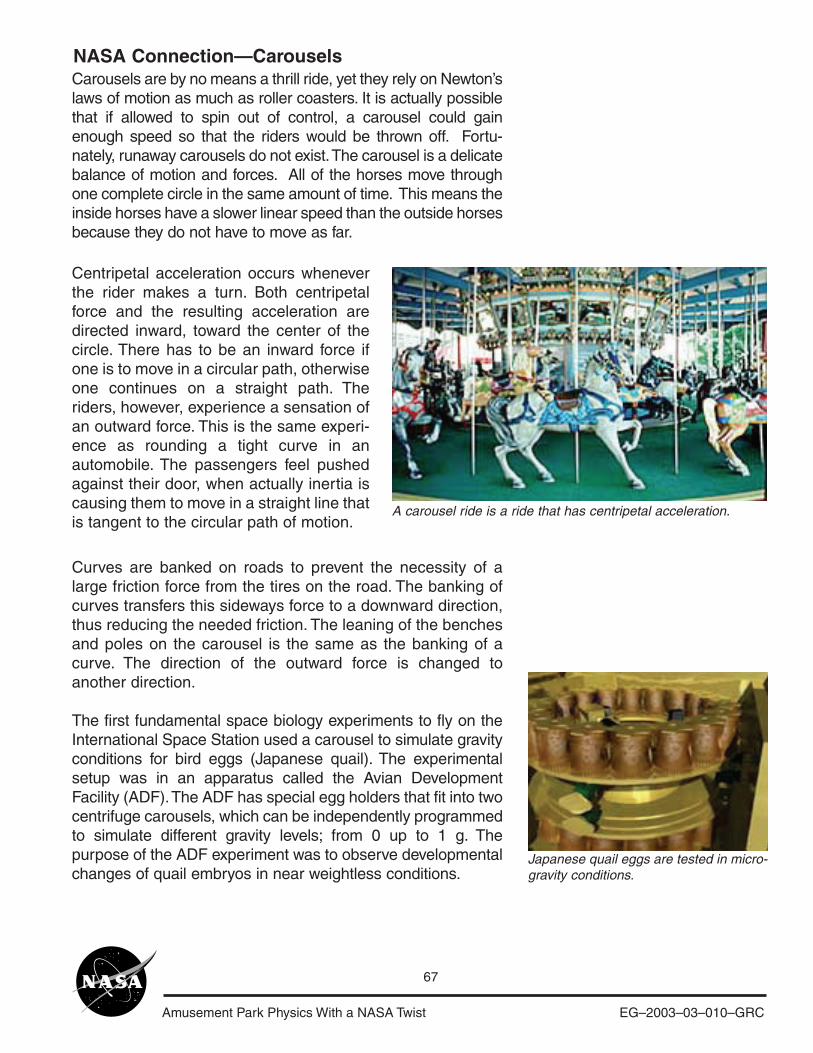
Amusement Park Physics With a NASA Twist EG–2003–03–010–GRC
67
NASA Connection—Carousels
Curves are banked on roads to prevent the necessity of alarge friction force from the tires on the road. The banking ofcurves transfers this sideways force to a downward direction,thus reducing the needed friction. The leaning of the benchesand poles on the carousel is the same as the banking of acurve. The direction of the outward force is changed toanother direction.
The first fundamental space biology experiments to fly on theInternational Space Station used a carousel to simulate gravityconditions for bird eggs (Japanese quail). The experimentalsetup was in an apparatus called the Avian DevelopmentFacility (ADF). The ADF has special egg holders that fit into twocentrifuge carousels, which can be independently programmedto simulate different gravity levels; from 0 up to 1 g. Thepurpose of the ADF experiment was to observe developmentalchanges of quail embryos in near weightless conditions.
Carousels are by no means a thrill ride, yet they rely on Newton’slaws of motion as much as roller coasters. It is actually possiblethat if allowed to spin out of control, a carousel could gainenough speed so that the riders would be thrown off. Fortu-nately, runaway carousels do not exist. The carousel is a delicatebalance of motion and forces. All of the horses move throughone complete circle in the same amount of time. This means theinside horses have a slower linear speed than the outside horsesbecause they do not have to move as far.
A carousel ride is a ride that has centripetal acceleration.
Centripetal acceleration occurs wheneverthe rider makes a turn. Both centripetalforce and the resulting acceleration aredirected inward, toward the center of thecircle. There has to be an inward force ifone is to move in a circular path, otherwiseone continues on a straight path. Theriders, however, experience a sensation ofan outward force. This is the same experi-ence as rounding a tight curve in anautomobile. The passengers feel pushedagainst their door, when actually inertia iscausing them to move in a straight line thatis tangent to the circular path of motion.
Japanese quail eggs are tested in micro-gravity conditions.
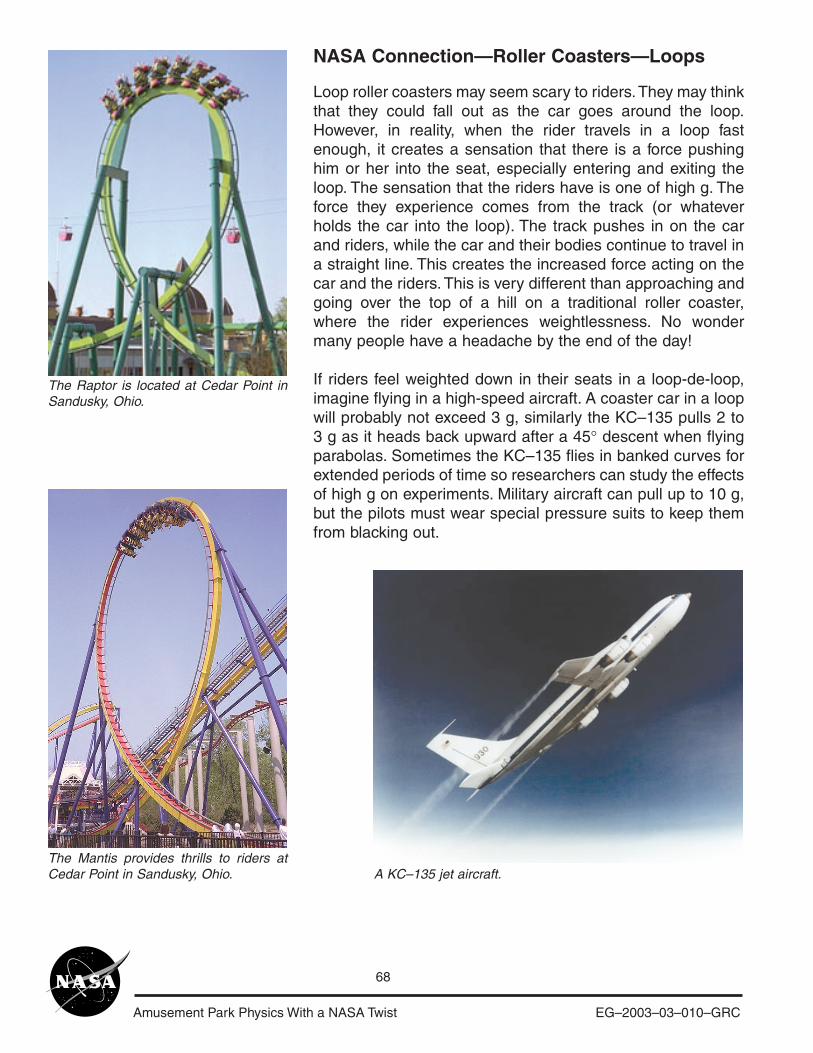
Amusement Park Physics With a NASA Twist EG–2003–03–010–GRC
68
NASA Connection—Roller Coasters—Loops
Loop roller coasters may seem scary to riders. They may thinkthat they could fall out as the car goes around the loop.However, in reality, when the rider travels in a loop fastenough, it creates a sensation that there is a force pushinghim or her into the seat, especially entering and exiting theloop. The sensation that the riders have is one of high g. Theforce they experience comes from the track (or whateverholds the car into the loop). The track pushes in on the carand riders, while the car and their bodies continue to travel ina straight line. This creates the increased force acting on thecar and the riders. This is very different than approaching andgoing over the top of a hill on a traditional roller coaster,where the rider experiences weightlessness. No wondermany people have a headache by the end of the day!
If riders feel weighted down in their seats in a loop-de-loop,imagine flying in a high-speed aircraft. A coaster car in a loopwill probably not exceed 3 g, similarly the KC–135 pulls 2 to3 g as it heads back upward after a 45° descent when flyingparabolas. Sometimes the KC–135 flies in banked curves forextended periods of time so researchers can study the effectsof high g on experiments. Military aircraft can pull up to 10 g,but the pilots must wear special pressure suits to keep themfrom blacking out.
A KC–135 jet aircraft.The Mantis provides thrills to riders atCedar Point in Sandusky, Ohio.
The Raptor is located at Cedar Point inSandusky, Ohio.
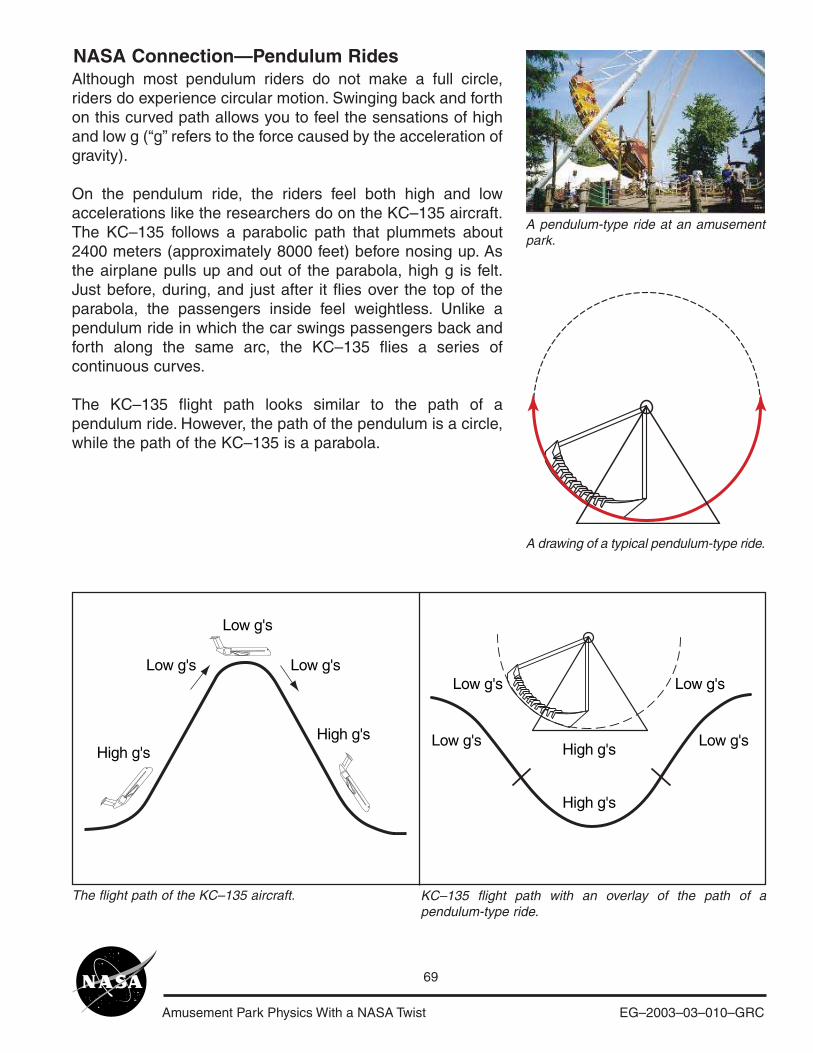
Amusement Park Physics With a NASA Twist EG–2003–03–010–GRC
69
NASA Connection—Pendulum RidesAlthough most pendulum riders do not make a full circle,riders do experience circular motion. Swinging back and forthon this curved path allows you to feel the sensations of highand low g (“g” refers to the force caused by the acceleration ofgravity).
On the pendulum ride, the riders feel both high and lowaccelerations like the researchers do on the KC–135 aircraft.The KC–135 follows a parabolic path that plummets about2400 meters (approximately 8000 feet) before nosing up. Asthe airplane pulls up and out of the parabola, high g is felt.Just before, during, and just after it flies over the top of theparabola, the passengers inside feel weightless. Unlike apendulum ride in which the car swings passengers back andforth along the same arc, the KC–135 flies a series ofcontinuous curves.
The KC–135 flight path looks similar to the path of apendulum ride. However, the path of the pendulum is a circle,while the path of the KC–135 is a parabola.
Low g'sHigh g's
High g'sHigh g's
High g's
Low g's
Low g's
Low g's
Low g's Low g'sLow g's
A pendulum-type ride at an amusementpark.
A drawing of a typical pendulum-type ride.
The flight path of the KC–135 aircraft. KC–135 flight path with an overlay of the path of apendulum-type ride.

Amusement Park Physics With a NASA Twist EG–2003–03–010–GRC
70
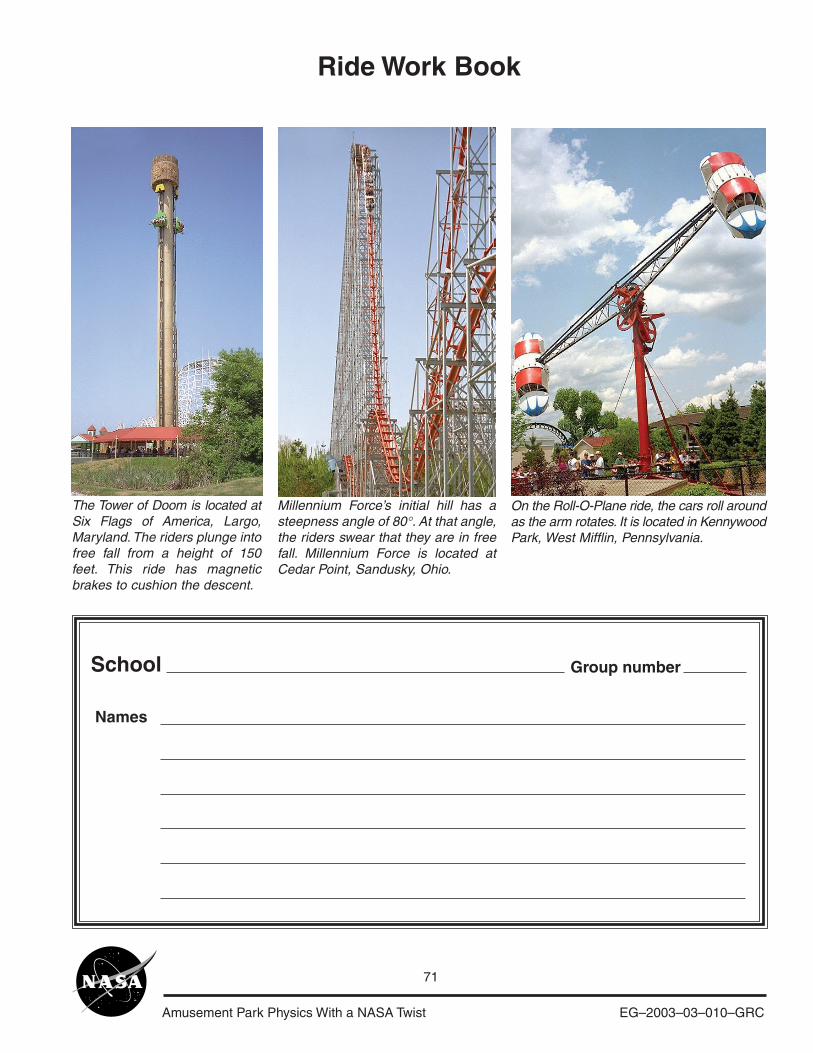
Amusement Park Physics With a NASA Twist EG–2003–03–010–GRC
71
The Tower of Doom is located atSix Flags of America, Largo,Maryland. The riders plunge intofree fall from a height of 150feet. This ride has magneticbrakes to cushion the descent.
Ride Work Book
Millennium Force’s initial hill has asteepness angle of 80°. At that angle,the riders swear that they are in freefall. Millennium Force is located atCedar Point, Sandusky, Ohio.
On the Roll-O-Plane ride, the cars roll aroundas the arm rotates. It is located in KennywoodPark, West Mifflin, Pennsylvania.
School Group number
Names

Amusement Park Physics With a NASA Twist EG–2003–03–010–GRC
72
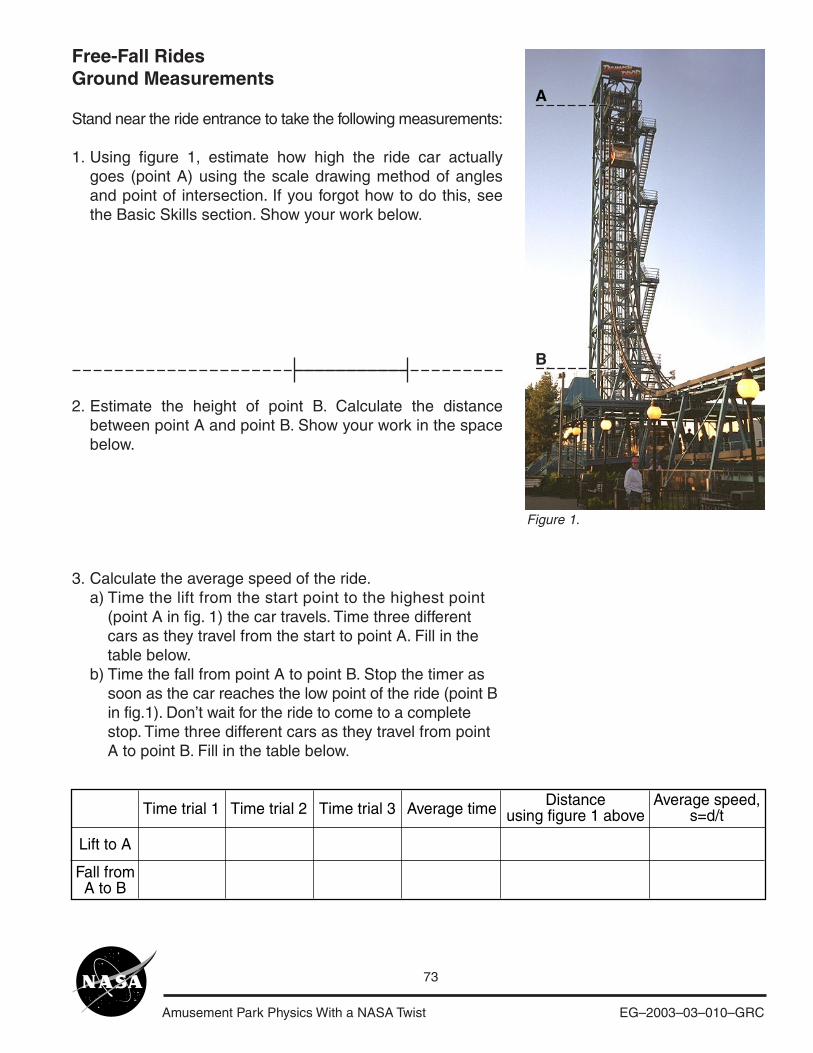
Amusement Park Physics With a NASA Twist EG–2003–03–010–GRC
73
Free-Fall RidesGround Measurements
Stand near the ride entrance to take the following measurements:
1.
2.
3.
Using figure 1, estimate how high the ride car actuallygoes (point A) using the scale drawing method of anglesand point of intersection. If you forgot how to do this, seethe Basic Skills section. Show your work below.
Estimate the height of point B. Calculate the distancebetween point A and point B. Show your work in the spacebelow.
Calculate the average speed of the ride.a) Time the lift from the start point to the highest point (point A in fig. 1) the car travels. Time three different cars as they travel from the start to point A. Fill in the table below.b) Time the fall from point A to point B. Stop the timer as soon as the car reaches the low point of the ride (point B in fig.1). Don’t wait for the ride to come to a complete stop. Time three different cars as they travel from point A to point B. Fill in the table below.
A
B
Time trial 1
Lift to A
Fall fromA to B
Time trial 2 Time trial 3 Average time Distanceusing figure 1 above
Average speed,s=d/t
Figure 1.
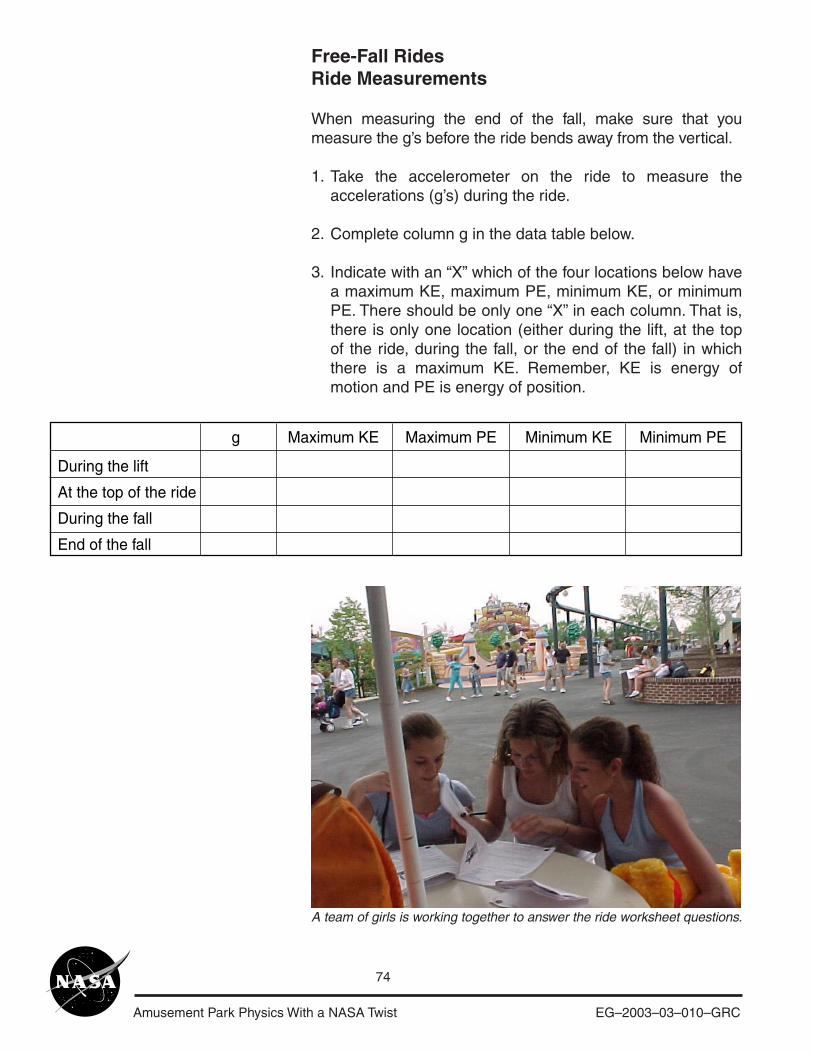
Amusement Park Physics With a NASA Twist EG–2003–03–010–GRC
74
Free-Fall RidesRide Measurements
When measuring the end of the fall, make sure that youmeasure the g’s before the ride bends away from the vertical.
1.
2.
3.
Take the accelerometer on the ride to measure theaccelerations (g’s) during the ride.
Complete column g in the data table below.
Indicate with an “X” which of the four locations below havea maximum KE, maximum PE, minimum KE, or minimumPE. There should be only one “X” in each column. That is,there is only one location (either during the lift, at the topof the ride, during the fall, or the end of the fall) in whichthere is a maximum KE. Remember, KE is energy ofmotion and PE is energy of position.
A team of girls is working together to answer the ride worksheet questions.
During the lift
At the top of the ride
During the fall
End of the fall
g Maximum KE Maximum PE Minimum KE Minimum PE
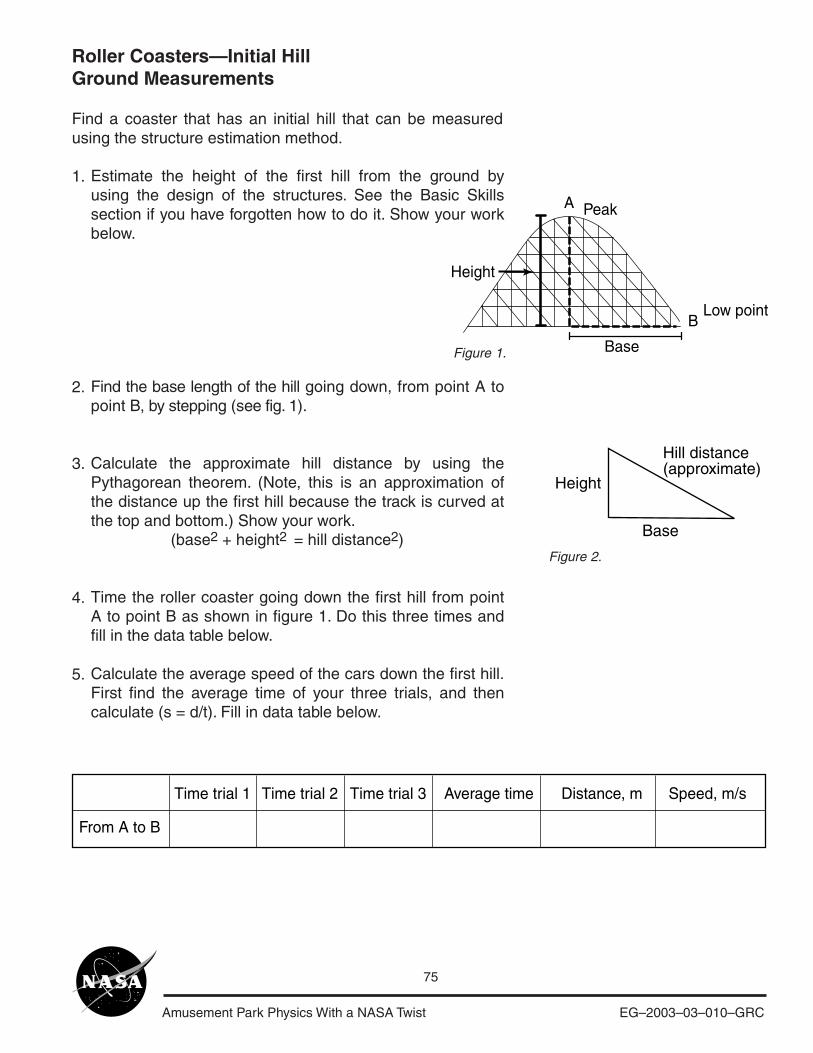
Amusement Park Physics With a NASA Twist EG–2003–03–010–GRC
75
Roller Coasters—Initial HillGround Measurements
Find a coaster that has an initial hill that can be measuredusing the structure estimation method.
1.
2.
3.
4.
5.
Estimate the height of the first hill from the ground byusing the design of the structures. See the Basic Skillssection if you have forgotten how to do it. Show your workbelow.
Find the base length of the hill going down, from point A topoint B, by stepping (see fig. 1).
Calculate the approximate hill distance by using thePythagorean theorem. (Note, this is an approximation ofthe distance up the first hill because the track is curved atthe top and bottom.) Show your work. (base2 + height2 = hill distance2)
Time the roller coaster going down the first hill from pointA to point B as shown in figure 1. Do this three times andfill in the data table below.
Calculate the average speed of the cars down the first hill.First find the average time of your three trials, and thencalculate (s = d/t). Fill in data table below.
A
Height
Low point
Base
B
Peak
Height
Base
Hill distance(approximate)
Figure 1.
Figure 2.
Time trial 1
From A to B
Time trial 2 Time trial 3 Average time Distance, m Speed, m/s
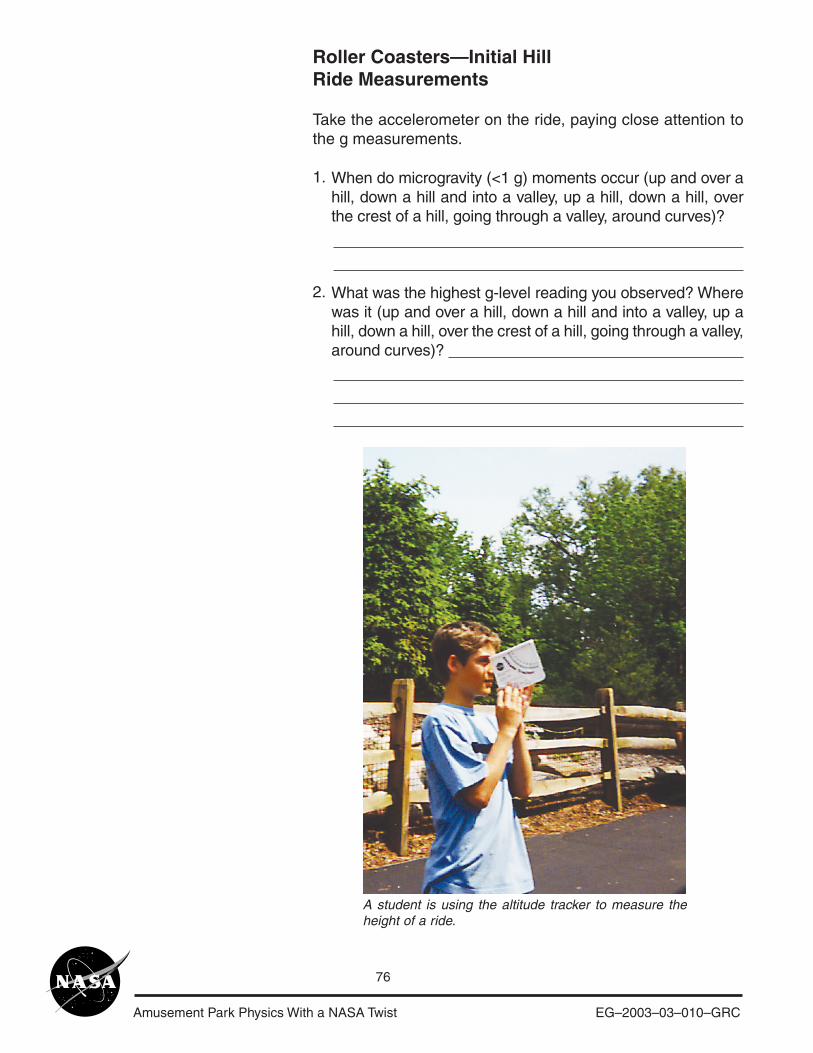
Amusement Park Physics With a NASA Twist EG–2003–03–010–GRC
76
Roller Coasters—Initial HillRide Measurements
Take the accelerometer on the ride, paying close attention tothe g measurements.
1.
2.
When do microgravity (<1 g) moments occur (up and over ahill, down a hill and into a valley, up a hill, down a hill, overthe crest of a hill, going through a valley, around curves)?
What was the highest g-level reading you observed? Wherewas it (up and over a hill, down a hill and into a valley, up ahill, down a hill, over the crest of a hill, going through a valley,around curves)?
A student is using the altitude tracker to measure theheight of a ride.
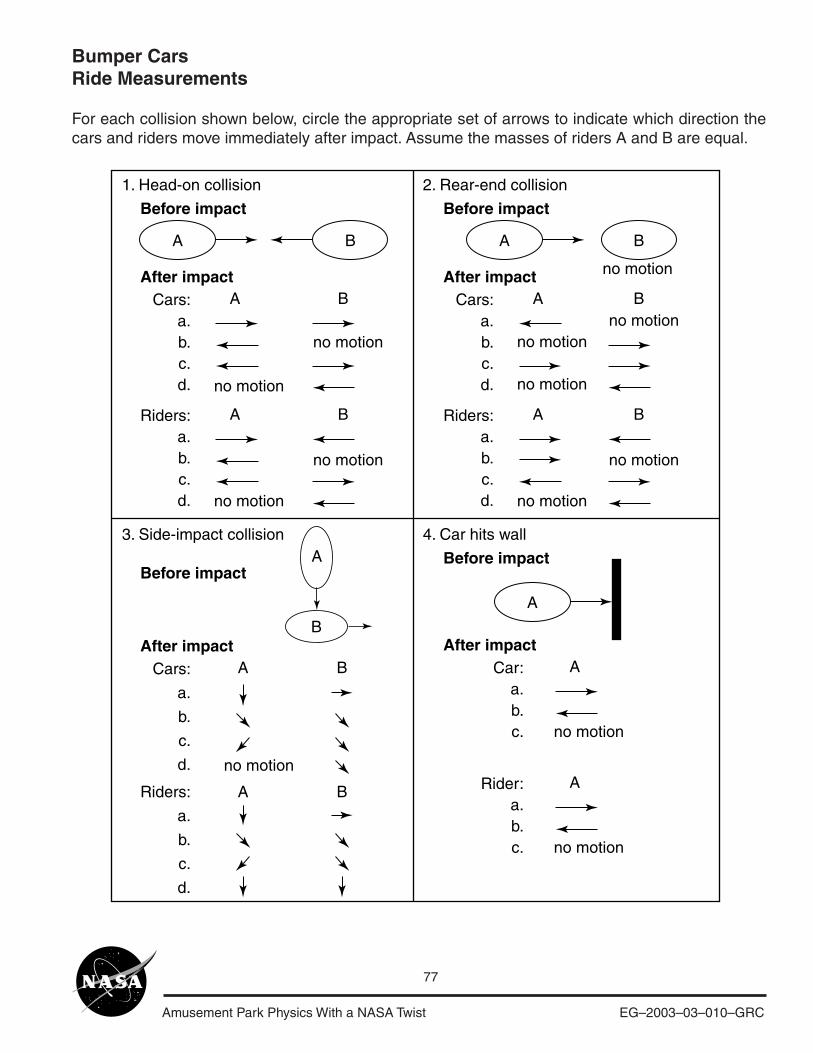
Amusement Park Physics With a NASA Twist EG–2003–03–010–GRC
77
Bumper CarsRide Measurements
For each collision shown below, circle the appropriate set of arrows to indicate which direction thecars and riders move immediately after impact. Assume the masses of riders A and B are equal.
A B
A B
1. Head-on collision 2. Rear-end collision
3. Side-impact collision 4. Car hits wall
Before impact
After impactCars:
a.b.c.d.
A BRiders:a.b.c.d.
no motion
no motion
no motion
no motion
A B
A B
Before impact
After impactCars:
a.b.c.d.
A BRiders:a.b.c.d.
no motion
no motion
no motion
no motion
no motion
no motion
A B
A
B
Before impact
After impactCars:
a.
b.
c.
d.
A BRiders:
a.
b.
c.
d.
no motion
A
A
Before impact
After impactCar:
a.b.c.
ARider:a.b.c. no motion
no motion
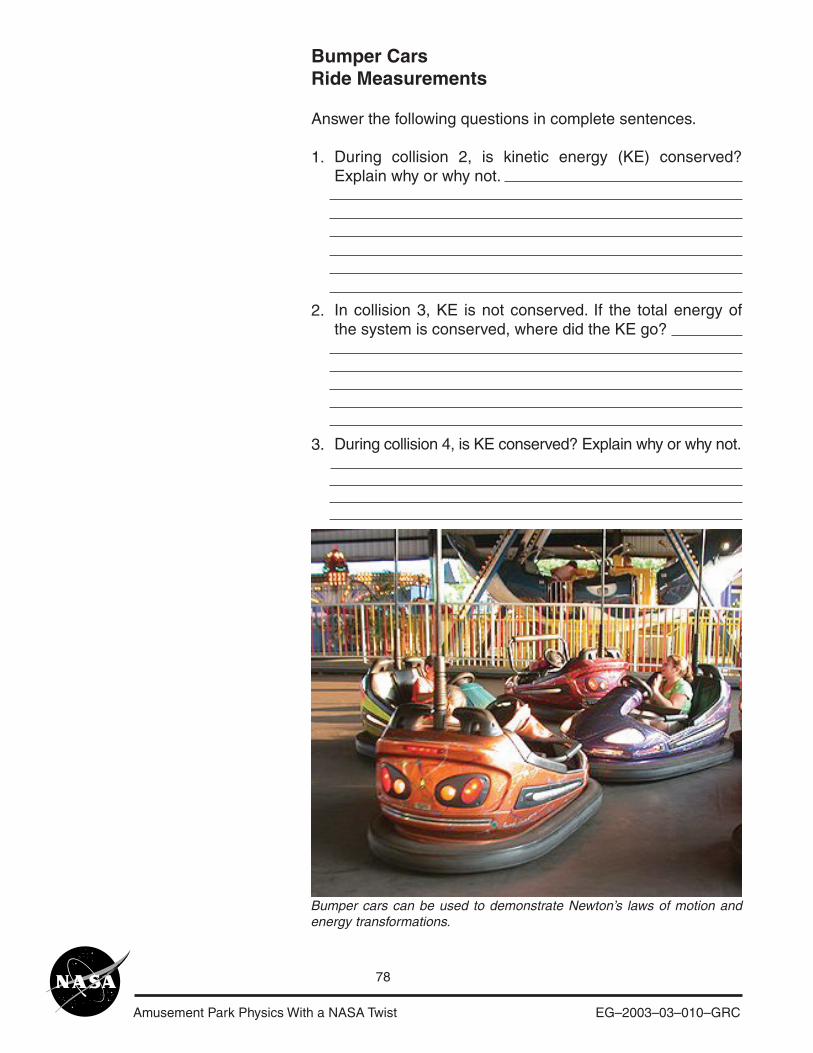
Amusement Park Physics With a NASA Twist EG–2003–03–010–GRC
78
Bumper cars can be used to demonstrate Newton’s laws of motion andenergy transformations.
Bumper CarsRide Measurements
Answer the following questions in complete sentences.
1.
2.
3.
During collision 2, is kinetic energy (KE) conserved?Explain why or why not.
In collision 3, KE is not conserved. If the total energy ofthe system is conserved, where did the KE go?
During collision 4, is KE conserved? Explain why or why not.
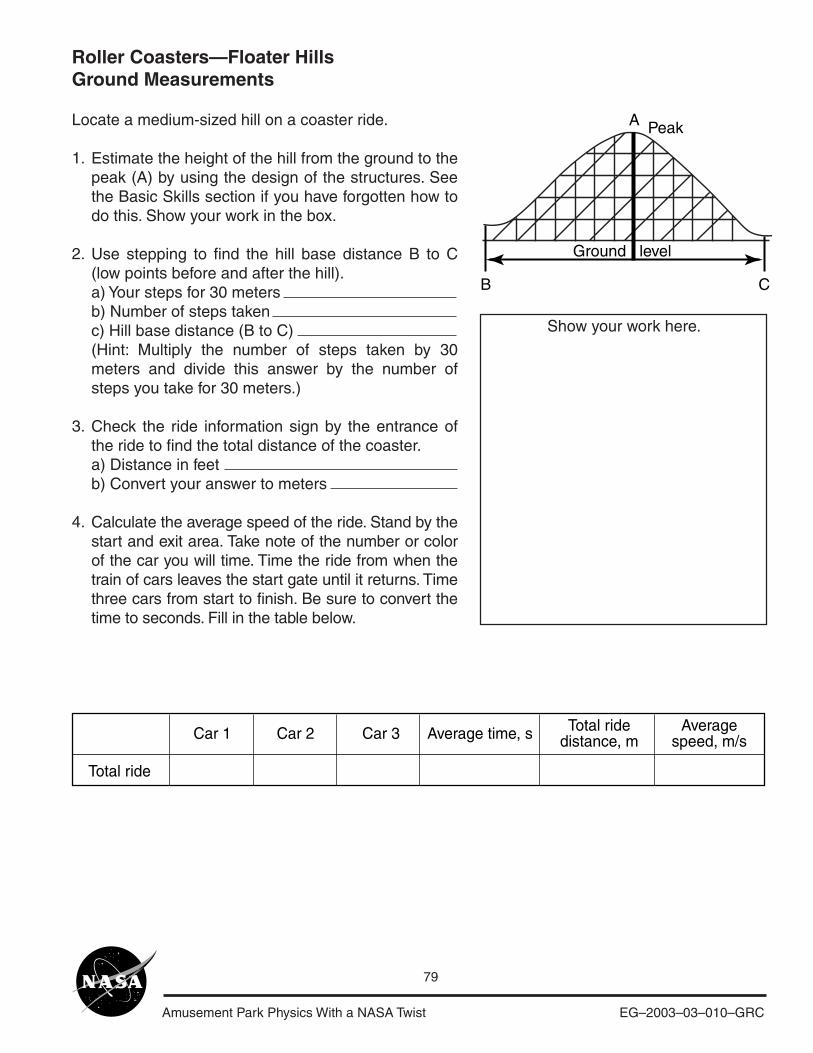
Amusement Park Physics With a NASA Twist EG–2003–03–010–GRC
79
Roller Coasters—Floater HillsGround Measurements
Locate a medium-sized hill on a coaster ride.
1.
2.
3.
4.
Estimate the height of the hill from the ground to thepeak (A) by using the design of the structures. Seethe Basic Skills section if you have forgotten how todo this. Show your work in the box.
Use stepping to find the hill base distance B to C(low points before and after the hill).a) Your steps for 30 metersb) Number of steps takenc) Hill base distance (B to C)(Hint: Multiply the number of steps taken by 30meters and divide this answer by the number ofsteps you take for 30 meters.)
Check the ride information sign by the entrance ofthe ride to find the total distance of the coaster.a) Distance in feetb) Convert your answer to meters
Calculate the average speed of the ride. Stand by thestart and exit area. Take note of the number or colorof the car you will time. Time the ride from when thetrain of cars leaves the start gate until it returns. Timethree cars from start to finish. Be sure to convert thetime to seconds. Fill in the table below.
Car 1
Total ride
Car 2 Car 3 Average time, s Total ridedistance, m
Averagespeed, m/s
A
B C
Peak
Ground level
Show your work here.
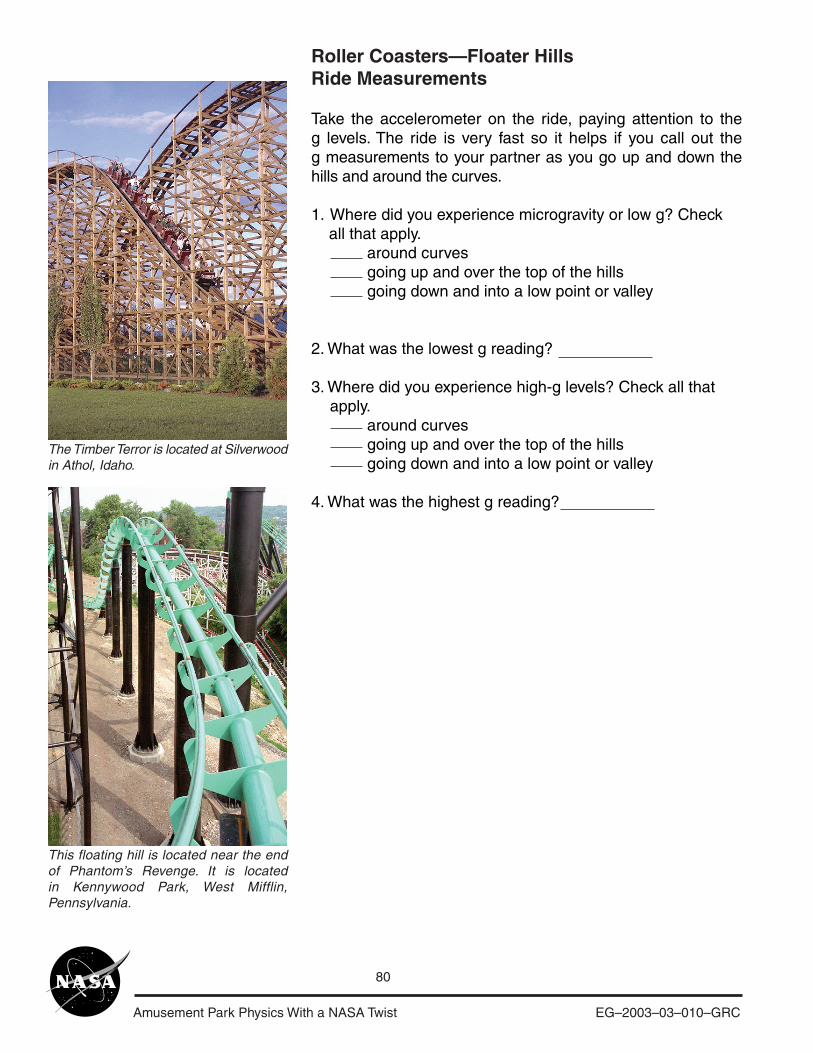
Amusement Park Physics With a NASA Twist EG–2003–03–010–GRC
80
Roller Coasters—Floater HillsRide Measurements
Take the accelerometer on the ride, paying attention to theg levels. The ride is very fast so it helps if you call out theg measurements to your partner as you go up and down thehills and around the curves.
1. Where did you experience microgravity or low g? Check all that apply.
around curvesgoing up and over the top of the hillsgoing down and into a low point or valley
2. What was the lowest g reading?
3. Where did you experience high-g levels? Check all thatapply.
around curvesgoing up and over the top of the hillsgoing down and into a low point or valley
4. What was the highest g reading?
This floating hill is located near the endof Phantom’s Revenge. It is locatedin Kennywood Park, West Mifflin,Pennsylvania.
The Timber Terror is located at Silverwoodin Athol, Idaho.
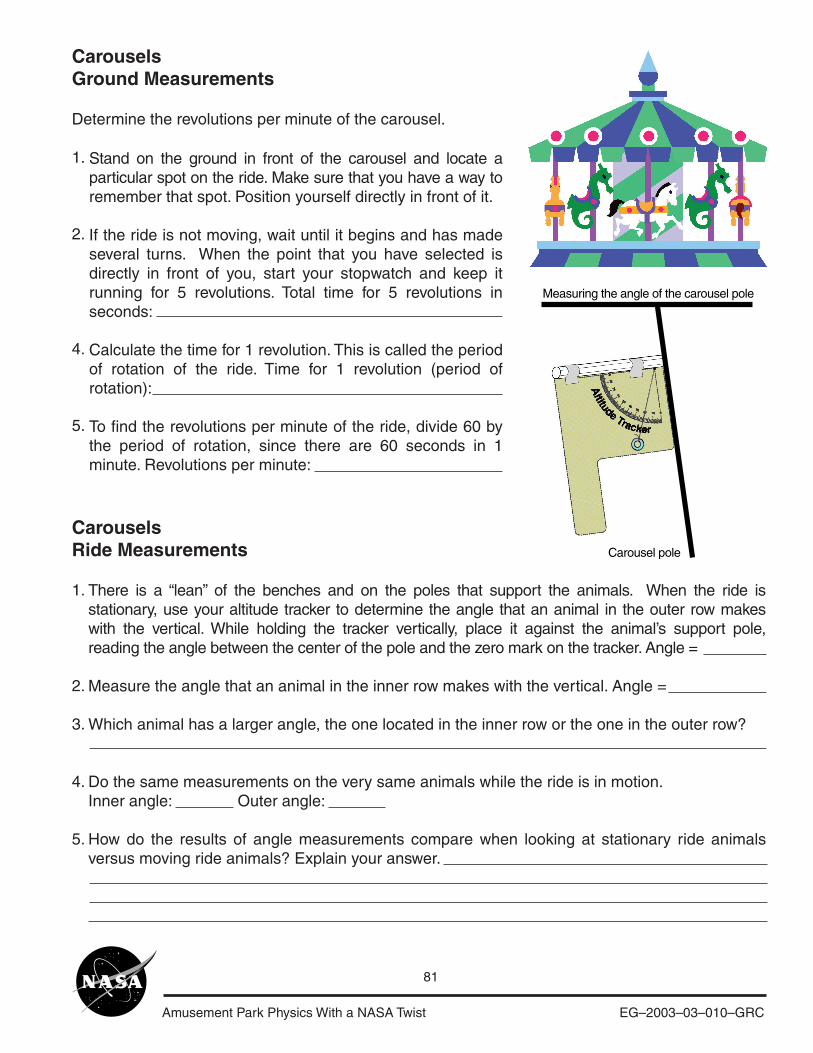
Amusement Park Physics With a NASA Twist EG–2003–03–010–GRC
81
CarouselsRide Measurements
1.
2.
3.
4.
5.
There is a “lean” of the benches and on the poles that support the animals. When the ride isstationary, use your altitude tracker to determine the angle that an animal in the outer row makeswith the vertical. While holding the tracker vertically, place it against the animal’s support pole,reading the angle between the center of the pole and the zero mark on the tracker. Angle =
Measure the angle that an animal in the inner row makes with the vertical. Angle =
Which animal has a larger angle, the one located in the inner row or the one in the outer row?
Do the same measurements on the very same animals while the ride is in motion.Inner angle: Outer angle:
How do the results of angle measurements compare when looking at stationary ride animalsversus moving ride animals? Explain your answer.
CarouselsGround Measurements
Determine the revolutions per minute of the carousel.
1.
2.
4.
5.
Stand on the ground in front of the carousel and locate aparticular spot on the ride. Make sure that you have a way toremember that spot. Position yourself directly in front of it.
If the ride is not moving, wait until it begins and has madeseveral turns. When the point that you have selected isdirectly in front of you, start your stopwatch and keep itrunning for 5 revolutions. Total time for 5 revolutions inseconds:
Calculate the time for 1 revolution. This is called the periodof rotation of the ride. Time for 1 revolution (period ofrotation):
To find the revolutions per minute of the ride, divide 60 bythe period of rotation, since there are 60 seconds in 1minute. Revolutions per minute:
Measuring the angle of the carousel pole
Carousel pole
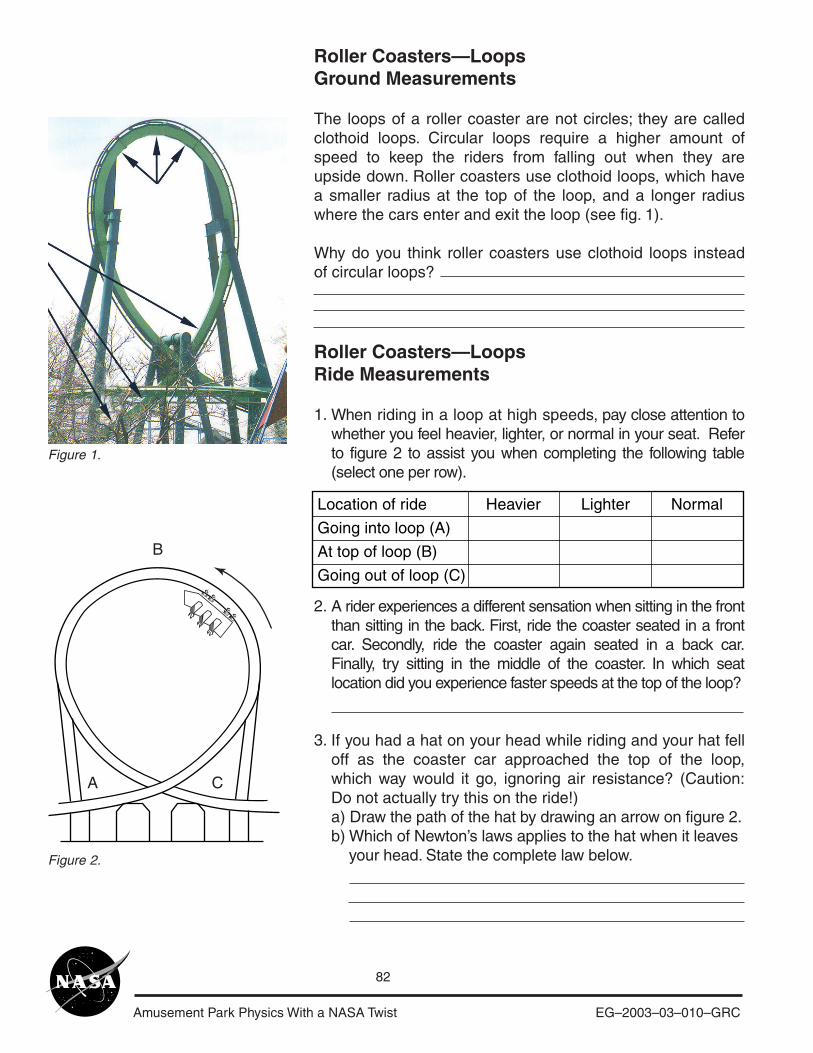
Amusement Park Physics With a NASA Twist EG–2003–03–010–GRC
82
Roller Coasters—LoopsGround Measurements
The loops of a roller coaster are not circles; they are calledclothoid loops. Circular loops require a higher amount ofspeed to keep the riders from falling out when they areupside down. Roller coasters use clothoid loops, which havea smaller radius at the top of the loop, and a longer radiuswhere the cars enter and exit the loop (see fig. 1).
Why do you think roller coasters use clothoid loops insteadof circular loops?
Figure 1.
Roller Coasters—LoopsRide Measurements
1.
2.
3.
A
B
C
Figure 2.
When riding in a loop at high speeds, pay close attention towhether you feel heavier, lighter, or normal in your seat. Referto figure 2 to assist you when completing the following table(select one per row).
A rider experiences a different sensation when sitting in the frontthan sitting in the back. First, ride the coaster seated in a frontcar. Secondly, ride the coaster again seated in a back car.Finally, try sitting in the middle of the coaster. In which seatlocation did you experience faster speeds at the top of the loop?
If you had a hat on your head while riding and your hat felloff as the coaster car approached the top of the loop,which way would it go, ignoring air resistance? (Caution:Do not actually try this on the ride!)a) Draw the path of the hat by drawing an arrow on figure 2.b) Which of Newton’s laws applies to the hat when it leaves your head. State the complete law below.
Location of ride Heavier Lighter Normal
Going into loop (A)
At top of loop (B)
Going out of loop (C)
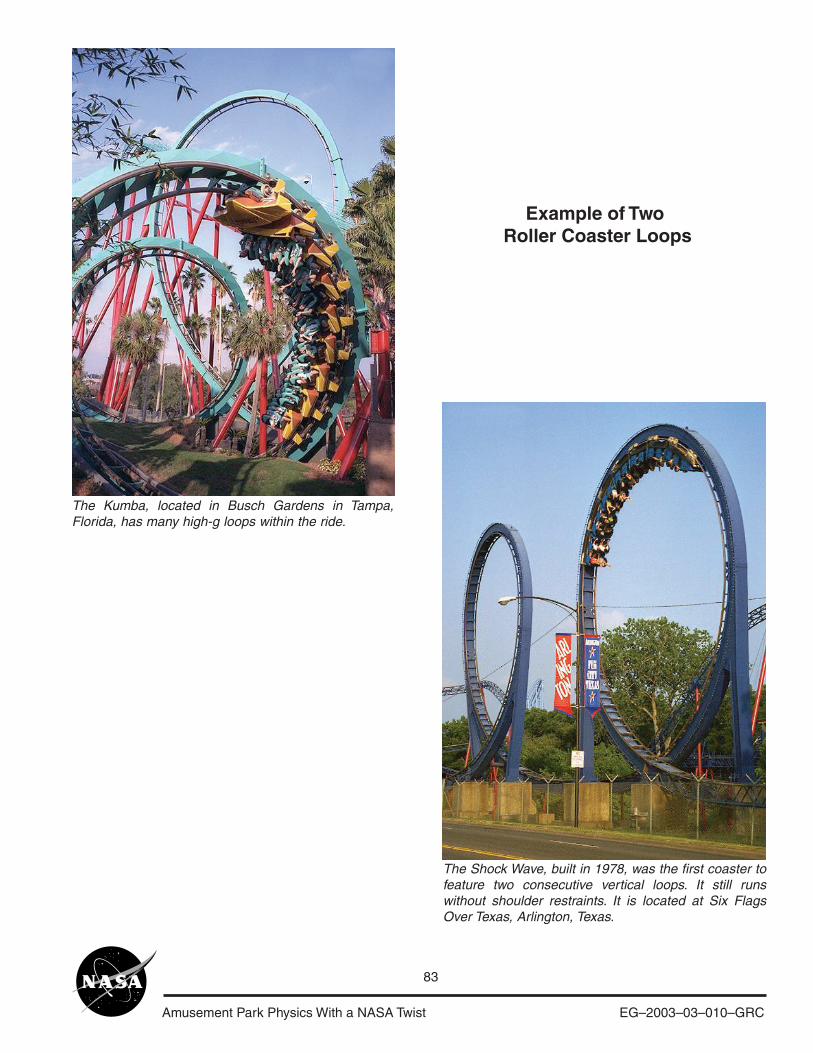
Amusement Park Physics With a NASA Twist EG–2003–03–010–GRC
83
The Kumba, located in Busch Gardens in Tampa,Florida, has many high-g loops within the ride.
The Shock Wave, built in 1978, was the first coaster tofeature two consecutive vertical loops. It still runswithout shoulder restraints. It is located at Six FlagsOver Texas, Arlington, Texas.
Example of Two Roller Coaster Loops
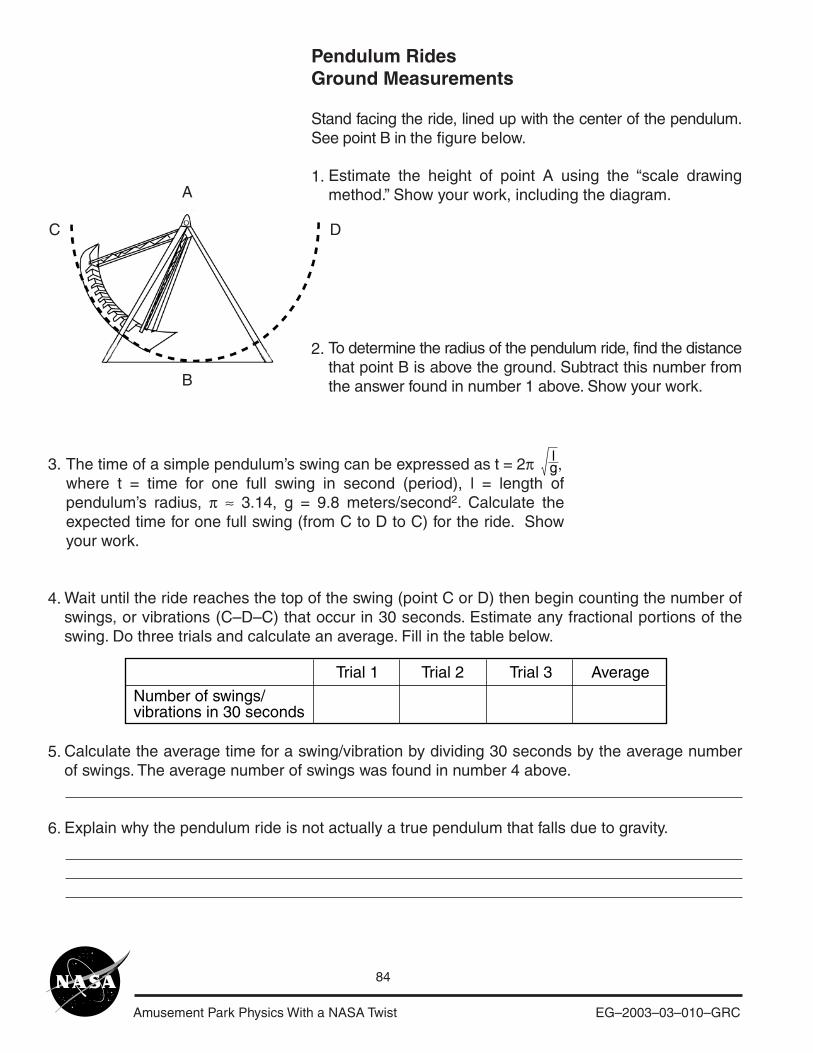
Amusement Park Physics With a NASA Twist EG–2003–03–010–GRC
84
A
B
C D
Pendulum RidesGround Measurements
Stand facing the ride, lined up with the center of the pendulum.See point B in the figure below.
1.
2.
Estimate the height of point A using the “scale drawingmethod.” Show your work, including the diagram.
To determine the radius of the pendulum ride, find the distancethat point B is above the ground. Subtract this number fromthe answer found in number 1 above. Show your work.
The time of a simple pendulum’s swing can be expressed as t = 2π ,where t = time for one full swing in second (period), l = length ofpendulum’s radius, π ≈ 3.14, g = 9.8 meters/second2. Calculate theexpected time for one full swing (from C to D to C) for the ride. Showyour work.
Trial 1
Number of swings/vibrations in 30 seconds
Trial 2 Trial 3 Average
Wait until the ride reaches the top of the swing (point C or D) then begin counting the number ofswings, or vibrations (C–D–C) that occur in 30 seconds. Estimate any fractional portions of theswing. Do three trials and calculate an average. Fill in the table below.
Calculate the average time for a swing/vibration by dividing 30 seconds by the average numberof swings. The average number of swings was found in number 4 above.
Explain why the pendulum ride is not actually a true pendulum that falls due to gravity.
lg3.
4.
5.
6.
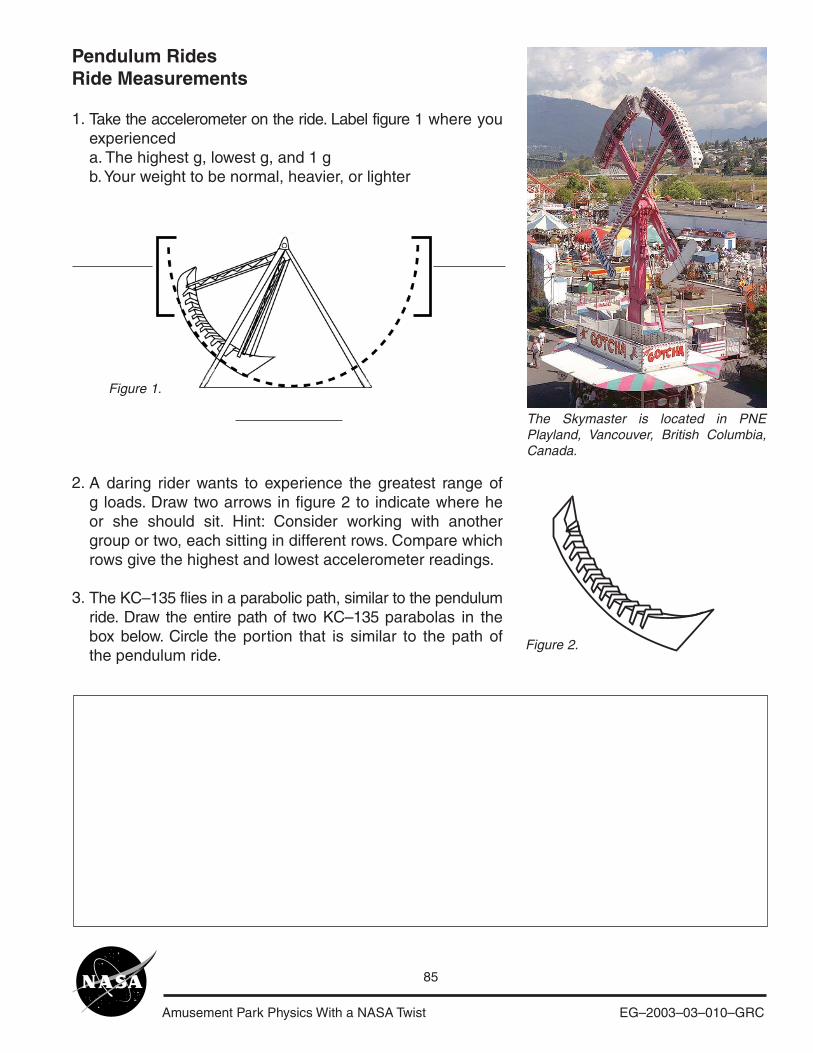
Amusement Park Physics With a NASA Twist EG–2003–03–010–GRC
85
Pendulum RidesRide Measurements
1.
2.
3.
Take the accelerometer on the ride. Label figure 1 where youexperienceda. The highest g, lowest g, and 1 gb. Your weight to be normal, heavier, or lighter
A daring rider wants to experience the greatest range ofg loads. Draw two arrows in figure 2 to indicate where heor she should sit. Hint: Consider working with anothergroup or two, each sitting in different rows. Compare whichrows give the highest and lowest accelerometer readings.
The KC–135 flies in a parabolic path, similar to the pendulumride. Draw the entire path of two KC–135 parabolas in thebox below. Circle the portion that is similar to the path ofthe pendulum ride.
Figure 1.
Figure 2.
The Skymaster is located in PNEPlayland, Vancouver, British Columbia,Canada.
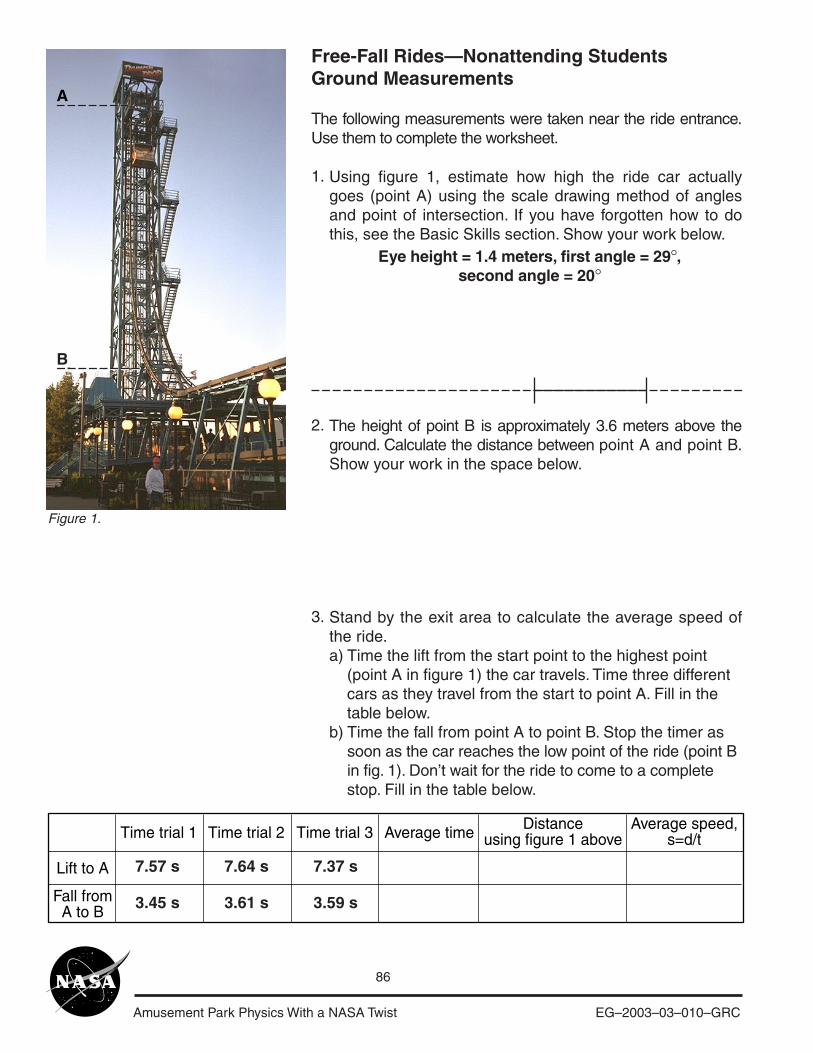
Amusement Park Physics With a NASA Twist EG–2003–03–010–GRC
86
Free-Fall Rides—Nonattending StudentsGround Measurements
The following measurements were taken near the ride entrance.Use them to complete the worksheet.
1.
2.
3.
Using figure 1, estimate how high the ride car actuallygoes (point A) using the scale drawing method of anglesand point of intersection. If you have forgotten how to dothis, see the Basic Skills section. Show your work below.
The height of point B is approximately 3.6 meters above theground. Calculate the distance between point A and point B.Show your work in the space below.
Stand by the exit area to calculate the average speed ofthe ride.a) Time the lift from the start point to the highest point (point A in figure 1) the car travels. Time three different cars as they travel from the start to point A. Fill in the table below.b) Time the fall from point A to point B. Stop the timer as soon as the car reaches the low point of the ride (point B in fig. 1). Don’t wait for the ride to come to a complete stop. Fill in the table below.
A
B
Time trial 1
Lift to A
Fall fromA to B
Time trial 2 Time trial 3 Average time Distanceusing figure 1 above
Average speed,s=d/t
Figure 1.
Eye height = 1.4 meters, first angle = 29°,second angle = 20°
7.57 s
3.45 s
7.64 s
3.61 s
7.37 s
3.59 s
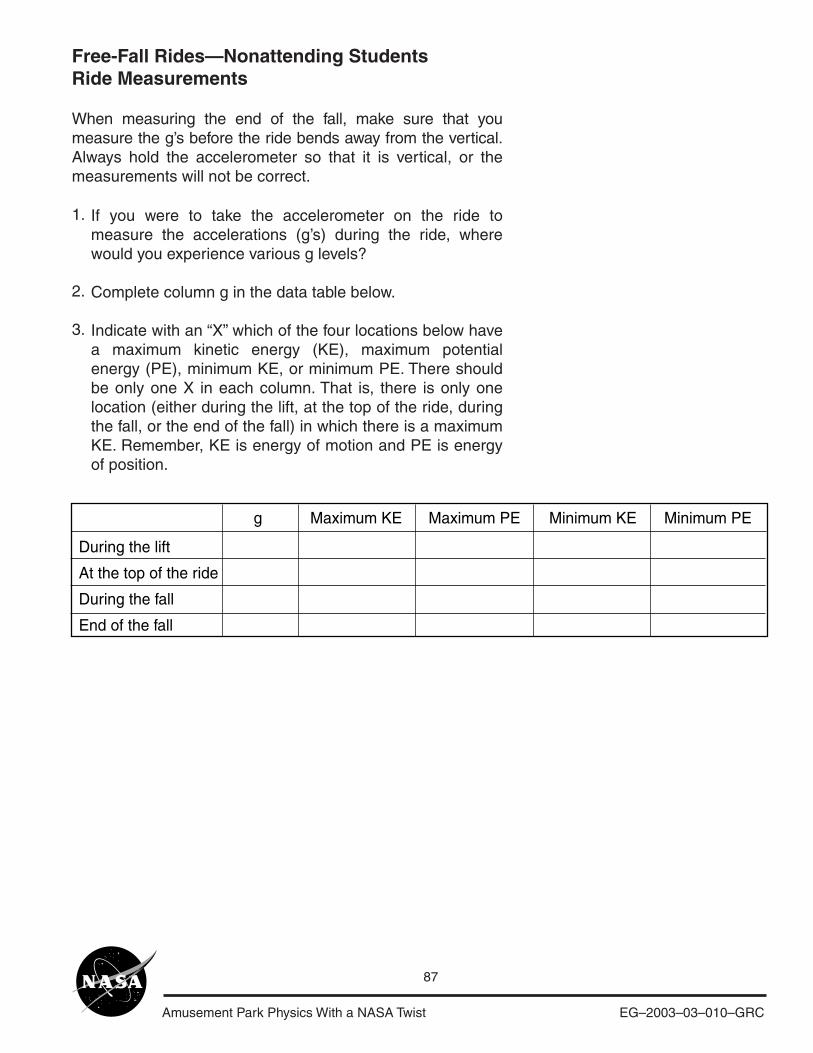
Amusement Park Physics With a NASA Twist EG–2003–03–010–GRC
87
Free-Fall Rides—Nonattending StudentsRide Measurements
When measuring the end of the fall, make sure that youmeasure the g’s before the ride bends away from the vertical.Always hold the accelerometer so that it is vertical, or themeasurements will not be correct.
1.
2.
3.
If you were to take the accelerometer on the ride tomeasure the accelerations (g’s) during the ride, wherewould you experience various g levels?
Complete column g in the data table below.
Indicate with an “X” which of the four locations below havea maximum kinetic energy (KE), maximum potentialenergy (PE), minimum KE, or minimum PE. There shouldbe only one X in each column. That is, there is only onelocation (either during the lift, at the top of the ride, duringthe fall, or the end of the fall) in which there is a maximumKE. Remember, KE is energy of motion and PE is energyof position.
During the lift
At the top of the ride
During the fall
End of the fall
g Maximum KE Maximum PE Minimum KE Minimum PE
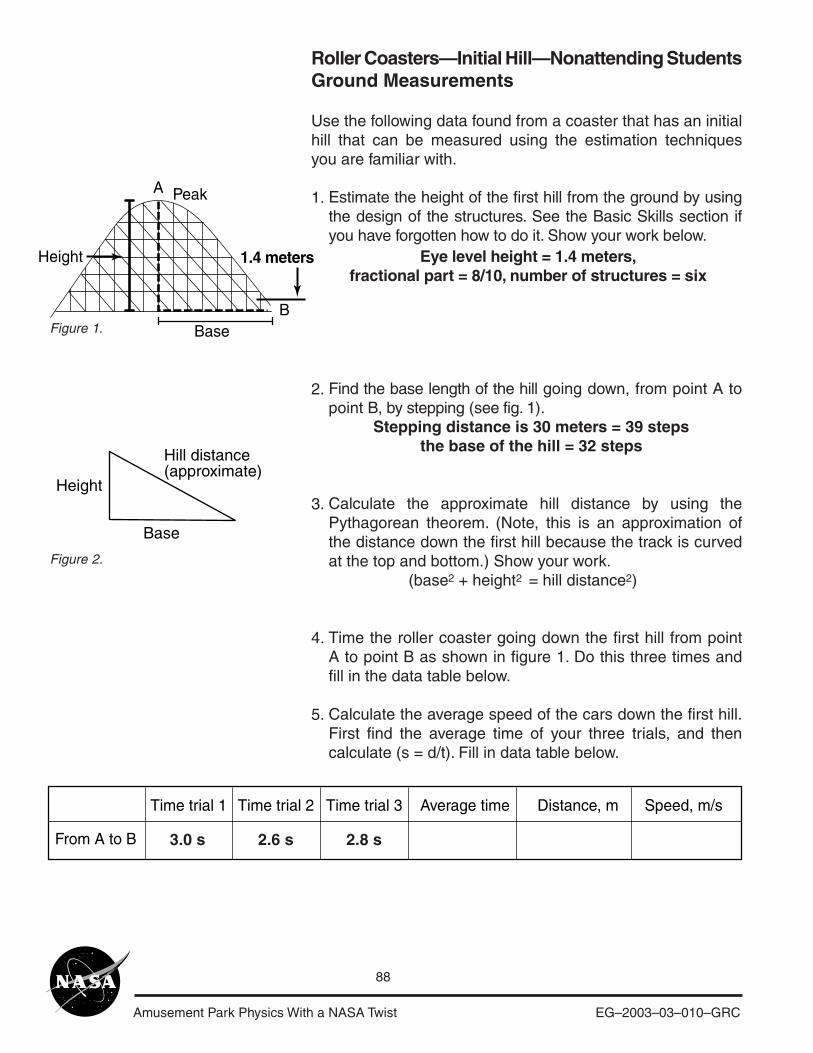
Amusement Park Physics With a NASA Twist EG–2003–03–010–GRC
88
Roller Coasters—Initial Hill—Nonattending StudentsGround Measurements
Use the following data found from a coaster that has an initialhill that can be measured using the estimation techniquesyou are familiar with.
1.
2.
3.
4.
5.
Estimate the height of the first hill from the ground by usingthe design of the structures. See the Basic Skills section ifyou have forgotten how to do it. Show your work below.
Find the base length of the hill going down, from point A topoint B, by stepping (see fig. 1).
Calculate the approximate hill distance by using thePythagorean theorem. (Note, this is an approximation ofthe distance down the first hill because the track is curvedat the top and bottom.) Show your work. (base2 + height2 = hill distance2)
Time the roller coaster going down the first hill from pointA to point B as shown in figure 1. Do this three times andfill in the data table below.
Calculate the average speed of the cars down the first hill.First find the average time of your three trials, and thencalculate (s = d/t). Fill in data table below.
Height
Base
Hill distance(approximate)
Figure 1.
Figure 2.
Time trial 1
From A to B
Time trial 2 Time trial 3 Average time Distance, m Speed, m/s
Eye level height = 1.4 meters,fractional part = 8/10, number of structures = six
Stepping distance is 30 meters = 39 stepsthe base of the hill = 32 steps
3.0 s 2.6 s 2.8 s
A
Height 1.4 meters
BaseB
Peak
Amusement Park Physics With a NASA Twist EG–2003–03–010–GRC
89
Roller Coasters—Initial Hill—Nonattending StudentsRide Measurements
The accelerometer was taken on a ride, with close attentionpaid to observing the g measurements.
1.
2.
When do microgravity (<1 g) moments occur (up and over ahill, down a hill and into a valley, up a hill, down a hill, overthe crest of a hill, going through a valley, around curves)?
What was the highest g-level reading you observed? Wherewas it (up and over a hill, down a hill and into a valley, up ahill, down a hill, over the crest of a hill, going through a valley,around curves)?
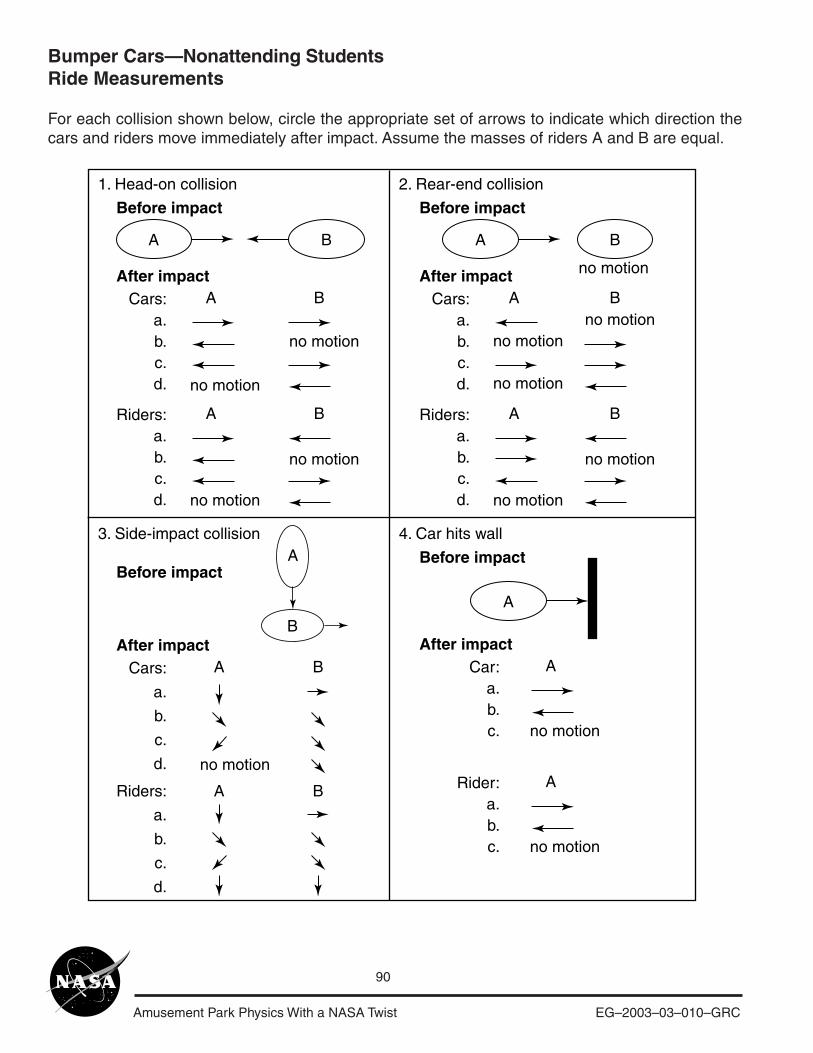
Amusement Park Physics With a NASA Twist EG–2003–03–010–GRC
90
Bumper Cars—Nonattending StudentsRide Measurements
For each collision shown below, circle the appropriate set of arrows to indicate which direction thecars and riders move immediately after impact. Assume the masses of riders A and B are equal.
A B
A B
1. Head-on collision 2. Rear-end collision
3. Side-impact collision 4. Car hits wall
Before impact
After impactCars:
a.b.c.d.
A BRiders:a.b.c.d.
no motion
no motion
no motion
no motion
A B
A B
Before impact
After impactCars:
a.b.c.d.
A BRiders:a.b.c.d.
no motion
no motion
no motion
no motion
no motion
no motion
A B
A
B
Before impact
After impactCars:
a.
b.
c.
d.
A BRiders:
a.
b.
c.
d.
no motion
A
A
Before impact
After impactCar:
a.b.c.
ARider:a.b.c. no motion
no motion
Amusement Park Physics With a NASA Twist EG–2003–03–010–GRC
91
Bumper Cars—Nonattending StudentsRide Measurements
Answer the following questions in complete sentences.
1.
2.
3.
During collision 2, is kinetic energy (KE) conserved?Explain why or why not.
In collision 3, KE is not conserved. If the total energy ofthe system is conserved, where did the KE go?
During collision 4, is KE conserved? Explain why or why not.
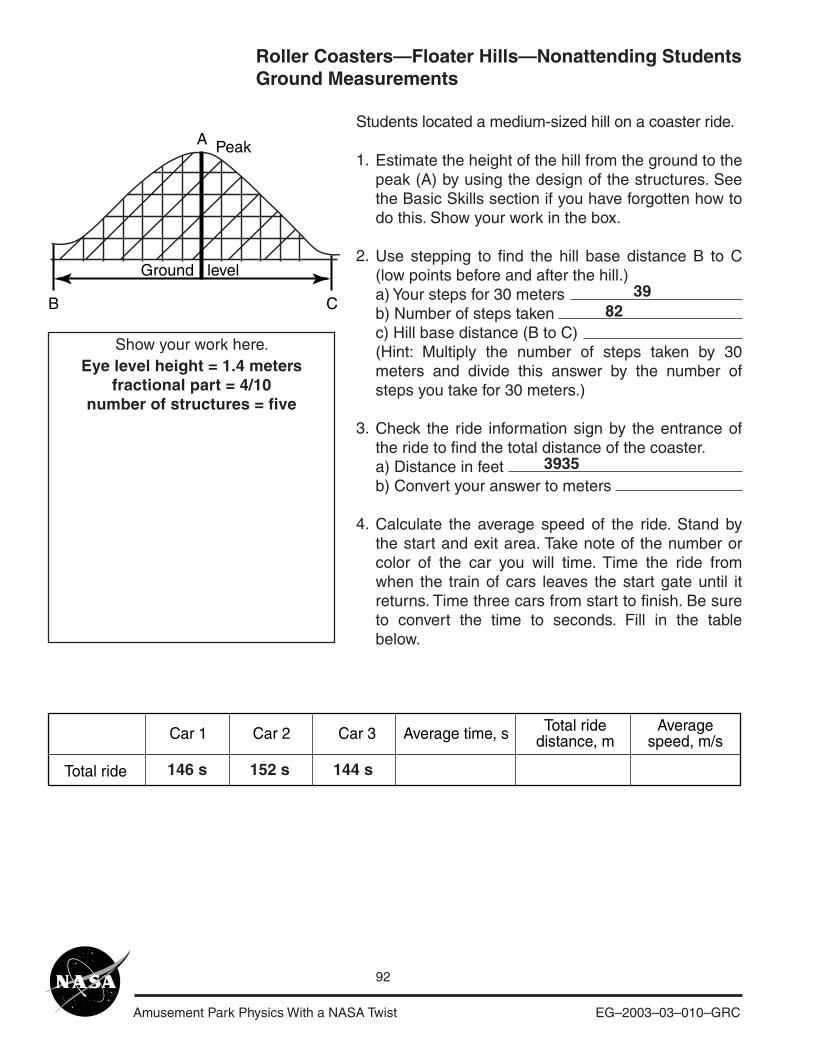
Amusement Park Physics With a NASA Twist EG–2003–03–010–GRC
92
Students located a medium-sized hill on a coaster ride.
1.
2.
3.
4.
Estimate the height of the hill from the ground to thepeak (A) by using the design of the structures. Seethe Basic Skills section if you have forgotten how todo this. Show your work in the box.
Use stepping to find the hill base distance B to C(low points before and after the hill.)a) Your steps for 30 metersb) Number of steps takenc) Hill base distance (B to C)(Hint: Multiply the number of steps taken by 30meters and divide this answer by the number ofsteps you take for 30 meters.)
Check the ride information sign by the entrance ofthe ride to find the total distance of the coaster.a) Distance in feetb) Convert your answer to meters
Calculate the average speed of the ride. Stand bythe start and exit area. Take note of the number orcolor of the car you will time. Time the ride fromwhen the train of cars leaves the start gate until itreturns. Time three cars from start to finish. Be sureto convert the time to seconds. Fill in the tablebelow.
Car 1
Total ride
Car 2 Car 3 Average time, s Total ridedistance, m
Averagespeed, m/s
A
B C
Peak
Ground level
Show your work here.Eye level height = 1.4 meters
fractional part = 4/10number of structures = five
3982
3935
146 s 152 s 144 s
Roller Coasters—Floater Hills—Nonattending StudentsGround Measurements
Amusement Park Physics With a NASA Twist EG–2003–03–010–GRC
93
Roller Coasters—Floater Hills—Nonattending StudentsRide Measurements
If you were to take the accelerometer on the ride, paying attention to the g levels, you would experiencevarious g levels.
1. Where would you experience microgravity or low g? Check all that apply.around curvesgoing up and over the top of the hillsgoing down and into a low point or valley
2. What would be the lowest g reading?
3. Where would you experience high-g levels? Check all that apply.around curvesgoing up and over the top of the hillsgoing down and into a low point or valley
4. What would be the highest g reading?
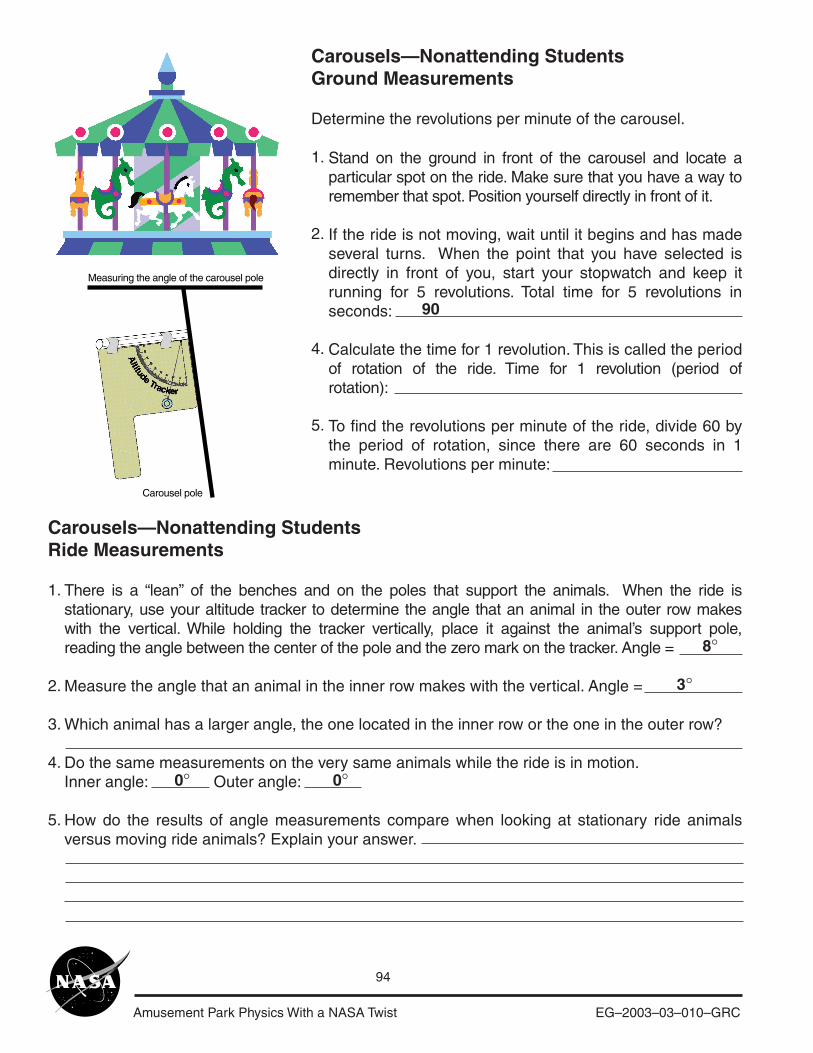
Amusement Park Physics With a NASA Twist EG–2003–03–010–GRC
94
Carousels—Nonattending StudentsGround Measurements
Determine the revolutions per minute of the carousel.
1.
2.
4.
5.
Stand on the ground in front of the carousel and locate aparticular spot on the ride. Make sure that you have a way toremember that spot. Position yourself directly in front of it.
If the ride is not moving, wait until it begins and has madeseveral turns. When the point that you have selected isdirectly in front of you, start your stopwatch and keep itrunning for 5 revolutions. Total time for 5 revolutions inseconds:
Calculate the time for 1 revolution. This is called the periodof rotation of the ride. Time for 1 revolution (period ofrotation):
To find the revolutions per minute of the ride, divide 60 bythe period of rotation, since there are 60 seconds in 1minute. Revolutions per minute:
Carousels—Nonattending StudentsRide Measurements
1.
2.
3.
4.
5.
There is a “lean” of the benches and on the poles that support the animals. When the ride isstationary, use your altitude tracker to determine the angle that an animal in the outer row makeswith the vertical. While holding the tracker vertically, place it against the animal’s support pole,reading the angle between the center of the pole and the zero mark on the tracker. Angle =
Measure the angle that an animal in the inner row makes with the vertical. Angle =
Which animal has a larger angle, the one located in the inner row or the one in the outer row?
Do the same measurements on the very same animals while the ride is in motion.Inner angle: Outer angle:
How do the results of angle measurements compare when looking at stationary ride animalsversus moving ride animals? Explain your answer.
90
8°
3°
0° 0°
Measuring the angle of the carousel pole
Carousel pole
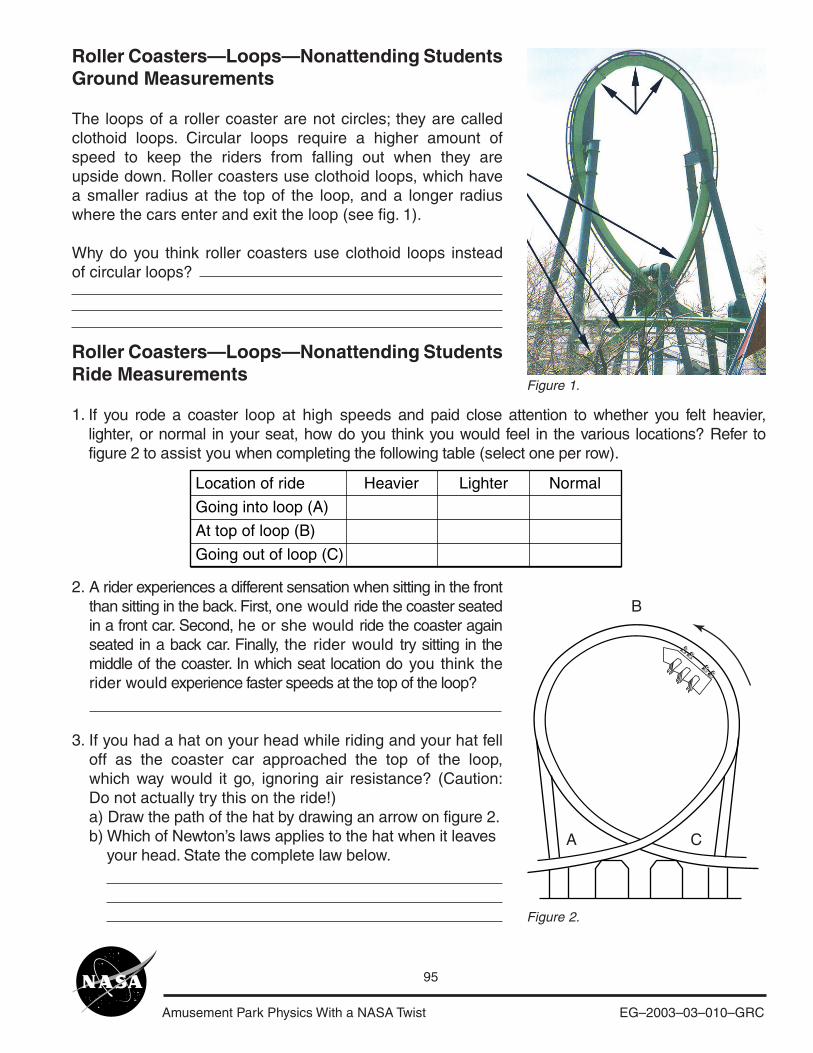
Amusement Park Physics With a NASA Twist EG–2003–03–010–GRC
95
Roller Coasters—Loops—Nonattending StudentsGround Measurements
The loops of a roller coaster are not circles; they are calledclothoid loops. Circular loops require a higher amount ofspeed to keep the riders from falling out when they areupside down. Roller coasters use clothoid loops, which havea smaller radius at the top of the loop, and a longer radiuswhere the cars enter and exit the loop (see fig. 1).
Why do you think roller coasters use clothoid loops insteadof circular loops?
Figure 1.
Roller Coasters—Loops—Nonattending StudentsRide Measurements
1.
2.
3.
A
B
C
Figure 2.
A rider experiences a different sensation when sitting in the frontthan sitting in the back. First, one would ride the coaster seatedin a front car. Second, he or she would ride the coaster againseated in a back car. Finally, the rider would try sitting in themiddle of the coaster. In which seat location do you think therider would experience faster speeds at the top of the loop?
If you had a hat on your head while riding and your hat felloff as the coaster car approached the top of the loop,which way would it go, ignoring air resistance? (Caution:Do not actually try this on the ride!)a) Draw the path of the hat by drawing an arrow on figure 2.b) Which of Newton’s laws applies to the hat when it leaves your head. State the complete law below.
Location of ride Heavier Lighter Normal
Going into loop (A)
At top of loop (B)
Going out of loop (C)
If you rode a coaster loop at high speeds and paid close attention to whether you felt heavier,lighter, or normal in your seat, how do you think you would feel in the various locations? Refer tofigure 2 to assist you when completing the following table (select one per row).
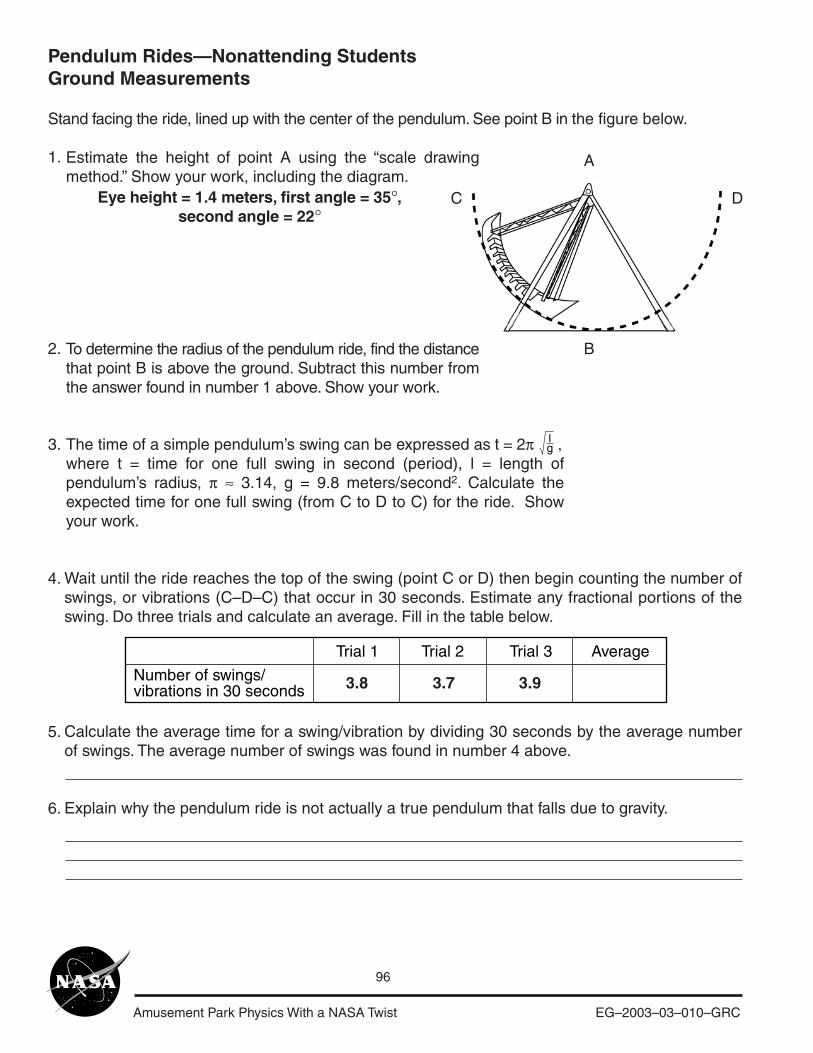
Amusement Park Physics With a NASA Twist EG–2003–03–010–GRC
96
A
B
C D
Pendulum Rides—Nonattending StudentsGround Measurements
Stand facing the ride, lined up with the center of the pendulum. See point B in the figure below.
1.
2.
3.
4.
5.
6.
Estimate the height of point A using the “scale drawingmethod.” Show your work, including the diagram.
To determine the radius of the pendulum ride, find the distancethat point B is above the ground. Subtract this number fromthe answer found in number 1 above. Show your work.
The time of a simple pendulum’s swing can be expressed as t = 2π ,where t = time for one full swing in second (period), l = length ofpendulum’s radius, π ≈ 3.14, g = 9.8 meters/second2. Calculate theexpected time for one full swing (from C to D to C) for the ride. Showyour work.
Trial 1
Number of swings/vibrations in 30 seconds
Trial 2 Trial 3 Average
Wait until the ride reaches the top of the swing (point C or D) then begin counting the number ofswings, or vibrations (C–D–C) that occur in 30 seconds. Estimate any fractional portions of theswing. Do three trials and calculate an average. Fill in the table below.
Calculate the average time for a swing/vibration by dividing 30 seconds by the average numberof swings. The average number of swings was found in number 4 above.
Explain why the pendulum ride is not actually a true pendulum that falls due to gravity.
3.8 3.7 3.9
Eye height = 1.4 meters, first angle = 35°,second angle = 22°
lg
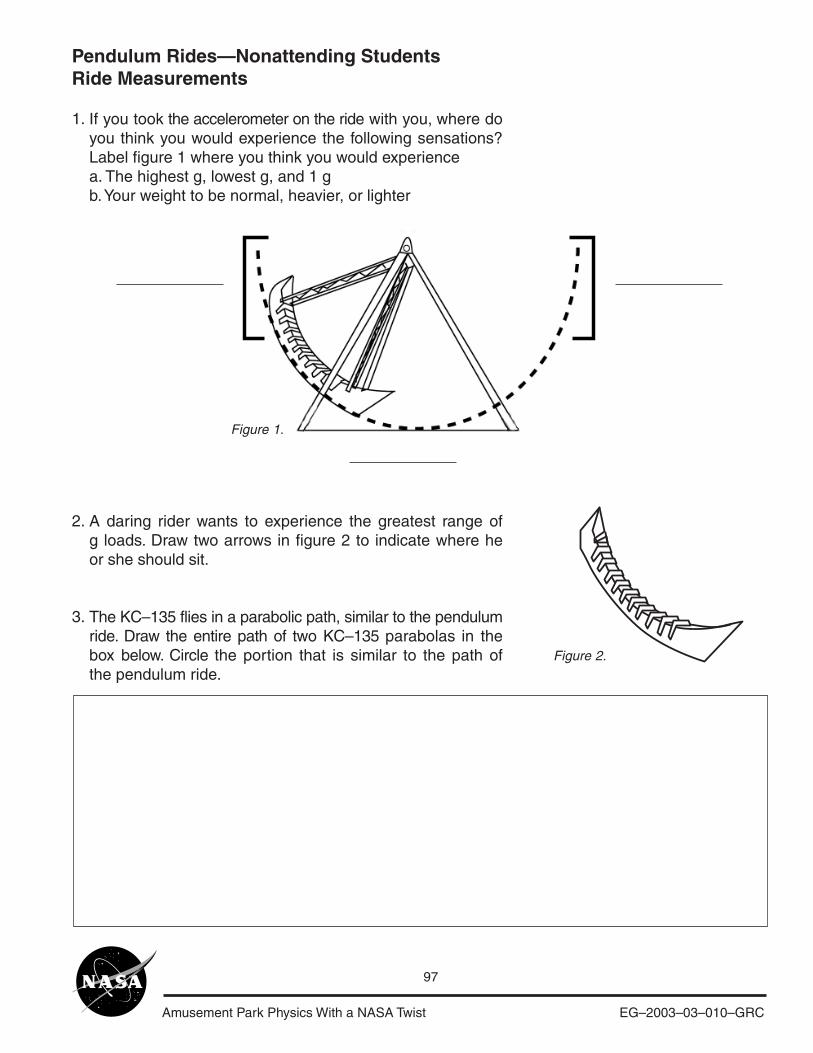
Amusement Park Physics With a NASA Twist EG–2003–03–010–GRC
97
Pendulum Rides—Nonattending StudentsRide Measurements
1.
2.
3.
If you took the accelerometer on the ride with you, where doyou think you would experience the following sensations?Label figure 1 where you think you would experiencea. The highest g, lowest g, and 1 gb. Your weight to be normal, heavier, or lighter
A daring rider wants to experience the greatest range ofg loads. Draw two arrows in figure 2 to indicate where heor she should sit.
The KC–135 flies in a parabolic path, similar to the pendulumride. Draw the entire path of two KC–135 parabolas in thebox below. Circle the portion that is similar to the path ofthe pendulum ride.
Figure 1.
Figure 2.
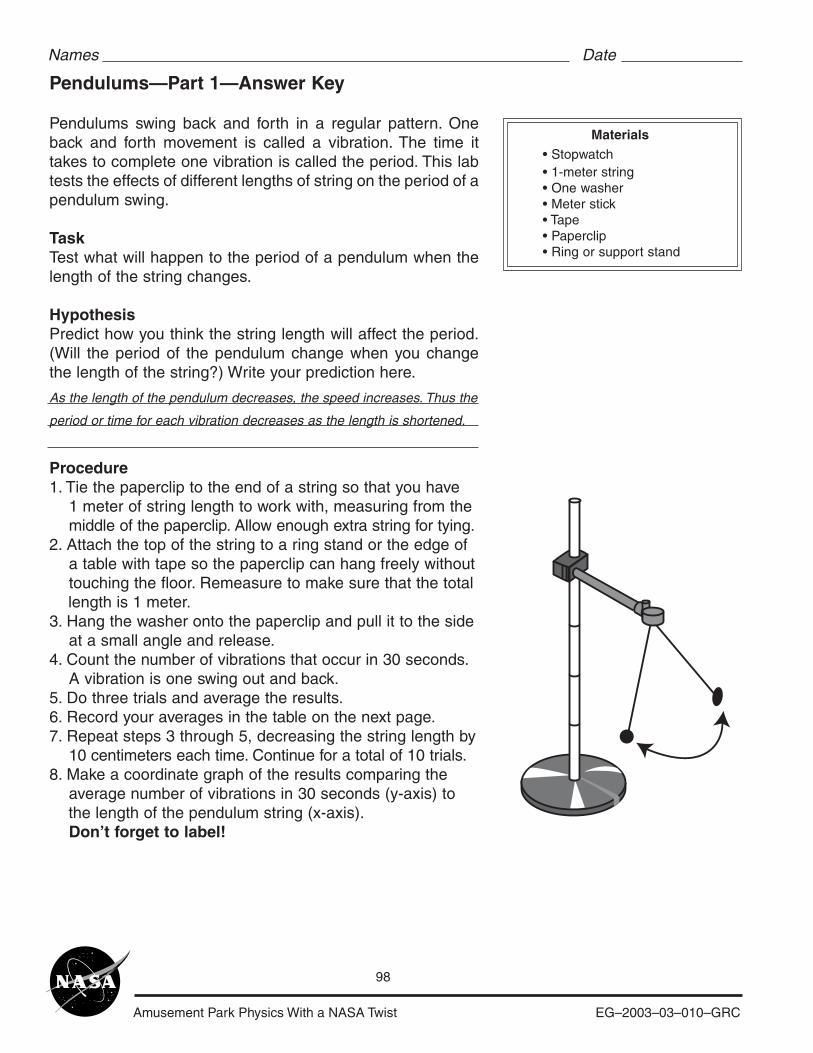
Amusement Park Physics With a NASA Twist EG–2003–03–010–GRC
98
Pendulums—Part 1—Answer Key
Pendulums swing back and forth in a regular pattern. Oneback and forth movement is called a vibration. The time ittakes to complete one vibration is called the period. This labtests the effects of different lengths of string on the period of apendulum swing.
TaskTest what will happen to the period of a pendulum when thelength of the string changes.
HypothesisPredict how you think the string length will affect the period.(Will the period of the pendulum change when you changethe length of the string?) Write your prediction here.
Procedure1. Tie the paperclip to the end of a string so that you have 1 meter of string length to work with, measuring from the middle of the paperclip. Allow enough extra string for tying.2. Attach the top of the string to a ring stand or the edge of a table with tape so the paperclip can hang freely without touching the floor. Remeasure to make sure that the total length is 1 meter.3. Hang the washer onto the paperclip and pull it to the side at a small angle and release.4. Count the number of vibrations that occur in 30 seconds. A vibration is one swing out and back.5. Do three trials and average the results.6. Record your averages in the table on the next page.7. Repeat steps 3 through 5, decreasing the string length by 10 centimeters each time. Continue for a total of 10 trials.8. Make a coordinate graph of the results comparing the average number of vibrations in 30 seconds (y-axis) to the length of the pendulum string (x-axis). Don’t forget to label!
Materials• Stopwatch• 1-meter string• One washer• Meter stick• Tape• Paperclip• Ring or support stand
Names Date
As the length of the pendulum decreases, the speed increases. Thus the
period or time for each vibration decreases as the length is shortened.
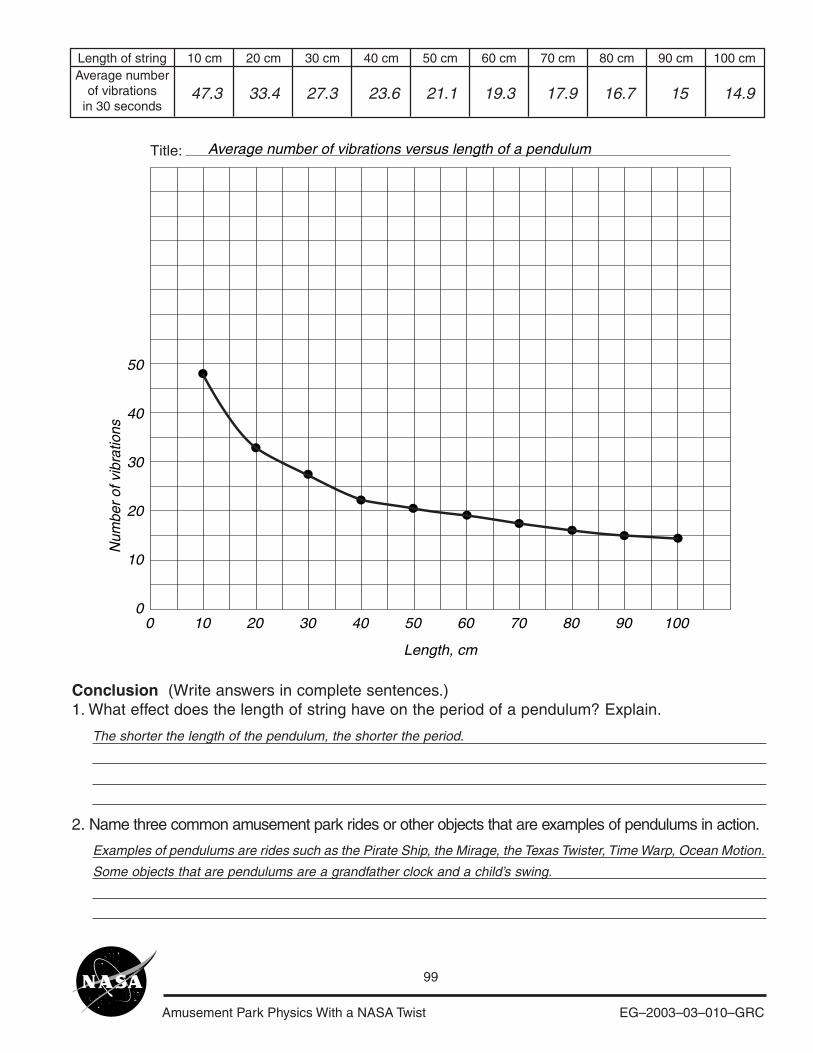
Amusement Park Physics With a NASA Twist EG–2003–03–010–GRC
99
Length of string 10 cm 20 cm 30 cm 40 cm 50 cm 60 cm 70 cm 80 cm 90 cm 100 cmAverage number
of vibrationsin 30 seconds
Conclusion (Write answers in complete sentences.)1. What effect does the length of string have on the period of a pendulum? Explain.
2. Name three common amusement park rides or other objects that are examples of pendulums in action.
Title:
50
40
30
20
10
00 10 20 30 40 50 60 70 80 90 100
Length, cm
Average number of vibrations versus length of a pendulum
Num
ber
of v
ibra
tions
The shorter the length of the pendulum, the shorter the period.
47.3 33.4 27.3 23.6 21.1 19.3 17.9 16.7 15 14.9
Examples of pendulums are rides such as the Pirate Ship, the Mirage, the Texas Twister, Time Warp, Ocean Motion.
Some objects that are pendulums are a grandfather clock and a child’s swing.
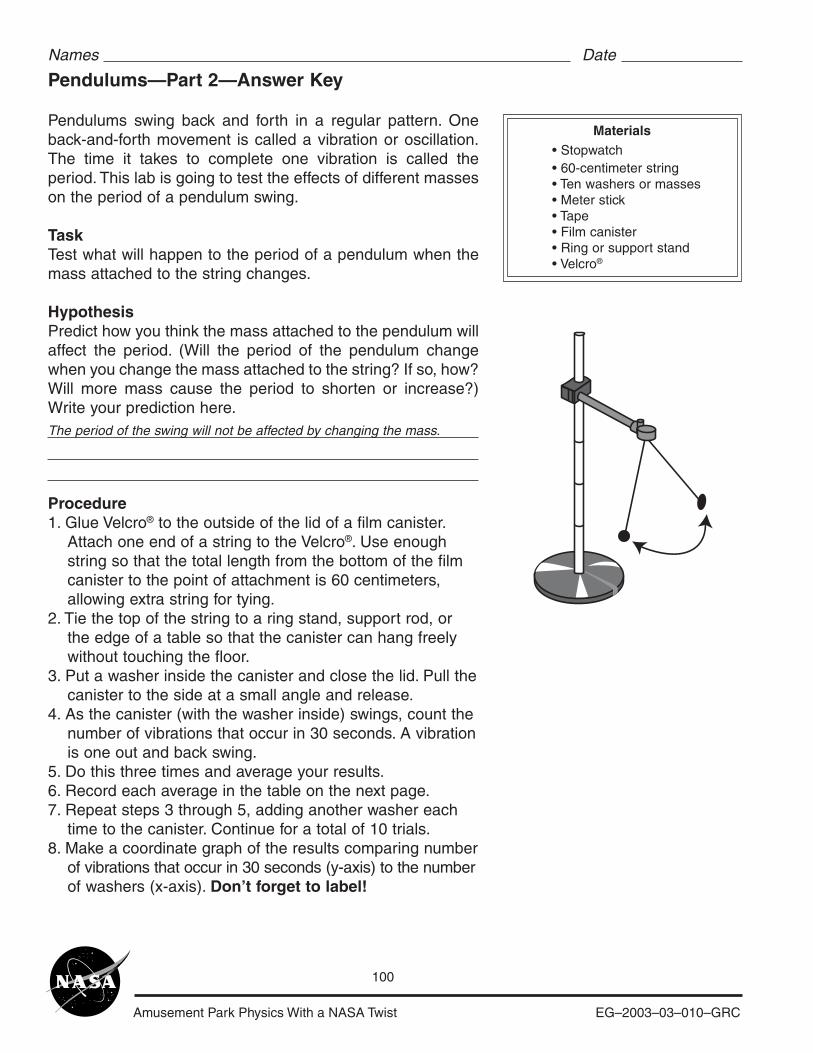
Amusement Park Physics With a NASA Twist EG–2003–03–010–GRC
100
Pendulums—Part 2—Answer Key
Pendulums swing back and forth in a regular pattern. Oneback-and-forth movement is called a vibration or oscillation.The time it takes to complete one vibration is called theperiod. This lab is going to test the effects of different masseson the period of a pendulum swing.
TaskTest what will happen to the period of a pendulum when themass attached to the string changes.
HypothesisPredict how you think the mass attached to the pendulum willaffect the period. (Will the period of the pendulum changewhen you change the mass attached to the string? If so, how?Will more mass cause the period to shorten or increase?)Write your prediction here.
Procedure1. Glue Velcro® to the outside of the lid of a film canister. Attach one end of a string to the Velcro®. Use enough string so that the total length from the bottom of the film canister to the point of attachment is 60 centimeters, allowing extra string for tying.2. Tie the top of the string to a ring stand, support rod, or the edge of a table so that the canister can hang freely without touching the floor.3. Put a washer inside the canister and close the lid. Pull the canister to the side at a small angle and release.4. As the canister (with the washer inside) swings, count the number of vibrations that occur in 30 seconds. A vibration is one out and back swing.5. Do this three times and average your results.6. Record each average in the table on the next page.7. Repeat steps 3 through 5, adding another washer each time to the canister. Continue for a total of 10 trials.8. Make a coordinate graph of the results comparing number of vibrations that occur in 30 seconds (y-axis) to the number of washers (x-axis). Don’t forget to label!
Materials• Stopwatch• 60-centimeter string• Ten washers or masses• Meter stick• Tape• Film canister• Ring or support stand• Velcro®
Names Date
The period of the swing will not be affected by changing the mass.
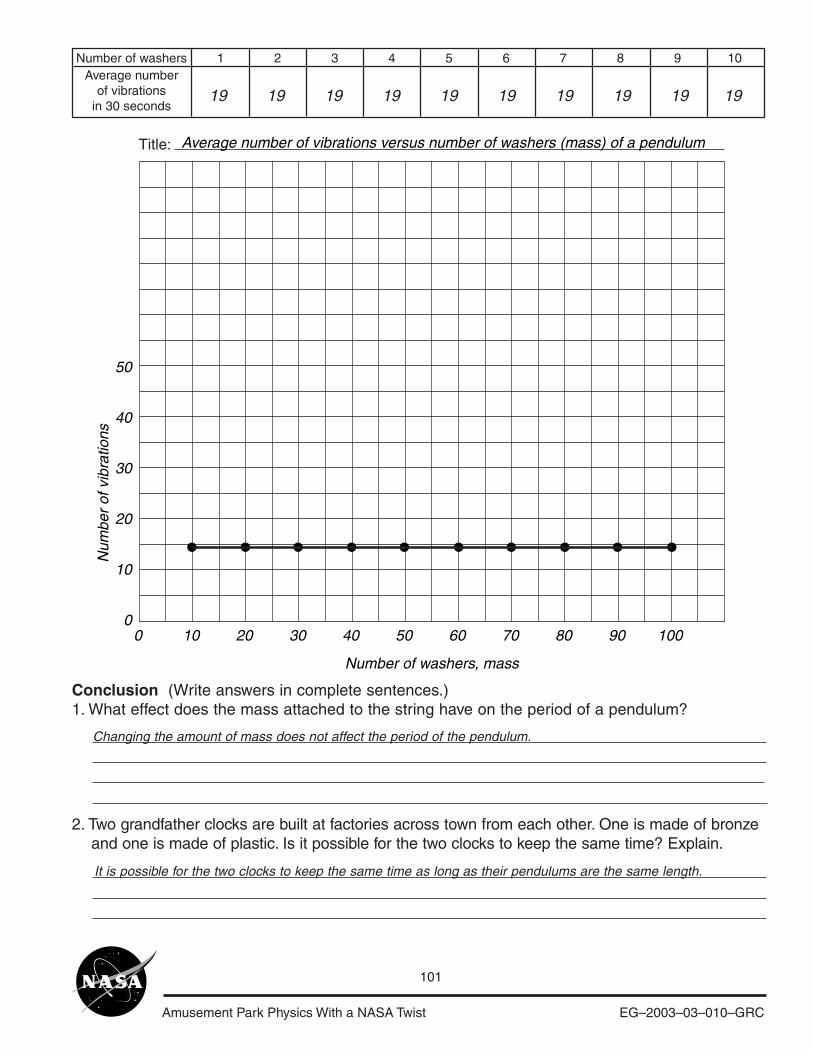
Amusement Park Physics With a NASA Twist EG–2003–03–010–GRC
101
Conclusion (Write answers in complete sentences.)1. What effect does the mass attached to the string have on the period of a pendulum?
2. Two grandfather clocks are built at factories across town from each other. One is made of bronze and one is made of plastic. Is it possible for the two clocks to keep the same time? Explain.
Number of washers 1 2 3 4 5 6 7 8 9 10Average number
of vibrationsin 30 seconds
19 19 19 19 19 19 19 19 19 19
Title:
50
40
30
20
10
00 10 20 30 40 50 60 70 80 90 100
Number of washers, mass
Average number of vibrations versus number of washers (mass) of a pendulum
Num
ber
of v
ibra
tions
Changing the amount of mass does not affect the period of the pendulum.
It is possible for the two clocks to keep the same time as long as their pendulums are the same length.
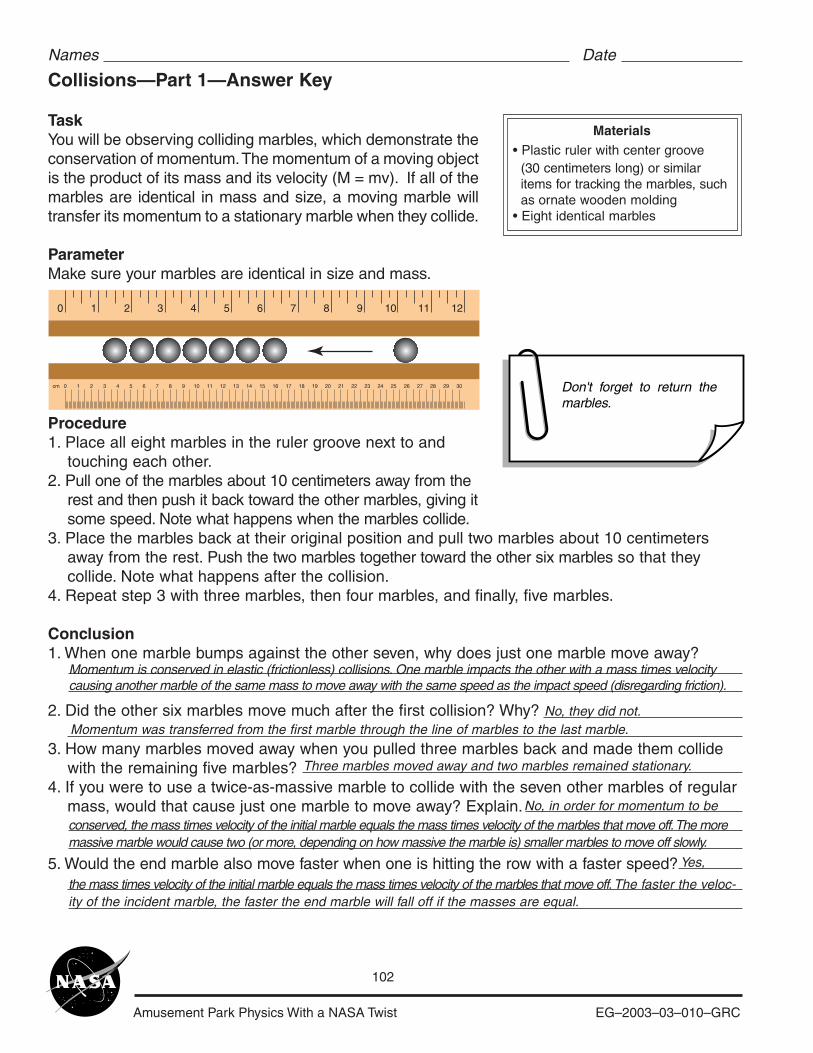
Amusement Park Physics With a NASA Twist EG–2003–03–010–GRC
102
Collisions—Part 1—Answer Key
TaskYou will be observing colliding marbles, which demonstrate theconservation of momentum. The momentum of a moving objectis the product of its mass and its velocity (M = mv). If all of themarbles are identical in mass and size, a moving marble willtransfer its momentum to a stationary marble when they collide.
ParameterMake sure your marbles are identical in size and mass.
Names Date
10
10cm 2 3 4 5 6 7 8 9 10 11 12 13 14 15 16 17 18 19 20 21 22 23 24 25 26 27 28 29 30
2 3 4 5 6 7 8 9 10 11 12
Materials• Plastic ruler with center groove (30 centimeters long) or similar items for tracking the marbles, such as ornate wooden molding• Eight identical marbles
Don't forget to return the marbles.
Procedure1. Place all eight marbles in the ruler groove next to and touching each other.2. Pull one of the marbles about 10 centimeters away from the rest and then push it back toward the other marbles, giving it some speed. Note what happens when the marbles collide.3. Place the marbles back at their original position and pull two marbles about 10 centimeters away from the rest. Push the two marbles together toward the other six marbles so that they collide. Note what happens after the collision.4. Repeat step 3 with three marbles, then four marbles, and finally, five marbles.
Conclusion1. When one marble bumps against the other seven, why does just one marble move away?
2. Did the other six marbles move much after the first collision? Why?
3. How many marbles moved away when you pulled three marbles back and made them collide with the remaining five marbles?4. If you were to use a twice-as-massive marble to collide with the seven other marbles of regular mass, would that cause just one marble to move away? Explain.
5. Would the end marble also move faster when one is hitting the row with a faster speed?
Momentum is conserved in elastic (frictionless) collisions. One marble impacts the other with a mass times velocitycausing another marble of the same mass to move away with the same speed as the impact speed (disregarding friction).
Momentum was transferred from the first marble through the line of marbles to the last marble.No, they did not.
Three marbles moved away and two marbles remained stationary.
No, in order for momentum to beconserved, the mass times velocity of the initial marble equals the mass times velocity of the marbles that move off. The moremassive marble would cause two (or more, depending on how massive the marble is) smaller marbles to move off slowly.
Yes,
the mass times velocity of the initial marble equals the mass times velocity of the marbles that move off. The faster the veloc-ity of the incident marble, the faster the end marble will fall off if the masses are equal.
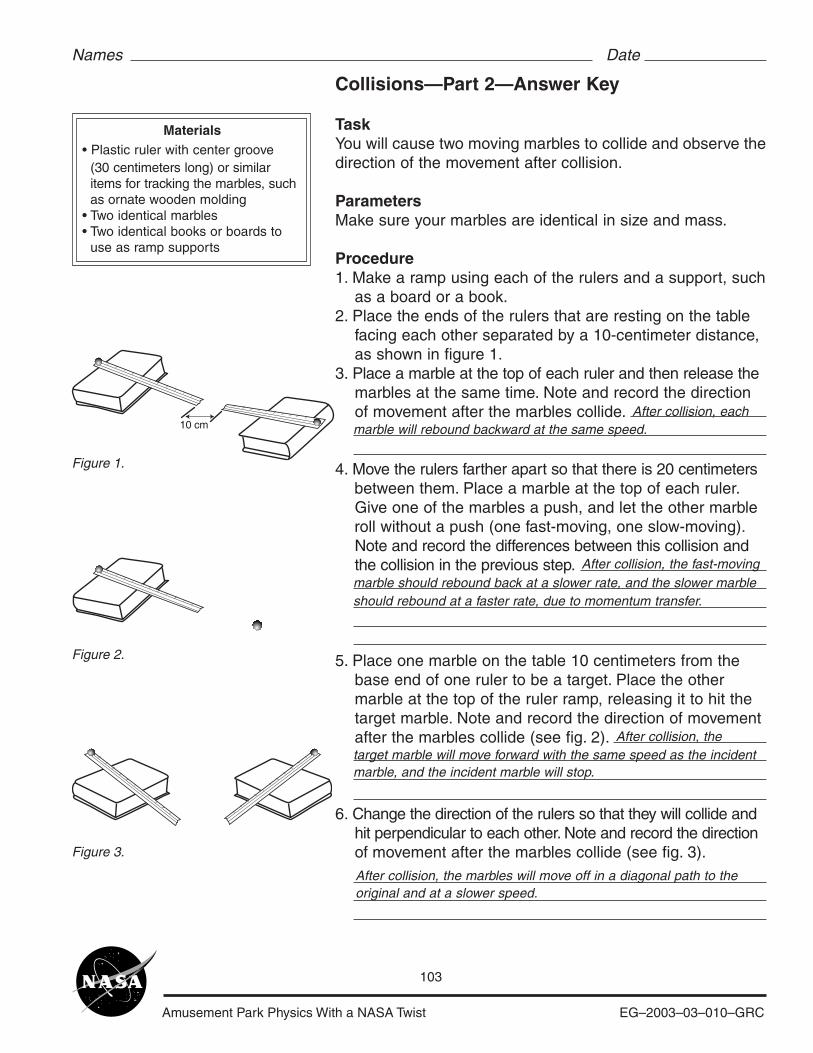
Amusement Park Physics With a NASA Twist EG–2003–03–010–GRC
103
Collisions—Part 2—Answer Key
TaskYou will cause two moving marbles to collide and observe thedirection of the movement after collision.
ParametersMake sure your marbles are identical in size and mass.
Procedure1. Make a ramp using each of the rulers and a support, such as a board or a book.2. Place the ends of the rulers that are resting on the table facing each other separated by a 10-centimeter distance, as shown in figure 1.3. Place a marble at the top of each ruler and then release the marbles at the same time. Note and record the direction of movement after the marbles collide.
4. Move the rulers farther apart so that there is 20 centimeters between them. Place a marble at the top of each ruler. Give one of the marbles a push, and let the other marble roll without a push (one fast-moving, one slow-moving). Note and record the differences between this collision and the collision in the previous step.
5. Place one marble on the table 10 centimeters from the base end of one ruler to be a target. Place the other marble at the top of the ruler ramp, releasing it to hit the target marble. Note and record the direction of movement after the marbles collide (see fig. 2).
6. Change the direction of the rulers so that they will collide and hit perpendicular to each other. Note and record the direction of movement after the marbles collide (see fig. 3).
Names Date
Materials• Plastic ruler with center groove (30 centimeters long) or similar items for tracking the marbles, such as ornate wooden molding• Two identical marbles• Two identical books or boards to use as ramp supports
Figure 1.
Figure 2.
Figure 3.
10 cmAfter collision, each
marble will rebound backward at the same speed.
marble should rebound back at a slower rate, and the slower marbleshould rebound at a faster rate, due to momentum transfer.
After collision, the fast-moving
target marble will move forward with the same speed as the incidentmarble, and the incident marble will stop.
After collision, the
After collision, the marbles will move off in a diagonal path to theoriginal and at a slower speed.
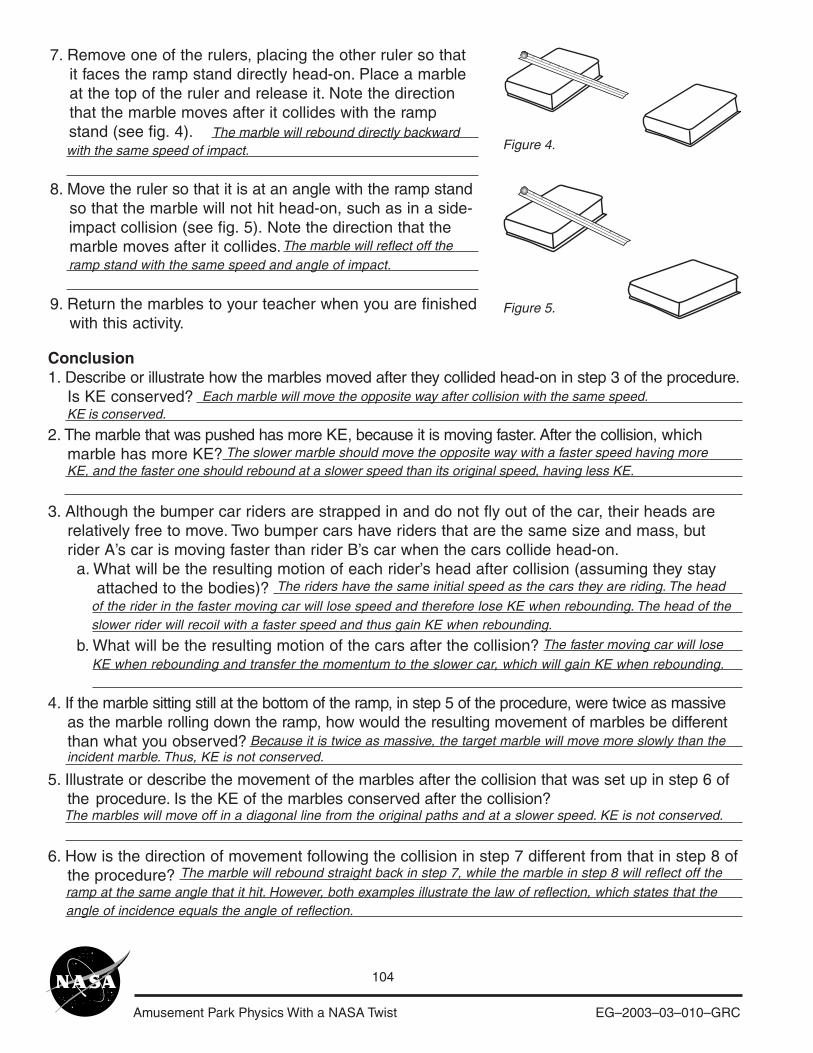
Amusement Park Physics With a NASA Twist EG–2003–03–010–GRC
104
Conclusion1. Describe or illustrate how the marbles moved after they collided head-on in step 3 of the procedure. Is KE conserved?
2. The marble that was pushed has more KE, because it is moving faster. After the collision, which marble has more KE?
3. Although the bumper car riders are strapped in and do not fly out of the car, their heads are relatively free to move. Two bumper cars have riders that are the same size and mass, but rider A’s car is moving faster than rider B’s car when the cars collide head-on.
a. What will be the resulting motion of each rider’s head after collision (assuming they stay attached to the bodies)?
b. What will be the resulting motion of the cars after the collision?
4. If the marble sitting still at the bottom of the ramp, in step 5 of the procedure, were twice as massive as the marble rolling down the ramp, how would the resulting movement of marbles be different than what you observed?
5. Illustrate or describe the movement of the marbles after the collision that was set up in step 6 of the procedure. Is the KE of the marbles conserved after the collision?
6. How is the direction of movement following the collision in step 7 different from that in step 8 of the procedure?
7. Remove one of the rulers, placing the other ruler so that it faces the ramp stand directly head-on. Place a marble at the top of the ruler and release it. Note the direction that the marble moves after it collides with the ramp stand (see fig. 4).
8. Move the ruler so that it is at an angle with the ramp stand so that the marble will not hit head-on, such as in a side- impact collision (see fig. 5). Note the direction that the marble moves after it collides.
9. Return the marbles to your teacher when you are finished with this activity.
Figure 4.
Figure 5.
The marbles will move off in a diagonal line from the original paths and at a slower speed. KE is not conserved.
The marble will rebound directly backwardwith the same speed of impact.
The marble will reflect off theramp stand with the same speed and angle of impact.
Each marble will move the opposite way after collision with the same speed.
The slower marble should move the opposite way with a faster speed having moreKE, and the faster one should rebound at a slower speed than its original speed, having less KE.
of the rider in the faster moving car will lose speed and therefore lose KE when rebounding. The head of theslower rider will recoil with a faster speed and thus gain KE when rebounding.
The riders have the same initial speed as the cars they are riding. The head
The faster moving car will loseKE when rebounding and transfer the momentum to the slower car, which will gain KE when rebounding.
ramp at the same angle that it hit. However, both examples illustrate the law of reflection, which states that theangle of incidence equals the angle of reflection.
Because it is twice as massive, the target marble will move more slowly than the
The marble will rebound straight back in step 7, while the marble in step 8 will reflect off the
incident marble. Thus, KE is not conserved.
KE is conserved.
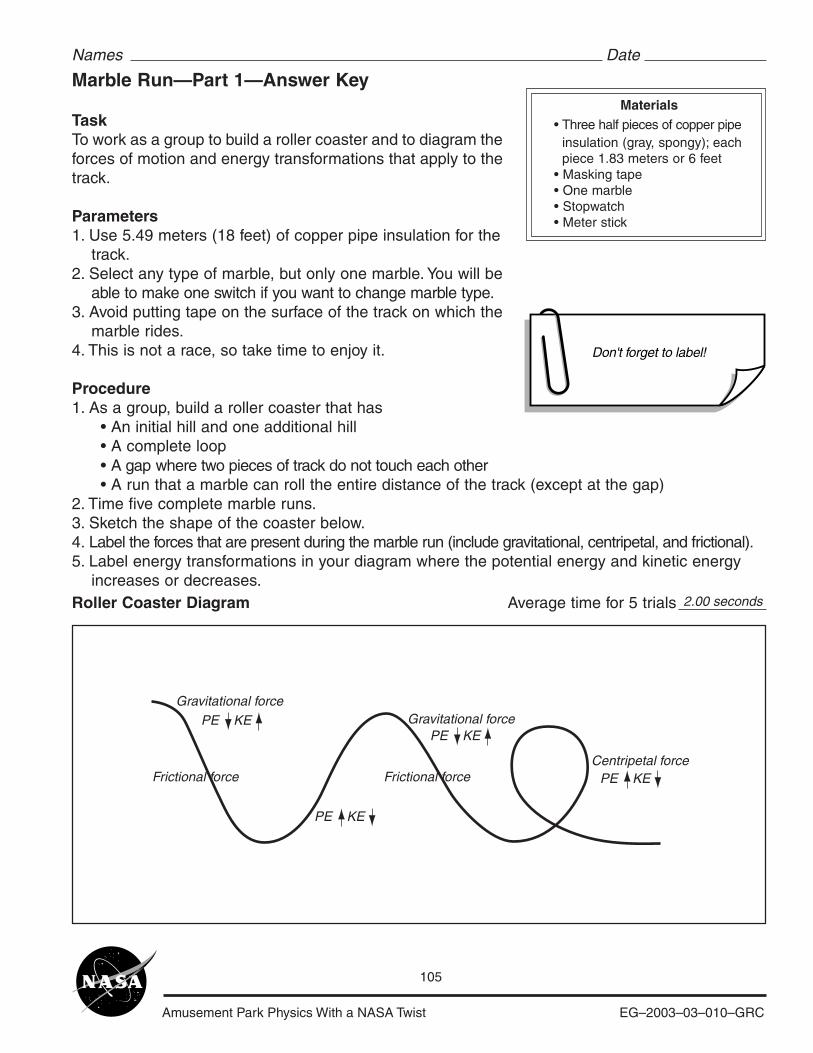
Amusement Park Physics With a NASA Twist EG–2003–03–010–GRC
105
• A gap where two pieces of track do not touch each other• A run that a marble can roll the entire distance of the track (except at the gap)
2. Time five complete marble runs.3. Sketch the shape of the coaster below.4. Label the forces that are present during the marble run (include gravitational, centripetal, and frictional).5. Label energy transformations in your diagram where the potential energy and kinetic energy increases or decreases.Roller Coaster Diagram Average time for 5 trials
Marble Run—Part 1—Answer Key
TaskTo work as a group to build a roller coaster and to diagram theforces of motion and energy transformations that apply to thetrack.
Parameters1. Use 5.49 meters (18 feet) of copper pipe insulation for the track.2. Select any type of marble, but only one marble. You will be able to make one switch if you want to change marble type.3. Avoid putting tape on the surface of the track on which the marble rides.4. This is not a race, so take time to enjoy it.
Procedure1. As a group, build a roller coaster that has
• An initial hill and one additional hill• A complete loop
Names Date
Materials• Three half pieces of copper pipe insulation (gray, spongy); each piece 1.83 meters or 6 feet• Masking tape• One marble• Stopwatch• Meter stick
Don't forget to label!
2.00 seconds
Gravitational force
Frictional force Frictional forceCentripetal force
PE KE Gravitational forcePE KE
PE KE
PE KE
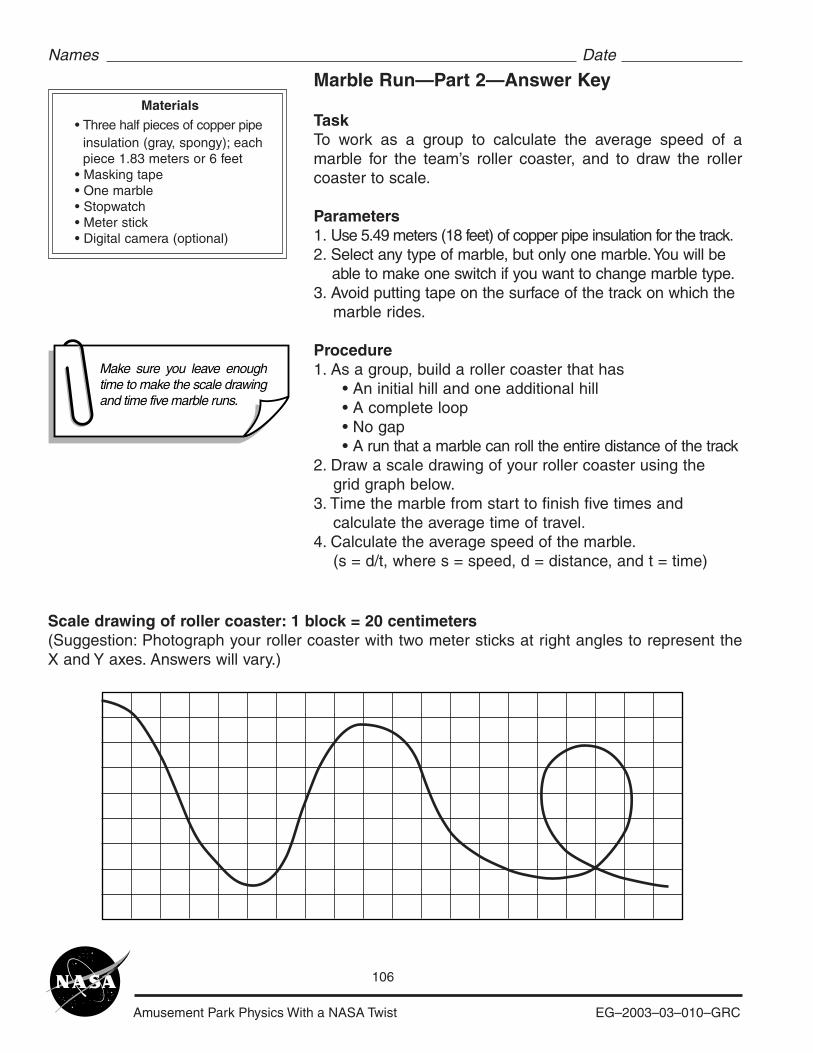
Amusement Park Physics With a NASA Twist EG–2003–03–010–GRC
106
Scale drawing of roller coaster: 1 block = 20 centimeters(Suggestion: Photograph your roller coaster with two meter sticks at right angles to represent theX and Y axes. Answers will vary.)
Names Date
Materials• Three half pieces of copper pipe insulation (gray, spongy); each piece 1.83 meters or 6 feet• Masking tape• One marble• Stopwatch• Meter stick• Digital camera (optional)
Make sure you leave enough time to make the scale drawing and time five marble runs.
Marble Run—Part 2—Answer Key
TaskTo work as a group to calculate the average speed of amarble for the team’s roller coaster, and to draw the rollercoaster to scale.
Parameters1. Use 5.49 meters (18 feet) of copper pipe insulation for the track.2. Select any type of marble, but only one marble. You will be able to make one switch if you want to change marble type.3. Avoid putting tape on the surface of the track on which the marble rides.
Procedure1. As a group, build a roller coaster that has
• An initial hill and one additional hill• A complete loop• No gap• A run that a marble can roll the entire distance of the track
2. Draw a scale drawing of your roller coaster using the grid graph below.3. Time the marble from start to finish five times and calculate the average time of travel.4. Calculate the average speed of the marble. (s = d/t, where s = speed, d = distance, and t = time)

Amusement Park Physics With a NASA Twist EG–2003–03–010–GRC
107
Data and Calculations
Trial1
2
3
4
5
Average
5.45
5.45
5.45
5.45
5.45
5.45
2.68
3.06
2.78
2.70
2.72
2.79
2.03
1.78
1.96
2.02
2.00
1.95
Distance, m Time, s Speed, m/s
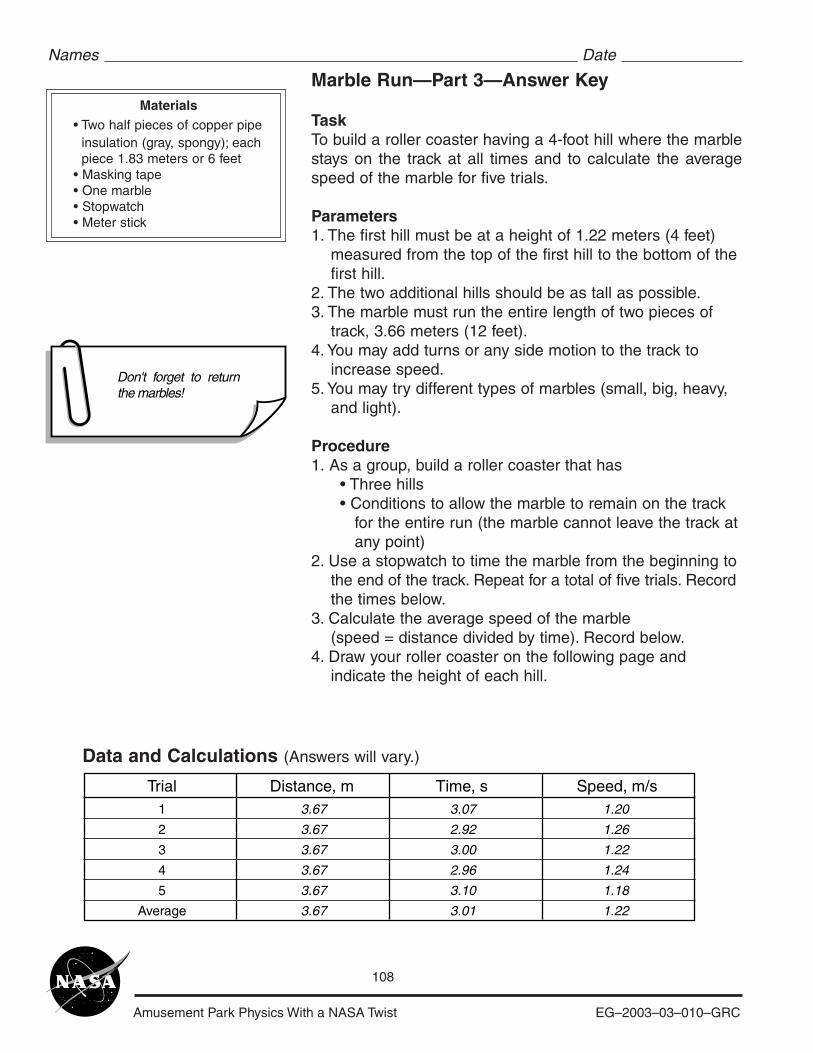
Amusement Park Physics With a NASA Twist EG–2003–03–010–GRC
108
Names Date
Materials• Two half pieces of copper pipe insulation (gray, spongy); each piece 1.83 meters or 6 feet• Masking tape• One marble• Stopwatch• Meter stick
Marble Run—Part 3—Answer Key
TaskTo build a roller coaster having a 4-foot hill where the marblestays on the track at all times and to calculate the averagespeed of the marble for five trials.
Parameters1. The first hill must be at a height of 1.22 meters (4 feet) measured from the top of the first hill to the bottom of the first hill.2. The two additional hills should be as tall as possible.3. The marble must run the entire length of two pieces of track, 3.66 meters (12 feet).4. You may add turns or any side motion to the track to increase speed.5. You may try different types of marbles (small, big, heavy, and light).
Procedure1. As a group, build a roller coaster that has
• Three hills• Conditions to allow the marble to remain on the track for the entire run (the marble cannot leave the track at any point)
2. Use a stopwatch to time the marble from the beginning to the end of the track. Repeat for a total of five trials. Record the times below.3. Calculate the average speed of the marble (speed = distance divided by time). Record below.4. Draw your roller coaster on the following page and indicate the height of each hill.
Don't forget to return the marbles!
Trial1
2
3
4
5
Average
3.67
3.67
3.67
3.67
3.67
3.67
3.07
2.92
3.00
2.96
3.10
3.01
1.20
1.26
1.22
1.24
1.18
1.22
Distance, m Time, s Speed, m/s
Data and Calculations (Answers will vary.)
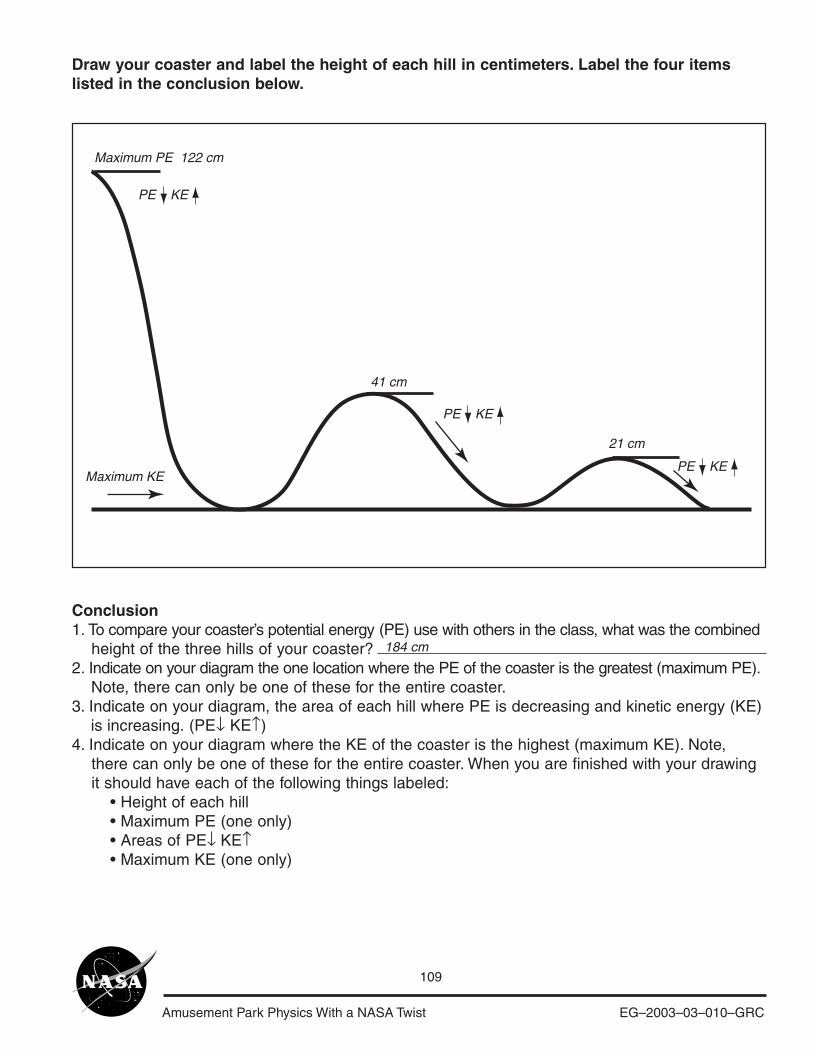
Amusement Park Physics With a NASA Twist EG–2003–03–010–GRC
109
Draw your coaster and label the height of each hill in centimeters. Label the four itemslisted in the conclusion below.
Conclusion1. To compare your coaster’s potential energy (PE) use with others in the class, what was the combined height of the three hills of your coaster?2. Indicate on your diagram the one location where the PE of the coaster is the greatest (maximum PE). Note, there can only be one of these for the entire coaster.3. Indicate on your diagram, the area of each hill where PE is decreasing and kinetic energy (KE) is increasing. (PE↓ KE↑)4. Indicate on your diagram where the KE of the coaster is the highest (maximum KE). Note, there can only be one of these for the entire coaster. When you are finished with your drawing it should have each of the following things labeled:
• Height of each hill• Maximum PE (one only)• Areas of PE↓ KE↑• Maximum KE (one only)
184 cm
Maximum PE 122 cm
41 cm
21 cm
Maximum KE
PE KE
PE KE
PE KE
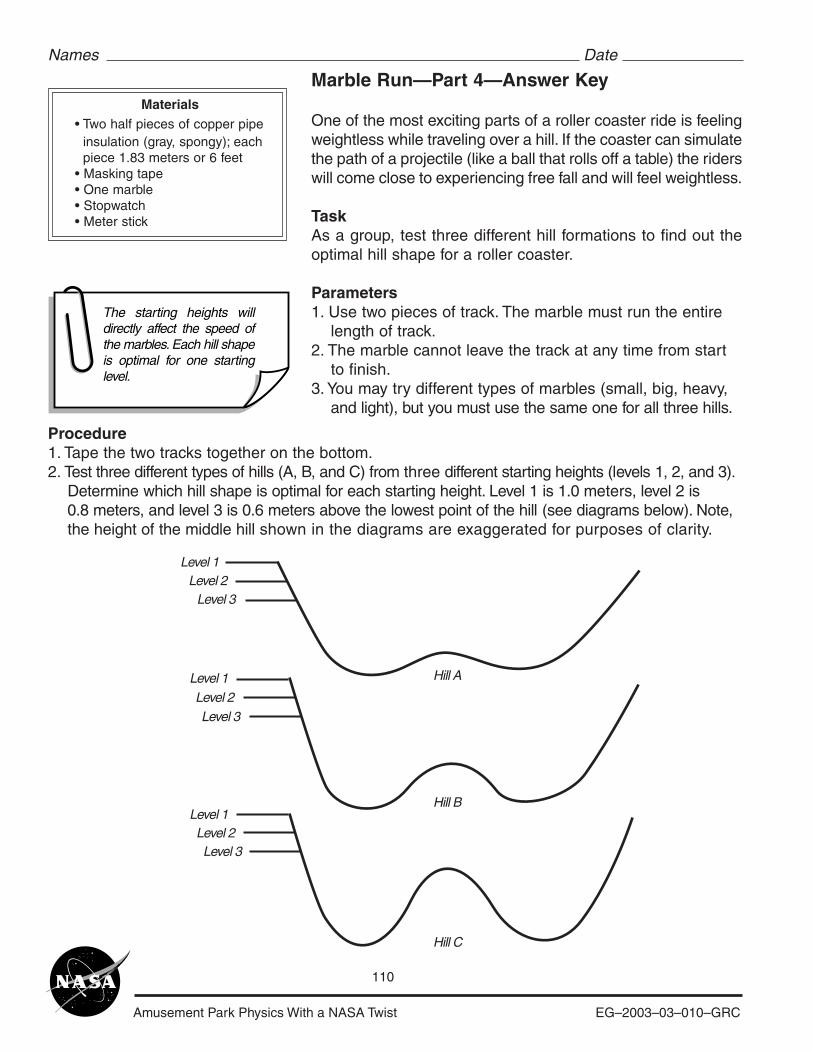
Amusement Park Physics With a NASA Twist EG–2003–03–010–GRC
110
Names Date
Materials• Two half pieces of copper pipe insulation (gray, spongy); each piece 1.83 meters or 6 feet• Masking tape• One marble• Stopwatch• Meter stick
Marble Run—Part 4—Answer Key
One of the most exciting parts of a roller coaster ride is feelingweightless while traveling over a hill. If the coaster can simulatethe path of a projectile (like a ball that rolls off a table) the riderswill come close to experiencing free fall and will feel weightless.
TaskAs a group, test three different hill formations to find out theoptimal hill shape for a roller coaster.
Parameters1. Use two pieces of track. The marble must run the entire length of track.2. The marble cannot leave the track at any time from start to finish.3. You may try different types of marbles (small, big, heavy, and light), but you must use the same one for all three hills.
The starting heights will directly affect the speed of the marbles. Each hill shape is optimal for one starting level.
Level 1Level 2
Level 3
Level 1Level 2Level 3
Level 1Level 2Level 3
Hill A
Hill B
Hill C
Procedure1. Tape the two tracks together on the bottom.2. Test three different types of hills (A, B, and C) from three different starting heights (levels 1, 2, and 3). Determine which hill shape is optimal for each starting height. Level 1 is 1.0 meters, level 2 is 0.8 meters, and level 3 is 0.6 meters above the lowest point of the hill (see diagrams below). Note, the height of the middle hill shown in the diagrams are exaggerated for purposes of clarity.
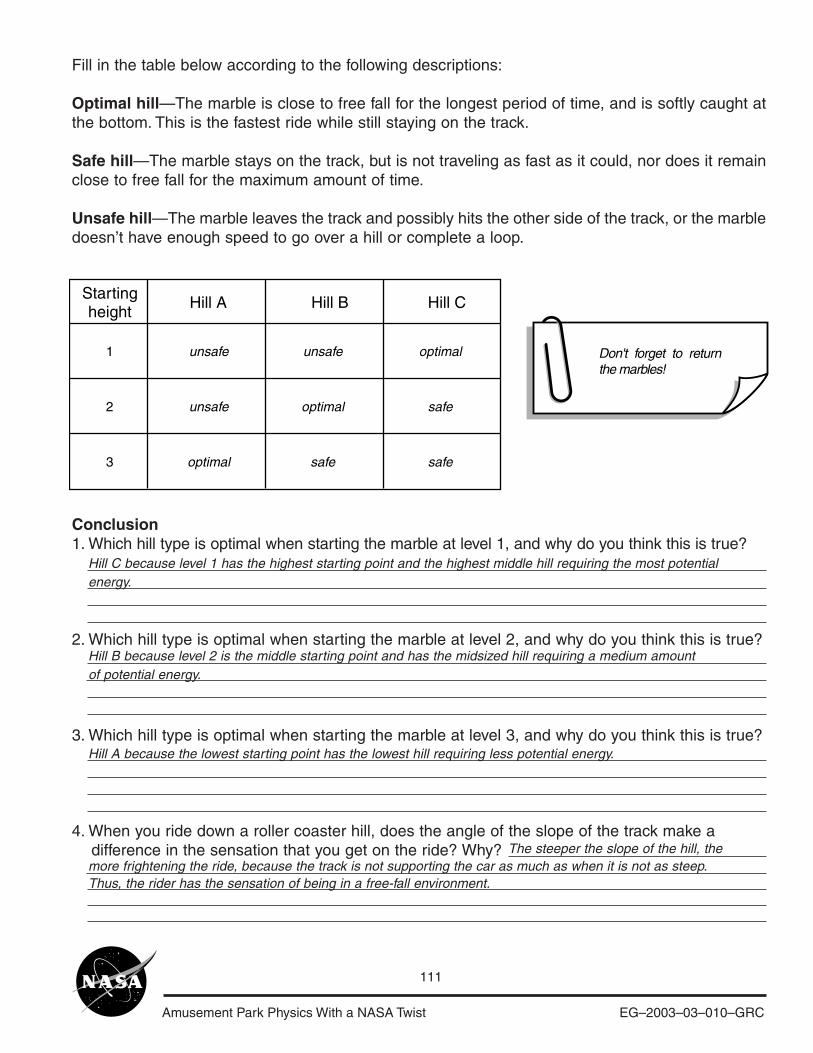
Amusement Park Physics With a NASA Twist EG–2003–03–010–GRC
111
Fill in the table below according to the following descriptions:
Optimal hill—The marble is close to free fall for the longest period of time, and is softly caught atthe bottom. This is the fastest ride while still staying on the track.
Safe hill—The marble stays on the track, but is not traveling as fast as it could, nor does it remainclose to free fall for the maximum amount of time.
Unsafe hill—The marble leaves the track and possibly hits the other side of the track, or the marbledoesn’t have enough speed to go over a hill or complete a loop.
Don't forget to return the marbles!
Startingheight
Hill A Hill B Hill C
1
2
3
unsafe
unsafe
optimal
unsafe
optimal
safe
optimal
safe
safe
Conclusion1. Which hill type is optimal when starting the marble at level 1, and why do you think this is true?
2. Which hill type is optimal when starting the marble at level 2, and why do you think this is true?
3. Which hill type is optimal when starting the marble at level 3, and why do you think this is true?
4. When you ride down a roller coaster hill, does the angle of the slope of the track make a difference in the sensation that you get on the ride? Why?
Hill C because level 1 has the highest starting point and the highest middle hill requiring the most potentialenergy.
Hill B because level 2 is the middle starting point and has the midsized hill requiring a medium amountof potential energy.
Hill A because the lowest starting point has the lowest hill requiring less potential energy.
more frightening the ride, because the track is not supporting the car as much as when it is not as steep.Thus, the rider has the sensation of being in a free-fall environment.
The steeper the slope of the hill, the
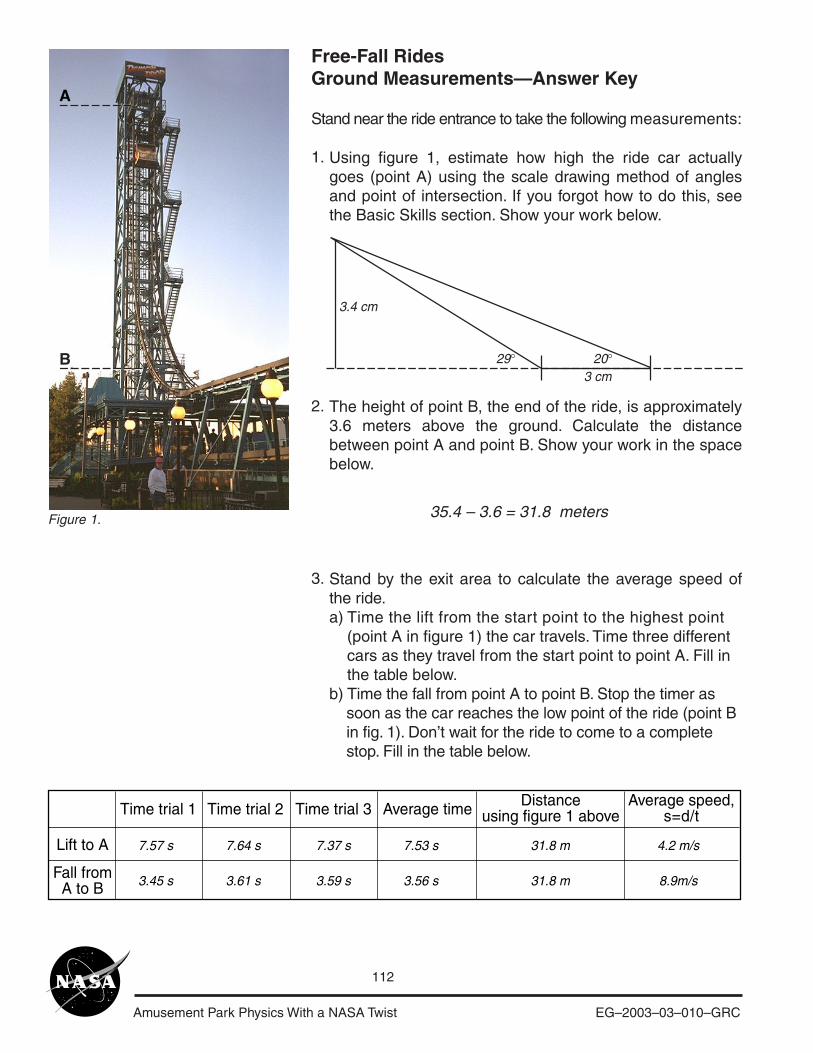
Amusement Park Physics With a NASA Twist EG–2003–03–010–GRC
112
Free-Fall RidesGround Measurements—Answer Key
Stand near the ride entrance to take the following measurements:
1.
2.
3.
Using figure 1, estimate how high the ride car actuallygoes (point A) using the scale drawing method of anglesand point of intersection. If you forgot how to do this, seethe Basic Skills section. Show your work below.
The height of point B, the end of the ride, is approximately3.6 meters above the ground. Calculate the distancebetween point A and point B. Show your work in the spacebelow.
Stand by the exit area to calculate the average speed ofthe ride.a) Time the lift from the start point to the highest point (point A in figure 1) the car travels. Time three different cars as they travel from the start point to point A. Fill in the table below.b) Time the fall from point A to point B. Stop the timer as soon as the car reaches the low point of the ride (point B in fig. 1). Don’t wait for the ride to come to a complete stop. Fill in the table below.
A
B
Figure 1. 35.4 – 3.6 = 31.8 meters
3 cm
3.4 cm
29° 20°
Time trial 1
Lift to A 7.57 s
3.45 s
7.64 s
3.61 s
7.37 s
3.59 s
7.53 s
3.56 s
31.8 m
31.8 m
4.2 m/s
8.9m/sFall fromA to B
Time trial 2 Time trial 3 Average time Distanceusing figure 1 above
Average speed,s=d/t
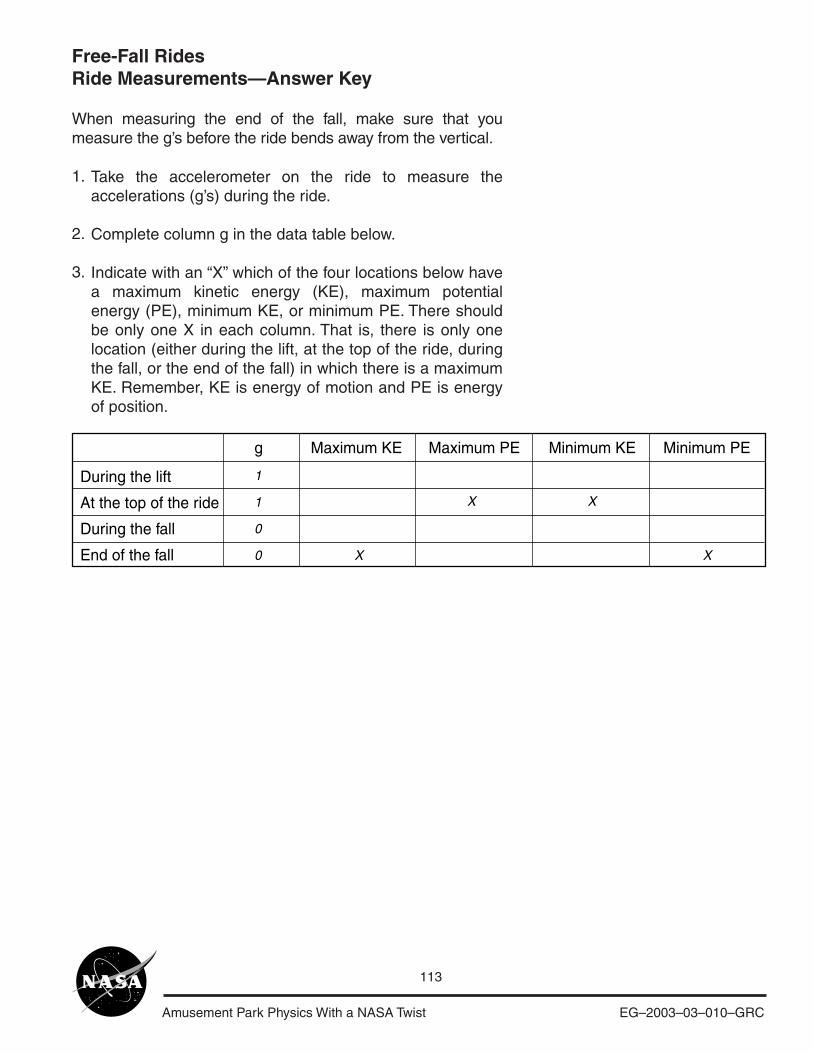
Amusement Park Physics With a NASA Twist EG–2003–03–010–GRC
113
Free-Fall RidesRide Measurements—Answer Key
When measuring the end of the fall, make sure that youmeasure the g’s before the ride bends away from the vertical.
1.
2.
3.
Take the accelerometer on the ride to measure theaccelerations (g’s) during the ride.
Complete column g in the data table below.
Indicate with an “X” which of the four locations below havea maximum kinetic energy (KE), maximum potentialenergy (PE), minimum KE, or minimum PE. There shouldbe only one X in each column. That is, there is only onelocation (either during the lift, at the top of the ride, duringthe fall, or the end of the fall) in which there is a maximumKE. Remember, KE is energy of motion and PE is energyof position.
During the lift
At the top of the ride
During the fall
End of the fall
g Maximum KE Maximum PE Minimum KE Minimum PE
X X
X X
1
1
0
0
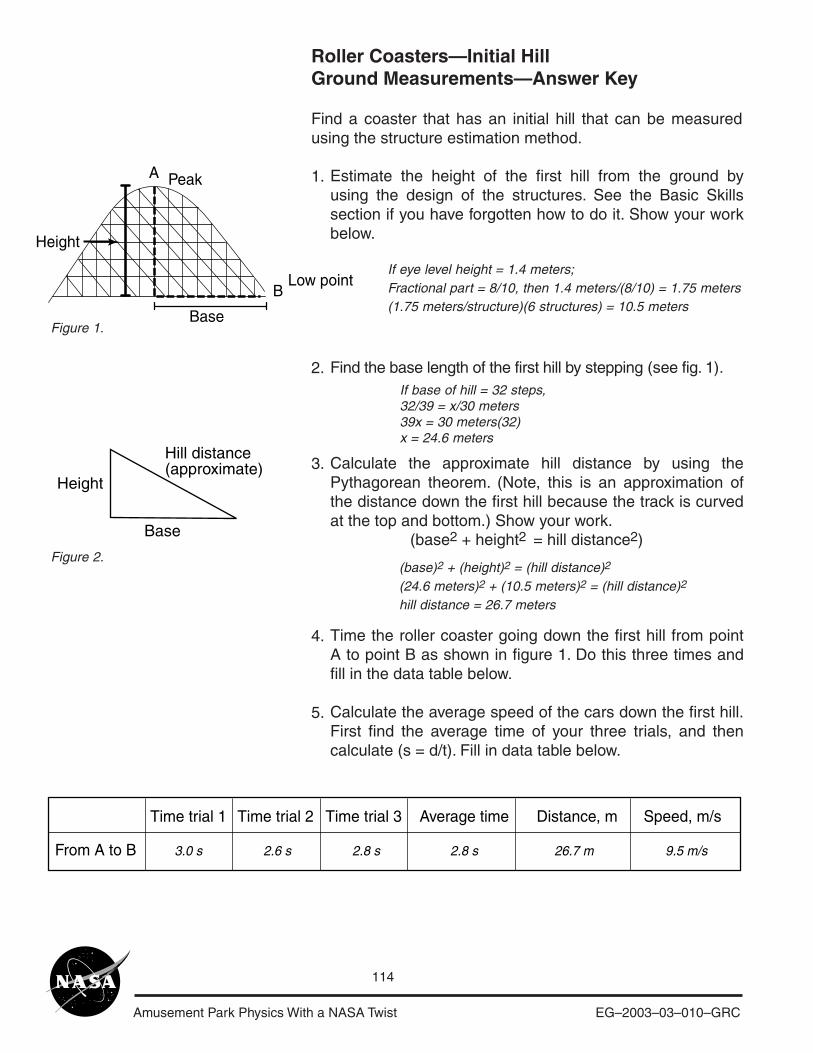
Amusement Park Physics With a NASA Twist EG–2003–03–010–GRC
114
Roller Coasters—Initial HillGround Measurements—Answer Key
Find a coaster that has an initial hill that can be measuredusing the structure estimation method.
1.
2.
3.
4.
5.
Estimate the height of the first hill from the ground byusing the design of the structures. See the Basic Skillssection if you have forgotten how to do it. Show your workbelow.
Find the base length of the first hill by stepping (see fig. 1).
Calculate the approximate hill distance by using thePythagorean theorem. (Note, this is an approximation ofthe distance down the first hill because the track is curvedat the top and bottom.) Show your work. (base2 + height2 = hill distance2)
Time the roller coaster going down the first hill from pointA to point B as shown in figure 1. Do this three times andfill in the data table below.
Calculate the average speed of the cars down the first hill.First find the average time of your three trials, and thencalculate (s = d/t). Fill in data table below.
Height
Base
Hill distance(approximate)
Figure 1.
Figure 2.
If eye level height = 1.4 meters;Fractional part = 8/10, then 1.4 meters/(8/10) = 1.75 meters(1.75 meters/structure)(6 structures) = 10.5 meters
If base of hill = 32 steps,32/39 = x/30 meters39x = 30 meters(32)x = 24.6 meters
(base)2 + (height)2 = (hill distance)2
(24.6 meters)2 + (10.5 meters)2 = (hill distance)2
hill distance = 26.7 meters
Time trial 1
From A to B 3.0 s 2.6 s 2.8 s 2.8 s 26.7 m 9.5 m/s
Time trial 2 Time trial 3 Average time Distance, m Speed, m/s
A
Height
Low point
Base
B
Peak
Amusement Park Physics With a NASA Twist EG–2003–03–010–GRC
115
Roller Coasters—Initial HillRide Measurements—Answer Key
Take the accelerometer on the ride, paying close attention tothe g measurements.
1.
2.
When do microgravity (<1 g) moments occur (up and over ahill, down a hill and into a valley, up a hill, down a hill, overthe crest of a hill, going through a valley, around curves)?
What was the highest g-level reading you observed? Wherewas it (up and over a hill, down a hill and into a valley, up ahill, down a hill, over the crest of a hill, going through a valley,around curves)?
Microgravity conditions occur when moving up and over a hill.
a valley and around curves. The values will vary from slightly morethan 1 g to up to 4 g.
High-g readings will occur while going through
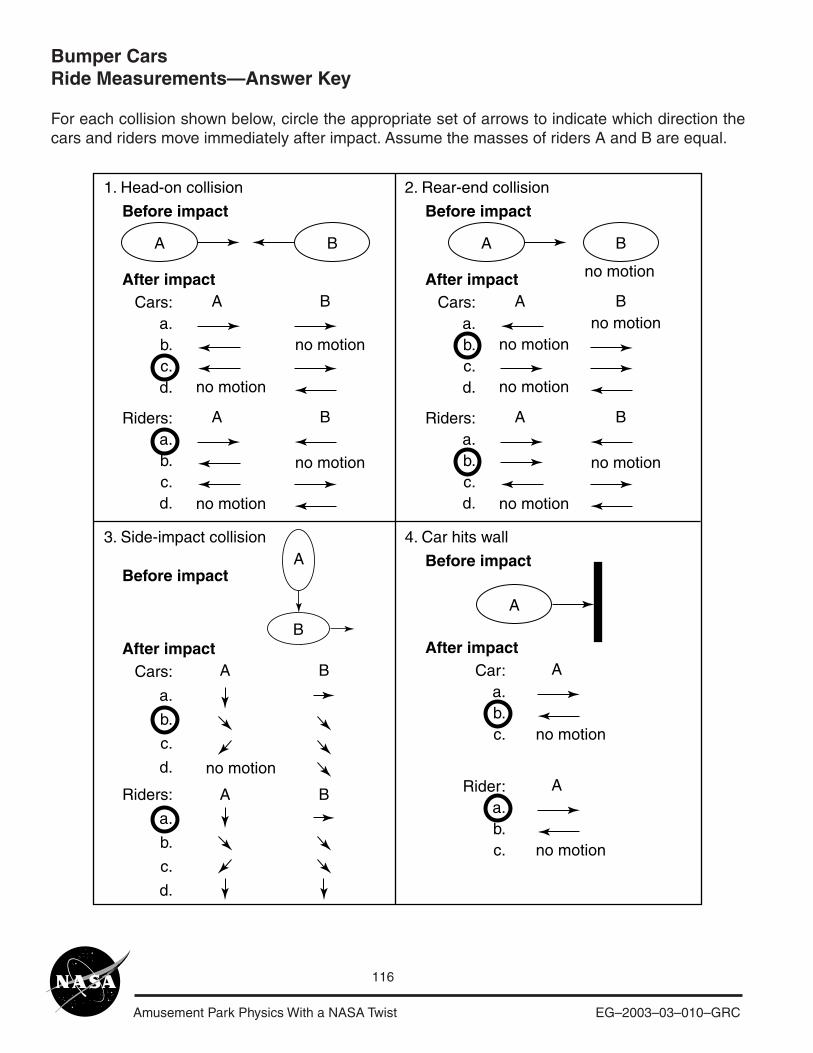
Amusement Park Physics With a NASA Twist EG–2003–03–010–GRC
116
Bumper CarsRide Measurements—Answer Key
For each collision shown below, circle the appropriate set of arrows to indicate which direction thecars and riders move immediately after impact. Assume the masses of riders A and B are equal.
A B
A B
1. Head-on collision 2. Rear-end collision
3. Side-impact collision 4. Car hits wall
Before impact
After impactCars:
a.b.c.d.
A BRiders:a.b.c.d.
no motion
no motion
no motion
no motion
A B
A B
Before impact
After impactCars:
a.b.c.d.
A BRiders:a.b.c.d.
no motion
no motion
no motion
no motion
no motion
no motion
A B
A
B
Before impact
After impactCars:
a.
b.
c.
d.
A BRiders:
a.
b.
c.
d.
no motion
A
A
Before impact
After impactCar:
a.b.c.
ARider:a.b.c. no motion
no motion
Amusement Park Physics With a NASA Twist EG–2003–03–010–GRC
117
Bumper CarsRide Measurements—Answer Key
Answer the following questions in complete sentences.
1.
2.
3.
During collision 2, is kinetic energy (KE) conserved?Explain why or why not.
In collision 3, KE is not conserved. If the total energy ofthe system is conserved, where did the KE go?
During collision 4, is KE conserved? Explain why or why not.
Although both cars end up in motion, some KE is lost. The totalenergy of the system, however, is constant, as some of the KE orenergy of motion, is changed to heat and sound. Also, the two carslock up and combine to be a unit. This unit has a large mass, thusthey end up going slower.
loss of energy due to heat and sound formed by the collision, thespeed and thus the KE of car A was transferred to car B.
Yes, KE is conserved. Except for the
There will be some loss due to heat and sound, but most of the KEis conserved as the car rebounds from the wall. The harder thesurface of the wall, the more KE is conserved.
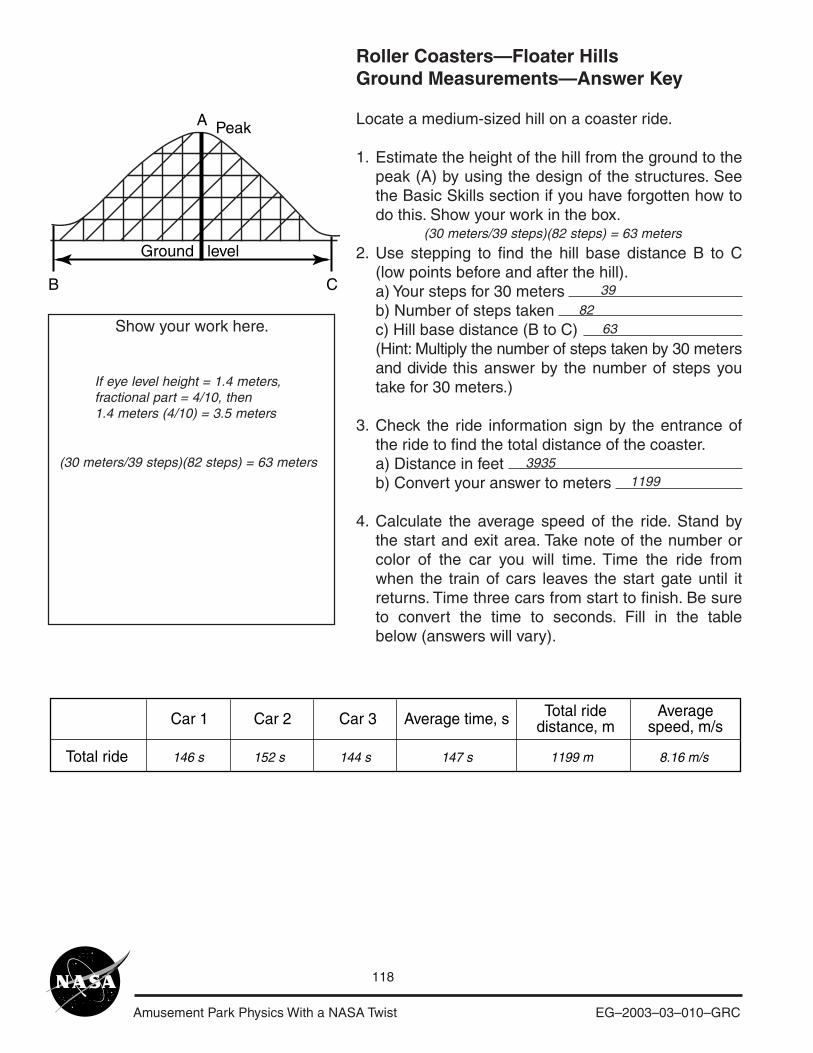
Amusement Park Physics With a NASA Twist EG–2003–03–010–GRC
118
Roller Coasters—Floater HillsGround Measurements—Answer Key
Locate a medium-sized hill on a coaster ride.
1.
2.
3.
4.
Estimate the height of the hill from the ground to thepeak (A) by using the design of the structures. Seethe Basic Skills section if you have forgotten how todo this. Show your work in the box.
Use stepping to find the hill base distance B to C(low points before and after the hill).a) Your steps for 30 metersb) Number of steps takenc) Hill base distance (B to C)(Hint: Multiply the number of steps taken by 30 metersand divide this answer by the number of steps youtake for 30 meters.)
Check the ride information sign by the entrance ofthe ride to find the total distance of the coaster.a) Distance in feetb) Convert your answer to meters
Calculate the average speed of the ride. Stand bythe start and exit area. Take note of the number orcolor of the car you will time. Time the ride fromwhen the train of cars leaves the start gate until itreturns. Time three cars from start to finish. Be sureto convert the time to seconds. Fill in the tablebelow (answers will vary).
A
B C
Peak
Ground level
Show your work here.
If eye level height = 1.4 meters,fractional part = 4/10, then1.4 meters (4/10) = 3.5 meters
(30 meters/39 steps)(82 steps) = 63 meters
(30 meters/39 steps)(82 steps) = 63 meters
39
8263
39351199
Car 1
Total ride 146 s 152 s 144 s 147 s 1199 m 8.16 m/s
Car 2 Car 3 Average time, s Total ridedistance, m
Averagespeed, m/s
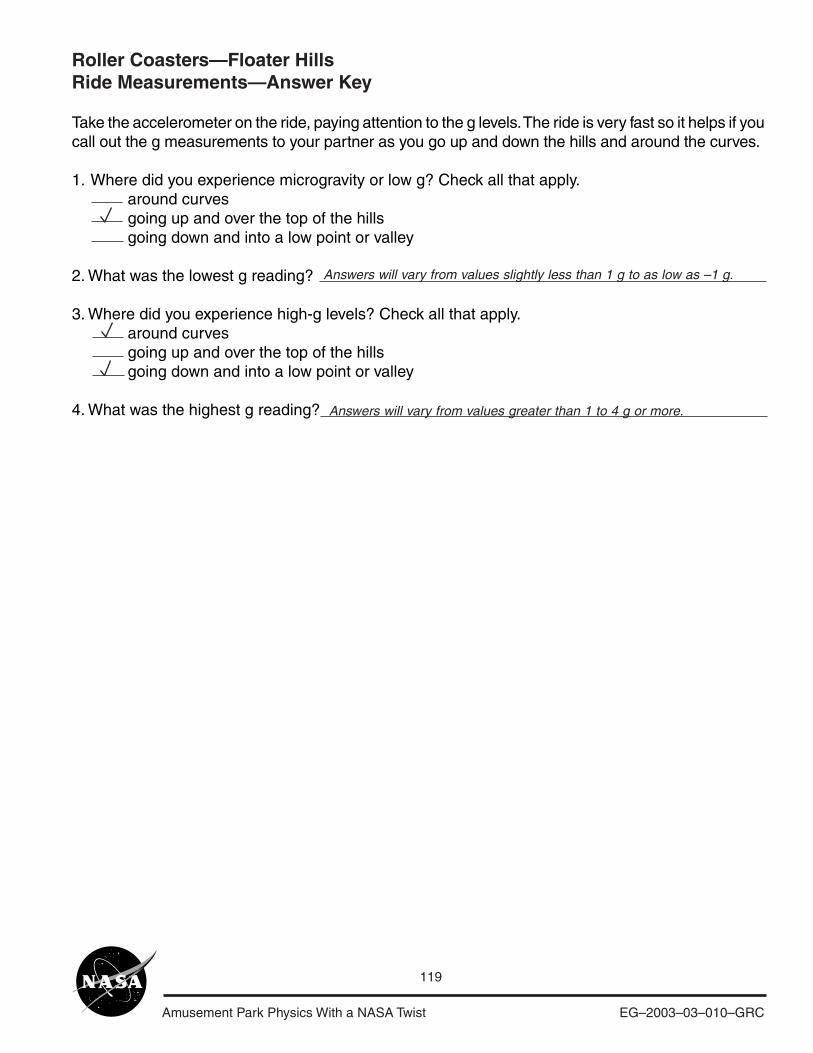
Amusement Park Physics With a NASA Twist EG–2003–03–010–GRC
119
Roller Coasters—Floater HillsRide Measurements—Answer Key
Take the accelerometer on the ride, paying attention to the g levels. The ride is very fast so it helps if youcall out the g measurements to your partner as you go up and down the hills and around the curves.
1. Where did you experience microgravity or low g? Check all that apply.around curvesgoing up and over the top of the hillsgoing down and into a low point or valley
2. What was the lowest g reading?
3. Where did you experience high-g levels? Check all that apply.around curvesgoing up and over the top of the hillsgoing down and into a low point or valley
4. What was the highest g reading? Answers will vary from values greater than 1 to 4 g or more.
Answers will vary from values slightly less than 1 g to as low as –1 g.
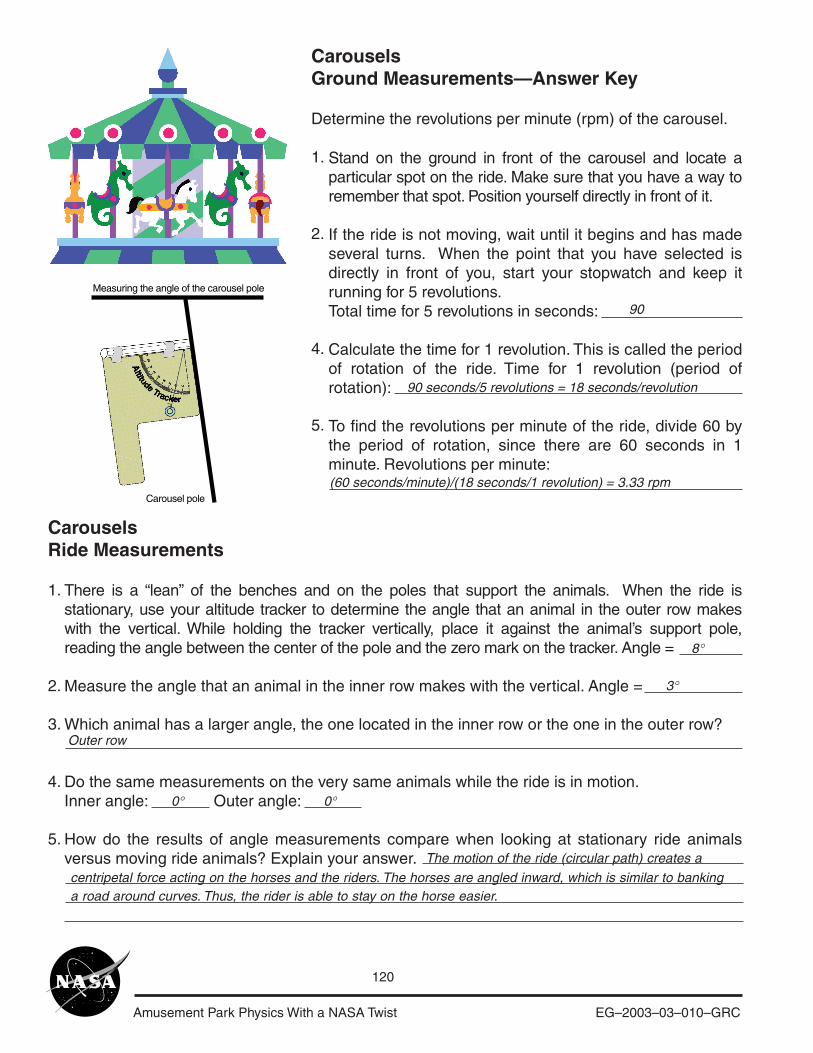
Amusement Park Physics With a NASA Twist EG–2003–03–010–GRC
120
Measuring the angle of the carousel pole
Carousel pole
CarouselsGround Measurements—Answer Key
Determine the revolutions per minute (rpm) of the carousel.
1.
2.
4.
5.
Stand on the ground in front of the carousel and locate aparticular spot on the ride. Make sure that you have a way toremember that spot. Position yourself directly in front of it.
If the ride is not moving, wait until it begins and has madeseveral turns. When the point that you have selected isdirectly in front of you, start your stopwatch and keep itrunning for 5 revolutions.Total time for 5 revolutions in seconds:
Calculate the time for 1 revolution. This is called the periodof rotation of the ride. Time for 1 revolution (period ofrotation):
To find the revolutions per minute of the ride, divide 60 bythe period of rotation, since there are 60 seconds in 1minute. Revolutions per minute:
CarouselsRide Measurements
1.
2.
3.
4.
5.
There is a “lean” of the benches and on the poles that support the animals. When the ride isstationary, use your altitude tracker to determine the angle that an animal in the outer row makeswith the vertical. While holding the tracker vertically, place it against the animal’s support pole,reading the angle between the center of the pole and the zero mark on the tracker. Angle =
Measure the angle that an animal in the inner row makes with the vertical. Angle =
Which animal has a larger angle, the one located in the inner row or the one in the outer row?
Do the same measurements on the very same animals while the ride is in motion.Inner angle: Outer angle:
How do the results of angle measurements compare when looking at stationary ride animalsversus moving ride animals? Explain your answer.
90
90 seconds/5 revolutions = 18 seconds/revolution
(60 seconds/minute)/(18 seconds/1 revolution) = 3.33 rpm
8°
3°
Outer row
0° 0°
centripetal force acting on the horses and the riders. The horses are angled inward, which is similar to bankinga road around curves. Thus, the rider is able to stay on the horse easier.
The motion of the ride (circular path) creates a
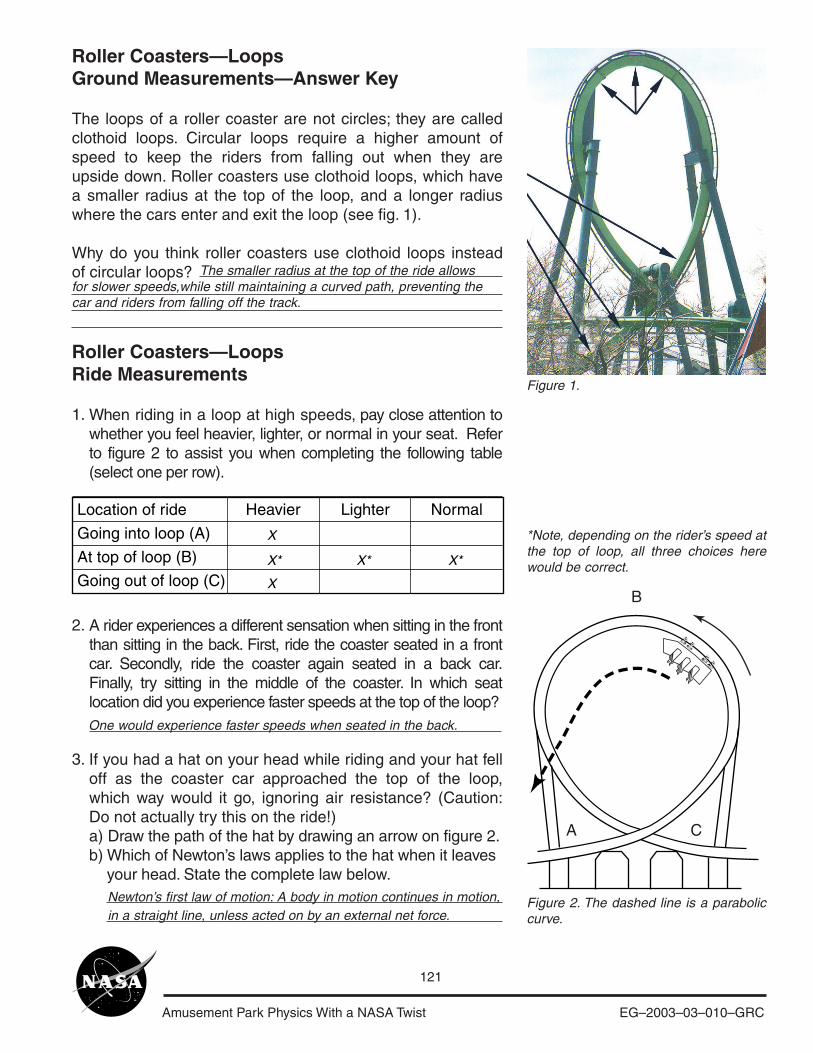
Amusement Park Physics With a NASA Twist EG–2003–03–010–GRC
121
Roller Coasters—LoopsGround Measurements—Answer Key
The loops of a roller coaster are not circles; they are calledclothoid loops. Circular loops require a higher amount ofspeed to keep the riders from falling out when they areupside down. Roller coasters use clothoid loops, which havea smaller radius at the top of the loop, and a longer radiuswhere the cars enter and exit the loop (see fig. 1).
Why do you think roller coasters use clothoid loops insteadof circular loops?
Figure 1.
Roller Coasters—LoopsRide Measurements
1.
2.
3.
Figure 2. The dashed line is a paraboliccurve.
When riding in a loop at high speeds, pay close attention towhether you feel heavier, lighter, or normal in your seat. Referto figure 2 to assist you when completing the following table(select one per row).
A rider experiences a different sensation when sitting in the frontthan sitting in the back. First, ride the coaster seated in a frontcar. Secondly, ride the coaster again seated in a back car.Finally, try sitting in the middle of the coaster. In which seatlocation did you experience faster speeds at the top of the loop?
If you had a hat on your head while riding and your hat felloff as the coaster car approached the top of the loop,which way would it go, ignoring air resistance? (Caution:Do not actually try this on the ride!)a) Draw the path of the hat by drawing an arrow on figure 2.b) Which of Newton’s laws applies to the hat when it leaves your head. State the complete law below.
for slower speeds,while still maintaining a curved path, preventing thecar and riders from falling off the track.
The smaller radius at the top of the ride allows
Location of ride Heavier Lighter Normal
Going into loop (A)
At top of loop (B)
Going out of loop (C)
X
X* X* X*
X
A
B
C
One would experience faster speeds when seated in the back.
Newton’s first law of motion: A body in motion continues in motion,in a straight line, unless acted on by an external net force.
*Note, depending on the rider’s speed atthe top of loop, all three choices herewould be correct.
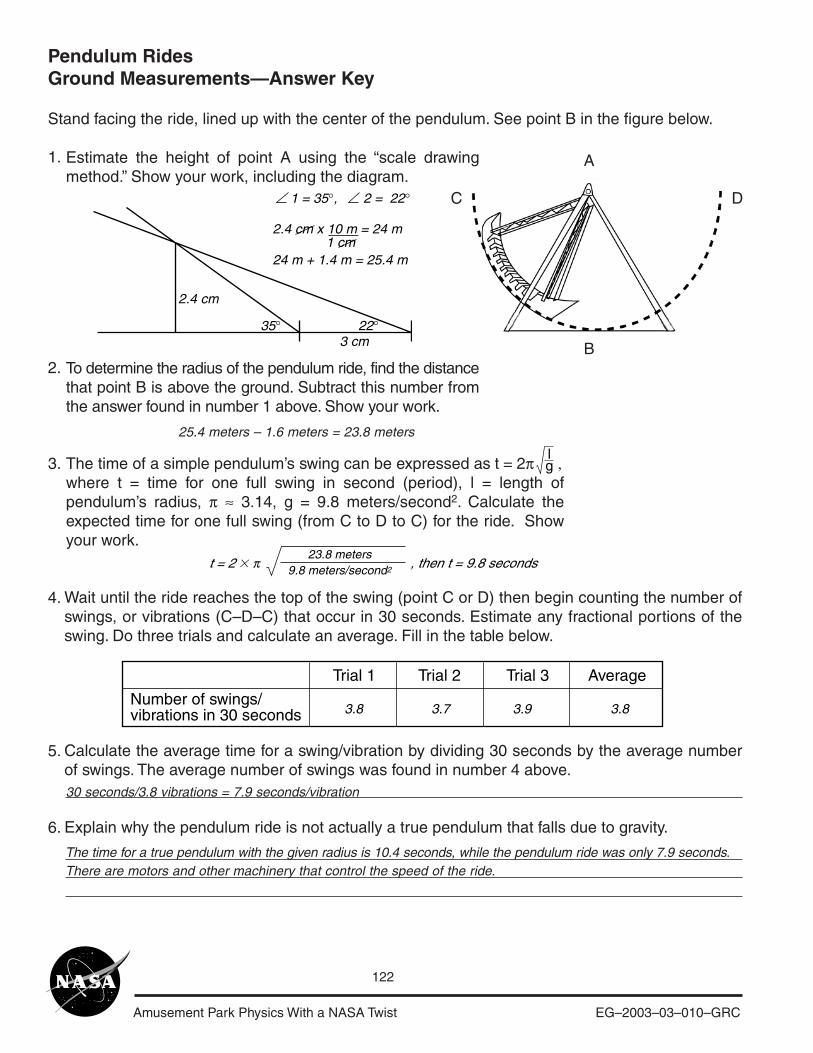
Amusement Park Physics With a NASA Twist EG–2003–03–010–GRC
122
Pendulum RidesGround Measurements—Answer Key
Stand facing the ride, lined up with the center of the pendulum. See point B in the figure below.
1.
2.
3.
4.
5.
6.
Wait until the ride reaches the top of the swing (point C or D) then begin counting the number ofswings, or vibrations (C–D–C) that occur in 30 seconds. Estimate any fractional portions of theswing. Do three trials and calculate an average. Fill in the table below.
Calculate the average time for a swing/vibration by dividing 30 seconds by the average numberof swings. The average number of swings was found in number 4 above.
Explain why the pendulum ride is not actually a true pendulum that falls due to gravity.
A
B
C D
Estimate the height of point A using the “scale drawingmethod.” Show your work, including the diagram.
To determine the radius of the pendulum ride, find the distancethat point B is above the ground. Subtract this number fromthe answer found in number 1 above. Show your work.
The time of a simple pendulum’s swing can be expressed as t = 2π ,where t = time for one full swing in second (period), l = length ofpendulum’s radius, π ≈ 3.14, g = 9.8 meters/second2. Calculate theexpected time for one full swing (from C to D to C) for the ride. Showyour work.
2.4 cm
3 cm35° 22°
1 = 35°, 2 = 22°
2.4 cm x 10 m = 24 m
24 m + 1.4 m = 25.4 m1 cm
25.4 meters – 1.6 meters = 23.8 meters
lg
Trial 1
Number of swings/vibrations in 30 seconds
Trial 2 Trial 3 Average
3.8 3.7 3.9 3.8
30 seconds/3.8 vibrations = 7.9 seconds/vibration
The time for a true pendulum with the given radius is 10.4 seconds, while the pendulum ride was only 7.9 seconds.There are motors and other machinery that control the speed of the ride.
23.8 meters9.8 meters/second2
t = 2 � π , then t = 9.8 seconds
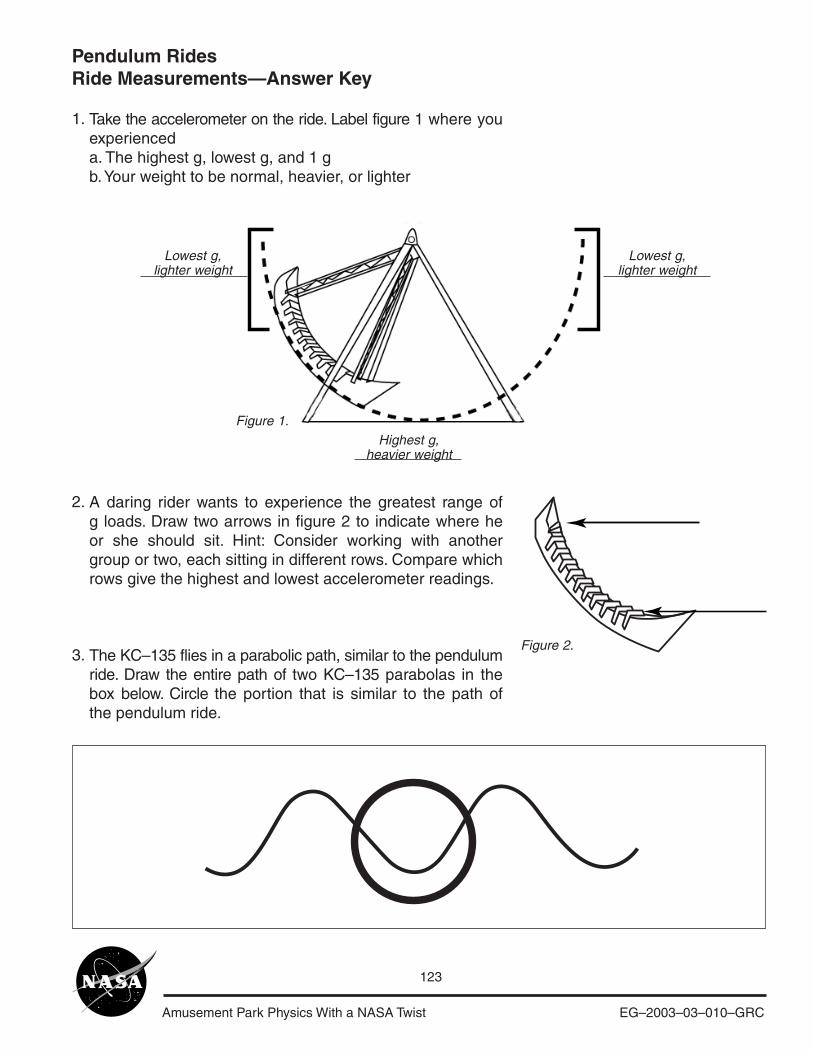
Amusement Park Physics With a NASA Twist EG–2003–03–010–GRC
123
Pendulum RidesRide Measurements—Answer Key
1.
2.
3.
Take the accelerometer on the ride. Label figure 1 where youexperienceda. The highest g, lowest g, and 1 gb. Your weight to be normal, heavier, or lighter
A daring rider wants to experience the greatest range ofg loads. Draw two arrows in figure 2 to indicate where heor she should sit. Hint: Consider working with anothergroup or two, each sitting in different rows. Compare whichrows give the highest and lowest accelerometer readings.
The KC–135 flies in a parabolic path, similar to the pendulumride. Draw the entire path of two KC–135 parabolas in thebox below. Circle the portion that is similar to the path ofthe pendulum ride.
Figure 1.
Figure 2.
Lowest g,lighter weight
Highest g,heavier weight
Lowest g,lighter weight

Amusement Park Physics With a NASA Twist EG–2003–03–010–GRC
124

Amusement Park Physics With a NASA Twist EG–2003–03–010–GRC
125
Tests

Amusement Park Physics With a NASA Twist EG–2003–03–010–GRC
126
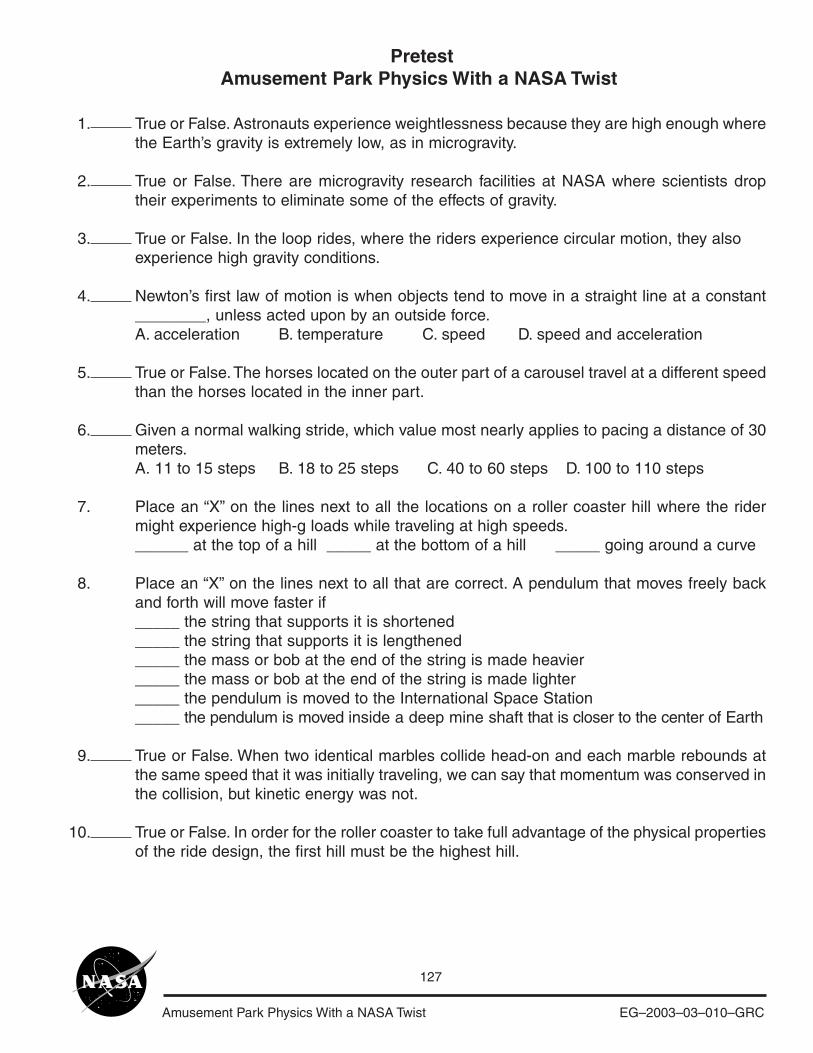
Amusement Park Physics With a NASA Twist EG–2003–03–010–GRC
127
PretestAmusement Park Physics With a NASA Twist
True or False. Astronauts experience weightlessness because they are high enough wherethe Earth’s gravity is extremely low, as in microgravity.
True or False. There are microgravity research facilities at NASA where scientists droptheir experiments to eliminate some of the effects of gravity.
True or False. In the loop rides, where the riders experience circular motion, they alsoexperience high gravity conditions.
Newton’s first law of motion is when objects tend to move in a straight line at a constant________, unless acted upon by an outside force.A. acceleration B. temperature C. speed D. speed and acceleration
True or False. The horses located on the outer part of a carousel travel at a different speedthan the horses located in the inner part.
Given a normal walking stride, which value most nearly applies to pacing a distance of 30meters.A. 11 to 15 steps B. 18 to 25 steps C. 40 to 60 steps D. 100 to 110 steps
Place an “X” on the lines next to all the locations on a roller coaster hill where the ridermight experience high-g loads while traveling at high speeds.______ at the top of a hill _____ at the bottom of a hill _____ going around a curve
Place an “X” on the lines next to all that are correct. A pendulum that moves freely backand forth will move faster if_____ the string that supports it is shortened_____ the string that supports it is lengthened_____ the mass or bob at the end of the string is made heavier_____ the mass or bob at the end of the string is made lighter_____ the pendulum is moved to the International Space Station_____ the pendulum is moved inside a deep mine shaft that is closer to the center of Earth
True or False. When two identical marbles collide head-on and each marble rebounds atthe same speed that it was initially traveling, we can say that momentum was conserved inthe collision, but kinetic energy was not.
True or False. In order for the roller coaster to take full advantage of the physical propertiesof the ride design, the first hill must be the highest hill.
1.
2.
3.
4.
5.
6.
7.
8.
9.
10.
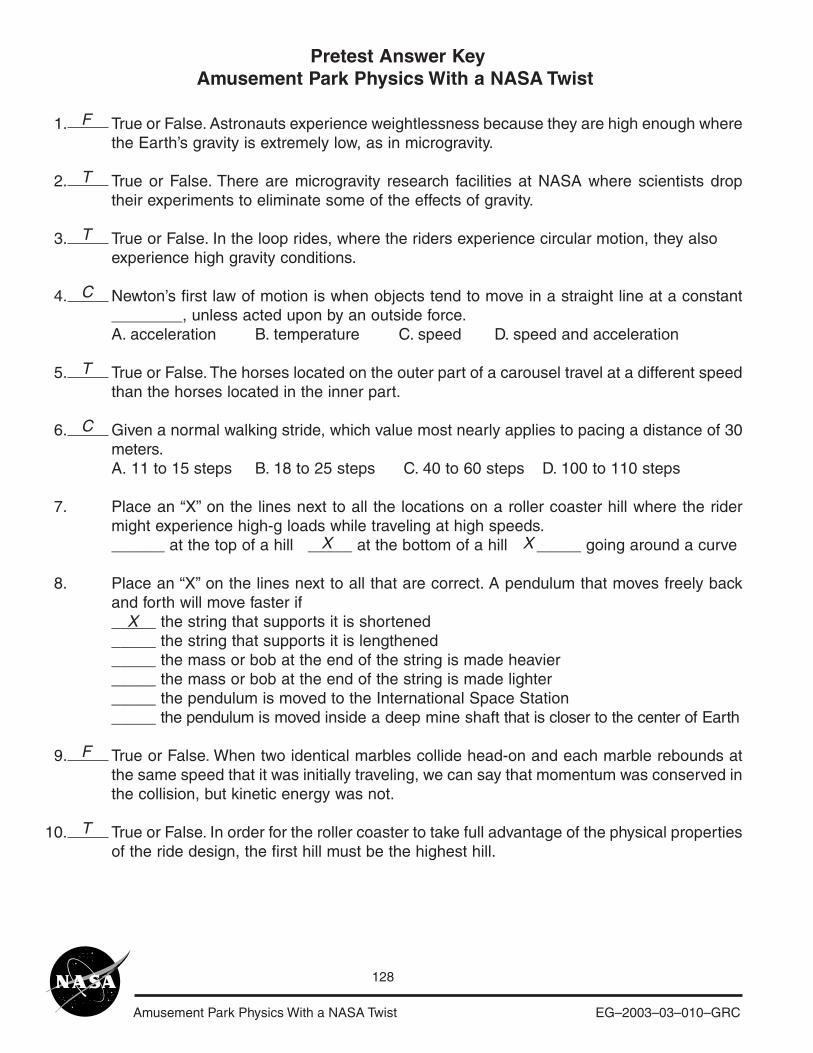
Amusement Park Physics With a NASA Twist EG–2003–03–010–GRC
128
Pretest Answer KeyAmusement Park Physics With a NASA Twist
True or False. Astronauts experience weightlessness because they are high enough wherethe Earth’s gravity is extremely low, as in microgravity.
True or False. There are microgravity research facilities at NASA where scientists droptheir experiments to eliminate some of the effects of gravity.
True or False. In the loop rides, where the riders experience circular motion, they alsoexperience high gravity conditions.
Newton’s first law of motion is when objects tend to move in a straight line at a constant________, unless acted upon by an outside force.A. acceleration B. temperature C. speed D. speed and acceleration
True or False. The horses located on the outer part of a carousel travel at a different speedthan the horses located in the inner part.
Given a normal walking stride, which value most nearly applies to pacing a distance of 30meters.A. 11 to 15 steps B. 18 to 25 steps C. 40 to 60 steps D. 100 to 110 steps
Place an “X” on the lines next to all the locations on a roller coaster hill where the ridermight experience high-g loads while traveling at high speeds.______ at the top of a hill _____ at the bottom of a hill _____ going around a curve
Place an “X” on the lines next to all that are correct. A pendulum that moves freely backand forth will move faster if_____ the string that supports it is shortened_____ the string that supports it is lengthened_____ the mass or bob at the end of the string is made heavier_____ the mass or bob at the end of the string is made lighter_____ the pendulum is moved to the International Space Station_____ the pendulum is moved inside a deep mine shaft that is closer to the center of Earth
True or False. When two identical marbles collide head-on and each marble rebounds atthe same speed that it was initially traveling, we can say that momentum was conserved inthe collision, but kinetic energy was not.
True or False. In order for the roller coaster to take full advantage of the physical propertiesof the ride design, the first hill must be the highest hill.
1.
2.
3.
4.
5.
6.
7.
8.
9.
10.
F
T
T
C
T
C
F
T
X X
X
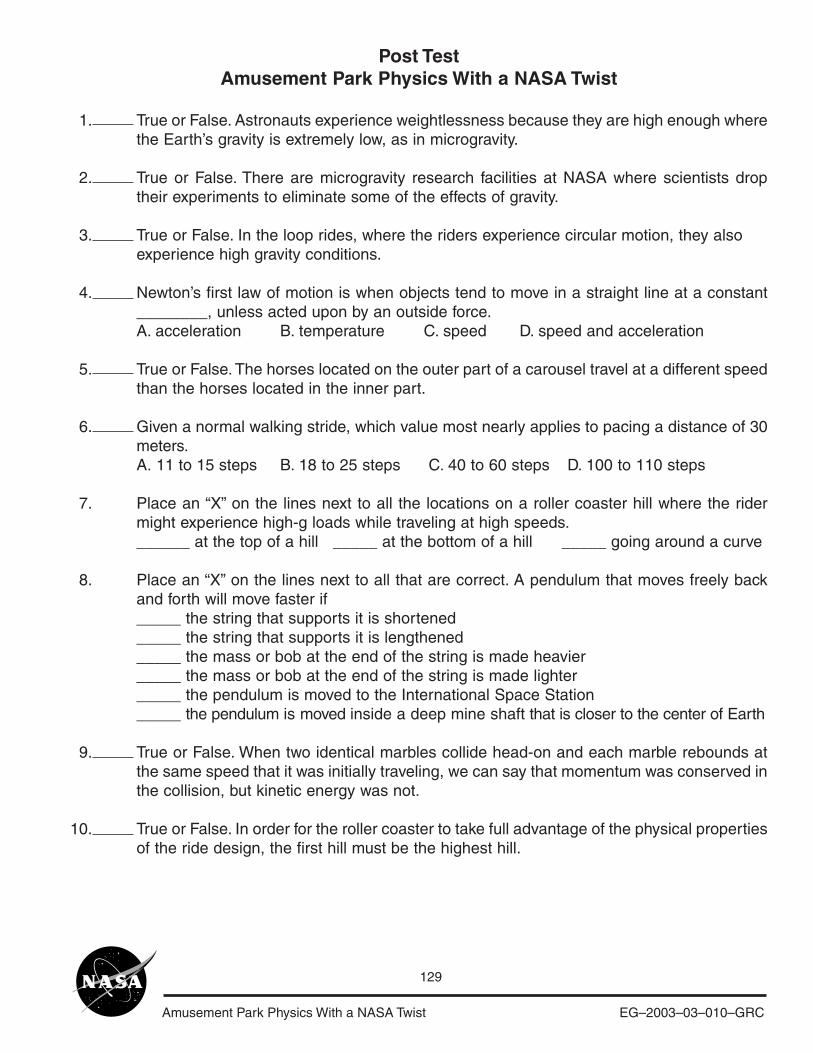
Amusement Park Physics With a NASA Twist EG–2003–03–010–GRC
129
Post TestAmusement Park Physics With a NASA Twist
True or False. Astronauts experience weightlessness because they are high enough wherethe Earth’s gravity is extremely low, as in microgravity.
True or False. There are microgravity research facilities at NASA where scientists droptheir experiments to eliminate some of the effects of gravity.
True or False. In the loop rides, where the riders experience circular motion, they alsoexperience high gravity conditions.
Newton’s first law of motion is when objects tend to move in a straight line at a constant________, unless acted upon by an outside force.A. acceleration B. temperature C. speed D. speed and acceleration
True or False. The horses located on the outer part of a carousel travel at a different speedthan the horses located in the inner part.
Given a normal walking stride, which value most nearly applies to pacing a distance of 30meters.A. 11 to 15 steps B. 18 to 25 steps C. 40 to 60 steps D. 100 to 110 steps
Place an “X” on the lines next to all the locations on a roller coaster hill where the ridermight experience high-g loads while traveling at high speeds.______ at the top of a hill _____ at the bottom of a hill _____ going around a curve
Place an “X” on the lines next to all that are correct. A pendulum that moves freely backand forth will move faster if_____ the string that supports it is shortened_____ the string that supports it is lengthened_____ the mass or bob at the end of the string is made heavier_____ the mass or bob at the end of the string is made lighter_____ the pendulum is moved to the International Space Station_____ the pendulum is moved inside a deep mine shaft that is closer to the center of Earth
True or False. When two identical marbles collide head-on and each marble rebounds atthe same speed that it was initially traveling, we can say that momentum was conserved inthe collision, but kinetic energy was not.
True or False. In order for the roller coaster to take full advantage of the physical propertiesof the ride design, the first hill must be the highest hill.
1.
2.
3.
4.
5.
6.
7.
8.
9.
10.
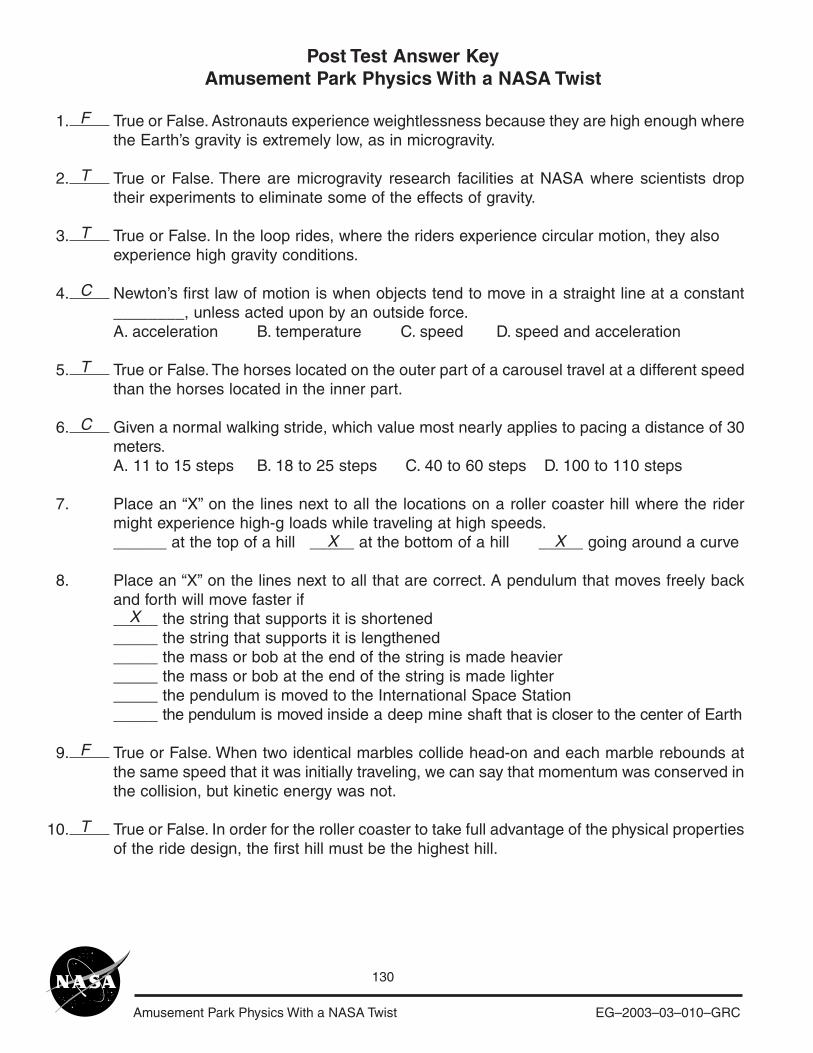
Amusement Park Physics With a NASA Twist EG–2003–03–010–GRC
130
Post Test Answer KeyAmusement Park Physics With a NASA Twist
F
T
T
C
T
C
F
T
X X
X
True or False. Astronauts experience weightlessness because they are high enough wherethe Earth’s gravity is extremely low, as in microgravity.
True or False. There are microgravity research facilities at NASA where scientists droptheir experiments to eliminate some of the effects of gravity.
True or False. In the loop rides, where the riders experience circular motion, they alsoexperience high gravity conditions.
Newton’s first law of motion is when objects tend to move in a straight line at a constant________, unless acted upon by an outside force.A. acceleration B. temperature C. speed D. speed and acceleration
True or False. The horses located on the outer part of a carousel travel at a different speedthan the horses located in the inner part.
Given a normal walking stride, which value most nearly applies to pacing a distance of 30meters.A. 11 to 15 steps B. 18 to 25 steps C. 40 to 60 steps D. 100 to 110 steps
Place an “X” on the lines next to all the locations on a roller coaster hill where the ridermight experience high-g loads while traveling at high speeds.______ at the top of a hill _____ at the bottom of a hill _____ going around a curve
Place an “X” on the lines next to all that are correct. A pendulum that moves freely backand forth will move faster if_____ the string that supports it is shortened_____ the string that supports it is lengthened_____ the mass or bob at the end of the string is made heavier_____ the mass or bob at the end of the string is made lighter_____ the pendulum is moved to the International Space Station_____ the pendulum is moved inside a deep mine shaft that is closer to the center of Earth
True or False. When two identical marbles collide head-on and each marble rebounds atthe same speed that it was initially traveling, we can say that momentum was conserved inthe collision, but kinetic energy was not.
True or False. In order for the roller coaster to take full advantage of the physical propertiesof the ride design, the first hill must be the highest hill.
1.
2.
3.
4.
5.
6.
7.
8.
9.
10.

Amusement Park Physics With a NASA Twist EG–2003–03–010–GRC
131
Forms and Extras

Amusement Park Physics With a NASA Twist EG–2003–03–010–GRC
132
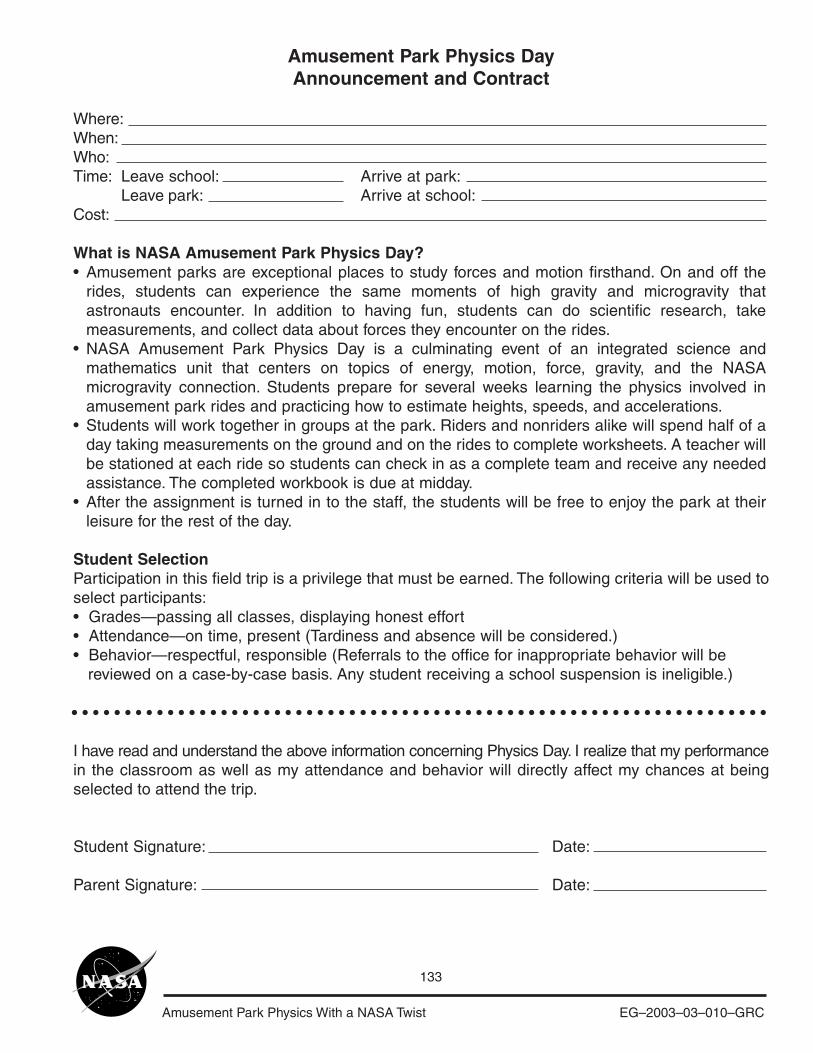
Amusement Park Physics With a NASA Twist EG–2003–03–010–GRC
133
Amusement Park Physics DayAnnouncement and Contract
Where:When:Who:Time: Leave school: Arrive at park:
Leave park: Arrive at school:Cost:
What is NASA Amusement Park Physics Day?•
•
•
•
Student SelectionParticipation in this field trip is a privilege that must be earned. The following criteria will be used toselect participants:• Grades—passing all classes, displaying honest effort• Attendance—on time, present (Tardiness and absence will be considered.)• Behavior—respectful, responsible (Referrals to the office for inappropriate behavior will be reviewed on a case-by-case basis. Any student receiving a school suspension is ineligible.)
I have read and understand the above information concerning Physics Day. I realize that my performancein the classroom as well as my attendance and behavior will directly affect my chances at beingselected to attend the trip.
Student Signature: Date:
Parent Signature: Date:
Amusement parks are exceptional places to study forces and motion firsthand. On and off therides, students can experience the same moments of high gravity and microgravity thatastronauts encounter. In addition to having fun, students can do scientific research, takemeasurements, and collect data about forces they encounter on the rides.NASA Amusement Park Physics Day is a culminating event of an integrated science andmathematics unit that centers on topics of energy, motion, force, gravity, and the NASAmicrogravity connection. Students prepare for several weeks learning the physics involved inamusement park rides and practicing how to estimate heights, speeds, and accelerations.Students will work together in groups at the park. Riders and nonriders alike will spend half of aday taking measurements on the ground and on the rides to complete worksheets. A teacher willbe stationed at each ride so students can check in as a complete team and receive any neededassistance. The completed workbook is due at midday.After the assignment is turned in to the staff, the students will be free to enjoy the park at theirleisure for the rest of the day.
○ ○ ○ ○ ○ ○ ○ ○ ○ ○ ○ ○ ○ ○ ○ ○ ○ ○ ○ ○ ○ ○ ○ ○ ○ ○ ○ ○ ○ ○ ○ ○ ○ ○ ○ ○ ○ ○ ○ ○ ○ ○ ○ ○ ○ ○ ○ ○ ○ ○ ○ ○ ○ ○ ○ ○ ○ ○ ○ ○ ○ ○ ○ ○ ○ ○
Amusement Park Physics With a NASA Twist EG–2003–03–010–GRC
134
Amusement Park Physics DayAnnouncement and Contract
PermissionTo be completed by parent or guardian:
I hereby give my permission for my son/daughter, ________________________________, to go to
_____________________________________________ on _____________________________.
Transportation ________________________________ Cost _____________________________
Parent/Guardian Signature ________________________________________ Date ___________
Emergency InformationIn the event that reasonable attempts to contact me at _____–______–_______ (day phone) or
_____–______–_______ (emergency number) have been unsuccessful, I hereby give my consent for
1. The administration of any treatment deemed necessary by Dr. ______________________ (preferred physician) at _____–______–_______ (phone number of doctor), or in the event
that a designated preferred practitioner is not available, treatment may be administered by another licensed physician or dentist.
2. The transfer of the child to ____________________________ (preferred hospital) or anyhospital reasonably accessible.
Allergies
Other health-related issues
Refusal of ConsentI do not give my consent for emergency medical treatment of my child. In the event of illness orinjury requiring emergency treatment, I wish the school authorities to contact
Name:___________________________________________Phone: _______________________
Address: ______________________________________________________________________
Signature: ______________________________________________ Date: __________________
○ ○ ○ ○ ○ ○ ○ ○ ○ ○ ○ ○ ○ ○ ○ ○ ○ ○ ○ ○ ○ ○ ○ ○ ○ ○ ○ ○ ○ ○ ○ ○ ○ ○ ○ ○ ○ ○ ○ ○ ○ ○ ○ ○ ○ ○ ○ ○ ○ ○ ○ ○ ○ ○ ○ ○ ○ ○ ○ ○ ○ ○ ○ ○ ○ ○
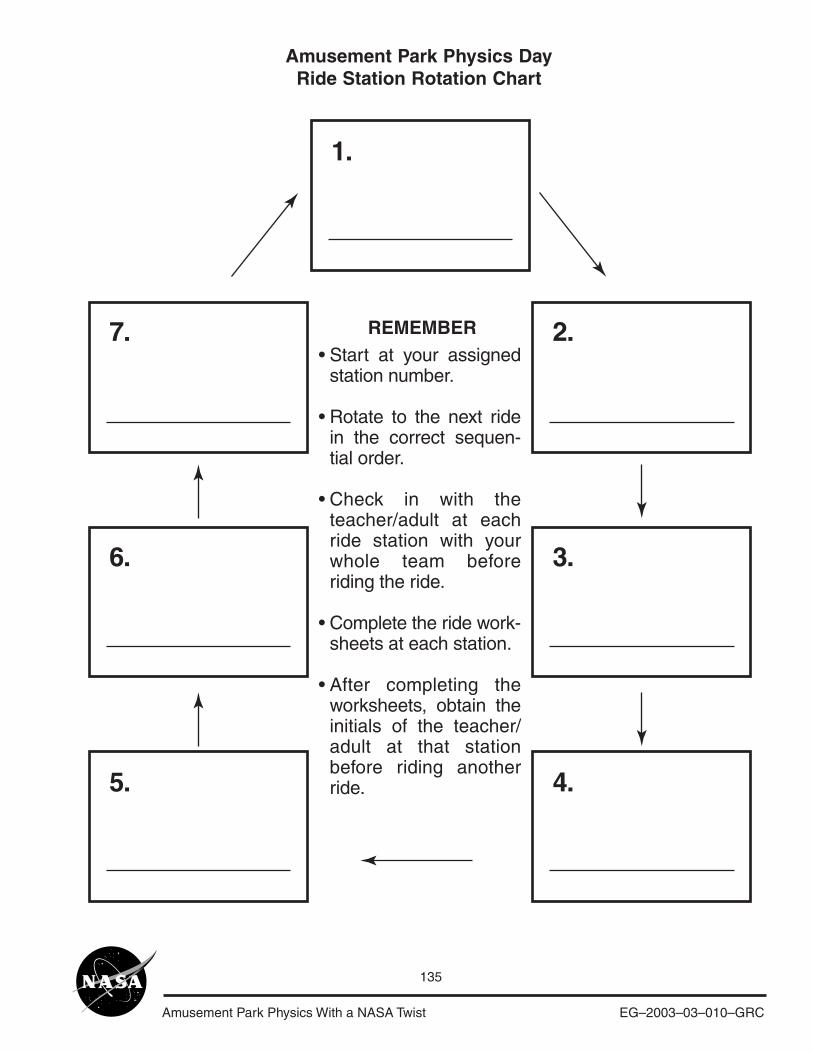
Amusement Park Physics With a NASA Twist EG–2003–03–010–GRC
135
Amusement Park Physics DayRide Station Rotation Chart
1.
2.
3.
4.
7.
6.
5.
REMEMBERStart at your assigned station number.
Rotate to the next ride in the correct sequen-tial order.
Check in with the teacher/adult at each ride station with your whole team before riding the ride.
Complete the ride work-sheets at each station.
After completing the worksheets, obtain the initials of the teacher/ adult at that station before riding another ride.
•
•
•
•
•
Amusement Park Physics With a NASA Twist EG–2003–03–010–GRC
136
Name Eye level height 10 meters = ____ steps 30 meters = ____ steps
1.
2.
3.
4.
5.
6.
7.
8.
9.
10.
11.
12.
13.
14.
15.
16.
17.
18.
19.
20.
21.
22.
23.
24.
25.
26.
27.
28.
29.
30.
Amusement Park Physics DayEye Level Height and Stepping Estimation Record
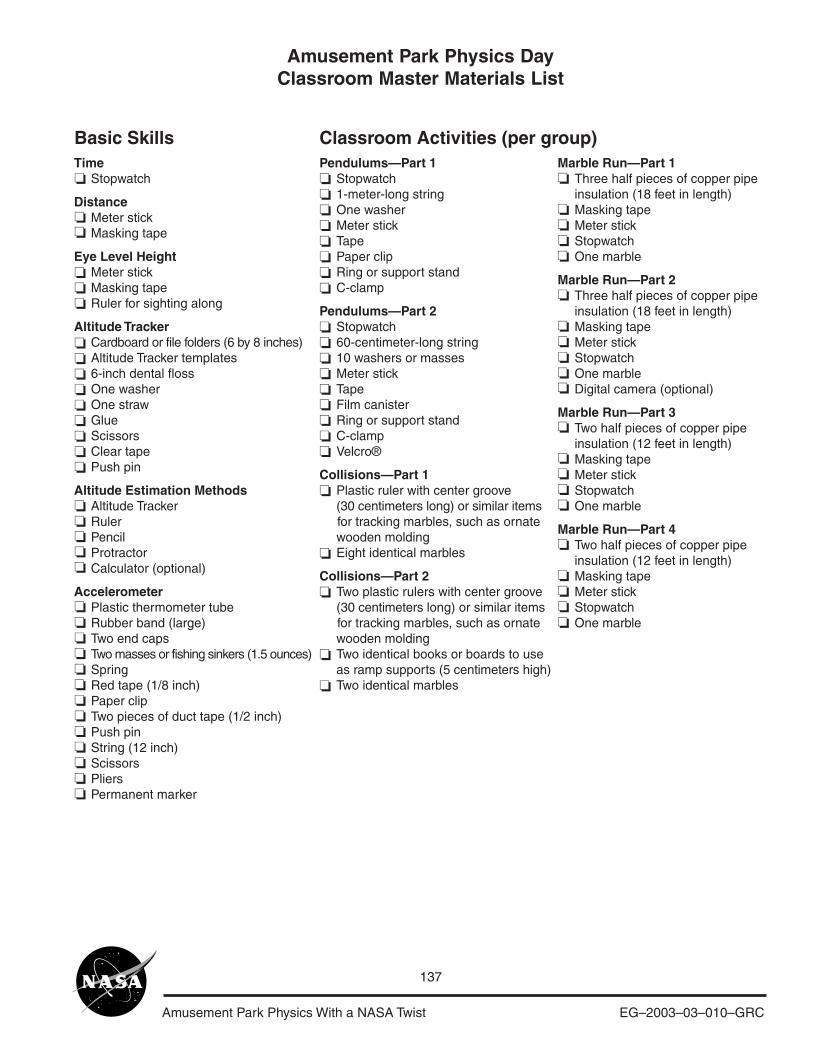
Amusement Park Physics With a NASA Twist EG–2003–03–010–GRC
137
Amusement Park Physics DayClassroom Master Materials List
Basic Skills Classroom Activities (per group)Time
Stopwatch
DistanceMeter stickMasking tape
Eye Level HeightMeter stickMasking tapeRuler for sighting along
Altitude TrackerCardboard or file folders (6 by 8 inches)Altitude Tracker templates6-inch dental flossOne washerOne strawGlueScissorsClear tapePush pin
Altitude Estimation MethodsAltitude TrackerRulerPencilProtractorCalculator (optional)
AccelerometerPlastic thermometer tubeRubber band (large)Two end capsTwo masses or fishing sinkers (1.5 ounces)SpringRed tape (1/8 inch)Paper clipTwo pieces of duct tape (1/2 inch)Push pinString (12 inch)ScissorsPliersPermanent marker
Pendulums—Part 1Stopwatch1-meter-long stringOne washerMeter stickTapePaper clipRing or support standC-clamp
Pendulums—Part 2Stopwatch 60-centimeter-long string10 washers or massesMeter stickTape Film canisterRing or support standC-clampVelcro®
Collisions—Part 1Plastic ruler with center groove (30 centimeters long) or similar items
for tracking marbles, such as ornate wooden moldingEight identical marbles
Collisions—Part 2Two plastic rulers with center groove
(30 centimeters long) or similar items for tracking marbles, such as ornate
wooden moldingTwo identical books or boards to use
as ramp supports (5 centimeters high) Two identical marbles
Marble Run—Part 1Three half pieces of copper pipe insulation (18 feet in length)Masking tapeMeter stickStopwatchOne marble
Marble Run—Part 2Three half pieces of copper pipe insulation (18 feet in length)Masking tapeMeter stickStopwatchOne marbleDigital camera (optional)
Marble Run—Part 3Two half pieces of copper pipe insulation (12 feet in length)Masking tapeMeter stickStopwatchOne marble
Marble Run—Part 4Two half pieces of copper pipe insulation (12 feet in length)Masking tapeMeter stickStopwatchOne marble
❏
❏❏
❏
❏❏❏
❏
❏❏❏❏❏❏❏❏❏
❏
❏
❏
❏
❏
❏
❏❏❏❏
❏
❏❏❏❏
❏
❏❏❏❏
❏
❏❏❏❏
❏
❏
❏❏
❏❏❏
❏❏❏❏❏❏❏❏❏
❏❏❏❏❏❏❏❏❏
❏❏❏❏❏
❏❏❏❏
Amusement Park Physics With a NASA Twist EG–2003–03–010–GRC
138
Amusement Park Physics DayAmusement Park Day Master Materials List
Ride WorksheetsTeacher Supplies (one per student group)
Plastic resealable-top bag (gallon size)Altitude TrackerAccelerometerProtractorRide worksheets and answer key
Student Supplies (at least one per group)Pencil Stopwatch or watch with a second handCalculatorMetric rulerClipboard (optional, but very helpful)Backpack (optional)
Other Materials to ConsiderExtra student ride packetsLunch money or a bagged lunchChange of clothesSunscreen/hat/sunglassesRaincoat/poncho/umbrella (inclement weather)Camera and filmComfortable walking shoes/socksLayered clothing (Students should be prepared for inclement weather.)Wristwatch (Students need to be aware of the time throughout the day.)
❏❏❏❏❏
❏❏❏❏❏❏❏❏❏
❏❏❏❏❏❏
Amusement Park Physics With a NASA Twist EG–2003–03–010–GRC
139
Amusement Park Physics DayBus List
Name Name
1.
2.
3.
4.
5.
6.
7.
8.
9.
10.
11.
12.
13.
14.
15.
16.
17.
18.
19.
20.
21.
22.
23.
24.
25.
26.
27.
28.
29.
30.
31.
32.
33.
34.
35.
36.
37.
38.
39.
40.
41.
42.
43.
44.
45.
46.
47.
48.
49.
50.
Bus number
Amusement Park Physics With a NASA Twist EG–2003–03–010–GRC
140
Team #
This ride worksheet is complete. (Initials)
Name Present atstation
Starting station #
1.
2.
3.
4.
Team #
This ride worksheet is complete. (Initials)
Name Present atstation
Starting station #
1.
2.
3.
4.
Team #
This ride worksheet is complete. (Initials)
Name Present atstation
Starting station #
1.
2.
3.
4.
Team #
This ride worksheet is complete. (Initials)
Name Present atstation
Starting station #
1.
2.
3.
4.
Team #
This ride worksheet is complete. (Initials)
Name Present atstation
Starting station #
1.
2.
3.
4.
Team #
This ride worksheet is complete. (Initials)
Name Present atstation
Starting station #
1.
2.
3.
4.
Team #
This ride worksheet is complete. (Initials)
Name Present atstation
Starting station #
1.
2.
3.
4.
Team #
This ride worksheet is complete. (Initials)
Name Present atstation
Starting station #
1.
2.
3.
4.
Amusement Park Physics DayRide Attendance Form

Amusement Park Physics With a NASA Twist EG–2003–03–010–GRC
141
Resources

Amusement Park Physics With a NASA Twist EG–2003–03–010–GRC
142
Amusement Park Physics With a NASA Twist EG–2003–03–010–GRC
143
acceleration—the rate of change of velocity
displacement—change in position of an object
force—a push or a pull exerted on some object
frame of reference—a coordinate system for specifying the precise location of objects in space
free fall—the state of moving and being acted upon only by the force of gravity
g—describes the level of gravity at sea level, for example, 1 g
gravity—the acceleration caused by the attractive force between two objects that is proportional to their masses;generally, it is taken to be the acceleration of an object to Earth
high g—conditions or environments that create the sensation of an increase of gravitational effects, greater than 1 g
kinetic energy—energy associated with an object in motion
law of universal gravitation—the force of gravitational pull between any two objects is directly related to theirmasses and inversely related to the square of their distance
low g—conditions or environments that create sensation of a reduction of gravitational effects, less than 1 g
mass—the measure of an object’s inertia
microgravity—an environment in which some of the effects of gravity are minimized
Newton’s first law of motion—an object continues in a state of rest or uniform motion unless an unbalanced forceacts on it
Newton’s second law of motion—the acceleration of an object is directly proportional to the force acting on theobject, is inversely proportional to the mass of the object, and is in the same direction as the force
Newton’s third law of motion—for every force or action, there is an equal and opposite force or reaction
period—the time in seconds for one complete vibration, cycle, or oscillation
potential energy—a stored form of energy associated with an object due to its position relative to Earth or someother gravitational source
speed—the rate of change of distance
structure estimation—use of the regularity of support structures to estimate the height of the entire structure
velocity—the rate of change of displacement
vibration—one complete cycle or complete path
Vocabulary
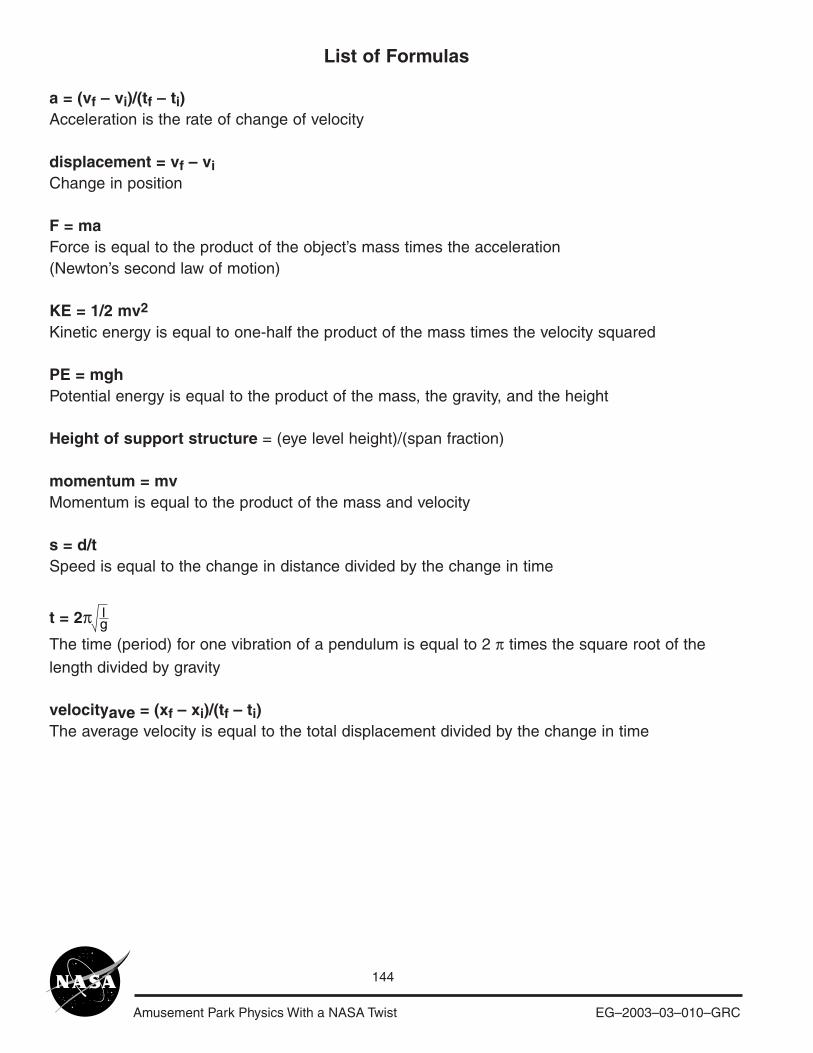
Amusement Park Physics With a NASA Twist EG–2003–03–010–GRC
144
a = (vf – vi)/(tf – ti)Acceleration is the rate of change of velocity
displacement = vf – viChange in position
F = maForce is equal to the product of the object’s mass times the acceleration(Newton’s second law of motion)
KE = 1/2 mv2
Kinetic energy is equal to one-half the product of the mass times the velocity squared
PE = mghPotential energy is equal to the product of the mass, the gravity, and the height
Height of support structure = (eye level height)/(span fraction)
momentum = mvMomentum is equal to the product of the mass and velocity
s = d/tSpeed is equal to the change in distance divided by the change in time
t = 2πThe time (period) for one vibration of a pendulum is equal to 2 π times the square root of the
length divided by gravity
velocityave = (xf – xi)/(tf – ti)The average velocity is equal to the total displacement divided by the change in time
List of Formulas
lg
Amusement Park Physics With a NASA Twist EG–2003–03–010–GRC
145
Amusement Park Physics and Related Web Sites
Amusement Park Physicshttp://curie.uncg.edu/~mturner/title.htmlThis site has several activities with questions that can be used while riding on several well-knownamusement park rides. The answers are given as well.
Amusement Park Physics: What are the forces behind the fun?http://www.learner.org/exhibits/parkphysics/This excellent Web site has lesson plans, creative demonstrations, roller coaster FAQs, information onNewton’s laws of motion, and concise explanations on aerodynamics.
Coaster Links: Build a Coasterhttp://dsc.discovery.com/convergence/coasters/interactive/interactive.htmlDesign a roller coaster and find out how it rates on the "fearometer."
Funderstanding: Roller Coastershttp://www.funderstanding.com/k12/coaster/Students design their own thrilling roller coaster rides while applying physics concepts.
Physics of Amusement Parkshttp://library.thinkquest.org/2745/data/openpark.htmStudents learn about potential and kinetic energy, centripetal force, and free fall. This site offers informationand statistics on major roller coasters. Directions are provided on how to build an accelerometer.
Roller Coaster Databasehttp://www.rcdb.com/This site provides the most complete and accurate statistics on more than 475 roller coasters foundthroughout the world.
Amusement Park Physics Linkshttp://homepage.mac.com/cbakken/pga/links.htmlThis site has links to other interesting sites, including one that simulates the forces in a Clothoid loop.
Avian Development Facilityhttp://spaceresearch.nasa.gov/research_projects/ros/adfop.htmlThis site describes flight hardware that studies the development of bird embryos in low gravity.
Drop Towershttp://microgravity.grc.nasa.gov/drop2/http://microgravity.grc.nasa.gov/FACILITY/ZERO.HTMThese Web sites describe two facilities and the scientific research done at NASA Glenn Research Centerwhere weightlessness is created using free fall.
Research Aircraft (KC–135)http://jsc-aircraft-ops.jsc.nasa.gov/kc135/index.htmlFind out about how NASA research aircraft create weightless conditions.
Sounding Rocketshttp://www.wff.nasa.gov/pages/soundingrockets.htmlDiscover information about research rockets used to create weightless conditions.
Amusement Park Physics With a NASA Twist EG–2003–03–010–GRC
146
NASA Resources for EducatorsCentral Operation of Resources for Educators (CORE) was established for the national andinternational distribution of NASA-produced educational materials in multimedia format. Educatorscan obtain a catalogue and an order form by one of the following methods:
NASA CORELorain County Joint Vocational School15181 Route 58 SouthOberlin, OH 44074–9799Phone: 440–775–1400Fax: 440–775–1460E-mail: [email protected] page: http://core.nasa.gov
Educator Resource Center Network (ERCN)To make additional information available to the education community, NASA has created theNASA ERCN. Educators may preview, copy, or receive NASA materials at these sites. Phone callsare welcome if you are unable to visit the ERC (Educator Resource Center) that serves yourgeographic area. A list of the centers and the regions they serve includes
AK, Northern CA, HI, ID, MT, NV, OR, UT, WA, WYNASA Educator Resource CenterNASA Ames Research CenterMail Stop 253–2Moffett Field, CA 94035–1000Phone: 650–604–3574http://amesnews.arc.nasa.gov/erc/erchome.html
IL, IN, MI, MN, OH, WINASA Educator Resource CenterNASA Glenn Research CenterMail Stop 8–121000 Brookpark RoadCleveland, OH 44135Phone: 216–433–2017http://www.grc.nasa.gov/WWW/PAO/html/edteachr.htm
CT, DE, DC, ME, MD, MA, NH, NJ, NY, PA, RI, VTNASA Educator Resource LaboratoryNASA Goddard Space Flight CenterMail Code 130.3Greenbelt, MD 20771–0001Phone: 301–286–8570http://www.gsfc.nasa.gov/vc/erc.htm
Amusement Park Physics With a NASA Twist EG–2003–03–010–GRC
147
CO, KS, NE, NM, ND, OK, SD, TXSpace Center HoustonNASA Educator Resource CenterNASA Johnson Space Center1601 NASA Road OneHouston, TX 77058Phone: 281–244–2129http://www.spacecenter.org/educator_resource.html
FL, GA, PR, VINASA Educator Resource CenterNASA Kennedy Space CenterMail Code ERCKennedy Space Center, FL 32899Phone: 321–867–4090http://www-pao.ksc.nasa.gov/kscpao/educate/edu.htm
KY, NC, SC, VA, WVVirginia Air & Space CenterNASA Educator Resource CenterNASA Langley Research Center600 Settlers Landing RoadHampton, VA 23669–4033Phone: 757–727–0900 x757http://www.vasc.org/erc/
AL, AR, IA, LA, MO, TNU.S. Space and Rocket CenterNASA Educator Resource CenterNASA Marshall Space Flight CenterOne Tranquility BaseHuntsville, AL 35807Phone: 256–544–5812http://erc.msfc.nasa.gov
MSNASA Educator Resource CenterNASA Stennis Space CenterMail Stop 1200Stennis Space Center, MS 39529–6000Phone: 228–688–3338http://education.ssc.nasa.gov/erc/erc.htm
Amusement Park Physics With a NASA Twist EG–2003–03–010–GRC
148
CANASA Educator Resource CenterNASA Jet Propulsion LaboratoryVillage at Indian Hill1460 East Holt Avenue, Suite 20Pomona, CA 91767Phone: 909–397–4420http://learn.jpl.nasa.gov/resources/resources_index.html
AZ and Southern CANASA Educator Resource CenterNASA Dryden Flight Research CenterPO Box 273 M/S 4839Edwards, CA 93523–0273Phone: 661–276–5009http://www.dfrc.nasa.gov/trc/ERC/
VA and MD’s Eastern ShoresNASA Educator Resource CenterGSFC/Wallops Flight FacilityVisitor Center Building J–17Wallops Island, VA 23337Phone: 757–824–2298http://www.wff.nasa.gov/~WVC/ERC.htm
Regional Educator Resource Centers offer more educators access to NASA educationalmaterials. NASA has formed partnerships with universities, museums, and other educationalinstitutions to serve as regional ERCs in many states. A complete list of regional ERCs is availablethrough CORE, or electronically via NASA Spacelink at http://spacelink.nasa.gov/ercn.
NASA’s Education Home Page serves as the education portal for information regardingeducational programs and services offered by NASA for the American education community. Thishigh-level directory of information provides specific details and points of contact for all of NASA’seducational efforts, field center offices, and points of presence within each state. Visit thisresource at the following address: http://education.nasa.gov.
NASA Spacelink is one of NASA’s electronic resources specifically developed for the educationalcommunity. Spacelink serves as an electronic library to NASA’s educational and scientific resources,with hundreds of subject areas arranged in a manner familiar to educators. Using Spacelink Search,educators and students can easily find information among NASA’s thousands of Internet resources.Special events, missions, and intriguing NASA Web sites are featured in Spacelink’s “Hot Topics” and“Cool Picks” areas. Spacelink may be accessed at: http://spacelink.nasa.gov.
NASA Spacelink is the official home to electronic versions of NASA’s Educational Products.A complete listing of NASA Educational Products can be found at the following address:http://spacelink.nasa.gov/products.
Amusement Park Physics With a NASA Twist EG–2003–03–010–GRC
149
NASA Television (NTV) features Space Station and shuttle mission coverage, live specialevents, interactive educational live shows, electronic field trips, aviation and space news, andhistorical NASA footage. Programming has a 3-hour block—Video (News) File, NASA Gallery,and Education File—beginning at noon Eastern and repeated four more times throughout theday. Live feeds preempt regularly scheduled programming.
Check the Internet for programs listings at http://www.nasa.gov/ntvFor more information on NTV, contactNASA TVNASA Headquarters—Code P–2Washington, DC 20546–0001Phone: 202–358–3572
NTV Weekday Programming Schedules (Eastern Time)Video File NASA Gallery Education File12–1 p.m. 1–2 p.m. 2–3 p.m.3–4 p.m. 4–5 p.m. 5–6 p.m.6–7 p.m. 7–8 p.m. 8–9 p.m.9–10 p.m. 10–11 p.m. 11–12 p.m.12–1 a.m. 1–2 a.m. 2–3 a.m.
How to Access Information on NASA’s Education Program, Materials, and Services(EP–2002–07–345–HQ) This brochure serves as a guide to accessing a variety of NASAmaterials and services for educators. Copies are available through the ERC network, orelectronically via NASA Spacelink.

Amusement Park Physics With a NASA Twist EG–2003–03–010–GRC
150B–1073Apr 03
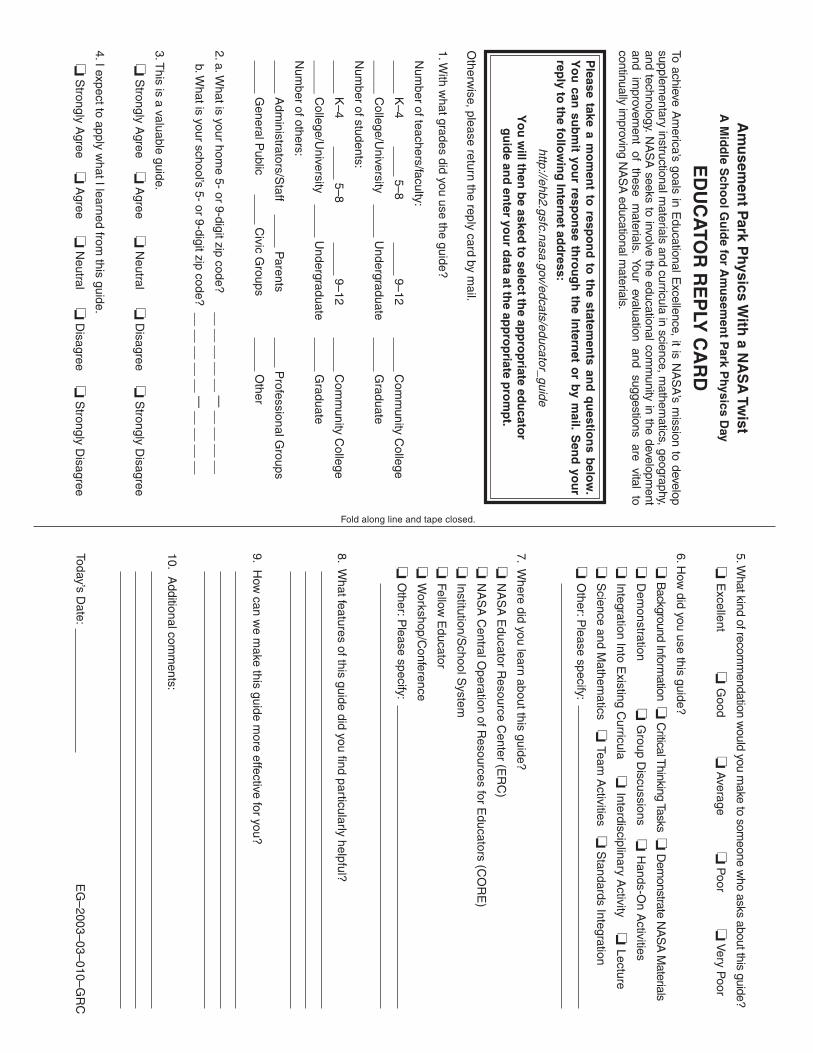
Amusement Park Physics With a NASA Twist EG–2003–03–010–GRC
151
Am
usem
ent P
ark Physics W
ith a N
AS
A Tw
istA
Mid
dle S
cho
ol G
uid
e for A
mu
semen
t Park P
hysics Day
ED
UC
ATO
R R
EP
LY C
AR
DTo achieve A
merica’s goals in E
ducational Excellence, it is N
AS
A’s m
ission to developsupplem
entary instructional materials and curricula in science, m
athematics, geography,
and technology. NA
SA
seeks to involve the educational comm
unity in the development
and im
provement
of these
materials. Your
evaluation and
suggestions are
vital to
continually improving N
AS
A educational m
aterials.
Otherw
ise, please return the reply card by mail.
1. With w
hat grades did you use the guide?
Num
ber of teachers/faculty:
K–4
5–8 9–12
Com
munity C
ollege
_____ College/U
niversity Undergraduate
Graduate
Num
ber of students:
K–4
5–8 9–12
Com
munity C
ollege
_____ College/U
niversity Undergraduate
Graduate
Num
ber of others:
Adm
inistrators/Staff P
arents P
rofessional Groups
General P
ublic C
ivic Groups
Other
2. a. What is your hom
e 5- or 9-digit zip code? __ __ __ __ __ — __ __ __ __
b. What is your school’s 5- or 9-digit zip code? __ __ __ __ __ —
__ __ __ __
3. This is a valuable guide.
❏ S
trongly Agree ❏
Agree ❏
Neutral ❏
Disagree
❏ S
trongly Disagree
4. I expect to apply what I learned from
this guide.
❏ S
trongly Agree ❏
Agree ❏
Neutral ❏
Disagree
❏ S
trongly Disagree
Please take a m
om
ent to
respo
nd
to th
e statemen
ts and
qu
estion
s belo
w.
Yo
u can
sub
mit yo
ur resp
on
se thro
ug
h th
e Intern
et or b
y mail. S
end
you
rrep
ly to th
e follo
win
g In
ternet ad
dress:
http://ehb2.gsfc.nasa.gov/edcats/educator_guide
5. What kind of recom
mendation w
ould you make to som
eone who asks about this guide?
❏ E
xcellent ❏ G
ood ❏ A
verage ❏ P
oor ❏ V
ery Poor
6. How
did you use this guide?
❏ B
ackground Information ❏
Critical T
hinking Tasks ❏ D
emonstrate N
AS
A M
aterials
❏ D
emonstration ❏
Group D
iscussions ❏ H
ands-On A
ctivities
❏ Integration Into E
xisting Curricula ❏
I nterdisciplinary Activity ❏
Lecture
❏ S
cience and Mathem
atics ❏ Team
Activities ❏
Standards Integration
❏ O
ther: Please specify:
7. Where did you learn about this guide?
❏ N
AS
A E
ducator Resource C
enter (ER
C)
❏ N
AS
A C
entral Operation of R
esources for Educators (C
OR
E)
❏ Institution/S
chool System
❏ Fellow
Educator
❏ W
orkshop/Conference
❏ O
ther: Please specify:
8. What features of this guide did you find particularly helpful?
9. How
can we m
ake this guide more effective for you?
10. Additional com
ments:
Today’s Date:
EG
–2003–03–010–GR
C
Fold along line and tape closed.
Yo
u w
ill then
be asked
to select th
e app
rop
riate edu
cator
gu
ide an
d en
ter you
r data at th
e app
rop
riate pro
mp
t.
Amusement Park Physics With a NASA Twist EG–2003–03–010–GRC
152
Please PlaceStamp HerePost Office
Will Not DeliverWithout Proper
Postage
NATIONAL AERONAUTICS AND SPACE ADMINISTRATIONEDUCATION DIVISIONMAIL CODE FEWASHINGTON DC 20546–0001
Fold along line and tape closed.