Embed Size (px)
Citation preview

Amusement Park Physics With a NASA Twist
A Middle School Guide for Amusement Park Physics Day
National Aeronautics and Space Administration
NASA Glenn Research Center Microgravity Science Division
National Center for Microgravity Research on Fluids and Combustion Office of Educational Programs
NASA Headquarters Office of Biological and Physical Research
Office of Education
This publication is in the public domain and is not protected by copyright. Permission is not required for duplication for classroom use.
For all other uses, please give credit to NASA and the authors.
EG-2003-Q3-01 O-G RC
8-1 073 Aug 04
3
Amusement Park Physics With a NASA Twist EG-2003-03-010-GRC
Acknowledgments
The K-12 Educational Program group at the National Center for Microgravity Research on Fluids and Combustion developed this educator guide at the NASA Glenn Research Center in Cleveland, Ohio. This publication is a product of 4 years of development and testing with over 1500 students at Six Flags and Cedar Point in Ohio. Special thanks go to the teachers who formally piloted this program with over 900 students. Their feedback was invaluable.
Project manager: Carla B. Rosenberg National Center for Microgravity Research on Fluids and Combustion Cleveland, Ohio
Contributing authors: Carol Hodanbosi, Ph.D. Carla B. Rosenberg National Center for Microgravity Research on Fluids and Combustion Cleveland, Ohio
Samantha Beres Chimayo, New Mexico
Melissa J. B. Rogers Macedonia, Ohio
Ann Schwartz Emerson Middle School Lakewood, Ohio
Reviewers/editors Richard DeLombard NASA Glenn Research Center Cleveland, Ohio
Thomas Jacobson National Center for Microgravity Research on Fluids and Combustion Cleveland, Ohio
John Fellenstein Max Hayes Vocational High School Cleveland, Ohio
Pilot teachers: William Altman Horace Mann Middle School Lakewood, Ohio
Megan Boivin Roosevelt Middle School Springfield, Ohio
Wendy Booth Fairport Harbor High School Fairport Harbor, Ohio
Matthew Broda Erwine Middle School Akron, Ohio
Rick Chiera Bolich Middle School Cuyahoga Falls, Ohio
Debbie Dobney McCormick Middle School Wellington , Ohio
Michael Eier Glenwood Middle School Findlay, Ohio
Cindy Mast Emerson Middle School Lakewood, Ohio
James Nold Hudson Middle School Hudson, Ohio
Elaine Peduzzi Ford Middle School Brook Park, Ohio
Karen Rayl Wickliffe Middle School Wickliffe, Ohio
Michelle Smith Hillside Middle School Seven Hills, Ohio
Special thanks to photographer Joe Schwartz for his permission to use his ©1995 pictures on the following pages: 7,9, 15 (2),37, 38, 64, 65, 67, 68 (2), 69, 71 (3), 73 , 78, 80 (2), 82, 83 (2),85,86,95, 112, 121.
4
Amusement Park Physics With a NASA Twist EG-2003-03-010-GRC
Table of Contents
Introduction 7 Correlation to National Education Standards 11 Background 14 Basic Skills 26
Time 26 Distance 26 Eye Level Height 27 Altitude Tracker 28 Altitude Tracker Template 29 Altitude Estimation Methods 31 Scale Drawing Method 31 Altitude Tracker Worksheet 32 Flagpole Height Worksheet 34 Structure Estimation 35 Structure Estimation Worksheet 37 Accelerometer 39 Errors in Measurement 41
Classroom Activities 43 Pendulums-Part 1 45 Pendulums-Part 2 47 Collisions-Part 1 49 Collisions-Part 2 50 Marble Run-Part 1 52 Marble Run-Part 2 53 Marble Run-Part 3 55 Marble Run-Part 4 57
NASA Connection 59 Student Reading Guide 61 Student Reading Guide Answer Key 62 Free-Fall Rides 64 Roller Coasters 65 Bumper Cars 66 Carousels 67 Roller Coasters-Loops 68 Pendulum Rides 69
Ride Workbook 71 Free-Fall Rides 73 Roller Coasters-Initial Hill 75 Bumper Cars 77 Roller Coasters-Floater Hills 79 Carousels 81 Roller Coasters-Loops 82 Pendulum Rides 84 Worksheets for Nonattending Students 86
5
Amusement Park Physics With a NASA Twist EG-2003-03-01 G-GRC

Answer Key 98 Pendulums-Part 1 98 Pendulums-Part 2 100 Collisions-Part 1 102 Collisions-Part 2 103 Marble Run-Part 1 105 Marble Run-Part 2 106 Marble Run-Part 3 108 Marble Run-Part 4 110 Free-Fall Rides 112 Roller Coasters-Initial Hill 114 Bumper Cars 116 Roller Coasters-Floater Hills 118 Ca rousels 120 Roller Coaster-Loops 121 Pendulum Rides 122
Tests 125 Pretest 127 Pretest Answer Key 128 Posttest 129 Posttest Answer Key ........ ...... .......... ..................... ........ ...... ......... ....... ........ ....... ........ ...... 130
Forms and Extras 131 Purpose of Amusement Park Physics Day 133 Ride Station Rotation Chart 135 Eye Level Height and Stepping Estimation Record 136 Classroom Master Materials List 137 Amusement Park Day Master Materials List 138 Bus List 139 Ride Attendance Form 140
Resources 141 Vocabulary 143 List of Formulas 144 Amusement Park Physics and Related Web Sites 145 NASA Resources for Educators 146
6
Amusement Park Physics With a NASA Twist EG-2003-G3-01 o-o RC
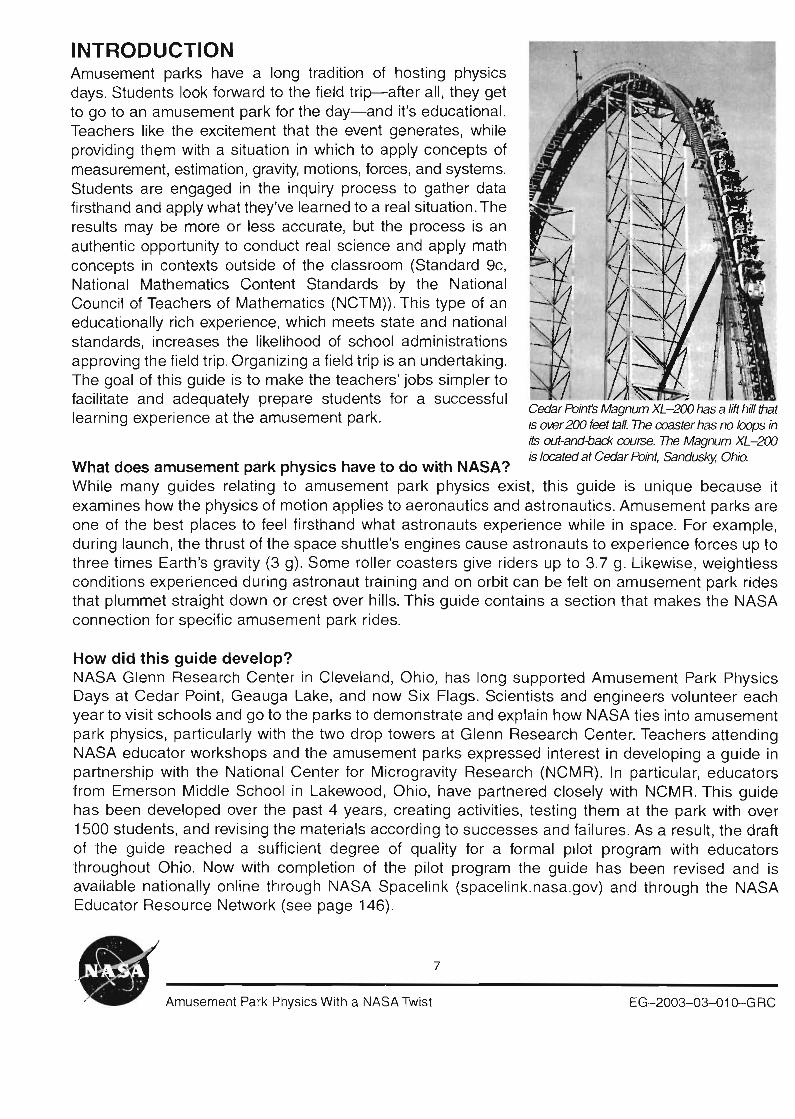
CedarPoinfsMagnumXL-200 hasa lifthill that
INTRODUCTION Amusement parks have a long tradition of hosting physics days. Students look forward to the field trip-after all, they get to go to an amusement park for the day-and it's educational. Teachers like the excitement that the event generates, while providing them with a situation in which to apply concepts of measurement, estimation, gravity, motions, forces, and systems. Students are engaged in the inquiry process to gather data firsthand and apply what they've learned to a real situation. The results may be more or less accurate, but the process is an authentic opportunity to conduct real science and apply math concepts in contexts outside of the classroom (Standard gc, National Mathematics Content Standards by the National Council of Teachers of Mathematics (NCTM)). This type of an educationally rich experience, which meets state and national standards, increases the likelihood of school administrations approving the field trip. Organizing a field trip is an undertaking. ,- ~
'... , . ----....: ~
The goal of this guide is to make the teachers' jobs simpler to ~~-facilitate and adequately prepare students for a successful , J
learning experience at the amusement park. is olier200 feet tall. Thecoasterhas no loopsin its out-and-back course. The Magnum XL-200 is locatedat CedarFbint, sandusky. Ohio.
What does amusement park physics have to do with NASA? While many guides relating to amusement park physics exist , this guide is unique because it examines how the physics of motion applies to aeronautics and astronautics. Amusement parks are one of the best places to feel firsthand what astronauts experience while in space. For example, during launch , the thrust of the space shuttle's engines cause astronauts to experience forces up to three times Earth 's gravity (3 g). Some roller coasters give riders up to 3.7 g. Likewise, weightless conditions experienced during astronaut training and on orbit can be felt on amusement park rides that plummet straight down or crest over hills. This guide contains a section that makes the NASA connection for specific amusement park rides.
How did this guide develop? NASA Glenn Research Center in Cleveland, Ohio, has long supported Amusement Park Physics Days at Cedar Point , Geauga Lake, and now Six Flags. Scientists and engineers volunteer each year to visit schools and go to the parks to demonstrate and explain how NASA ties into amusement park physics, particularly with the two drop towers at Glenn Research Center. Teachers attending NASA educator workshops and the amusement parks expressed interest in developing a guide in partnership with the National Center for Microgravity Research (NCMR). In particular, educators from Emerson Middle School in Lakewood , Ohio, have partnered closely with NCMR. This guide has been developed over the past 4 years, creating activities, testing them at the park with over 1500 students, and revising the materials according to successes and failures. As a result , the draft of the guide reached a sufficient degree of quality for a formal pilot program with educators throughout Ohio. Now with completion of the pilot program the guide has been revised and is available nationally online through NASA Spacelink (spacelink.nasa.gov) and through the NASA Educator Resource Network (see page 146).
7
Amusement Park Physics With a NASA Twist EG-2003-03-o1o-GRC

For what grades is this guide appropriate? Many amusement park physics guides are geared toward high school level science and mathematics classes. This guide does not require knowledge of trigonometry or calculus. The intended audience is primarily students in seventh through ninth grades. Since high school level mathematics is not used and the measurement tools are fairly low-end technoloqies, and not terribly accurate, the emphasis is less on getting the "correct" answer and more about making reasonable estimations and the thinking process. Note, upper elementary school teachers have found this guide to be appropriate for classes for gifted and talented students. However, this age group may lack the necessary motor skills to operate stop watches and take consistent altitude tracker readings.
How is this amusement park guide different from other guides? Most amusement park physics guides focus primarily on problem sets and are geared towards using trigonometry and calculus. This is a middle school guide that makes the NASA connection to the rides. All of the activities are centered on preparing students to complete worksheets for specific rides. The science and mathematics teachers can prepare students to use a single method or several methods for gathering the data. In addition, the guide is geared to help plan and run a successful field trip. After having many amusement park field trips, in all types of weather, with all types of students, and involving teachers of many different subjects, we have learned a lot about what works and what does not. Included in this guide you will find what the teachers found to be most essential in preparing and running this field trip.
How to use this guide The sections found in the guide include
• Background Information-covers amusement park physics, gravity, forces and motion, and microgravity. This information is for the teacher, but may also be given out to the students.
• Basic Skills-discusses skills needed to do classroom activities and ride worksheets at the amusement park. Skills involve using a stopwatch, walking baselines, taking altimeter readings, calculating heights and speeds, and making and using accelerometers.
• Classroom Activities-contains 2 weeks worth of activities designed to provide students with skills needed to complete ride worksheets at the park.
• NASA Connections-makes the NASA tie-in with each amusement park ride. • Ride Worksheets-can be used as a workbook for specific rides at the amusement park . • Answer Key-gives approximate answers for each of the classroom activities and
ride worksheets. • Tests-provides a pretest and posttest to show students and teachers how much they have
learned from this unit on motion and forces. • Forms and Extras-includes tips and forms to help get the trip organized and methods for
facilitating a successful experience at the park. • Resources-covers vocabulary, formula list , Web sites, and other useful NASA resources for
educators.
8
Amusement Park Physics With a NASA Twist EG-2003-03-01o-GRC

To get a sense of the scope of the content , read through the Ride Worksheets and Answer Key sections first. Remember that for middle school students, the emphasis is less on getting a "correct" answer than using the problem-solving process. The measurement tools are not highly accurate, but if used correctly can provide comparative values. The basic skills and classroom activities prepare students to successfully complete the ride worksheets at the park. If you or your students need more science and math information related to forces and motion, consult the background information. The Background Information section can be used as a student handout or as a teacher reference.
Plan on spending at least 2 weeks prior to the spring field trip working on the classroom activities. Ideally, the science and mathematics teachers should work closely together to coordinate teaching basic skills. One option is to begin the unit with the pretest to see what students know about motion and forces. Then give the posttest after the field trip to see what the students have learned. The English teacher can assist in the preparation process too by reinforcing or even introducing the NASA Connections section with a worksheet activity.
When it comes to organizing the field trip, read through the planning schedule that follows. We recommend generating interest and support hom school administrators, parents, students, and fellow teachers early in the semester in which you plan to implement this guide. Some schools have had success with high school physics students assisting student teams at the amusement park. Many schools have fundraisers to subsidize paying for school buses, purchasing measurement equipment, and even partially or completely paying for the students' tickets. The forms and extras section includes a letter of permission for parents, ways to keep track of supply bags, teams of students, and attendance lists for riding the buses. From past experience, teachers and parents that volunteer to be of ass istance at the amusement park prefer to just learn the worksheet for their particular assigned ride station. If possible, attend an amusement park physics workshop for educators at NASA Glenn Research Center. Visit www.ncmr.org/education/k12/workshops.htm/for information on future workshops.
The Dungeon Drop, located at Six Flags AstroWorld in Houston, Texas, stands 230 feet high. The feeling of weightlessness the riders experience is enhanced by extending their arms and legs .
9
Amusement Park Physics With a NASA Twist EG-2003-03-01 D-GRC
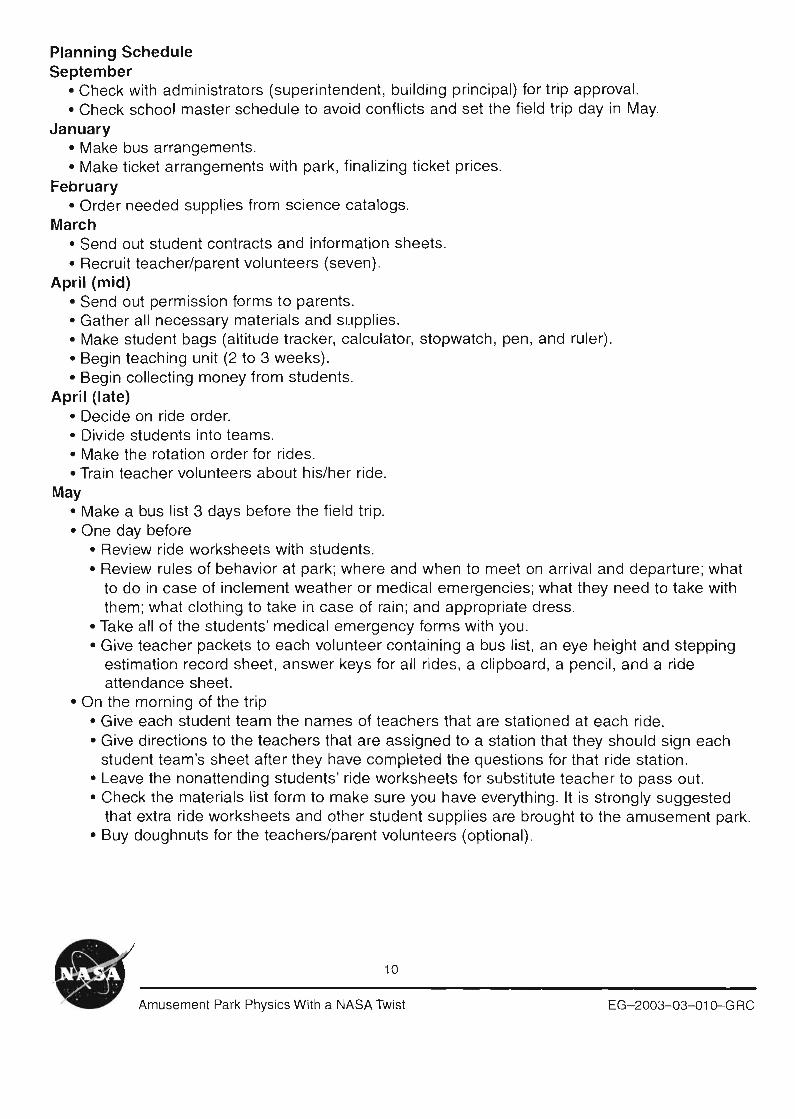
Planning Schedule September
• Check with administrators (superintendent, building principal) for trip approval. • Check school master schedule to avoid conflicts and set the field tr ip day in May.
January • Make bus arrangements. • Make ticket arrangements with park , finalizing ticket prices.
February • Order needed supplies from science catalogs.
March • Send out student contracts and information sheets. • Recruit teacher/parent volunteers (seven).
April (mid) • Send out permission forms to parents. • Gather all necessary materials and supplies. • Make student bags (altitude tracker, calculator, stopwatch, pen, and ruler). • Begin teaching unit (2 to 3 weeks). • Begin collecting money from students.
April (late) • Decide on ride order. • Divide students into teams. • Make the rotation order for rides. • Train teacher volunteers about his/her ride.
May • Make a bus list 3 days before the field trip. • One day before
• Review ride worksheets with students. • Review rules of behavior at park; where and when to meet on arrival and departure; what
to do in case of inclement weather or medical emergencies; what they need to take with them; what clothing to take in case of rain; and appropriate dress.
• Take all of the students' medical emergency forms with you. • Give teacher packets to each volunteer containing a bus list, an eye height and stepping
estimation record sheet, answer keys for all rides, a clipboard, a pencil, and a ride attendance sheet.
• On the morning of the trip • Give each student team the names of teachers that are stationed at each ride. • Give directions to the teachers that are assigned to a station that they should sign each
student team's sheet after they have completed the questions for that ride station. • Leave the nonattending students' ride worksheets for subst itute teacher to pass out. • Check the materials list form to make sure you have everything. It is strongly suggested
that extra ride worksheets and other student supplies are brought to the amusement park. • Buy doughnuts for the teachers/parent volunteers (optional) .
10
Amusement Park Physics With a NASA Twist EG-2003-03-01 G-G RC

National Science Education Standards, Grades 5-8 by the National Research Council, 1996
Basic Skills
Science Standard Altimeter angles
Flagpole height
Structure estimation
NASA connection
Unlfvinq Concept and Processes Evidence, models , and organization •Chanqe, constancy, and explanation • • •
Science as Inquiry Abilities necessary to do scientific inquiry • • •Understanding scientific inquiry •
Physical Science Motions and forces •Transfer of energy •Science and Technology Understanding science and technology • •Science in Personal and Social Perspectives Risk and benefits •Science and technology in society •History and Nature of Science Nature of science •History of science •
Mathematics Principles and Standards for Schools, Grades 6-8 by the National Council of Teachers of Mathematics, 2000
Basic Skills
Mathematics Standard Altimeter angles
Flagpole height
Structure estimation
NASA connection
Number and Operations
Representinq numbers • •Meanings of operations • •Compute fluently • • •Algebra Mathematical models • •
Geometry Apply transformation • •Use visualization • • • •Measurement Measurable attributes • • •Appropriate techniques, tools, formulas • • •Problem Solving Build new math knowledge • • • •Solve problems that arise • • •Apply appropriate strategies • • •Connections Apply math in contexts outside of math • • • •Representation Use representations to model world phenomena • • •
11
Amusement Park Physics With a NASA Twist EG-2003-Q3-01O-GRC

National Science Education Standards, Grades 5-8 by the National Research Council, 1996
Classroom Activities
Science Standard Collisions Part 1
Collisions Part 2
Marble Run
Part 1
Marble Run
Part 2
Marble Run
Part 3
Marble Run
Part 4 Pendulums
Part 1 Pendulums
Part 2
Unifvinq Concept and Processes Systems, order, and orqanization • • • • •Evidenc e, models, and orqan ization • • • • • • • •Chanqe, constancy. and explanation • • • • • • • • Evolut ion and equilibrium • •
Science as Inquiry Abilities necessary to do scientific inquiry • • • • • • • •Understandings about scientific inquiry • • • • • • • •
Physical Science Motions and forces • • • • • • • •Transfer of energy • • •
Mathematics Principles and Standards for Schools, Grades 6-8 by the National Council of Teachers of Mathematics, 2000
Classroom Activities
Mathematics Standard Collisions Part 1
Collisions Part 2
Marble Run
Part 1
Marble Run
Part 2
Marble Run
Part 3
Marble Run
Part 4 Pendulums
Part 1 Pendulums
Part 2
Number and Operations Reoresentino numbers • • • •Mean inqs of operations • • • •Compute fluentlv • • • •
Alqebra Patterns • •Represent and analvze • •Mathematical models • • • • • •Analvze chance • •
Geometrv Apolv transformation • •Use visualization • •
Measurement Measurable attributes • • • •Appropriate techniaues, tools , formulas • • • •Data Analysis and Probability Select and use statist ical methods • • • •Develop and evaluate • • •Problem Solving Build new math knowledqe • • • •Solve problems that arise • • • • • • • •Apply appropriate strateqies • • • • • • • •Connections Apply math in contexts outside of math • • • •Representation Use representations to model world phenomena • • • • • •
12
Amusement Park Physics With a NASA Twist EG-2003-03-Q1 G-G RC
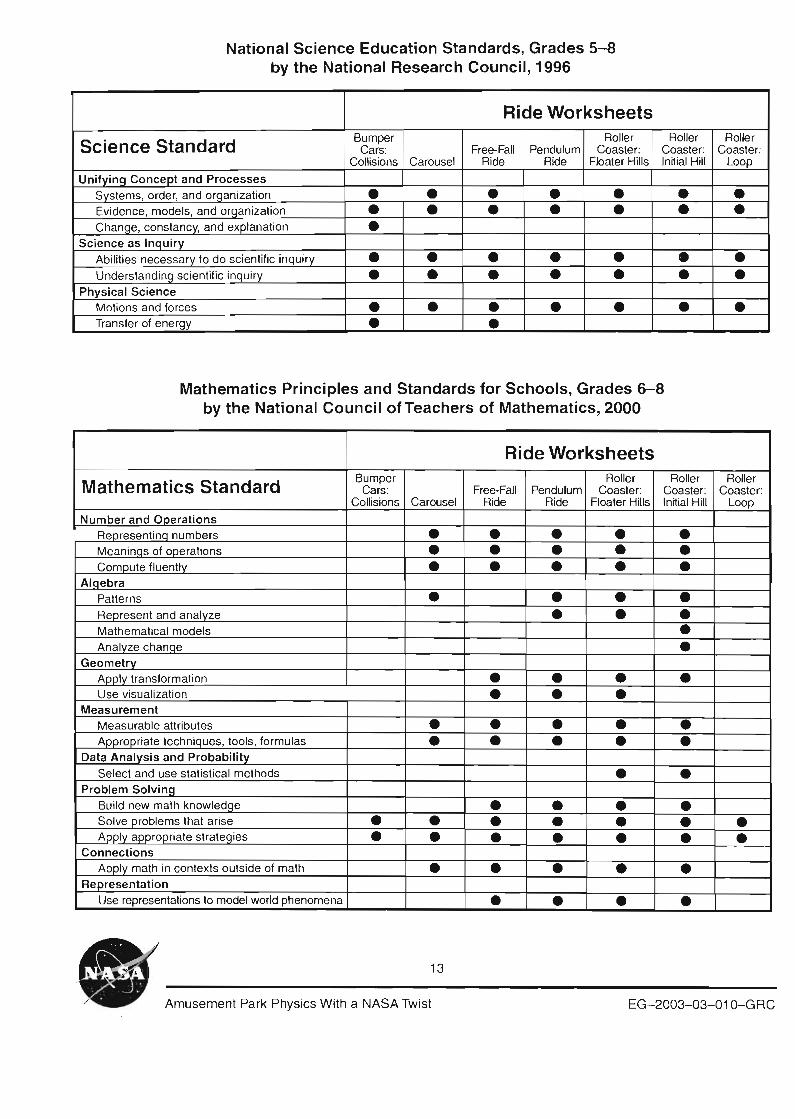
National Science Education Standards, Grades 5-8 by the National Research Council, 1996
Ride Worksheets
Science Standard Bumper
Cars: Collisions Carousel
Free-Fall Ride
Pendulum Ride
Roller Coaster:
Floater Hills
Roller Coaster: Initial Hill
Roller Coaster:
Loop
Unifying Concept and Processes Systems, order , and orqanization • • • • • • •Evidence, models , and orqan izatlon • • • • • • • Chance, constancy, and explanation •
Science as Inquiry Abilities necessa ry to do scientific inqu iry • • • • • • • Understandinq scient ific inquiry • • • • • • •
Physical Science Motions and forces • • • • • • •Transfer of energy • •
Mathematics Principles and Standards for Schools, Grades 6-8 by the National Council of Teachers of Mathematics, 2000
Ride Worksheets
Mathematics Standard Bumper
Cars: Free-Fall Pendulum Roller
Coaster: Roller
Coaster: Roller
Coaster: Collisions Carousel Ride Ride Floater Hills Initial Hill Loop
Number and Ooerations Reoresentina numbers • • • • •Meaninas of ooerations • • • • • Comoute fluentlv • • • • •
AIQebra Patterns • • • • Reoresent and analvze • • •Mathematical models • Analvze chanae •
Geometrv Aoolv transformation • • • •Use visua lizatio n • • •Measurement Measurable attributes • • • • •Aoorooriate techniaues , tools , formulas • • • • •
Data Analvsis and Probabilitv Select and use statistical methods • •
Problem Solvinq Build new math knowledqe • • • •Solve problems that arise • • • • • • •Aootv appropriate strateqies • • • • • • •Connections Apply math in contexts outside of math • • • • •Representation Use representations to model world phenomena • • • •
13
Amusement Park Physics With a NASA Twist EG-2003-D3-010-GRC

Microgravity does not mean a little bit of gravity. It means that some of the effects of gravity are minimized.
NASA has a number of ways to create microgravity for research. This drop tower at the Glenn Research Center in Cleveland, Ohio, creates a microgravity environment.
BACKGROUND Why are amusement park rides so much fun? The roller coasters, free-fall , and pendulum rides are exhilarating, if not terrifying. Think about how the motion of a ride heightens one's senses. The roller coaster creeps to the top of a hill slowly. Anticipation builds. As it crests the hill, the car seems suspended for a moment before it thunders down and the car and rider are falling fast. It feels like one might fly out of the car if not for the safety restraints. The boat ride that swings like a pendulum looks harmless, but as it swings higher and higher in its arc, the rider comes off his or her seat. One feels suspended in midair just long enough to give one 's stomach a flutter.
Believe it or not, science explains the thrills one experiences on the roller coaster and other rides. An amusement park is a great place to study motions and forces, and something different, called microgravity.
Microgravity Microgravity is not what it sounds like. Although "micro" means small, "microgravity" does not mean a little bit of gravity; it means that some of the effects of gravity are minimized. Amusement park rides provide brief glimpses of what astronauts experience in the microgravity of orbit-a sense of weightlessness. The gravitational pull in an amusement park does not change from place to place, but one will experience a sensation of feeling heavier, lighter, even weightless, on some rides .
Motion Makes All the Commotion Amusement park rides are exciting because of a common element that they all share. What do merry-go-rounds, ferris wheels, flume rides, and bumper cars have in common? All these rides have motion. What would a roller coaster be without motion? It is the motion of a ride that can move one in such a way that one feels heavy, as if gravity became stronger. The motion can also let one fall for a second or more, making one feel light or weightless. Motions can change the effect that gravity has on one's body, enough to create a microgravity environment.
Three types of motion found at amusement parks relate to the sensations one feels-linear motion, curved motion , and circular motion . Linear motion describes an object that moves in a straight line. Bumper cars move in a horizontal, linear
14
Amusement Park Physics With a NASA Twist EG-2003-03-01 G-GRC

path much of the time. The free-fall ride makes a vertical, or up-and-down, type of linear motion. Roller coasters use a combination of horizontal and vertical linear motion, as well as curved motion, as the cars charge over hills and careen around corners. The pendulum ride, though it may not always travel in a complete circle, moves in a circular path, as does the ferris wheel. These types of motion contribute to the chills and thrills of the rides. Knowing these three types of motion will come in handy when one wants to compare a ride, like the free fall, to something outside of the amusement park, such as a drop tower. Both, obviously, have vertical and linear motion.
The Measure of Motion There is more to motion than just the path an object takes. One can determine if one will feel heavier, lighter, or weightless by studying its motion beforehand. By measuring the ride's position at different times, one can find its displacement, velocity, and acceleration.
The position of a ride is where it is at any given moment. Imagine a giant ruler that could be held up next to a free-fall ride to measure the car's position during the ride. One might place the zero point of the ruler at ground level and label it as Y, for the final height. If the ride is 30 meters tall , then the position of the car at the start is 30 meters and is labeled Vi' for the initial height. This causes the location of the car's position at the start to be positive, since it is above the ground. After 1 second of fall , the car's position will be 25 meters. After 2 seconds, the position will be 10 meters and after less than 2.5 seconds the position will be zero with the rider located at the bottom of the ride .
Displacement When a ride changes position, one can calculate the difference between these two positions. This is called finding the displacement. When the free-fall ride is over, the displacement of the car is found by subtracting its starting or initial height from its ending or final height (Yf - Vi' or 0 meters - 30 meters =-30 meters).
Frames of Reference In the first example, the giant ruler was used to define a reference frame in which zero is at the ground level and upward is positive. However, the lowest point of a ride may be above the ground level. In a second example, one may want to move the ruler to change the reference frame , to
Three types of motion that are found in amusement parks are
1. Linear motion 2. Curved motion 3. Circular motion
This drop tower ride is an example of a ride having linear motion.
. ""
\ ~.
\\ The path going down a roller coaster hill is one example of curved motion.
15
Amusement Park Physics With a NASA Twist EG-2003-03-01 G-GRC

The starting height at 30 meters, which is above the ground level, and the ending height at 0 meters, which is ground level.
The starting height is above the ground level at 30 meters, and the ending height is also above ground level at 0 meters.
Displacement, velocity, and acceleration have both magnitude (size) and direction.
define zero to be at the lowest point of the ride (see diagram) . Using this frame of reference, when the rider moves downward "from the starting height , the displacement is negative. Note, nothing has changed other than the location of the ruler, which defines the frame of reference and the location of zero. The motion of the ride will still be the same. Frames of reference are often defined in such a way as to make calculations as simple as possible.
Velocity Determining the velocity of a ride will tell you how fast the ride is falling at any given moment (e.g. , 5 meters per second), or how fast the ride's position is changing. It will also tell you the direction in which the ride is moving. One can use a stopwatch to help calculate velocity. To find the average velocity, divide the displacement by the change in time. The formula is V = ave
(XI - Xi)/(tl - t.). V stands for the average velocity, XI is the ave
final horizontal position, Xi is the initial horizontal position, 4 is the final time, and t, is the initial time. Our free-fall ride takes about 2.5 seconds to fall 30 meters so its average velocity is V = (0 meters - 30 meters)/(2.5 seconds - 0 seconds) = ave -12 meters/second. The velocity is negative because the direction of motion is downward.
The difficulty is that part of the time the free-fall ride is moving slower than 12 meters/second and the rest of the time it is moving faster. In this case, one may also want to know the instantaneous velocity, which is the speed and direction of motion at an instant in time. If one had more position and time data points, one could plot these ordered pairs on graph paper. The slope of a line drawn between any two points on the resulting curve is the average velocity of the car moving between the two positions. The instantaneous velocity at any given time is the slope of the line tangent to the curve at that time.
Acceleration The rate at which velocity changes is called acceleration. The change can be in speed, direction, or both. For the freefall ride, the acceleration is considered to be a constant of 9.8 meters/seconds due to Earth 's gravity. Thus, acceleration in a free-fall ride is a change in velocity. However, in a roller coaster, the acceleration in many instances is not just a change in speed caused by gravity. In some sections of the roller coaster, such as a loop-de-Ioop, the direction in which the roller coaster is moving also changes.
16
Amusement Park Physics With a NASA Twist EG-2003-03-01 G-GRC
Newton's First Law of Motion An object at rest will stay at rest and an object in motion will stay in motion with the same velocity-speed and direction- unless acted upon by a net external force. One can determine if a force is acting on an object: It moves if it was at rest; it changes speed if it was in motion; or it changes direction. Often it is a change of motion that makes a ride so thrilling. Consider riding in an automobile. If one closes his or her eyes while the car travels at a steady rate, he or she can hardly tell it is moving. But one can definitely feel sudden stops, starts , or sharp turns . Amusement park rides capitalize on this by creating changes in motion to make the rides more exciting and interesting.
If it is the change in motion that makes a ride so much fun, one must wonder what causes these changes. What makes a ride speed up, slow down , or take a sharp curve? As Newton said , the answer is force .
Forces A force, simply put, is a push or a pull. Forces exist everywhere. When one throws a ball at a target and tries to win a stuffed animal , his or her arm pushes on the ball until it leaves the hand; that is a force . When one presses the acceleration pedal of a bumper car, the car moves forward and the seat pushes on the rider's body, another example of a force. Forces have both magnitude (size) and direction, as do displacement, velocity, and acceleration.
One can think of it this way. If a rider is in a bumper car traveling forward and someone bumps him or her from behind, the push or force is going in the same direction as the rider, so he or she would accelerate forward and speed up. If the rider gets a bump from the side, he or she may not speed up, but the car and the rider will change directions. In a head on collision the car may stop or it may bounce backwards, depending on the circumstances. In all these situations, the final outcome depends upon the amount of force and the direction of force. What do these examples have in common? An outside force applied to an object causes the object to accelerate. This is explained by Newton 's second law of motion.
Newton's Second Law of Motion The greater the force on an object, the greater its acceleration , that is, F = ma, where F stands for force applied, a for acceleration, and m represents the mass of the object to which the force is applied .
Newton's First Law of Motion
An object at rest will stay at rest and an object in motion will stay in motion with the same velocity-speed and directionunless acted upon by an unbalanced external force.
)
17
Amusement Park Physics With a NASA Twist EG-2003-03-01o-GRC

( ( Newton's Second
Law of Motion
The greater the force on an object, the greater its resulting acceleration.
F=ma
(
Newton's Third Law of Motion
For every action, there is a resulting equal and opposite reaction force.
To illustrate Newton's second law, one may use the bumper car ride for illustration. When car A hits car B, car A impacts with a force on B that is dependent on the mass and the change of speed (acceleration) of car A. If car A merely taps car B, car B will change speed or direction only slightly. If car A hits car B with a large amount of force, car B will increase speed and, depending on the direction of the hit , car B may move off in another direction.
Let's assume a rider and a bumper car have a combined mass of 175 kilograms (kg). Before the car even gets a chance to start moving, another car and rider having the same combined mass drives up from behind and hits the first car with a force of 350 newtons ((N) a unit of force). What is the resulting acceleration due to the force applied?
By applying the second law of motion , F = ma , one can solve for the acceleration (a) a = F/m a = 350 N/175 kg = 350 (kg • meters/second2)/(175 kg)
= 2.1 meters/second-
If the car is hit with a force of 525 N, the resulting acceleration is a = 525 N/175 kg = 525 (kg • meters/second2)/(175 kg)
=3 meters/second?
Newton's Third Law of Motion For every action there is an equal and opposite reaction. Using the same bumper cars to illustrate Newton's third law of motion, if car A hits car B, the motion of both cars changes. This is because car A is not the only one exerting a force. Car B is exerting an equal and opposite force on car A. This opposite and equal force is Newton 's third law of motion. Both the object exerting the force and the object that receives the force have changes in acceleration. This leads to a discussion of gravity and to Newton's law of universal gravitation.
Gravity Remember that a force is a push or a pull. Gravity is a force that pulls all objects on Earth toward the Earth's center of mass. The force due to gravity is the reason that we walk on the ground, rather than bounce or float. Most people are not aware, however, that all objects have a gravitational pull to themselves. That means that everything, regardless of whether it is a feather, a cannon ball, or a star, is attracting everything toward its center of mass. Any object that has mass produces a gravitational pull toward its center.
18
Amusement Park Physics With a NASA Twist EG-2003-03-01o-GRC

Newton's Law of Universal Gravitation Any two objects have a force of attraction between them. Newton reasoned that the orbits of the planets were caused by the forces of attraction between the planets and the Sun, the gravitational force. The amount of gravitational pull depends on the mass of an object . The more massive the object, the stronger the pull. Earth is a huge mass with an enormous gravitational force, pulling everything toward its center. Because the gravitational pull one feels on Earth is so huge, one may not notice other pulls from smaller objects on Earth, which are negligible in comparison and are not strong enough to overcome friction.
Earth 's mass creates a gravitational field that attracts objects with a force inversely proportional to the square of the distance between the center of the object and the center of Earth and is shown in the equation FG = is the gravitational GmEmJr2. FG force, G is the universal gravitational constant, mE is the mass of Earth , m is the mass of the object, and r is the distance a between the centers of Earth and the object. At the surface of Earth, the acceleration due to gravity is approximately 9.8 meters/second", This acceleration is called 1 9 or 1 Earth gravity ("g" refers to the acceleration caused by the gravitational force FG) . Using the same giant ruler reference frame , 1 g = -9.8 meters/second", The sign is negative because the acceleration is inward toward the center of Earth, or downward.
Massive bodies, such as planets, moons, and stars , exert different sizes of forces of gravity on an object, depending on the masses and the distances between the objects. The Moon , for instance, has one-fourth the radius of Earth , 1.2 percent of Earth's mass, and has one-sixth as much gravity as Earth. The Sun could hypothetically hold 1 million Earths and has an immense gravitational pull. This explains why the planets in our solar system orbit the Sun.
Remember that gravitational pull is a two way street. Just as Earth pulls on the Moon, the Moon pulls on Earth. The tides on Earth are caused by the gravitational pull of the Moon and the Sun . Even though the Sun is comparatively farther away than the Moon, it is much more massive. The effect on the tides of Earth is the greatest when the Moon and the Sun are on the same side of the Earth and in a straight line with respect to each other.
) Newton's Law of
Universal Gravitation
All objects have a force of attraction among them that is proportional to the product of the ir masses and inversely proportional to the square of the distance between them.
)
19
Amusement Park Physics With a NASA Twist EG-2003-03-Q10-GRC

Weighing in on Gravity
Earth 's gravitational field pulls objects toward its center. At Earth's surface, this force causes an acceleration of 1 g. As a person or object travels farther away from Earth 's surface, the smaller the effect of the gravitational pull on that person or object becomes.
Actual Weight and Apparent Weight
Actual Weight W = mg, where W is the actual weight, m is the mass of the object, and g is the acceleration of gravity. This acceleration on Earth's surface equals -9.8 meters/second".
Apparent Weight P = ma - W, where P is the apparent weight, m is the object's mass, and a is the net sum of accelerations acting on the object, other than gravity.
As a rider plummets to the ground on a free-fall ride, he or she may feel like he or she weighs less than usual, without any change of body size. How is this explained? Understanding the difference between weight and mass is an important next step.
Mass is a fundamental property of all matter and can be thought of as the amount of "stuff" that makes up an object. Two scoops of ice cream could be exactly the same size, but one of them could have more mass than the other. The ice cream with more mass is made of more stuff, or molecules. It could have less air mixed in with it, or have thick, dense fudge swirled through it to give it more mass than the other scoop .
For any given object, mass is constant but weight is not. Weight is affected by both the mass and the gravitational pull. When people weigh themselves, they step on a scale, compressing a spring or other device inside. It compresses because gravity is attracting and pulling the person downward, creating a push on the spring. The more massive a person is, the more the person weighs, therefore causing the spring to compress more than for less massive people. If the gravitational pull of Earth suddenly became weaker, everyone and everything would weigh less. That is because the spring inside the scale would compress less . This happens even though their masses have not changed. Weight is both a measure of gravitational force and the amount of mass of the object. The actual weight is a result of the force that the existing gravity imparts onto you.
If an object were weighed on the Moon, the weight would appear to be one-sixth of what it is on Earth, although its mass would not have changed. The Moon has one-sixth the amount of Earth's gravity.Therefore, a 445-newton (1 DO-pound) person would weigh 74.2 newtons or 16.6 pounds on the Moon.
So, even though one may feel lighter on a certain ride, it is not because the gravitational pull of Earth is changing.The rider's actual weight is not changing, but his or her apparent weight is changing. One's apparent weight may be either larger or smaller than the actual weight.
The Earth's gravity, for small distances above and below the Earth's surface, can be considered constant. Also, one's mass, for the most part, does not change, at least not during the time one spends at the amusement park. Of course, a
20
Amusement Park Physics With a NASA Twist EG-2003-G3-01O-GRC
huge intake of food items can change one's mass slightly. Then, what causes a person to be pressed sharply into his or her seat on a roller coaster (greater than one's actual weight), or to feel lighter on a ride (less than one 's actual weight)? The reason that one's apparent weight changes may be due to a variety of forces acting on the person or object.
The Energy of Motion Potential energy (PE) is a stored form of energy that can produce motion , that is, the potential for motion. The Earth's gravitational attraction can be used as a source of PE. When the roller coaster car is at the top of the highest hill , it has the greatest amount of gravitational PE for the ride . PE(grav)=mgy, where mg represents the weight of the car and its occupants, and y represents the height in meters. Using the reference frame that was used previously, the downward displacement of an object results in a decrease in PE,
Kinetic energy (KE) is a form of energy related to an object 's motion. KE = (1/2) mv 2 , where m is the mass (kg) of the car and its occupants and v is the velocity (m/s) of the car. If the mass of two objects are equal, then the object having the higher speed or velocity will have more KE than the other. The roller coaster car's kinetic and potential energies change as the car moves along the track . The sum of the two is called the total mechanical energy of the car. If gravity is the only force acting on the car, then the total mechanical energy is constant . This is referred to as the law of conservation of mechanical energy.
In most real-life situations, however, friction and air resistance are present also. As the roller coaster falls , only part of its potential energy is converted to KE. Due to air resistance and friction, the part of the PE that is not converted to KE is converted to heat energy and possibly sound energy too. In these cases , the law of conservation of mechanical energy does not hold true because the sum of the PE and KE is not constant throughout the ride. Sometimes there are situations where the friction and air resistance are negligible, such as when the moving object is very dense and rolling on a smooth surface, and they can be ignored. For purposes of simplicity in this guide, friction and air resistance will be ignored, and it will be assumed that the law of conservation of mechanical energy is true for the amusement park rides.
9 loads The g load gives a numeric value as to how the forces that are acting on you make you feel.
g load = apparent weight =PiW actual weight
Puzzler
You are riding around the curve of a roller coaster, and your accelerometer reads 3 g. As you go down the hill, the accelerometer reads 0 g.
Q: Does this mean the Earth's gravity changes on the roller coaster?
A: No. Although the gravitational force changes as the vertical distance changes, for small distances, such as those for a roller coaster, it is cons idered to be constant. There must be other forces that are affecting the reading. The accelerometer is registering changes in acceleration, which in this case, happens to be measured in g units.
21
Amusement Park Physics With a NASA Twist EG-2003-03-010-GRC

Parabolic Path of Low-Gravity Research Aircraft
34,000
32,000
--Q) Q) 30,000
Q) "D :::J
:,:::; - 28,000«
26,000
24,000
Push over
Push 0"/ I I I I
Pull out
I I I
o 20 45 65
Flight time for a parabola, seconds
Microgravity at the Amusement Park You will definitely feel microgravity conditions at the amusement park, because your apparent weight may feel less than your actual weight at times. The sudden changes in motion create this effect. We can now define microgravity more precisely than we did previously to be "an environment where your apparent weight is less than your actual weight." At the park the key to this condition is free fall. Think of a steep roller coaster hill. Gravity pulls the coaster car down towards the center of Earth. When not in the state of free fall, between the coaster and the ground is a rail that pushes up on the car to keep the coaster from falling to the ground. When it is in free fall, however, there is no vertical support needed. As long as the rail is curved in a parabolic shape and the car is moving at the correct speed, the car and its riders are in free fall .
What would happen if you were not strapped in? Maybe a ride on a special airplane can provide some answers. The KC-135 jet is a research aircraft that NASA uses to create microgravity conditions. This aircraft creates microgravity conditions by flying in steep arcs, or parabolas (see diagram) . It has padded walls, foot restraints, handholds, and devices for securing the experiments during flight. During research flights, the KC-135 can fly 40 to 60 parabolas, each lasting for 60 to 65 seconds. First , the plane climbs at a 45° angle to the horizon. This is called a pull up. Then the pilot slows the engines so that they just make up for the air resistance or drag. The plane and everything that is inside coasts up over the top, then down, in a steep curve, a parabola. This is called a push over. The plane then descends at a 45° angle to the horizon, called a pull out. As the plane starts to dive, the pilot increases the power on the engine, then arcs up to repeat the
22
Amusement Park Physics With a NASA Twist EG-2003-03-010-GRC

NASA Drop Towers Compared With Cedar Point Amusement Park Attractions
/
NASA 5.2 Second Drop Tower
132 m (435 leet) deep
Cedar Point Space Spiral
. Cedar Point Cedar Point 86 m (285 feet) high MllienOlum Force ~.;;.._ Power Tower 94 m (310 leet) high ~73 m (240 leel) high
" ~~ 1J l\; I-""" ......
process. During the pull up and pull out segments, the crew and the experiments experience accelerations of about 2 g. During the parabola trace, the net accelerations drop as low as 0.015 g (nearly 0 g) for about 20 to 25 seconds. Reduced-gravity conditions created by the same type of parabolic motion can be experienced on "floater" hills of roller coaster rides .
Low 9 or Microgravity Microgravity conditions can be due to a reduction of gravitational forces ,or an acceleration toward the Earth's surface. The first method is not an option if we are staying on Earth.
A free-fall ride , however, can provide a rider a great on-Earth microgravity experience. If one could stand or sit on a scale during this ride, it would show that he or she would weigh less than normal. Remember the spring in the scale? In order for the scale to read a person 's weight, the spring must be compressed by a force. Because the scale would be falling right along with the rider as the car is falling , there would be no downward force to compress the spring even if it were directly underneath the person. Instead of using a scale to register weight, a vertical accelerometer can be used to measure the g loads experienced during the ride.
Outside of the amusement park, free fall is not all fun and games. NASA facilities, called drop towers, operate like the free-fall rides, taking full advantage of the acceleration of gravity in order to create microgravity conditions. These towers are used by scientists to study everything from
23
Amusement Park Physics With a NASA Twist EG-2003--03-01O-G RC

High-g Loads
Wash ing mach ine spin cycle up to 163 g
Fighter jet up to 10 g
Loop roller coasters up to 3.7 9
Shuttle takeoff up to 3 9
Commercial aircraft on takeoff up to 1.5 9
combustion to fluids, to experimental designs. The NASA Glenn Research Center has two drop facilities . One provides a 132-meter drop into a hole in the ground creating a microgravity environment for 5.2 seconds. The other facility, a 24-meter tower, allows for 2.2 seconds of microgravity. One can experience falling by riding on drop rides such as the Demon Drop (22 meters high) and the Power Tower (73 meters high). Both of these rides are at the Cedar Point Amusement Park in Sandusky, Ohio.
The longest drop time available to researchers at this time is 10 seconds, achieved at a 490-meter underground drop shaft in Japan. This drop tower, which is deeper than the Empire State Building is tall , has a drop distance of 381 meters or 1250 feet!
An ideal microgravity environment for research is in the Earth's orbit. A main difference between an orbiting spacecraft, such as the space shuttle, the International Space Station, and the drop towers is the length of time for the microgravity condition. The similarity is that the microgravity condition is achieved the same way in orbit as it is in the drop towers or even the drop rides at the amusement park-by free fall. It is a common misconception that astronauts float around in the shuttle because there is no gravity in space. What really makes them float is the fact that spacecraft, and the astronauts in it, are falling around Earth.
High-g Loads The gravitational pull towards Earth never changes. However, just as weightless sensations can be created by certain motions on Earth , so can the feeling of heaviness. When a person 's apparent weight is heavier than his or her actual weight, he or she is experiencing what is called high-g forces. These high-g forces can happen because of an increase in gravitational force, an acceleration away from Earth, or horizontal circular motions. One doesn 't have to look too far at the amusement park to find high-g force experiences. On the roller coaster the rider feels pressed into his or her seat as the car hits the bottom of a hill or bends around a sharp curve. Some free-fall rides shoot up into the air, in which case the rider feels as if he or she is getting pushed into his or her seat. One feels high-g forces in these situations because the direction and/or speed of the ride is changing in just the right way.
24
Amusement Park Physics With a NASA Twist EG-2003-Q3-01 D-GRC
Loop-de-Ioop coasters rarely exceed 3.7 g. This may sound like fun, but for most people these g loads are more than enough excitement. Accelerating at 9 or 10 g in the wrong direction can cause the blood (which carries needed oxygen) to drain from a person's head resulting in tunnel vision and unconsciousness. If the curves of a roller coaster can make you feel weighted down, imagine flying a military high-speed aircraft. These jets are built to withstand up to 10 g. Pilots train to pull 4 to 5 g. Sometimes fighter pilots must handle as many as 10-g loads. How do they avoid passing out? Fighter plane seats are inclined back to prevent blood from draining from the head. Pilots also wear vests and leg straps with rubber air bladders that automatically inflate to create pressure on the body to force blood back to the brain . Also, grunting by the pilots tightens the stomach muscles which helps to bring oxygen back to the brain .
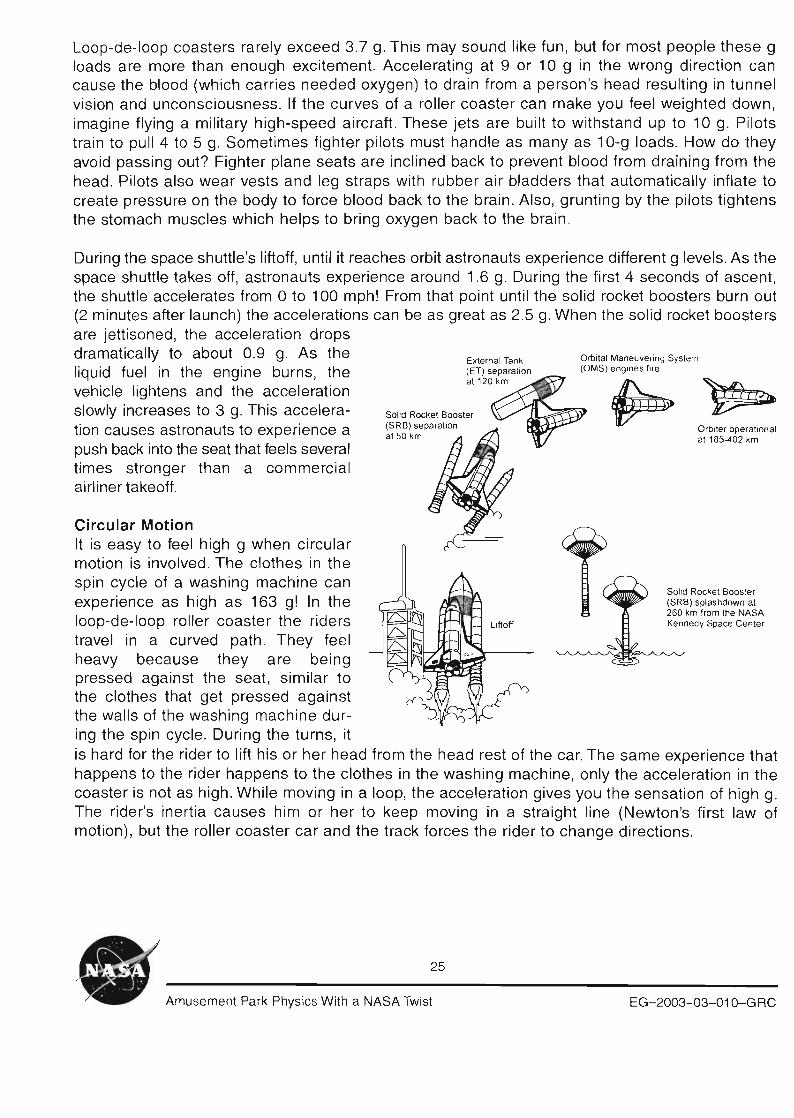
During the space shuttle's liftoff, until it reaches orbit astronauts experience different g levels . As the space shuttle takes off, astronauts experience around 1.6 g. During the first 4 seconds of ascent, the shuttle accelerates from 0 to 100 mph! From that point until the solid rocket boosters burn out (2 minutes after launch) the accelerations can be as great as 2.5 g. When the solid rocket boosters are jettisoned, the acceleration drops dramatically to about 0.9 g. As the Orbital Maneuvering System External Tank
(OMS) engines fire liquid fuel in the engine burns, the at 120 km
Solid Rocket Booster (SRB) separation at 50 km
(ET) separation
vehicle lightens and the acceleration slowly increases to 3 g. This accelera ~~ tion causes astronauts to experience a Orbiter operational
at 185-402 krn push back into the seat that feels several times stronger than a commercial airliner takeoff.
Circular Motion It is easy to feel high g when circular motion is involved . The clothes in the spin cycle of a washing machine can
Solid Rocket Booster (SRB) splashdown at 260 krn from the NASA
experience as high as 163 g! In the loop-de-Ioop roller coaster the riders Kennedy Space Center
travel in a curved path. They feel heavy because they are being pressed against the seat, similar to the clothes that get pressed against the walls of the washing machine during the spin cycle. During the turns, it is hard for the rider to lift his or her head from the head rest of the car. The same experience that happens to the rider happens to the clothes in the washing machine, only the acceleration in the coaster is not as high. While moving in a loop, the acceleration gives you the sensation of high g. The rider's inertia causes him or her to keep moving in a straight line (Newton 's first law of motion), but the roller coaster car and the track forces the rider to change directions.
25
Amusement Park Phys ics With a NASA Twist EG-2003-03-01o-GRC

Basic Skills Students who go to the park without mastering the following skills have difficulty completing the ride worksheets in the next section. To have a successful physics day experience at the amusement park, students need to
1. Practice and successfully use a stopwatch to time rides. / "
/ -, 2. Know how many average steps to take to walk 30 meters. / -,
-, 3 . Measure eye level height. / / -,
-, 4. Practice using the altitude tracker and accelerometer. / -,/
-, 5. Practice and master two methods for estimating heights. /
-,/ -,
6. Review how to calculate average times , average speed, how /
to correctly use the Pythagorean theorem, and how to use / ;(~
/ the equation for finding the period of a pendulum. <, /<,
/' ..... Time Time is an important measurement for calculating speed and
A vibration is one back-and-forth motion. acceleration. Students can use stopwatches to time a ride's duration, portions of rides, or a series of movements to calculate the average ride speeds. Stopwatches and digital watches with stopwatch features are the best. Digital and analog watches with second hands may work well with high school students. Students need practice taking several readings to improve accuracy and get practice calculating average times and speeds.
For fast movements it sometimes is easier to time a series and divide to find the single motion. For example, a student gets on a swing and has established a consistent arc. The partner times the rider for 30 seconds and counts the number of vibrations (one vibration is a back-and-forth movement). The partner can then divide the time, in seconds, by the total number of vibrations to calculate the period (period = time/number of vibrations).
Distance At the amusement park, one cannot interfere with the normal operation of the rides, such as jumping gates and shrubbery to measure ride diameters and distances. Measuring the length of a normal step is a relatively reliable way to gauge distances. Many of the ride worksheets require measuring hill distances or using baselines for angle measurements to calculate ride heights. Use a metric measuring tape or meter stick to mark 10 meters in a hallway or parking lot, with strips of masking tape or chalk. Students can practice walking this distance and counting their steps. Each step counts as one. Have students determine the average number of steps they
These students are finding the average number of steps they take to walk in 10 meters along a hallway in their school.
26
Amusement Park Physics With a NASA Twist EG-2003-03-Q1 Q-GRC
take after three or four trials. As a class, review how many steps they would need to take to walk 10 meters and what to do to calculate 30 meters. Students should record this number in a safe place so they do not forget. See the Forms and Extras section for the Eye Level Height and Stepping Estimation Record.
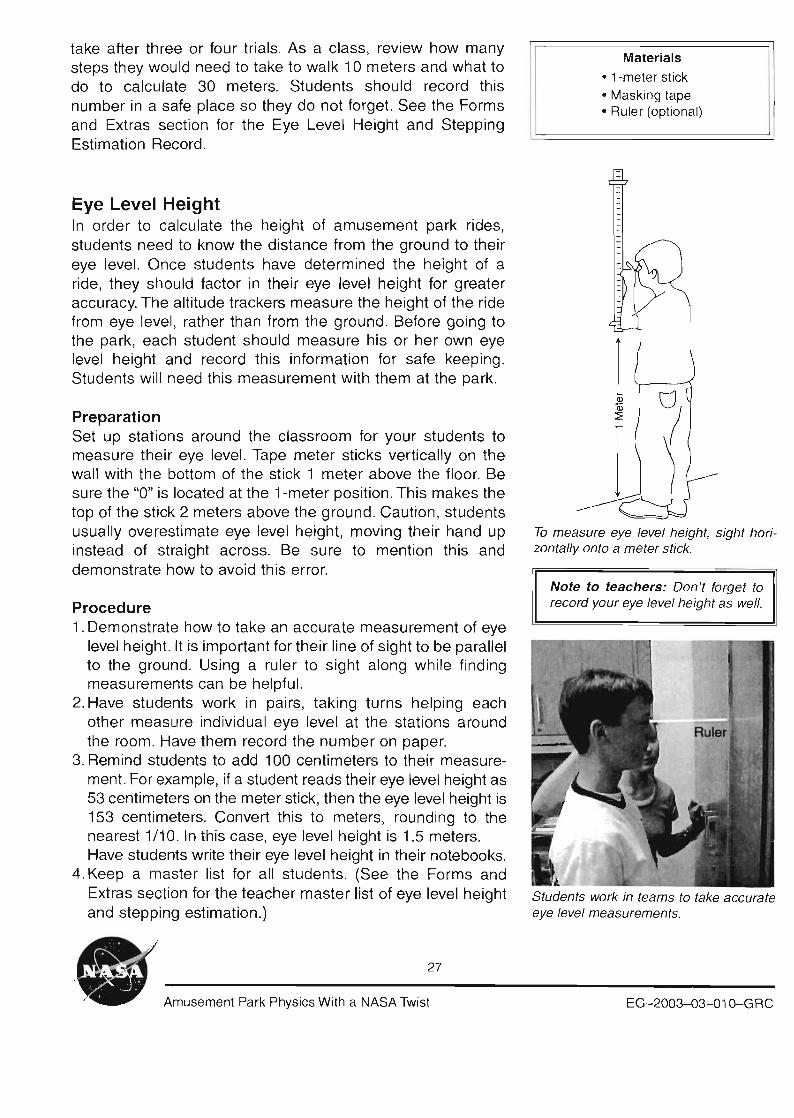
Eye Level Height In order to calculate the height of amusement park rides, students need to know the distance from the ground to their eye level. Once students have determined the height of a ride, they should factor in their eye level height for greater accuracy. The altitude trackers measure the height of the ride from eye level, rather than from the ground. Before going to the park, each student should measure his or her own eye level height and record this information for safe keeping . Students will need this measurement with them at the park.
Preparation Set up stations around the classroom for your students to measure their eye level. Tape meter sticks vertically on the wall with the bottom of the stick 1 meter above the floor. Be sure the "0" is located at the 1-meter position. This makes the top of the stick 2 meters above the ground. Caution, students usually overestimate eye level height, moving their hand up instead of straight across. Be sure to mention this and demonstrate how to avoid this error.
Procedure 1. Demonstrate how to take an accurate measurement of eye
level height. It is important for their line of sight to be parallel to the ground. Using a ruler to sight along while finding measurements can be helpful.
2. Have students work in pairs, taking turns helping each other measure individual eye level at the stations around the room. Have them record the number on paper.
3. Remind students to add 100 centimeters to their measurement. For example, if a student reads their eye level height as 53 centimeters on the meter stick, then the eye level height is 153 centimeters. Convert this to meters, rounding to the nearest 1/10. In this case, eye level height is 1.5 meters. Have students write their eye level height in their notebooks.
4.Keep a master list for all students. (See the Forms and Extras section for the teacher master list of eye level height and stepping estimation.)
Materials
• 1-meter stick • Masking tape • Ruler (optional)
To measure eye level height, sight horizontally onto a meter stick.
Note to teachers: Don't forget to record your eye level height as well.
L Students work in teams to take accurate eye level measurements.
27
Amusement Park Physics With a NASA Twist EG-2003-03-01 Q-GRC

Materials (per student pair)
• Cardboard or file folders (6 by 8 inches)
• Altitude tracker template • 6-inch length of dental floss • One washer • One straw • Glue • Scissors • Clear tape • Push pin
The altitude tracker.
Altitude Tracker To assemble sturdy altitude trackers that will withstand a trip to the amusement park follow the directions below. It is recommended that students work in pairs or groups of four at the park . In this case , the teacher will need enough supplies so each team of students has one tracker. If the teacher chooses to have the students work in a different size group, then adjust the materials accordingly.
Procedure for building the tracker 1. Glue either the right-handed or left-handed altitude
tracker template to the cardboard. 2. Cut out the template attached to the cardboard. 3. Glue the left-handed altitude tracker template to the
other side of the cardboard. 4. Use the push pin to make a hole through the dots at the
upper corners of the degree markings. 5. Tie one end of the dental floss to the washer. 6. Tie the other end of the dental floss through the hole in
the template. The dental floss needs to hang down long enough so that the washer lies beneath the words "Altitude Tracker" and above the lower edge of the cardboard. If the dental floss is too long, the washer cannot swing freely while you hold the handle of the tracker and it will not work properly.
7. Tape the straw to the top of the tracker. Position the straw between the 90° line and the top edge of the tracker. Trim the straw so that the ends of the straw do not hang over either end of the tracker.
8. To prevent the dental floss from tangling while transporting, tape the washer to one side of the tracker.
Students practice how to use the altitude tracker by measuring the height of a flagpole outside their school.
28
Amusement Park Physics With a NASA Twist EG-2003-Q3-Q1o-c RC
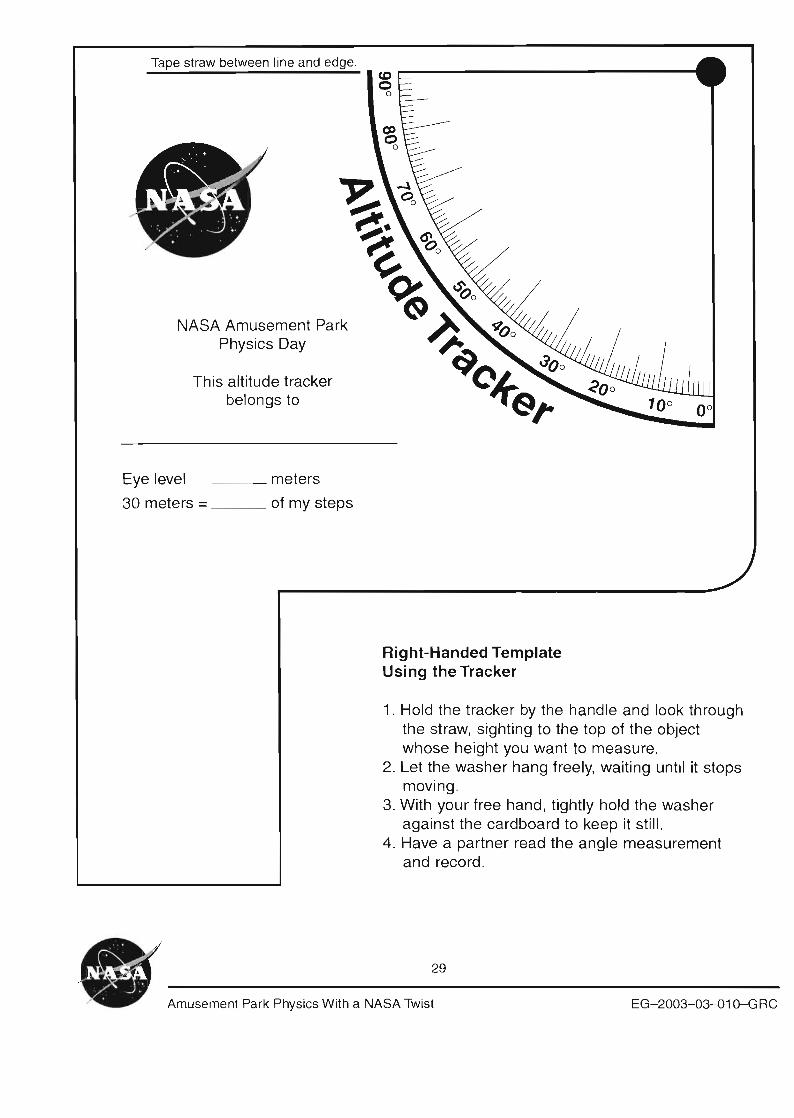
Tape straw between line and edge.
NASA Amusement Park Physics Day
This altitude tracker belongs to
Eye level ~~~~ meters
30 meters = of my steps
Right-Handed Template Using the Tracker
1. Hold the tracker by the handle and look through the straw, sighting to the top of the object whose height you want to measure.
2. Let the washer hang freely, waiting until it stops moving .
3. With your free hand, tightly hold the washer against the cardboard to keep it still.
4. Have a partner read the angle measurement and record.
29
Amusement Park Physics With a NASA Twist EG-2003-03-010-GRC
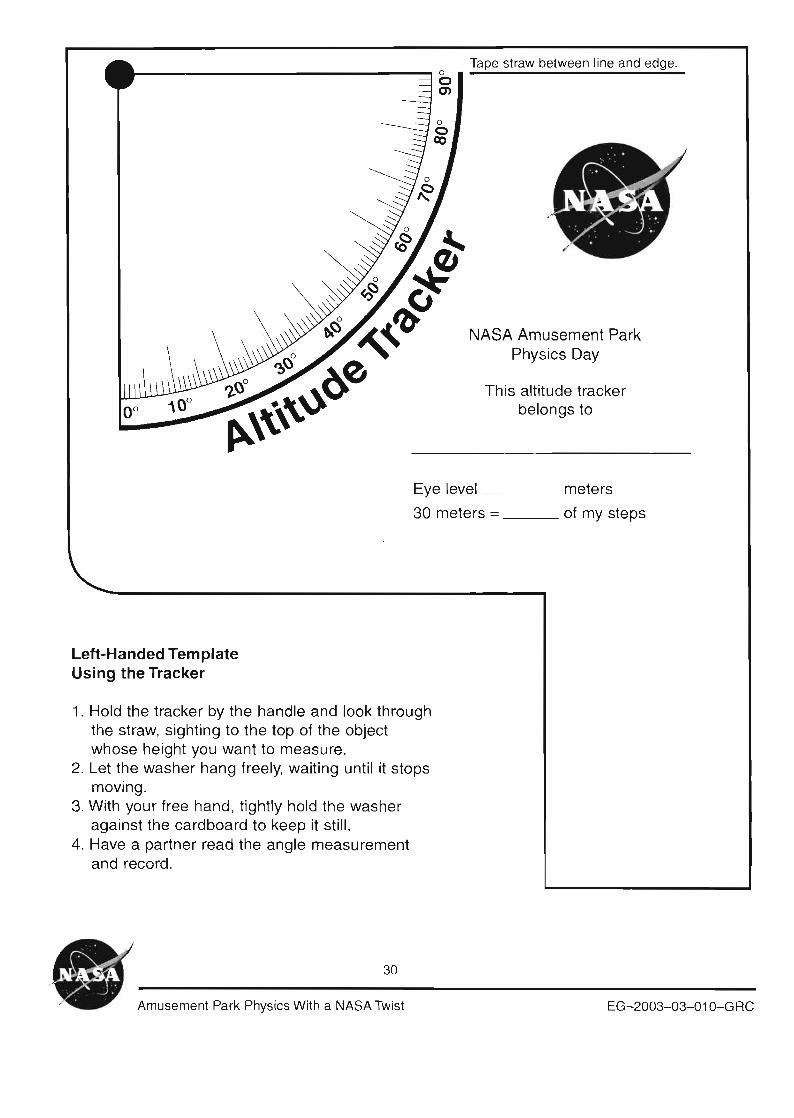
~ --,o Tape straw between line and edge. o (J)
NASA Amusement Park Physics Day
This altitude tracker belongs to
Eye level meters
30 meters = of my steps
Left-Handed Template Using the Tracker
1. Hold the tracker by the handle and look through the straw, sighting to the top of the object whose height you want to measure.
2. Let the washer hang freely, waiting until it stops moving.
3. With your free hand, tightly hold the washer against the cardboard to keep it still.
4. Have a partner read the angle measurement and record.
30
Amusement Park Physics With a NASA Twist EG-2003-03-010-GRC
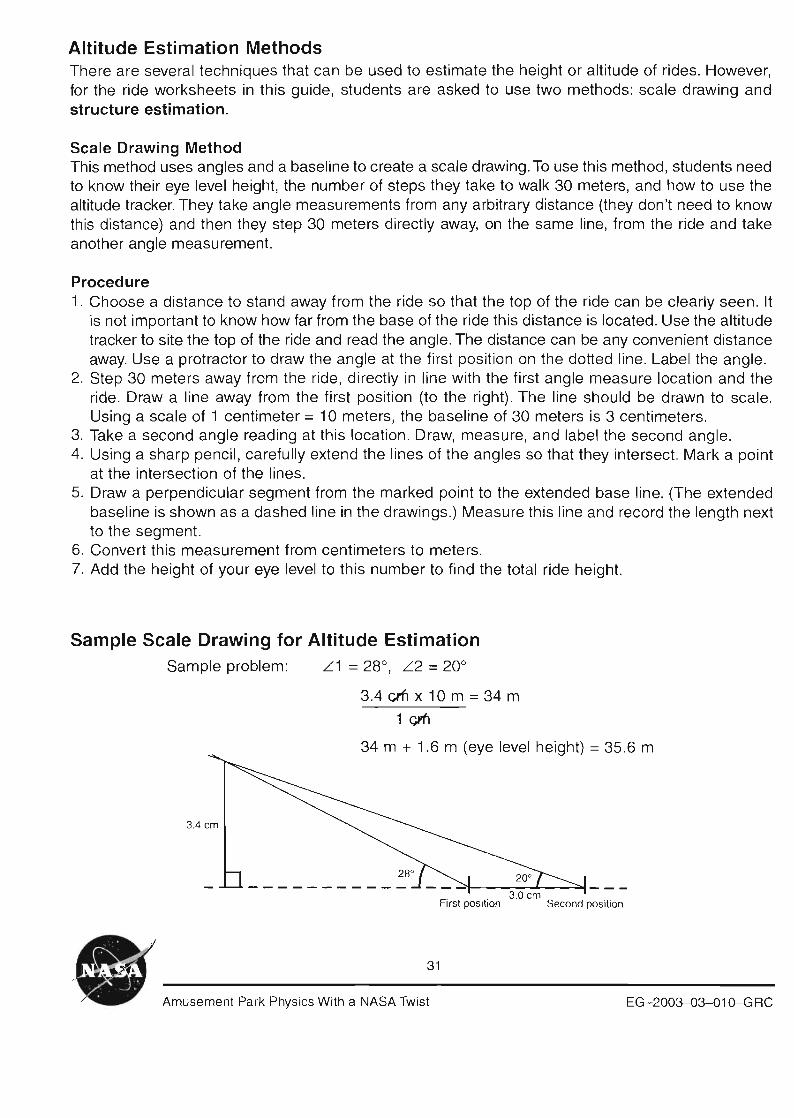
Altitude Estimation Methods There are several techniques that can be used to estimate the height or altitude of rides. However, for the ride worksheets in this guide, students are asked to use two methods: scale drawing and structure estimation.
Scale Drawing Method This method uses angles and a baseline to create a scale drawing. To use this method, students need to know their eye level height, the number of steps they take to walk 30 meters, and how to use the altitude tracker. They take angle measurements from any arbitrary distance (they don't need to know this distance) and then they step 30 meters directly away, on the same line, from the ride and take another angle measurement.
Procedure 1. Choose a distance to stand away from the ride so that the top of the ride can be clearly seen. It
is not important to know how far from the base of the ride this distance is located. Use the altitude tracker to site the top of the ride and read the angle. The distance can be any convenient distance away. Use a protractor to draw the angle at the first position on the dotted line. Label the angle.
2. Step 30 meters away from the ride, directly in line with the first angle measure location and the ride. Draw a line away from the first position (to the right). The line should be drawn to scale. Using a scale of 1 centimeter = 10 meters, the baseline of 30 meters is 3 centimeters.
3. Take a second angle reading at this location. Draw, measure, and label the second angle. 4. Using a sharp pencil, carefully extend the lines of the angles so that they intersect. Mark a point
at the intersection of the lines. 5. Draw a perpendicular segment from the marked point to the extended base line. (The extended
baseline is shown as a dashed line in the drawings.) Measure this line and record the length next to the segment.
6. Convert this measurement from centimeters to meters. 7. Add the height of your eye level to this number to find the total ride height.
Sample Scale Drawing for Altitude Estimation Sample problem: L1 = 28°, L2 = 20°
3.4cmx10m=34m
1 G1fl
34 m + 1.6 m (eye level height) = 35.6 m
3.4 cm
First position Second position
31
Amusement Park Physics With a NASA Twist EG-2003-03-010-GRC

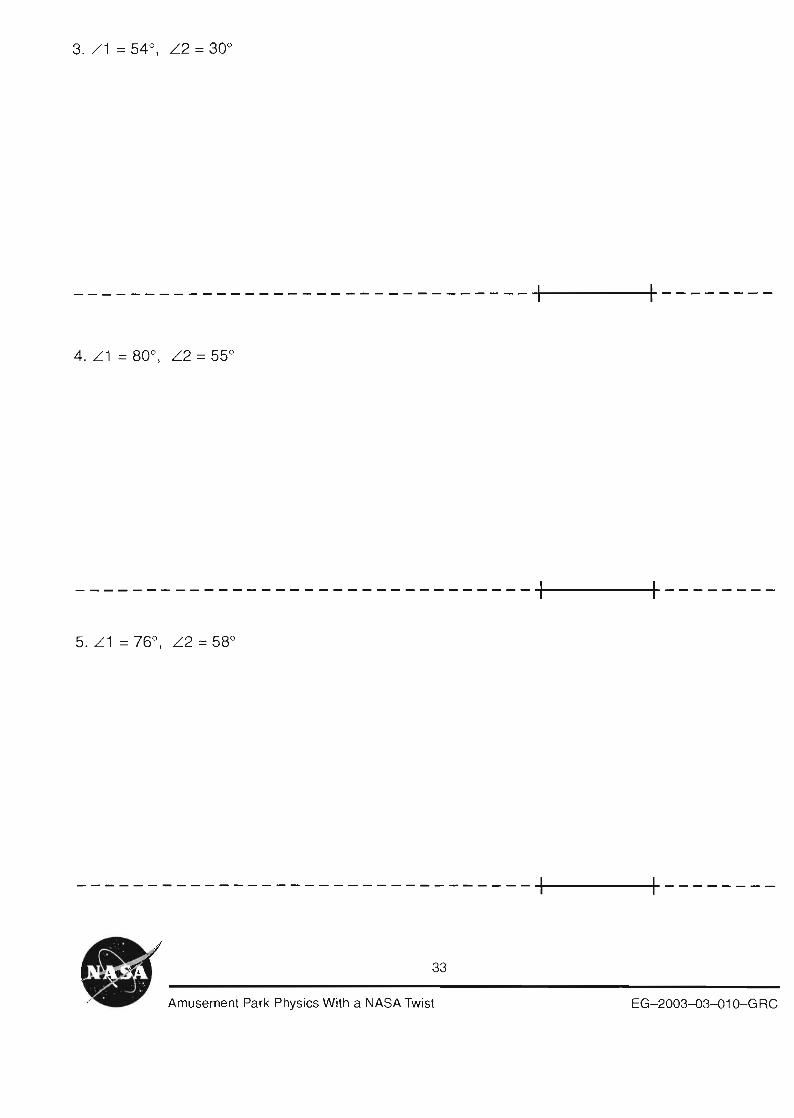
Altitude Tracker Worksheet Procedure Use a sharp pencil and a protractor to draw two angles 3 centimeters apart. Label the two angles. Find the point of intersection of the two rays of the angle. Draw a perpendicular line to the baseline from this intersection point to the extended baseline of the angles. Measure this distance in centimeters. Convert this number to meters using a scale of 1 centimeter = 10 meters. Add in an eye level height of 1.2 meters. See the example shown below.
Example: L 1 =50°, L 2 =35°
5.2 cm x 10m = 52.0 m + 1.2 m
53.2 m
Determine the height of an object using the above procedure. Assume that the angles were measured using the altitude tracker.
--------------------------------1~------r--------
--------------------------------1~----~r--------
32
Amusement Park Physics With a NASA Twist EG-2003-03-010-GRC
--------------------------------1~------~--------
--------------------------------1~-----~--------
--------------------------------1~------~--------
33
Amusement Park Physics With a NASA Twist EG-2003-Q3-Q10-GRC

Flagpole Height Worksheet
Measure the height of the school flagpole using the scale drawing method. See diagram shown. Use the space below to make your drawings.
1. Use the altitude tracker to site to the top of the flagpole and read the angle. Record the angle measure. _
2. Draw the angle using the line segment at the bottom of the page. Using a protractor, draw the angle on the line segment at the bottom of this page . Label this angle.
3. Step 30 meters away from the flagpole. 4. Draw a baseline to represent 30 meters .
The line should be drawn to scale. Using 1 centimeter = 10 meters, the baseline is 3 centimeters. Second angle First angle
~ Eye level
5. Measure the second angle and record height
its measure. _
6. Draw and label the second angle. -e - 30-m baseli ne
7. Carefully extend the lines of the angles with a sharp pencil , until the lines intersect. Mark the intersection with a point.
8. Draw a perpendicular line from the point of intersection to the extended baseline. Measure and record this segment. _
9. Convert the measurement from centimeters to meters. _ 10. Add your eye level height to find the total flagpole height. Write your final answer here. _
Draw your angles on this line segment.
34
Amusement Park Physics With a NASA Twist EG-2003-Q3-Q1o-GRC
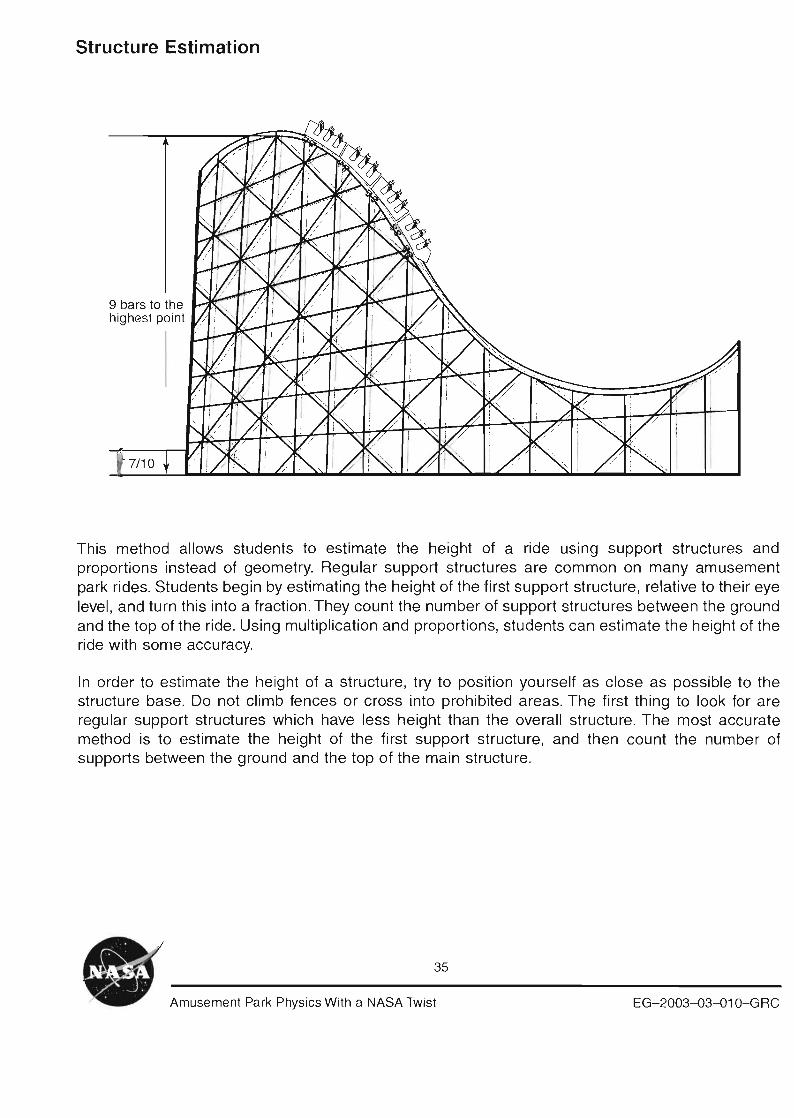
Structure Estimation
9 bars to the highest point
This method allows students to estimate the height of a ride using support structures and proportions instead of geometry. Regular support structures are common on many amusement park rides. Students begin by estimating the height of the first support structure, relative to their eye level, and turn this into a fraction .They count the number of support structures between the ground and the top of the ride. Using multiplication and proportions, students can estimate the height of the ride with some accuracy.
In order to estimate the height of a structure, try to position yourself as close as possible to the structure base. Do not climb fences or cross into prohibited areas. The first thing to look for are regular support structures which have less height than the overall structure. The most accurate method is to estimate the height of the first support structure, and then count the number of supports between the ground and the top of the main structure.
35
Amusement Park Physics With a NASA Twist EG-2003--D3-010-GRC

Procedure 1. Sight the height of your eye level to a target point on the first
structure nearest the ground using the sighting tube on the altitude tracker. Be sure to hold the altitude tracker level aligned horizontally while doing this. Make note of the target point on the structure. This target point is your eye level height. See diagram shown.
2. Estimate the fraction of the target point to the height of the first support structure, to the nearest 1/10. This may take some practice to be able to do accurately. For example, in the diagram shown, a good estimate would be 7/10 the height of the first support structure. This fraction is called the span fraction.
3. Use formula H (support structure) = eye level height/span fraction to estimate the overall height of the support structure. In this example, if your eye level height was 1.4 meters, then H = 1.4 meters/0.7 = 2 meters, then you would have estimated the support structure to be 2 meters.
4. Count the number of these structures to the highest point and multiply the height, or H, by the number of structures. In this example, you would multiply 2 meters by 9 to get 18 meters in height.
Summarizing the measurements in the above example: The overall height of the ride = number of structures x H
= number of structures x eye level height/span fraction
= 9 x (1.4 meters/(7/1 0)) = 9 x (1.4 meters/0.7) = 9 x 2 meters = 18 meters
Note: When calculating distances, students often progress through the steps without considering whether their final answer is reasonable. One might consider having them estimate the height of the school building by counting rows of bricks, and multiplying this number by the height of each brick. Have them compare this height to the height they computed for the flagpole. Ask them to determine, based on their calculations, which is taller, the school building or the flagpole? Is this a reasonable outcome?
36
Amusement Park Physics With a NASA Twist EG-2003-03-010-GRC
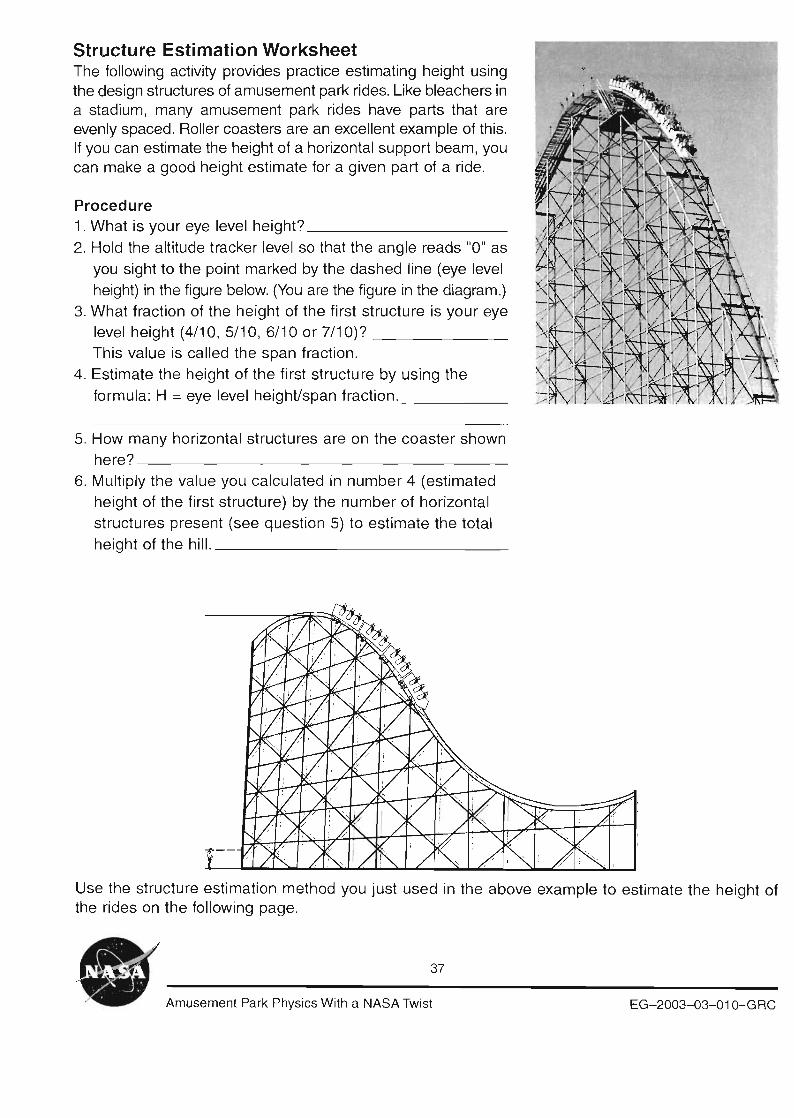
Structure Estimation Worksheet The following activity provides practice estimating height using the design structures of amusement park rides. Like bleachers in a stadium, many amusement park rides have parts that are evenly spaced. Roller coasters are an excellent example of this. If you can estimate the height of a horizontal support beam, you can make a good height estimate for a given part of a ride.
Procedure 1. What is your eye level height? _
2. Hold the altitude tracker level so that the angle reads "0" as you sight to the point marked by the dashed line (eye level height) in the figure below. (You are the figure in the diagram.)
3. What fraction of the height of the first structure is your eye level height (4/10, 5/10, 6/10 or 7/10)? _ This value is called the span fraction.
4. Estimate the height of the first structure by using the formula: H = eye level height/span fraction. _
5. How many horizontal structures are on the coaster shown here? _
6. Multiply the value you calculated in number 4 (estimated height of the first structure) by the number of horizontal structures present (see question 5) to estimate the total height of the hill. _
Use the structure estimation method you just used in the above example to estimate the height of the rides on the following page.
37
Amusement Park Physics With a NASA Twist EG-2003-03-01o-GRC
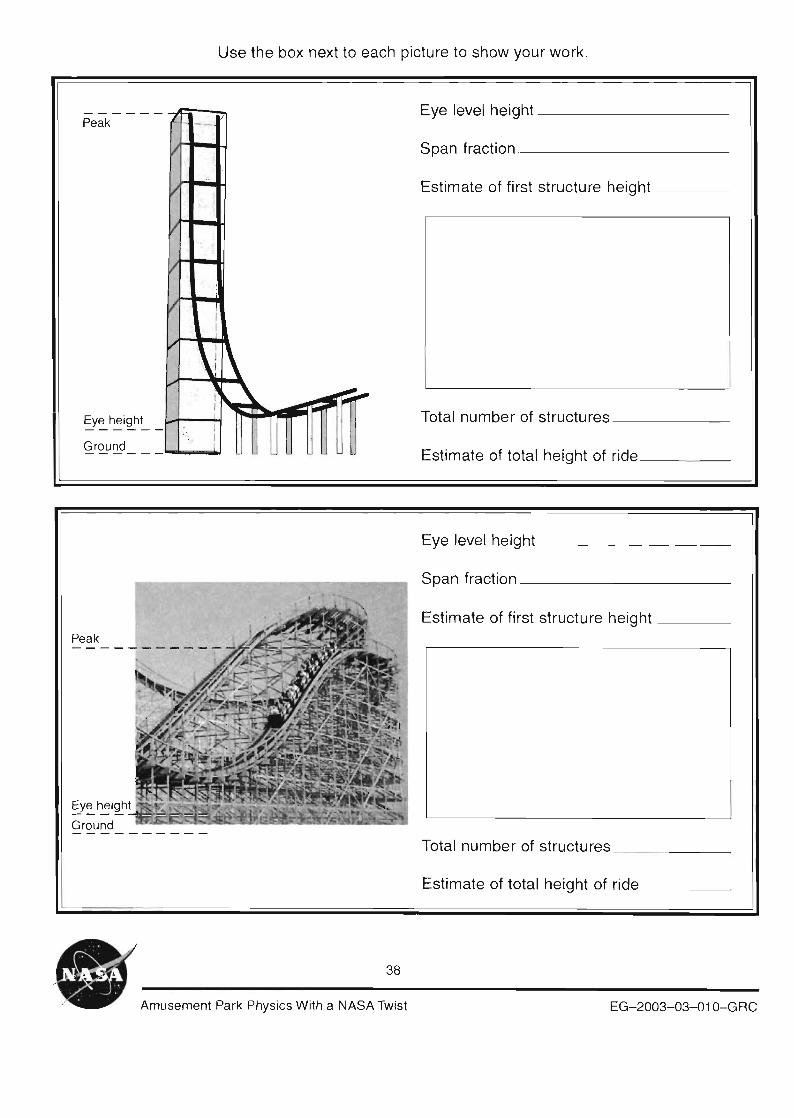
Use the box next to each picture to show your work.
----- z __Peak
v
/ -
Eye height
v v
I
!
~\ ~"" ,I ... • ....,
_ _ _ _ _ _ "-"'=;;;;;W Ground
Eye level height
Span fraction
Estimate of first structure height
Total number of structures
Estimate of total height of ride
_
_
_
_
_
Eye level height
Span fraction
Estimate of first structure height
Total number of structures
Estimate of total height of ride
_
_
_
_
_
38
Amusement Park Physics With a NASA Twist EG-2003-03-010-GRC

Accelerometer A vertical accelerometer is a simple tool that can measure the upward and downward accelerations of a ride in terms of Earth's gravity (g). At rest , the accelerometer registers 1 g, or normal Earth gravity. Earth 's gravitational attraction will pull the spring to the 1-g position. Measurements will range from -4 to 4 g on amusement park rides . You can make your own accelerometers by following these directions, or you can order an amusement park kit from a scientific supply catalog. Finding the tubes may present a problem, although thermometers are shipped in these tubes. If you plan to order a kit, allow plenty of time for delivery.
Procedure-Spring-Mass Assembly 1. Attach the mass to one end of the spring. Be careful not
to stretch the spring out of shape. 2. Bend the paper clip into a "V" shape, as shown in figure 1. 3. Poke two holes in one end cap, as shown in figure 2. 4. Thread the paper clip through the end of the spring with
out the weight, as shown in figure 3. 5. Thread the paper clip (with the spring and mass) through
the holes inside the cap. Bend the wires down the cap sides. Trim the excess wire (see fig . 4).
Calibration 1. Put the spring, mass, and cap into the tube. Hold the tube
vertically (see fig. 5). 2. Carefully wrap the red tape around the tube level with the
bottom of the weight. Use a narrow width of red tape. This marks the 1-g position. At the top of the tube, draw a small upward arrow.
3. Remove the cap, mass, and spring from the tube. 4. Tie a second mass to the end of a string. Thread the
other end of the string to the loop of the spring holding the first mass. Do not tie the string tightly because you will have to untie it shortly.
5. Replace the cap, spring, masses, and string through the tube. Be sure the tube has the arrow pointing up.
6. Wrap another narrow piece of red tape around the tube level with the bottom of the weight. This marks the 2-g position (see fig. 6).
7. Remove the cap, masses, string, and spring from the tube. Untie the string/mass from the spring. Give the string/mass to the another pair of students for calibration.
39
Materials (per student pair)
• Plastic thermometer tube • Rubber band (large) • Two end caps • Two masses or fishing sinkers
(1 .5 ounces) • Spring • Red tape (1/8 inch wide) • Paper clip • White duct tape or masking tape
(1/2 inch wide) • Push pin • String (12 inches) • Scissors • Pliers • Permanent marker
Figure 1. Figure 2.
Figure 4.
Figure 3.
Figure 5.
Amusement Park Physics With a NASA Twist EG-2003-03-01O-GRC

1-g position
2-g position
Figure 6.
O-g position
1-g position
2-g position
3-g position
4-g position
8. Measure the distance between the two pieces of red tape. Measure from the top of both pieces of tape.
9. Use this distance to measure and mark positions for 0, 3, and 4 g with red tape (see fig. 7).
10. To make reading the g loads easier to see on the rides, number the markings. Write 0 to 4 on a strip of paper and tape them in place with white duct tape or masing tape. An alternative is to write the numbers on the sticky side of the tape with a permanent marker. Note , if possible, write the numbers 2 to 4 backwards.
11. Fully assemble the vertical accelerometer with both end caps and the spring-mass system in the tube.
12. Use duct tape to seal the end caps, cover the paper clip ends , and attach the rubber band tether to the tube (see fig. 8).
Note: Amusement parks may have rules about what types of measuring devices, such as accelerometers, they will allow on rides. Be sure to call and check in advance. Most parks require a tether to be used with the devices for ride safety considerations.
Figure 7. Figure 8.
40
Amusement Park Physics With a NASA Twist EG-2003-03-010-GRC

Errors in Measurement Whenever something such as the thickness of a book or the length of a table is measured, there is always error involved in the measurement process. It doesn't mean that the person performing the measuring has measured it wrong. It is inherent in the measuring process. No measuring device is or can be 100 percent precise. For example, if one is using a ruler to measure length, and the smallest division on the ruler is 1/8 of an inch, the precision of that ruler is 1/8 of an inch. If the smallest division is 1/16 of an inch, then the precision is 1/16 of an inch. Notice that by dividing the ruler into more divisions, the greater the precision, but it can never measure anything perfectly. This is not possible for any measurement tool. For this to be so, the tool would have to have an infinite number of divisions. Because we are always limited to finite-scale measuring instruments, there will always be an associated uncertainty called error. Also, remember that if your ruler only measures with a precision of 1/8 of an inch, you cannot state that you found a length to the nearest 1/16. Your measurement device will not allow you to have that high of a precision.
Since some tools have more divisions than others, some are more precise than others. Using more precise tools means that one's answer is a better estimate of the actual length, but it is still an estimate. At the amusement park, the tools used to perform these activities are not very precise. They only give a rough estimate of the actual measurements allowing the student to make observations and predictions based on patterns.The answer key and the measures and values that are found are also not exact.The teacher should expect to have answers that are in the range of those found in the key.
In some instances the student will be pacing to find some distances, using estimation of structures, and using eye level for height. Because they will not be using a standardized measurement device, such as a ruler, expect a large amount of error. Every time the student records a measurement, consider the possible sources of error. By increasing the number of times that he or she takes a measurement, the average or mean value of these measurements will more closely resemble the actual value of the quantity he or she is trying to measure assuming that the student used the tool correctly.This is because he or she is just as likely to measure a value that is slightly too high as one that is too low, therefore, these errors will "average themselves out."
If a value that is recorded involves an estimate that is to be multiplied with another estimated value, the error is multiplied also. This is called error propagation, and it can be significant, especially when there are several steps of measurements multiplied within a problem. It cannot be avoided, but be aware that along with the measurements, the error continues to be multiplied and it is inherent in the final value.
As an example, if the students want to measure the base of a roller coaster hill, they would pace off the distance, using their pacing distance. If they estimate that two of their steps is about a meter in length, there is some error in this measurement. Also, they may not take the same size steps each time. So when they walk a 3D-meter baseline, this error increases. However, the longer the distance, the more likely the short and long steps will average themselves out, thus giving them a better overall estimate. The use of the altitude tracker to measure the height of a structure can allow for more errors. Did they look through the same part of the hole; did they sight to the top of the structure at the same point each time-in other words, were they consistent when taking their measurements? This gives the student some idea of why there is no "exact" answer when taking measurements. Scientists and researchers always try to reduce the error as much as possible, but some error is always present.
41
Amusement Park Physics With a NASA Twist EG-2003-03-01 Q-GRC

42
Amusement Park Physics With a NASA Twist EG-2003-03-010-GRC