Embed Size (px)
Citation preview

Copyright © Cengage Learning. All rights reserved.
Amplitude, Reflection, and
Period
SECTION 4.2

Find the amplitude of a sine or cosine function.
Find the period of a sine or cosine function.
Graph a sine or cosine function having a
different amplitude and period.
Solve a real-life problem involving a
trigonometric function as a model.
1
Learning Objectives
2
4
3

Amplitude
Question: What effect will multiplying a trigonometric
function by a positive numerical number (factor) A has on
the graph?
Answer: The graph of y = A sin x and y = A cos x are the
same as the graph of y = sin x and y = cos x, respectively,
stretched vertically by a factor of A if A>1 and compressed
by a factor of A if A<1
Examples: Analyze the graphs of y = 2 sin x and
y = (1/2) sin x

Example 1
Sketch the graph of y = 2 sin x. for 0 x 2 and analyze
the graph.
Solution:
The coefficient 2 on the right side of the equation will
simply multiply each value of sin x by a factor of 2.
Therefore, the values of y in y = 2 sin x should all be twice
the corresponding values of y in y = sin x.

Example 1 – Solution
Table 1 contains some values for y = 2 sin x.
Table 1

Figure 1 shows the graphs of y = sin x and y = 2 sin x. (We
are including the graph of y = sin x simply for reference and
comparison. With both graphs to look at, it is easier to see
what change is brought about by the coefficient 2.)
Figure 1

The coefficient 2 in y = 2 sin x changes the amplitude from
1 to 2 but does not affect the period. That is, we can think
of the graph of y = 2 sin x as if it were the graph of y = sin x
stretched by a factor of 2, so the amplitude extended to 2
instead of 1. Observe that the range has doubled from
[–1, 1] to [–2, 2].
Example 2: Sketch the graph of y = 1/ 2 sin x and analyze
the graph.
2π
π
2π
π
Example 3: Repeat both examples for y = cos x
2π π

Amplitude

Reflecting About the x-Axis
Question: What effect will multiplying a trigonometric
function by a negative numerical number (factor) A has on
the graph?
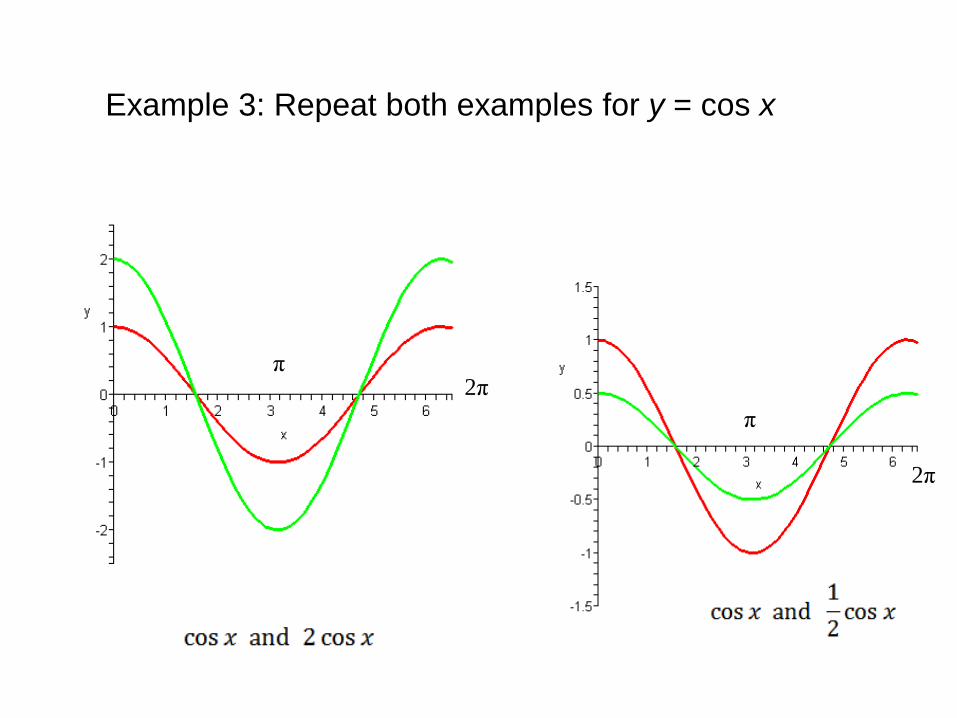
Answer: Let A<0.The graph of y = A sin x and y = A cos x
are the same as the graph of y = sin x and y = cos x,
respectively, stretched (or compressed) vertically by a
factor of A and then reflected about the x-axis.
Example 3: Analyze the graphs of y = -2 sin x and
y = (-1/2) sin x

Reflecting About the x-Axis

Period
Up to this point we have considered the effect that a
coefficient, which multiplies the trigonometric function, has
on the graph.
Question: What happens if we allow the input variable, x
(called the argument) to have a coefficient B, i.e., how do
graphs of y= sin(Bx) and y = cos(Bx) look like?
Answer: we answer the question by an example.

Example 4
Graph y = sin 2x for 0 x 2.
Solution:
To see how the coefficient 2 in y = sin 2x affects the graph,
we can make a table in which the values of x are multiples
of /4. (Multiples of /4 are convenient because the
coefficient 2 divides the 4 in /4 exactly.)

Example 4 – Solution
Table below shows the values of x and y, while Figure 4
contains the graphs of y = sin x and y = sin 2x.

The graph of y = sin 2x has a period of . It goes through
two complete cycles in 2 units on the x-axis. So doubling
the argument of the function has the reverse effect of
halving the period.
We know that the sine function completes one cycle when
the input value, or argument, varies between 0 and 2.
So, because of the factor of 2, the period is now and the
graph will complete 2 cycles in 2 units.

So in general, for y = sin Bx or y = cos Bx the period is
determined as following
The period will be 2 /B, and the graph will complete
B cycles in 2 units.

We summarize all of the information gathered from the
previous example as follows.
In the situation where B < 0, we can use the properties of
even and odd functions to rewrite the function so that B is
positive.

Example 5
Graph
Solution:
Because cosine is an even function,
Construct a Frame
The amplitude is 4, so –4 y 4.

We use the amplitude to determine the position of the
upper and lower sides of a frame that will act as a
boundary for a basic cycle.
Next we identify one complete cycle.
The end points of the cycle give us the position of the left
and right sides of the frame.

Figure below shows how this is done.
Subdivide the Frame
The period is 3. Dividing by 4 gives us 3 /4, so we will
mark the x-axis in increments of 3 /4.

We already know where the cycle begins and ends, so we
compute the three middle values:
We divide our frame in Figure 7 into four equal sections,
marking the x-axis accordingly. Figure 8 shows the result.
Figure 8
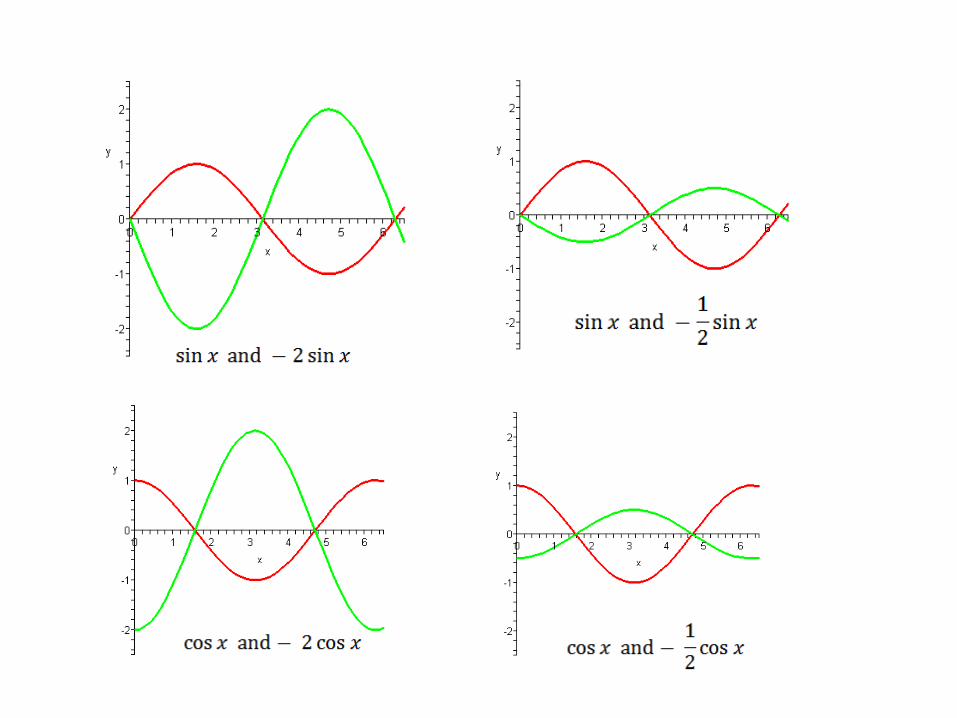
Graph One Cycle
Now we use the frame to plot the key points that will define
the shape of one complete cycle of the graph and then
draw the graph itself (Figure below).

Example 7 – Solution
Extend the Graph, if Necessary
The original problem asked for the graph on the interval
We extend the graph to the right by adding the first quarter
of a second cycle.
On the left, we add another complete cycle (which takes
the graph to –3) and then add the last quarter of an
additional cycle to reach –15 /4.

Example 7 – Solution
The final graph is shown in Figure below.