Embed Size (px)
Citation preview

1
Amplitude-Modulation Characteristics of Power-Combining
Class-E Amplifier with Finite Choke
Mury Thian and Vincent Fusco
Queen’s University Belfast, ECIT Institute
Queen’s Road, Queen’s Island
Belfast BT3 9DT
United Kingdom
P: +44 (0)28 9097 1808
F: +44 (0)28 9097 1702
Abstract: Power back-off performances of a new variant power-combining Class-E
amplifier under different amplitude-modulation schemes such as continuous wave
(CW), envelope elimination and restoration (EER), envelope tracking (ET), and
outphasing are for the first time investigated in this paper. Finite dc-feed inductances
rather than massive RF chokes as used in the classic single-ended Class-E power
amplifier (PA) resulted from the approximate yet effective frequency-domain circuit
analysis provide the wherewithal to increase modulation bandwidth up to 80% higher
than the classic single-ended Class-E PA. This increase modulation bandwidth is
required for the linearity improvement in the EER/ET transmitters. The modified
output load network of the power-combining Class-E amplifier adopting three-
harmonic terminations technique relaxes the design specifications for the additional
filtering block typically required at the output stage of the transmitter chain.
Qualitative agreements between simulation and measurement results for all four
schemes were achieved where the ET technique was proven superior to the other
schemes. When the PA is used within the ET scheme, an increase of average drain
efficiency of as high as 40% with respect to the CW excitation was obtained for a
multi-carrier input signal with 12dB peak-to-average power ratio.
Key words: Amplitude modulation, Class E; envelope elimination and restoration
(EER); envelope tracking (ET); high efficiency; outphasing; power amplifier; power
combining; transformer; transistor circuits; transmission line.

2
1. Introduction
Future wireless mobile communications are required to transfer different types of data
ranges from image and voice to high-definition videos at ultra high speed. This
requires deployment of not only wideband transmitters but also advanced digital
modulation techniques with high spectral-efficiency feature such as CDMA.
However, these modulation techniques typically have rather stringent requirements
for the power amplifier (PA) linearity. On the other hand, high-efficiency
amplification is required so as to increase talk time, reduce power dissipation, and
improve reliability of the battery-operated wireless handsets. Conventional linear PAs
such as Class-A suffer from poor efficiency while non-linear switching-mode PAs
such as Class-E [1] only offer high efficiency at peak-envelope power (PEP) at which
point linearity is poor. As the Class-E PA is operated at back-off where the linearity is
considerably better, the efficiency rapidly drops. Different types of predistortion
techniques such as memory polynomial [2] and Volterra [3] can be applied to the non-
linear PAs so as to improve their linearity but at the expense of increased system
complexity.
To arrive at a compromise between linearity and efficiency at high frequencies,
classical schemes such as envelope elimination and restoration (EER) [4]-[6],
envelope tracking (ET) [7]-[9], and outphasing [10]-[13] can be effectively utilized.
In the EER transmitter the amplitude- and phase-modulated input signal is separated
into two signals: (1) a constant-amplitude phase-modulated carrier and (2) an
envelope signal. The phase-modulated carrier goes to the non-linear high-efficiency
PA such as Class D, E, F while the envelope signal modulates the collector/drain of
the PA so that an amplified replica of the input signal can be restored. The ET scheme
is similar to the EER technique. The main differences are (i) the PA used is linear and
(ii) the RF drive signal contains both amplitude and phase information. Outphasing,
also known as LInear amplification using Nonlinear Components (LINC), produces
amplitude-modulated signal based on vector summation principle where the output of
two PAs driven with signals of different time-varying phases are combined using
quarter-wave lines. The analysis in [14] shows that when deployed in the EER/ET
transmitter, the conventional Class-E PA generates significantly high intermodulation

3
distortion (IMD) since large RF choke used in the classic Class-E circuit limits the
modulation bandwidth. To improve the IMD performance, a small RF choke must be
used instead.
In order to obtain larger output power from a PA for better signal-receiving ability,
larger transistors should be deployed. However, in the classical single-stage Class-E
PA, this strategy is critically constrained by the optimum shunt capacitance resulted
from the Class-E synthesis since at high frequencies this capacitance is typically
smaller than the actual output capacitance of a large device. Push-pull configurations
can be adopted to obtain large output power. However, an output transformer is
required in order to operate into an unbalanced load. This solution is not very
attractive since transformers are bulky and consume a large chip area in MMIC
implementations. More critically, it is very challenging to design low loss (high Q-
factor) transformers particularly in Si-based technology due to substantial dielectric
loss.
The Class-E PA topology recently introduced in [15] overcomes the aforementioned
problems. It uses small RF chokes (LDC) useful for the EER and ET schemes and also
facilitates an elegant means for power combining into an unbalanced load without the
need for bulky transformers so as to obtain large output power that would not be
possible from the classic Class-E due to the shunt-capacitance limitation. No
experimental validation was presented in [15].
Small RF chokes increases modulation bandwidth ωAM
DC
DCAM
L
R=ω (1)
O
DC
DC
DCDC
P
V
P
VR
22
== (2)
where RDC is the resistance that the amplifier presents to the dc supply. DC power
dissipation PDC is set equal to output power PO in (2) since 100% dc-to-rf efficiency is
expected from the idealized Class-E PA design. Design equations for LDC in the

4
single-ended [1] and power-combining [15] Class-E amplifiers are given in Table 1
where k > 30 and γ = 2.3305. It appears that the ratio of 3dB modulation bandwidth
and carrier frequency of the power-combining circuit is as high as 86% compared to
just 1% in the classical Class-E.
Table 1 Design equations for RF choke (LDC) and modulation bandwidth (ωAM)
Parameter Single-ended Power-combining
DCL
Oo
DC
P
Vk
ω
π 2
Oo
DC
P
V
ω
γ
2
2
o
AM
ω
ω
kπ
1
γ
2
The previous theoretical analysis on the power-combining amplifier circuit focuses on
the performance of the amplifier with regard to efficiency alone but without
considering out-of-band emission restrictions. In order to comply with the
standardized out-of-band emission regulations, additional filtering block is typically
needed at the output of the final stage. A modified output load network of the power-
combining Class-E is described in this paper so as to relax the requirement for the
filter in the transmitter chain. Furthermore, it will be demonstrated that for the same
output power level and dc supply voltage, the load resistance resulted from the new
circuit’s synthesis is larger than the classical Class-E circuit. This crucially reduces
the loss due to the output matching network and consequently increases the overall
circuit efficiency. The aim of this paper is to investigate the amplitude-modulation
(AM) characteristics of the modified power-combining Class-E amplifier when
operated in the EER, ET and outphasing schemes.
2. Power-Combining Class-E Amplifier
In Class-E mode, the active device (either bipolar transistor or FET) is driven
sufficiently hard to mimic a switch rather than a current source as in the conventional
linear PAs. For an optimum Class-E operation, the load impedances presented to the
transistor are R + jω0L at fundamental frequency and open circuit at harmonics [16].
Techniques to combine two or more output of the single-ended Class-E PAs into an

5
unbalanced load using quarter-wave (λ/4) transmission lines are illustrated in Fig.
1(a). The optimum Class-E load resistance R [16] is transformed into the system
impedance (Rα which is typically 50 Ω) by the λ/4 lines. The λ/4 lines in Fig. 1(a) are
then replaced by the equivalent hybrid Π-circuits comprised of a transmission line
with characteristic impedance Z01 and electrical length θ1 (θ1 < 90o) and shunt
capacitors CX1, CX2. The large RF chokes (RFC) in Fig. 1(a) are substituted by finite
dc-feed inductances (LDC). The series inductance L in the load network is removed by
properly assigning its inductive loading to LDC. This results in the circuit in Fig. 1(b).
The capacitance CX2 in Fig. 1(b) can be replaced by the equivalent open-circuit stub
TL2 (Z02, θ2). This stub together with the series line TL1 (Z01, θ1) should provide an
open-circuit termination at 2fo as required for Class-E mode. This dictates the
electrical lengths of TL1 and TL2 to be equal to 90o at 2fo. The series resonator LS –
CS in Fig. 1(b) can be removed since its filtering function (i.e. to suppress the
dominant second-harmonic signal) has now been taken over by TL1 and TL2. In
addition, CX1 and LDC in Fig. 1(b) should resonate at 2fo. This results in the circuit in
Fig. 1(c). Cb is bypass/dc blocking capacitance. For prescribed output power (PO),
operating frequency (f0), and dc supply voltage (VDC), the optimal circuit component
values of the power-combining Class-E PA are given as follows:
2
DCo
O
V
PC
ωπ= (3)
212 DCo
OX
V
PC
γω= (4)
Oo
DCDC
P
VL
ω
γ
2
2
= (5)
( ) O
DC
PN
VR
2
2 4
64 γ
ππβ
−= (6)
ODC PVZZ /2 2
0201 γ== (7)
where N is the number of single-ended Class-E PA combined.

6
(a)
(b)
(c)
Figure 1 (a)-(c) show the circuit evolution from the initial two single-ended Class-E
combined using λ/4 lines to the final power-combining Class-E
The shunt capacitance C + CX1 in Fig. 1(c) may now be seen as the device output
capacitance. When compared to the classic Class-E where the device output
capacitance is C, the extra capacitance CX1 present in the new power-combining
Class-E circuit suggests that larger transistors (larger output capacitance) can be
utilized to permit larger power at the output of individual PAs. Alternatively from (3)-
(4), it can be computed that the maximum operating frequency of the conventional

7
Class-E PA can be extended up to 67% higher by adopting the power-combining
technique explained above.
Using (6), the optimum load resistance for, say, a 1.5W–3V power-combining PA
with three parallel branches (N = 3) is 48.5Ω, close to the typical load impedance
50Ω. In contrast, the optimum load resistance for the classic Class-E amplifier [16] is
as small as 3.5Ω, leading to an increase loss due to the output matching network.
3. Design and Implementation
In order to better comply with standardized out-of-band emission regulations, two λ/8
open-circuit stubs (Z02, θ2) in Fig. 1(c) are modified in such that they can vigorously
suppress not only the second- but also the third-harmonic components. The new
electrical lengths (θ2A, θ2B) are λ/8 and λ/12 at fundamental frequency and the
characteristic impedance is given as follows
( ) 020202 45tan30tan5.0 ZZZoo
BA +== (8)
(a) (b)
Figure 2 (a) Power-combining Class-E with finite choke and (b) single-ended Class-
E with λ/4-line choke.
A 2.4GHz power-combining Class-E PA with two parallel branches (N = 2) was
designed using MwT-8 GaAs MESFETs based upon Fig. 1(c). Surface-mount
technology (SMT) inductors of 2.2nH are used to implement the finite RF choke. Fig.
2(a) shows the PA fabricated on 7cmx4.7cm, 787µm thick FR4 substrate with a
8
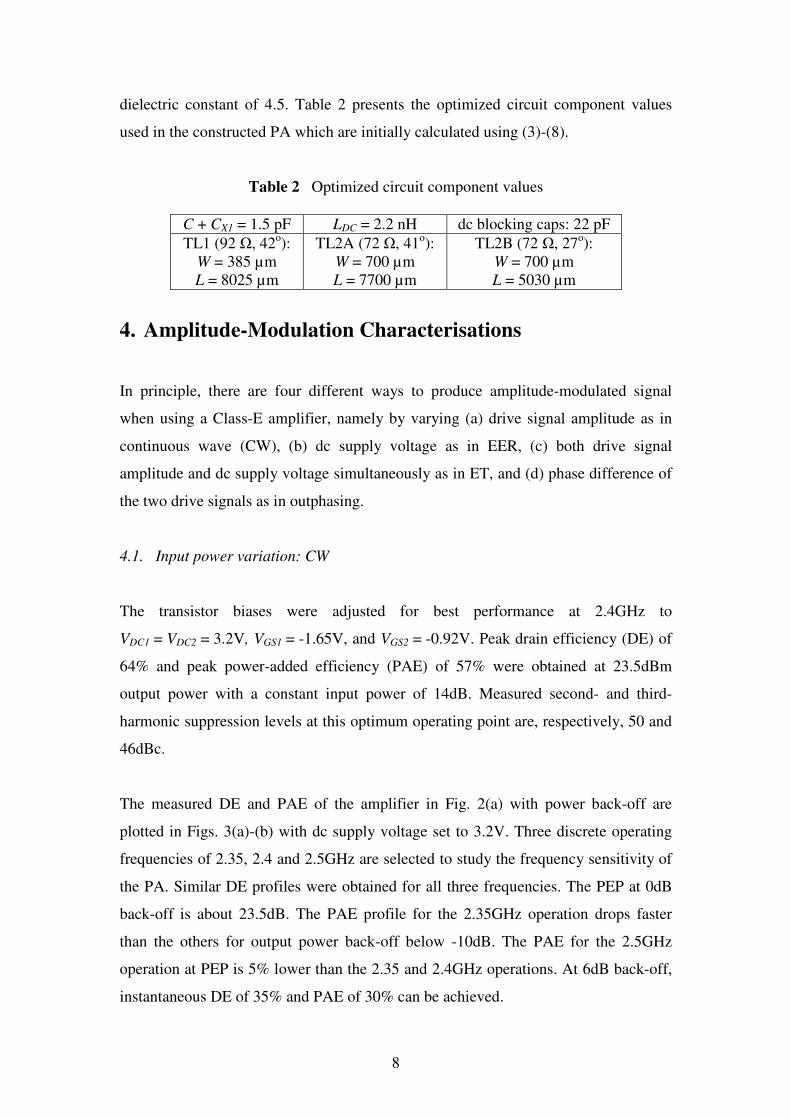
dielectric constant of 4.5. Table 2 presents the optimized circuit component values
used in the constructed PA which are initially calculated using (3)-(8).
Table 2 Optimized circuit component values
C + CX1 = 1.5 pF LDC = 2.2 nH dc blocking caps: 22 pF
TL1 (92 Ω, 42o):
W = 385 µm
L = 8025 µm
TL2A (72 Ω, 41o):
W = 700 µm
L = 7700 µm
TL2B (72 Ω, 27o):
W = 700 µm
L = 5030 µm
4. Amplitude-Modulation Characterisations
In principle, there are four different ways to produce amplitude-modulated signal
when using a Class-E amplifier, namely by varying (a) drive signal amplitude as in
continuous wave (CW), (b) dc supply voltage as in EER, (c) both drive signal
amplitude and dc supply voltage simultaneously as in ET, and (d) phase difference of
the two drive signals as in outphasing.
4.1. Input power variation: CW
The transistor biases were adjusted for best performance at 2.4GHz to
VDC1 = VDC2 = 3.2V, VGS1 = -1.65V, and VGS2 = -0.92V. Peak drain efficiency (DE) of
64% and peak power-added efficiency (PAE) of 57% were obtained at 23.5dBm
output power with a constant input power of 14dB. Measured second- and third-
harmonic suppression levels at this optimum operating point are, respectively, 50 and
46dBc.
The measured DE and PAE of the amplifier in Fig. 2(a) with power back-off are
plotted in Figs. 3(a)-(b) with dc supply voltage set to 3.2V. Three discrete operating
frequencies of 2.35, 2.4 and 2.5GHz are selected to study the frequency sensitivity of
the PA. Similar DE profiles were obtained for all three frequencies. The PEP at 0dB
back-off is about 23.5dB. The PAE profile for the 2.35GHz operation drops faster
than the others for output power back-off below -10dB. The PAE for the 2.5GHz
operation at PEP is 5% lower than the 2.35 and 2.4GHz operations. At 6dB back-off,
instantaneous DE of 35% and PAE of 30% can be achieved.

9
(a) (b)
Figure 3 Measured (a) DE and (b) PAE versus output power back-off for several
operating frequencies by varying input power at VDC = 3.2V
Figure 4 Measured PAE comparisons of the single-ended Class-E, power-combining
Class-E, and single-ended Inverse Class-E at power back-off.
The approximate frequency-domain rather than full time-domain circuit synthesis
described in sections 2 and 3 leads to the power-combining amplifier working in sub-
optimal operation rather than in optimal operation as in the standard single-ended
Class-E PA. It is therefore necessary to investigate if the standard single-ended Class-
E efficiency profile is inherited in the power-combining amplifier reported here. The
single-ended Class-E PA reported in [16], Fig. 2(b), operates at 2.4GHz and delivers
19.5dBm PEP (i.e. 4dB lower than the power-combining Class-E amplifier) with 60%
PAE. It uses the same MwT-8 device. The CW performance at 2.4GHz of the power-
combining amplifier with finite choke is compared in Fig. 4 to that of the single-
ended counterpart with λ/4-line choke. Similar behavioural profiles are obtained
although the power-combining amplifier seems to offer better efficiency at low power

10
back-off. As a comparison, the CW back-off performance of the Inverse Class-E PA
[17] is also plotted in Fig. 4. The Inverse Class-E PA is attractive since it offers peak
switch voltage 20% lower than the Class-E PA. It turns out that as the power reduces,
the efficiency of the Inverse Class-E PA degrades at much faster rate than the Class-E
PAs.
4.2. DC supply voltage variation: EER
In the EER scheme, the RF input signal amplitude is constant. The amplitude
modulation is obtained by varying the dc supply voltage. Here, a constant 14dBm RF
input power is selected since from the measurements in section 4.1, peak PAE of 57%
was achieved at this input power level. The dc supply voltage is swept from 1 to 4V
with 0.4V step. The PEP at 0dB back-off is 25.5dBm correspond to VDC = 4V. To
study the frequency-sensitivity behaviour of the power-combining Class-E amplifier,
measurements were carried out for three discrete operating frequencies 2.35, 2.4, and
2.5GHz.
Fig. 5(a) demonstrates the ability of the power-combining Class-E PA to maintain
high drain efficiency over a wide dynamic range. One may wonder why high
efficiency can be conserved within a wide range of VDC value, since the optimum
circuit component values (3)-(7) are strongly dependent upon VDC. As a consequence,
one may expect that once VDC has been modified from its initial value, the circuit
component values need to be re-calculated to maintain the high efficiency. However,
the measurement results show that efficiency is high still for a wide range of VDC even
though the component values are not adaptively tuned. This can be explained as
follows. The circuit component values (3)-(7) are proportional either to PO/VDC2 or to
VDC2/PO. On the other hand, from (9)-(12) in [16] it can be easily shown that PO of the
Class-E PA is proportional to VDC2, confirmed with the measurement results in Fig.
5(b). This implies that in the idealized Class-E operation, a constant 100% dc-to-rf
efficiency should theoretically be achieved for any values of dc supply voltage
without the need for modifying the optimum load network for each VDC value as long
as PO < P1dB (1dB compression point of the transistor).

11
As can be observed from Fig. 5(a), relatively constant high-efficiency profiles for
2.35 and 2.5GHz operations can be obtained up to 7.5dB power back-off, above
which the efficiency goes up. Deviation from the theory is mainly due to the non-
idealities of the transistors used, for instance, the device output capacitance is
assumed to be linear in theory whereas in practice its value is dependant on VDC. This,
in turn, will alter the impedance that the amplifier presents to the supply voltage (RDC)
and accordingly the dc current.
(a) (b)
Figure 5 (a) Measured DE versus output power back-off and (b) quadratic behaviour
of output power as a function of dc supply voltage for several operating frequencies
by varying dc supply voltage from 1 to 4V at PI = 14dBm.
Figure 6 Measured PAE versus output power back-off for several operating
frequencies by varying dc supply voltage from 1 to 4V at PI = 14dBm

12
From inspection of Fig. 6, it can be seen that within 6dB back-off, PAE of better than
45% can be obtained for 2.35 and 2.4GHz operations. However, at back-off higher
than 6dB, PAE degrades more rapidly. This is because the constant drive power of
14dBm from which the output power is subtracted in the PAE calculation becomes
more dominant as output power reduces.
4.3. Input power and DC supply voltage variation: ET
For a constant VDC = 3.2V, the instantaneous PAE in Fig. 4 degrades substantially as
the output power decreases. By operating the PA with reduced VDC values at low PO,
the PAE can be improved as illustrated in Fig. 7. The results indicated by the dotted
lines are obtained by biasing the PA with a specific VDC value and then sweeping the
drive power. This is done individually for each set of VDC values. In order to establish
the ET profile (solid line), the peaks of these lines are connected using interpolation.
This arrangement suggests that every point on the ET curve corresponds to a pair of
VDC and PI values. For example, 50% PAE can be obtained at 4dB power back-off by
setting VDC to 2V and PI to 12dBm. In contrast, from Fig. 3(b), the PAE at the same
back-off level is only 40% and this is obtained when VDC = 3.2V and PI = 6.3dBm.
Figure 7 Measured PAE versus output power at 2.4GHz by varying input power and
dc supply voltage
4.4. Input-phase difference variation: Outphasing

13
Two signal generators with the same phase reference were used for the outphasing
measurements. Fig. 8 depicts measured output power and dc currents as a function of
drive phase difference when the PA was operated at optimum point (VDC = 3.2V,
fo = 2.4GHz, PI = 14dBm). The output power of the PA at 2.3 and 2.5GHz are also
presented in Fig. 8. At full power, i.e., when input signals are in-phase, the gate
voltages were adjusted such that the same dc currents were drawn from each
individual PA. The output power of the 2.3 and 2.4GHz operations are slightly higher
than that of 2.5 GHz. The slope of the output power is relatively flat for phase
differences from 0 to 90o but is getting steeper beyond that point. This importantly
means that any phase imbalance of up to 90o exists between the two branches would
not lead to major problems.
Figure 8 Measured output power and dc currents versus drive phase difference at
optimum operating point (VDC = 3.2V, fo = 2.4GHz, PI = 14dBm)
The PA outphasing performance for all three operating frequencies can be observed
from Figs. 9(a)-(b). Here, VDC = 3.2V and PI = 14dBm were set constant. The PEP at
0dB back-off for 2.3 and 2.4GHz operations is 23.5dBm while for 2.5GHz is 22dBm.
The best DE profile at back-off occurs at 2.3GHz. PAE curves for 2.3 and 2.4GHz
operations are quite similar.
The effect that the dc supply voltage has on the PA outphasing performance at 2.3
GHz can be seen from Figs. 9(c)-(d). These results suggest that the DE of the PA

14
when operated in outphasing arrangement is insensitive to VDC variation. PEP at 0dB
back-off for 2.5, 3.2, and 4V operations are, respectively, 21, 23.5, and 25.5dBm
(a) (b)
(c) (d)
Figure 9 Measured DE and PAE versus output power back-off by varying drive
phase difference: (a)-(b) for several operating frequencies at VDC = 3.2V and (c)-(d)
for several dc supply voltages at 2.3GHz. The input power for (a)-(d) is 14dBm.
5 Comparisons: CW, EER, ET, and Outphasing
Measured PAE at 2.4GHz versus output power back-off under different schemes
discussed above are plotted on the same graph in Fig. 10 for comparisons. Here, the
PEP at 0dB back-off is aligned for all four schemes, i.e., 23.5dBm. As a consequence,
the PAE profile for the EER scheme in Fig. 10 is obtained by sweeping VDC from 1.2
to 3.2V rather than from 1 to 4V as in Fig. 6. It is evident that the PAE of the ET
scheme outperforms other schemes. Although the PAE profile of the EER is worse
than that obtained for ET, it is still superior to CW up to about 7dB back-off. This

15
implies that varying VDC below 1.4V will lead to poor PAE. PAE performance of the
outphasing scheme can be improved using Chireix reactive compensator [10].
The ET profile in Fig. 10 is slightly different from that presented in Fig. 7 due to the
following reason. For the PA characterizations, RF input signal coming from a signal
generator is distributed to the input ports RFIN1 and RFIN2, Fig. 2(a), by a broadband
power splitter (1-10GHz). Due to the amplitude imbalance of the splitter (± 0.4dB),
drive signal fed to one input port is higher than the other input port. From the
experiments, it turns out that best PAE is obtained when the larger input power is
applied to RFIN1 rather than RFIN2. PAE of the ET scheme plotted in Fig. 7 is slightly
worse than that in Fig. 10 since the larger input power is fed to RFIN2.
Figure 10 Measured PAE at output power back-off under different AM schemes
As an independent verification, the PA was simulated in Agilent Advanced Design
System (ADS) using the actual transistor large-signal model. The best performance
was achieved for 2.5GHz operation with the gate bias voltage of -2V. For the
outphasing arrangement, the total available drive power used is 13dBm and the
simulated PA operates from a higher dc supply voltage, 3.7V, rather than 3.2V used in
the measurements resulted in a higher PEP, 26.5dBm. The harmonic-balance
simulation results are presented in Fig. 11 with reasonable qualitative agreement with
the measurement results in Fig. 10. The discrepancies between measured and
simulated results are mainly due to inaccuracy of the device large signal model,
fabrication tolerances, and amplitude-phase imbalances of the power splitter. More

16
importantly, two transistors used in the actual design are unlikely identical, i.e., have
the same I-V and transfer characteristics (as assumed in the simulation environment)
even if they are from the same batch.
Figure 11 Simulated PAE at output power back-off under different AM schemes
The probability density function (PDF) of a particular input signal gives information
about the relative amount of time the signal spends at various amplitudes. For
example, as described in [18], the probability density function of a multi-carrier input
signal, such as CDMA, can be approximated with a Rayleigh function (9) while full-
carrier amplitude modulation by a Gaussian signal generates an RF signal with a
Gaussian-AM envelope (10):
)exp(2)( 2vvvp ξξ −= (9)
( ) 25.02exp/2)( −−= vvp ξπξ (10)
where v is the normalized output voltage and
10/10
PAR=ξ (11)
In Fig. 12, Rayleigh and Gaussian-AM probability density functions are illustrated for
several peak-to-average power ratio (PAR) values. Recall that for the same amplitude
multi-tone signal, the PAR value corresponds to the number of carriers. Modern

17
digital modulation techniques which employ many carriers have rather stringent
linearity requirements. This can be seen from the Rayleigh distribution in Fig. 12 that
for higher PAR values the peak of the PDF occurs at lower v at which point the
linearity is better but the efficiency of the amplifier is poor. With knowledge of p(v),
average PAE (PAEAVG) can be computed using
AVGDC
AVGIAVGO
AVGP
PPPAE
_
__ −= (12)
where PO_AVG, PI_AVG, and PDC_AVG follow
∫=1
0
)()( dvvpvff AVG (13)
Figure 12 PDF of Rayleigh and Gaussian-AM for several PAR values
Average DE and PAE of the PA for the CW and ET cases are computed in MATLAB
and presented in Fig. 13. By adopting ET technique, an increase PAEAVG of 17% was
obtained for the Rayleigh distribution with PAR = 10dB.

18
Figure 13 Average DE and PAE for CW and ET schemes
6 Conclusion
The characterized Class-E amplifier topology offers an attractive solution for simple
high-efficiency power combining. The power back-off characteristics of the power-
combining Class-E amplifier with finite choke have been investigated for CW, EER,
ET, and outphasing schemes. Under EER scheme, PAE of better than 45% can be
obtained within 6dB back-off for 2.35 and 2.4GHz operations. The PA efficiency
when operated in outphasing arrangement was shown to be insensitive to dc supply
voltage and frequency variation. Qualitative agreement between simulation and
measurement results was achieved where the ET technique outperforms other
schemes.
7 Acknowledgment
The work was supported by the UK Engineering and Physical Sciences Research
Council (EPSRC) under Grant EP/E01707X/1 and by the Northern Ireland
Department of Education and Learning (DEL) under Strengthening All Island Mobile
Wireless Futures programme.

19
8 References
[1] Sokal, N. O., and Sokal, A. D.: ‘Class-E-A new class of high-efficiency tuned
single-ended switching power amplifiers’, IEEE J. Solid-State Circuits, 1975,
10, (3), pp. 168-176.
[2] Morgan, D. R., et. al.: ‘A generalized memory polynomial model for digital
predistortion of RF power amplifiers’, IEEE Trans. Signal Processing, 2006, 54,
(10), pp. 3852-3860.
[3] Eun, C., and Powers, E. J.: ‘A new Volterra predistorter based on the indirect
learning architecture’, IEEE Trans. Signal Processing, 1997, 45, (1), pp. 223-
227.
[4] Kahn, L. R.: ‘Single-sideband transmission by envelope elimination and
restoration’, Proc. IRE, 1952, 40, (7), pp. 803-806.
[5] Kim, I., et. al.: ‘High-efficiency hybrid EER transmitter using optimized power
amplifier’, IEEE Trans. Microw. Theory Tech., 2008, 56, (11), pp. 2582-2593.
[6] Warr, P. A., et. al.: ‘A 60% PAE WCDMA handset transmitter amplifier’, IEEE
Trans. Microw. Theory Tech., 2009, 57, (10), pp. 2368-2377.
[7] Buoli, C., Abbiati, A., and Riccardi, D.: ‘Microwave power amplifier with
“envelope controlled” drain power supply’. Proc. 25th European Microw. Conf.,
Bologna, Italy, Sept. 1995, pp. 31-35.
[8] Lopez, J., et. al.: ‘Design of highly efficient wideband RF polar transmitters
using the envelope-tracking technique’, IEEE J. Solid-State Circuits, 2009, 44,
(9), pp. 2276-2294.
[9] Jeong, J., et. al.: ‘High-efficiency WCDMA envelope tracking base-station
amplifier implemented with GaAs HVHBTs’, IEEE J. Solid-State Circuits,
2009, 44, (10), pp. 2629-2639.
[10] Chireix, H.: ‘High power outphasing modulation’, Proc. IRE, 1935, 23, (11), pp.
1370-1392.
[11] Cox, D. C.: ‘Linear amplification with nonlinear components’, IEEE Trans.
Commun., 1974, 22, (12), pp.1942-1945.
[12] Lee, S., and Nam, S.: ‘A CMOS outphasing power amplifier with integrated
single-ended Chireix combiner’, IEEE Trans. Circuits Syst. II, 2010, 57, (6), pp.
411-415.

20
[13] Qureshi, J. H., et. al.: ‘A 90-W peak power GaN outphasing amplifier with
optimum input signal conditioning’, IEEE Trans. Microw. Theory Tech., 2009,
57, (8), pp. 1925-1935.
[14] Milosevic, D., van der Tang, J., and van Roermund, A.: ‘Intermodulation
products in the EER technique applied to Class-E amplifiers’. Proc. ISCAS,
Vancouver, Canada, May 2004, pp. 637–640.
[15] Thian, M., and Fusco, V.: ‘Power combining techniques into unbalanced loads
for Class-E and Inverse Class-E amplifiers’, IET Microw. Antennas Propag.,
2008, 2, (6), pp. 529-537.
[16] Mury, T., Fusco, V. F., and Cantu, H.: ‘2.4 GHz Class-E power amplifier with
transmission-line harmonic terminations’, IET Microw. Antennas Propag., 2007,
1, (2), pp. 267-272.
[17] Mury, T., and Fusco, V. F.: ‘Inverse Class-E amplifier with transmission-line
harmonic suppression’, IEEE Trans. Circuits Syst. I, 2007, 54, (7), pp. 1555-
1561.
[18] Raab, F. H.: ‘Average efficiency of power amplifiers’. Proc. RF Technology
Expo ’86, Anaheim, CA, Dec. 1977, pp. 725-735.