Embed Size (px)
Citation preview

Teo Lachev
M A N N I N G
MicrosoftReportingServicesIN ACTION
S A M P L E C H A P T E R

Microsoft Reporting Services in Actionby Teo Lachev
Chapter 6
Copyright 2004 Manning Publications

vii
brief contents
1 Introducing Microsoft Reporting Services 1
2 Report authoring basics 39
3 Working with data 63
4 Designing reports 102
5 Using expressions and functions 142
6 Using custom code 183
7 Managing the Reporting Services environment 215
8 Securing Reporting Services 260
9 On-demand report delivery 299
10 Reporting for Windows Forms applications 337
11 Reporting for web-based applications 377
12 Reporting for OLAP applications 416
13 Enterprise reporting 456
14 Subscribed report delivery 483
15 Extending Reporting Services 517
16 Performance and scalability 566

183
C H A P T E R 6
Using custom code6.1 Understanding custom code 1846.2 Custom code in action: implementing report forecasting 1916.3 Using XML-based reports 2046.4 Summary 2106.5 Resources 211
Reporting Services doesn’t limit your programming options to using inline expressions andfunctions. In this chapter, we will show you how to supercharge the expression capabilitiesof your reports by integrating them with custom code. Writing custom code allows us touse advanced programming techniques to meet the most demanding reporting needs.
In this chapter, you will
• See what custom code options RS offers
• Learn how to write embedded code
• Find out how to integrate reports with external .NET assemblies
• Use XSL transformations to produce XML reports
We will put our custom code knowledge into practice by creating an advanced reportthat will show forecasted sales data.
With the widespread adoption of the XML as an interoperable data exchange for-mat, we will also see how we can export reports to XML and custom-tailor the reportoutput by using XSL transformations.
184 CHAPTER 6 USING CUSTOM CODE
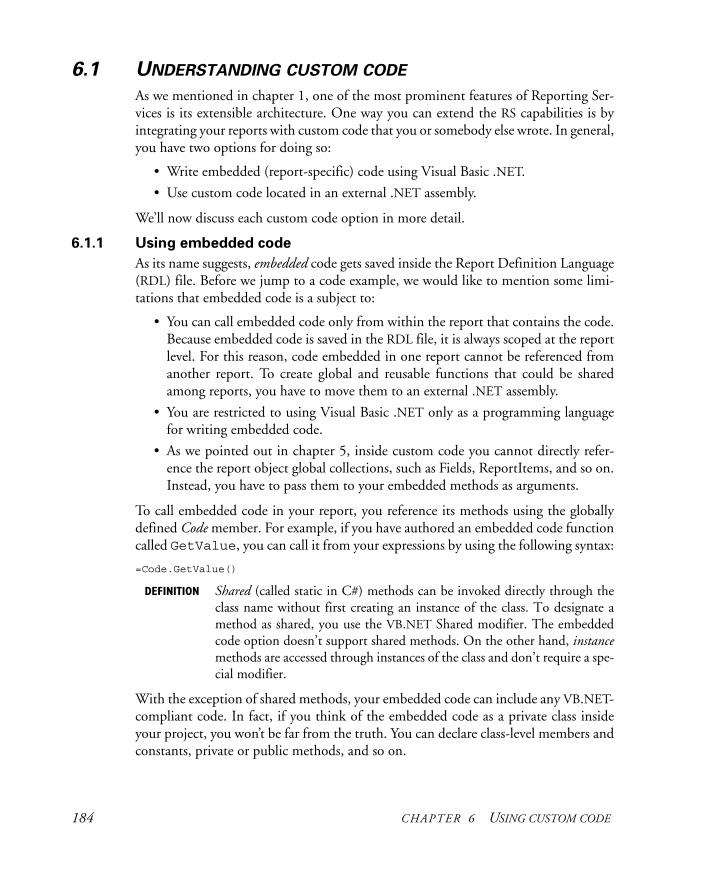
6.1 UNDERSTANDING CUSTOM CODE
As we mentioned in chapter 1, one of the most prominent features of Reporting Ser-vices is its extensible architecture. One way you can extend the RS capabilities is byintegrating your reports with custom code that you or somebody else wrote. In general,you have two options for doing so:
• Write embedded (report-specific) code using Visual Basic .NET.
• Use custom code located in an external .NET assembly.
We’ll now discuss each custom code option in more detail.
6.1.1 Using embedded code
As its name suggests, embedded code gets saved inside the Report Definition Language(RDL) file. Before we jump to a code example, we would like to mention some limi-tations that embedded code is a subject to:
• You can call embedded code only from within the report that contains the code.Because embedded code is saved in the RDL file, it is always scoped at the reportlevel. For this reason, code embedded in one report cannot be referenced fromanother report. To create global and reusable functions that could be sharedamong reports, you have to move them to an external .NET assembly.
• You are restricted to using Visual Basic .NET only as a programming languagefor writing embedded code.
• As we pointed out in chapter 5, inside custom code you cannot directly refer-ence the report object global collections, such as Fields, ReportItems, and so on.Instead, you have to pass them to your embedded methods as arguments.
To call embedded code in your report, you reference its methods using the globallydefined Code member. For example, if you have authored an embedded code functioncalled GetValue, you can call it from your expressions by using the following syntax:
=Code.GetValue()
DEFINITION Shared (called static in C#) methods can be invoked directly through theclass name without first creating an instance of the class. To designate amethod as shared, you use the VB.NET Shared modifier. The embeddedcode option doesn’t support shared methods. On the other hand, instancemethods are accessed through instances of the class and don’t require a spe-cial modifier.
With the exception of shared methods, your embedded code can include any VB.NET-compliant code. In fact, if you think of the embedded code as a private class insideyour project, you won’t be far from the truth. You can declare class-level members andconstants, private or public methods, and so on.

UNDERSTANDING CUSTOM CODE 185
Maintaining state
One not-so-obvious aspect of working with embedded code is that you can maintainstate in it. For example, you can use class-level members to preserve the values of the vari-ables between calls to embedded code methods from the moment the report processingstarts until the report is fully processed. We will demonstrate this technique in the fore-casting example that we will explore in section 6.2.
Please note that state can be maintained within the duration of single reportrequest only. As we explained in chapter 2, the RS report-processing model is stateless.For this reason, the report state gets discarded at the end of the report processing.Reporting Services is a web-based application, and just like any other web application,once the request is handled, its runtime state gets released. For this reason, subsequentrequests to the same report cannot share state stored in class-level variables.
Let’s now look at a practical example where embedded code can be useful.
Writing embedded code
You can write embedded code to create reusable utility functions that can be calledfrom several expressions in your report. Let’s examine an example of how we can dojust that.
Suppose that the Adventure Works users have requested that we change the TerritorySales Crosstab report to display N/A when data is missing, as shown in figure 6.1.
Figure 6.1 You can use embedded code to implement useful utility functions scoped at the
report level.

186 CHAPTER 6 USING CUSTOM CODE
Further, let’s assume that we need to differentiate between missing data and NULL val-ues. When the underlying value is NULL, we will translate it to zero. To meet thisrequirement, we could write a simple embedded function called GetValue.
Using the Code Editor
To write custom embedded code, you use the Report Designer Code Editor, which you caninvoke from the Report Properties dialog. You can open this dialog in either of two ways:
• Select the report by right-clicking the Report Selector and choosing Properties. • Right-click anywhere on the report outside the body area, and choose Properties.
Then, from the Report Properties dialog, choose the Code tab, as shown in figure 6.2.Granted, function GetValue can easily be replaced with an Iif-based expression.
However, encapsulating the logic in an embedded function has two advantages. First,it centralizes the logic of the expression in one place instead of using Iif functions forevery field in the report. Second, it makes the report more maintainable because if youdecide to make a logical change to your function, you do not have to track down andchange every Iif function in the report.
As you can see, the Code Editor is nothing to brag about. It is implemented as asimple text area control, and its feature set doesn’t go beyond copying and pasting text.For this reason, I highly recommend that you use a standard VB Windows Forms orConsole application to write your VB.NET code in a civilized manner and then copyand paste it inside the Code Editor.
The Report Designer saves embedded code under the <Code> element in the RDLfile. When doing so, the Report Designer URL-encodes the text. Be aware of this ifyou decide to change the <Code> element directly for some reason.
Figure 6.2
Use the Code Editor for
writing embedded code.
The GetValue function,
shown in the Code Editor,
determines whether a value
is missing or NULL.
UNDERSTANDING CUSTOM CODE 187
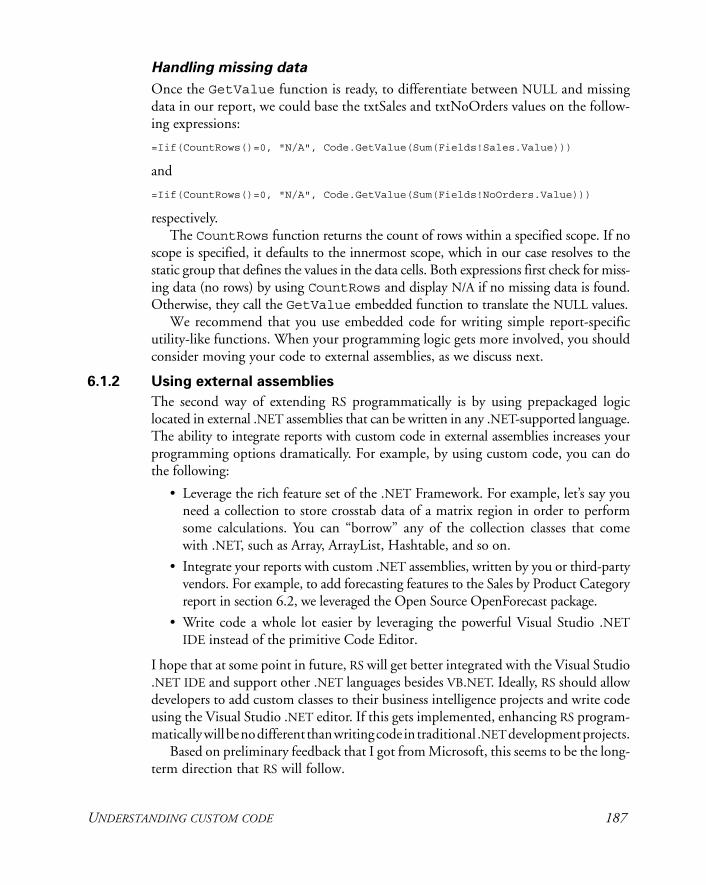
Handling missing data
Once the GetValue function is ready, to differentiate between NULL and missingdata in our report, we could base the txtSales and txtNoOrders values on the follow-ing expressions:
=Iif(CountRows()=0, "N/A", Code.GetValue(Sum(Fields!Sales.Value)))
and
=Iif(CountRows()=0, "N/A", Code.GetValue(Sum(Fields!NoOrders.Value)))
respectively.The CountRows function returns the count of rows within a specified scope. If no
scope is specified, it defaults to the innermost scope, which in our case resolves to thestatic group that defines the values in the data cells. Both expressions first check for miss-ing data (no rows) by using CountRows and display N/A if no missing data is found.Otherwise, they call the GetValue embedded function to translate the NULL values.
We recommend that you use embedded code for writing simple report-specificutility-like functions. When your programming logic gets more involved, you shouldconsider moving your code to external assemblies, as we discuss next.
6.1.2 Using external assemblies
The second way of extending RS programmatically is by using prepackaged logiclocated in external .NET assemblies that can be written in any .NET-supported language.The ability to integrate reports with custom code in external assemblies increases yourprogramming options dramatically. For example, by using custom code, you can dothe following:
• Leverage the rich feature set of the .NET Framework. For example, let’s say youneed a collection to store crosstab data of a matrix region in order to performsome calculations. You can “borrow” any of the collection classes that comewith .NET, such as Array, ArrayList, Hashtable, and so on.
• Integrate your reports with custom .NET assemblies, written by you or third-partyvendors. For example, to add forecasting features to the Sales by Product Categoryreport in section 6.2, we leveraged the Open Source OpenForecast package.
• Write code a whole lot easier by leveraging the powerful Visual Studio .NETIDE instead of the primitive Code Editor.
I hope that at some point in future, RS will get better integrated with the Visual Studio.NET IDE and support other .NET languages besides VB.NET. Ideally, RS should allowdevelopers to add custom classes to their business intelligence projects and write codeusing the Visual Studio .NET editor. If this gets implemented, enhancing RS program-matically will be no different than writing code in traditional .NET development projects.
Based on preliminary feedback that I got from Microsoft, this seems to be the long-term direction that RS will follow.
188 CHAPTER 6 USING CUSTOM CODE
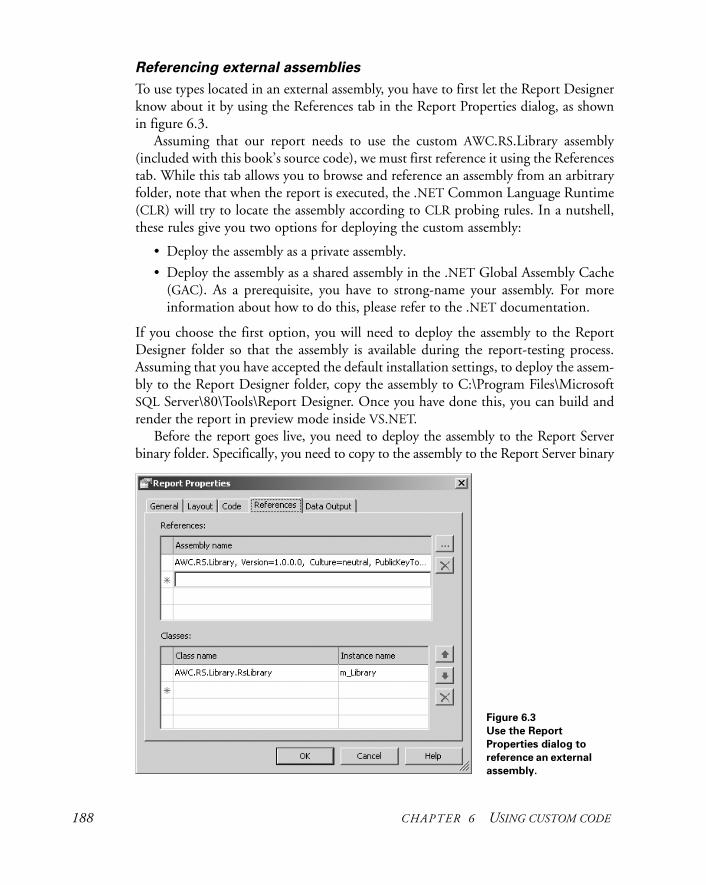
Referencing external assemblies
To use types located in an external assembly, you have to first let the Report Designerknow about it by using the References tab in the Report Properties dialog, as shownin figure 6.3.
Assuming that our report needs to use the custom AWC.RS.Library assembly(included with this book’s source code), we must first reference it using the Referencestab. While this tab allows you to browse and reference an assembly from an arbitraryfolder, note that when the report is executed, the .NET Common Language Runtime(CLR) will try to locate the assembly according to CLR probing rules. In a nutshell,these rules give you two options for deploying the custom assembly:
• Deploy the assembly as a private assembly.
• Deploy the assembly as a shared assembly in the .NET Global Assembly Cache(GAC). As a prerequisite, you have to strong-name your assembly. For moreinformation about how to do this, please refer to the .NET documentation.
If you choose the first option, you will need to deploy the assembly to the ReportDesigner folder so that the assembly is available during the report-testing process.Assuming that you have accepted the default installation settings, to deploy the assem-bly to the Report Designer folder, copy the assembly to C:\Program Files\MicrosoftSQL Server\80\Tools\Report Designer. Once you have done this, you can build andrender the report in preview mode inside VS.NET.
Before the report goes live, you need to deploy the assembly to the Report Serverbinary folder. Specifically, you need to copy to the assembly to the Report Server binary
Figure 6.3
Use the Report
Properties dialog to
reference an external
assembly.

UNDERSTANDING CUSTOM CODE 189
folder, which by default is C:\Program Files\Microsoft SQL Server\MSSQL\ ReportingServices\ReportServer\bin.
Please note that deploying the custom assembly to the right location is only halfof the deployment story. Depending on what your code does, you may need also toadjust the code access security policy so the assembly code can execute successfully. Wewill discuss the code access security model in chapter 8. If you need more informationabout deploying custom assemblies, please refer to the “Using Custom Assemblieswith Reports” section in the RS documentation.
Calling shared methods
When using custom code in external assemblies, you can call both instance andshared methods. If you need to call only shared methods (also called static in C#)inside the assembly, you are ready to go because shared methods are available globallywithin the report.
You can call shared methods by using the fully qualified type name using the fol-lowing syntax:
<Namespace>.<Type>.<Method>(argument1, argument2, …, argumentN)
For example, if we need to call the GetForecastedSet shared method located inthe RsLibrary class (AWC.RS.Library assembly) from an expression or embedded code,we would use the following syntax:
=AWC.RS.Library.RsLibrary.GetForecastedSet(forecastedSet, forecastedMonths)
where AWC.RS.Library is the namespace, RsLibrary is the type, GetFore-castedSet is the method, and forecastedSet and forecastedMonths arethe arguments.
If the custom assembly is your own, how can you decide whether to define yourmethods as shared or instance? My short answer is to use shared methods if you don’tneed instance methods. Shared methods are convenient to call. However, instancemethods allow you to maintain state within the duration of the report request. Forexample, you can preserve the class-level variable values between multiple method invo-cations of the same type. The state considerations for using code in external .NETassemblies are the same as the ones we discussed in the section 6.1.1 for embedded code.
One thing to watch for is using shared class-level fields to maintain state becausetheir values are shared across all instances of the same report. So, depending on howmany users are accessing a single report at any one time, the value of a shared field maybe changing. In addition, the values of shared fields are not private to a report user,so sensitive user-only data should never be accessed through a shared field or property.Finally, static class-level fields are subject to multithreading locking issues. To avoidthese issues, create your classes as stateless classes that don’t have class-level sharedfields or use instance class-level fields and methods. For more information aboutshared vs. instance methods, see the Visual Studio .NET documentation.

190 CHAPTER 6 USING CUSTOM CODE
Sometimes, you simply won’t have a choice and your applications requirementswill dictate the type of method invocation. For example, if the method needs to be alsoinvoked remotely via .NET Remoting, it has to be an instance method.
Calling instance methods
To invoke an instance method, you have some extra work left to do. First, you have toenumerate all instance classes (types) that you need to instantiate in the Classes grid(see figure 6.3). For each class, you have to assign an instance name. Behind the scenes,RS will create a variable with that name to hold a reference to the instance of the type.
NOTE When you specify the class name in the Classes grid, make sure that you enterthe fully qualified type name (namespace included). In our example (shownpreviously in figure 6.3), the namespace is AWC.RS.Library while theclass name is RsLibrary. When you are in doubt as to what the fully qualifiedclass name is, use the VS.NET Object Browser or another utility, such as LutzRoeder’s excellent .NET Reflector (see section 6.5 for information on thisutility), to browse to the class name and find out its namespace.
For example, assuming that we need to call an instance method in the AWC.RS.Libraryassembly, we have to declare an instance variable m_Library, as shown in figure 6.3. Inour case, this variable will hold a reference to the RsLibrary class.
If you declare more than one variable pointing to the same type, each will referencea separate instance of that type. Behind the scenes, when the report is processed, RS willinstantiate as many instances of the referenced type as the number of instance variables.
Once you have finished with the reference settings, you are ready to call theinstance methods via the instance type name that you specified. Just as with embeddedcode, you use the Code keyword to call an instance method. The difference betweena shared and an instance method is that instead of using the class name, you use thevariable name to call the method.
For example, if the RsLibrary type had an instance method named Dummy-Method(), we could invoke it from an expression or embedded code like this:
Code.m_Library.DummyMethod().
Having seen what options we have as developers for programmatically expanding ourreport features, let’s see how we can apply them in practice. In the next section, wewill find out how we can use embedded and external code to add advanced featuresto our reports.

CUSTOM CODE IN ACTION: IMPLEMENTING REPORT FORECASTING 191
6.2 CUSTOM CODE IN ACTION: IMPLEMENTING REPORT FORECASTING
In this section, we will show you how to incorporate forecasting capabilities in ourreports. These are the design goals of the sample report that we are going to create:
• Allow the user to generate a crosstab report of sales data for an arbitrary period.
• Allow the user to specify the number of forecasted columns.
• Use data extrapolation to forecast the sales data.
Here is our fictitious scenario. Imagine that the AWC management has requested tosee forecasted monthly sales data grouped by product category. To make these thingsmore interesting, let’s allow the report users to specify a data range to filter the sales data,as well as the number of forecasted months. To accomplish the above requirements, wewill author a crosstab report, Sales by Product Category, as shown in figure 6.4.
The user can enter a start date and an end date to filter the sales data. In addition,the user can specify how many months of forecasted data will be shown on the report.The report shows the data in a crosstab fashion, with product categories on rows andtime periods on columns. The data portion of the report shows first the actual saleswithin the requested period, followed by the forecasted sales in bold font.
For example, if the user enters 4/30/2003 as a start date and 3/31/2004 as an enddate and requests to see three forecasted months, the report will show the forecasteddata for April, May, and June 2004 (to conserve space, figure 6.4 shows only onemonth of forecasted data).
As you would probably agree, implementing forecasting features on your own is not aneasy undertaking. But what if there is already prepackaged code that does this for us? If thiscode can run on .NET, our report can access it as custom code. Enter OpenForecast.
Figure 6.4 The Sales by Product Category report uses embedded and external custom code
for forecasting.
192 CHAPTER 6 USING CUSTOM CODE
6.2.1 Forecasting with OpenForecast
Forecasting is a science in itself. Generally speaking, forecasting is concerned with theprocess used to predict the unknown. Instead of looking at a crystal ball, forecastingpractitioners use mathematical models to analyze data, discover trends, and make edu-cated conclusions. In our example, the Sales by Product Category report will predictthe future sales data by using the data extrapolating method.
There are number of well-known mathematical models for extrapolating a set ofdata, such as polynomial regression and simple exponential smoothing. Implementingone of those models, though, is not a simple task. Instead, for the purposes of our salesforecasting example, we will use the excellent Open Source OpenForecast package,written by Steven Gould.
OpenForecast is a general-purpose package that includes Java-based forecastingmodels that can be applied to any data series. The package require no knowledge offorecasting, which is great for those of us who have decided to focus on solving purebusiness problems and kissed mathematics goodbye a long time ago.
OpenForecast supports several mathematical forecasting models, including single-variable linear regression, multi-variable linear regression, and so on. The currentOpenForecast version as of the time of this writing is 0.3, but version 0.4 is underdevelopment and probably will be released by the time you read this book. Please seesection 6.5 for a link to the OpenForecast web site.
Let’s now see how we can implement our forecasting example and integrate withOpenForecast by writing some embedded and external code.
6.2.2 Implementing report forecasting features
Creating a crosstab report with forecasting capabilities requires several implementationsteps. Let’s start with a high-level view of our envisioned approach and then drill downinto the implementation details.
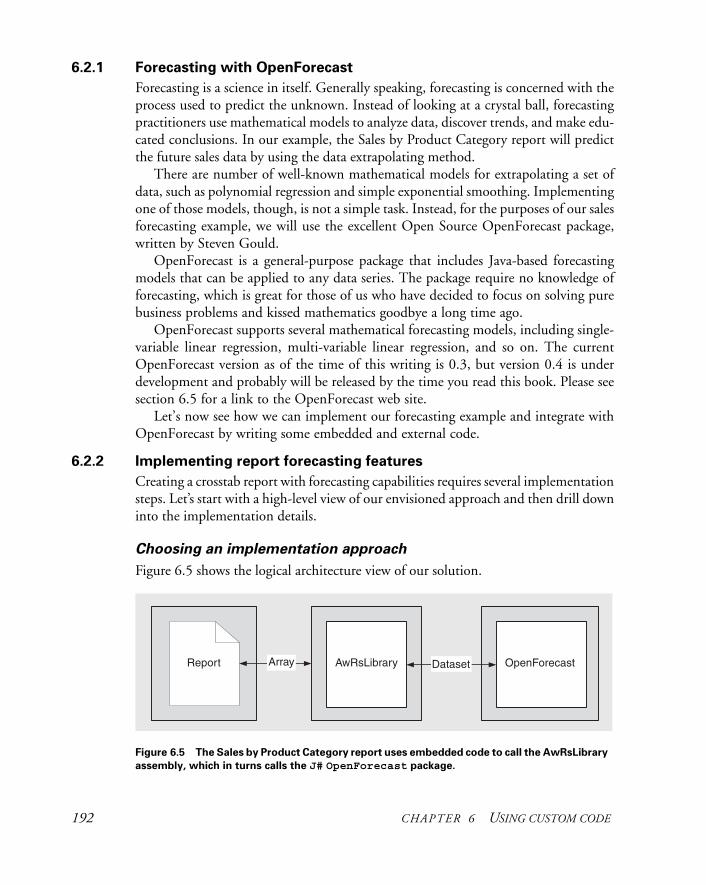
Choosing an implementation approach
Figure 6.5 shows the logical architecture view of our solution.
Figure 6.5 The Sales by Product Category report uses embedded code to call the AwRsLibrary
assembly, which in turns calls the J# OpenForecast package.
CUSTOM CODE IN ACTION: IMPLEMENTING REPORT FORECASTING 193
Our report will use embedded code to call a shared method in a custom assembly(AwRsLibrary) and get the forecasted data. AwRsLibrary will load the existing salesdata into an OpenForecast dataset and obtain a forecasting model from OpenForecast.Then, it will call down to OpenForecast to get the forecasted values for the requestednumber of months. AwRsLibrary will return the forecasted data to the report, whichin turn will display it.
We have at least two implementation options for passing the crosstab sales data toAwRsLibrary:
• Fetch the sales data again from the database. To accomplish this, the reportcould pass the selected product category and month values on a row-by-rowbasis. Then, AwRsLibrary could make a database call to retrieve the matchingsales data.
• Load the existing sales data in a structure of some kind using embedded codeinside the report and pass the structure to AwRsLibrary.
The advantages of the latter approach are as follows:
• The custom code logic is self-contained. We don’t have to query the database again.
• It uses the default custom code security policy. We don’t have to elevate the defaultcode access security policy for the AwRsLibrary assembly. If we choose the firstoption, we won’t be able to get away with the default code access security setup,because RS will grant our custom assemblies only Execution rights, which arenot sufficient to make a database call. Actually, in the case of OpenForecast, wehad to grant both assemblies FullTrust rights because any J# code requires Full-Trust to execute successfully. However, we wouldn’t have had to do this if wehad chosen C# as a programming language.
• No data synchronization is required. We don’t have to worry about synchronizingthe data containers, the matrix region and the AwRsLibrary dataset.
For the above reasons, we will choose the second approach. To get it implemented, wewill use an expression to populate the matrix region data values. The expression willcall our embedded code to load an array structure on a row-by-row basis. Once a givenrow is loaded, we will pass the array to AwRsLibrary to get the forecasted data.
Now, let’s discuss the implementation details, starting with converting OpenFore-cast to .NET.
Migrating OpenForecast to .NET
OpenForecast is written in Java, so one of the first hurdles that we had to overcomewas to integrate it with .NET. We had two options to do so:
• Use a third-party Java-to-.NET gateway to integrate both platforms. Given thecomplexities of this approach we quickly dismissed it.

194 CHAPTER 6 USING CUSTOM CODE
• Port OpenForecast to one of the supported .NET languages. Microsoft provides twooptions for this. First, we can use the Microsoft Java Language ConversionAssistant (see section 6.5 for more information) to convert Java-language codeto C#. Second, we could convert OpenForecast to J#. The latter option wouldhave preserved the Java syntax although that code will execute under the controlof the .NET Common Language Runtime instead of the Java Virtual Machine.
We decided to port OpenForecast to J#. The added benefit to this approach is that theOpen Source developers could maintain only one Java-based version of OpenForecast.Porting OpenForecast to J# turned out to be easier than we thought. We created a newJ# library project, named it OpenForecast, and loaded all *.java source files inside it.We included the .NET version of OpenForecast in the source code that comes withthis book.
Figure 6.6 shows the converted to J# version of OpenForecast open in Visual Stu-dio.NET.
We had take care of only a few compilation errors inside the MultipleLinearRegres-sion, because several Java hashtable methods are not supported in J#, such as keySet(),entries(), and hashtable cloning. We also included a WinForm application (Test-Harness) that you can use to test the converted OpenForecast. We included the Open-Forecast DLL so you could still run the report even if you don’t have J# installed.
Figure 6.6 To convert Java-based OpenForecast to .NET, we migrated its code to J#.

CUSTOM CODE IN ACTION: IMPLEMENTING REPORT FORECASTING 195
Implementing the AwRsLibrary assembly
The next step was to create the custom .NET assembly, AwRsLibrary, that will bridgethe report-embedded code and OpenForecast. We implemented AwRsLibrary as a C#class library project. Inside it we created the class RsLibrary that exposes a static(shared) method, GetForecastedSet. The abbreviated code of this method isshown in listing 6.1.
public static void GetForecastedSet(double[] dataSet, int numberForecastedPoints ) { DataSet observedData = new DataSet(); Observation dp; for (int i=0;i<dataSet.Length-numberForecastedPoints;i++) { dp = new Observation( dataSet[i]); dp.setIndependentValue( "x", i); observedData.add( dp ); }
ForecastingModel forecaster = new MultipleLinearRegressionModel(); forecaster.init(observedData); DataSet requiredObservations = new DataSet(); for ( int i=dataSet.Length-numberForecastedPoints; i < dataSet.Length; i++ ) { dp = new Observation( 0.0 ); dp.setIndependentValue( "x", i ); requiredObservations.add( dp ); }
forecaster.forecast( requiredObservations );
int index = dataSet.Length - numberForecastedPoints; Iterator it = requiredObservations.iterator(); while ( it.hasNext() ) { dataSet[index] = ((DataPoint)it.next()).getDependentValue(); index++; }}
The GetForecastedSet method receives the existing sales data for a given productcategory in the form of a dataSet array, as well as the number of the requested monthsfor forecasted data. Next, integrating with OpenForecast is a matter of five steps.
Step 1 We create a new OpenForecast dataset and load it with the existing data fromthe matrix row array.
Step 2 We obtain a given forecasting model. OpenForecast allows developers to getthe optimal forecasting mathematical model based on the given data series by
Listing 6.1 The report-embedded code calls the AwRsLibrary
GetForecastedSet method, which in turns calls OpenForecast.
Define an OpenForecast dataset and load it with the matrix row array
Obtain a forecastingmodel from
OpenForecast
Specify placeholders for the forecasted data
Perform forecasting
Populate the input array
196 CHAPTER 6 USING CUSTOM CODE
calling the getBestForecast method. This method will examine thedataset and will try a few forecasting models to select the most optimal. If thereturned model is not a good fit, you can request a forecasting model explic-itly by instantiating any of the classes found under the model’s project folder.
NOTE When testing the report, I noticed that with my sales data getBestFore-cast() returns the PolynomialRegressionModel model, which returnsnegative values when the sales data varies considerably. For this reason, Iexplicitly request the MultipleLinearRegressionModel model. I recom-mend that you try getBestForecast() first for your forecasting appli-cations, and only if the returned model doesn’t meet your needs should yourequest a model explicitly.
Step 3 We prepare another dataset to hold the forecasted data and initialize it withas many elements as the number of forecasted months.
Step 4 We call the forecast method to extrapolate the data and return the forecastedresults.
Step 5 We load the forecasted data back to the dataSet array so we can pass it backto the report’s embedded code.
Once we have finished with both the AwRsLibrary and OpenForecast .NET assem-blies, we need to deploy them.
Deploying custom assemblies
As we explained in section 6.1, we need to deploy custom assemblies to both theReport Designer and Report Server binary folders. The custom assembly deploymentprocess consists of the following steps:
Step 1 Copy the assemblies to the Report Designer and Report Server binary folders.
Step 2 Adjust the code-based security if the custom code needs an elevated set ofcode access security permissions.
To make both assemblies, AwRsLibrary and OpenForecast, available during designtime, we have to copy AWC.RS.Library.dll and OpenForecast.dll to the ReportDesigner folder, which by default is C:\Program Files\Microsoft SQL Server\80\Tools\Report Designer.
Similarly, to successfully render the deployed report under the Report Server, wehave to deploy both assemblies to the Report Server binary folder, which by defaultis C:\Program Files\Microsoft SQL Server\MSSQL\Reporting Services\ReportServer\bin. In fact, the Report Server will not let you deploy a report from within the VS.NETIDE if all referenced custom assemblies are not already deployed.
The default RS code access security policy grants Execution rights to all customassemblies by default. However, J# assemblies require FullTrust code access rights.Because the .NET Common Language Runtime walks up the call stack to verify that
CUSTOM CODE IN ACTION: IMPLEMENTING REPORT FORECASTING 197
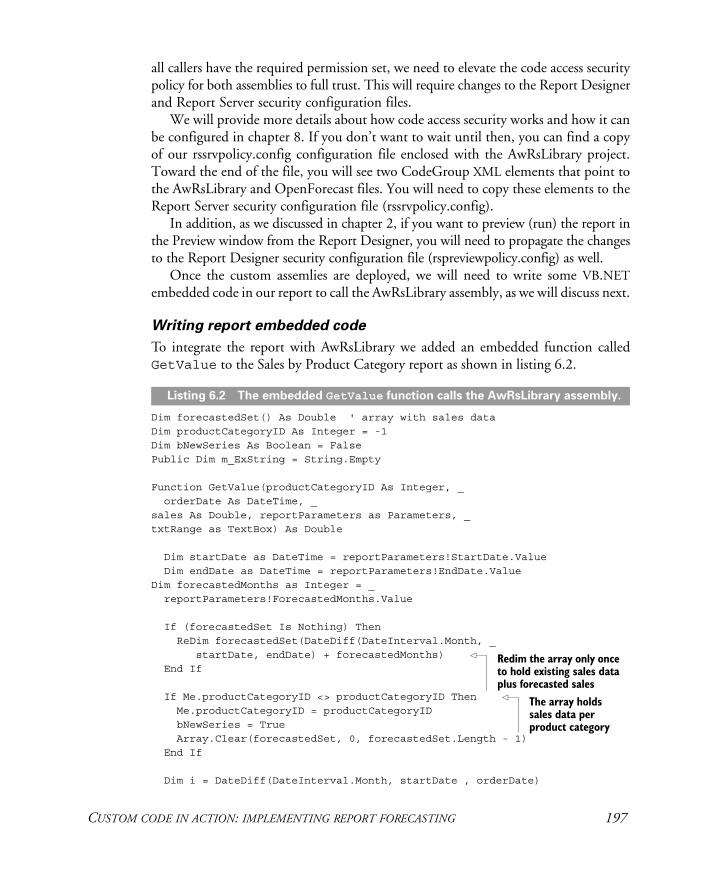
all callers have the required permission set, we need to elevate the code access securitypolicy for both assemblies to full trust. This will require changes to the Report Designerand Report Server security configuration files.
We will provide more details about how code access security works and how it canbe configured in chapter 8. If you don’t want to wait until then, you can find a copyof our rssrvpolicy.config configuration file enclosed with the AwRsLibrary project.Toward the end of the file, you will see two CodeGroup XML elements that point tothe AwRsLibrary and OpenForecast files. You will need to copy these elements to theReport Server security configuration file (rssrvpolicy.config).
In addition, as we discussed in chapter 2, if you want to preview (run) the report inthe Preview window from the Report Designer, you will need to propagate the changesto the Report Designer security configuration file (rspreviewpolicy.config) as well.
Once the custom assemlies are deployed, we will need to write some VB.NETembedded code in our report to call the AwRsLibrary assembly, as we will discuss next.
Writing report embedded code
To integrate the report with AwRsLibrary we added an embedded function calledGetValue to the Sales by Product Category report as shown in listing 6.2.
Dim forecastedSet() As Double ' array with sales dataDim productCategoryID As Integer = -1Dim bNewSeries As Boolean = FalsePublic Dim m_ExString = String.Empty
Function GetValue(productCategoryID As Integer, _ orderDate As DateTime, _sales As Double, reportParameters as Parameters, _txtRange as TextBox) As Double
Dim startDate as DateTime = reportParameters!StartDate.Value Dim endDate as DateTime = reportParameters!EndDate.ValueDim forecastedMonths as Integer = _ reportParameters!ForecastedMonths.Value If (forecastedSet Is Nothing) Then ReDim forecastedSet(DateDiff(DateInterval.Month, _ startDate, endDate) + forecastedMonths) End If
If Me.productCategoryID <> productCategoryID Then Me.productCategoryID = productCategoryID bNewSeries = True Array.Clear(forecastedSet, 0, forecastedSet.Length - 1) End If
Dim i = DateDiff(DateInterval.Month, startDate , orderDate)
Listing 6.2 The embedded GetValue function calls the AwRsLibrary assembly.
Redim the array only once to hold existing sales data plus forecasted sales
The array holds sales data per product category

198 CHAPTER 6 USING CUSTOM CODE
'Is this a forecasted value? If orderDate <= endDate Then ' No, just load the value in the array forecastedSet(i) = sales Else If bNewSeries Then Try AWC.RS.Library.RsLibrary.GetForecastedSet(_ forecastedSet, _ forecastedMonths) bNewSeries = False Catch ex As Exception m_ExString = "Exception: " & ex.Message System.Diagnostics.Trace.WriteLine(ex.ToString()) throw ex End Try End If End If ' is it forecasted value Return forecastedSet(i)End Function
Because the matrix region data cells use an expression that references the GetValuefunction, this function gets called by each data cell. Table 6.1 lists the input argumentsthat the GetValue function takes.
To understand how GetValue works, note that each data cell inside the matrixregion is fed from the forecastedSet array. If the cell doesn’t need forecasting (its corre-sponding date is within the requested date range), we just load the cell value in thearray and pass it back to display it in the matrix region. To get this working, we needto initialize the array to have a rank equal to the number of requested months plus thenumber of forecasted months. Once the matrix region moves to a new row and calls
Table 6.1 Each data cell inside the matrix region will call the GetValue embedded function
and pass the following input arguments.
Argument Purpose
productCategoryID The productCategoryID value from the rowProductCategory row grouping corresponding to the cell
orderDate The orderDate value from the colMonth column grouping corresponding to the cell
sales The aggregated sales total for this cell
reportParameters To calculate the array dimensions, GetValue needs the values of the report parameters. Instead of passing the parameters individually using Parame-ters!ParameterName.Value, we pass a reference to the report Parameters collection.
txtRange A variable that holds the error message in case an exception occurs when getting the forecasted data
Call AwRsLibrary to get the forecasted set
CUSTOM CODE IN ACTION: IMPLEMENTING REPORT FORECASTING 199
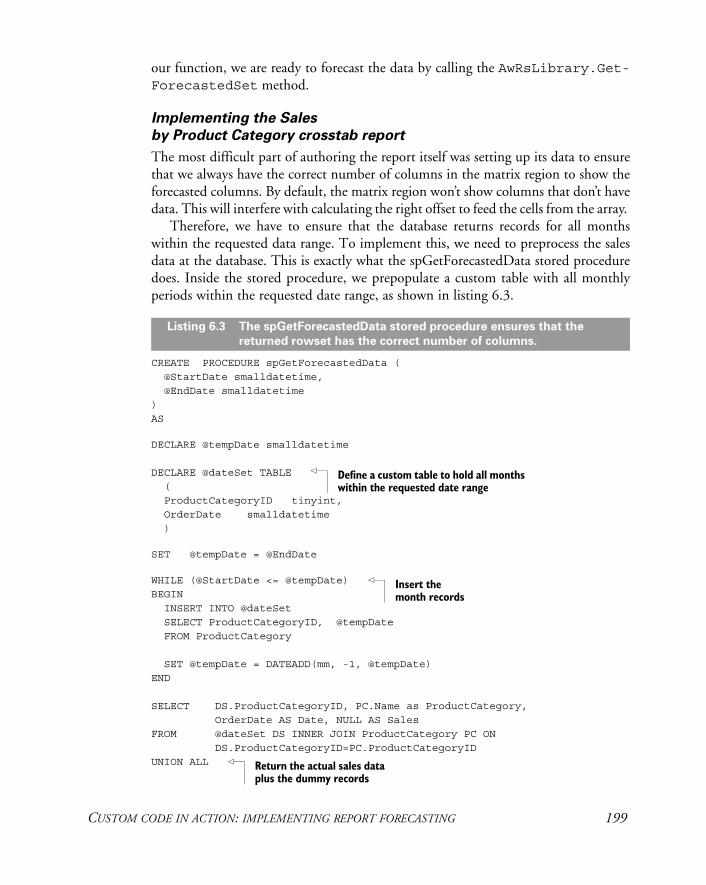
our function, we are ready to forecast the data by calling the AwRsLibrary.Get-ForecastedSet method.
Implementing the Sales
by Product Category crosstab report
The most difficult part of authoring the report itself was setting up its data to ensurethat we always have the correct number of columns in the matrix region to show theforecasted columns. By default, the matrix region won’t show columns that don’t havedata. This will interfere with calculating the right offset to feed the cells from the array.
Therefore, we have to ensure that the database returns records for all monthswithin the requested data range. To implement this, we need to preprocess the salesdata at the database. This is exactly what the spGetForecastedData stored proceduredoes. Inside the stored procedure, we prepopulate a custom table with all monthlyperiods within the requested date range, as shown in listing 6.3.
CREATE PROCEDURE spGetForecastedData ( @StartDate smalldatetime, @EndDate smalldatetime)AS
DECLARE @tempDate smalldatetime
DECLARE @dateSet TABLE ( ProductCategoryID tinyint, OrderDate smalldatetime )
SET @tempDate = @EndDate
WHILE (@StartDate <= @tempDate) BEGIN INSERT INTO @dateSet SELECT ProductCategoryID, @tempDate FROM ProductCategory
SET @tempDate = DATEADD(mm, -1, @tempDate)END
SELECT DS.ProductCategoryID, PC.Name as ProductCategory, OrderDate AS Date, NULL AS SalesFROM @dateSet DS INNER JOIN ProductCategory PC ON DS.ProductCategoryID=PC.ProductCategoryIDUNION ALL
Listing 6.3 The spGetForecastedData stored procedure ensures that the
returned rowset has the correct number of columns.
Define a custom table to hold all months within the requested date range
Insert the month records
Return the actual sales data plus the dummy records

200 CHAPTER 6 USING CUSTOM CODE
SELECT PC.ProductCategoryID, PC.Name AS ProductCategory, SOH.OrderDate AS Date, SUM(SOD.UnitPrice * SOD.OrderQty) AS SalesFROM ProductSubCategory PSC INNER JOIN ProductCategory PC ON PSC.ProductCategoryID = PC.ProductCategoryIDINNER JOIN Product P ON PSC.ProductSubCategoryID = P.ProductSubCategoryID INNER JOIN SalesOrderHeader SOH INNER JOIN SalesOrderDetail SOD ON SOH.SalesOrderID = SOD.SalesOrderID ON P.ProductID = SOD.ProductIDWHERE (SOH.OrderDate BETWEEN @StartDate AND @EndDate)GROUP BY SOH.OrderDate, PC.Name, PC.ProductCategoryIDORDER BY PC.Name, OrderDate
Finally, we union all records from the @dateSet table (its Sales column values are setto NULL) with the actual SQL statement that fetches the sales data.
Once the dataset is set, authoring the rest of the report is easy. We use a matrixregion for the crosstab portion of the report. To understand how the matrix regionmagic works and how it invokes the embedded GetValue function, you may wantto replace the expression of the txtSales textbox with the following expression:
= Fields!ProductCategoryID.Value & "," & Fields!Date.Value _ & "," & Format(Fields!Sales.Value, "C")
Figure 6.7 shows what the Sales by Product Category crosstab report looks like whenthis expression is applied.
As you can see, we can easily get to the corresponding row and column group valuesthat the matrix region uses to calculate the aggregate values in the region data cells.Now we have a way to identify each data cell. The matrix region is set up as shownin table 6.2.
Figure 6.7 How the matrix region aggregates data

CUSTOM CODE IN ACTION: IMPLEMENTING REPORT FORECASTING 201
To implement conditional formatting for the forecasted columns (show them in bold),we used the following expression for the font property of the txtSales textbox:
=Iif(Code.IsForecasted(Fields!Date.Value, Parameters!EndDate.Value), "Bold", "Normal")
This expression calls the IsForecasted function located in the report-embeddedcode. The function simply compares the sales monthly date with the requested enddate and, if the sales date is before the end date, returns false.
The only thing left for us to do is to reference the AwRsLibrary assembly using theReport Properties dialog’s References tab, as shown previously in figure 6.3. Please notethat for the purposes of this report, we don’t need to set up an Instance Name (no needto enter anything in the Classes grid), because we don’t call any instance methods.
Debugging custom code
You may find debugging custom code challenging. For this reason, I would like toshare with you a few techniques that I have found useful for custom code debugging.
There aren’t many options for debugging embedded code. The only one I havefound so far is to use the MsgBox function to output messages and variable valueswhen the report is rendered inside the Report Designer. Make sure to remove the callsto MsgBox before deploying the report to the Report Server. If you don’t, all MsgBoxcalls will result in an exception. For some reason, trace messages using System.Diag-nostics.Trace (OutputDebugString API) inside embedded code get “swallowed” anddon’t appear either in the VS.NET Output window or by using an external tracing tool.
When working with external assemblies, you have at least two debugging options:
• Output trace messages.
• Use the VS.NET debugger to step through the custom code.
Tracing
For example, in the AwRsLibrary.GetForecastedSet method, we are outputtingtrace messages using System.Dianogistics.Trace.WriteLine to display the observed andforecasted values. To see these messages when running the report inside VS.NET or ReportServer, you can use Mark Russinovich’s excellent DebugView tool, shown in figure 6.8.
Table 6.2 The trick to getting the matrix region populated with forecasted values is to base its
data cells on an expression.
Matrix Area Name Expression
Rows rowProductGroup =Fields!ProductCategory.Value
Columns colYear =Fields!Date.Value.Year
colMonth =Fields!Date.Value.Month
Data txtSales =Code.GetValue(Fields!ProductCategoryID.Value, Fields!Date.Value, Sum(Fields!Sales.Value), Parameters, ReportItems!txtRange)

202 CHAPTER 6 USING CUSTOM CODE
For more information about DebugView, see section 6.5.
Debugging custom code
You can also step through the custom assembly code using the VS.NET debugger byattaching to the Report Designer process, as follows:
Step 1 Open the custom assembly that you want to debug in a new instance ofVS.NET. Set breakpoints in your code as usual.
Step 2 In your custom assembly project properties, expand the Configuration Prop-erties node and select Debugging. Set Debug Mode to Wait to Attach to anExternal Process.
Step 3 Open your business intelligence project in another instance of VS.NET.
Step 4 Back at the custom assembly project, click on the Debug menu and thenchoose Processes. Locate the devevn process that hosts that the Business Intelli-gence project and attach to it. In the Attach To Process dialog, make sure thatthe Common Language Runtime check box is selected, and click Attach. Atthis point, your Processes dialog should look like the one shown in figure 6.9.
In this case, we want to debug the code in the AwRsLibrary assemblywhen it is invoked by the Sales by Product Category report. For this reason,in the AwRsLibrary project we attach to the AWReporter devenv process.
Figure 6.8 Outputting trace messages from external assemblies in DebugView

CUSTOM CODE IN ACTION: IMPLEMENTING REPORT FORECASTING 203
Step 5 In the Business Intelligence project, preview the report that calls the customassembly. Or, if you have already been previewing the report, press theRefresh Report button on the Preview Tab toolbar. At this point, your break-points should be hit by the VS.NET debugger.
As you will soon find out, if you need to make code changes and recompile the customassembly, trying to redeploy it to the Report Designer folder results in the followingexception:
Cannot copy <assembly name>: It is being used by another person or program.
The problem is that VS.NET IDE holds a reference to the custom assembly. You willneed to shut down VS.NET and then redeploy the new assembly. To avoid this situa-tion and make the debugging process even easier, you could debug the custom assem-bly code by using the Report Host (Preview Window). To do this, follow these steps:
Step 1 Add the custom assembly to the VS.NET solution that includes your BI project.
Step 2 Change the BI project start item to the report that calls the custom code, asshown in figure 6.10.
Step 3 Press F5 to run the report in the Preview window. When the report calls thecustom code, your breakpoints will be hit.
Figure 6.9 To debug custom assemblies, attach to the Visual Studio instance that hosts your
BI project.

204 CHAPTER 6 USING CUSTOM CODE
NOTE As explained in chapter 2, what happens when you press F5 to debug areport depends on your project settings. If both the Build and Deployoptions are selected in Configuration Manager, VS.NET will build anddeploy all reports in your Business Intelligence project before the report isdisplayed in the Preview window. To avoid this problem and launch yourreport faster, clear these options or switch to DebugLocal configuration.This configuration doesn’t include the Deploy option by default.
When using the Preview window approach, VS.NET doesn’t lock the custom assem-blies. This allows you to change the build location of your assembly to the ReportDesigner folder so that it always includes the most recent copy when you rebuild theassembly. As we explained in chapter 2, running your projects in the Preview windowis a result of the code access security policy settings specified in the Report Designerconfiguration file (rspreviewpolicy.config).
Let’s now look at another way of using custom code in reports in the form of XSLtransformations.
6.3 USING XML-BASED REPORTS
So far in this chapter, we’ve seen how we can use custom code to extend report capa-bilities programmatically. For all its flexibility, custom code has its limitations. Forexample, besides hiding report items, you cannot control the report output program-matically. However, if you export your reports to XML, you can use custom code inthe form of XSL transformations to precisely control the XML presentation of thereport, as we will discuss next.
Strictly speaking, from an implementation standpoint, exporting a report to XMLis no different than exporting it to any other rendering format, because the actual work
Figure 6.10 Use the Report Host debug option to avoid locking assemblies.

USING XML-BASED REPORTS 205
is performed by the XML rendering extension (Microsoft.ReportingServices.XmlRen-dering.dll), which happens to be one of the supported RS extensions. However, Idecided to devote a special place for it because, in my opinion, this is an extremely use-ful and important option.
Given the fact that the IT industry has embraced XML as the de facto standard fordata exchange between heterogeneous platforms, exporting a report to XML opens awhole new world of opportunity. For example, in the B2B (business-to-business) sce-nario, an organization could expose an inventory report to its vendors. A vendor couldrequest the report in XML to find out the current inventory product levels. The XMLdocument could then be sent to a BizTalk server, which could extract the productinformation and send it to the manufacturing department. We will implement a sim-ilar solution in chapter 11.
6.3.1 Understanding XML exporting
The content of the following report elements could be exported to XML: textbox, rect-angle, subreport, table region, list region, and matrix region. As a report author, youhave full control over the XML presentation of these elements. To customize the XML-rendered output of the report, you use the Data Output tab of the report element’sproperty pages. Which settings can be customized depends on the type of the element.In general, you can specify the following:
• Whether the report element and its content (for regions, groups, and rectangles)will be exported
• The XML element name• Whether the report element will be rendered as an XML attribute or element
For example, at a report level, you can specify the root node name and XML schema.At the region level, you can specify whether the region and its items will be renderedat all. At the textbox level, you can tell the Report Server whether the textbox contentwill be rendered as an XML attribute or element.
When the Data Output settings are not enough, you can further fine-tune the XML out-put by using custom XSL transformations. For example, while skipping report elements iseasy, adding additional XML nodes is not. In cases such as this, you can write an XSL trans-formation that will be applied by the Report Server after the report is rendered to XML.
Let’s now look at a practical example that demonstrates how exporting to XMLcould be useful.
6.3.2 Exposing the report content as an RSS feed
While I was trying to figure out what a good XML report could be, my favorite RSS reader(IntraVNews) popped up a new window to let me know about the current news headlines.For those of you who are not familiar with this great information medium, RSS (whichstands for all of the following: RDF Site Summary, Rich Site Summary, or Really SimpleSyndication) is an XML-based format that allows information workers to describe andsyndicate web content. Many organizations and individuals use RSS for blogging.

206 CHAPTER 6 USING CUSTOM CODE
DEFINITION A blog, short for web log, is a personal journal that is frequently updated andintended for general public consumption.
This inspired me to see if we could expose a report as an RSS feed. To give our examplea touch of reality, let’s say that Adventure Works Cycles would like to take advantageof the increasing popularity of blogging with RSS feeds. In particular, the companymanagement has requested these requirements:
• Future promotional campaigns must be exposed as an RSS feed. The AWC cus-tomers could subscribe to the feed using their favorite RSS newsreader and benotified about future product promotions.
• Each promotional item must include a hyperlink that will show more detailsabout the campaign, such as discounted products and their sale prices.
Implementation options
How can we implement the above requirements? One approach could be to add thepromotional information as static or dynamic web content to the company’s web por-tal. For example, the products page could include a section that lists the current pro-motions. As far as exporting the promotional data as XML for the purposes of the RSSfeed, we could create a Web Service that would query the Adventure Works database,retrieve the promotion details in XML, and write them into an RSS blog file.
Another implementation option could be to author an RS report that would supplyboth the HTML and XML content. The RSS Web Service could then request the reportas XML and append the promotional information to the RSS blog file. The RSS itemhyperlink could bring the customer to the HTML version of same report. Of course,the latter option assumes that you are willing to allow web users to access your ReportServer directly by URL. This is not as bad as it sounds. If Windows authentication isan issue, you can replace it with a custom security extension to authenticate and autho-rize your web users, as we will discuss in Chapter 15.
Which approach will work better for you depends on your particular needs andlimitations. In our case, we will go for the latter to demonstrate the exporting-to-XMLfeature. To recap, our design goals for the new report sample will be as follows:
• Export the report to RSS-compliant XML format.
• Append the report XML to an RSS feed (we will postpone the actual implemen-tation to chapter 9).
Implementing the report
Let’s start by creating a new report called Sales Promotion. The report gets the promo-tional data from the SpecialOffer and SpecialOfferProduct tables. In addition, it takesone parameter, Campaign ID, which the user can use to request a specific campaign.
For example, figure 6.11 shows the second page of the Sales Promotion reportwhen the user requests a campaign with an ID of 2.
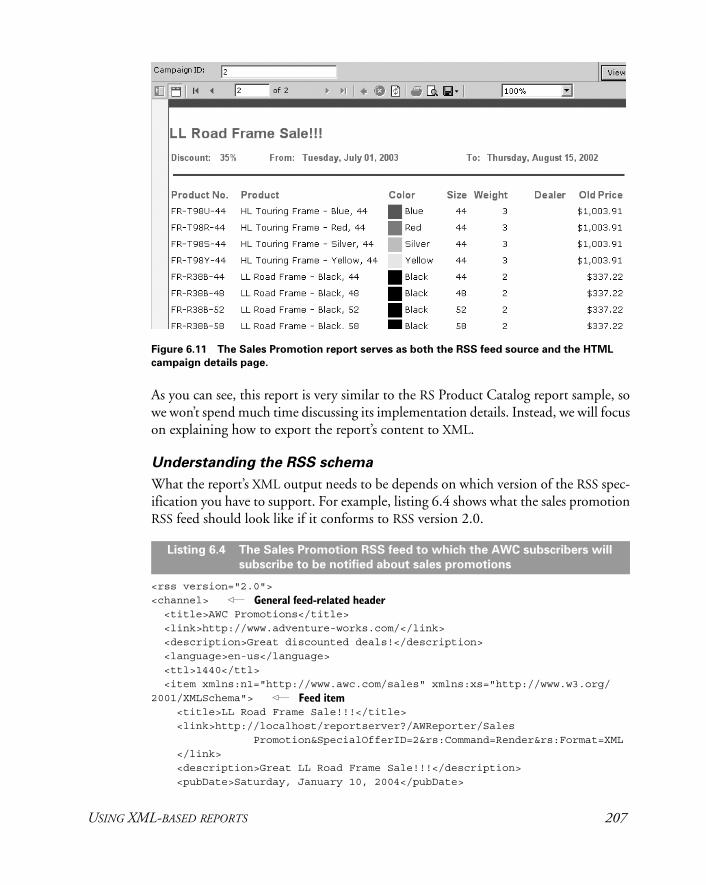
USING XML-BASED REPORTS 207
As you can see, this report is very similar to the RS Product Catalog report sample, sowe won’t spend much time discussing its implementation details. Instead, we will focuson explaining how to export the report’s content to XML.
Understanding the RSS schema
What the report’s XML output needs to be depends on which version of the RSS spec-ification you have to support. For example, listing 6.4 shows what the sales promotionRSS feed should look like if it conforms to RSS version 2.0.
<rss version="2.0"><channel> <title>AWC Promotions</title> <link>http://www.adventure-works.com/</link> <description>Great discounted deals!</description> <language>en-us</language> <ttl>1440</ttl>
<item xmlns:n1="http://www.awc.com/sales" xmlns:xs="http://www.w3.org/2001/XMLSchema"> <title>LL Road Frame Sale!!!</title> <link>http://localhost/reportserver?/AWReporter/Sales Promotion&SpecialOfferID=2&rs:Command=Render&rs:Format=XML </link> <description>Great LL Road Frame Sale!!!</description> <pubDate>Saturday, January 10, 2004</pubDate>
Figure 6.11 The Sales Promotion report serves as both the RSS feed source and the HTML
campaign details page.
Listing 6.4 The Sales Promotion RSS feed to which the AWC subscribers will
subscribe to be notified about sales promotions
General feed-related header
Feed item
208 CHAPTER 6 USING CUSTOM CODE
</item> <item xmlns:n1="http://www.awc.com/sales" xmlns:xs="http://www.w3.org/2001/XMLSchema"> <!-Another item information here- </item></channel></rss>
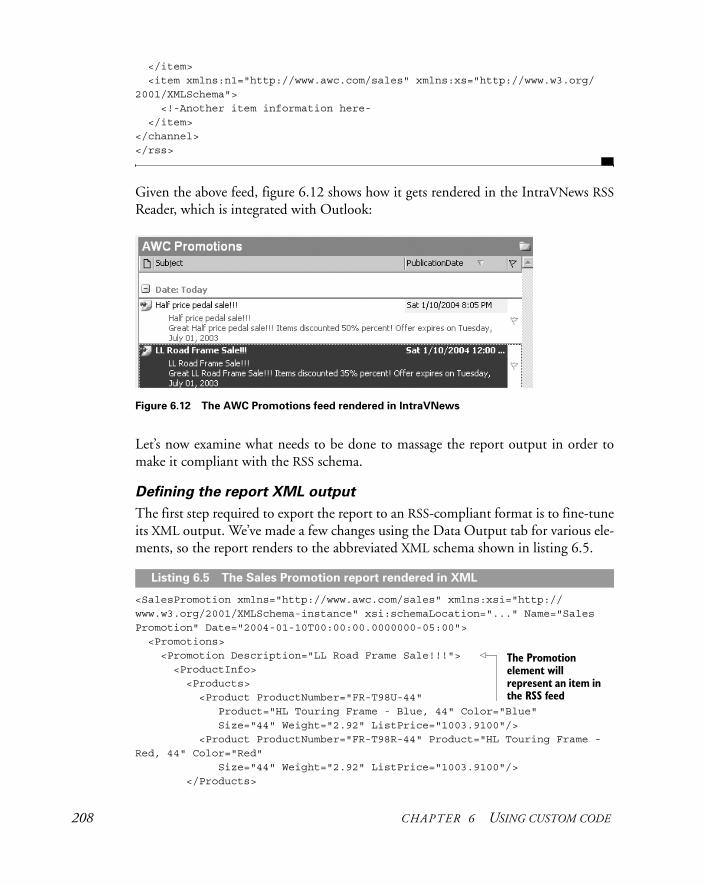
Given the above feed, figure 6.12 shows how it gets rendered in the IntraVNews RSSReader, which is integrated with Outlook:
Let’s now examine what needs to be done to massage the report output in order tomake it compliant with the RSS schema.
Defining the report XML output
The first step required to export the report to an RSS-compliant format is to fine-tuneits XML output. We’ve made a few changes using the Data Output tab for various ele-ments, so the report renders to the abbreviated XML schema shown in listing 6.5.
<SalesPromotion xmlns="http://www.awc.com/sales" xmlns:xsi="http://www.w3.org/2001/XMLSchema-instance" xsi:schemaLocation="..." Name="Sales Promotion" Date="2004-01-10T00:00:00.0000000-05:00"> <Promotions> <Promotion Description="LL Road Frame Sale!!!"> <ProductInfo> <Products> <Product ProductNumber="FR-T98U-44" Product="HL Touring Frame - Blue, 44" Color="Blue" Size="44" Weight="2.92" ListPrice="1003.9100"/> <Product ProductNumber="FR-T98R-44" Product="HL Touring Frame - Red, 44" Color="Red" Size="44" Weight="2.92" ListPrice="1003.9100"/> </Products>
Figure 6.12 The AWC Promotions feed rendered in IntraVNews
Listing 6.5 The Sales Promotion report rendered in XML
The Promotion element will represent an item in the RSS feed

USING XML-BASED REPORTS 209
</ProductInfo> </Promotion> </Promotions></SalesPromotion>
The most important change that you have to make is to explicitly set the XML Schemasetting at the report level, as shown in figure 6.13.
If the Data Schema setting is not specified, the Report Server will autogenerate theXML document global namespace to include the date when the report is processed.This will interfere with referencing the document elements from an XSL transforma-tion, so make sure you explicitly set the schema namespace.
Writing the XSL tranformation
Once you have finished making adjustments to the XML schema, the next step will beto write an XSL transformation to transform the XML output to an RSS-compliant for-mat. To fit the Sales Promotion output to the RSS schema, we wrote the simple XSLtransformation shown in listing 6.6.
<?xml version="1.0" encoding="UTF-8"?><xsl:stylesheet version="1.0" xmlns:n1="http://www.awc.com/sales"xmlns:xs="http://www.w3.org/2001/XMLSchema"> <xsl:template match="/"> <xsl:for-each select="n1:SalesPromotion/n1:Promotions/
Figure 6.13
Use the Data Output
report settings to
define the report XML
root element name
and namespace.
Listing 6.6 Use XSL transformations to fine-tune the report’s XML output.

210 CHAPTER 6 USING CUSTOM CODE
n1:Promotion"> <item> <title><xsl:value-of select="./@Description"/></title> <link>http://www.adventure-workds.com/promotions</link> <description>Great <xsl:value-of select="./@Description"/> Items discounted <xsl:value-of select="./@DiscountPct"/> percent! Offer expires on <xsl:value-of select="./@StartDate"/> </description> <pubDate><xsl:value-of select="./@StartDate"/></pubDate> </item> </xsl:for-each> </xsl:template></xsl:stylesheet>
The XSL transformation simply loops through all sales promotions and outputs themin XML according to the RSS item specification. Strictly speaking, in our case there isalways going to be only one XML sales promotion node, because we use a reportparameter to select a single campaign. Finally, we need to add the XSL transformationfile to our project. Similarly to working with images, we have to add the XSLT file tothe same report project and subsequently upload it to the report catalog when thereport is deployed. The Report Server cannot reference external XSLT files.
The last implementation step is to take care of appending the current sales promo-tion item to the RSS blog file. The easiest way to accomplish this would be to manuallyupdate the RSS feed XML file on the web server when there is a new promotional cam-paign. RSS newsreaders could reference this file directly, for example, by going tohttp://www.adventure-works.com/promotions.rss. Of course, if the requirements callfor it, the process could also be fully automated. We will see how this could be donein chapter 9, where we will implement a table trigger that invokes a custom web servicewhen a new sales promotion record is added to the database.
To subscribe to the RSS feed, AWC customers would configure their favorite RSSreaders to point to the blog file. Once they do so, they will be notified each time theblog file is updated.
6.4 SUMMARY
In this chapter we learned how to integrate our reports with custom code that we orsomeone else wrote.
For simple report-specific programming logic, you can use embedded VB.NETcode. When the code complexity increases or you prefer to use programming lan-guages other than VB.NET, you can move your code to external assemblies.
For interoperability with different platforms and languages, you can export yourreports to XML. You can control precisely the report output by using the Data Outputtab coupled with custom XSL transformations.
Loop through all Promotion elementsGenerate an RSS item
RESOURCES 211
By now, you should have enough knowledge to be able to author reports withReporting Services. We’ll now move on to the second phase of the report lifecycle:report management.
6.5 RESOURCES
The OpenForecast web site (http://openforecast.sourceforge.net/)
Microsoft Java Language Conversion Assistant (http://msdn.microsoft.com/vstudio/downloads/tools/jlca/default.aspx)Converts Java-language code to C#
Mark Russinovich’s DebugView tool(http://www.sysinternals.com/ntw2k/freeware/debugview.shtml)
What is RSS? (http://www.xml.com/pub/a/2002/12/18/dive-into-xml.html)A good introduction to RSS
Lutz Roeder’s .NET Reflector (http://www.aisto.com/roeder/dotnet/)Similar to the VS.NET Object Browser, Reflector is a class browser for .NETcomponents.
M A N N I N G $39.95 US/$55.95 Canada
Business reporting is a lifeline of business, so a better reportingenvironment is a big deal. With a sophisticated, modern tool likeMicrosoft Reporting Services, you can report-enable any type of
application, regardless of its targeted platform or development language.
Written for information workers, system administrators, and developers,this book is a detailed and practical guide to the functionality provided byReporting Services. It systematically shows off many powerful RS featuresby leading you through a dizzying variety of possible uses. Following a typ-ical report lifecycle, the book shows you how to create, manage, and deliv-er RS reports.
In the first half, you will master the skills you need to create reports.System administrators will learn the ropes of managing and securing thereport environment. The second half of the book teaches developers thetechniques they need to integrate RS with their WinForm or web-basedapplications. It exercises RS through a wide variety of real-world scenar-ios—one of this book’s strengths are its many useful examples.
What’s Inside■ Extend RS with custom code■ Expose reports as RSS feeds■ Implement dynamic reports with Office Web Components■ Create reports off ADO.NET datasets■ Deliver reports to Web Services■ Customize RS security■ Evaluate RS performance and capacity■ and much more
A technology consultant with the Enterprise Application Services practiceof Hewlett-Packard, Teo Lachev has more than 11 years’ experience design-ing and developing Microsoft-centric solutions. He is a MicrosoftCertified Solution Developer and a Microsoft Certified Trainer. Teo livesin Atlanta, GA.
Microsoft Reporting Services IN ACTIONTeo Lachev
,!7IB9D2-djeccb!:p;n;T;T;pISBN 1-932394-22-2
www.manning.com/lachev
Ask the Author Ebook edition
AUTHOR✔
ONLINE
✔