Embed Size (px)
Citation preview

&he
2 b m
SLAC-PUB-95-7006 September, 1995
Numerical Simulation of PEP-I1 Beam Position Monitor*
N. Kurita, D. Martin, C.-K. Ng, S. Smith Stanford Linear Accelerator Center
Stanford University, Stanford, CA 94309, USA
and
T. Weiland University of Technology FB18, Schlossgartenstr. 8
D64289, Darmstadt, Germany.
Abstract
We use MAFIA to analyze the PEP-I1 button-type beam position monitor (BPM). Employing proper termination of the BPM into a coaxial cable, the output signal at the BPM is determined. Thus the issues of signal sensitivity and power output can be addressed quantitatively, including all transient effects and wakefields. Besides this first quantitative analysis of a true BPM 3D structure, we find that internal resonant modes are a major source of high value narrow-band impedances. The effects of these resonances on coupled-bunch instabilities are discussed. An estimate of the power dissipation in the ceramic vacuum seal under high current operation is given.
Presented at the Workshop on Collective E$ects and Impedance for B-Factories, Tsukuba, Japan, June 12-1'7, 1995
Work supported by Department of Energy, contract DEAC03-76SF00515. MASTE &
DISTRIBUTION OF THE DOCUMENT IS UNtIMtTEb

1 Introduction There are several issues of concern for the button-type BPMs in the PEP-I1 [l] vacuum
chamber. First, the presence of BPMs in the vacuum chamber contributes significant impedances, broad-band and narrow-band. For broad-band impedance, the contribution of all the BPMs to the total impedance budget can be readily calculated. Narrow-band impedances arise from the formation of resonances or trapped modes in the BPM, which may have detrimental effects on the beams because of coupled-bunch instabilities, and which may produce heating effects above tolerable levels. Second, the power coming out of the cable connected to the BPM should not be too high such that it is within the handling capability of the diagnostic electronics, but not at the expense of losing the signal sensitivity at the processing frequency of 952 MHz. Third, the power carried by the trapped modes and by the signal, especially when the beam is offset, may produce considerable heating in the ceramic and metallic walls of the BPM. These issues are closely related to each other, thus increasing the complexity of designing the BPM. In view of these electrical and mechanical requirements, BPMs with 1.5-cm diameter buttons have been selected for the PEP-11.
In the next section, we describe the essential features of the MAFIA modeling of the BPM. The calculations are carried out in the time domain to obtain the wakefield and other relevant information. In section 3, we present the main results of the numerical simulation. The longitudinal broad-band and narrow-band impedances, the signal sensitivity and power output at the coaxial cable are calculated. We estimate the power dissipation in the ceramic vacuum seal in section 4. A summary of the results is given in section 5. In this paper, we are mainly concerned with the electrical properties of the BPM. The mechanical design of the BPM can be found in
The paper is organized as follows.
Ref. [2].
2 MAFIA Modeling The detailed layout of the BPM in the arcs of the PEP-I1 High Energy Ring (HER)
is shown in Fig. 1. Each BPM consists of four buttons, located symmetrically at the top and at the bottom of the vacuum chamber; The HER arc sections have totally 198 BPMs. There are 92 BPMs in the straight sections of the HER, and the four buttons are located symmetrically at 90" from each other at the circumference of the circular pipe. The BPM button is tapered in such a way that the impedance matches that of a 50 s1 coaxial line. A ceramic ring for vacuum insulation is located near the button region. It has a dielectric constant of about 9.5. The inner radius of the ceramic vacuum seal needs to be adjusted for optimum matching.
The 3D MAFIA model of the BPM is shown in Fig. 2. Because of symmetry, only one quarter of the structure is simulated. One button of the BPM is situated on the top of the -
t tapers gradually to a coaxial line above. The simulation is done hich consists of two kinds of calculations, namely wakefield and
2

.
DISCLAIMER
Portions of this document may be illegible electronic image products. Images are produced from the best available original document.

Figure 1: Layout of the 4 buttons of a BPM in the arcs of the HER vacuum chamber.
port transmission calculations. For wakefield calculation, a rigid beam comes in along the z-direction. It excites electromagnetic fields at the BPM, which in turn act back on the beam. The boundary conditions at the beam entrance and exit planes are set to waveguide boundary conditions so that electromagnetic waves traveling to these boundaries are not reflected. At the top boundary of the coaxial line, it is treated as an outgoing waveguide port, where the transmission of the signal is determined. A two-dimensional eigenvalue problem is first solved to determine the propagating and evanescent modes of the coaxial line. These modes are then loaded at the port in the 3D time domain calculation. Since the beam excites a broad frequency spectrum, a broad-band boundary has to be implemented at the waveguide port.
The impedance of a BPM can be evaluated from the wakefield or its Fourier trans- form. From the Fourier transform of the wakefield, we can identify potential resonant modes excited by the beam in the BPM. Since the resolution of narrow resonances in the impedance spectrum depends on the number of sampling points in the wakefield calcula- tion, we evaluate the wakefield up to a long distance of s = 5 m, where s is the bunch coordinate. The transmission calculation at the port gives us the value of the outgoing voltage at the end of the coaxial line as a function of time, which corresponds to the signal picked up by the BPM as the beam passes through this region of the vacuum chamber.
3
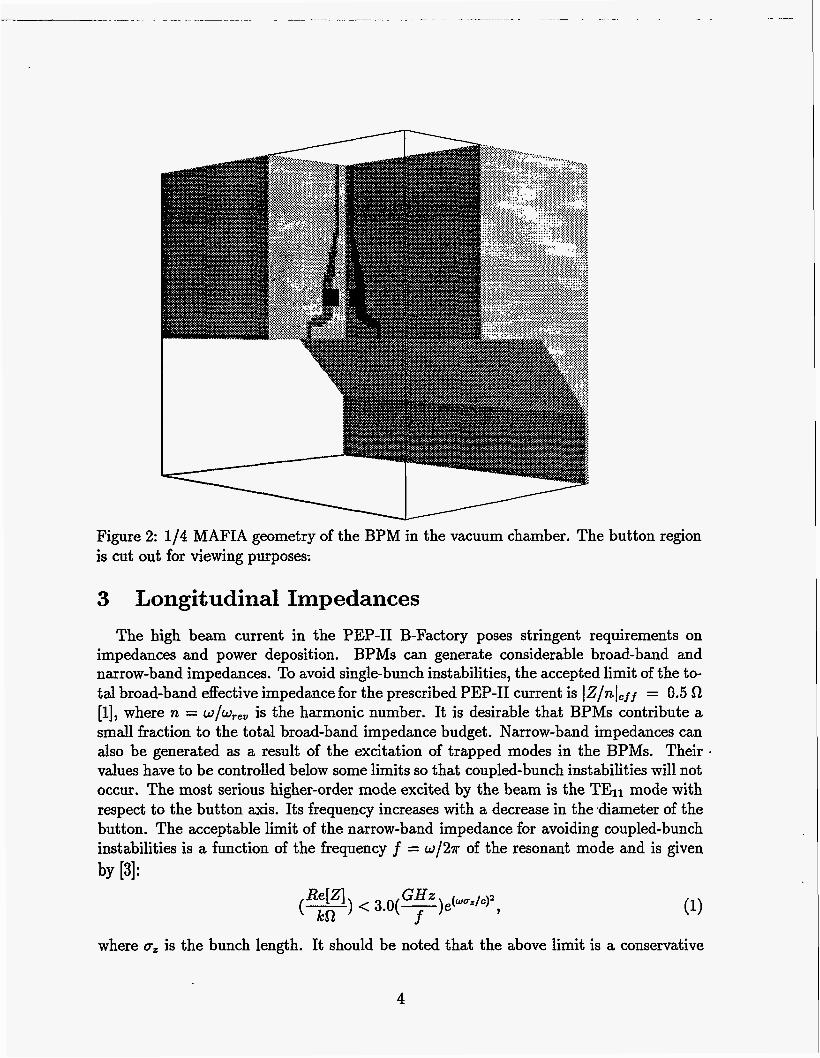
Figure 2: 1/4 MAFIA geometry of the BPM in the vacuum chamber. The button region is cut out for viewing purposes:
3 Longitudinal Impedances The high beam current in the PEP-I1 B-Factory poses stringent requirements on
impedances and power deposition. BPMs can generate considerable broad-band and narrow-band impedances. To avoid single-bunch instabilities, the accepted limit of the to- tal broad-band effective impedance for the prescribed PEP-I1 current is IZ/nlejj = 0.5 Cn [l], where n = w/w,,, is the harmonic number. It is desirable that BPMs contribute a small fraction to the total broad-band impedance budget. Narrow-band impedances can also be generated as a result of the excitation of trapped modes in the BPMs. Their values have to be controlled below some limits so that coupled-bunch instabilities will not occur. The most serious higher-order mode excited by the beam is the TEll mode with respect to the button axis. Its frequency increases with a decrease in the ,diameter of the button. The acceptable limit of the narrow-band impedance for avoiding coupled-bunch instabilities is a function of the frequency f = w/2n of the resonant mode and is given
where a, is the bunch length. It should be noted that the above limit is a conservative
4
estimate since it takes into account of only radiation damping. Other damping mech- anisms such its feedback will help suppress the narrow-band resonance. The numerical factor is given for the Low Energy Ring (LER) with a current of 3 A, and the limit is inversely proportional to the current. The exponential factor indicates the decay of the beam spectrum at high frequencies.
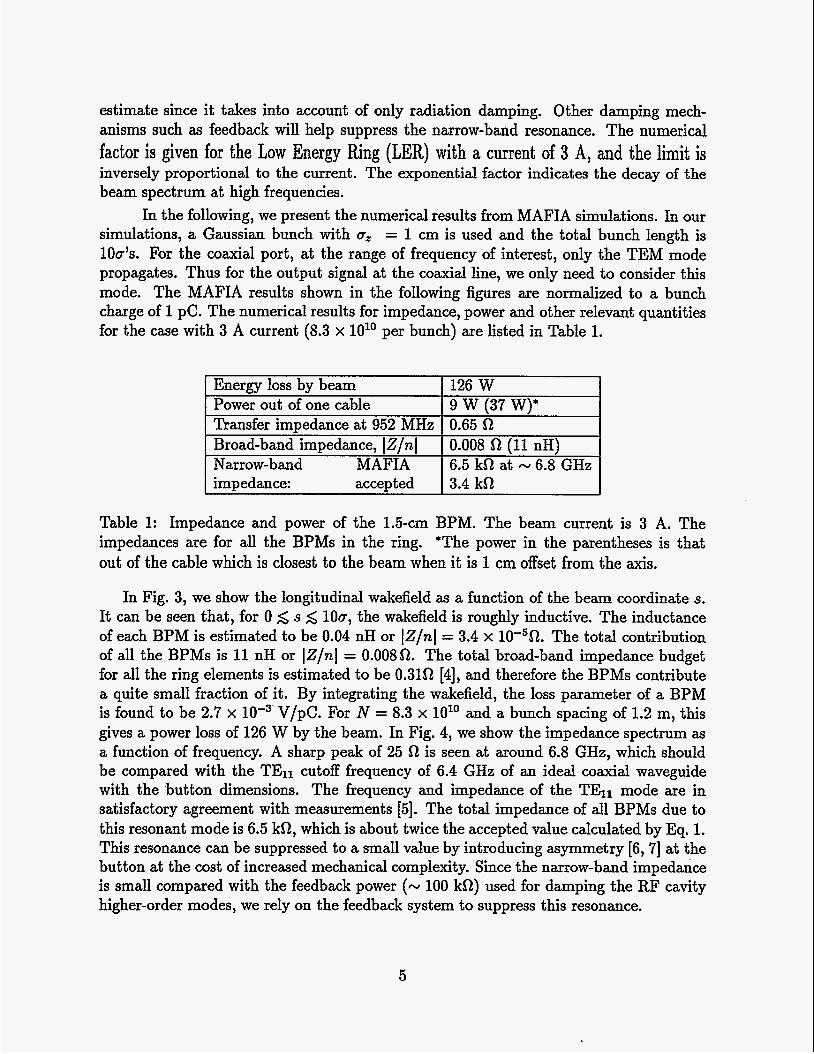
In the following, we present the numerical results from MAFIA simulations. In our simulations, a Gaussian bunch with a, = 1 cm is used and the total bunch length is 100's. For the coaxial port, at the range of frequency of interest, only the TEM mode propagates. Thus for the output signal at the coaxial line, we only need to consider this mode. The MAFIA results shown in the following figures are normalized to a bunch charge of 1 pC. The numerical results for impedance, power and other relevant quantities for the case with 3 A current (8.3 x 10" per bunch) are listed in Table 1.
Energy loss by beam Power out of one cable Transfer impedance at 952 MHz Broad-band impedance, IZ/nl Narrow-band MAFIA impedance: accepted
126 W
0.65 52 0.008 52 (11 nH) 6.5 k52 at N 6.8 GHz 3.4 k52
9 w (37 W)*
Table 1: Impedance and power of the 1.5-cm BPM. The beam current is 3 A. The impedances are for all the BPMs in the ring. *The power in the parentheses is that out of the cable which is closest to the beam when it is 1 cm offset from the axis.
In Fig. 3, we show the longitudinal wakefield as a function of the beam coordinate s. It can be seen that, for 0 5 s 5 100, the wakefield is roughly inductive. The inductance of each BPM is estimated to be 0.04 nH or IZ/nl = 3.4 x 10⁻⁵fl. The total contribution of all the BPMs is 11 nH or IZ/nl = 0.00852. The total broad-band impedance budget for all the ring elements is estimated to be 0.3152 [4], and therefore the BPMs contribute a quite small fraction of it. By integrating the wakefield, the loss parameter of a BPM is found to be 2.7 x 10⁻³ V/pC. For N = 8.3 x 10" and a bunch spacing of 1.2 m, this gives a power loss of 126 W by the beam. In Fig. 4, we show the impedance spectrum as a function of frequency. A sharp peak of 25 52 is seen at around 6.8 GHz, which should be compared with the TEll cutoff frequency of 6.4 GHz of an ideal coaxial waveguide with the button dimensions. The frequency and impedance of the TEll mode are in satisfactory agreement with measurements [5]. The total impedance of all BPMs due to this resonant mode is 6.5 k52, which is about twice the accepted value calculated by Eq. 1. This resonance can be suppressed to a small value by introducing asymmetry [6,7] at the button at the cost of increased mechanical complexity. Since the narrow-band impedance is small compared with the feedback power (w 100 k52) used for damping the RF cavity higher-order modes, we rely on the feedback system to suppress this resonance.
5

n
u a 3 \
U
\
m n
W
5
-. 010:
-.015-
.OlO] I
. . . , 1 ' " ' I ' " ' I ' " '
.o 10.0 20.0 30.0 40.0 Frequency f/c / [l/m]
Figure 4: Longitudinal impedance spectrum of the 1.5-cm BPM as a function of the inverse wavelength for a Gaussian bunch with a, = 1 cm.
6

.OlO L
1
I ’
20.0 .o 5.0 10.0 15.0 Time/ns
Figure 5: Voltage output of the 1.5-cm BPM at the coaxial line as a function of time.
-I
3.5 :
3.0 : - - -
0 \
2.0:
10.0 .o 2.0 4.0 6.0 8.0
f /GHz Figure 6: Beam-to-signal transfer function of the 1.5-cm BPM at the coaxial line as a function of frequency.
7
4 Signal and Power Output In Fig. 5, we show the output signal of the TEM mode at the coaxial line as a function
of time. The signal dies off rapidly after the transient excitation during the passage of the beam. The power output can be evaluated by integrating the signal voltage over time. When the beam is offset from the center of the chamber, the monitor closest to the beam will transmit the highest power. The power carried by the signal for this monitor for an 1 cm offset beam is 37 W, which can be handled by the diagnostic electronics. Fig. 6 shows the Fourier transform of the output signal divided by the beam current spectrum. The frequency content of the signal is quite broad-band and there is no evidence of high narrow peaks up to 10 GHz. In particular, at 952 MHz, the transfer impedance is 0.65 a, which is above our minimum requirement of 0.5 51.
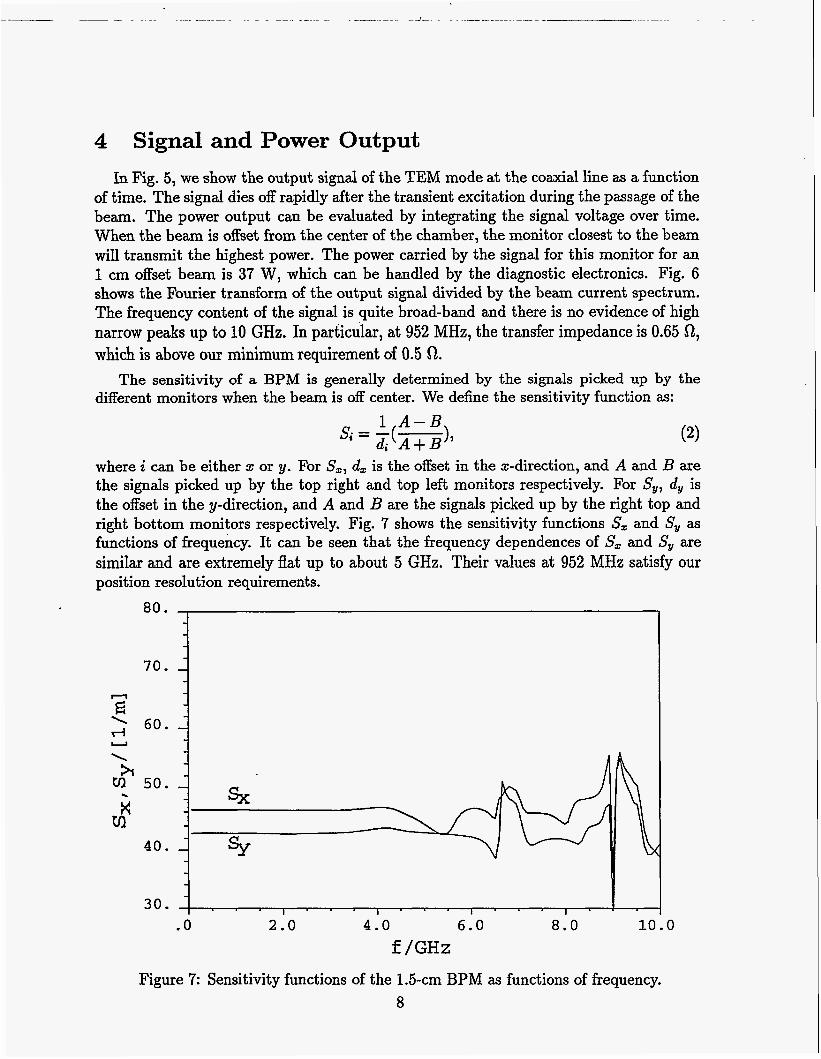
The sensitivity of a BPM is generally determined by the signals picked up by the different monitors when the beam is off center. We define the sensitivity function as:
1 A - B di A + B si = -(-),
where i can be either 2 or y. For S,, d, is the offset in the s-direction, and A and B are the signals picked up by the top right and top left monitors respectively. For Sy, dy is the offset in the y-direction, and A and B are the signals picked up by the right top and right bottom monitors respectively. Fig. 7 shows the sensitivity functions S, and Sy as functions of frequency. It can be seen that the frequency dependences of S, and Sy are similar and are extremely flat up to about 5 GHz. Their values at 952 MHz satisfy our position resolution requirements.
80. - -
70. - - n - E - ' 60. ri U
3 0 . 1 . . , , , , . , . , . , , . , , , 1 , .o 2.0 4.0 6.0 8.0 10.0
f /GHz Figure 7: Sensitivity functions of the 1.5-cm BPM as functions of frequency.
8
5 Power Dissipation The high power throughput of the signal and the presence of HOMs in the BPM may
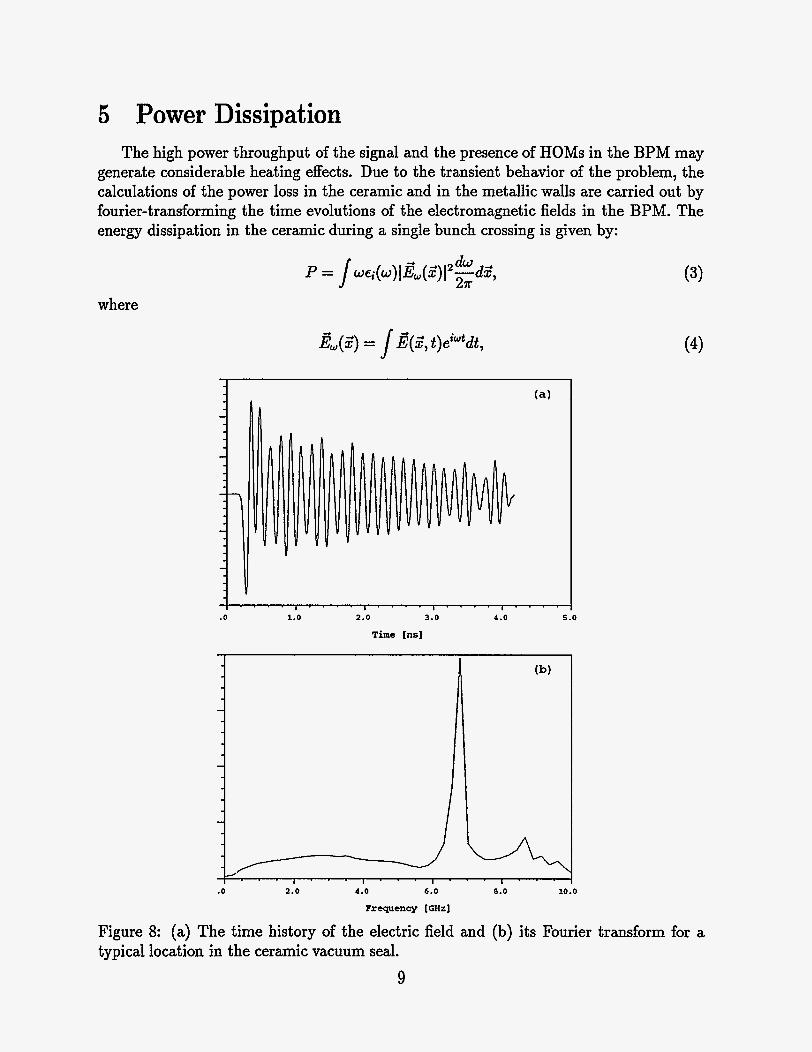
generate considerable heating effects. Due to the transient behavior of the problem, the calculations of the power loss in the ceramic and in the metallic walls are carried out by fourier-transforming the time evolutions of the electromagnetic fields in the BPM. The energy dissipation in the ceramic during a single bunch crossing is given by:
where
.O 1.0 2.0 3 .0 4.0 5 .0
Time [ns]
.O 2.0 4.0 6.0 8.0 10.0
Frequency [GHz]
Figure 8: (a) The time history of the electric field and (b) its Fourier transform for a typical location in the ceramic vacuum seal.
9
and E; is the imaginary part of the dielectric constant. The time dependence of the electric field and its Fourier transform at a typical location in the ceramic vacuum seal is shown in Fig. 8. A resonant peak appears in the Fourier spectrum, corresponding to the trapped TE mode in the BPM. Since the Q value of the resonance is about 100, we do not expect heating enhancement due to multi-bunch effects. Therefore it is sufficient to use the above formulas to determine the power dissipation. Assuming the ceramic has a dielectric constant of 9.5 and a loss tangent of 0.0007, we find that the ceramic loss is - 0.35 W when the beam is offset by 1 cm at 3 A. At the junction of the ceramic and inner molybdenum center pin where heating effects are of more concern than the outer wall, the power loss is found to be - 0.007 W, assuming copper conductivity. The introduction of other material such as nickel on the surface of the center pin will increase the power dissipation roughly by an order of magnitude. ANSYS were used to estimate the thermal and structural stabilities of the BPM under these conditions with an additional heat source of 0.25 W/cm2 from scattered synchrotron radiation. A maximum temperature of 110°C was found on the button and a temperature gradient of about 30°C in the ceramic. ANSYS simulations showed that the temperature and stress distributions are acceptable [2].
6 Summary We simulated the PEP-I1 BPM using MAFIA and showed that the 1.5-cm button
type BPM has the required transfer impedance and signal sensitivity. The broad-band impedance is a small fraction of the ring impedance, and the narrow-band impedance can be suppressed by the feedback system. The power dissipated in the ceramic vacuum seal was estimated, and temperature and stress distributions were found to be acceptable from ANSYS simulations.
Acknowledgements We would like to thank J. Corlett, S. Heifets, K. KO, G. Lambertson, M.'Nordby,
J. Seeman and T. Shintake for many useful discussions.
References [l] An Asymmetric B Factory, Conceptual Design Report, LBL-PUB-5379 or SLAC-418, June
[2] N. Kurita et. al., Design of the Button Beam Position Monitor for PEP-11, to be published
[3] S . Heifets, Estimate of the Wakefield Tolerances, AP-99 (1994). [4] S . Heifets, Broad Band Impedance of the B-Factory, SLAC/AP-93 (1992). [5] J. Corlett, these proceedings. [SI T. Shintake et. al., these proceedings. [7] N. Kurita et. al., Simulation of PEP-I1 Beam Position Monitors, PEP-I1 Technical Note
1993.
in Proc. of PAC95.
No: 87, 1995.
10


![PEP I1 16-Channel Corrector Controller Using BITBUS'/67531/metadc689960/m2/1/high_re… · BITBUS, a subset of SDLC [2]. The individual packet length is limited to 43 bytes due to](https://img.pdfslide.us/doc/110x75/5ebb7a858772db18c74d18fa/pep-i1-16-channel-corrector-controller-using-bitbus-67531metadc689960m21highre.jpg)