Embed Size (px)
Citation preview

AMP Series – Academia Meets Practice [Mike Lewis & Manish Tripathi] Note on Fan Equity
[email protected] CONFIDENTIAL [email protected]
Fan Equity Part 1: Measurement and Management of Sports Organization’s Brand Equity
Version 1.0: January 2015
The information revolution has led to fundamental shifts in how marketing is
viewed and conducted. As information technology has become more sophisticated
and data has become cheaper and more plentiful, marketing organizations are
increasingly able to quantify the impact of marketing decisions and the value of
marketing assets.
This last phrase “marketing assets” may be unfamiliar. It is still somewhat unusual
for marketing organizations to think of themselves as asset managers. However,
with the growing availability of data marketers can now go beyond “gut feel” and
can focus on the measurement and development of brand and customer assets. In
the first entry in the AMP series we focused on the management of an
organization’s “customer relationship assets.” In that document, we discussed the
relationship between the long-term value of customer relationships and marketing
activities.
In this article, we consider the value of sports organizations’ brands. This includes
the description of a methodology for measuring brand equity or, as we will call it
Fan Equity. We will also provide some guidance for how organizations can begin
to link marketing decisions and team outcomes to Fan Equity development.
Brand equity is an established marketing concept. Intuitively, we know that the
Coca-Cola name or the Nike Swoosh has an economic value. Brand equity is in
practice, however, a difficult asset to measure and manage due to its inherent

AMP Series – Academia Meets Practice [Mike Lewis & Manish Tripathi] Note on Fan Equity
[email protected] CONFIDENTIAL [email protected]
intangibility. Fundamentally, a brand has value because of how consumers think
about the brand and the emotional connections they have to the brand (or team in
our case). The objective of this article is to discuss the measurement and
management of a team’s brand equity. Given the special relationship that exists
between teams and fans, we prefer the phrase Fan Equity when considering brand
equity in the world of sports.
We begin this article with multiple goals. In addition to laying a conceptual
foundation, we also have multiple practical aims. We spend a great deal of time on
applied issues with an emphasis on applying statistical techniques to brand equity
measurement. Specific goals are as follows:
GOALS
• Introduce the concept of Brand / Fan Equity
• Describe a statistical methodology for measuring brand / Fan Equity based
on revenue premiums
• Provide examples of the application of the revenue premium model
• Discuss alternative approaches to brand equity management
• Provide several examples of how marketing decisions and team results can
influence Brand / Fan Equity
To accomplish our objectives, this document is organized as follows. We start
with a brief discussion of the concept of brand equity and how this concept may be
applied to sports. In this section we discuss our preference for the term Fan
Equity.

AMP Series – Academia Meets Practice [Mike Lewis & Manish Tripathi] Note on Fan Equity
[email protected] CONFIDENTIAL [email protected]
Section 2 describes an approach for measuring Fan Equity. This section focuses
on the logic of our approach, necessary data and statistical techniques. Section 3
then implements the model and reports sample Fan Equity rankings for the NBA.
Within this section we take a deeper dive into several of the rankings to further
explore how the “revenue premium” model works.
Section 4 provides some preliminary guidance related to how the Fan Equity
metric may be used to evaluate and guide marketing decisions. This section is
fairly elementary as we plan to publish a follow up document that provides more
details and several examples of how the Fan Equity model may be used to
evaluate the impact of on-field success, player success and marketing strategies.
Section 5 provides some final thoughts about the revenue premium based model of
Fan Equity. In particular we examine the weaknesses of the model and discuss
other possible approaches.
SECTIONS
1. Brand Equity in Sports
2. Measuring Fan Equity
3. Example: The NBA
4. Fan Equity and Marketing Decisions
5. Critique and Alternative Approaches

AMP Series – Academia Meets Practice [Mike Lewis & Manish Tripathi] Note on Fan Equity
[email protected] CONFIDENTIAL [email protected]
1. Brand Equity and Sports
Brand equity is a core-marketing concept. The basic idea is that brand names,
symbols, and other assets have an economic value. Economic value exists because
high equity brands often result in decreased price sensitivity and increased
customer loyalty. The brand equity concept is a natural fit for sports marketing
since sports fans have extraordinary levels of loyalty and are often willing to pay
substantial prices.
As noted, brand equity is an established marketing concept. For instance, a
common framework for considering brand equity is David Aaker’s model. Aaker
identifies five components of brand equity: Brand Loyalty, Brand Awareness,
Perceived Quality, Brand Associations and Other Proprietary Assets. While this
framework provides guidance for thinking about brand equity, it does not provide a
clear path to measuring and managing brand equity. Aaker’s model does,
however, suggest the means by which brand equity leads to increased revenues and
profits. Factors such as increased loyalty and perceived quality likely manifest as
higher demand levels and increased willingness to pay higher prices. The
implication is that looking at loyalty and pricing power that is not explained by
product quality may measure brand equity.
Our preferred approach to moving the brand equity concept to an empirical reality
is to use market outcomes to make relative assessments of brand equity. For
example, the academic literature has discussed price and market premiums as
measures for brand equity. The key in these “premium” based approaches is an
ability to monitor the market response metric of interest (prices, market share,
etc…) and an ability to identify and control for quality differences.
AMP Series – Academia Meets Practice [Mike Lewis & Manish Tripathi] Note on Fan Equity
[email protected] CONFIDENTIAL [email protected]
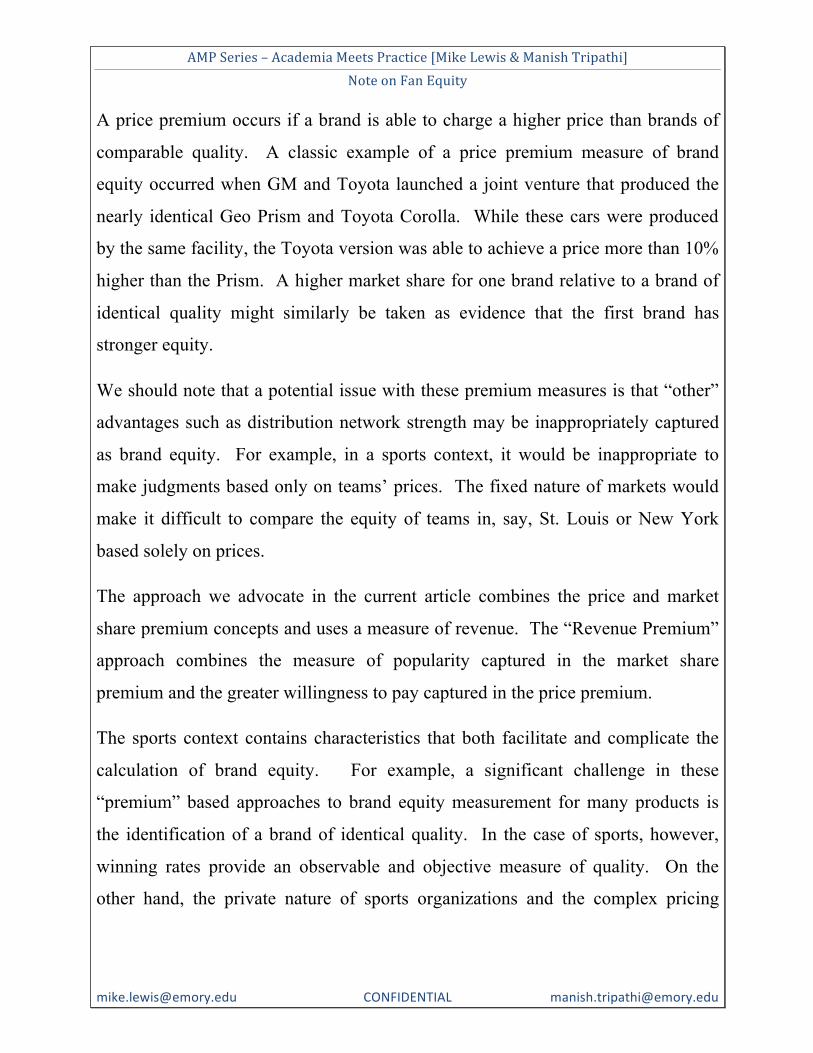
A price premium occurs if a brand is able to charge a higher price than brands of
comparable quality. A classic example of a price premium measure of brand
equity occurred when GM and Toyota launched a joint venture that produced the
nearly identical Geo Prism and Toyota Corolla. While these cars were produced
by the same facility, the Toyota version was able to achieve a price more than 10%
higher than the Prism. A higher market share for one brand relative to a brand of
identical quality might similarly be taken as evidence that the first brand has
stronger equity.
We should note that a potential issue with these premium measures is that “other”
advantages such as distribution network strength may be inappropriately captured
as brand equity. For example, in a sports context, it would be inappropriate to
make judgments based only on teams’ prices. The fixed nature of markets would
make it difficult to compare the equity of teams in, say, St. Louis or New York
based solely on prices.
The approach we advocate in the current article combines the price and market
share premium concepts and uses a measure of revenue. The “Revenue Premium”
approach combines the measure of popularity captured in the market share
premium and the greater willingness to pay captured in the price premium.
The sports context contains characteristics that both facilitate and complicate the
calculation of brand equity. For example, a significant challenge in these
“premium” based approaches to brand equity measurement for many products is
the identification of a brand of identical quality. In the case of sports, however,
winning rates provide an observable and objective measure of quality. On the
other hand, the private nature of sports organizations and the complex pricing

AMP Series – Academia Meets Practice [Mike Lewis & Manish Tripathi] Note on Fan Equity
[email protected] CONFIDENTIAL [email protected]
structures used to sell tickets often complicates the collection of market response
data.
Key Principles
• Brands are an economically valuable asset as stronger brands are associated
with higher loyalty rates and diminished price sensitivity.
• There are a variety of approaches to measure brand equity. A particularly
powerful approach is to use market based evidence such as observed price or
market share premiums.
• We advocate the use of “revenue premium” because revenue combines both
popularity (market share) and pricing power.
• The sports category is well suited to a “revenue premium” based approach
because quality is objectively and directly observable. But challenges
related to market demand data and pricing complexity also exist.

AMP Series – Academia Meets Practice [Mike Lewis & Manish Tripathi] Note on Fan Equity
[email protected] CONFIDENTIAL [email protected]
2. Measuring Fan Equity
Our baseline concept of Fan Equity is similar in spirit to brand equity but is
adapted to focus specifically on the intensity of customer preference. The term fan
intensity is important because we are trying to capture the “pure” value of team
brands as opposed to the value that is purely driven by location. In most
categories, brands can sell across multiple markets. In sports, teams’ market
regions tend to be largely fixed. This complicates the calculation of brand value
simply because teams in more populous and affluent markets have higher revenue
potentials. In terms of an overall brand equity measurement, it would be important
to include these market characteristics. Our interest in the current article is to
focus on measures of fan interest or engagement rather than to simply measure the
value of playing in New York rather than Orlando.
We calculate Fan Equity using a revenue-premium model. The basic approach is
to develop a statistical model of team revenues based on team performance and
market characteristics. We then compare the forecasted revenues from this model
for each team to actual revenues. When teams’ actual revenues exceed predicted
revenues, we take this as evidence of superior fan support.
The Fan Equity measure has some significant benefits. First, since it is calculated
using revenues, it is based on actual fan spending decisions. In general, measures
based on actual purchasing are preferred to survey based data. The other key
benefit is that a statistical model is used to control for factors such as market size
and short-term variations in team performance. This allows the measure to reflect
true preference levels for a team, rather than effects due to a team playing in a
large market or because a team is currently a winner.

AMP Series – Academia Meets Practice [Mike Lewis & Manish Tripathi] Note on Fan Equity
[email protected] CONFIDENTIAL [email protected]
For the mathematically inclined, we describe a simple version of the Fan Equity
model below. Equation (1) simply states that team i’s box office revenue in season
t is a function of the team’s performance in season t, the economic potential or
characteristics of the team’s home market and the team’s “Fan Equity.”
(1) 𝑅𝑒𝑣𝑒𝑛𝑢𝑒 𝑡𝑒𝑎𝑚 𝑖, 𝑠𝑒𝑎𝑠𝑜𝑛 𝑡 =
𝑓(𝑡𝑒𝑎𝑚 𝑝𝑒𝑟𝑓𝑜𝑟𝑚𝑎𝑛𝑐𝑒,𝑚𝑎𝑟𝑘𝑒𝑡 𝑝𝑜𝑡𝑒𝑛𝑡𝑖𝑎𝑙,𝐹𝑎𝑛 𝐸𝑞𝑢𝑖𝑡𝑦)
We implement equation (1) through a statistical model. For example, if we wished
to use linear regression we would translate equation (1) into something like
equation (2) below.
(2) 𝑅𝑒𝑣 𝑖, 𝑡 = 𝛽! + 𝛽!𝑊𝑖𝑛% 𝑖, 𝑡 + 𝛽!𝑃𝑙𝑎𝑦𝑜𝑓𝑓 𝑖, 𝑡 + 𝛽!𝑃𝑜𝑝𝑢𝑙𝑎𝑡𝑖𝑜𝑛 + 𝜀!,!
Equation (2) says that a team’s revenue is a linear function of its winning
percentage in the current season, whether or not the team made the playoffs and the
population of the team’s market. This is, obviously, a simple expression for
revenue. The winning percentage and playoff variables are included to capture
team quality, and the population variable is intended to control for variations in
market potential. In practice, additional variables would be included in the model,
and the model specification would not necessarily be a simple linear expression.
The 𝜀!,! term at the end of the equation may be interpreted as an error term that
captures factors (such as Fan Equity) not included in the model.
Equation (2) is estimated (meaning that we determine the values of the 𝛽′𝑠 through
statistical analysis) using multiple years of data for each team in a given league.
This is a critical point that deserves emphasis. We estimate the value of winning

AMP Series – Academia Meets Practice [Mike Lewis & Manish Tripathi] Note on Fan Equity
[email protected] CONFIDENTIAL [email protected]
and market characteristics using data from all teams across a league. This means
that the model yields the average value of winning, population, median income, or
whatever is included in the model. The result is that the rankings are based solely
on data rather than on opinion or judgment.
Data on winning rates, playoff participation, population and other performance and
market factors are easy to obtain. Revenue numbers may be more difficult,
however, and some creativity may be needed. At the collegiate level, Title 9
requires schools to report revenue by sport. Accounting standards do seem to vary
across schools, but these numbers are widely used. At the pro-level, the non-
public nature of most teams complicates the situation. Forbes does publish an
annual estimate of team values that includes an estimate of annual revenues.
In our rankings, we have explored multiple types of data, but based on our
experience, we have developed a preference for a simple estimate of box office
revenue constructed by multiplying attendance by average ticket prices. There are,
of course, objections to this metric, but our feeling is that it is a very good measure
of the “intensity” of the mainstream (local) fan.
We should also note that, while we prefer a measure of revenue, the key is to find
some market outcome that is observable. Television ratings, merchandise sales or
social media activity might also be useful “outcomes” for Fan Equity
measurement. Along these lines, we actually publish Social Media Equity
rankings as well. We will be releasing a follow up article that discusses the
measurement of brand equity based on social media data in the near future.

AMP Series – Academia Meets Practice [Mike Lewis & Manish Tripathi] Note on Fan Equity
[email protected] CONFIDENTIAL [email protected]
In sum, we start with a bunch of data and some concepts (theory) that guide the
way we approach the analysis. In the case of the Fan Equity study, our guiding
theory is that team revenue (or other market outcome) is based on the loyalty of
fans, the size of the team’s market, the quality of the product, and the
entertainment value of the team. The insight or theory that drives the analysis is
that we can build a model that can be used to predict the revenue that is due to
observable factors like quality and market potential. We can then look at the
difference between the predictions based solely on observables and actual results to
get a sense of each team’s unobservable Fan Equity.
The creation of a linear regression model that predicts “revenue” as a function of
team performance and market characteristics is useful for understanding how the
world works on average. In equation (2), for example, when the model is
estimated the β3 term would describe the relationship between population and
revenue as found in the real world data. If we found that β3 was equal to 2, the
implication would be that the value of each incremental person in a team’s home
market is $2. In the case of MLB, this would mean that the value of the New York
market with a population of about 20 million would be about $36 million more
than the Milwaukee market with a population of about 2 million (NOTE: we
haven’t estimated any models at this point and the value of β3 equal to 2 was
chosen purely for illustrative purposes).
The basic insight is that we are using real data to determine the value of
population, winning and any other factors. Equation (2) is purposely simple. The
equation could be extended to include additional measures of performance such as
offensive output, number of current all-pros, team payroll, and measures of market
potential such as market-level median income or the number of other pro teams.

AMP Series – Academia Meets Practice [Mike Lewis & Manish Tripathi] Note on Fan Equity
[email protected] CONFIDENTIAL [email protected]
In our discussion of what to include in the revenue equation, there is a category of
data that is noticeably missing. Specifically, we have not included aspects of
historical success, such as past championships or hall of fame players. Our view is
that these types of factors are the foundation of Fan Equity. We will return to this
topic when we discuss how brand or Fan Equity is created.
Returning to statistical estimation of equation (2) using multiple years of league-
wide data, the output of the statistical procedure is an equation that can be used to
predict revenue. In the case of equation (2), the equation would be used to predict
revenue based on the value of winning and population in the historical data. Our
theory is that the difference between this predicted value and actual value is what
we define as Fan Equity as shown in equation (3). This may be practically
understood as fan loyalty or engagement or intensity or whatever marketing
buzzword is popular at the moment.
(3) 𝐹𝑎𝑛𝐸𝑞𝑢𝑖𝑡𝑦 𝑖, 𝑡 = 𝑅𝑒𝑣𝑒𝑛𝑢𝑒 𝑖, 𝑡 − 𝑃𝑟𝑒𝑑𝑖𝑐𝑡𝑒𝑑𝑅𝑒𝑣𝑒𝑛𝑢𝑒(𝑖, 𝑡)
Our measure of Fan Equity is therefore a relative measure, as it is based on
performance relative to league norms. The effect of population or winning
measured in the statistical model is based on the results of the complete set of
teams. Since we are using residuals and our forecasting equation is unbiased, the
implication is that the mean value of Fan Equity is equal to zero. The proper
interpretation of the results is via a comparison of teams. If Team A’s Fan Equity
is $6 million while Team B’s Fan Equity is -$3 million, the correct inference is that
the Team A brand drives an incremental $9 million in revenue relative to Team B.
Key Principles

AMP Series – Academia Meets Practice [Mike Lewis & Manish Tripathi] Note on Fan Equity
[email protected] CONFIDENTIAL [email protected]
• Sports contexts are prime candidates for revenue premium studies of brand
equity because quality is objectively and directly observable.
• The selection of the dependent variable is complicated by the lack of
revenue reporting. However, measures of attendance, average prices, social
media followings, TV ratings and other measures of demand are available.
• The first step in the revenue premium model is the specification and
estimation of a statistical model that explains revenue based on team quality
and market potential
• The revenue-forecasting model has utility as it shows how fan support varies
across a league based on market size and winning.
• Fan Equity is taken as the difference between actual and predicted revenues.
The predictions are based on the statistical model.
• Fan Equity is a relative metric. Fan Equity estimates are interpretable as
the revenue attributed to a team’s brand RELATIVE to an average franchise.

AMP Series – Academia Meets Practice [Mike Lewis & Manish Tripathi] Note on Fan Equity
[email protected] CONFIDENTIAL [email protected]
3. Example: The NBA
The preceding section describes the basic ideas of the approach we advocate for
brand or Fan Equity analysis. In this section, we shift from the conceptual to the
applied. To facilitate the discussion, we present our most recent Fan Equity
rankings for the NBA. We publish the analysis on an annual basis, and the results
that follow are from the summer of 2014. We use fifteen years of data to estimate
the effects of performance and market size of revenues, and then just a brief
window of the three most recent years to perform the rankings. In what follows,
we will skip the statistical analyses. While we like to look at R-squares and t-
statistics, we know that our interest in the statistical analyses is seldom shared.
The winners in our NBA 2014 Fan Equity rankings were fairly consistent with the
conventional wisdom. We ranked the Knicks 1st, the Lakers 2nd, the Celtics 3rd,
the Bulls 4th and the Heat 5th. The Knicks finish is largely driven by their
exceptional pricing power. The Knicks sell out while charging the highest prices
in the league. The Lakers are second in terms of pricing, and also do very well in
terms of attendance. This is indicative of exceptional fan loyalty, given that the
Lakers won only 33% of their games last year. Miami is perhaps the most
intriguing team on the list. Future years will reveal how much Fan Equity is
owned by the Heat, and how much was temporarily contributed by LeBron James.
In the tables that follow, we provide Fan Equity rankings and a measure of team
quality during the 2014-2015 season. Specifically we use the Hollinger power
rankings from ESPN.com as of January 18, 2015. The tables list the Fan Equity
rankings as of the end of the 2013 – 2014 season and a snapshot of team quality

AMP Series – Academia Meets Practice [Mike Lewis & Manish Tripathi] Note on Fan Equity
[email protected] CONFIDENTIAL [email protected]
during the 2014 - 2015 season. We provide a measure of team quality to illustrate
a couple of points about how the rankings work.
An initial observation is that there does not appear to be a positive correlation
between Fan Equity and team quality. This lack of overlap between quality teams
and clubs with high Fan Equity raises some important issues. The first is an
observation about our methodology. We “control” for team quality when
developing our rankings. This means that we are looking at fan support when wins
(and population) are equal. Second, the lack of overlap should have the NBA
worried. The NBA finds itself in a season where the premier brands like the
Knicks, Lakers, Celtics, and Bulls are not likely to be factors in the post season.
This puts the league and its television partners in the position of not having the
optimal market impact during the post-season. The only teams in both the Top 10
of Fan Equity and Power Rankings are the Trail Blazers and Mavericks.
The next few teams on the list are where things get interesting. Portland finished
6th on the list. This finish provides support for the notion that Portland is an
extraordinary sports town for a small market. While market size is important in
terms of TV deals, Portland should not be neglected when leagues consider
expansion. Cleveland’s finish is also notable. While Cleveland has suffered in
recent years, there does appear to be a solid base of support. With great young
talent and LeBron returning, this should be a fascinating story to watch (despite
current on-court struggles). Of course, on the downside, Cleveland fans are likely
to find their loyalty rewarded with higher prices.

AMP Series – Academia Meets Practice [Mike Lewis & Manish Tripathi] Note on Fan Equity
[email protected] CONFIDENTIAL [email protected]
‘14 Fan Equity
Ranking
Team Logo Hollinger Power Ranking (1/18/15)
1 Knicks
29
2 Lakers
27
3 Celtics
23
4 Bulls
16
5 Heat
24
6 Trail Blazers
5
7 Suns
10
8 Jazz
19
9 Cavs
18
10 Mavericks
4
The next block of the table lists the teams ranked 11 through 20. The Nuggets,
Kings and Magic are just outside the top ten, while the Rockets, Clippers and
Warriors rank 18, 19, and 20 respectively. This part of the list shows a mix of
performance levels as well. Orlando and Sacramento are in the lower 20s, and the
Clippers and Warriors are near the top of the league power rankings. The middle
portion of the league also provides some interesting points for discussion.

AMP Series – Academia Meets Practice [Mike Lewis & Manish Tripathi] Note on Fan Equity
[email protected] CONFIDENTIAL [email protected]
‘14 Fan Equity
Ranking
Team Logo Hollinger Power Ranking (1/18/15)
11 Nuggets
17
12 Kings
25
13 Magic
26
14 Bucks
11
15 Spurs
7
16 Raptors
9
17 Thunder
13
18 Rockets
6
19 Clippers
3
20 Warriors
1
The Magic and the Spurs have notable and probably counter-intuitive results. Why
is Orlando ranked above the Spurs? The Spurs sold 100% of their tickets
(according to ESPN) and averaged 18,632 fans per game. The Magic sold about
90% of their tickets (16,923 per game). According to the Team Marketing Report
Fan Cost Index, San Antonio had the 9th highest cost of attendance while the Magic
had the 23rd. The two markets are of similar size, ranking 25 and 26 in population
according to the US census. On a superficial level, the Spurs have the greater fan
support.

AMP Series – Academia Meets Practice [Mike Lewis & Manish Tripathi] Note on Fan Equity
[email protected] CONFIDENTIAL [email protected]
But, the real question is support relative to performance and market potential. So
why does Orlando rank ahead of San Antonio? During the 2013-2014 season the
Spurs won 62 games and the NBA Championship while the Magic won just 28%
of their games. During the last few years, this has been the basic state of the
world. The Spurs excel on the court while the Magic struggles. The key point is
that the difference in fan support is not what is expected based on league wide
data. San Antonio should have more pricing power (the conjecture that the Spurs
owners are altruistic and price below market is certainly a possibility) and
Orlando’s ability to draw fans while struggling mightily is impressive.
Finally we come to the bottom third of the league. This portion of the table is
interesting, as it contains many relatively new teams and teams that have altered
branding elements over time. There are also a few teams with long and storied
histories. The Timberwolves and newly renamed Pelicans finish 21st and 22nd,
respectively. The former Bullets and former New Jersey franchise finish in two of
the bottom 3 positions. The Pistons and 76ers are a bit of a surprise given the
histories of these two franchises.
The two teams at the very bottom are interesting stories. The Memphis Grizzlies
are second from the bottom. Memphis simply doesn't generate the revenues that
they should for a team of their quality. Memphis’ finish is especially notable given
that the Grizzlies have been named the best overall professional sports franchise.
‘14 Ranking Fan Equity
Team Logo Hollinger Power Ranking (1/18/15)
21 Timberwolves
28

AMP Series – Academia Meets Practice [Mike Lewis & Manish Tripathi] Note on Fan Equity
[email protected] CONFIDENTIAL [email protected]
22 Pelicans
12
23 76ers
30
24 Pistons
14
25 Hornets
20
26 Pacers
21
27 Hawks
2
28 Wizards
15
29 Grizzlies
8
30 Nets
22
At the very bottom, we have the Nets. The Nets were a surprise to many and even
to us. We are fans as well as academics, so when we start an analysis we can’t
help but have expectations that are based on the “conventional wisdom.” The Nets
have been a high profile story with celebrity ownership and a dramatic move to
Brooklyn. The team has also performed well on the court.
So, what is the problem? When you compare the Nets’ fan support to that of other
big market teams like the Knicks, Bulls and Lakers, the Nets just don’t have the
pricing and drawing power that they should. The table below shows some key
comparisons between the Knicks and the Nets from the 2013 season. The teams
share the largest population metropolitan areas, but the Knicks achieve a 10.7%

AMP Series – Academia Meets Practice [Mike Lewis & Manish Tripathi] Note on Fan Equity
[email protected] CONFIDENTIAL [email protected]
advantage in terms of attendance DESPITE charging much greater prices. It is this
greater pricing power that pushes the two teams to opposite ends of the ranking.
c
Finally we should re-emphasize that we develop our revenue forecasting models
using fifteen years of data, but only use the last three years to rank Fan
Equity. We limit the Fan Equity rankings to three years because while fan loyalty
and brand equity are enduring, they do change over time. For the more statistically
inclined, this is why we don’t simply estimate fixed effects.
Key Principles (Findings)
• Our NBA rankings reveal what the fans and league office know. The
league’s premier teams are the Lakers, Knicks and Bulls.
• San Antonio is a great team but its market results do not suggest that it is a
high Fan Equity club.
• Current team quality is not necessarily correlated with Fan Equity. This
may be counterintuitive but it is a fundamental point. We are looking at Fan
support / engagement that is not driven by short-term fluctuations in
winning.
o Of course, the NBA and its TV partners would prefer that Fan Equity
and performance be highly correlated.

AMP Series – Academia Meets Practice [Mike Lewis & Manish Tripathi] Note on Fan Equity
[email protected] CONFIDENTIAL [email protected]
• Counterintuitive Fan Equity results can motivate deeper dives into the data.
For example, it is only through digging into the underlying data that the
strength of the Orlando fan base becomes apparent.

AMP Series – Academia Meets Practice [Mike Lewis & Manish Tripathi] Note on Fan Equity
[email protected] CONFIDENTIAL [email protected]
4. Fan Equity and Marketing Decisions
The rankings are (we think) interesting but they also have value beyond providing
a simple description of the landscape of fan loyalty. Once we have calculated Fan
Equity, it becomes relatively straightforward to investigate how various factors
contribute to or create Fan Equity. The sports context often provides a great
laboratory for investigating how brand equity and customer loyalty are created.
Teams have an uncommon opportunity to quantify how team success and
marketing decisions impact the long-term health of a franchise.
These opportunities do, however, require statistical modeling. To understand the
drivers of Fan Equity creation, we again rely on data and theory. From a
theoretical perspective, we start with the idea that Fan Equity is a fairly enduring
asset that waxes and wanes based on how teams act and perform over time.
Equation (4) says that Fan Equity in a given year is a function of what has
transpired for a team up until that specific season.
(4) 𝐹𝑎𝑛𝐸𝑞𝑢𝑖𝑡𝑦 𝑖, 𝑡
= 𝑓(𝑝𝑎𝑠𝑡 𝑡𝑒𝑎𝑚 𝑝𝑒𝑟𝑓𝑜𝑟𝑚𝑎𝑛𝑐𝑒, 𝑝𝑎𝑠𝑡 𝑝𝑙𝑎𝑦𝑒𝑟𝑠, 𝑡𝑖𝑚𝑒 𝑖𝑛 𝑚𝑎𝑟𝑘𝑒𝑡, 𝑒𝑡𝑐. )
The logic is that Fan Equity is created over time and then impacts current season
revenues. We begin, in equation (4), with a fairly open ended view of the drivers
of Fan Equity. Initial speculation is that brand equity is largely created by on-field
performances. That brand equity is created by quality experience is intuitive. The
brand equity of Honda or Coca-Cola is without doubt a result of the positive
experiences that consumers have had with the brands. In the case of sports, it is an
empirical question as to what elements of the past impact Fan Equity.

AMP Series – Academia Meets Practice [Mike Lewis & Manish Tripathi] Note on Fan Equity
[email protected] CONFIDENTIAL [email protected]
For example, we might conduct the statistical analysis using equation (5) below.
In this equation, Fan Equity is modeled as a function of the team’s cumulative
winning percentage (CumWin%) up until the most recent season, past playoff
appearances (PlayoffAPP), and cumulative championships (CumChamps). As
before, the equation is kept intentionally simple. In practice, the equation would
be specified based on managerial wisdom and data availability.
(5) 𝐹𝑎𝑛𝐸𝑞𝑢𝑖𝑡𝑦 𝑖, 𝑡 = 𝛽! + 𝛽!𝐶𝑢𝑚𝑊𝑖𝑛% 𝑖, 𝑡 − 1 + 𝛽!𝑃𝑙𝑎𝑦𝑜𝑓𝑓𝐴𝑃𝑃 𝑖, 𝑡 − 1
+𝛽!𝐶𝑢𝑚𝐶ℎ𝑎𝑚𝑝𝑠(𝑖, 𝑡 − 1) + 𝜀!,!
A consistent finding in our research, across multiple leagues, has been that Fan
Equity is developed through past post-season achievements. However, the
relevant achievements needed vary across leagues. In the case of Major League
Baseball, we have found that just making the playoffs drives brand equity, while in
the NBA it is necessary to win championships. In College football, we found that
the key to building Fan Equity was participation in major bowls. Participation in
minor bowls was insignificant. Overall, the empirical results suggest that the key to
building Fan Equity is extreme performances rather than consistent moderate
success.
Our conjecture is that the reason extreme performances are what matters is that
these are the moments that foster fan communities and publicity. A team that plays
in the Rose Bowl gets three hours of prime time coverage on New Year’s Day and
additional exposure during a flower filled parade that morning. Playing in the
Rose Bowl might (historically) have been reason for a group of fans to leave the
Midwest to vacation in Southern California in the middle of winter. Significant
bowl games and national championships may be fodder for conversations for
decades. In contrast, an appearance in a low level bowl sponsored by a lawn

AMP Series – Academia Meets Practice [Mike Lewis & Manish Tripathi] Note on Fan Equity
[email protected] CONFIDENTIAL [email protected]
equipment manufacturer or a chicken sandwich restaurant is unlikely to drive
excitement and build a brand community.
A key point, that should be made explicit, is that understanding the link between
past performance and Fan Equity provides a means for understanding the true
value of investing in championship caliber teams. Furthermore, making a direct
link between on-field performance metrics and Fan Equity can benefit
organizations by clarifying the nature of organization’s long-term objectives.
Sports organizations are unique in that they possess goals related to both on-field
success and also marketing outcomes. Linking Fan Equity to winning over time is
a crucial task for sports managers.
In a subsequent article, we will expand on ways in which Fan Equity scores can be
used by sports businesses. In particular, we have two statistically-based case
studies that examine the impact of extreme individual player performances (i.e.
Heisman Trophies) and of using different types of mascots (Native American and
live animals).
Key Principles
• Measurement of Fan Equity is valuable as it provides a check on the health
of a sports brand.
• Potentially, the more valuable use of Fan Equity scores is as a piece of data
to be explained in terms of past organizational outcomes and decisions.
• Linkage of outcomes to Fan Equity may be useful for guiding future
investment decisions.
• We have found that the key to building Fan Equity is championships and
deep playoff runs. This finding implies that there is little value in only

AMP Series – Academia Meets Practice [Mike Lewis & Manish Tripathi] Note on Fan Equity
[email protected] CONFIDENTIAL [email protected]
investing “enough” to make the playoffs in leagues like the NBA or to make
low level bowl games in college football.
• The linkage of organizational outcomes and decisions to Fan Equity
requires data collection and statistical tools.

AMP Series – Academia Meets Practice [Mike Lewis & Manish Tripathi] Note on Fan Equity
[email protected] CONFIDENTIAL [email protected]
5. Fan Equity: A Critique and Alternative Approaches
Since Fan Equity is an intangible asset, we can never be totally sure that we are
measuring it correctly. There are multiple approaches to measuring brand equity in
sports, and many different types of data can be usefully examined. The Fan Equity
measure based on home attendance revenues is our current standard because it
reflects what fans are willing to spend after controlling for team performance and
market potential. In general terms, marketers are almost always better off
assessing customers based on how they spend their money rather than what they
say.
However, no metric is perfect, and our Fan Equity measure can be
criticized. First, one of the distinguishing features of sports is capacity
constraints. Measures of attendance or revenues may therefore underestimate true
consumer demand simply because we do not observe demand above stadium
capacity. The second issue relates to owner pricing decisions. An implicit
assumption in the revenue-premium model is that teams are revenue maximizers.
For example in our NFL rankings Seattle has tended to perform poorly. This result
has created many questions about the rankings. The numbers suggest that while
the Seahawks fans may be very loud, they are a below average fan base on the Fan
Equity metric. At the end of the day, it appears that Seahawks fans are not willing
to pay the prices that you would expect for a team of the quality of the Seahawks in
a market with the demographics of Seattle. However, there is another explanation
for the Seahawks fans’ poor showing. Maybe the assumption that the Seahawks
are pricing to maximize revenues isn’t correct. Of course, what this would really

AMP Series – Academia Meets Practice [Mike Lewis & Manish Tripathi] Note on Fan Equity
[email protected] CONFIDENTIAL [email protected]
boil down to is whether the Seahawks owners are more altruistic than other NFL
owners. Perhaps?
Our Fan Equity measure implicitly assumes that teams are revenue
maximizers. There is a reasonable case to be made that this assumption is not
always true. For example, the Steelers and Packers could easily raise prices and
continue to sell-out their stadiums.
In a supplement to this article, we will be publishing a short work on a metric that
we call social media equity. Our Social Media Equity measure, while only based
on a couple of years of data, is a useful supplement to the Fan Equity
measure. The Social Media analysis allows for fans from outside the market to be
counted in a team’s equity score; the social media equity measure is not
constrained by capacity limitations, and team pricing strategies less influence the
measure. On the downside, the social media metric is based on social media
activities that do not require consumer expenditures.
Key Principles
• The revenue premium model of Fan Equity is based on market outcome and
statistical analysis. It is explicitly designed to capture fans’ willingness to
spend. Compared to other brand equity measurement models, these
characteristics result in a much more objective and defensible measurement
strategy.
• The revenue premium model of Fan Equity does include strong assumptions
related to ownership objectives, and the use of box office revenue can be
problematic when capacity constraints are common.

AMP Series – Academia Meets Practice [Mike Lewis & Manish Tripathi] Note on Fan Equity
[email protected] CONFIDENTIAL [email protected]
• Other measures of fan demand such as television ratings, social media
followings or merchandise sales can also be used to estimate “premium”
models of Fan Equity.