Embed Size (px)
Citation preview

AMP Investor ReportHalf Year 2013

Management and contact details
Executive management team
Craig Dunn Managing Director and Chief Executive Officer
Colin Storrie Chief Financial Officer
Craig Meller Managing Director, AMP Financial Services
Stephen Dunne Managing Director, AMP Capital
Paul Sainsbury Chief Customer Officer
Lee Barnett Chief Information Officer
Brian Salter General Counsel
Jonathan Deane General Manager, Strategy
Matthew Percival General Manager, Public Affairs
Fiona Wardlaw General Manager, Human Resources
Investor relations
Howard Marks Director, Investor Relations
Telephone 61 2 9257 7109
Email [email protected]
Stephen Daly Manager, Institutional Investor Relations
Telephone 61 2 9257 5207
Email [email protected]
Online reports
This investor report is available online at www.amp.com.au/shareholdercentre along with other investor relations information.
AMP Limited ABN 49 079 354 519

ContentsAMP Investor Report 1H 13 1
Contents
AMP 1H 13 performance summary 2
Financial summary 3
Five year summary 5
Strategic overview 6
AMP Financial Services (AFS) AMP Financial Services financial summary 8
Market share – AFS 9
Australian wealth management (WM) 10
Australian wealth protection (WP) 12
Australian mature 14
New Zealand 16
Cashflows and assets under management (AUM) 18
Embedded value (EV) and value of new business (VNB) 22
EV and VNB sensitivities 24
EV assumptions 25
AMP Capital AMP Capital financial summary 26
Investment performance 28
Cashflows and assets under management (AUM) 30
Capital structure Capital management 32
Debt overview 36
Additional information Group Office 37
Sensitivities – profit and capital 39
Glossary of terms and independent review Accounting treatment and definitions 41
Definitions of business units (BUs) and exchange rates 43
1H 13 financial results 44
Independent Auditor's Review Report 45
Information for shareholders 46
Important note
This Investor Report provides financial information reflecting after income tax results for AMP shareholders. The principles of life insurance accounting are used in reporting the results of AFS. Information is provided on an operational basis (rather than statutory basis) to reflect a management view of the businesses and existing structures. Content is prepared using external market data and internal management information useful for investors. This Investor Report is not audited. In preparing the Investor Report, management has had its external auditor, Ernst & Young, prepare a review statement in relation to specific matters pertaining to some of the information presented herein for management’s purposes. This statement has been included in the document for the information of readers; however, it has been prepared solely for directors and management and should not be relied upon by any party other than the directors and management of AMP Limited.
Profit attributable to shareholders of AMP Limited has been prepared in accordance with Australian accounting standards.
Forward looking statements in this Investor Report are based on management’s current views and assumptions and involve known and unknown risks and uncertainties, many of which are beyond AMP’s control and could cause actual results, performance or events to differ materially from those expressed. These forward looking statements are not guarantees or representations of future performance, and should not be relied upon.
This Investor Report is not an offer document and therefore has not been the subject of a full due diligence process typically used for an offer document. While AMP has sought to ensure that information in this Investor Report is accurate by undertaking a review process, it makes no representation or warranty as to the accuracy or completeness of any information or statement in this Investor Report. In particular, information and statements in this Investor Report do not constitute investment advice or a recommendation on any matter, and should not be relied upon.
AMP also provides statutory reporting prescribed under the Corporations Act 2001. Those accounts will be available from AMP’s website www.amp.com.au and reflect policyholder and shareholder interests.

2 AMPAMP Investor Report 1H 13
1H 13 performance summary
1H 13 profit attributable to shareholders of AMP Limited of A$393m (1H 12 A$373m) and underlying profit of A$440m (1H 12 A$488m)1
– Australian wealth management operating earnings up 20%, AMP Capital up 13%, Australian mature up 12%, AFS New Zealand up 21%, on 1H 12 respectively
– Australian wealth protection operating earnings down 52% on 1H 12, reflecting poor claims experience and increased lapse rates
– Underlying investment income down A$47m on 1H 12 to A$66m, reflecting a lower rate of return applied to shareholder assets with the substantial fall in interest rates over 2012
Key performance measures1H 13 underlying profit of A$440m, down 10% on 1H 12, reflecting Australian wealth protection experience losses and lower underlying investment income
1H 13 cost to income ratio of 48.6%, up 2.1 percentage points on 1H 12; controllable costs down 3% on 1H 12
Growth measures: – AFS 1H 13 net cashflows were A$862m, up from net cash outflows of A$113m in 1H 122;
AMP Capital external net cash outflows were A$2,070m, an increase in net cash outflows from A$1,345m for 1H 12 – AFS value of risk new business down A$43m on 1H 12 to A$69m3
Underlying return on equity reduced 2.2 percentage points to 11.2% in 1H 13 from 1H 12, reflecting higher capital held, Australian wealth protection experience losses and lower underlying investment income
Profit and profit drivers
Cashflows, AUM, API and banking
Total AUM of A$179b4 in 1H 13, up 4% from FY 12 – AFS AUM up 7% to A$138b in 1H 13 from FY 12
– Wealth management net cashflows of A$1,383m, up from net cashflows of A$233m in 1H 12 – North net cashflows of A$1,864m, up from A$636m in 1H 12; AMP Flexible Super net cashflows of A$1,093m, down
from A$1,289m in 1H 12 – AMP Capital AUM increased 2% to A$131b in 1H 13 from FY 12 – AFS Australia individual risk API increased 5% on 1H 12 to A$1.4b, AFS Australia group risk API increased 2% on 1H 12 to
A$361m, AFS NZ individual risk API increased 3% on 1H 12 to NZ$301m – AMP Bank mortgage book up 3% and deposit book down 2% in 1H 13 respectively
Controllable costs and cost ratios
Total controllable costs decreased by 3% on 1H 12 to A$652m; cost to income ratio up 2.1 percentage points to 48.6% in 1H 13 with lower controllable costs more than offset by lower revenues
– AFS 1H 13 controllable costs decreased 2% on 1H 12 to A$454m (cost to income ratio 41.9%), AMP Capital controllable costs decreased 4% on 1H 12 to A$152m in 1H 13 (cost to income ratio 63.3%)
– Controllable costs to AUM decreased 10 bps on 1H 12 to 73 bps during 1H 13
Capital management and dividend – 1H 13 shareholder regulatory capital resources above minimum regulatory requirements were A$1,703m (A$1,372m at
31 December 2012 after allowing for the impact of the Life and General Insurance Capital Standards (LAGIC) of $272m), reflecting retained profits, additional capital issued under the DRP, capital efficiency initiatives, more favourable investment markets and the impact of AMP Bank's repayment of the A$100m loan from Group Office
– Interest cover (underlying) remains strong at 13.2 times – Gearing on an S&P basis increased to 12% from 11% in 1H 12 – 1H 13 interim dividend of 11.5 cents per share (cps) was declared, representing an interim 2013 dividend payout ratio of
77% of underlying profit. The dividend reinvestment plan (DRP) will continue to operate, however no discount will apply to determine the DRP allocation price
1 Prior period underlying profit and profit attributable to shareholders have been revised in accordance with changes in accounting standards AASB 10 and AASB 119.2 AFS current and comparative cashflows exclude SMSF.3 Represents value of new business for AFS’s Australian and New Zealand risk businesses.4 Includes SMSF, refer to page 21.

AMPAMP Investor Report 1H 13 3
Financial summary
A$m 1H 13 1H 12 2H 12 FY 12% 1H 13/
1H 12
Profit and loss
Australian wealth management 196 164 183 347 19.5
Australian wealth protection 64 134 56 190 (52.2)
Australian mature 85 76 91 167 11.8
New Zealand 46 38 35 73 21.1
AMP Financial Services 391 412 365 777 (5.1)
AMP Capital2 51 45 54 99 13.3
BU operating earnings 442 457 419 876 (3.3)
Group Office costs1 (32) (34) (32) (66) 5.9
Total operating earnings 410 423 387 810 (3.1)
Underlying investment income2 66 113 113 226 (41.6)
Interest expense on corporate debt (36) (48) (38) (86) 25.0
Underlying profit 440 488 462 950 (9.8)
Other items1,2,3 (5) 4 17 21 n/a
AXA integration costs (31) (71) (57) (128) 56.3
Amortisation of AXA acquired intangible assets2 (47) (50) (49) (99) 6.0
Profit before market adjustments and accounting mismatches 357 371 373 744 (3.8)
Market adjustment – investment income2 3 (1) (11) (12) n/a
Market adjustment – annuity fair value 10 (10) 1 (9) n/a
Market adjustment – risk products 5 23 (27) (4) (78.3)
Accounting mismatches4 18 (10) (20) (30) n/a
Profit attributable to shareholders of AMP Limited 393 373 316 689 5.4
1 Prior period comparatives have been revised in accordance with changes in accounting standard AASB 119. Refer to page 37 for more detail.
2 Net of minority interests for the period from 1 March 2012.
3 Other items principally comprise one-off and non-recurring items. Refer to page 37 for more detail.
4 Prior period comparatives have been revised in accordance with changes in accounting standard AASB 10. Refer to page 38 for more detail.
Movement in 1H 12 to 1H 13 underlying profit
A$m
1H 12
underlyin
g profit
Controlla
ble cost
s1
Underlyin
g
inve
stm
ent inco
me,
net of c
orpora
te debt
1H 12 profit
rebase
d for
change in
underly
ing
inve
stm
ent inco
me ra
te
AMP C
apital
perform
ance fe
es
Capitalis
ed
loss
reve
rsals
in 1H 12
Wealth
prote
ctio
n
experience
loss
es
Wealth
Prote
ctio
n
assum
ption ch
anges
Other
Business
volu
mes
(inclu
ding m
arkets)
1H 13
underlyin
g profit
200
250
300
350
400
450
500
550
488
453440
(35)
5112 2
(5)(15)
(20)
(38)
1 Represents controllable cost synergies of A$25m less costs associated with acquisition of Cavendish and internalisation of the AMP Capital Brookfield joint venture (A$6m) and other controllable cost growth (A$7m).

4 AMPAMP Investor Report 1H 13
Financial summary cont’d
1H 13 1H 12 2H 12 FY 12
Earnings1
EPS basic – underlying (cps) 15.0 17.0 15.9 32.9
EPS basic – actual (cps) 13.6 13.2 11.1 24.2
RoE – underlying 11.2% 13.4% 12.1% 12.7%
RoE – actual 10.0% 10.3% 8.3% 9.2%
Dividend
Dividend per share (cps) 11.5 12.5 12.5 25.0
Dividend payout ratio – underlying1 77% 74% 79% 76%
Ordinary shares on issue (m)2 2,945 2,895 2,930 2,930
Weighted average number of shares on issue (m) – basic2 2,937 2,874 2,911 2,892
– fully diluted2 2,961 2,895 2,933 2,915
– statutory 2,888 2,831 2,860 2,845
Market capitalisation – end period (A$m) 12,514 11,145 14,095 14,095
Capital management
AMP shareholder equity (A$m) 7,955 7,554 7,744 7,744
Corporate debt (excluding AMP Bank debt) (A$m) 1,679 1,579 1,579 1,579
S&P gearing 12% 11% 11% 11%
Interest cover – underlying (times) 13.2 11.2 12.1 12.1
Interest cover – actual (times) 10.6 9.0 9.2 9.2
EV and VNB
AFS value of new business (A$m)3 171 208 216 424
AFS value of risk new business (3% dm) (A$m)3 69 112 91 203
AFS EV after transfers – AFS (3% dm) (A$m)4 11,646 11,480 11,695 11,695
AFS return on EV – AFS (3% dm)3 3.8% 7.0% 5.1% 12.4%
Cashflows and AUM
AFS cash inflows (A$m) 13,312 11,210 13,451 24,661
AFS cash outflows (A$m) (12,450) (11,323) (13,030) (24,353)
AFS net cashflows (A$m) 862 (113) 421 308
AFS persistency 88.6% 87.8% 87.5% 87.5%
AFS AUM – AMP Capital managed (A$b) 90 79 86 86
AFS AUM – non-AMP Capital managed (A$b) 48 36 43 43
AMP Capital net cashflows – external (A$m) (2,070) (1,345) (439) (1,784)
AMP Capital net cashflows – internal (A$m) (1,715) (1,436) (1,566) (3,002)
AMP Capital AUM (A$b) 131 123 129 129
Total AUM (A$b) 179 159 172 172
Controllable costs (pre-tax) and cost ratios1
Operating costs (A$m) 597 622 637 1,259
Project costs (A$m) 55 48 46 94
Total controllable costs (A$m) 652 670 683 1,353
Cost to income ratio 48.6% 46.5% 48.6% 47.6%
Controllable costs to AUM (bps) 73 83 80 82
1 Prior period comparatives have been revised in accordance with changes in accounting standards. Refer pages 37 and 38 for further details.
2 Number of shares has not been adjusted to remove treasury shares.
3 Return on EV is not annualised for half year periods.
4 1H 13 transfers of A$488m (1H 12 A$310m).

AMPAMP Investor Report 1H 13 5
Five year summary
AMP + AXA
1H 13
AMP + AXA
1H 12
AMP + 3 months
AXA1H 11
AMP1H 10
AMP1H 09
Earnings1
Total operating earnings (A$m) 410 423 407 347 332Underlying profit (A$m) 440 488 459 383 367Profit attributable to shareholders of AMP Limited (A$m) 393 373 346 425 362EPS basic – underlying (cps) 15.0 17.0 18.6 18.6 18.3EPS basic – actual (cps) 13.6 13.2 14.3 20.9 18.2RoE – underlying 11.2% 13.4% 18.2% 27.4% 31.6%RoE – actual 10.0% 10.3% 13.7% 30.4% 31.2%DividendDividend per share (cps) 11.5 12.5 15.0 15.0 14.0 Dividend payout ratio – underlying1 77% 74% 80% 81% 77%Ordinary shares on issue (m)2 2,945 2,895 2,812 2,072 2,014Weighted average number of shares on issue (m) – basic2 2,937 2,874 2,462 2,059 2,008 – fully diluted2 2,961 2,895 2,476 2,069 2,018 – statutory 2,888 2,831 2,420 2,034 1,989Share price for the period (A$) – low 4.25 3.73 4.67 5.21 3.59 – high 5.67 4.40 5.78 6.77 5.66EV and VNBValue of new business (3% dm) (A$m)3 171 208 190 140 141Value of risk new business (3% dm) (A$m)3 69 112 94 45 47Return on EV (3% dm)3 3.8% 7.0% 3.3% 2.7%Financial positionAMP shareholder equity (A$m) 7,955 7,554 6,991 2,891 2,357Corporate debt (excluding AMP Bank debt) (A$m) 1,679 1,579 1,536 1,363 1,389S&P gearing 12% 11% 11% 15% 16%Interest cover – underlying (times) 13.2 11.2 12.1 12.3 10.0Interest cover – actual (times) 10.6 9.0 10.3 12.5 8.0Cashflows and AUMAFS net cashflows (A$m)4 862 (113) 94 584 865 AFS persistency4 88.6% 87.8% 88.5% 90.7% 90.3%AMP Capital net cashflows – external (A$m)4 (2,070) (1,345) (371) 1,855 192 AMP Capital AUM (A$b) 131 123 130 95 89AUM non-AMP Capital managed (A$b) 48 36 34 16 14Total AUM (A$b) 179 159 164 111 103Controllable costs (pre-tax) and cost ratios1
Controllable costs (pre-tax) – AMP (A$m) 652 670 558 426 413Cost to income ratio – AMP 48.6% 46.5% 44.8% 42.2% 42.4%Controllable costs to AUM (bps) 73 83 77 76 81Staff numbersAFS5,6 3,579 3,573 3,844 1,891 1,840AMP Capital7 902 992 976 919 954Group Office 1,268 1,295 1,392 867 876Total staff numbers 5,749 5,860 6,212 3,677 3,670
1 2012 prior period comparatives have been revised in accordance with changes in accounting standards. Refer pages 37 and 38 for further details.
2 The number of shares has not been adjusted to remove treasury shares.
3 1H 11 VNB, risk VNB and return on EV includes AXA for six months to 30 June 2011. 1H 09 and 1H 10 comparatives have not been restated. Return on EV is not annualised for half year periods.
4 1H 11 cashflows and persistency include AXA for the six months.
5 Excludes planners.
6 AFS 1H 13 includes employees of Cavendish acquired in July 2012.
7 1H 13 includes 230 shopping centre FTEs (266 in 1H 12); however, the costs of these FTEs are recharged to shopping centres.

6 AMPAMP Investor Report 1H 13
AMP is Australia and New Zealand’s leading independent wealth management company. It has a retail banking business in Australia and a growing international investment management business.
The company’s 1H 13 underlying profit was A$440m compared to A$488m in 1H 12. Strong earnings growth from most of its businesses, along with good cost control, was offset by poor claims and lapse experience in Australian wealth protection and the impact of lower interest rates on investment returns from shareholder capital.
The integration with AXA is now almost complete. The integration program has achieved all its objectives and is expected to deliver A$150m post-tax synergies by 1H 14 for project spend of A$310m post-tax.
AMP’s interim 2013 dividend is 11.5 cents per share franked to 70%.
1H 13 results highlightsDuring 1H 13, AMP:
– achieved double-digit operating earnings growth in its wealth management, mature, AFS New Zealand and investment management businesses
– lowered costs by 3% on 1H 12 – improved its capital position, with A$1.7b in surplus capital
above minimum regulatory requirements – grew AMP Financial Services' net cashflows to A$862m, as a result
of strong sales and new practices joining the AMP network – improved the competitiveness of AMP Bank, with its return on
capital increasing to 15.4%, the cost to income ratio decreasing to 32% and operating earnings up 31% on 1H 12
– added to its leading financial advice network in Australia and New Zealand, which grew to 4,286 in total
– improved investment performance, with three of the top 20 best performing balanced funds in Australia.1
StrategyAMP is capitalising on its strengthened competitive position following the merger to help it better deliver on its promise: to help people own tomorrow.
To do this, its strategic priorities are to continue investment in: – reshaping its Australian business – new domestic growth opportunities, such as AMP SMSF, the
Horizons Academy and the North platform, and – targeted international expansion through AMP Capital.
Accelerating change in Australian businessWith the integration largely complete, AMP is now increasing the scale and pace of change in its Australian business to better respond to changing consumer behaviour and ongoing margin pressures.
AMP is reshaping its Australian business to be more customer centric while also driving improved cost efficiencies.
Putting customers at the centre of AMPAMP is developing a much stronger understanding and capability to solve customers’ financial challenges throughout their lives. This will ensure the company’s expertise, advice and solutions are more accessible, relevant and easier for customers to act on.
This change will require increased investment in: – next generation advice models, with the aim to provide more
advice solutions at different price points for customers and greater productivity for advisers
– the customer experience, with planned improvements designed through segmentation, human-centred design and behavioural economics
– technology, particularly customer analytics and new digital and mobile platforms
– products and services, including a new retirement offer, an insurance offer including income protection (IP), multi manager investment funds, along with improvements to North’s functionality.
In 1H 13, AMP appointed Paul Sainsbury to the newly created role of Chief Customer Officer, reporting to the CEO, to lead this work.
Driving improved business efficienciesAMP is putting in place a new three-year business efficiency program to redirect investment to where customers value it most, as well as reduce the company's overall cost base. The program is expected to deliver A$200m pre-tax recurring run rate cost savings by the end of 2016 for a one-off investment of A$320m pre-tax. Estimated recurring cost savings are likely to be 80% controllable and 20% variable.
Savings will come from: – rationalising product duplication and construction to better
utilise scale – further rolling out management operating systems in new
business areas – increasing use of cloud computing – automation, including increased self-service opportunities for
customers – improving back office efficiency, and – greater office space efficiency.
One-off costs for the program will be funded through a combination of future retained earnings, capital surplus and the Dividend Reinvestment Program (DRP).
Continue to develop new businesses in growing market segmentsAMP continues to invest in areas where it sees profitable growth, such as self-managed superannuation.
After a year in operation, its AMP SMSF business is Australia’s market leader in SMSF administration and continues to grow at more than double the pace of overall system growth. It administers more than 9,650 member accounts, up from 3,000 in 1H 12, and has A$12.3b in funds under administration.
During 1H 13, AMP SMSF continued to build and promote the company’s SMSF expertise. It launched AMP SMSF Solutions, an online SMSF administration and compliance service, and provided more than 6,700 hours of SMSF education and training to financial advisers, trustees and consumers. AMP’s 2013 brand campaign, highlighting the company’s SMSF capabilities and expertise, has generated strong consumer interest in both SMSF Solutions and education seminars.
Strategic overview
1 Includes Responsible Investment Leaders Balanced, AMP, ipac Super Directions Balanced and AMP Future Directions Balanced. Interim Chant West Multi-Manager Quarterly Survey, June 2013. Investment performance for one year to 30 June 2013. Refer 'growth' category.

AMPAMP Investor Report 1H 13 7
AMP SMSF also: – increased the take up of its SMSF service to AMP aligned advisers,
'Ascend', with member accounts increasing 42% in 1H 13 following improvements to its functionality and features in 2012
– continued to build a more efficient business, upgrading Multiport’s technology platform and transitioning the majority of Cavendish funds onto the SuperIQ platform
– worked with other AMP businesses to develop SMSF-specific products, like AMP Bank’s loan product AMP SuperEdge, and
– increased the number of advisers accredited to write SMSF business.
Increasing financial adviser numbers is also a key growth opportunity. AMP’s financial planning network increased to 4,286 in 1H 13. In Australia, the number of advisers increased by 44. AMP has grown its network despite a broader industry decline in adviser numbers.
Demonstrating the quality of its network, AMP’s Charter Financial Planning was named market research group CoreData’s 2013 Licensee of the Year. The AMP Horizons Academy continues to successfully recruit, train and educate new advisers. During 1H 13, the Academy won an international award from the American Society of Training & Development for its flagship Career Changer program. More than 600 financial advisers have graduated from this financial planning training program since it began in 2007. In 1H 13, the Academy welcomed two new intakes to the program.
AMP continued to upgrade its popular North platform during 1H 13, with its cashflows almost tripling to A$1.9b on 1H 12.
Maintain targeted international expansion through AMP Capital InvestorsAt 1H 13, 7% of AMP Capital’s AUM was sourced from international investors. This includes A$5.6b it manages for clients in Japan.
During the half, AMP Capital’s business alliance with MUTB helped AMP expand its distribution reach in Japan. The alliance launched the Global Listed Infrastructure Fund for MUTB’s corporate pension fund clients. In the retail funds (Toshin) market, the partners now offer three funds, with combined funds under management of A$300m. The alliance continues to develop additional corporate pension and retail products.
AMP Capital continued to attract new international clients in 1H 13, including four new European investors to its Australian Wholesale and Shopping Centre funds. In Asia, the private Hong-Kong based arm of a leading global bank subscribed to A$200m of our third QFII quota.
In addition, AMP Capital’s Infrastructure Debt Fund II is generating strong international demand. The fund is expected to hold its first close in the third quarter of 2013.
AMP is well placed to take advantage of China’s new, more liberal financial sector regulation. In line with their memorandum of understanding, AMP Capital and China Life continue to explore multiple opportunities to partner in pensions and asset management.
Capital management updateAMP remains well capitalised, with A$1.7b in regulatory capital resources above minimum regulatory requirements (MRR). This was up A$331m on FY 12 (after allowing for the impact of LAGIC).
The increase in shareholder regulatory capital resources above MRR was mainly driven by retained underlying profits, additional capital issued under the DRP, capital efficiency initiatives, more favourable investment markets and the impact of AMP Bank's repayment of the A$100m loan from Group Office. This was partially offset by business growth and integration costs. The capital initiatives include refinements to LAGIC calculations and a revised responsible entity structure within AMP Capital.
The Australian Prudential Regulation Authority is developing capital standards for conglomerate groups which will not be fully effective for AMP until 1 January 2015. Refer to page 34 for more information.
AMP’s interim 2013 dividend is 11.5 cents per share franked to 70%. This represents a dividend payout ratio of 77% of underlying profit.
Wealth protection updateAMP wealth protection’s 1H 13 operating earnings of A$64m were down 52% on 1H 12 and up 14% on 2H 12. The result was impacted by experience losses of A$33m and lower profit margins reflecting lapse assumptions strengthened in FY 12. Performance reflected challenging external market factors and some AMP specific issues (refer to AMP’s 2013 half year market presentation for more information).
AMP is taking a number of actions to improve claims and lapse experience in its Australian wealth protection business by addressing issues that are both cyclical and structural. This involves activity that is expected to yield both short and medium-term benefits.
New management, with strong industry experience and expertise, is now in place and has continued to strengthen the IP claims management process, where the overall aim is to establish a process that helps customers recover and return to work more quickly.
To improve lapses, the company has introduced specific retention campaigns, increased the size of its retention team, along with a series of other actions to encourage more customers to keep their policies.
Improvement initiatives that will yield benefits over the medium-term include:
– partnering with experienced external providers that promote quicker turnaround in back-to-work initiatives
– investing in new IP claims tools, systems and data analytics – implementing targeted premium increases – redesigning the IP product – developing improved customer analytics and propensity
modelling, and – improving pricing and remuneration structures to improve
retention.
These actions are expected to deliver some short-term benefits, however given the challenging industry conditions, sustained improvement is expected over the medium-term with uneven progress due to inherent volatility. AMP's wealth protection business is focused on building sustainable value and profitability.
Strategic overview cont’d

8 AMP Financial ServicesAMP Investor Report 1H 13
AMP Financial Services financial summary
A$m 1H 13 1H 12 2H 12 FY 12% 1H 13/
1H 12
Profit and loss
Australian wealth management 196 164 183 347 19.5
Australian wealth protection 97 109 110 219 (11.0)
Australian mature 85 75 87 162 13.3
New Zealand 45 37 44 81 21.6
Profit margins 423 385 424 809 9.9
Australian wealth protection1 - 20 - 20 n/a
Capitalised loss reversals - 20 - 20 n/a
Australian wealth protection (33) 5 (54) (49) n/a
Australian mature - 1 4 5 n/a
New Zealand 1 1 (9) (8) -
Experience profits/(losses) (32) 7 (59) (52) n/a
Operating earnings 391 412 365 777 (5.1)
Underlying investment income 50 83 85 168 (39.8)
Underlying operating profit after income tax 441 495 450 945 (10.9)
Controllable costs and cost ratios
Operating costs 406 423 434 857 (4.0)
Project costs 48 40 37 77 20.0
Total controllable costs 454 463 471 934 (1.9)
Cost to income ratio 41.9% 39.6% 42.4% 41.0% n/a
Controllable costs to AUM (bps)2 68 81 75 78 n/a
Return on capital
RoBUE 19.6% 24.6% 20.7% 22.5% n/a
End period tangible capital resources – after transfers (A$m)3 4,484 4,157 4,333 4,333 7.9
Cashflows, AUM and persistency
AFS cash inflows (A$m) 13,312 11,210 13,451 24,661 18.8
AFS cash outflows (A$m) (12,450) (11,323) (13,030) (24,353) (10.0)
AFS net cashflows (A$m) 862 (113) 421 308 n/a
AUM (pre-capital) (A$b) 137.9 114.8 129.5 129.5 20.1
Persistency 88.6% 87.8% 87.5% 87.5% n/a
VNB – risk insurance and risk annual premium in-force (API)
Value of risk new business (3% dm) (A$m) 69 112 91 203 (38.4)
Australian individual risk API (A$m) 1,395 1,328 1,389 1,389 5.0
New Zealand individual risk API (NZ$m) 301 292 298 298 3.1
1 Refer to pages 12 and 13 for more detail on WP capitalised loss reversals.
2 Average AUM is based on monthly average AUM excluding capital.
3 1H 12 not restated for the revised life insurance capital standards.

AMP Financial ServicesAMP Investor Report 1H 13 9
Market share – AFS
March 2013 March 2012
Market share – Australia
Total market size
A$b
Market position
(rank)
Market share
%
Total market size
A$b
Market position
(rank)
Market share
%
Assets under management
Superannuation including rollovers1,4 289.4 1 25.9 251.2 1 23.6
Corporate superannuation master funds2 105.9 2 21.8 93.6 1 22.6
Retirement income1 140.4 2 17.7 123.4 2 17.5
Unit trusts (excluding cash management trusts)1,4 126.1 6 8.8 117.8 6 9.7
Total retail managed funds (excluding cash management trusts)1,4 562.5 1 19.8 499.2 1 18.6
Total in-force annual premiums3
Individual risk 7.5 1 18.5 6.8 1 19.0
Group risk 4.0 5 9.5 3.6 4 10.3
1 Source: Plan for Life 31 March 2013 – QDS Retail & Wholesale.
2 Source: Plan for Life 31 March 2013 – Corporate Super Master Funds Report.
3 Source: Plan for Life 31 March 2013 – Detailed Risk Statistics. In-force premiums individual risk excludes single premiums.
4 These figures include AMP SMSF including Cavendish, SuperIQ, and Multiport products in the superannuation and unit trust categories totalling A$12.3b (March 2012 A$1.3b) and A$272m (March 2012 A$186m) respectively.
March 2013 March 2012
Market share – New Zealand
Total market size
NZ$b
Market position
(rank)
Market share
%
Total market size
NZ$b
Market position
(rank)
Market share
%
Assets under management
Retail superannuation1 4.1 1 50.3 4.0 1 46.0
Unit trusts1 13.9 4 12.0 10.2 2 17.3
Insurance bonds1 0.6 3 21.0 0.6 3 20.7
Total retail funds1 34.4 1 18.8 27.6 1 21.4
Corporate superannuation2 4.8 1 44.9 4.5 1 52.7
KiwiSaver1 14.7 3 17.2 11.3 3 18.4
Total in-force annual premiums3
Individual risk 1.6 2 18.8 1.5 2 19.7
Conventional 0.1 1 73.0 0.2 1 72.7
1 Measured by AUM: Source: Fund Source Research Limited March 2013.
2 Measured by AUM: Source: Eriksen’s Master Trust Survey March 2013.
3 Measured by in-force premium: Source: FSC Statistics March 2013.

10 AMP Financial ServicesAMP Investor Report 1H 13
Australian wealth management
A$m 1H 13 1H 12 2H 12 FY 12% 1H 13/
1H 12
Profit and loss
Revenue
Investment related1 546 502 524 1,026 8.8
Bank related 105 89 97 185 18.0
Other2 51 44 57 101 15.9
Total revenue 702 635 678 1,312 10.6
Investment management expense 121 102 111 213 18.6
Bank variable costs 26 24 25 49 8.3
Total variable costs 147 126 136 262 16.7
Controllable costs 276 274 283 556 0.7
Tax expense 83 71 76 147 16.9
Operating earnings 196 164 183 347 19.5
Underlying investment income 12 17 16 33 (29.4)
Underlying operating profit after income tax 208 181 199 380 14.9
RoBUE 31.9% 32.7% 32.4% 32.5% n/a
End period tangible capital resources – after transfers (A$m)3 1,198 1,130 1,224 1,224 6.0
Net cashflows (A$m)4 1,383 233 588 821 n/a
AUM (A$b)4 91.8 80.4 85.7 85.7 14.2
Average AUM (A$b)4,5 90.1 80.6 83.5 82.0 11.8
Persistency4 88.2% 86.8% 86.8% 86.6% n/a
Cost to income ratio 48.2% 51.4% 49.9% 50.6% n/a
Investment related revenue to AUM (bps)1,4,6 122 125 125 125 n/a
Investment management expense to AUM (bps)1,4,6 27 25 26 26 n/a
Investment related revenue less variable costs to AUM (bps)1,4,6,7 95 100 98 99 n/a
Controllable costs to AUM (bps)6,7 56 62 62 62 n/a
Operating earnings to AUM (bps)6,8 35 34 36 35 n/a
1 Investment related refers to revenue on superannuation, allocated pension and investment products.
2 Other revenue includes SMSF revenues and product fees, platform fees and advice fees received by licensees on AFS wealth protection and movements in the value of client registers purchased from financial planners.
3 1H 12 not restated for the revised life insurance capital standards.
4 Excludes SMSF.
5 Average AUM is based on monthly average AUM excluding capital.
6 Ratio based on 181 days in 1H 13 and 182 in 1H 12.
7 Costs in this ratio exclude AMP Bank costs.
8 Operating earnings in this ratio exclude AMP Bank.
Movement in 1H 12 to 1H 13 operating earnings
A$m
1H 12
operatin
g earnin
gs
1H 13
operatin
g earnin
gs
AMP Bank
earnin
gsIn
vest
ment r
elated
reve
nue less
varia
ble cost
s
Other r
evenue
Controlla
ble cost
s
(exclu
ding A
MP Bank)
Tax
(exclu
ding A
MP Bank)
50
100
150
200
164
1969
257
0(9)

AMP Financial ServicesAMP Investor Report 1H 13 11
Business overviewThe wealth management (WM) business provides customers with superannuation, retirement income, investment, and banking products, SMSF administration and financial planning services (through aligned and owned advice businesses).
WM’s key priorities are to: – build a stronger, more customer centric business whilst
remaining vigilant on cost control – improve the quality of the advice experience and develop
complementary advice channels – position AFS for the changing regulatory environment – improve adviser productivity and grow adviser numbers – develop a strong SMSF capability.
Operating earningsOperating earnings increased by A$32m (20%) to A$196m in 1H 13 from A$164m in 1H 12. The increase in operating earnings was due to:
– stronger net cashflows and improved investment markets leading to a 12% growth in average AUM
– higher net interest margins in AMP Bank – continued cost focus including the realisation of cost synergies.
Growth in Other Revenue was primarily driven by SMSF revenues, following the Cavendish acquisition in July 2012 and stronger organic growth.
Investment related revenue to AUM1H 13 investment related revenue to AUM was 122 bps, a 3 bps reduction from 1H 12. The 3 bps decline in 1H 13 is attributable to the impact of a change in product and fee mix associated with the strong growth in cashflows on the North platform and higher fee rebates as investment markets in 1H 13 were on average higher than in 1H 12. AMP continues to expect average margin compression of 3.5% to 4.5% per annum over the MySuper implementation period to 2017.
1H 13 investment management expense to AUM of 27 bps was 2 bps higher than in 1H 12 and 1 bps higher than 2H 12, reflecting a relative increase in AUM weighting towards higher margin growth asset classes.
AMP SMSFIn 2012, AMP established a new business unit named AMP SMSF. AMP SMSF comprises Cavendish, Multiport, Ascend and AMP’s 49% shareholding in SuperIQ. AMP SMSF forms part of WM’s consolidated reporting.
The drivers for SMSF success are expected to be scale and efficiency in administration, developing advice capabilities, broadening distribution reach and packaging product solutions relevant to SMSF customers. At 1H 13, AMP SMSF administered more than 9,650 member accounts (1,434 through SuperIQ), up from 9,100 at FY 12 and approximately 3,000 at 1H 12.
SMSF revenue, including the 49% equity accounted interest in SuperIQ, is reported as part of Other Revenue.
The contribution of AMP SMSF to 1H 13 WM operating earnings was not material.
AMP BankAMP Bank contributed A$38m to WM’s 1H 13 operating earnings, up from A$29m in 1H 12.
Bank related revenue was up 18% in 1H 13 on 1H 12, driven mainly by higher net interest margins. AMP Bank’s net interest margin in 1H 13 was 1.39%, up from 1.22% in 1H 12, benefiting from the optimisation of AMP Bank’s funding and liquidity position. During the half AMP Bank also launched new products such as the innovative ‘AMP Notice Account’ which offers customers a deposit product with an ongoing variable rate at least 100 basis points above the RBA’s cash rate target.
Bank variable costs increased by 8% in 1H 13, driven by higher commissions and other mortgage acquisition costs. AMP Bank controllable costs were A$25m in 1H 13, up from A$23m in 1H 12. The cost to income ratio decreased to 32% in 1H 13 from 36% in 1H 12 mainly due to higher net interest margins.
AMP’s mortgage book increased by A$372m (3%) to A$12.8b in 1H 13.
The growth in mortgages in 1H 13 was funded by an increase in wholesale funding of A$1.1b, including the issuance of A$0.8b in medium-term notes. With this additional wholesale funding, less funding from deposits was required in 1H 13. The total deposit book decreased by A$188m (2%) to A$8.1b in 1H 13.
AMP Bank’s return on capital was 15.4% in 1H 13, up from 13.4% in 1H 12 due mainly to the higher net interest margins.
Controllable costsWM controllable costs increased marginally in 1H 13 to A$276m from A$274m in 1H 12, but decreased A$7m (2%) from 2H 12. Excluding AMP Bank, controllable costs were flat on 1H 12.
WM controllable costs increased in 1H 13 over 1H 12 driven by operational and capital investment supporting the growth in the North platform, higher allocation of overheads and the costs of the Cavendish business acquired in 2H 12 (A$6m), offset by the synergy benefits accruing from AMP’s merger with AXA in 2011.
WM controllable costs declined from 2H 12 in part because costs are traditionally higher in the second half of the year due to the annual customer statements and associated administration.
The 1H 13 cost to income ratio fell by 3.2 percentage points from 1H 12 to 48.2% as a result of strong revenue growth offsetting the marginal increase in controllable costs. Controllable costs to AUM decreased 6 bps to 56 bps in 1H 13.
Return on capitalRoBUE for 1H 13 was 31.9%, down from 32.7% in 1H 12, despite strong growth in operating earnings reflecting higher average capital held under revised capital standards.
Australian wealth management cont’d

12 AMP Financial ServicesAMP Investor Report 1H 13
Movement in 1H 12 to 1H 13 operating earnings
1H 12
operatin
g earnin
gs
Grow
th in
business
volu
mes
Low
er
contro
llable co
sts
Impact
of FY 12
assum
ption ch
anges
on profit
marg
ins
Experience
Capitalis
ed
loss
reve
rsals
1H 13
operatin
g earnin
gs
0
20
40
60
80
100
120
140
160
134
2 1
(15)
(38)
(20) 64
Australian wealth protection
A$m 1H 13 1H 12 2H 12 FY 12% 1H 13/
1H 12
Profit and loss
Profit margins 97 109 110 219 (11.0)
Capitalised loss reversals - 20 - 20 n/a
Experience profits/(losses) (33) 5 (54) (49) n/a
Operating earnings 64 134 56 190 (52.2)
Underlying investment income 22 42 47 89 (47.6)
Underlying operating profit after income tax 86 176 103 279 (51.1)
RoBUE 8.1% 19.1% 10.1% 14.4% n/a
End period tangible capital resources – after transfers (A$m)1 2,212 1,970 2,073 2,073 12.3
VNB (3% dm) (A$m) 68 112 91 203 (39.3)
EV – after transfers (3% dm) (A$m) 3,652 3,888 3,657 3,657 (6.1)
Return on EV before transfers (3% dm)2 0.6% 8.8% (5.5%) 2.8% n/a
Individual risk API (A$m) 1,395 1,328 1,389 1,389 5.1
Group risk API (A$m) 361 354 357 357 2.0
Individual risk lapse rate 13.9% 12.9% 14.8% 13.9% n/a
Profit margins/annual premium 11.2% 13.1% 12.7% 12.9% n/a
Operating earnings/annual premium 7.4% 16.1% 6.5% 11.2% n/a
Controllable costs (A$m) 104 105 105 211 (1.0)
Cost to income ratio 45.7% 29.4% 41.8% 34.5% n/a
Controllable costs/annual premium 12.0% 12.6% 12.1% 12.4% n/a
1 1H 12 end period tangible capital resources not restated for the revised life insurance capital standards.
2 Return on EV before transfers is not annualised for half year periods.

AMP Financial ServicesAMP Investor Report 1H 13 13
Australian wealth protection cont’d
Business overviewWealth protection (WP) comprises individual and group term, disability and income protection insurance products. Products can be bundled with a superannuation product or held independently.
The Australian life insurance market continues to experience deteriorating claims and worsening lapse experience. AMP's WP business experienced significant experience losses in 1H 13.
Due to this challenging environment for the Australian life insurance market, AMP further strengthened income protection claims assumptions at the end of 1H 13. The financial impact of this assumption change on profit margins is largely offset by future premium rate increases.
AMP continues to implement actions aimed at improving its claims experience over time. This includes enhanced claims management processes, earlier intervention strategies and enhanced support to help customers return to work more quickly. For more information see pages 6 and 7 of this report and slides 10 to 14 of AMP's 2013 half year market presentation.
Operating earningsOperating earnings decreased A$70m to A$64m in 1H 13 from A$134m in 1H 12 on worsening claims and lapse experience. Operating earnings increased A$8m from 2H 12.
Profit marginsProfit margins decreased by A$12m to A$97m in 1H 13 from A$109m in 1H 12 with the impact of strengthening long-term claim and lapse assumptions in FY 12, more than offsetting organic growth in the retail business. The strengthening of claims and lapse assumptions in FY 12 reduced profit margins by A$15m in 1H 13.
Profit margins as a percentage of average API were 11.2% in 1H 13, down from 13.1% in 1H 12.
Capitalised loss reversalsThe NMLA income protection book is in loss recognition after the Australian income protection morbidity claims assumptions were strengthened in 2011.
Capitalised losses of A$32m post-tax remain at 30 June 2013 with no capitalised loss reversals recorded during the half year period. The impact of 1H 13 claims assumption changes are largely offset by future premium rate increases.
Future reversals of capitalised losses can be driven by pricing increases, changes in claims assumptions, reductions in unit costs and growth in profitable business.
ExperienceExperience losses were A$33m in 1H 13 compared with experience profits of A$5m in 1H 12 and experience losses of A$54m in 2H 12. This reflects the volatile nature of experience from period to period across an in-force portfolio of A$1.8b.
Total claims experience losses in 1H 13 were A$24m (2H 12 A$29m loss) while lapse experience losses were A$12m (2H 12 A$20m loss), with other experience profits of A$3m. Claims experience losses in 1H 13 were incurred in the income protection book primarily due to higher claims costs as well as in the group insurance and individual lump sum books.
Lapse experience losses on retail insurance in 1H 13 were incurred in both income protection and lump sum products.
Annual premium in-force (API)Individual API increased A$67m (5%) to A$1.4b in 1H 13 from 1H 12 and was flat over 2H 12. 2H 12 API included the annual benefit from Consumer Price Index (CPI) and age premium increases on risk policies held within superannuation in AMP Life. In 1H 13, 44% of in-force and 65% of new business was written within superannuation.
The increase in API primarily reflected the benefits of higher premiums across the wealth protection book.
1H 13 individual risk API comprised lump sum insurance (71%) and disability, including income protection (29%).
Group API increased 2% to A$361m in 1H 13 from A$354m in 1H 12 and increased A$4m from 2H 12.
Lapse rates1H 13 lapse rates were 13.9%, 1.0 percentage point higher than 1H 12 and 0.9 percentage points lower than in 2H 12.
2H lapse rates are traditionally higher than in the 1H partly due to annual age and CPI premium increases that come into effect from 1 July each year for many policies written within superannuation.
Controllable costsWP controllable costs were A$104m in 1H 13, in line with 1H 12 and 2H 12. Increased investment in WP was offset by synergy benefits.
As part of the FY 13 result, certain claims management expenses currently classified as controllable costs will be reclassified as variable costs. These costs amounted to A$13m in FY 12 and A$7m in 1H 13.
The cost to income ratio increased 16.3 percentage points to 45.7% in 1H 13 from 1H 12 due to lower underlying operating profit and higher capital.
Return on capital1H 13 RoBUE decreased to 8.1% from 19.1% in 1H 12, reflecting experience losses, a lower earnings rate on capital and higher average capital held under revised capital standards as a result of business growth and changes in actuarial assumptions.
Embedded value and value of new business – at the 3% discount margin 1H 13 EV increased 0.6% before transfers at the 3% discount margin to A$3,679m.
Other than the expected return, EV was driven by new business and pricing reviews, partially offset by the impact of strengthened income protection claims assumptions, increasing bond yields and current year experience.
1H 13 VNB fell A$44m to A$68m from 1H 12 as a result of lower sales volumes, strengthened lapse assumptions in FY 12 and higher bond yields, partially offset by the impact of pricing reviews.
For further details on EV and VNB, refer to pages 22 to 25.

14 AMP Financial ServicesAMP Investor Report 1H 13
Australian mature
A$m 1H 13 1H 12 2H 12 FY 12% 1H 13/
1H 12
Profit and loss
Profit margins 85 75 87 162 13.3
Experience profits - 1 4 5 n/a
Operating earnings 85 76 91 167 11.8
Underlying investment income 10 12 14 26 (16.7)
Underlying operating profit after income tax 95 88 105 193 8.0
RoBUE 36.4% 30.4% 36.6% 33.5% n/a
End period tangible capital resources – after transfers (A$m)1 431 561 494 494 (23.2)
VNB (3% dm) (A$m) 7 5 12 17 40.0
EV – after transfers (3% dm) (A$m) 1,917 1,855 1,910 1,910 3.3
Return on EV before transfers (3% dm)2 8.5% 3.8% 12.7% 17.0% n/a
Net cashflows (A$m) (946) (806) (591) (1,397) (17.4)
AUM (pre-capital) (A$b) 22.8 22.9 23.0 23.0 (0.4)
Profit margins to AUM (bps)3 75 66 75 71 n/a
Persistency 89.1% 89.9% 89.5% 89.7% n/a
Controllable costs (A$m) 31 38 39 77 (18.4)
Cost to income ratio 18.6% 23.2% 20.7% 21.8% n/a
Controllable costs to AUM (bps)3 27 34 34 34 n/a
1 1H 12 end period tangible capital resources have not been restated for the revised life insurance capital standards.
2 Return on EV before transfers is not annualised for half year periods.
3 Based on monthly average AUM excluding capital.
Movement in 1H 12 to 1H 13 operating earnings
A$m
1H 12
operatin
g earnin
gs
Run-off
New busin
ess
Low
er
contro
llable co
sts
Inve
stm
ent m
arkets
Low
er experie
nce
1H 13
operatin
g earnin
gs
(5)
25
8
(1)
0
20
40
60
80
100
76
85
AMP Financial ServicesAMP Investor Report 1H 13 15
Australian mature cont’d
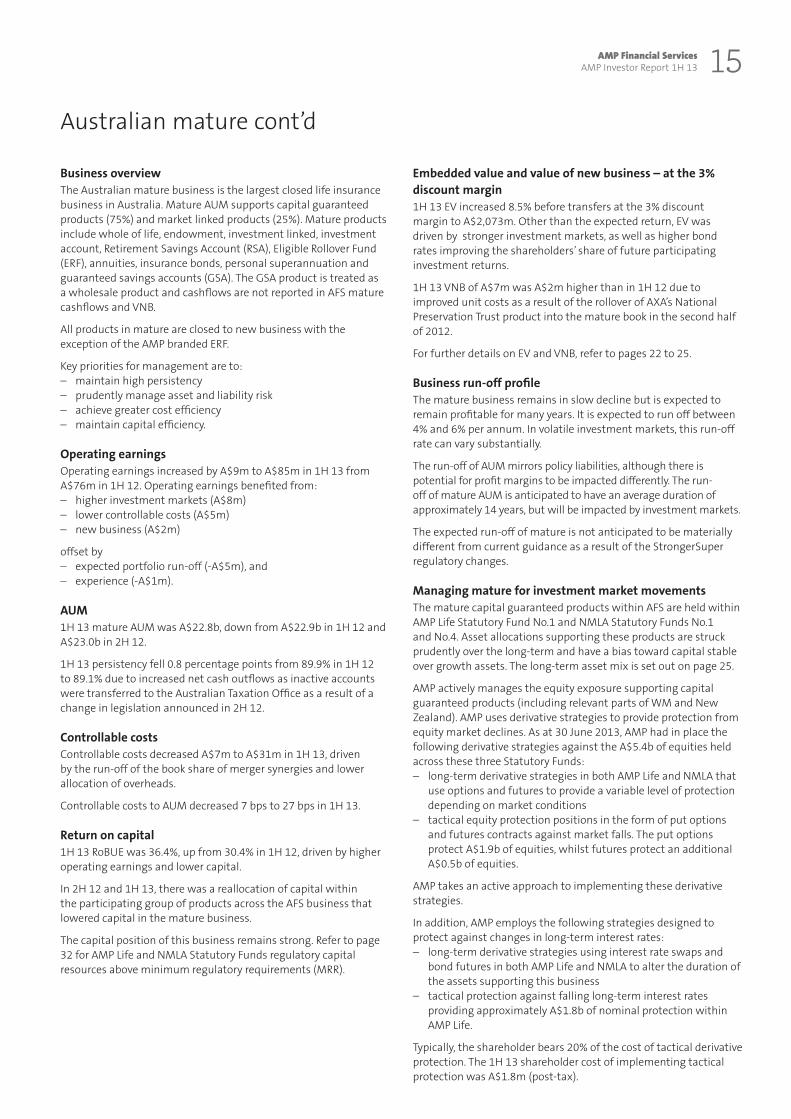
Business overviewThe Australian mature business is the largest closed life insurance business in Australia. Mature AUM supports capital guaranteed products (75%) and market linked products (25%). Mature products include whole of life, endowment, investment linked, investment account, Retirement Savings Account (RSA), Eligible Rollover Fund (ERF), annuities, insurance bonds, personal superannuation and guaranteed savings accounts (GSA). The GSA product is treated as a wholesale product and cashflows are not reported in AFS mature cashflows and VNB.
All products in mature are closed to new business with the exception of the AMP branded ERF.
Key priorities for management are to: – maintain high persistency – prudently manage asset and liability risk – achieve greater cost efficiency – maintain capital efficiency.
Operating earningsOperating earnings increased by A$9m to A$85m in 1H 13 from A$76m in 1H 12. Operating earnings benefited from:
– higher investment markets (A$8m) – lower controllable costs (A$5m) – new business (A$2m)
offset by – expected portfolio run-off (-A$5m), and – experience (-A$1m).
AUM1H 13 mature AUM was A$22.8b, down from A$22.9b in 1H 12 and A$23.0b in 2H 12.
1H 13 persistency fell 0.8 percentage points from 89.9% in 1H 12 to 89.1% due to increased net cash outflows as inactive accounts were transferred to the Australian Taxation Office as a result of a change in legislation announced in 2H 12.
Controllable costsControllable costs decreased A$7m to A$31m in 1H 13, driven by the run-off of the book share of merger synergies and lower allocation of overheads.
Controllable costs to AUM decreased 7 bps to 27 bps in 1H 13.
Return on capital1H 13 RoBUE was 36.4%, up from 30.4% in 1H 12, driven by higher operating earnings and lower capital.
In 2H 12 and 1H 13, there was a reallocation of capital within the participating group of products across the AFS business that lowered capital in the mature business.
The capital position of this business remains strong. Refer to page 32 for AMP Life and NMLA Statutory Funds regulatory capital resources above minimum regulatory requirements (MRR).
Embedded value and value of new business – at the 3% discount margin1H 13 EV increased 8.5% before transfers at the 3% discount margin to A$2,073m. Other than the expected return, EV was driven by stronger investment markets, as well as higher bond rates improving the shareholders’ share of future participating investment returns.
1H 13 VNB of A$7m was A$2m higher than in 1H 12 due to improved unit costs as a result of the rollover of AXA’s National Preservation Trust product into the mature book in the second half of 2012.
For further details on EV and VNB, refer to pages 22 to 25.
Business run-off profileThe mature business remains in slow decline but is expected to remain profitable for many years. It is expected to run off between 4% and 6% per annum. In volatile investment markets, this run-off rate can vary substantially.
The run-off of AUM mirrors policy liabilities, although there is potential for profit margins to be impacted differently. The run- off of mature AUM is anticipated to have an average duration of approximately 14 years, but will be impacted by investment markets.
The expected run-off of mature is not anticipated to be materially different from current guidance as a result of the StrongerSuper regulatory changes.
Managing mature for investment market movementsThe mature capital guaranteed products within AFS are held within AMP Life Statutory Fund No.1 and NMLA Statutory Funds No.1 and No.4. Asset allocations supporting these products are struck prudently over the long-term and have a bias toward capital stable over growth assets. The long-term asset mix is set out on page 25.
AMP actively manages the equity exposure supporting capital guaranteed products (including relevant parts of WM and New Zealand). AMP uses derivative strategies to provide protection from equity market declines. As at 30 June 2013, AMP had in place the following derivative strategies against the A$5.4b of equities held across these three Statutory Funds:
– long-term derivative strategies in both AMP Life and NMLA that use options and futures to provide a variable level of protection depending on market conditions
– tactical equity protection positions in the form of put options and futures contracts against market falls. The put options protect A$1.9b of equities, whilst futures protect an additional A$0.5b of equities.
AMP takes an active approach to implementing these derivative strategies.
In addition, AMP employs the following strategies designed to protect against changes in long-term interest rates:
– long-term derivative strategies using interest rate swaps and bond futures in both AMP Life and NMLA to alter the duration of the assets supporting this business
– tactical protection against falling long-term interest rates providing approximately A$1.8b of nominal protection within AMP Life.
Typically, the shareholder bears 20% of the cost of tactical derivative protection. The 1H 13 shareholder cost of implementing tactical protection was A$1.8m (post-tax).

16 AMP Financial ServicesAMP Investor Report 1H 13
New Zealand
A$m 1H 13 1H 12 2H 12 FY 12% 1H 13/
1H 12
Profit and loss
Profit margins 36 28 35 63 28.6
Provisional tax relief1 9 9 9 18 -
Experience profits/(losses) 1 1 (9) (8) -
Operating earnings2 46 38 35 73 21.1
Underlying investment income 6 12 8 20 (50.0)
Underlying operating profit after income tax 52 50 43 93 4.0
RoBUE 18.5% 19.9% 16.7% 18.2% n/a
End period tangible capital resources – after transfers (A$m)3 643 496 541 541 29.6
VNB (3% dm) (A$m) 1 2 1 3 (50.0)
EV – after transfers (3% dm) (A$m) 1,248 1,022 1,096 1,096 22.1
Return on EV before transfers (3% dm) (A$m)4 12.3% 5.9% 8.6% 15.0% n/a
Net cashflows (A$m) 3 51 2 53 (94.1)
AUM (A$b) 11.0 9.5 10.3 10.3 15.8
Individual risk API (A$m) 254 229 237 237 10.9
Individual risk API (NZ$m) 301 292 298 298 3.1
Group risk API (A$m) 33 30 31 31 10.0
Group risk API (NZ$m) 39 38 39 39 2.6
Individual risk lapse rate 11.6% 9.9% 12.3% 10.9% n/a
Controllable costs (A$m) 43 46 44 90 (6.5)
Cost to income ratio 37.2% 40.1% 42.0% 41.0% n/a
Controllable costs/annual premium5 31.4% 36.3% 33.1% 34.7% n/a
1 Provisional tax relief reflects the benefit currently being received prior to the effect of the change in life tax rules that will apply from 1 July 2015.
2 In NZ dollar terms, operating earnings in 1H 13 were NZ$57m (1H 12 NZ$49m).
3 1H 12 end period tangible capital resources have not been restated for the revised life insurance capital standards.
4 Return on EV before transfers is not annualised for half year periods.
5 Based on monthly individual and group risk API.
Movement in 1H 12 to 1H 13 operating earnings
A$m
1H 12
operatin
g earnin
gsFo
reig
n curre
ncy
move
ment
Change inbond ra
tes
Low
er
contro
llable co
sts
3rd party
distrib
ution re
venues
Other
1H 13
operatin
g earnin
gs
2 12
2 1
0
10
20
30
40
50
38
46

AMP Financial ServicesAMP Investor Report 1H 13 17
New Zealand cont’d
Business overviewAFS NZ provides tailored financial products and solutions to New Zealanders through a network of financial advisers. AFS NZ’s risk business is the second largest by market share and is complemented by a growing wealth management business.
AFS NZ’s key priorities to grow shareholder value are to: – enhance product features and offerings – improve services through developing customer focused systems
and processes – build strong distribution relationships – maximise cost efficiency.
Changes to the taxation of life insurance business in New Zealand, which will impact AFS NZ from 1 July 2015, are expected to result in a material increase in the amount of corporate tax paid by AFS NZ. These tax changes apply to all life insurance companies in New Zealand and are not specific to AFS NZ. To offset the impact of this change on operating earnings, AFS NZ is progressively growing its revenue base, driving down its costs and reducing the capital impacts of distributing life insurance.
Provisional tax relief is shown as a separate line item to highlight the impact the change in life tax rules will have on AFS NZ operating earnings from 1 July 2015.
Operating earningsOperating earnings increased by A$8m (21%) to A$46m in 1H 13 from 1H 12 primarily as a result of strong growth in profit margins, whilst experience profits remained steady compared to 1H 12.
Profit margins1H 13 profit margins (excluding transitional tax relief) increased by A$8m (29%) to A$36m over 1H 12 due to lower controllable costs, growth in AUM (particularly KiwiSaver), and growth in API.
Experience profitsExperience profits of A$1m in 1H 13 were in line with 1H 12, but improved A$10m from 2H 12, reflecting the volatile nature of the life insurance industry.
1H 13 experience profits were due to favourable lump sum and income protection underwriting profits from lower incidence of claims and improved claims management through the performance of the claims rehabilitation team. This was partially offset by lump sum lapse losses following the impact of price rises, which continued to come into force during 1H 13.
Controllable costs1H 13 controllable costs of A$43m reduced 7% from 1H 12 and in NZ dollar terms reduced 11% from NZ$59m to NZ$53m.
Controllable costs benefited from the completion of the integration activities, which delivered accommodation savings, a single organisational design and product and systems savings.
There continues to be significant investment in IT systems, including further integration into Australian systems and processes to achieve greater efficiencies and improve customer, staff and adviser experience.
The cost to income ratio reduced 2.9 percentage points to 37.2% in 1H 13 from 1H 12 as a result of higher earnings and lower costs.
Annual premium in-force (API)1H 13 individual risk API was A$254m, up 11% from A$229m on 1H 12. In NZ dollar terms, individual risk API grew 3% to NZ$301m.
Individual risk API increased modestly, reflecting subdued new business sales and customer retention. Slower economic growth, the ongoing uptrend in life and general insurance costs and a competitive marketplace, which continues to experience aggressive selling behaviour, are limiting API growth.
Lapse rates1H 13 lapse rates increased 1.7 percentage points from 1H 12 to 11.6%, but improved 0.7 percentage points from 2H 12. Targeted retention activities and product enhancements implemented over the last 12 months are starting to have a positive effect on lapse rates.
NZ industry lapse rates are under pressure as the sector addresses the life insurance tax changes due to take effect in 2015. AFS NZ’s strong aligned distribution network helps to mitigate the impact of higher industry lapse rates.
Return on capital1H 13 RoBUE was 18.5%, down from 19.9% in 1H 12, reflecting higher average capital and a lower earnings rate on capital, partly offset by higher operating earnings. In 2H 12 and 1H 13 there was a reallocation of capital within the participating group of products across the AFS business that increased capital in the AFS NZ business.
Embedded value and value of new business – at the 3% discount margin1H 13 EV increased 12.3% (in A$) before transfers to A$1,231m. Other than the expected return, the increase in EV was primarily due to the favourable movement in the AUD/NZD exchange and pricing reviews, offset by the impact of strengthened claims assumptions.
1H 13 VNB reduced to A$1m from A$2m in 1H 12.
For further details on EV and VNB, refer to pages 22 to 25.
AdvisersTotal adviser numbers at 1H 13 were 606 compared to 640 at 2H 12, reflecting a finalisation of the impact of definitional changes applying to how adviser numbers are reported under the new compliance regime. AFS NZ's underlying distribution footprint improved during 1H 13 through greater diversification by growing its direct distribution capacity.
KiwiSaverThe KiwiSaver market in New Zealand continues to grow with positive industry cashflows and is the primary focus for AFS NZ’s wealth management growth strategy. The New Zealand Treasury is forecasting KiwiSaver AUM to grow from NZ$16.9b in June 20131 to NZ$60b by 2021, although member growth is expected to slow.
On 2 August 2013, AFS NZ consolidated its two KiwiSaver offerings into the AMP KiwiSaver scheme providing greater scale and choice for KiwiSaver members.
As at 1H 13, AFS NZ had almost 262,000 KiwiSaver customers and almost NZ$2.6b in AUM – an increase from 1H 12 of 2% for member numbers and 22% for AUM, reflecting improved investment markets and continued positive net cashflows. AMP’s market share is approximately 17.2%2 of the total KiwiSaver market.
1 Based on Plan for Life KiwiSaver Funds Under Management at June 2013.
2 Based on 31 March 2013 industry data.

18 AMP Financial ServicesAMP Investor Report 1H 13
Cashflows and assets under management (AUM)
1H 13 cashflowsCash inflows Cash outflows Net cashflows
Cashflows by product (A$m) 1H 13 1H 12 % 1H/1H 1H 13 1H 12 % 1H/1H 1H 13 1H 12 % 1H/1H
Australian wealth management
AMP Flexible Super1 2,561 2,479 3.3 1,468 1,190 (23.4) 1,093 1,289 (15.2)
North2 3,084 1,175 162.5 1,220 539 (126.3) 1,864 636 193.1
Summit, Generations and iAccess (including Assure)3 1,124 1,247 (9.9) 1,742 1,744 0.1 (618) (497) (24.3)
Flexible Lifetime Super (superannuation and pension)4 1,157 1,266 (8.6) 2,060 2,183 5.6 (903) (917) 1.5
Other retail investment and platforms5 178 160 11.3 318 351 9.4 (140) (191) 26.7
Total retail on AMP platforms 8,104 6,327 28.1 6,808 6,007 (13.3) 1,296 320 n/a
Total corporate superannuation6 1,771 1,767 0.2 1,674 1,505 (11.2) 97 262 (63.0)
Total retail and corporate super on AMP platforms 9,875 8,094 22.0 8,482 7,512 (12.9) 1,393 582 139.3
External platforms7 1,749 1,460 19.8 1,759 1,809 2.8 (10) (349) 97.1
Total Australian wealth management 11,624 9,554 21.7 10,241 9,321 (9.9) 1,383 233 n/a
Australian wealth protection
Individual risk 648 625 3.7 289 280 (3.2) 359 345 4.1
Group risk 178 172 3.5 115 108 (6.5) 63 64 (1.6)
Total Australian wealth protection 826 797 3.6 404 388 (4.1) 422 409 3.2
Australian mature 308 336 (8.3) 1,254 1,142 (9.8) (946) (806) (17.4)
Total Australia 12,758 10,687 19.4 11,899 10,851 (9.7) 859 (164) n/a
New Zealand
KiwiSaver 194 184 5.4 124 61 (103.3) 70 123 (43.1)
Other 360 339 6.2 427 411 (3.9) (67) (72) 6.9
Total New Zealand 554 523 5.9 551 472 (16.7) 3 51 (94.1)
Total AFS cashflows 13,312 11,210 18.8 12,450 11,323 (10.0) 862 (113) n/a
Net movement
1H 13 1H 12 % 1H/1H
Australian wealth management – AMP SMSF8
Assets under administration 1,787 591 n/a
Australian wealth management – AMP Bank by product9
Deposits (Supercash, Super TDs and Platform TDs) 35 804 (95.7)
Deposits (retail) (223) 626 n/a
Mortgages 372 863 (56.9)
1 AMP Flexible Super is a flexible all in one superannuation and retirement account for individual retail and SME business.
2 North is a market leading fully functioning wrap platform which includes guaranteed and non-guaranteed options.
3 Summit and Generations are owned and developed platforms. iAccess and Assure are ipac badges on Summit.
4 Flexible Lifetime Super (superannuation and pension) was closed to new business from 1 July 2010. A small component of corporate superannuation schemes is included.
5 Other retail investment and platforms include Flexible Lifetime – Investments, AMP Personal Portfolio and Synergy.
6 Corporate superannuation comprises SignatureSuper, CustomSuper, SuperLeader and AXA Business Super.
7 External platforms comprise Asgard, Macquarie and BT Wrap platforms.
8 Represents movements in AMP SMSF's assets under administration. SMSF includes Multiport, Cavendish, SuperIQ and Ascend administration platforms. SuperIQ is 49% owned by AMP; however, 100% of assets under administration are included.
9 Represents movements in AMP Bank’s deposits and mortgage books.

AMP Financial ServicesAMP Investor Report 1H 13 19
Cash inflows Cash outflows Net cashflows
Cashflows by channel (A$m)1 1H 13 1H 12 % 1H/1H 1H 13 1H 12 % 1H/1H 1H 13 1H 12 % 1H/1H
AMP Financial Planning 5,011 4,482 11.8 4,576 4,284 (6.8) 435 198 119.7
Hillross 1,636 917 78.4 1,100 931 (18.2) 536 (14) n/a
Charter Financial Planning 1,895 1,484 27.7 1,593 1,403 (13.5) 302 81 n/a
Jigsaw advisers 158 116 36.2 168 160 (5.0) (10) (44) 77.3
ipac group advisers and Tynan Mackenzie 1,182 819 44.3 1,135 973 (16.7) 47 (154) n/a
Genesys group advisers 584 570 2.5 530 575 7.8 54 (5) n/a
Direct (including corporate superannuation) 944 896 5.4 734 684 (7.3) 210 212 (0.9)
Centrally managed clients and other 345 352 (2.0) 571 416 (37.3) (226) (64) n/a
3rd party distributors 1,003 1,051 (4.6) 1,492 1,425 (4.7) (489) (374) (30.7)
Total Australia 12,758 10,687 19.4 11,899 10,851 (9.7) 859 (164) n/a
New Zealand 554 523 5.9 551 472 (16.7) 3 51 (94.1)
Total AFS cashflows 13,312 11,210 18.8 12,450 11,323 (10.0) 862 (113) n/a
Cash inflows
Australian wealth management cash inflows (A$m) 1H 13 1H 12
Member contributions 1,485 1,051
Employer contributions 1,958 2,081
Total contributions 3,443 3,132
Transfers and rollovers in2 8,073 6,317
Other cash inflows 108 105
Total Australian wealth management 11,624 9,554
1 1H 12 cashflows have been restated to reflect changes in distribution channels.
2 Transfers and rollovers in includes the transfer of accumulated member balances into AMP from both internal (eg retail superannuation to allocated pension/annuities) and external products.
Cashflows and assets under management (AUM) cont’d

20 AMP Financial ServicesAMP Investor Report 1H 13
Cashflows and assets under management (AUM) cont’d
OverviewAFS net cashflows increased by A$975m to a net cash inflow of A$862m in 1H 13. The improvement in net cashflows was generated by:
– AMP’s platforms (up A$976m) with strong support for North across AMP’s advice channels, and
– lower net outflows from external platforms (down A$339m) as a number of financial planning practices joined Hillross during 1H 13.
This was partially offset by lower corporate superannuation net cashflows (down A$165m) and Mature (down A$140m).
AFS cash inflows increased by 19% (A$2.1b) to A$13.3b in 1H 13. Cash outflows increased by 10% (A$1.1b) to A$12.5b.
Total AFS persistency, excluding major internal products flows, in 1H 13 was 88.6%, improved from 87.8% in 1H 12.
AMP SMSF has been removed from cashflows as management consider assets under administration and member accounts as more relevant value drivers for this business.
Retail on AMP platformsAustralian wealth management (WM) generated net cashflows of A$1.4b in 1H 13, an increase of A$1.1b from 1H 12. Strong inflows into AMP’s contemporary North and Flexible Super products were partially offset by net outflows from legacy platforms and products closed to new business.
WM cash inflows increased by 22% (A$2.1b) and WM cash outflows increased by 10% (A$920m). AMP’s reported cash inflow and outflow numbers are materially impacted by internal movements between products. Internal flows across WM products were A$5.3b in 1H 13 (A$4.2b in 1H 12), representing approximately 45% (44% in 1H 12) of total WM cash inflows.
AMP’s retail platforms comprise platforms which are owned, developed and operated by AMP as opposed to external platforms which are administered by other platform providers. AMP retail platforms net cashflows increased by A$976m to A$1.3b in 1H 13.
AMP Flexible Super net cashflows fell A$196m to A$1.1b in 1H 13, reflecting higher pension payments to customers in line with strong growth of Flexible Super – Retirement, and higher lump sum withdrawals partially offset by growth in external cash inflows largely from employer contributions. The superannuation and retirement accounts contributed A$615m and A$478m respectively to Flexible Super net cashflows.
In 1H 13, AMP Flexible Super AUM increased A$1.5b to A$8.8b, driven primarily by strong net cashflows. 1H 13 cash inflows includes A$99m (1% of WM cash inflows) relating to pre-retirement customers moving from AMP’s closed retail superannuation product (Flexible Lifetime – Super) to AMP Flexible Super – Superannuation. Only A$6m of the A$99m was invested in the core option (A$52m in the select option and A$41m in the choice option).
North net cashflows increased by A$1.2b to A$1.9b in 1H 13. The strong growth in net cashflows was due to the increased take-up of the North platform across AMP’s aligned distribution network and previous enhancements to support a full wrap service.
In 1H 13, North AUM increased A$2.0b to A$6.7b driven by strong net cashflows. 92% of 1H 13 North cash inflows were non-guaranteed cash inflows, up from 78% in 1H 12, and were driven principally by stronger cash inflows from aligned advisers (92% of cash inflows). North cashflows continued to accelerate throughout the year from average weekly flows of A$25m in 1H 12 to average weekly cashflows of A$72m in 1H 13. During 1H 13, North attracted over 13,400 new customers.
Summit, Generations and iAccess net cash outflows increased by A$121m in 1H 13 to a net outflow of A$618m. The increase in net cash outflows was largely a result of lower cash inflows with new business increasingly flowing to the North platform. A$190m moved from these platforms to the North platform in 1H 13 (1H 12 A$85m).
Flexible Lifetime Superannuation and Pension were closed to new business from 1 July 2010. As a result, net cash outflows were A$903m in 1H 13, a A$14m improvement on the net cash outflows reported in 1H 12.
Corporate superannuationCorporate superannuation net cashflows fell A$165m to A$97m in 1H 13 due to 1H 12 cashflows benefiting from a one-off A$48m transition of funds from a plan won in the previous year and higher internal outflows into AMP retail products. There were no corporate super mandate wins in 1H 13.
External platformsExternal platforms represent superannuation, pension and investment products on the Asgard, Macquarie and BT Wrap platforms.
External platform net outflows improved by A$339m in 1H 13 to a net cash outflow of A$10m. The improvement in net outflows was largely due to a number of financial planning practices joining Hillross during the half (contributing A$447m of net cashflows), partially offset by the take-up of North by AMP’s aligned distribution network. 1H 12 also benefited from the transfer of a financial planning business to Hillross which contributed A$90m to net flows.
MatureMature net cash outflows increased by A$140m to A$946m in 1H 13, due to normal business run-off and higher transfers of inactive accounts to the Australian Taxation Office, following rule changes on the size of superannuation balances and the period of inactivity, which were announced in 2H 12.
New ZealandAFS New Zealand net cashflows decreased by A$48m to A$3m in 1H 13. In NZ dollar terms, net cashflows decreased by NZ$59m.
KiwiSaver net flows fell A$53m to A$70m as higher AUM led to larger cash outflows due to higher balances and an increase in the number of KiwiSaver customers over 65 years old who withdrew funds as the initial five-year KiwiSaver lock-in came to an end.
In addition, the consolidation of two KiwiSaver offerings into the AMP KiwiSaver scheme, and the ending of a distribution arrangement with an external party for the two KiwiSaver schemes, drove an expected uplift in outflows in the first half of the year.

AMP Financial ServicesAMP Investor Report 1H 13 21
Cashflows and assets under management (AUM) cont’d
Other net cashflows continued to be impacted by investor sentiment and KiwiSaver now being the main investment and retirement product in the NZ market place.
AMP SMSFAMP SMSF includes Multiport, Cavendish and Ascend administration platforms and a 49% interest in SuperIQ. At 1H 13, AMP SMSF administered over 9,650 member accounts (including 1,434 through SuperIQ), up from approximately 3,000 member accounts at 1H 12.
AMP SMSF generated increased assets under administration of A$1,787m in 1H 13. At 1H 13, AMP SMSF administered A$12.3b.
AMP BankAMP Bank’s mortgage book increased by A$372m (3%) in 1H 13 to A$12.8b. In 1H 13, whilst mortgage demand was stronger across AMP’s aligned distribution channels including a stronger take-up of practice finance loans in the half.
AMP Bank’s deposit book reduced by A$188m (2%) to A$8.1b as a result of AMP Bank changing its preferred funding mix, with deposit rates adjusted accordingly. 45% of deposits are sourced directly from retail, 38% from AMP superannuation cash and term deposits, and the remaining 17% mainly from AMP managed investment fund platforms including North and Summit.
1H 13 AUM1
1H 13 net cashflows
AUM (A$m)FY 12AUM
Super-annuation Pension Investment Other
Total netcashflows
Othermovements2
1H 13AUM
Australian wealth management
AMP Flexible Super 7,309 615 478 - - 1,093 377 8,779
North 4,703 689 742 433 - 1,864 163 6,730
Summit, Generations and iAccess (including Assure) 13,864 (329) (162) (127) - (618) 826 14,072
Flexible Lifetime (superannuation and pension) 23,452 (452) (451) - - (903) 1,473 24,022
Other retail investment and platforms 3,161 (41) (50) (49) - (140) 145 3,166
Total retail on AMP platforms 52,489 482 557 257 - 1,296 2,984 56,769
Total corporate superannuation 21,162 66 31 - - 97 1,009 22,268
Total retail and corporate superannuation on AMP products 73,651 548 588 257 - 1,393 3,993 79,037
External platforms 12,008 (47) 50 (13) - (10) 755 12,753
Total Australian wealth management 85,659 501 638 244 - 1,383 4,748 91,790
Australian wealth protection 422 422 (422)
Australian mature 23,029 (476) (124) (18) (328) (946) 689 22,772
Total Australia 108,688 25 514 226 94 859 5,015 114,562
New Zealand
KiwiSaver 1,908 70 - - - 70 173 2,151
Other 8,397 2 (2) (86) 19 (67) 547 8,877
Total New Zealand 10,305 72 (2) (86) 19 3 720 11,028
Australian wealth management – AMP SMSF3
Assets under administration 10,512 1,787 12,299
Total AUM 129,505 97 512 140 113 862 7,522 137,889
Australian wealth management – AMP Bank by product
Deposits (Supercash, Super TDs and Platform TDs) 4,416 35 4,451
Deposits (retail) 3,886 (223) 3,663
Mortgages 12,384 372 12,756
Australian wealth management – AUM by asset class
Cash and fixed interest 34% 32%
Australian equities 33% 34%
International equities 22% 23%
Property 6% 6%
Other 5% 5%
Total 100% 100%
1 Reported AUM excludes shareholder capital.
2 Other movements includes fees, investment returns, taxes, as well as foreign currency movements on New Zealand AUM.
3 AMP SMSF includes Multiport, Cavendish, SuperIQ and Ascend administration platforms. SuperIQ is 49% owned by AMP, however 100% of assets under administration are included.

22 AMP Financial ServicesAMP Investor Report 1H 13
Embedded value (EV) and value of new business (VNB)
AFS embedded value (A$m)1 3% dm 4% dm 5% dm
Embedded value as at FY 12 11,695 10,962 10,318
Expected return 356 379 399
Investment markets, bond yields and currency 182 193 201
Claim and persistency assumptions, product and other (270) (253) (234)
VNB 171 149 130
Net transfers out (488) (488) (488)
Embedded value as at 1H 13 11,646 10,942 10,326
Return on embedded value before transfers as at 1H 132 3.8% 4.3% 4.8%
Embedded value comprises
Adjusted net assets3 972 972 972
Value of in-force business4 10,674 9,970 9,354
AFS embedded value (A$m) at the 3% dmWealth
managementWealth
protection MatureNew
Zealand Total
Embedded value as at FY 12 5,032 3,657 1,910 1,096 11,695
Expected return 142 126 54 34 356
Investment markets, bond yields and currency 97 (87) 94 78 182
Claim and persistency assumptions, product and other (215) (85) 8 22 (270)
VNB 95 68 7 1 171
Net transfers out (322) (27) (156) 17 (488)
Embedded value as at 1H 13 4,829 3,652 1,917 1,248 11,646
Return on embedded value before transfers as at 1H 132 2.4% 0.6% 8.5% 12.3% 3.8%
AFS embedded value (A$m) at the 4% dm
Embedded value as at FY 12 4,689 3,422 1,818 1,033 10,962
Expected return 150 135 58 36 379
Investment markets, bond yields and currency 102 (74) 89 76 193
Claim and persistency assumptions, product and other (170) (100) 1 16 (253)
VNB 85 58 6 - 149
Net transfers out (322) (27) (156) 17 (488)
Embedded value as at 1H 13 4,534 3,414 1,816 1,178 10,942
Return on embedded value before transfers as at 1H 132 3.6% 0.6% 8.5% 12.4% 4.3%
AFS embedded value (A$m) at the 5% dm
Embedded value as at FY 12 4,398 3,206 1,736 978 10,318
Expected return 156 142 63 38 399
Investment markets, bond yields and currency 107 (65) 84 75 201
Claim and persistency assumptions, product and other (135) (104) (3) 8 (234)
VNB 75 49 6 - 130
Net transfers out (322) (27) (156) 17 (488)
Embedded value as at 1H 13 4,279 3,201 1,730 1,116 10,326
Return on embedded value before transfers as at 1H 132 4.6% 0.7% 8.6% 12.4% 4.8%
3% dm 4% dm 5% dm
AFS value of new business (A$m)1 1H 13 1H 12 1H 13 1H 12 1H 13 1H 12
Value of new business by business line
Wealth management 95 89 85 77 75 66
Wealth protection 68 112 58 98 49 83
Mature 7 5 6 3 6 2
New Zealand 1 2 - - - (1)
Total 171 208 149 178 130 150
1 AMP Banking is excluded.
2 Return on EV before transfers is not annualised for half year periods.
3 Adjusted net assets are shareholder assets in excess of regulatory capital requirements (allocated at product level), at face value.
4 Value of in-force business discounts the value of shareholder net assets (A$3,038m at face value) to reflect expected time of release.

AMP Financial ServicesAMP Investor Report 1H 13 23
Embedded value (EV) and value of new business (VNB) cont’d
Embedded value1H 13 embedded value (EV) increased 3.8% before transfers at the 3% discount margin to A$12,134m.
Net transfers of A$488m include capital and AFS profits, Australian franking credits (at 70% of face value) and other value transferred to AMP Group.
Apart from the expected return which reflects the unwinding of the discount applied to the value of in-force business and the expected return on the adjusted net assets, the increase in 1H 13 EV was the result of:
– 1H 13 new business of $171m. – Investment and bond yields (A$113m). This was primarily
driven by the benefit of stronger investment markets on wealth management (WM) and Mature as well as higher bond rates for Mature improving the shareholders’ share of future
participating investment returns. This was partially offset by higher bond rates reducing the present value of the in-force wealth protection (WP) and WM books.
– Other (A$58m) primarily due to the favourable movement in the AUD/NZD exchange rate.
Offset by: – Persistency and claims assumptions (-A$126m). The primary
contributor to this was the strengthening of income protection claims assumptions during 1H 13 in both the Australian and New Zealand wealth protection businesses, and
– Product changes (-A$139m). (-A$214m) of the product change allows for the anticipated margin impacts from the enacted StrongerSuper legislation, consistent with previous margin guidance for wealth management, while A$75m relates to pricing reviews across the WP and AFS NZ insurance products.
Change in AFS embedded value 1H 13 (A$m) (at a discount rate of 3% above the bond yield)
10,500
11,000
11,500
12,000
12,500
13,000
FY 12 EV
Persist
ency and
claim
s ass
umptio
ns
Other
1H 13 EV
(befo
re tr
ansfers)
Net tra
nsfers
out
1H 13 EV
(afte
r tra
nsfers)
Product
changes
Expenses
1H 13
new busin
ess
Inve
stm
ent and
bond yield
s
Expected re
turn
12,134356
113
171 6
(126)
(488)
(139)
58
11,64611,695
A$m
Value of new business1H 13 value of new business (VNB) fell 17.8% to A$171m at the 3% discount margin.
The decline in VNB in 1H 13 reflects lower wealth protection risk volumes, the impact of strengthened wealth protection lapse assumptions in FY 12, higher discount rates in line with rising bond yields, and product change which allows for anticipated margin impacts from the enacted StrongerSuper legislation, partially offset by wealth protection pricing reviews.
Change in AFS value of new business 1H 13 (A$m) (at a discount rate of 3% above the bond yield)
0
50
100
150
200
250
A$m
1H 12 VNB
Product
changes
1H 13 VNB
Persist
ency, c
laim and
other a
ssum
ptions
Expenses
Futu
re eco
nomic/
inve
stm
ent ass
umptio
ns
Volum
e and mix
208
171(16)
(13)
12
(4)(16)

24 AMP Financial ServicesAMP Investor Report 1H 13
EV and VNB sensitivities
Key assumptionsThe tables illustrate the sensitivity of the embedded and new business values to various economic and business variables. The sensitivities can at best be only indicative because:
– they are not always linear or symmetrical, due to the asymmetric nature of risks facing insurance companies, including the scope for policyholders to exercise options against the company or to benefit from guarantees
– they assume that the movement in a particular variable is independent of all others; for the change in discontinuance rates, unit costs are assumed unchanged; for the 5% increase in sales (all costs variable), unit costs are assumed unchanged; for the 5% increase in sales (controllable costs fixed), unit costs are assumed to reduce because of the increase in business volumes
– they show the average movement for the risk discount margin range, ie 4%
– they are based on the 1H 13 position, ie not “forward looking”, and make no allowance for events subsequent to 30 June 2013.
– they are based on the 1H 13 sales product mix.
Note, at 1H 13 the VNB sensitivities are against the six month values of new business.
The 1% increase in long-term government bond yields is assumed to be accompanied by a 0.5% increase in Consumer Price Index (CPI) and other associated changes in economic assumptions, bonus rates, risk discount rates and bond values. For equities, the assumed future earning rate is assumed to increase by 1% (ie the equity risk premium is unchanged).
The 5% reduction in costs is based on AFS controllable costs only, ie it excludes planner payments and investment management fees.
Maintenance unit costs are derived from 2013 budgets. Allowance is made for future inflation but potential cost improvements arising after 2013 are ignored. Note that synergies captured in 2013 from the merger with AXA have been allowed for, however no allowance has been made for future cost savings from AMP's efficiency program. To determine the impact of further synergies on EV and VNB, the most appropriate sensitivity to use is the reduction in controllable costs.
The 10% reduction in discontinuance rates is based on a uniform reduction in lapses in all future years (eg a 15% lapse rate changes to 13.5%).
The 10% increase in Australian equities assumes all Australian shares increase in value by 10%.
Investment fees are defined as all ongoing fees (including member fees and rebates) on investment products with explicit fees. The investment fee sensitivity assumes no corresponding reduction in funds management costs or planner payments.
For wealth protection, lower discount rates due to lower long-term bond yields increases the present value of the margins in future wealth protection premiums and EV. For mature, the benefit of lower discount rates due to lower long-term bond yields is more than offset by the associated decrease in future participating business investment returns.
1H 13 change in embedded value (A$m)Wealth
managementWealth
protection MatureNew
Zealand Total
5% reduction in AFS controllable costs 107 38 23 11 179
10% reduction in discontinuance rates 297 322 52 75 746
1% (100 bps) decrease in long-term bond yields 83 155 (69) 22 191
1% (100 bps) increase in long-term bond yields (81) (141) 52 (23) (193)
10% increase in Australian equities 94 - 48 - 142
10% increase in international equities 59 - 16 14 89
1% reduction in investment fees (91) - (7) (4) (102)
1H 13 change in value of new business (A$m)Wealth
managementWealth
protection MatureNew
Zealand Total
5% reduction in AFS controllable costs 8 4 - 1 13
10% reduction in discontinuance rates 13 15 1 2 31
1% (100 bps) decrease in long-term bond yields 3 7 - 1 11
1% (100 bps) increase in long-term bond yields (3) (7) - - (10)
5% increase in sales (all costs variable) 5 3 - - 8
5% increase in sales (acquisition controllable costs fixed) 7 6 - - 13
1% reduction in investment fees (6) - - - (6)

AMP Financial ServicesAMP Investor Report 1H 13 25
EV assumptions
Economic assumptionsRisk discount rates are based on the yield on long-term government bonds plus a discount margin.
Annualised 10 year government bond yields 1H 13 FY 12
Australia 3.8% 3.3%
New Zealand 4.2% 3.6%
Assumed investment returns gross of income tax (% pa) are set at risk premiums over long-term government bond rates:
Risk premiums 1H 13 FY 12
Local equities1 4.5% 4.5%
International equities 3.5% 3.5%
Property 2.5% 2.5%
Fixed interest2 0.7% 0.8%
Cash (0.5%) (0.5%)
1 Includes allowance for franking credits on equity income.
2 The risk premium depends on the duration and credit rating of the underlying bond portfolios and hence can vary. The premium shown is the average across all portfolios.
For the purpose of setting future investment assumptions, the broad asset mixes assumed for participating business (A$19b) in Australia are:
AFS Australian participating 1H 13 FY 12
Equities 26% 26%
Property 10% 10%
Fixed interest 41% 41%
Cash 23% 23%
These asset mixes are not necessarily the same as the actual asset mix at the valuation date, as they reflect long-term future assumptions. The mixes shown are the weighted average across all Australian participating business, which is mostly in the mature business.
Annual inflation rates assumed are:
Inflation rate 1H 13 FY 12
Australia – CPI 2.4% 2.7%
Australia – Expenses 3.0% 3.0%
New Zealand – CPI 2.5% 2.5%
New Zealand – Expenses 3.0% 3.0%
These inflation rates are used for indexation of premiums and benefits, where appropriate, and for expense inflation.
Capital assumptionsValue of in-force business includes the discounted value of the future release to shareholder of the regulatory capital requirements as the business in-force runs off.
Adjusted net assets are shareholder assets in excess of the regulatory capital requirements and are valued at face value.
Operating assumptionsFuture mortality, morbidity and discontinuance rates are based on an analysis of recent AFS experience, general industry experience and, in some cases, population experience.
Changes since 31 December 2012 include: – changes to retail income protection claim assumptions resulting
in an overall higher incidence for future claims and an overall lower rate for termination of claims
– changes to NMLA income protection reinsurance claim assumptions resulting in a higher reinsurance recovery
– alignment of maintenance expenses assumptions within retail income protection including the introduction of an explicit claims management expense assumption for AMP Life.
Maintenance unit costs are derived from 2013 budgets. Allowance is made for future inflation but potential cost improvements arising after 2013 are ignored. Note that only synergies captured in 2013 from the merger with AXA have been allowed for; however, no allowance has been made for future cost savings from AMP's efficiency program.
Future rates of bonus for participating business were set at levels that were supportable by the assets backing the respective product sub-funds as at 30 June 2013.
Acquisition costs for VNB are the actual costs incurred in 1H 13.
Franking credits are valued at 70% of face value for Australia.
The continuation of the existing tax and regulatory framework is assumed including the impact of the enacted Future of Financial Advice and Stronger Super legislation which reduced 1H 13 embedded value by A$214m in respect of anticipated margin impacts, consistent with recent margin guidance in wealth management. No further allowance for regulatory change is made in the embedded value.
Further detailsOtherwise assumptions are generally consistent with the best estimate assumptions used in calculating policy liabilities for AMP Life and NMLA. A more detailed description of these assumptions and their 31 December 2012 values can be found in the notes to the 2012 AMP Limited Financial Report. As all relevant business is projected for the embedded value, the description of the assumptions in the notes applies even where that business is not valued by projection methods for profit reporting.

26 AMP CapitalAMP Investor Report 1H 13
AMP Capital financial summary
A$m 1H 13 1H 12 2H 12 FY 12% 1H 13/
1H 12
Profit and loss
Internal AUM based management fees 96 89 90 179 7.9
External AUM based management fees 91 88 94 182 3.4
Non-AUM based management fees 26 23 29 52 13.0
Performance and transaction fees 16 23 26 49 (30.4)
Fee income 229 223 239 462 2.7
Controllable costs (152) (159) (165) (324) 4.4
Tax expense (22) (17) (20) (37) (29.4)
Operating earnings before net seed pool income 55 47 54 101 17.0
Net seed pool income 5 4 9 13 25.0
Operating earnings including minority interests 60 51 63 114 17.6
Minority interests in operating earnings1 (9) (6) (9) (15) (50.0)
Operating earnings 51 45 54 99 13.3
Underlying investment income2 2 3 3 6 (33.3)
Underlying operating profit after income tax 53 48 57 105 10.4
Controllable costs
Employee related 85 92 93 185 (7.6)
Investment operations and other 60 59 63 122 1.7
Total operating costs 145 151 156 307 (4.0)
Project costs 7 8 9 17 (12.5)
Total controllable costs 152 159 165 324 (4.4)
Cost to income ratio 63.3% 68.2% 64.2% 66.2% n/a
Controllable costs to average AUM (bps)3 23.2 25.6 26.0 25.8 n/a
AUM (A$b) 131.0 123.3 128.6 128.6 6.2
Average AUM (A$b) – total3 131.6 124.3 126.5 125.5 5.9
Average AUM (A$b) – internal3 93.8 86.5 88.1 87.3 8.4
Average AUM (A$b) – external3 37.8 37.8 38.4 38.1 n/a
AUM based management fees to AUM (bps) – internal3 20.5 20.6 20.4 20.5 n/a
AUM based management fees to AUM (bps) – external3 48.1 46.6 48.9 47.8 n/a
Performance and transaction fees to AUM (bps)3 2.4 3.6 4.2 3.9 n/a
End period tangible capital resources – after transfers (A$m)4 285 210 289 289 35.7
RoBUE 45.2% 50.0% 58.3% 54.3% n/a
1 Minority interest for the period from 1 March 2012.
2 Underlying investment income is disclosed net of minority interest for the period from 1 March 2012.
3 Based on average of monthly average AUM.
4 End period tangible capital resources are disclosed gross of minority interest.
Movement in operating earnings 1H 12 to 1H 13
A$m
1H 12
operatin
g earnin
gsHig
her AUM
based
managem
ent fees
Higher n
on-AUM
based
managem
ent fees
Low
er perfo
rmance
and transa
ctio
n fees
Low
er
contro
llable co
sts
Higher t
axexpense
Higher n
et
seed pool in
com
e
Higher
min
ority i
ntere
st
1H 13
operatin
g earnin
gs
10
(5)
1
(3)
3
(7)
7
20
30
40
50
60
45
51

AMP CapitalAMP Investor Report 1H 13 27
AMP Capital financial summary cont’d
Business overviewAMP Capital is a diversified investment manager, managing investments across major asset classes including equities, fixed interest, infrastructure, property, diversified funds, multi-manager and multi-asset funds. Since 1 March 2012, Mitsubishi UFJ Trust and Banking Corporation (MUTB) has held a 15% ownership interest in AMP Capital.
Through working as a unified investment house, AMP Capital’s key priorities are to generate revenue growth through:
– delivering outstanding investment outcomes to clients – building a differentiated client experience driving strong client
engagement – partnering effectively with AFS to deliver investment solutions
for retail, SMSF and corporate super customers – expanding the global pension fund client base, and – building preferential distribution partnerships in select Asian
markets, particularly Japan and China.
Executing on these priorities continues to be supported by a focus on cost efficiency to allow both reinvestment and profit growth. AMP Capital has achieved a cost to income ratio within the target range of 60% to 65% for the last two half year periods in advance of the original target timeframe of 1H 14.
Operating earningsAMP Capital’s 1H 13 operating earnings before minority interests were A$60m, up from A$51m in 1H 12. AMP Capital’s operating earnings increased as a result of both growth in revenues driven by strong market performance and a continued focus on cost efficiency. This was partly offset by lower performance fees and a higher effective tax rate in line with previously provided guidance.
Fee incomeFee income increased A$6m (3%) in 1H 13 to A$229m from A$223m in 1H 12. The increase in 1H 13 fee income was driven by a A$10m (6%) increase in AUM based management fees, a A$3m (13%) increase in non-AUM based management fees partially offset by a A$7m (30%) decrease in performance and transaction fees.
AUM based management fees in 1H 13 increased A$10m (6%) over 1H 12 and average AUM increased A$7.3b (6%) with total AUM based management fees to AUM largely unchanged at 28.4 bps.
Internal AUM based management fees in 1H 13 increased A$7m (8%) to A$96m relative to 1H 12. The increase was primarily due to an 8% increase in average internal AUM, with internal AUM based management fees to AUM of 20.5 bps largely unchanged from 1H 12.
External AUM based management fees increased in 1H 13 by $3m to $91m (up 3% against 1H 12), and these were earned on the same level of AUM (A$37.8b at the end of both 1H 13 and 1H 12). The revenue increase was driven by higher average fees which were 48.1 bps for 1H 13 compared with 46.6 bps for 1H 12 (up 1.5 bps). The average fees earned benefited from a higher proportion of listed property and infrastructure assets being managed in-house (having transitioned from the ACB joint venture), partly offset by a reduction on fees from the internalisation of DUET at the end of 2012.
Non-AUM based management fees mainly include property asset management, development and leasing fees and bond lending fees. Non-AUM based management fees increased by A$3m to A$26m in 1H 13, primarily due to DUET advisory fees in respect of services assisting the transition of the DUET management structure and higher property development fees partly offset by lower property
management fees. The revised retail property co-ownership structure, agreed with Westfield in 2012, will continue to have the effect of decreasing property leasing and management fees in the near term while increasing development fees and AUM based management fees over the longer term.
1H 13 performance and transaction fees were A$16m, down from A$23m in 1H 12. In 1H 12, performance fees included A$6m in respect of outperformance of DUET. AMP Capital ceased to be entitled to performance fees from DUET upon implementation of the internalisation of DUET management in 2H 12. AMP Capital’s performance fees are traditionally higher in the first half of the year as performance fees for infrastructure funds are recognised annually on a 30 June year end basis.
Controllable costsControllable costs decreased by A$7m (4%) in 1H 13 to A$152m from A$159m in 1H 12. Cost efficiencies, including the full benefit of merger synergies relative to 1H 12 reflected through lower headcount, were partially offset by a A$2m increase in employee and operational costs as the listed property and listed infrastructure capabilities were brought in-house from 1 April 2012. These capabilities were previously run as a joint venture.
The cost to income ratio improved by 4.9 percentage points to 63.3% for 1H 13 which is within AMP Capital’s target of 60% to 65% in advance of the original timeframe of 1H 14.
Tax expenseAMP Capital’s effective tax rate in 1H 13 was 28.6% (1H 12 26.9%), which is lower than the Australian corporate tax rate (30%) largely due to tax concessions as a result of undertaking offshore activities and the receipt of joint venture (JV) income which is recognised net of tax.
AMP Capital’s effective tax rate increased following the settlement of the MUTB transaction as AMP Capital is no longer wholly-owned by AMP which reduced the amount of tax concessions claimed as a result of undertaking offshore activities.
Return on capitalRoBUE decreased to 45.2% in 1H 13 from 50.0% in 1H 12 due to higher average capital partially offset by higher operating earnings. Higher levels of capital were retained within the business due to the implementation of the revised ASIC capital requirements for responsible entities. Over the period a number of capital initiatives have been undertaken including a revised responsible entity structure, which will improve capital efficiency in future periods.
Net seed pool incomeThe seed pool is designed to assist business growth by seeding funds with assets and by investing initial equity in new funds. The seed pool is primarily debt funded.
At 30 June 2013, the seed pool held investment assets of A$28.8m, the largest of which was a 4.3% stake in Singapore Exchange listed AIMS AMP Capital Industrial REIT. The 1H 13 net seed pool profit of A$5m was driven by realised gains on short-term investments and distribution income on AIMS AMP Capital Industrial REIT. This was partially offset by debt funding costs.
Given the variable mix of short-term asset holdings and longer term cornerstone investments, the seed pool result can be volatile from year to year. Over the medium term, the seed pool is expected to break even.

28 AMP CapitalAMP Investor Report 1H 13
Investment performance
1 Year 3 Year 5 Year
Fund/style name AUM ($M)
Absolutereturn1
%
Excessreturn2
%
Competitorquartile
ranking3
Absolutereturn1
%
Excessreturn2
%
Competitorquartile
ranking3
Absolute return1
%
Excessreturn2
%
Competitor quartileranking3
Equities
Fundamental – Capital 1,852 27.0 2.3 Q2 10.1 (0.4) Q2 4.6 (0.3) Q2
Fundamental – SRI 1,464 25.9 1.2 Q2 9.0 (1.5) Q2 2.7 (2.2) Q4
Multi-Strategy – Active quant 1,227 23.9 (0.4) Q3 9.1 (1.0) Q2 3.6 (0.9) Q3
Multi-Strategy – Value 2,709 21.9 (2.9) Q4 9.0 (1.5) Q2 3.7 (1.2) Q3
FD Australian Shares 2,395 23.5 0.6 Q2 9.4 0.2 Q1 4.3 0.6 Q2
Asian Equity Growth 395 20.9 (4.0) Q4 (0.7) (6.7) Q4 n/a n/a n/a
Fixed interest
Wholesale Australian Bond Fund4
3,243 5.0 1.7 Q2 8.5 1.2 Q1 9.4 1.1 Q2
Corporate Bond 1,839 8.4 1.4 Q2 9.0 1.1 Q2 9.3 0.5 Q1
Asia Local Currency Bond 28 12.0 (2.2) n/a n/a n/a n/a n/a n/a n/a
International
FD Core International Shares 4,453 34.6 (0.0) Q1 11.3 (1.0) Q1 2.8 (2.3) Q3
FD International Bonds 1,877 6.0 0.6 Q3 7.5 (1.0) Q4 8.6 (1.1) Q2
Property (direct and listed)
Australian Core Property Portfolio
3,548 8.9 2.7 Q2 9.6 2.4 Q2 4.2 (3.4) Q1
Global Listed Property4 1,348 17.4 2.1 Q3 19.4 0.9 Q1 7.5 1.6 Q1
Infrastructure (direct and listed)
Infrastructure Equity Fund 672 10.8 3.0 Q2 11.6 2.9 Q3 6.2 (2.9) Q4
Global Listed Infrastructure 53 27.4 (1.8) n/a 15.9 (0.8) n/a n/a n/a n/a
Diversified
Balanced Growth Option5 8,621 19.5 Yes Q2 9.7 Yes Q2 4.0 No Q4
FD Balanced Fund5 8,232 18.9 Yes Q1 9.9 No Q3 4.2 No Q4
Goal based
Multi Asset Fund 480 11.9 4.1 n/a 8.4 0.6 n/a n/a n/a n/a
ipac Income Generator 688 15.5 3.2 n/a 9.9 2.5 n/a n/a n/a n/a
1 Absolute returns are annualised for periods greater than one year.
2 Excess return measured against the client goal.
3 Competitor quartile ranking determined using relevant Mercer or Chantwest Survey.
4 For this fund competitor quartile ranking, a composite return was used.
5 For this fund the client goal is to perform Q2 or better.

AMP CapitalAMP Investor Report 1H 13 29
Investment performance goalsIn line with AMP Capital’s priority to deepen client insight, in 1H 13 the business began to measure each fund and client mandate against its own client goal. Each goal displays a meaningful measurement of performance for the client and reflects AMP Capital’s commitment to foster a deep understanding of client expectations around investment performance.
In most cases, client goals reflect a relevant index (eg the S&P/ASX 200 Index) plus a level of return above the index agreed between the client and AMP Capital. For direct real estate and infrastructure investments, these client goals were already in place, with most funds and client mandates targeting an absolute benchmark reflecting an agreed margin above bond rates or CPI.
The table on page 28 shows the performance of AMP Capital’s flagship funds over various timeframes to 30 June 2013.
Responding to clients’ needs and volatile markets AMP Capital has experienced increased interest in funds that are specifically designed to more closely match investors’ particular financial needs. Such funds are commonly referred to as ‘goal based’ investments and may target a return over a measure such as inflation rather than a return benchmarked to a market index.
The ipac Income Generator and the AMP Capital Multi-Asset funds are designed to more closely meet investors’ financial goals and have seen a strong growth in assets under management over the past 12 months. In the 12 months to 30 June 2013, assets invested in the ipac Income Generator increased more than 100%, and assets invested in the AMP Capital Multi-Asset funds rose more than 250%. Over both 1 year and 3 year performance periods these funds have both delivered significant returns in excess of their goals (see page 28).
Recognition for the delivery of outstanding investment outcomesWithin the retail product suite there have been 12 ratings upgrades in 1H 13. Among ratings awarded to AMP Capital funds were ‘Recommended’ ratings by Zenith for three Australian equity funds (Australian Concentrated Equity Fund, Equity Fund and Sustainable Share Fund). The ratings are conviction based, and reflect the research house’s confidence in the newly formed equity team and its underlying investment processes.
Within fixed income, the Corporate Bond Fund received a ratings upgrade from Lonsec to ‘Highly Recommended’, the highest possible grade from this research house. In addition, the Wholesale Australian Bond Fund received a ‘Bronze’ rating from Morningstar. Within real estate, the Listed Property Trust received two upgrades – a ‘Bronze’ rating from Morningstar and a ‘Recommended’ rating from Lonsec.
Over the past 12 months, AMP Capital had three of the best 20 performing balanced funds for superannuation in Australia.1 In New Zealand, AMP Capital's Wealth Income Plus Fund delivered the strongest performance of the default KiwiSaver providers over the year to 30 June 2013.2 AMP Capital was also named Australian Fund House of the Year in Asian Investor magazine’s Investment Performance Awards for 2013. The award, from one of Asia’s most respected trade magazines, recognises AMP Capital’s strong investment performance, client focus and service.
Investment performance cont’d
1 Interim Chant West Multi-Manager Quarterly Survey, June 2013.
2 Morningstar KiwiSaver Survey; investment performance for one year to 30 June 2013.

30 AMP CapitalAMP Investor Report 1H 13
Cashflows and assets under management (AUM)
Cash inflows Cash outflows Net cashflows
Cashflows by asset class (A$m)1 1H 13 1H 12 % 1H/1H 1H 13 1H 12 % 1H/1H 1H 13 1H 12 % 1H/1H
ExternalAustralian equities 1,025 350 192.9 664 475 (39.8) 361 (125) n/aInternational equities 774 451 71.6 1,761 996 (76.8) (987) (545) (81.1)Fixed interest 1,028 1,387 (25.9) 2,283 1,500 (52.2) (1,255) (113) n/aInfrastructure 410 265 54.7 195 812 n/a 215 (547) 139.3Direct investments - - - - - - - - -Property 407 28 n/a 827 65 n/a (420) (37) n/aAlternative assets 17 23 (26.1) 1 1 - 16 22 (27.3)Total external 3,661 2,504 46.2 5,731 3,849 (48.9) (2,070) (1,345) (53.9)InternalAustralian equities 1,271 1,341 (5.2) 1,612 1,480 (8.9) (341) (139) (145.3)International equities 2,825 1,225 130.6 3,198 1,032 n/a (373) 193 n/aFixed interest 5,243 4,419 18.6 6,020 5,554 (8.4) (777) (1,135) 31.5Infrastructure 85 15 n/a 95 61 (55.7) (10) (46) 78.3Direct investments 6 6 - 50 20 (150.0) (44) (14) n/aProperty 179 40 n/a 373 101 n/a (194) (61) n/aAlternative assets 50 96 (47.9) 26 330 92.1 24 (234) 110.3Total internal 9,659 7,142 35.2 11,374 8,578 (32.6) (1,715) (1,436) (19.4)Total 13,320 9,646 38.1 17,105 12,427 (37.6) (3,785) (2,781) (36.1)
AUM by asset class (A$m) FY 124Net
cashflowsInvestment
returns and other1 1H 13 %
ExternalAustralian equities 3,434 361 163 3,958 10International equities 6,709 (987) 1,110 6,832 18Fixed interest 11,367 (1,255) (3) 10,109 27Infrastructure 3,657 215 90 3,962 11Direct investments 7 - 13 20 -Property2 12,846 (420) 163 12,589 34Alternative assets3 51 16 9 76 -Total external 38,071 (2,070) 1,545 37,546 100InternalAustralian equities 24,312 (341) 1,071 25,042 27International equities 19,929 (373) 3,048 22,604 24Fixed interest 39,207 (777) 166 38,596 41Infrastructure 1,423 (10) 30 1,443 2Direct investments 534 (44) 68 558 1Property2 3,833 (194) 133 3,772 4Alternative assets3 1,278 24 115 1,417 1Total internal 90,516 (1,715) 4,631 93,432 100TotalAustralian equities 27,746 20 1,234 29,000 24International equities 26,638 (1,360) 4,158 29,436 22Fixed interest 50,574 (2,032) 163 48,705 37Infrastructure 5,080 205 120 5,405 4Direct investments 541 (44) 81 578 -Property2 16,679 (614) 296 16,361 12Alternative assets3 1,329 40 124 1,493 1Total 128,587 (3,785) 6,176 130,978 100
AUM by source of client (A$m) FY 12 1H 13 %
Australia 104,819 107,485 82New Zealand 13,823 14,277 11Asia (including Middle East) 8,369 7,446 6Rest of world 1,576 1,770 1Total 128,587 130,978 100
1 Other includes distributions, taxes and foreign exchange movements.
2 Property AUM comprises Australian (A$14.0b), NZ (A$1.5b) and Global (A$0.6b) managed assets. Australian property AUM is invested in office (39%), retail (53%) and industrial (5%) and other (3%).
3 Alternative assets refer to a range of investments that fall outside of the traditional asset classes and includes investments in commodities and absolute return funds.
4 FY 12 allocation between internal and external AUM has been restated to be consistent with current period disclosures.

AMP CapitalAMP Investor Report 1H 13 31
Cashflows and assets under management (AUM) cont’d
AUM and cashflowsAUM increased by A$2.4b to A$131.0b in 1H 13, due to positive investment returns (+A$6.2b), partly offset by negative net cashflows (-A$3.8b).
External AUM decreased by A$0.5b in 1H 13 to A$37.5b, due to negative net cashflows (-A$2.1b) and partially offset by positive investment returns (+A$1.6b). External cash outflows were predominantly driven by net outflows from AXA equity products managed by an external investment manager (-A$0.3b), the restructure of the AXA Wholesale Australian Property Fund (-A$0.3b), international equity mandate losses from two domestic industry funds (-A$0.9b) and net outflows from Japanese retail clients (-A$1.4b). These outflows were partly offset by numerous domestic and international mandate inflows particularly into Australian equities and direct infrastructure assets. AMP Capital currently manages over A$2.2b on behalf of 60 global pension fund clients.
Cashflows from Japan have been significantly impacted by government policies seeking to bring Japan out of its deflationary environment. Targeted government fiscal policy and central bank actions to ease monetary policy have driven a depreciation of the Japanese Yen relative to the Australian dollar while also encouraging interest in domestic growth focused investments. The primary products impacted have been Australian dollar denominated bond funds across all distribution partnerships, where customers have been able to realise significant profits due to the depreciation of the Yen.
During the half, AMP Capital’s business alliance with MUTB helped AMP Capital continue to expand its distribution reach in Japan. The alliance launched the Global Listed Infrastructure Fund for MUTB’s corporate pension fund clients. Further product launches are planned for the pension channel in 2H 13, namely Global REITs and infrastructure debt.
In the Japanese retail market, the MUTB alliance now has three funds in the market, with combined funds under management of A$300m and further product launches planned for 2H 13.
AMP Capital is also working closely with its other existing Japanese distributors to promote existing products, develop new products and broaden distribution. A significant opportunity exists to work with
our alliance and distribution partners to create products tailored to a Japanese market characterised by inflation rather than deflation.
Partly offsetting these outflows were significant international and domestic mandate inflows. These included:
– A$0.7b Australian equities mandate from a domestic institution – A$0.2b global infrastructure mandate from a domestic
institution – A$0.2b for AMP’s 3rd China QFII quota supporting AMP Capital’s
investment in relocating its Asian equities capability to Hong Kong in 2012
– A$0.2b from a number of foreign pension funds into Australian office and shopping centre funds supporting a large property development pipeline.
Internal AUM increased by A$2.9b in 1H 13 to A$93.4b, due to strong investment returns (+A$4.6b), partly offset by negative net cashflows (-A$1.7b).
Internal net cashflows include AMP group payments such as dividend payments to shareholders and inflows/outflows from AFS products including products in run-off. Net cashflows from AFS are net of wealth management fees and taxes. AMP Capital manages all of AMP Life’s and part of NMLA’s Mature AUM, which is expected to run off between 4% and 6% per annum. Internal net cashflows are also impacted by flows to passive investment options managed outside of AMP Capital and cash investment options managed by AMP Bank. Whilst AFS cashflows have strengthened relative to 1H 12, this growth has been in AFS platforms (eg North) where AMP Capital manages a lower proportion of the FUM relative to other AFS platforms (eg Flexible Lifetime Super and corporate super products).
AMP Capital continues to partner with AFS to deliver tailored investment solutions for domestic retail clients which incorporate customer insights gained through Australia’s largest distribution network, employer relationships through corporate super and the SMSF business unit. This includes outcome based funds such as the Multi Asset Fund and ipac Income Generator seeking to provide customers with less volatile returns through investment cycles and have attracted A$187m in 1H 13.
Refer to the tables on page 30 for more detail on external and internal cashflows.
Movement in AUM by channel FY 12 to 1H 131
116
118
120
122
124
126
128
130
132
A$b
128.6
131.0
AUM at F
Y 12
Austra
lian
Matu
re busin
ess
AMP G
roup
Asian dist
ributio
nch
annels
Rest of t
he world
Austra
lian
WM
and WP
New Zealand
mark
et flo
ws
New Zealand
mark
et flo
ws
Inve
stm
ent
retu
rns a
nd other
AUM at 1
H 13
Austra
lian
mark
et flo
ws
External Internal
(1.0)
(1.2)
(1.0) (0.2)
6.2
(0.5) 0.00.0
0.1
1 AMP Capital cash inflows reported net of fees and taxes.

32 Capital structureAMP Investor Report 1H 13
Capital management
30 June 20131
A$m Total AMP1 AMP Life2 NMLA2AMPBank
OtherAFS
TotalAFS
AMPCapital
GroupOffice
Total capital resources3 9,634 2,749 1,468 520 3,094 7,831 466 1,337
Intangibles4 (3,807) (517) - (46) (2,784) (3,347) (223) (237)
Tangible capital resources 5,827 2,232 1,468 474 310 4,484 243 1,100
Senior debt5 (700) (700)
Other deductions6 (1,858) (982) (858) (18) - (1,858) - -
Regulatory capital resources 3,269 1,250 610 456 310 2,626 243 400
Shareholder minimum regulatory capital requirements (MRR)
1,566 686 367 313 145 1,511 55 -
Shareholder regulatory capital resources above MRR
1,703 564 243 143 165 1,115 188 400
31 December 20121,7
A$m Total AMP1 AMP Life NMLAAMPBank
OtherAFS
TotalAFS
AMPCapital
GroupOffice
Total capital resources3 9,323 2,795 1,366 482 3,085 7,728 477 1,118
Intangibles4 (3,808) (517) - (46) (2,832) (3,395) (230) (183)
Tangible capital resources 5,515 2,278 1,366 436 253 4,333 247 935
Senior debt5 (700) (700)
Other deductions6 (1,867) (1,003) (847) (17) - (1,867) - -
Regulatory capital resources 2,948 1,275 519 419 253 2,466 247 235
Shareholder minimum regulatory capital requirements (MRR)
1,576 715 351 248 151 1,465 111 -
Shareholder regulatory capital resources above MRR
1,372 560 168 171 102 1,001 136 235
1 Excludes minority interests.
2 AMP Life and NMLA include statutory funds and shareholder funds after expected 1H 13 transfers.
3 Shown after accounting mismatches, cashflow hedge resources and other adjustments. Refer to page 44.
4 Refer to page 41 for definition of intangibles. Intangibles includes capitalised costs. AXA acquired intangibles have been allocated between Other AFS and AMP Capital.
5 Refer to debt overview page 36 for more details.
6 Other deductions includes LAGIC regulatory adjustments and AMP Bank securitisation deductions.
7 FY 12 results restated. Comparative shown after allowing for the impact of LAGIC. The AMP Life and NMLA total have also been adjusted to include both statutory funds and shareholder funds.

Capital structureAMP Investor Report 1H 13 33
Capital management cont’d
Capital management frameworkAMP holds capital to protect customers, creditors and shareholders against unexpected losses. There are a number of ways AMP assesses the adequacy of its capital position. Primarily, AMP aims to:
– maintain a sufficient surplus above minimum regulatory requirements (MRR) to reduce the risk of breaching MRR
– hold sufficient liquidity to ensure that AMP has sufficient access to liquid funds, even under stress situations
– maintain the Group’s credit rating.
These measures form part of AMP’s risk appetite as approved by the Board and balances these considerations against the cost of capital.
A number of the operating entities within the AMP group of companies are regulated. This includes an authorised deposit taking institution (ADI), life insurance companies, superannuation entities and a number of companies that hold Australian Financial Services Licences (AFSL). This includes companies that are regulated by APRA, the Reserve Bank of New Zealand and/or ASIC and are required to hold minimum levels of regulatory capital, as set by the appropriate regulator.
Regulatory capital resources above MRR may vary throughout the year due to a range of factors including investment market movements, dividend payments and profits.
AMP’s businesses and the AMP Group maintain capital targets, reflecting AMP’s risk appetite and material risks including financial risk, product and insurance risk and operational risk. The capital targets are a management guide to the level of excess capital that AMP seeks to carry to reduce the risk of breaching its MRR.
AMP’s current dividend policy, as approved by the AMP Limited Board, is to pay dividends based on a payout ratio in the range of 70% to 80% of underlying profit and franked to the maximum extent possible. The dividend payout ratio is set to ensure that AMP retains sufficient profits to fund the expected growth in the capital requirements of its businesses, and is reviewed periodically.
AMP aims to meet larger non-recurring capital requirements through other capital management initiatives, including the use of the Dividend Reinvestment Plan (DRP).
Capital positionAt 30 June 2013, shareholder regulatory capital resources above MRR was A$1,703m (A$1,372m at 31 December 2012 after allowing for the impact of LAGIC of $272m). Compared to 31 December 2012, LAGIC impacts AMP’s capital disclosures, including:
– certain items (such as implicit deferred acquisition costs) being deducted and reducing both regulatory capital resources and shareholder MRR, and
– policyholder surplus does not form part of the capital adequacy test. However, policyholder capital resources are still available to absorb market and other impacts on participating business.
The 31 December 2012 comparatives have been shown allowing for the impact of these changes. AMP Life and NMLA totals have also been adjusted to include both statutory funds and shareholders’ funds.
Policyholder retained profits continue to be resources supporting the participating business. The total policyholder retained profits for AMP Life and NMLA was A$1,863m at 30 June 2013 (A$1,773m at 31 December 2012).
Movement from FY 12 to 1H 13 regulatory capital resources above MRR
FY 12
(pre
-LAGIC
)
LAGIC
impact
FY 12
(post-
LAGIC
)Underly
ing
profit
Inte
gratio
n cost
s
and other i
tem
sDivi
dends
(net o
f DRP)
Business
grow
thCapita
lised co
sts
(net o
f am
ortisa
tion)
Actuaria
l
gains/
(loss
es)
on DB fu
ndsOth
er inco
me
(incl.
FX)
1H 13
Other2
Capital e
fficie
ncies1
0
500
1,000
1,500
2,000
1,644
1,372
1,703
(272)
440
(36)
(291)(66)
(55)
8176
71
111
A$m
1 Includes refinements to LAGIC calculations (+$30m) and a revised responsible entity structure within AMP Capital (+$38m).
2 Other includes the impact of AMP Bank repayment of $100m subordinated debt to AMP Group (+$100m).

34 Capital structureAMP Investor Report 1H 13
The increase in shareholder regulatory capital resources above MRR was mainly driven by retained profits, additional capital issued under the DRP, capital efficiency initiatives, more favourable investment markets and the impact of AMP Bank's repayment of the A$100m loan from Group Office. This was partially offset by business growth and integration costs. The capital initiatives include refinements to LAGIC calculations and a revised responsible entity structure within AMP Capital.
AMP uses a number of long-term strategies involving derivatives in place within both AMP Life and NMLA to manage market risks. Refer to page 15 for more details.
Minimum regulatory requirementsThe main minimum regulatory capital requirements for AMP’s businesses are:
– AMP Life and NMLA – capital adequacy requirements as specified under the APRA Life Insurance Prudential Standards
– AMP Bank – capital requirements as specified under the APRA ADI Prudential Standards
– Other AFS – capital requirements under AFSL and superannuation requirements, and
– AMP Capital – capital requirements under AFSL.
Additional capital is also held for risks associated with the North guarantees.
From 1 July 2013 Operational Risk Financial Requirements relating to new APRA Superannuation Prudential Standards will apply to AMP’s superannuation entities and will be transitioned in over three years.
APRA is developing capital standards for conglomerate groups which apply to AMP and are not expected to be fully effective until 1 January 2015. Draft capital standards were released in May 2013 and are still subject to ongoing consultation. The impact on AMP's capital position will be assessed against the final standards.
APRA has confirmed transition arrangements with AMP, relating to the subordinated debt held at the Group level continuing to be 100% recognised as eligible capital under the revised standards until the earlier of the relevant instruments’ first call date or March 2016.
Capital targetAMP’s businesses and the AMP Group maintain capital targets, reflecting AMP’s risk appetite and material risks including financial risk, product and insurance risk and operational risk.
AMP Life, NMLA and AMP Bank have Board minimum capital levels above APRA requirements, with additional capital targets held above these amounts. Within the life insurance businesses, the capital targets above Board minimums have been set to a less than 10% probability of capital resources falling below the Board minimum over a 12 month period.
AMP manages the participating business to target a very high level of confidence that the business is self-supporting and that assets will be sufficient to meet liabilities.
Capital targets are also set for AMP Capital to cover risk associated with seed and sponsor capital investments and operational risk.
Other components of AMP Group’s capital targets include amounts relating to Group Office investments, defined benefit funds and other operational risks.
Interim 2013 dividendAMP’s interim 2013 dividend is 11.5 cents per share franked to 70%. The total dividend payout ratio for 1H 13 is 77% of underlying profit. AMP continues to offer the DRP to eligible shareholders. For the purpose of the interim 2013 dividend, no discount will apply to determine the DRP allocation price. The DRP will not be underwritten and new shares will be issued.
Capital management cont’d

Capital structureAMP Investor Report 1H 13 35
Nominal versus effective exposureThe asset allocations above reflect the effective exposure of shareholder funds after consideration of the effects of derivative positions.
Management of market risks in the shareholder fundsTotal shareholder funds (A$5,124m) comprise direct shareholder funds (A$4,636m) where the shareholder can determine the asset mix and co-mingled shareholder funds (A$488m) that are invested in the same asset mix as participating policyholder funds.
The investment of shareholder funds provides management with the ability to manage the overall market risk within AMP. Changes are made to the asset mix of shareholder funds to achieve the desired level of overall market risk exposure across AMP. At 30 June 2013, less than 2% of AMP shareholder funds were invested in equities.
The majority of the international equity exposures are not hedged for currency. Property exposures relate primarily to a 65% interest in AMP’s head office at 33 Alfred Street, Sydney.
The shareholder fixed interest portfolio is split approximately 66% in sovereign exposures and 34% in corporate exposures. Corporate exposures are invested in AAA (12%), AA (38%), A (36%), BBB (14%) and sub-investment grade and unrated (less than 1%).
AMP continues to review the asset mix of shareholder funds to maximise shareholder returns within the constraints of AMP’s risk appetite.
Implicit DACThe implicit DAC relates to the wealth protection businesses, and is similar to a loan from shareholder capital to the wealth protection business (for both Australia and New Zealand) to fund the upfront costs associated with acquiring new risk insurance business. The implicit DAC asset generates an investment return equivalent to a one year government bond.
Underlying investment incomeAMP calculates the underlying investment income that is allocated to the business units (BUs) and Group Office by applying an underlying rate of return to BU and Group Office shareholder assets invested in income producing investment assets (as opposed to operating assets).
The underlying after tax rate of return used for 1H 13 was 3.0% pa (FY 12 4.25% pa) and is based on the long-term target asset mix and assumed long-term rates of return. The investment return equivalent to a one year government bond of 1.8% pa after tax is applied to the implicit DAC.
Shareholder funds invested in income producing assets may be higher or lower than business unit capital due to the working capital requirements of the business unit.
Capital management cont’d
Regulatory capital resources (A$m) 30 June 2013 31 December 20121
AMP shareholder equity2 7,955 7,744Allowable hybrid Tier 1 instruments - -Less: goodwill and other intangibles (3,807) (3,808)Less: other deductions3 (1,858) (1,867)Tier 1 2,290 2,069Tier 2 979 879Total regulatory capital (Tier 1 + Tier 2) 3,269 2,948
Total capital resources by asset class (A$m) 30 June 2013 31 December 2012International equities4 16 32Australian equities 85 86Property 312 309International fixed interest 52 43Australian fixed interest 290 247Cash5 2,139 2,090Implicit DAC 2,230 2,130Total shareholder funds 5,124 4,937Other6 703 578Tangible capital resources 5,827 5,515Intangibles 3,807 3,808Total capital resources 9,634 9,323
1 FY 12 results have been restated. Comparative shown after allowing for the impact of LAGIC.
2 Shown after accounting mismatches, cashflow hedge resources and other adjustments. Refer to page 44.
3 Other deductions includes LAGIC regulatory adjustments and AMP Bank securitisation deductions.
4 As at 30 June 2013, international equities includes A$76m of international equities and -A$60m in relation to equity down-side protection.
5 Cash includes cash balances held as bank deposits, short-term fixed interest securities and floating rate securities.
6 Other includes tangible capital resources of AMP Bank of A$474m (FY 12 A$436m), A$202m (FY 12 A$322m) of cash held backing liabilities, seed pool assets of A$26m (FY 12 A$25m) and A$1m (FY 12 -A$205m) of other assets and liabilities.

36 Capital structureAMP Investor Report 1H 13
Debt overview
30 June 2013 31 December 2012
A$mCorporate
debt AMP Bank1 TotalCorporate
debt AMP Bank1 Total
Subordinated bonds/notes 83 - 83 83 - 83
AMP Notes2 296 - 296 296 - 296
Subordinated loan from Group Office to AMP Bank - - - (100) 100 -
AXA subordinated notes 600 - 600 600 - 600
AMP Bank subordinated debt - 150 150 - 150 150
Total subordinated debt 979 150 1,129 879 250 1,129
Domestic commercial paper, NCDs and repos - 801 801 - 438 438
Euro commercial paper - 73 73 - - -
Domestic medium-term notes 200 1,588 1,788 200 903 1,103
Drawn syndicated loan 500 - 500 500 - 500
Total senior debt 700 2,462 3,162 700 1,341 2,041
Deposits3 - 8,427 8,427 - 8,615 8,615
Total debt 1,679 11,039 12,718 1,579 10,206 11,785
Corporate gearing ratios
S&P gearing 12% 11%
Interest cover – underlying (times) 13.2 12.1
Interest cover – actual (times) 10.6 9.2
Corporate debt by year of repayment4
A$m 0 - 1 year5 1 - 2 years 2 - 5 years 5 - 10 years 10+ years Total
Total corporate debt at 30 June 2013 296 200 1,100 83 - 1,679
Total corporate debt at 31 December 2012 - 196 1,300 - 83 1,579
1 This excludes AMP Bank debt held within securitisation vehicles.
2 The AMP Notes 10 year subordinated debt, with a call date in 2014, has been structured to qualify as Tier 2 capital for APRA purposes.
3 At 30 June 2013 deposits include AMP Bank retail and wholesale deposits (A$3.7b), AMP Super Cash and Super TDs (A$3.4b), North and Summit (A$1.0b) and other AMP Life policyholder deposits (A$0.3b).
4 Based on the earlier of the maturity date and the first call date.
5 At 30 June 2013 this amount represents the AMP Notes which mature in 2019 with a call date and step up in 1H 14.
Corporate debtAt 30 June 2013, AMP had access to significant liquidity through Group cash of $684m and an undrawn syndicated loan of A$500m. In May 2013, AMP Bank repaid A$100m of subordinated debt lent from AMP Group.
At 30 June 2013, approximately 50% of corporate debt was effectively at fixed rates.
AMP Bank AMP Bank utilises a diverse range of funding sources including securitisation, retail deposits and short and long-term wholesale borrowings to manage its funding and liquidity requirements.
The securitisation of residential mortgage backed securities (RMBS) is a source of funding and capital relief for AMP Bank. Securitisation funding is non-recourse to AMP Bank and the AMP Group. Total securitised funds as at 30 June 2013 were A$3.3b.
As at 1 January 2013, AMP Bank had A$250m of outstanding subordinated debt instruments, of which A$225m contributed to AMP Bank's Tier 2 capital under Basel III. In May 2013, AMP Bank repaid A$100m of subordinated debt lent from AMP Group. As at 30 June 2013, AMP Bank had A$150m of subordinated debt outstanding of which 100% qualifies as Tier 2 capital.
AMP Bank issued two senior unsecured MTNs during the half year being a three-year A$500m floating rate note issued at 108 bps over BBSW in March and a four-year $300m floating rate note which priced at 110 bps over BBSW in May.
AMP Group continues to provide a guarantee covering AMP Bank’s liabilities, with the exception of the $150m subordinated debt issued in December 2012.

Additional information AMP Investor Report 1H 13 37
Group Office
Group Office costs not recovered from business units1H 13 Group Office costs not recovered from business units were A$32m, A$2m lower than 1H 12 reflecting the benefit of integration synergies. Most Group Office related synergies have been passed onto AFS and AMP Capital through lower group charges.
On adoption of revised accounting standard ‘AASB 119 Employee Benefits’, requirements in respect of accounting for employee defined benefit funds have changed such that A$3m (post-tax) of additional cost has been recognised in 1H 13 Group Office costs. 1H 12 comparative information has also been restated to reflect the new requirements (A$3m post-tax). It is expected that this change will increase annual Group Office costs by approximately A$6m (post-tax) reducing over time as the number of current staff who are members of the defined benefit funds also reduces.
Underlying investment income on Group Office capitalUnderlying investment income on Group Office capital was A$14m in 1H 13, down from A$27m in 1H 12. As flagged in the FY 12 Investor Report and consistent with the substantial fall in interest rates over 2012, the lower amount of underlying investment income reflects assumed after tax returns of 3% for the shareholder investments and 1.8% for deferred acquisition costs.
Interest expense on corporate debt1H 13 interest expense on corporate debt was A$36m, down from A$48m in 1H 12. Interest expense decreased as the weighted average cost of debt declined 124 basis points due to the impact of falling interest rates on the floating rate component of corporate debt.
Other items1H 13 other items were -A$5m (1H 12 A$4m).
Other items include one-off and non-recurring revenues and costs.
In 1H 13, other items included the cost of A$8m in respect of implementing regulatory change. AMP expects the one-off cost to the company of implementing the Future of Financial Advice, Stronger Super and other regulatory changes over the next 12 months to be a further A$8m after tax taking the total cost to A$75m in line with the upper end of previous guidance.
1H 12 comparatives have been restated by -A$4m upon the adoption of accounting standard AASB 119 'Employee Benefits’. Under the revised AASB 119, the amount recognised in profit or loss in relation to the assets of the funds is measured using the same discount rate as for the defined benefit liability. Previously assets were measured using an expected earnings rate. The impact of this change in accounting standard will vary over time depending on the net surplus or deficit positions of the employee defined benefit funds and prevailing discount rates.
AXA integration costs1H 13 AXA integration costs were A$31m (1H 12 A$71m) and relate to the integration of AXA following the merger. AMP expects total integration costs to be A$310m (post-tax). The 1H 13 AXA integration costs were lower than forecast largely due to the timing of spend. Of the remaining expected AXA integration costs of A$46m, approximately A$30m to A$40m is expected to be incurred in 2H 13 with the remainder in FY 14.
At 30 June 2013, AMP had realised run rate synergies as a result of the merger with AXA of 93% of the targeted A$150m (post-tax) per annum.
A$m 1H 13 1H 12 2H 12 FY 12% 1H 13/
1H 12
Group Office costs not recovered from business units1 (32) (34) (32) (66) 5.6
Underlying investment income on Group Office capital 14 27 25 52 (48.1)
Interest expense on corporate debt (36) (48) (38) (86) 25.0
Other items1 (5) 4 17 21 n/a
AXA integration costs (31) (71) (57) (128) 56.3
Amortisation of AXA acquired intangible assets (47) (50) (49) (99) 6.0
Market adjustment – investment income 3 (1) (11) (12) n/a
Market adjustment – annuity fair value 10 (10) 1 (9) n/a
Market adjustment – risk products 5 23 (27) (4) (78.3)
Accounting mismatches1 18 (10) (20) (30) n/a
Interest expense summary
Average volume of corporate debt 1,609 1,795 1,579 1,696
Weighted average cost of corporate debt 6.40% 7.64% 6.87% 7.24%
Tax rate 30% 30% 30% 30%
Interest expense on corporate debt2 36 48 38 86
Franking credits
AMP dividend franking credits at face value at end of period3 210 141 191 191
1 Prior period comparatives have been restated in accordance with changes in accounting standards AASB 119 and AASB 10. Refer below and page 38 for further details.
2 Includes fees associated with undrawn liquidity facilities.
3 Balance of franking account adjusted for franking credits which will arise from the payment of income tax provided for in the financial statements. After franking the interim dividend (70%), the balance of franking credits will be A$108m.

38 Additional informationAMP Investor Report 1H 13
Amortisation of AXA acquired intangible assetsThe difference between the purchase consideration for AXA (A$4.3b) and AXA net tangible assets (A$1.2b) represents AXA intangible assets (A$1.0b) and goodwill (A$2.1b). AXA intangible assets primarily comprise rights to future income and the value of acquired software.
AXA intangible assets are required to be amortised over their expected useful life; goodwill is not required to be amortised.
1H 13 amortisation of AXA acquired intangible assets was A$47m. Amortisation of AXA acquired intangibles for FY 13 is expected to be approximately A$91m.
Market adjustment – investment incomeMarket adjustment – investment income represents the excess (or shortfall) between underlying investment income and actual return on shareholder assets invested in income producing assets.
The 1H 13 market adjustment – investment income was A$3m, reflecting valuation gains on domestic and international equities partially offset by the shortfall in underlying investment income relative to actual shareholder investment income due to low short-term interest rates and valuation movements on fixed interest assets.
Market adjustment – annuity fair value1H 13 market adjustment – annuity fair value was A$10m (1H 12 -A$10m) due to the impact of movements in credit spreads.
Market adjustment – annuity fair value relates to the net impact of investment markets on AMP’s annuity portfolio. AMP’s annuity portfolio comprises fixed term and lifetime annuity products, with Australian fixed term liabilities of A$0.4b and Australian lifetime annuity liabilities of A$1.4b. The Australian annuity portfolio is managed on a matched basis, with fixed interest assets matched to expected annuity cash outflows. Equities are not used by AMP to match its Australian annuity book.
The assets supporting AMP’s Australian annuity book comprise a mixture of government bonds, semi-government bonds and corporate bonds. These assets are principally exposed to Australian credit markets. The asset mix is managed to achieve close matching of assets to expected cash annuity outflows. Perfect cashflow matching should remove any interest rate or reinvestment risk, but credit risk remains.
For fixed term annuities, accounting standards require the liabilities and the assets that back them both to be valued consistently on a fair value basis.
For lifetime annuities, accounting standards require the liabilities to be valued based on the risk-free rate of return and the assets to be valued on a fair value basis. Therefore, in the absence of any defaults, changes in credit spreads and deterioration in the quality of individual assets can lead to timing differences.
As the assets are predominantly held to maturity, gains/losses due to changes in credit spreads or credit deterioration should reverse over time, to the extent that there are no asset defaults. In 1H 13 there were no asset defaults.
The assets that support AMP’s Australian annuity book comprise a mixture of government bonds and cash (9%), semi-government bonds (46%) and corporate bonds (45%). The average duration of the portfolio is six years. The portfolio credit rating composition is AAA (47%), AA (29%), A (21%), BBB (3%) and sub-investment grade and unrated (less than 1%). Corporate bond exposures are AAA (11%), AA (35%), A (47%), BBB (6%) and sub-investment grade and unrated (1%).
Market adjustment – risk products1H 13 market adjustment – risk products was A$5m (1H 12 A$23m) due to the impact of movements in bond yields.
Market adjustment – risk products relates to the net impact of changes in market economic assumptions (bond yields and CPI) on the valuation of risk insurance liabilities. Under Australian accounting standards, life insurance business is accounted for using Margin on Services (MoS).
Under MoS, the profits that are expected to be earned on life insurance contracts emerge over the life of the business as services are provided and income received. MoS involves projecting future cashflows (premiums, benefits and costs after allowing for inflation), and discounting future cashflows to their present value using the appropriate risk free discount rate. Changes to market related economic assumptions affect policy liabilities and current year profit. The impact of movements in bond yields can vary from period to period depending on the level of claims reserves. For information on changes in market economic assumptions in 1H 13, refer to page 25.
Accounting mismatchesUnder Australian Accounting Standards, some assets held on behalf of policyholders (and related tax balances) are included in the financial statements at different values to the value used in the calculation of policy liabilities in respect of the same asset. Movements in these policyholder assets flow through to shareholder profit. These differences have no impact on the true operational profits and losses of the Group.
Mismatch items that may impact the profit and loss arise from policyholder interests in the following:
– treasury shares (AMP Limited shares held by the statutory funds on behalf of policyholders) (1H 13 +A$11m, 1H 12 +A$4m)
– owner-occupied properties (1H 13 -A$2m, 1H 12 -A$1m) – investments in controlled entities (1H 13 +A$19m, 1H 12 -A$8m) – superannuation products invested with AMP Bank (1H 13
-A$10m, 1H 12 -A$5m).
1H 12 comparatives have been restated upon the adoption of accounting standard AASB 10 ‘Consolidated Financial Statements’ which resulted in an increase of A$3m to the accounting mismatch loss on investment in controlled entities of the statutory funds.
Group Office cont’d

Additional information AMP Investor Report 1H 13 39
Sensitivities – profit and capital
All profit sensitivities shown are a full year impact.
The profit and capital sensitivities are only indicative, because: – they are not always linear or symmetrical, because of the
asymmetric nature of risks facing insurance companies, including the scope for policyholders to exercise options against the company or to benefit from guarantees
– they assume that the particular variable moves independently of all others
– they are based on the 1H 13 position, ie not “forward looking”, and make no allowances for events subsequent to 30 June 2013
– in general, for profit sensitivities, they assume the movement occurs evenly over the year; for capital sensitivities, they assume the movement occurs at 30 June 2013.
Other assumptions include: – parent company shareholders’ equity is fully invested and there
are no adjustments for investments which are outside index weightings
– currency movements in investments in self-sustaining operations do not impact profit
– sales sensitivity assumes the same product mix as in underlying sales during 1H 13
– investment income sensitivity is based on the amount of investments held at 30 June 2013
– property sensitivities relate to unlisted property; listed property trusts are included in equities
– bond yield sensitivities relate to both government and corporate bond yields for both Australian and international bonds
– profit sensitivities exclude the impact of movements in credit spreads in corporate and semi-government debt
– AMP Bank net interest margin assumed to be insensitive to changes in cash rate.
Profit sensitivitiesThe sensitivities set out above apply to FY 13 operating earnings and investment income, assuming changes in a range of hypothetical economic or business variables.
Important considerations when using these sensitivities
Operating earnings – investment linked businessFor investment linked business, fee income is largely based on the level of AUM, which in turn is directly impacted by investment markets.
For changes in market variables which impact AUM levels, it is assumed that the change in the variable occurs evenly across the entire year. That is, the analysis is point to point, assuming the movement from one point (eg beginning of the year equity markets) to another point (eg end of the year equity markets) occurs evenly over the year. It is similar to assuming a one-off movement in the variable half way through the year. For large movements that do not occur half way through the year, the profit sensitivities need to be extrapolated. For example, a 10% increase/ decrease in equity markets at the start of the year would have double the impact on FY 13 operating earnings than set out in the table above.
The sensitivities are based on the 1H 13 position and are not forward looking. If using the sensitivities as forward looking (eg applying 1H 13 profit sensitivities for FY 13 or FY 14), an allowance for changes in AUM levels should be made. Refer to page 10 (WM) and page 26 (AMP Capital) for average AUM levels that applied in 1H 13.
The AMP Capital operating earning sensitivities are net of minority interests and assume no change to performance and transaction fees and do not include seed pool investments.
FY 13 profit sensitivities (A$m)Operating earnings (post-tax)
WM WP Mature NZTotal
AFSAMP
CapitalGroupOffice Total
Investment income
Investment market variables10% increase in Australian equities 10 - 4 - 14 2 16 410% decrease in Australian equities (10) - (4) - (14) (2) (16) 110% increase in international equities 7 - 1 2 10 2 12 1610% decrease in international equities (7) - (1) (2) (10) (2) (12) (8)10% increase in property 3 - 2 1 6 1 7 2610% decrease in property (3) - (2) (1) (6) (1) (7) (26)1% (100 bps) increase in 10 year Australian bond yields (1) - 5 - 4 (1) 3 (21)1% (100 bps) decrease in 10 year Australian bond yields 1 - (5) - (4) 1 (3) 201% increase in cash rate 1 - - - 1 - 1 191% decrease in cash rate (1) - - - (1) - (1) (19)Business variablesAMP Financial Services5% increase in AUM 19 - 5 3 275% increase in sales volumes 3 1 - 1 51% increase in persistency 3 8 (2) 1 10AMP Capital5% increase in average external AUM 65% increase in average internal AUM 7AMP Limited5% reduction in controllable costs 20 7 2 3 32 11 3 46

40 Additional informationAMP Investor Report 1H 13
Sensitivities – profit and capital cont’d
The sensitivities are based on 30 June 2013 equity markets, bond yields and property values and correspond to the disclosure in the capital management section (refer to page 32).
Sensitivities include the profit/loss impact from changes in investment market variables on total shareholder funds. Changes in BU operating earnings are not reflected.
The capital sensitivities for AMP Life and NMLA include guaranteed products (the majority of which are contained within the AFS mature business), risk insurance products, unit linked products and shareholders' funds.
AMP Group sensitivities are movements in AMP Life and NMLA plus movements in Group shareholder capital held outside the Life companies, and include the effect on capital from defined benefit funds and North guarantees.
AMP’s capital management policies includes market related trigger points at which management will take action to reduce the impact of market movements on AMP’s capital position.
AMP actively manages both the asset mix and the associated capital. Market movements and trends are carefully monitored and adjustments made accordingly.
The sensitivities contained in the table above do not make any allowance for management actions subsequent to 30 June 2013, which may have a significant impact on these sensitivities.
Operating earnings – risk insurance and annuity business For risk insurance and annuity business, movements in economic variables (bond yields, CPI) impact to the extent that the valuations of assets and liabilities are mismatched. These impacts are included in market adjustment – annuity fair value and market adjustment – risk products and have no effect on BU operating earnings but are included in EV sensitivities.
Operating earnings – participating businessFor participating business, profit margins are dependent on the level of future bonuses supported by both the value of available assets and the assumed future investment earnings (largely driven by prevailing bond yields). As the effect of movements in investment markets is absorbed by bonuses over a number of years, only a portion of the impact is recognised in the current reporting period and is allocated between policyholders and shareholders.
Investment incomeThe analysis is based on a point in time and indicates the impact a change in the market variable would have on AMP’s FY 13 total investment income (ie underlying investment income plus market adjustment - investment income).
The cash rate sensitivities show the impact of changes in the cash rate on FY 13 total investment income. The impact assumes that the change in the cash rate occurs evenly over the year.
The investment income sensitivities do not include any allowance for investment gains/losses on assets that back AMP’s annuity book (refer to page 38 for details) or the impact of changes in economic variables (such as bond yields or CPI) on wealth protection products. The impacts of investment market variables are not always symmetrical as they are inclusive of the impacts of long-term and tactical protection strategies.
The sensitivities assume that the guarantees on the North products are effectively hedged under current hedging procedures.
AMP regulatory capital sensitivitiesThe sensitivities shown below reflect the impact of market movements on AMP's capital position.
The analysis is a point in time view of the capital impact of movements in equity markets, bond yields and property values on AMP’s capital position inclusive of long-term and tactical protection.
Capital sensitivities – regulatory capital resources above MRR (A$m)1 AMP Life NMLAAMP
Group2
Actual 30 June 2013 (ASX 200 @ 4,803; Australian bond yields @ 3.8%) 564 243 1,703Equity sensitivity – 20% increase (ASX 200 @ 5,764) 50 30 170
– 10% increase (ASX 200 @ 5,283) 20 20 80– 10% decrease (ASX 200 @ 4,323) (20) (20) (80)– 20% decrease (ASX 200 @ 3,842) (40) (30) (160)
Australian bond yields sensitivity – 100 bps increase (Australian bond yields @ 4.8%) (80) (20) (10)– 50 bps increase (Australian bond yields @ 4.3%) (40) (10) (10)– 50 bps decrease (Australian bond yields @ 3.3 %) - - (40)– 100 bps decrease (Australian bond yields @ 2.8%) (60) (20) (160)
Property sensitivity3 – 10% increase in unlisted property values 50 10 60– 10% decrease in unlisted property values (50) (10) (60)
1 These sensitivities are a point in time and do not make any allowance for subsequent management actions.
2 AMP Group sensitivities include AMP Life, NMLA and impacts outside AMP Life and NMLA.
3 Property sensitivity relates to unlisted property. Listed property is included in the equity sensitivity.

Glossary of terms and independent reviewAMP Investor Report 1H 13 41
Accounting treatment and definitions
Accounting mismatches – Refer to page 38.
AFS value of new business – A calculation of the economic value of the shareholder profits expected to emerge from the new business written over a particular period for AFS, net of the cost of providing supporting capital.
AFS value of risk new business – Value of new business for AFS wealth protection and New Zealand risk business.
Controllable costs – Include operational and project costs and exclude variable costs, provision for bad and doubtful debts and interest on corporate debt.
Controllable costs to AUM – Calculated as controllable costs divided by average of monthly average AUM.
Corporate debt – Borrowings used to fund shareholder activities of the AMP Group including the impact of any cross-currency swaps entered into to convert the debt into A$, but excluding limited recourse debt in investment entities controlled by AMP Life policyholder funds and debt used to fund AMP Bank activities. Refer to page 36 for more detail.
Cost to income ratio – Calculated as controllable costs divided by gross margin. Gross margin is calculated as total operating earnings and underlying investment income before tax expense plus controllable costs.
Deferred acquisition costs (DAC) – Margin on Services (MoS) is the financial reporting methodology developed to report life insurance business in Australia. Under MoS, the profits that are expected to be earned on life insurance contracts emerge over the life of the business as services are provided and income received. Under MoS, all costs associated with acquiring new business (including planner payments, controllable costs and stamp duty) are allowed for in determining profit margins and policy liabilities. For wealth protection business, this normally results in negative policy liabilities for new business. The amount of this negative policy liability is often referred to as DAC or implicit DAC.
Defined benefit fund – A scheme that provides a retirement benefit, usually based on salary and/or a predetermined formula for calculating that benefit. Unlike an accumulation scheme, the retirement benefit and method of calculation is known to the member at all times.
Discontinuance rates – The assumed future rates for voluntary discontinuance (lapse) of contracts for the purposes of determining embedded value. These rates vary by individual product or product groups and, where appropriate, by other factors such as duration in-force or age attained.
Dividend payout ratio – Calculated as dividend per share divided by EPS (underlying).
Embedded value – A calculation of the economic value of the shareholder capital in the AFS business and the shareholder profits expected to emerge from the AFS business in-force.
EPS (actual) – Earnings per share calculated as profit attributable to shareholders of AMP Limited divided by the basic weighted average number of ordinary shares. The weighted average number of ordinary shares is net of treasury shares.
EPS (underlying) – Calculated as underlying profit divided by the basic weighted average number of ordinary shares.
External AUM (AMP Capital) – Assets managed by AMP Capital sourced from institutional clients (including corporate, public sector and industry superannuation funds, and large non-superannuation funds), non-AMP dealer groups, private clients and international clients and partnerships.
Group cash – Cash and cash equivalents held outside business units.
Group risk API – Contractual annual premium payable on all in-force group risk policies.
Individual risk API – Contractual annual premium payable on all in-force individual risk policies.
Individual risk lapse rate – Calculated as annualised voluntary cancellations as a percentage of average annual premium in-force prior to cancellations. Policies expiring due to maturities, death or disablement and conversions are excluded from the calculation.
Intangibles – Represents acquired goodwill, acquired identifiable intangibles on merging with AXA, acquired asset management mandates and capitalised costs.
Interest cover (actual) – Calculated on a rolling 12 month after tax basis as profit attributable to shareholders of AMP Limited before interest expense on corporate debt for the year divided by interest expense on corporate debt for the same period.
Interest cover (underlying) – Calculated on a rolling 12 month after tax basis as underlying profit before interest expense on corporate debt for the year divided by interest expense on corporate debt for the same period.
Internal AUM (AMP Capital) – Assets managed by AMP Capital sourced from AFS and Group Office.
Investment performance (AMP Capital) – The percentage of AUM meeting or exceeding their client goals.
Market adjustment – annuity fair value – Refer to page 38.
Market adjustment – investment income – Refer to page 38.
Market adjustment – risk products – Refer to page 38.
Minimum regulatory capital requirements (MRR) – Refer to page 34.
Net interest margin (AMP Bank) – Net interest income over average interest earning assets.
Net seed pool income (AMP Capital) – Income on seed pool assets, including normal valuation movements and net profit/loss on sales, offset by funding costs.
Operating earnings – Represent shareholder attributable profits or losses that relate to the performance of the BU. The principles of life insurance accounting are used in reporting the results of AFS. Operating earnings exclude investment earnings on shareholder capital and one-off items.
Persistency – Calculated as opening AUM less cash outflows during the period divided by opening AUM. AFS and WM total cash outflows are adjusted to exclude internal flows so as to reflect external cash outflows only.

42 Glossary of terms and independent reviewAMP Investor Report 1H 13
Accounting treatment and definitions cont’d
Return on embedded value – Calculated as the increase in embedded value in the period before transfers, divided by embedded value at the beginning of the period.
RoBUE – Return on BU equity is calculated as BU underlying operating profit after income tax (including underlying investment income) divided by the BU’s average of monthly average tangible capital resources. No allowance is made for the benefit of gearing, which occurs at the Group level.
RoE (actual) – Calculated as annualised profit attributable to shareholders of AMP Limited divided by the average of the monthly average shareholder equity for the period.
RoE (underlying) – Calculated as annualised underlying profit divided by the average of the monthly average shareholder equity for the period.
S&P gearing – Senior debt plus non-allowable hybrids divided by Economic Capital Available plus hybrids plus senior debt. Economic Capital Available is as defined by Standard & Poor’s and includes AMP shareholders’ equity (including goodwill and acquired AXA intangibles but excluding acquired asset management mandates and capitalised costs) and 100% of future AMP Life shareholder profits.
Tier 1 capital – Comprises the highest quality components of capital that fully satisfy all of the following essential characteristics:a) provide a permanent and unrestricted commitment of fundsb) are freely available to absorb lossesc) do not impose any unavoidable servicing charge against
earnings, and d) rank behind the claims of depositors, policyholders and other
creditors in the event of winding-up.
Tier 2 capital – Includes other components of capital that, to varying degrees, fall short of the quality of Tier 1 capital but nonetheless contribute to the overall strength of an entity as a going concern.
Total capital resources – Total capital invested in BUs and Group Office including both tangible and intangible capital.
Underlying investment income – The investment income on shareholder assets invested in income producing investment assets (as opposed to income producing operating assets) attributed to the BUs (including Group Office) has been normalised in order to bring greater clarity to the results by eliminating the impact of short-term market volatility on underlying performance. The excess (or shortfall) between the underlying return and the actual return is disclosed separately as market adjustment – investment income. Underlying returns are set based on long-term expected returns for each asset class, except for a short-term return, equivalent to a one year government bond, set annually for the implicit DAC component of shareholder assets. The return on AMP Bank income producing investment assets is included in wealth management operating earnings.
Underlying profit – AMP’s key measure of business profitability, as it smooths investment market volatility stemming from shareholder assets invested in investment markets and aims to reflect the trends in the underlying business performance of the AMP Group. The components of underlying profit are listed on page 3.
Variable costs – Include costs that vary directly with the level of related business (eg investment management fees and banking commissions and securitisation costs).
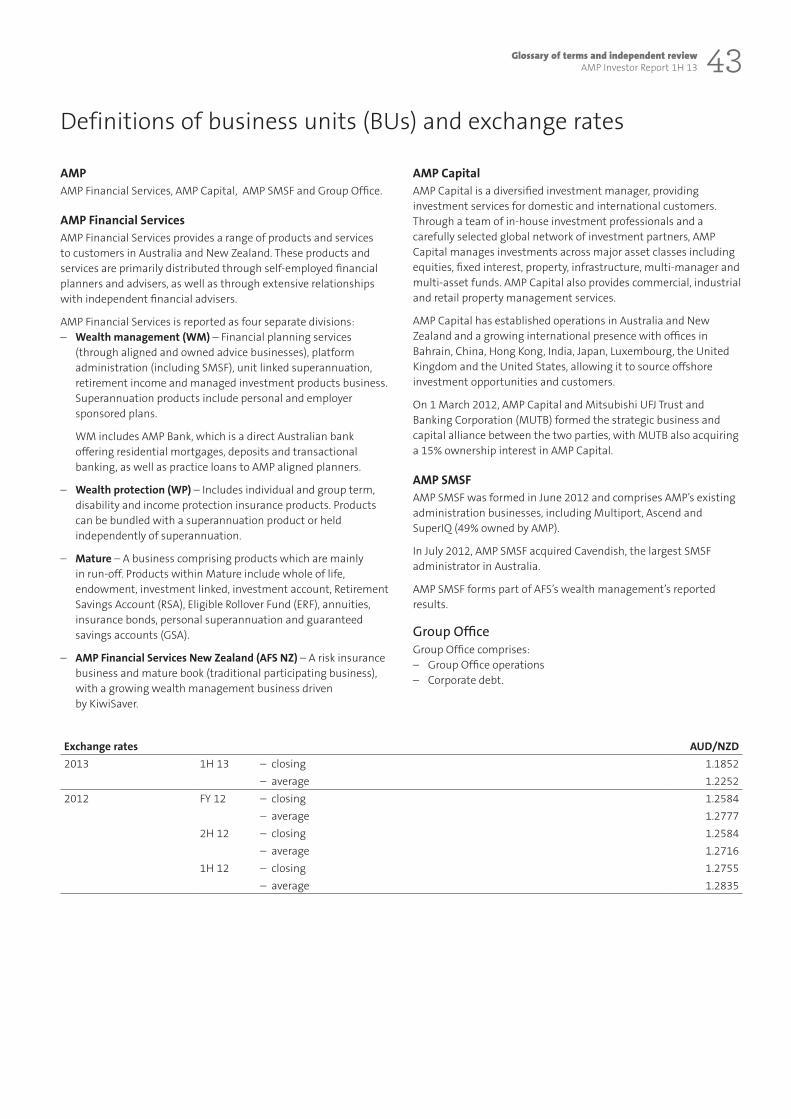
Glossary of terms and independent reviewAMP Investor Report 1H 13 43
Definitions of business units (BUs) and exchange rates
AMPAMP Financial Services, AMP Capital, AMP SMSF and Group Office.
AMP Financial ServicesAMP Financial Services provides a range of products and services to customers in Australia and New Zealand. These products and services are primarily distributed through self-employed financial planners and advisers, as well as through extensive relationships with independent financial advisers.
AMP Financial Services is reported as four separate divisions: – Wealth management (WM) – Financial planning services
(through aligned and owned advice businesses), platform administration (including SMSF), unit linked superannuation, retirement income and managed investment products business. Superannuation products include personal and employer sponsored plans.
WM includes AMP Bank, which is a direct Australian bank offering residential mortgages, deposits and transactional banking, as well as practice loans to AMP aligned planners.
– Wealth protection (WP) – Includes individual and group term, disability and income protection insurance products. Products can be bundled with a superannuation product or held independently of superannuation.
– Mature – A business comprising products which are mainly in run-off. Products within Mature include whole of life, endowment, investment linked, investment account, Retirement Savings Account (RSA), Eligible Rollover Fund (ERF), annuities, insurance bonds, personal superannuation and guaranteed savings accounts (GSA).
– AMP Financial Services New Zealand (AFS NZ) – A risk insurance business and mature book (traditional participating business), with a growing wealth management business driven by KiwiSaver.
AMP CapitalAMP Capital is a diversified investment manager, providing investment services for domestic and international customers. Through a team of in-house investment professionals and a carefully selected global network of investment partners, AMP Capital manages investments across major asset classes including equities, fixed interest, property, infrastructure, multi-manager and multi-asset funds. AMP Capital also provides commercial, industrial and retail property management services.
AMP Capital has established operations in Australia and New Zealand and a growing international presence with offices in Bahrain, China, Hong Kong, India, Japan, Luxembourg, the United Kingdom and the United States, allowing it to source offshore investment opportunities and customers.
On 1 March 2012, AMP Capital and Mitsubishi UFJ Trust and Banking Corporation (MUTB) formed the strategic business and capital alliance between the two parties, with MUTB also acquiring a 15% ownership interest in AMP Capital.
AMP SMSFAMP SMSF was formed in June 2012 and comprises AMP’s existing administration businesses, including Multiport, Ascend and SuperIQ (49% owned by AMP).
In July 2012, AMP SMSF acquired Cavendish, the largest SMSF administrator in Australia.
AMP SMSF forms part of AFS’s wealth management’s reported results.
Group OfficeGroup Office comprises:
– Group Office operations – Corporate debt.
Exchange rates AUD/NZD
2013 1H 13 – closing 1.1852
– average 1.2252
2012 FY 12 – closing 1.2584
– average 1.2777
2H 12 – closing 1.2584
– average 1.2716
1H 12 – closing 1.2755
– average 1.2835

44 Glossary of terms and independent reviewAMP Investor Report 1H 13
1H 13 financial results
Analysis of operating results (A$m)
AMPFinancialServices
AMPCapital
GroupOffice Total
BU operating earnings 391 51 - 442
Group Office costs - - (32) (32)
Total operating earnings 391 51 (32) 410
Underlying investment income 50 2 14 66
Interest expense on corporate debt - - (36) (36)
Underlying profit 441 53 (54) 440
Other items - - (5) (5)
AXA integration costs - - (31) (31)
Amortisation of AXA acquired intangible assets - - (47) (47)
Profit before market adjustments and accounting mismatches 441 53 (137) 357
Market adjustment – investment income - - 3 3
Market adjustment – annuity fair value - - 10 10
Market adjustment – risk products - - 5 5
Accounting mismatches - - 18 18
Profit attributable to shareholders of AMP Limited 441 53 (101) 393
Total capital resources by equity class (A$m) 30 June 2013 31 December 20121
Contributed equity 9,486 9,333
Equity contribution reserve 1,019 1,019
Other reserves 479 409
Retained earnings 448 332
Demerger loss reserve (3,585) (3,585)
Total AMP statutory equity attributable to shareholders 7,847 7,508
Accounting mismatches, cashflow hedge reserve and other adjustments2 108 236
Total AMP shareholder equity 7,955 7,744
Corporate debt 1,679 1,579
Total capital resources 9,634 9,323
1 Prior period comparatives have been restated in accordance with changes in accounting standards AASB 119 and AASB 10.
2 Other adjustments includes an adjustment for AMP Foundation to exclude the assets of the foundation from capital resources.

Glossary of terms and independent reviewAMP Investor Report 1H 13 45
Independent Auditor’s Review Report to the Board of AMP Limited
We have reviewed selected information presented in the AMP Limited Investor Report for the half year ended 30 June 2013 (“Investor Report”).
The analysis of results, capital resources and embedded value information have been prepared for inclusion in the Investor Report and are used as a measure of financial performance and position.
Management’s Responsibility for the Investor ReportManagement is responsible for the preparation of the Investor Report, inclusive of pages 22, 24, 25 [Embedded Value], 32 [Capital Management] and 44 [1H 13 financial results] (collectively ’the financial information’) and has determined that the accounting, presentation and disclosure criteria used are appropriate to the needs of financial users. This responsibility includes establishing and maintaining internal control relevant to the preparation of the 30 June 2013 Investor Report that is free from material misstatement, whether due to fraud or error.
Auditor’s responsibilityOur responsibility is to express a conclusion on selected information set out in the 30 June 2013 Investor Report based on our review. We have conducted our review in accordance with the Standard on Review Engagement ASRE 2405 Review of Historical Financial Information Other than a Financial Report in order to state whether, on the basis of the procedures described, anything has come to our attention that causes us to believe that:
– the analysis of financial results on page 44 and total capital resources on page 35 of the Investor Report are not materially consistent with the definitions of operating earnings, underlying investment income and total capital resources set out on pages 41 and 42.
– the embedded value assumptions stated on pages 24 and 25 are not reasonable for their intended purpose in all material respects.
No opinion is expressed as to whether the accounting, presentation and disclosure criteria used are appropriate to the needs of the Directors of AMP Limited.
ASRE 2405 requires us to comply with the requirements of the applicable code of professional conduct of a professional accounting body.
The financial information has been prepared for inclusion in the Investor Report for the half year ended 30 June 2013. We disclaim any assumption of responsibility for any reliance on this review report or on the Investor Report to which it relates to any other than the Directors of AMP Limited.
Our review of the analysis of financial results included making enquiries, primarily of AMP Limited’s personnel responsible for financial and accounting matters, review the reconciliation of financial information on page 44 and total capital resources on page 35 to the Financial Report of AMP Limited, review of the determination of the operating earnings, underlying investment income and total capital resources in accordance with the definitions set out on pages 41 and 42 and analytical procedures.
Our review of the embedded value assumptions was limited to the review of AMP Limited’s documentation to support the embedded value assumptions, making enquiries, primarily of AMP Limited’s personnel responsible for financial and actuarial matters, and analytical procedures applied to financial data used by management to derive embedded value assumptions.
A review is substantially less in scope than an audit conducted in accordance with Australian Auditing Standards and consequently does not enable us to obtain assurance that we would become aware of all significant matters that might be identified in an audit. Accordingly, we do not express an audit opinion.
Independence We are independent of AMP Limited and have met the independence requirements of Australian professional ethical pronouncements and the Corporations Act 2001.
Conclusion
Analysis of Operating Results Based on our review, which is not an audit, nothing has come to our attention that causes us to believe that the analysis of financial results set out on page 44 and total capital resources on page 35 of the Investor Report for the half year ended 30 June 2013 are not materially consistent with the definitions of operating earnings, underlying investment income and total capital resources as set out on pages 41 and 42.
Embedded Value Based on our review, which is not an audit, nothing has come to our attention that causes us to believe that the embedded value assumptions set out on pages 24 and 25 of the Investor Report for the half year ended 30 June 2013 are not reasonable for their intended purpose in all material respects.
Ernst & Young Sydney 15 August 2013

46 Glossary of terms and independent reviewAMP Investor Report 1H 13
Information for shareholders
2 September 2013 Ex-dividend date for interim 2013 dividend (Australia)
4 September 2013 Ex-dividend date for interim 2013 dividend (New Zealand)
6 September 2013 Record date for interim 2013 dividend
9 September – 13 September 2013 Pricing period for interim 2013 dividend reinvestment plan
11 October 2013 Payment date for interim 2013 dividend
25 October 2013 Third quarter 2013 cashflow and AUM announcement
20 February 2014 FY 13 results announced
3 March 2014 Ex-dividend date for final 2013 dividend (Australia)
5 March 2014 Ex-dividend date for final 2013 dividend (New Zealand)
7 March 2014 Record date for final 2013 dividend
10 April 2014 Payment date for final 2013 dividend
8 May 2014 First quarter 2014 cashflow and AUM announcement
8 May 2014 Annual General Meeting

Website
For additional 2013 half year results information, visit AMP’s website at www.amp.com.au/shareholdercentre
You will find:
– Background information on AMP, business units, management and policies.
– Statutory reporting at the AMP Limited level (incorporating shareholder, policyholder and non-controlling interests).
– Archived webcasts of presentations to investors and analysts.
– Archived ASX announcements and historical information.
– Definitions and details of assumptions.
Registered Office: Level 24 33 Alfred St SyDNEy NSW 2000 AustrAlIA
www.amp.com.au

NS1679 08/13