Embed Size (px)
Citation preview

7/29/2019 Amos- Pleoseismic constraints on Holocene surface ruptures NZ
http://slidepdf.com/reader/full/amos-pleoseismic-constraints-on-holocene-surface-ruptures-nz 1/13
This article was downloaded by: [University of Colorado at Boulder Libraries]On: 30 October 2012, At: 22:02Publisher: Taylor & FrancisInforma Ltd Registered in England and Wales Registered Number: 1072954 Registered office: MortimerHouse, 37-41 Mortimer Street, London W1T 3JH, UK
New Zealand Journal of Geology and GeophysicsPublicat ion detai l s, incl uding inst ruct ions for aut hors and subscript ion infor mat ion:h t t p : / / www. t a nd f on l i ne . co m/ l o i/ t n zg2 0
Palaeoseismic constraints on Holocene surfaceruptures along the Ostler Fault, southern NewZealandCB Amos
a, JJ Lapwood
b, DC Nobes
b, DW Burbank
c, U Rieser
d& A Wade
e
aDepart ment of Eart h & Planetary Science, University of Cal i forni a, Berkeley, CA, USA
bDepart ment of Geological Sciences, Universit y of Canterbur y, Christchurch, NZ
cDepartment of Earth Science, University of California, Santa Barbara, CA, USA
dSchool of Geography, Environment and Earth Sciences, Victoria University of
Well ington, Well ington, NZeFugro Consultants, Inc., Walnut Creek, CA, US
Version of record first published: 07 Nov 2011.
To cite t his art icle: CB Amos, JJ Lapwood , DC Nobes, DW Burbank, U Rieser & A Wade (2011): Palaeoseismic const raint son Holocene surf ace rupt ures along t he Ost ler Fault , southern New Zealand, New Zealand Journal of Geology andGeophysics, 54: 4, 367-378
To link t o this art icle: ht t p : / / dx.do i .o rg / 10.1080/ 00288306.2011.601746
PLEASE SCROLL DOWN FOR ARTICLE
Full terms and conditions of use: http://www.tandfonline.com/page/terms-and-conditions
This article may be used for research, teaching, and private study purposes. Any substantial or systematicreproduction, redistribution, reselling, loan, sub-licensing, systematic supply, or distribution in any form toanyone is expressly forbidden.
The publisher does not give any warranty express or implied or make any representation that the contentswill be complete or accurate or up to date. The accuracy of any instructions, formulae, and drug dosesshould be independently verified with primary sources. The publisher shall not be liable for any loss, actions,claims, proceedings, demand, or costs or damages whatsoever or howsoever caused arising directly orindirectly in connection with or arising out of the use of this material.
7/29/2019 Amos- Pleoseismic constraints on Holocene surface ruptures NZ
http://slidepdf.com/reader/full/amos-pleoseismic-constraints-on-holocene-surface-ruptures-nz 2/13
Palaeoseismic constraints on Holocene surface ruptures along the Ostler Fault, southern New Zealand
CB Amosa*, JJ Lapwoodb$, DC Nobesb, DW Burbankc, U Rieserd and A Wadee
aDepartment of Earth & Planetary Science, University of California, Berkeley, CA, USA; bDepartment of Geological Sciences, Universityof Canterbury, Christchurch, NZ; cDepartment of Earth Science, University of California, Santa Barbara, CA, USA; d School of Geography, Environment and Earth Sciences, Victoria University of Wellington, Wellington, NZ; eFugro Consultants, Inc., Walnut Creek,CA, US
Palaeoseismic trenching along the central Ostler fault zone reveals the nature and timing of past surface-rupturing earthquakes.A 26 m long trench excavated into a last-glacial (26.5 ka) outwash surface cut by the Ruataniwha strand of the North CentralOstler fault reveals evidence for at least two metre-scale surface displacements in the last c. 8 ka. Detailed logging of colluvialwedge and alluvial stratigraphy, combined with optically stimulated luminescence dating of loess within colluvial packages,
provides a maximum bound on the most recent earthquake (MRE) of 2.3 Á /4.5 ka. The MRE resulted in a surface displacementof at least 1.8 m, consistent with an estimated moment magnitude (M) 6.9 Á /7.1 earthquake based on the total 60 km length of theOstler fault zone. The penultimate event occurred sometime before 4.1 Á /8.4 ka and resulted in a comparable or larger surfacedisplacement. Similar ages from samples collected in previous trenches on the Ostler fault suggest that surface ruptures maypersist across kilometre-scale stepovers defined by the active surface trace of the fault. At the trench scale, comparison betweendip slip calculated from topographic fault-scarp profiling (7.8 m) and the total offset of exposed outwash gravels (6.0 m) suggeststhat surface folding immediately adjacent to the fault scarp accommodates roughly 25% of the total slip. Given a previouslyreported recurrence interval of c. 2 Á /5 ka for the Ostler fault, the presence of only 2 Á /3 palaeoearthquakes on the 26.5 ka outwashsurface indicates that additional events likely occurred on nearby fault scarps in an overall complex zone of surface faulting.
Keywords: earthquake recurrence; luminescence dating; neotectonics; Ostler fault; palaeoseismicity; seismic hazard; SouthernAlps
Introduction
The Ostler fault is a zone of east-directed reverse faultingwithin the intermontane Mackenzie Basin in the Southern
Alps of New Zealand (Fig. 1). The fault represents one of
several structures east of the plate-bounding Alpine fault that
accommodate approximately one-quarter to one-third of the
37 mm a(1 of relative motion between the obliquely colliding
Pacific and Australian plates (DeMets et al. 1994; Pearson
et al. 1995; Norris & Cooper 2001). Previous work on the
structural and geomorphic evolution of the Ostler fault
suggests a rate of late-Quaternary slip of c. 1 Á /2 mma(1
from deformed geomorphic surfaces (Blick et al. 1989; Read
& Blick 1991; Amos et al. 2007; Amos et al. 2010) and seismic
reflection profiling (Ghisetti et al. 2007). Curiously, repeatedlevel-line surveying related to construction of the Ohau-A
Power Project near Twizel (Fig. 1) documents ongoing
vertical deformation and anticlinal warping of the fault’s
hanging wall comparable to the overall fault slip rate (Blick
et al. 1989). This observation raises the question whether the
Ostler fault zone slips coseismically during large surface-
rupturing earthquakes, or whether a component of the
permanent deformation across the fault represents the
product of aseismic creep. Fault trenching on the Northern
fault section (Fig. 1) confirms the presence of several
coseismic ruptures during the Holocene by documenting
colluvial wedge deposits adjacent to and deformed across thefault scarp (van Dissen et al. 1994). The question remains,
however, whether these earthquakes also ruptured central
portions of the Ostler fault, where aseismic folding may
accommodate some component of the total deformation.
New palaeoseismic trenching provides constraints on the
history of past earthquakes along the Ruataniwha strand of
the North Central Ostler fault, immediately west of Twizel
(Figs. 1 and 2). Here we present detailed logging of exposed
trench stratigraphy and the results of optically stimulated
luminescence (OSL) dating of colluvial wedges to character-
ise the size, timing and frequency of ancient surface-
rupturing earthquakes. This work confirms the presence of multiple metre-scale coseismic displacements during the
Holocene in the vicinity of the original levelling surveys
(Blick et al. 1989). Comparison with documented pa-
laeoearthquakes on the northern Ostler fault zone also
enables assessment of kilometre-scale stepovers in the sur-
face trace of the fault (Fig. 1) as potential barriers to rupture
propagation. Additionally, this work allows evaluation of
the relative contribution of coseismic displacement versus
hanging-wall folding to the total deformation over an
individual fault scarp.
*Corresponding author. Email: [email protected]$Present address: Rio Tinto Iron Ore, Perth, WA, Australia
New Zealand Journal of Geology and Geophysics
Vol. 54, No. 4, December 2011, 367 Á /378
ISSN 0028-8306 print/ISSN 1175-8791 online
# 2011 The Royal Society of New Zealand
http://dx.doi.org/10.1080/00288306.2011.601746
http://www.tandfonline.com

7/29/2019 Amos- Pleoseismic constraints on Holocene surface ruptures NZ
http://slidepdf.com/reader/full/amos-pleoseismic-constraints-on-holocene-surface-ruptures-nz 3/13
Study area
The Ostler fault spans approximately 60 km in total, from the
Ahuriri River in the south to Whale Stream at the northern
end of Lake Pukaki (Fig. 1). The fault exhibits an average
strike of 0158 (Fig. 1 inset) in a crustal and structural
transition zone that interrupts the largely plate-boundary
parallel orientation of folds and thrusts in Otago and
Canterbury (Upton et al. 2009). Geomorphic offsets along
Figure 1 The Ostler fault zone. Overview map shows the location of fault scarps, major fault sections and previous palaeoseismic trenches in
the Ohau and Pukaki Valleys. Inset map depicts active fault traces in the Mackenzie Basin (MB), Otago (OT) and Canterbury (CB), as well
as the tectonic setting of the obliquely colliding Australian (AUS) and Pacific (PAC) plates. The location of the Ostler fault zone (OFZ)
within the small bounding box and the Great Groove fault (GGF) are also shown for reference.
368 CB Amos et al.

7/29/2019 Amos- Pleoseismic constraints on Holocene surface ruptures NZ
http://slidepdf.com/reader/full/amos-pleoseismic-constraints-on-holocene-surface-ruptures-nz 4/13
the fault display primarily west-side-up, reverse displace-
ments without a significant component of strike slip (Read
1984). Seismic reflection profiles across the Ostler fault zone
indicate a throw of c. 800 m of Plio-Pleistocene strata
underlying the Mackenzie Basin (Ghisetti et al. 2007). The
Ostler fault at its northern end merges with the Great Groove
fault, which extends an additional 30 km along the foot of the
Ben Ohau Range (Ward & Sporli 1979). With the exception
Figure 2 Surficial geologic map of the Ohau River terraces showing the location of fault scarps, fold axes, terrace risers and topographic
profiles depicted in Fig. 3.
Palaeoseismic constraints on Holocene surface ruptures 369

7/29/2019 Amos- Pleoseismic constraints on Holocene surface ruptures NZ
http://slidepdf.com/reader/full/amos-pleoseismic-constraints-on-holocene-surface-ruptures-nz 5/13
of the Great Groove fault, where displacement of Plio-Pleistocene sediments includes both reverse and left-lateral
strike-slip components (Templeton et al. 1999), displacement
along the Ostler fault zone is considered to be predominately
dip slip.
The active surface trace of the Ostler fault is highly
segmented and can be subdivided into four primary fault
sections and numerous shorter strands based on disconti-
nuities in the surface trace and changes in the overall fault
strike (Fig. 1). Complex patterns of surface faulting are
common where the fault intersects major transverse drai-
nages or outwash valleys such as the Ohau River (Fig. 2).
Despite this surface complexity, the total displacement andfault-slip-rate profile summed for individual strands and
across stepovers (Amos et al. 2010) suggests that the entire
Ostler fault has behaved as a kinematically linked array
(Davis et al. 2005).
Surface deformation patterns across the fault zone are
typified by highly asymmetric anticlinal folding with broad
west-tilted fold backlimbs abruptly transitioning to rela-
tively steep and short fold forelimbs adjacent to the fault
trace (Fig. 3). In an earlier study, we interpreted this pattern
as reflecting slip along listric or curviplanar thrusts rooted at
shallow depths into planar fault ramps (Amos et al. 2007).
Changes in the shape and extent of surface folding (Fig. 3)
reflects substantial along-strike variation in the orientationand geometry of the underlying fault planes potentially
controlled in part by changes in the depth and character of
underlying Plio-Pleistocene strata. Fault planes imaged
using ground-penetrating radar in the shallow subsurface
show a range in fault dips of 30 Á /608 (Amos et al. 2007;
McClymont et al. 2008; Wallace et al. 2010). This rage of
fault orientations agrees with geometric estimates made
from offsets of multiple terrace levels (508998, 1s; Davis
et al. 2005) and from the range in fault dips imaged using
seismic reflection and refraction data (Ghisetti et al. 2007;
Campbell et al. 2010).
No major earthquakes have occurred on the Ostler faultsince European settlement of the area around 1850. How-
ever, previous trenching studies and radiocarbon dating 18
km north of our site (Fig. 1) uncovered colluvial wedge
stratigraphy bracketing the timing of two surface-rupturing
earthquakes at 2850 Á /4410 cal a BP and 5740 Á /7780 cal a BP,
and a third event c. 10 ky ago (van Dissen et al. 1994). In a
second trench to the south, these authors also reported a
radiocarbon age of 439 Á /674 cal a BP for an unfaulted debris
flow overlying the fault immediately south of Lake Ruatani-
wha and the Ohau River (Fig. 1). We also noted the presence
of an approximately 1 m high scarp cutting the foot of
young hillslopes outside of transverse drainages along much
Figure 3 Three-dimensional perspective image of topographic profiles extracted from a TOPSAR 10 m digital elevation model along fault
strands (grey) and perpendicular to faults and fold axes (black) on deformed outwash surfaces. Profile locations and corresponding letters are
shown in Fig. 2.
370 CB Amos et al.

7/29/2019 Amos- Pleoseismic constraints on Holocene surface ruptures NZ
http://slidepdf.com/reader/full/amos-pleoseismic-constraints-on-holocene-surface-ruptures-nz 6/13
of the length of the Ostler fault zone (Amos et al. 2010) that
may represent a single-event scarp formed during the most
recent earthquake (MRE).
Several generations of Late Pleistocene glacial moraines,
outwash surfaces and fluvial terraces generated through
repeated glacial occupation of the neighbouring Ohau and
Pukaki valleys dominate the surficial geology of the
Mackenzie Basin (Read 1984). Four general age divisions
of fluvioglacial landforms and deposits correlate amongindividual drainages across the fault as originally recognised
by Gair (1967). From oldest to youngest, these geomorphic
features include the Wolds, Balmoral, Mount John and
Tekapo age associations (T1 Á /T4, Fig. 2). A nearly complete
sequence of these outwash, strath and cut terrace surfaces is
preserved near the trench site flanking the Ohau River and
Lake Ruataniwha (Fig. 2). Available cosmogenic radio-
nuclide and OSL dating constraints for these landforms
indicate stabilisation of the last glacial maximum (LGM)
Tekapo T4 and Mount John T3 terrace surfaces at 15.292.4
ka and 26.594.0 ka, respectively (Schaefer et al. 2001; Amos
et al. 2007, 2010). These studies also bracket the formation
of the Balmoral T2 and Wolds T1 terraces at approximately
72 Á /105 ka and 130 Á /191 ka respectively, based on OSL
dating and correlation with global climate records.
Palaeoseismic trenching
A 26 m long trench was excavated across a 4 m high scarp on
the Ruataniwha strand of the Ostler fault (Figs. 3 and 4),
located along Old Glen Lyon Rd c. 4 km west of Twizel.
This site was chosen based on the location of previous
ground-penetrating radar surveys investigating the shallow
subsurface structure of the Ostler fault (Nobes et al. 2005).
The trench was excavated to an average depth of 2 m into
Mount John outwash gravels and was benched at its lower
end to prevent wall collapse. The Ruataniwha strand is one
of approximately four scarps within a complex zone of
surface faulting (Fig. 4) disrupting the relatively broad
LGM outwash plain north of Lake Ruataniwha (Fig. 2).
Several minor scarps separate the Ruataniwha strand from
the subparallel ‘Y’ fault, which terminates at its northern
end into an east-side-up backthrust (Fig. 2). Scarp-perpen-
dicular topographic profiles (Fig. 3) indicate that thetrenched fault strand accommodates less than c. 50% of
the total displacement of the Mount John surface in this
location.
Detailed logging of the exposed stratigraphy was com-
pleted at a scale of 1??00.4 m or c. 1:16 after cleaning the
trench walls and stringing with a meter grid. A scaled
version of the logged southwestern wall, as well as a
composite photomosaic, provides the clearest image of the
deformed and faulted stratigraphy (Fig. 5). Collapse of the
northern trench wall during excavation immediately adja-
cent to the exposed fault plane prevented complete logging
of this exposure. Nonetheless, a scaled section of the north-eastern trench wall (Fig. 6) supplements the analysis of the
opposite wall.
The Ruataniwha fault appears within the southwestern
trench wall as a gently northwest-dipping discontinuity in
otherwise continuous sedimentary layers near the midpoint
of the topographic scarp (Fig. 5). This discontinuity defines
the main fault plane, which exhibits an average dip of
approximately 308 in the upper 2 m of stratigraphy. The
fault is not perfectly planar, however, and becomes roughly
subhorizontal toward the top of the trench where it nears the
ground surface. This transition to an approximately hor-
izontal fault orientation is also observed in the northeastern
trench wall (Fig. 6), although the fault plane there reveals a
Figure 4 Oblique aerial image of the trench location and other adjacent strands of the North Central and Haybarn fault sections.
Palaeoseismic constraints on Holocene surface ruptures 371

7/29/2019 Amos- Pleoseismic constraints on Holocene surface ruptures NZ
http://slidepdf.com/reader/full/amos-pleoseismic-constraints-on-holocene-surface-ruptures-nz 7/13
Figure 5 A, Photomosaic of the southwestern wall of the Ruataniwha trench exposure. B, Annotated trench interpretations overlain
log. The location of OSL samples and the corresponding sample names are shown by stars. The depositional units (1 Á /4) defined

7/29/2019 Amos- Pleoseismic constraints on Holocene surface ruptures NZ
http://slidepdf.com/reader/full/amos-pleoseismic-constraints-on-holocene-surface-ruptures-nz 8/13
steeper dip of roughly 608 in the lower 2 m. A second
subhorizontal strand of the Ruataniwha fault is inferred in
each trench wall (dashed red line, Figs. 5 and 6) based on the
stratigraphic relationships described below.
We identified eight depositional units (Fig. 5) that enable
us to reconstruct the deformational record. In each trench
wall (Figs. 5 and 6), we encountered relatively loose and
sandy gravels beneath the overlying soil as well as several
packages of mixed silt and gravel immediately underlying
the topographic scarp. The lowest stratigraphic units
exposed in each trench comprise intact open-framework
alluvial gravels with interspersed boulders and sand lenses
towards the top of the deposit (Units 1A-C, Figs. 5 and 6).
We interpret these units as the original Mount John outwash
gravels deposited during formation of the T3’ braid plain
(Fig. 2). The lowest member of Unit 1 is only exposed on the
upthrown western side of the fault plane. Directly overlying
Unit 1 is a package of soil and colluvium, derived from and
developed directly on the lower alluvial gravels (Unit 2,
Figs 5 and 6). The matrix-supported nature of this deposit
and its pale yellow-to-brown colour serve to distinguish Unit
2 from the grey imbricated gravels of the underlying
outwash (Fig. 5). In both trench walls, Unit 2 is observed
in conformable contact above Unit 1 on the downthrown
southeastern side of the main fault plane (Figs. 5 and 6).
A succession of yellowish-brown massive silt with
interspersed cobbles and gravel (Units 3A and B) uncon-
formably overlies Unit 2 and rests in fault contact with
intact outwash gravels on the upthrown northwestern side of
the fault (Fig. 5). The rubbly nature of this matrix-supported
deposit suggests its origin as colluvium derived from the
Ruataniwha scarp. Unit 3 is divided into two sub-units (3A
and 3B) based on the relative abundance of coarser material.
In addition to silt, the lower Unit 3A contains abundant
Table 1 Luminescence dating results: water and radionuclide contents.
Sample
number Depth (m)
Water
content d1U (mg/g) from
234Th
U (mg/g)2 from226Ra, 214Pb, 214Bi
U (mg/g) from210Pb
Th (mg/g)2 from208Tl, 212Pb, 228Ac K (%) Field Code
WLL570 1.39 1.264 3.2890.31 3.1390.21 2.5190.27 10.9190.15 1.5490.04 GLT06-01
WLL571 1.15 1.218 3.3790.32 3.2290.21 2.9490.28 10.5390.15 1.5790.04 GLT06-02
WLL572 0.60 1.211 3.5890.24 3.2490.16 3.2690.21 11.0690.13 1.5390.03 GLT06-03
WLL573 0.60 1.279 3.4290.35 3.1690.23 2.8090.30 11.3390.17 1.5090.04 GLT06-04
WLL574 1.28 1.241 3.3190.32 2.6890.20 2.6490.26 10.4490.15 1.5590.04 GLT06-05
WLL575 0.73 1.229 3.5090.31 2.9690.20 3.0790.27 11.2990.15 1.5990.04 GLT06-06
WLL576 0.61 1.236 3.1790.33 3.1290.22 2.8790.29 11.0890.16 1.5590.04 GLT06-07
1Ratio wet sample to dry sample weight. Errors assumed 50% (d-1)2
U and Th-content is calculated from the error-weighted mean of the isotope equivalent contents. Italics indicate a radioactive disequilibrium on a 2s level.
Figure 6 Annotated trench interpretations of the northeastern trench wall are overlain onto a scaled version of the original trench log. The
location of OSL samples and the corresponding sample names are shown by stars.
Palaeoseismic constraints on Holocene surface ruptures 373
7/29/2019 Amos- Pleoseismic constraints on Holocene surface ruptures NZ
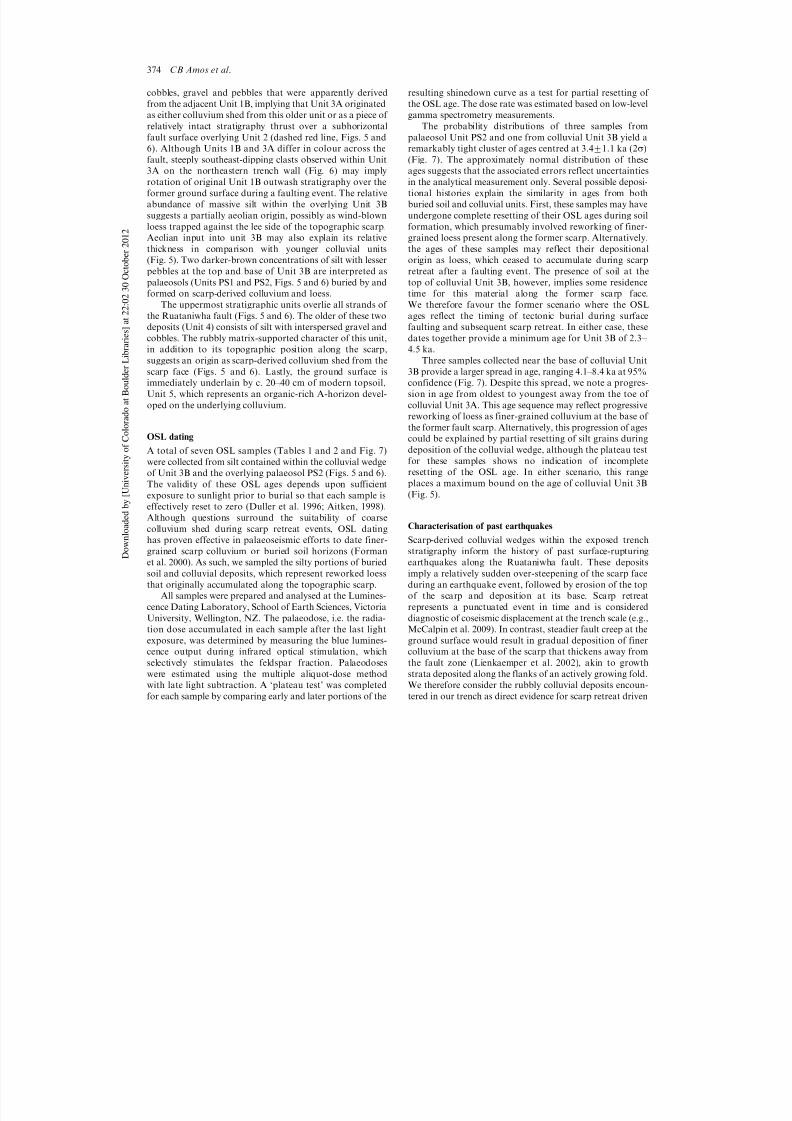
http://slidepdf.com/reader/full/amos-pleoseismic-constraints-on-holocene-surface-ruptures-nz 9/13
cobbles, gravel and pebbles that were apparently derived
from the adjacent Unit 1B, implying that Unit 3A originated
as either colluvium shed from this older unit or as a piece of
relatively intact stratigraphy thrust over a subhorizontal
fault surface overlying Unit 2 (dashed red line, Figs. 5 and6). Although Units 1B and 3A differ in colour across the
fault, steeply southeast-dipping clasts observed within Unit
3A on the northeastern trench wall (Fig. 6) may imply
rotation of original Unit 1B outwash stratigraphy over the
former ground surface during a faulting event. The relative
abundance of massive silt within the overlying Unit 3B
suggests a partially aeolian origin, possibly as wind-blown
loess trapped against the lee side of the topographic scarp.
Aeolian input into unit 3B may also explain its relative
thickness in comparison with younger colluvial units
(Fig. 5). Two darker-brown concentrations of silt with lesser
pebbles at the top and base of Unit 3B are interpreted as
palaeosols (Units PS1 and PS2, Figs. 5 and 6) buried by and
formed on scarp-derived colluvium and loess.
The uppermost stratigraphic units overlie all strands of
the Ruataniwha fault (Figs. 5 and 6). The older of these two
deposits (Unit 4) consists of silt with interspersed gravel and
cobbles. The rubbly matrix-supported character of this unit,
in addition to its topographic position along the scarp,
suggests an origin as scarp-derived colluvium shed from the
scarp face (Figs. 5 and 6). Lastly, the ground surface is
immediately underlain by c. 20 Á /40 cm of modern topsoil,
Unit 5, which represents an organic-rich A-horizon devel-
oped on the underlying colluvium.
OSL dating
A total of seven OSL samples (Tables 1 and 2 and Fig. 7)
were collected from silt contained within the colluvial wedge
of Unit 3B and the overlying palaeosol PS2 (Figs. 5 and 6).
The validity of these OSL ages depends upon sufficient
exposure to sunlight prior to burial so that each sample is
effectively reset to zero (Duller et al. 1996; Aitken, 1998).
Although questions surround the suitability of coarse
colluvium shed during scarp retreat events, OSL dating
has proven effective in palaeoseismic efforts to date finer-
grained scarp colluvium or buried soil horizons (Formanet al. 2000). As such, we sampled the silty portions of buried
soil and colluvial deposits, which represent reworked loess
that originally accumulated along the topographic scarp.
All samples were prepared and analysed at the Lumines-
cence Dating Laboratory, School of Earth Sciences, Victoria
University, Wellington, NZ. The palaeodose, i.e. the radia-
tion dose accumulated in each sample after the last light
exposure, was determined by measuring the blue lumines-
cence output during infrared optical stimulation, which
selectively stimulates the feldspar fraction. Palaeodoses
were estimated using the multiple aliquot-dose method
with late light subtraction. A ‘plateau test’ was completed
for each sample by comparing early and later portions of the
resulting shinedown curve as a test for partial resetting of
the OSL age. The dose rate was estimated based on low-level
gamma spectrometry measurements.
The probability distributions of three samples from
palaeosol Unit PS2 and one from colluvial Unit 3B yield aremarkably tight cluster of ages centred at 3.491.1 ka (2s)
(Fig. 7). The approximately normal distribution of these
ages suggests that the associated errors reflect uncertainties
in the analytical measurement only. Several possible deposi-
tional histories explain the similarity in ages from both
buried soil and colluvial units. First, these samples may have
undergone complete resetting of their OSL ages during soil
formation, which presumably involved reworking of finer-
grained loess present along the former scarp. Alternatively,
the ages of these samples may reflect their depositional
origin as loess, which ceased to accumulate during scarp
retreat after a faulting event. The presence of soil at the
top of colluvial Unit 3B, however, implies some residence
time for this material along the former scarp face.
We therefore favour the former scenario where the OSL
ages reflect the timing of tectonic burial during surface
faulting and subsequent scarp retreat. In either case, these
dates together provide a minimum age for Unit 3B of 2.3 Á /
4.5 ka.
Three samples collected near the base of colluvial Unit
3B provide a larger spread in age, ranging 4.1 Á /8.4 ka at 95%
confidence (Fig. 7). Despite this spread, we note a progres-
sion in age from oldest to youngest away from the toe of
colluvial Unit 3A. This age sequence may reflect progressive
reworking of loess as finer-grained colluvium at the base of the former fault scarp. Alternatively, this progression of ages
could be explained by partial resetting of silt grains during
deposition of the colluvial wedge, although the plateau test
for these samples shows no indication of incomplete
resetting of the OSL age. In either scenario, this range
places a maximum bound on the age of colluvial Unit 3B
(Fig. 5).
Characterisation of past earthquakes
Scarp-derived colluvial wedges within the exposed trench
stratigraphy inform the history of past surface-rupturingearthquakes along the Ruataniwha fault. These deposits
imply a relatively sudden over-steepening of the scarp face
during an earthquake event, followed by erosion of the top
of the scarp and deposition at its base. Scarp retreat
represents a punctuated event in time and is considered
diagnostic of coseismic displacement at the trench scale (e.g.,
McCalpin et al. 2009). In contrast, steadier fault creep at the
ground surface would result in gradual deposition of finer
colluvium at the base of the scarp that thickens away from
the fault zone (Lienkaemper et al. 2002), akin to growth
strata deposited along the flanks of an actively growing fold.
We therefore consider the rubbly colluvial deposits encoun-
tered in our trench as direct evidence for scarp retreat driven
374 CB Amos et al.

7/29/2019 Amos- Pleoseismic constraints on Holocene surface ruptures NZ
http://slidepdf.com/reader/full/amos-pleoseismic-constraints-on-holocene-surface-ruptures-nz 10/13
by past surface-rupturing earthquakes. In this interpreta-
tion, the base of each colluvial deposit represents an event
horizon bracketing the timing of earthquake displacement.
Within the Ruataniwha trench, colluvial debris truncates
the exposed fault plane as well as older, underlying colluvialunits, implying deposition of Unit 4 during erosional
stripping of the scarp face after the most recent earthquake
(Figs. 5 and 6). Accordingly, topsoil developed on this unit
thickens at the foot of the scarp and thins towards the top
(Fig. 5). Although a paucity of readily datable material
prevents a precise age estimate of Unit 4, OSL ages on the
underlying colluvial wedge (Units 3A and B) provide a
maximum bound on the MRE. A composite age from four
OSL samples within these units brackets the timing of the
MRE to some time after 2.3 Á /4.5 ka (95% confidence)
(Fig. 7). Slip during this event along the main fault plane
resulted in offset of the contact between Units 3A and B,
totalling at least 1.8 m (Fig. 5). This measurement representsa minimum estimate on the total displacement during the
MRE given that the Unit 3A/3B contact was eroded on the
upthrown northwestern side of the fault.
Faulted colluvial deposits of Units 3A and B also imply
the presence of an earlier earthquake. OSL dates from silt
collected at the base of Unit 3B provide a minimum age of
4.1 Á /8.4 ka (95% confidence) on the timing of the penulti-
mate event (Fig. 7). Constraints on the total displacement
during this event are less well bracketed than for the MRE.
If Unit 3A represents a relatively intact section of Unit 1B
outwash gravels overthrust subhorizontally onto Unit 2,then the total offset during this event exceeded 2.5 m
(Fig. 6) and may have been as large as 4 m (Fig. 5). Given
that no equivalent unit exists on the upthrown side of the
fault, an alternative interpretation of Unit 3A as a
colluvium derived from Units 1 and 2 would indicate a
comparable or larger surface displacement. However, the
presence of apparently rotated imbricate clasts in the
northeastern trench wall (Fig. 6) favours the former
scenario and implies that these gravels were essentially
‘bulldozed’ onto the old ground surface during the penulti-
mate earthquake. This contact now defines an approxi-
mately flat or undulatory fault surface in the exposed trench
stratigraphy. The subhorizontal nature of this structurereflects the former ground surface rather than the fault
plane orientation in the deeper subsurface.
Continuity in the outwash stratigraphy on either side of
the southwestern trench wall provides constraints on the
total offset of the Mount John outwash. Offset of sand
lenses at the top of Unit 1 (Unit 1C, Fig. 5) imply c. 2.9 m of
throw across the fault, corresponding to a dip slip of c. 6.0 m
over a 308 fault plane. Given our constraints on the
coseismic slip during the MRE and penultimate events,
this magnitude of displacement implies a maximum of only
2 Á /3 events on the trenched fault strand since deposition of
the LGM outwash surface.
Discussion
Coarse colluvial wedge deposits abutting and overlying the
Ruataniwha fault strand provide stratigraphic evidence of
past, coseismic surface ruptures along the central Ostler fault
zone (Figs. 5 and 6). Again, these deposits originate from
oversteepening of the scarp face during earthquake events
and are considered unique to coseismic deformation as
opposed to ongoing fault creep. Our results corroborate
previous trenching studies on the Northern Ostler fault (van
Dissen et al. 1994) that demonstrate similar palaeoseismic
evidence for ancient coseismic displacements, despite on-
Table 2 Luminescence dating results: measured a-value and equivalent dose, cosmic doserate, total doserate and OSL age.
Sample number a-value De (Gy) dDc/dt (Gy/ka)1 dD/dt (Gy/ka) OSL-age (ka) Field code
WLL570 0.08690.013 26.191.9 0.183490.0092 3.5990.29 7.2890.79 GLT06-01
WLL571 0.07390.015 17.190.6 0.189690.0095 3.6390.28 4.7190.40 GLT06-02WLL572 0.07290.019 12.692.3 0.204690.0102 3.6890.30 3.4290.69 GLT06-03
WLL573 0.06690.013 11.591.7 0.204690.0102 3.3890.29 3.4090.58 GLT06-04
WLL574 0.07290.013 19.391.3 0.186290.0093 3.3490.26 5.7890.59 GLT06-05
WLL575 0.08290.019 12.591.6 0.200990.0100 3.7090.31 3.3890.52 GLT06-06
WLL576 0.08290.013 12.491.6 0.204390.0102 3.6890.28 3.3790.50 GLT06-07
1Contribution of cosmic radiation to the total doserate, calculated as proposed by Prescott & Hutton (1995).
0 2 4 6 8 10 12
R e l a t i v e p r
o b a b i l i t y
OSL age (ka)
MRE
PE (95% CI)
Figure 7 Probability density functions for all reported OSL ages
and the associated standard errors. Composite probability func-
tions for the most recent earthquake (MRE) and the penultimate
event (PE) are shown in black. The vertical dashed line indicates a
composite age peak of 3.491.1 ka for the MRE. 95% confidence
intervals (CI) bracket the timing of the PE to before 4.1 Á /8.4 ka.
Palaeoseismic constraints on Holocene surface ruptures 375

7/29/2019 Amos- Pleoseismic constraints on Holocene surface ruptures NZ
http://slidepdf.com/reader/full/amos-pleoseismic-constraints-on-holocene-surface-ruptures-nz 11/13
going aseismic deformation localised near our trench site.
Geodetic monitoring of a levelling route passing within
metres of our trench along Glen Lyon Road indicated
relatively continuous growth of a hanging wall anticline
with a maximum uplift rate of c. 1 mm a(1 over the period
1966 Á /1989 (Blick et al. 1989). Folding over this time intervalmimics the overall shape and wavelength of the warped LGM
outwash surface, but occurred without a net vertical dis-
placement over the fault zone. As such, Blick et al. (1989)
attributed the permanent vertical component of the total
deformation observed in 104 Á /105 year old geomorphic offsets
to coseismic slip. Our results confirm that a significant
component of the total vertical offset of outwash stratigraphy
occurs during past surface-rupturing earthquakes.
Folding at the trench scale also accommodates some
component of the total deformation across the Ruataniwha
fault. Comparison of fault offset observed in the trench
exposures with that implied by the height of the topographicscarp constrains the relative contribution of surface folding
to the total deformation. Survey profiling at the trench site
using a differential GPS indicates a throw of 3.890.2 m,
corresponding to an offset of 7.8 '4.5/ Á /1.7 m at 95%
confidence (Fig. 8). Assuming purely dip slip, this calcula-
tion utilises a fault dip of 3089108 (2s) and standard errors
on linear survey regressions, following the Monte Carlo
approach developed by Thompson et al. (2002). Using age
estimates bracketing the timing of LGM outwash deposi-
tion, this offset corresponds to a range in dip-slip rates
between 0.3 and 0.5 mm a(1 (Fig. 8). The throw of Unit 1C
measured from the southwestern trench exposure (Fig. 5)
totals 2.9 m and indicates total offset of the Mount John
outwash of the order c. 6 m. This measurement fails to
capture the total deformation of this deposit, however, by
neglecting additional folding of the hanging-wall surface
immediately adjacent to the Ruataniwha fault (Fig. 8).
Results from our surveyed profiles indicate that surface
folding accounts for roughly 25% of the total 7.8 m dip-slipaccommodated across the scarp.
It remains unknown whether folding at the trench scale
reflects permanent deformation related to aseismic fault slip.
Alternatively, localised folding adjacent to the Ruataniwha
fault may be driven by relatively shallow gradients in fault
slip during earthquake surface ruptures. Given that approxi-
mately 75% of the total offset across the Ruataniwha scarp
is linked to coseismic fault slip, the majority of strain on this
fault strand appears to be released during seismic events.
Despite folding observed from levelling measurements over
the past several decades (Blick et al. 1989), our trenching
results suggest that aseismic deformation, if retained aspermanent deformation, is outpaced by coseismic slip
integrated over longer time intervals.
Coseismic slip during the MRE resulted in at least 1.8 m
of offset of the Unit 3A/1B contact (Fig. 5). Treating this
value as a minimum constraint on the total coseismic slip
suggests a possible range of earthquake magnitudes up to M
6.9 Á /7.1 using the empirical relationships of Wells & Copper-
smith (1994). Similarly, these relationships indicate possible
earthquake magnitudes up to M 7.1 if the entire c. 60 km
surface trace of the Ostler fault zone (Fig. 1) were to rupture
in a single event.
Similarity in the timing of both the MRE and penultimate
earthquake on the North Central Ostler fault (B 3.491.1 ka
Figure 8 A, Scarp-perpendicular profile points across the Ruataniwha fault from differential GPS surveying are overlain on an outline of the
southwestern trench wall. Linear regressions through intact portions of the footwall, hanging wall and scarp face are used to calculate
histograms of throw, fault slip and dip-slip rate shown in B, Reported values for each parameter reflect the histogram mode and the
associated 95% confidence intervals.
376 CB Amos et al.

7/29/2019 Amos- Pleoseismic constraints on Holocene surface ruptures NZ
http://slidepdf.com/reader/full/amos-pleoseismic-constraints-on-holocene-surface-ruptures-nz 12/13
and!4.1 Á /8.4 ka, respectively) with reported radiocarbon
age estimates of these events 18 km to the north (2850 Á /4410
cal a BP and 5740 Á /7780 cal a BP; van Dissen et al. 1994)
suggests the possibility of synchronous fault rupture between
these fault sections. Together with the radiocarbon age on anunfaulted debris flow south of Lake Ruataniwha, our study
indicate that the MRE on the North Central Ostler fault
occurred between 439 Á /674 cal a BP (van Dissen et al. 1994)
and 2.3 Á /4.5 ka. These ages indicate that the MRE observed in
our trench may have been part of a larger fault rupture
affecting northern sections of the fault. If indeed true,
stepovers between these fault sections up to 2.5 km wide
(Figs. 1 and 2) did not serve as barriers to rupture propaga-
tion. Available compilations for strike-slip faults suggest that
this value lies below the limiting dimension of fault stepovers
as endpoints to earthquake ruptures (Wesnousky 2006). This
result carries implications for seismic hazard assessments inthe area, which must therefore include the possibility of total
fault rupture of the entire c. 60 km long Ostler fault zone.
Despite the possibility of total fault rupture during large
earthquakes, the presence of only 2 Á /3 surface ruptures on the
Ruataniwha fault in the last 26.5 ka raises the possibility that
nearby strands (Fig. 2) may accommodate other events not
recorded along this scarp. The timing of Holocene events on
the trenched Ruataniwha fault and those uncovered in
previous trench investigations (van Dissen et al. 1994)
suggests an average earthquake recurrence interval of roughly
2 Á /5 ka, albeit spanning only 2 Á /3 events. Given the age of the
Mount John surface, a constant recurrence interval wouldsuggest an additional 2 Á /10 fault ruptures since deposition on
this surface ceased. These earthquakes need not recur at a
constant interval, however, as evidenced by similar total
deformation of the Mount John and Tekapo outwash
surfaces near Lake Ruataniwha (compare profiles I and K
on Fig. 3) despite a c. 10 ka difference in age. Comparable
offsets of each of these two surfaces may also reflect along-
strike changes in both the shape and amplitude of the scarp or
the hanging-wall anticline (Fig. 3) as slip is transferred among
individual fault strands (Davis et al. 2005).
Clearly, the Ruataniwha fault represents only one of
several additional strands within this part of the NorthCentral Ostler fault that accommodate additional slip and/
or drive folding of the ground surface (Figs. 2 and 3). Total
offset across both the Ruataniwha and Y fault strands of
North Central fault section, calculated from topographic
profiles on the Mount John surface, totals approximately 29
m (Amos et al. 2010). Of the c. 20 m of dip slip on the
Ruataniwha fault, only c. 8 m of total offset occurs along the
trenched strand. As such, an additional c. 12 m of slip must
occur on other adjacent fault segments or be accommodated
by hanging-wall folding (Fig. 3). This result emphasises the
importance of tradeoffs in displacement among overlapping
fault strands within a kinematically linked fault array.
Summary
The results of trench analysis and OSL dating along the
Ruataniwha strand of the Ostler fault zone allow us to make
the following conclusions.
1. Palaeoseismic trenching reveals evidence for at least two
metre-scale coseismic surface displacements along the
North Central Ostler fault zone. Despite geodetically
observed aseismic deformation in this location that
approaches the total vertical slip rate on the fault, most
strain on the Ostler fault zone is released during large
surface-rupturing earthquakes.
2. Interpretation of colluvial wedge stratigraphy and
optically stimulated luminescence dating in trench
exposures defines the most recent surface rupture on
the Ostler fault as younger than 2.3 Á /4.5 ka, whereas the
penultimate event pre-dates 4.1 Á /8.4 ka.3. Surface offset during the most recent earthquake
exceeded 1.8 m. Using the c. 60 km total length of the
Ostler fault zone, this value of coseismic slip is
consistent with earthquake magnitudes ranging up to
M 6.9 Á /7.1. Surface displacement during the penultimate
event is not as well constrained, but likely exceeded the
total slip during the most recent earthquake.
4. Folding at the trench scale accounts for roughly 25% of
the total offset measured from topographic profiling of
the deformed ground surface (7.8 m) when compared
with offset of Mount John outwash gravels (6.0 m)
observed in trench exposures. This folding may reflect
either retention of aseismic slip, i.e. fault creep, as acomponent of the permanent deformation or shallow
subsurface gradients in fault slip during coseismic
displacement.
5. Similarity between the timing of past earthquakes on the
central and northern Ostler fault zone suggests that
surface ruptures may persist across major fault-section
boundaries delineated by kilometre-scale stepovers and
changes in strike of the active surface trace.
6. If large surface ruptures on the Ostler fault recur every c.
2 Á 5 ka, evidence for only 2 Á 3 palaeoearthquakes
affecting the 26.5 ka Mount John outwash surface
trenched in this study indicates that additional eventslikely occurred on adjacent scarps within an overall
complex zone of surface faulting.
Acknowledgements
We thank the Hocken family for permission to access and excavate
a fault trench on their land. Jocelyn Campbell, Art Bettis and
Haikai Tane graciously provided trench review. We also thank Mrs
Ningsheng Wang at the Luminescence Dating Facility, Victoria
University of Wellington, for preparing the OSL samples. Helpful
reviews by Tim Little and Francesca Ghisetti improved the quality
and clarity of the manuscript. This research was supported by
National Science Foundation grant EAR-0117242 and ACS
Palaeoseismic constraints on Holocene surface ruptures 377

7/29/2019 Amos- Pleoseismic constraints on Holocene surface ruptures NZ
http://slidepdf.com/reader/full/amos-pleoseismic-constraints-on-holocene-surface-ruptures-nz 13/13
Petroleum Research Fund grant 41960-AC8. Support for J. Lap-
wood came from the Mason Trust at the University of Canterbury.
We also thank NASA for providing the TOPSAR digital elevation
model of the study area.
References
Aitken MJ 1998. An introduction to optical dating; the dating of Quaternary sediments by the use of photon-stimulated lumi-nescence, Oxford University Press, Oxford, United Kingdom(GBR). 267 p.
Amos CB, Burbank DW, Nobes DC, Read SAL 2007. Geo-morphic constraints on listric thrust faulting: Implications foractive deformation in the Mackenzie Basin, South Island, NewZealand. Journal of Geophysical Research-Solid Earth 112:B03S11, doi:10.1029/2006JB004291.
Amos CB, Burbank DW, Read SAL 2010. Along-strike growth of the Ostler fault, New Zealand: Consequences for drainagedeflection above active thrusts. Tectonics 29(4): TC4021,
10.1029/2009TC002613.Blick GH, Read SAL, Hall PT 1989. Deformation monitoring of
the Ostler fault zone, South Island, New Zealand. Tectono-physics 167: 329 Á 339, doi:10.1016/0040-1951(89)90083-8.
Campbell FM, Ghisetti F, Kaiser AE, Green AG, Horstmeyer H,Gorman AR 2010. Structure and evolution of the seismicallyactive Ostler Fault Zone (New Zealand) based on interpreta-tions of multiple high resolution seismic reflection profiles.Tectonophysics 495(3 Á 4): 195 Á 212.
Davis K, Burbank DW, Fisher D, Wallace S, Nobes D 2005.Thrust-fault growth and segment linkage in the active Ostlerfault zone, New Zealand. Journal of Structural Geology 27(8):1528 Á 1546, doi:10.1016/j.jsg.2005.04.011.
DeMets C, Gordon RG, Argus DF, Stein S 1994. Effect of recentrevisions to the geomagnetic reversal time-scale on estimates
of current plate motions. Geophysical Research Letters21(20): 2191 Á 2194, doi:10.1029/1999GL900405.
Duller GAT 1996. Recent developments in luminescence dating of Quaternary sediments. Progress in Physical Geography 20(2):127 Á 145.
Forman SL, Pierson J, Letter K 2000. Luminescence Geochronol-ogy. In: Sowers JM, Noller JS, Lettis WR ed. QuaternaryGeochronology: Methods and Applications, American Geo-physical Union Reference Shelf 4: 157 Á 176.
Gair HS 1967. Sheet 20-Mt. Cook. Geological Map of NewZealand [Geological Map of New Zealand]. Wellington, NZ,Department of Scientific and Industial Research.
Ghisetti FC, Gorman AR, Sibson RH 2007. Surface breakthroughof a basement fault by repeated seismic slip episodes: TheOstler Fault, South Island, New Zealand. Tectonics 26:
TC6004, doi:10.1029/2007TC002146.Lienkaemper JJ, Dawson TE, Personius SF, Seitz GG, Reidy LM,
Schwartz DP 2002. A record of large earthquakes on thesouthern Hayward fault for the past 500 years. Bulletin of theSeismological Society of America 92(7): 2637 Á 2658.
McCalpin JP, Rockwell TK, Weldon Ii RJ 2009. Chapter 6Paleoseismology of Strike-Slip Tectonic Environments. In:James PM ed. Paleoseismology, International GeophysicsSeries Vol. 95, Academic Press. Pp. 421 Á 496.
McClymont AF, Green AG, Villamor P, Horstmeyer H, Grass C,Nobes DC 2008. Characterization of the shallow structures of active fault zones using 3-D ground-penetrating radar data.Journal of Geophysical Research-Solid Earth 113(B10).
Nobes D, Burbank D, Amos C, Davis K 2005. 3D Imaging of thefore- and backthrusts of the Glen Lyon segment of the OstlerFault. In: Pettinga JR, Wandres AM ed. 50th AnnualConference. Pp. 61.
Norris RJ, Cooper AF 2001. Late Quaternary slip rates and slip
partitioning on the Alpine Fault, New Zealand. Journal of Structural Geology 23(2 Á 3): 507 Á 520, doi:10.1016/S0191-8141(00)00122-X.
Pearson CF, Beavan J, Darby DJ, Blick GH, Walcott RI 1995.Strain Distribution across the Australian Pacific Plate Bound-ary in the Central South-Island, New-Zealand, from 1992 Gpsand Earlier Terrestrial Observations. Journal of GeophysicalResearch-Solid Earth 100(B11): 22071 Á 22081, doi:10.1029/95JB02279.
Prescott JR, Hutton JT 1995. Environmental Dose-Rates andRadioactive Disequilibrium from Some Australian Lumines-cence Dating Sites. Quaternary Science Reviews 14(4):439 Á 448.
Read SAL 1984. The Ostler Fault Zone. In: Wood PR ed.Guidebook to the South Island Scientific Excursions Interna-
tional Symposium on Recent Crustal Movements of thePacific Region. Wellington, NZ, The Royal Society of NewZealand. Pp. 121 Á 134.
Read SAL, Blick GH 1991. Late Quaternary deformation andgeodetic monitoring in the area of ‘‘the knot’’ on the Ostlerfault zone, South Island, New Zealand. New Zealand Geolo-gical Survey Record 43: 85 Á 91.
Schaefer JM, Ninnemann U, Denton GH, Schluechter C, Ivy-OchsS, Wieler R, Kubik PW, Anderson BG, Schlosser P 2001.Structure of the Last Glacial Maximum in New Zealand -Terrestrial and Marine Evidence from Southern mid-latitudes.American Geophysical Union fall meeting 82(47): Fall Meet.Suppl., Abstract PP42B-0499.
Templeton AS, Craw D, Koons PO, Chamberlain CP 1999. Near-
surface expression of a young mesothermal gold mineralizingsystem, Sealy range, Southern Alps, New Zealand. Miner-alium Deposita 34(2): 163 Á 172.
Thompson SC, Weldon RJ, Rubin CM, Abdrakhmatov K, MolnarP, Berger GW 2002. Late Quaternary slip rates across thecentral Tien Shan, Kyrgyzstan, Central Asia. Journal of Geophysical Research, B, Solid Earth and Planets 107 (B9),2203, doi:10.1029/2001JB000596.
Upton P, Koons PO, Craw D, Henderson CM, Enlow R 2009.Along-strike differences in the Southern Alps of New Zealand:Consequences of inherited variation in rheology. Tectonics 28:Tc2007, 10.1029/2008TC002353.
van Dissen RJ, Hull AG, Read SAL 1994. Timing of some largeHolocene earthquakes on the Ostler Fault, New Zealand.Proceedings of the CRCM 1993: 381 Á 386.
Wallace SC, Nobes DC, Davis KJ, Burbank DW, White A 2010.Three-dimensional GPR imaging of the Benmore anticline andstep-over of the Ostler Fault, South Island, New Zealand.Geophysical Journal International 180(2): 465 Á 474.
Ward CM, Sporli KB 1979. Exceptionally large steeply plungingfolds in the Torlesse Terrace, New Zealand. Journal of Geology 87: 187 Á 193.
Wells DL, Coppersmith KJ 1994. New empirical relationshipsamong magnitude, rupture length, rupture width, rupturearea, and surface displacement. Bulletin of the SeismologicalSociety of America 84: 974 Á 1002.
Wesnousky SG 2006. Predicting the endpoints of earthquakeruptures. Nature 444(7117): 358 Á 360.
378 CB Amos et al.