Embed Size (px)
Citation preview

Marijuana Use Among California
Secondary Students, 2017/19:
Volume 1: Trends and Patterns of Marijuana Use
Gregory Austin, Thomas Hanson, Gary Zhang, and Cindy Zheng
Marijuana Use Among California Secondary Students, Volume 1 2017/19
This report was prepared by WestEd—a research, development, and service agency—under contract from the California Department of Health Care Services (DHCS), with support from the California Department of Education (CDE), School Health Office.
To download: https://calschls.org/docs/Marijuana_Use_Vol_1
For contract information, contact: Allen Scott California Department of Health Care Services Youth Services Section, Community Services Division [email protected]
For information on the California Healthy Kids Survey (CHKS), visit the survey website—calschls.org—or contact: Hilva Chan, Consultant California Department of Education School Health and Safety Office [email protected]
For more information about the 2017/19 Biennial State CHKS, or to request access to the database, contact: Thomas Hanson, Project Director WestEd [email protected]
The opinions, findings, and conclusions in this publication are those of the authors and not necessarily of the state agencies.
Recommended citation:
Austin, G., Hanson, T., Zhang, G., & Zheng, C. (2021). Marijuana Use Among California Secondary Students, 2017/19. Volume 1: Trends and Patterns of Marijuana Use. WestEd.
Marijuana Use Among California Secondary Students, Volume 1 2017/19
CONTENTS List of Exhibits ............................................................................................................................... i
List of Tables ................................................................................................................................. ii
The Survey ......................................................................................................................................1
Use Prevalence and Level ..............................................................................................................2
Lifetime and Current Use Prevalence ........................................................................................ 3
Heavy Involvement .................................................................................................................... 4
Demographic Differences in Current Use .................................................................................. 5
Cessation Efforts ........................................................................................................................ 6
Methods of Consumption ..............................................................................................................6
Use Attitudes and Perceptions ......................................................................................................8
Perceived Harm .......................................................................................................................... 8
Disapproval of Use ..................................................................................................................... 9
Availability....................................................................................................................................12
Ease of Obtaining ..................................................................................................................... 12
Sources of Marijuana................................................................................................................ 13
Discussion......................................................................................................................................14
Assessing Trends ...................................................................................................................... 14
The Spread of Alternative Modes of Administration ............................................................... 16
The role of Legalization of Adult Recreational Use ................................................................ 17
Conclusion ....................................................................................................................................19
Appendix A: Tables of Results....................................................................................................21
Appendix B: Inventory of Marijuana-Specific Items ...............................................................42
References .....................................................................................................................................49
Marijuana Use Among California Secondary Students, Volume 1 2017/19
i
List of Exhibits EXHIBIT 1. Marijuana Use (30-day) by Survey Year ................................................................... 3
EXHIBIT 2. Marijuana Use (Lifetime) by Survey Year ................................................................ 4
EXHIBIT 3. Marijuana Use (30-day) by Race/Ethnicity and Grade, 2017/19 ............................... 5
EXHIBIT 4. Marijuana Use (Lifetime) by Mode of Consumption and Grade, 2017/19 ................ 6
EXHIBIT 5. Vaping/E-Cigarette (Lifetime) by Product Consumed and Grade, 2017/19.............. 7
EXHIBIT 6. Perceived Harm of Occasional Marijuana Use by Survey Year ................................ 9
EXHIBIT 7. Strong Personal Disapproval of Experimental Marijuana Use by Survey Year ...... 11
EXHIBIT 8. Ease of Obtaining Marijuana (“Very easy”), 2017/19 ............................................. 12
EXHIBIT 9. Sources for Obtaining Marijuana, 2017/19 .............................................................. 13
Marijuana Use Among California Secondary Students, Volume 1 2017/19
ii
List of Tables 1. Survey Samples ........................................................................................................................21
Table 1.1 Student Sample Characteristics ............................................................................. 21
Table 1.2 Student Sample for AOD Module ......................................................................... 21
2. Summary of Key Indicators ....................................................................................................22
Table 2.1 Key Marijuana Indicators, by Grade and Year...................................................... 22
3. Use Prevalence, Frequency, and Patterns..............................................................................23
Table 3.1 Frequency of Lifetime Marijuana, Alcohol, and Cigarette Use, by Grade/Year .. 23
Table 3.2 Age of Onset—Marijuana, Alcohol and Tobacco, by Grade and Year ............... 24
Table 3.2 Age of Onset—Marijuana, Alcohol and Tobacco, by Grade/Year - Continued ... 25
Table 3.3 Lifetime Marijuana Consumption by Mode of Administration, by Grade/Year ... 26
Table 3.4 Summary of Current ATOD Use, Past 30 Days, by Grade and Year ................... 27
Table 3.5 Frequency of Current Marijuana and Alcohol Use, by Grade and Year ............... 28
Table 3.6 Current Marijuana Use, Past 30 Days, by Race/Ethnicity, by Grade and Year .... 29
Table 3.7 Current Marijuana Use, Past 30 Days, by Gender, Grade, and Year .................... 29
Table 3.8 Current AOD Use on School Property, Past 30 Days, by Grade and Year ........... 30
Table 3.9 Usual Consumption Level of Marijuana or other Drugs, by Grade and Year ....... 31
Table 3.10 Cessation Attempts, by Grade and Year ............................................................... 32
4. Attitudes: Perceived Harm and Disapproval ........................................................................33
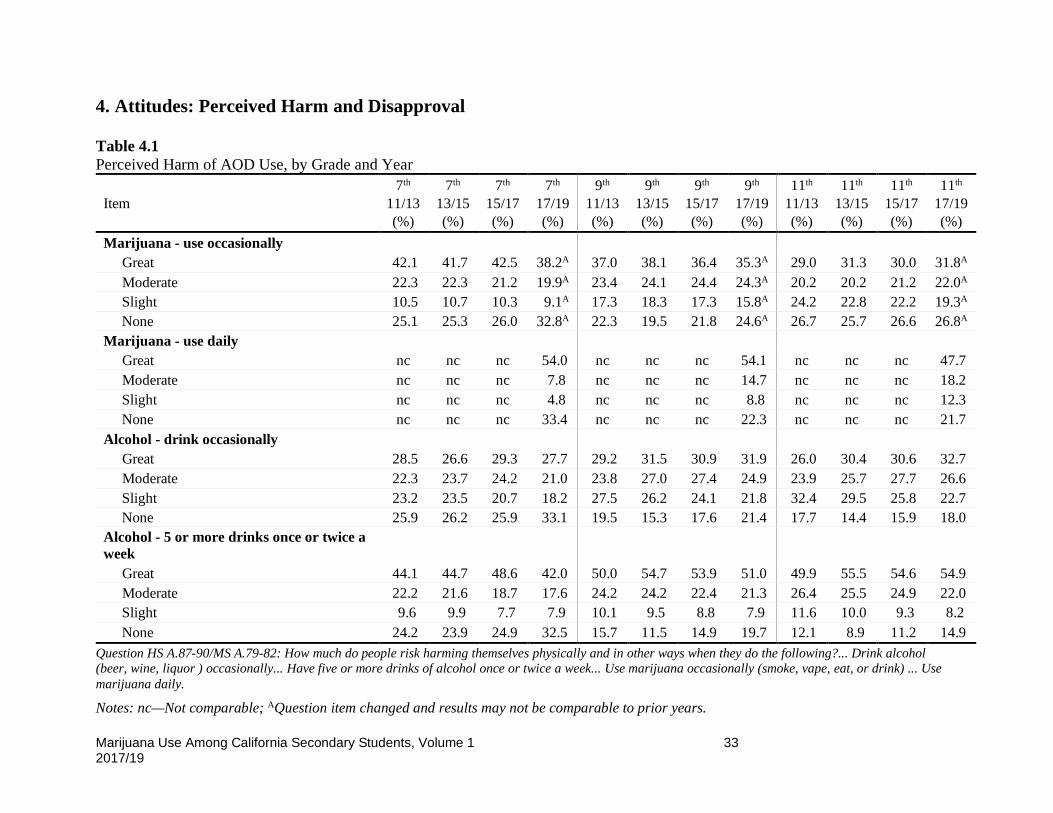
Table 4.1 Perceived Harm of AOD Use, by Grade and Year................................................ 33
Table 4.2 Personal Disapproval of AOD Use by Peers, by Grade and Year ........................ 34
Table 4.3 Parent Disapproval of Respondent Use, by Grade and Year (AOD Module B) ... 35
Table 4.4 Peer Disapproval of Respondent Use, by Grade and Year (AOD Module B) ...... 36
5. Availability................................................................................................................................37
Table 5.1 Sources for Obtaining Marijuana, by Grade and Year (AOD Module B)............. 37
Table 5.2 Perceived Difficulty of Obtaining Marijuana, Alcohol, and Cigarettes ................ 38
6. Use of Vaping Devices ..............................................................................................................39
Table 6.1 Lifetime and Current use of Vaping Devices, by Grade and Year ........................ 39
Table 6.2 Age of Onset—Vaping, by Grade and Year (AOD Module B) ............................ 40
Table 6.3 E-Cigarette Consumption, by Product, Grade and Year (AOD Module B) .......... 40
Marijuana Use Among California Secondary Students, Volume 1 2017/19
iii
Table 6.4 Perceived Difficulty of Obtaining E-Cigarettes, by Grade and Year .................... 41
Table B1 Marijuana-Specific CHKS items ........................................................................... 42
Marijuana Use Among California Secondary Students, Volume 1 2017/19
1
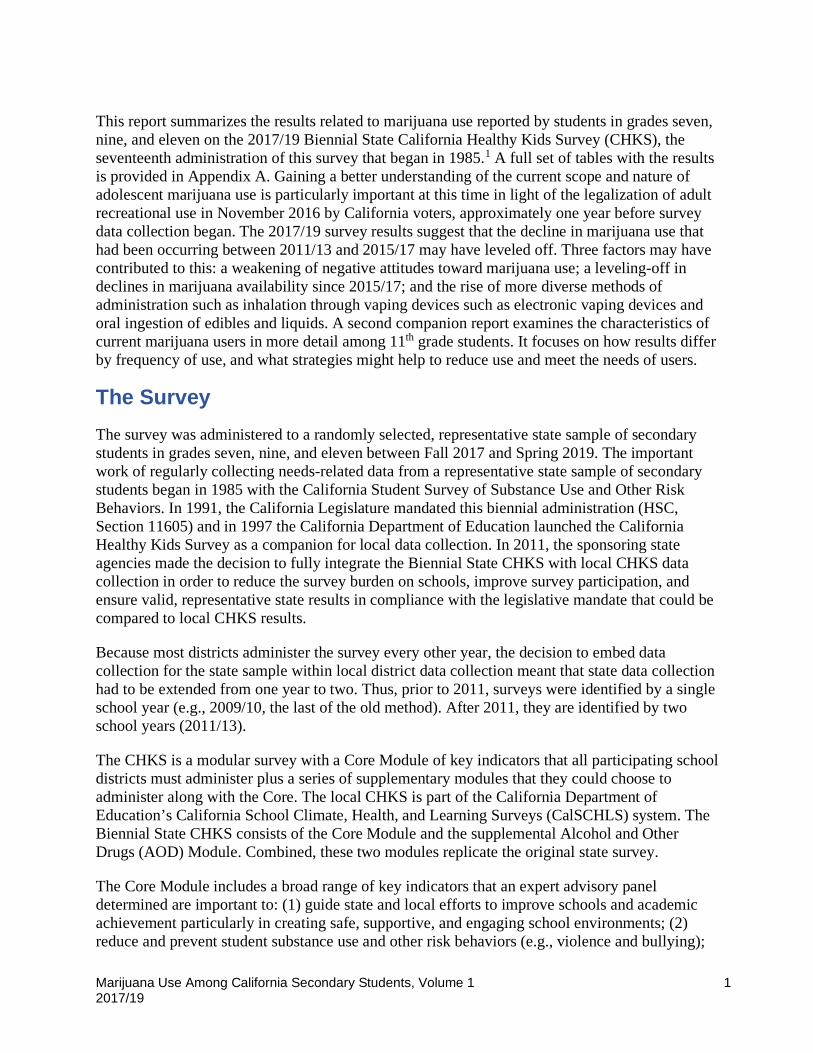
This report summarizes the results related to marijuana use reported by students in grades seven, nine, and eleven on the 2017/19 Biennial State California Healthy Kids Survey (CHKS), the seventeenth administration of this survey that began in 1985.1 A full set of tables with the results is provided in Appendix A. Gaining a better understanding of the current scope and nature of adolescent marijuana use is particularly important at this time in light of the legalization of adult recreational use in November 2016 by California voters, approximately one year before survey data collection began. The 2017/19 survey results suggest that the decline in marijuana use that had been occurring between 2011/13 and 2015/17 may have leveled off. Three factors may have contributed to this: a weakening of negative attitudes toward marijuana use; a leveling-off in declines in marijuana availability since 2015/17; and the rise of more diverse methods of administration such as inhalation through vaping devices such as electronic vaping devices and oral ingestion of edibles and liquids. A second companion report examines the characteristics of current marijuana users in more detail among 11th grade students. It focuses on how results differ by frequency of use, and what strategies might help to reduce use and meet the needs of users.
The Survey The survey was administered to a randomly selected, representative state sample of secondary students in grades seven, nine, and eleven between Fall 2017 and Spring 2019. The important work of regularly collecting needs-related data from a representative state sample of secondary students began in 1985 with the California Student Survey of Substance Use and Other Risk Behaviors. In 1991, the California Legislature mandated this biennial administration (HSC, Section 11605) and in 1997 the California Department of Education launched the California Healthy Kids Survey as a companion for local data collection. In 2011, the sponsoring state agencies made the decision to fully integrate the Biennial State CHKS with local CHKS data collection in order to reduce the survey burden on schools, improve survey participation, and ensure valid, representative state results in compliance with the legislative mandate that could be compared to local CHKS results.
Because most districts administer the survey every other year, the decision to embed data collection for the state sample within local district data collection meant that state data collection had to be extended from one year to two. Thus, prior to 2011, surveys were identified by a single school year (e.g., 2009/10, the last of the old method). After 2011, they are identified by two school years (2011/13).
The CHKS is a modular survey with a Core Module of key indicators that all participating school districts must administer plus a series of supplementary modules that they could choose to administer along with the Core. The local CHKS is part of the California Department of Education’s California School Climate, Health, and Learning Surveys (CalSCHLS) system. The Biennial State CHKS consists of the Core Module and the supplemental Alcohol and Other Drugs (AOD) Module. Combined, these two modules replicate the original state survey.
The Core Module includes a broad range of key indicators that an expert advisory panel determined are important to: (1) guide state and local efforts to improve schools and academic achievement particularly in creating safe, supportive, and engaging school environments; (2) reduce and prevent student substance use and other risk behaviors (e.g., violence and bullying);

Marijuana Use Among California Secondary Students, Volume 1 2017/19
2
and (3) foster resilience, mental health, and overall well-being. The great majority of Core questions are school-specific. The AOD Module provides additional information on patterns of substance use, factors that may be influencing it (correlates), and adverse consequences.
A total of 45,848 secondary students completed the Core Module and 33,621 completed the AOD Module, with roughly even numbers across grades.2 Because different samples of schools administered the Core and AOD modules, the tables with the full results from the two modules are presented separately in Appendix A and we note which results are from the AOD Module in this report.
A complete discussion of the survey methods and the sample is contained in the main report of Seventeenth Biennial State CHKS, which can be downloaded at CalSCHLS.org. The survey was conducted under conditions of strict anonymity and confidentiality. Participation by school districts, schools, and students was voluntary, and parental consent was required. The state’s Committee for the Protection of Human Subjects, Office of Statewide Health Planning and Development, approved the protocol.
Use Prevalence and Level As shown in Exhibits 1 and 2, a pronounced decline in use is evident between 2011/13 and 2015/17. For 2017/19, most use indicators changed little and there were even slight increases in current and lifetime prevalence among 7th graders. However, as discussed in the Conclusion, interpreting these two-year trends is complicated by a change in the wording of the survey questions from asking just about smoking marijuana, or using it in general, to more specifically asking about smoking, vaping, eating, or drinking it.
Marijuana Use Among California Secondary Students, Volume 1 2017/19
3
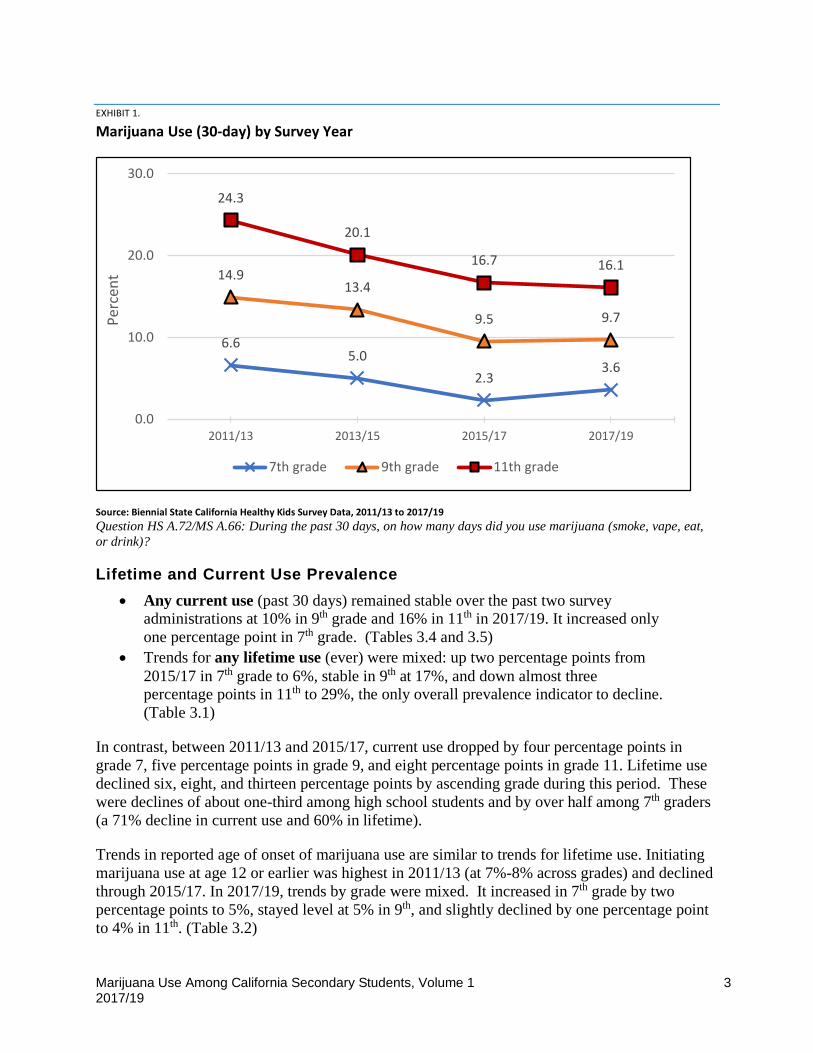
EXHIBIT 1. Marijuana Use (30-day) by Survey Year
Source: Biennial State California Healthy Kids Survey Data, 2011/13 to 2017/19 Question HS A.72/MS A.66: During the past 30 days, on how many days did you use marijuana (smoke, vape, eat, or drink)?
Lifetime and Current Use Prevalence • Any current use (past 30 days) remained stable over the past two survey
administrations at 10% in 9th grade and 16% in 11th in 2017/19. It increased only one percentage point in 7th grade. (Tables 3.4 and 3.5)
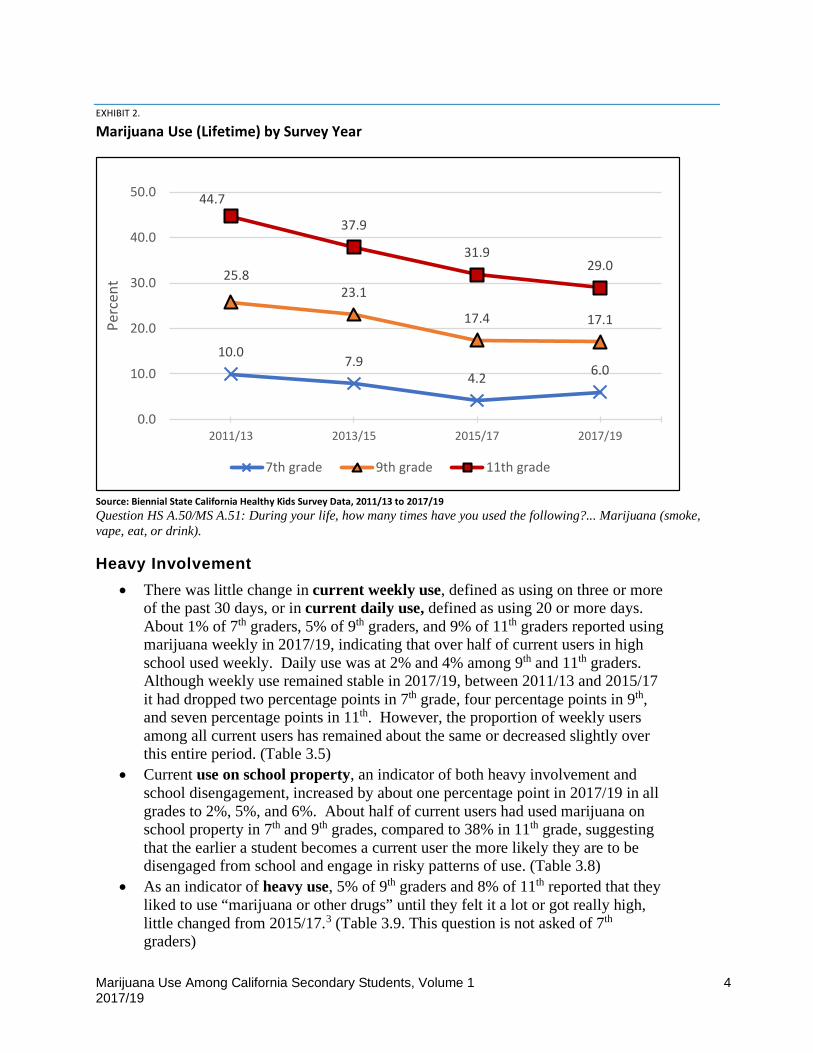
• Trends for any lifetime use (ever) were mixed: up two percentage points from 2015/17 in 7th grade to 6%, stable in 9th at 17%, and down almost three percentage points in 11th to 29%, the only overall prevalence indicator to decline. (Table 3.1)
In contrast, between 2011/13 and 2015/17, current use dropped by four percentage points in grade 7, five percentage points in grade 9, and eight percentage points in grade 11. Lifetime use declined six, eight, and thirteen percentage points by ascending grade during this period. These were declines of about one-third among high school students and by over half among 7th graders (a 71% decline in current use and 60% in lifetime).
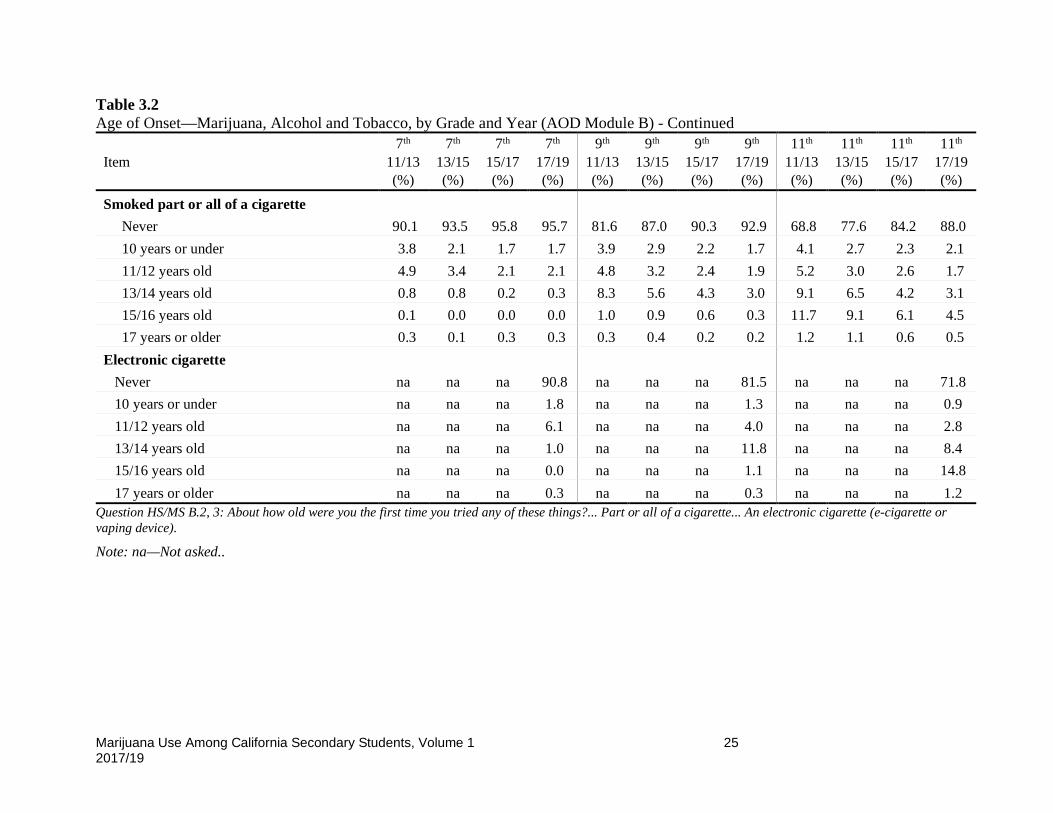
Trends in reported age of onset of marijuana use are similar to trends for lifetime use. Initiating marijuana use at age 12 or earlier was highest in 2011/13 (at 7%-8% across grades) and declined through 2015/17. In 2017/19, trends by grade were mixed. It increased in 7th grade by two percentage points to 5%, stayed level at 5% in 9th, and slightly declined by one percentage point to 4% in 11th. (Table 3.2)
6.65.0
2.33.6
14.913.4
9.5 9.7
24.3
20.1
16.7 16.1
0.0
10.0
20.0
30.0
2011/13 2013/15 2015/17 2017/19
Perc
ent
7th grade 9th grade 11th grade
Marijuana Use Among California Secondary Students, Volume 1 2017/19
4
EXHIBIT 2. Marijuana Use (Lifetime) by Survey Year
Source: Biennial State California Healthy Kids Survey Data, 2011/13 to 2017/19 Question HS A.50/MS A.51: During your life, how many times have you used the following?... Marijuana (smoke, vape, eat, or drink).
Heavy Involvement • There was little change in current weekly use, defined as using on three or more
of the past 30 days, or in current daily use, defined as using 20 or more days. About 1% of 7th graders, 5% of 9th graders, and 9% of 11th graders reported using marijuana weekly in 2017/19, indicating that over half of current users in high school used weekly. Daily use was at 2% and 4% among 9th and 11th graders. Although weekly use remained stable in 2017/19, between 2011/13 and 2015/17 it had dropped two percentage points in 7th grade, four percentage points in 9th, and seven percentage points in 11th. However, the proportion of weekly users among all current users has remained about the same or decreased slightly over this entire period. (Table 3.5)
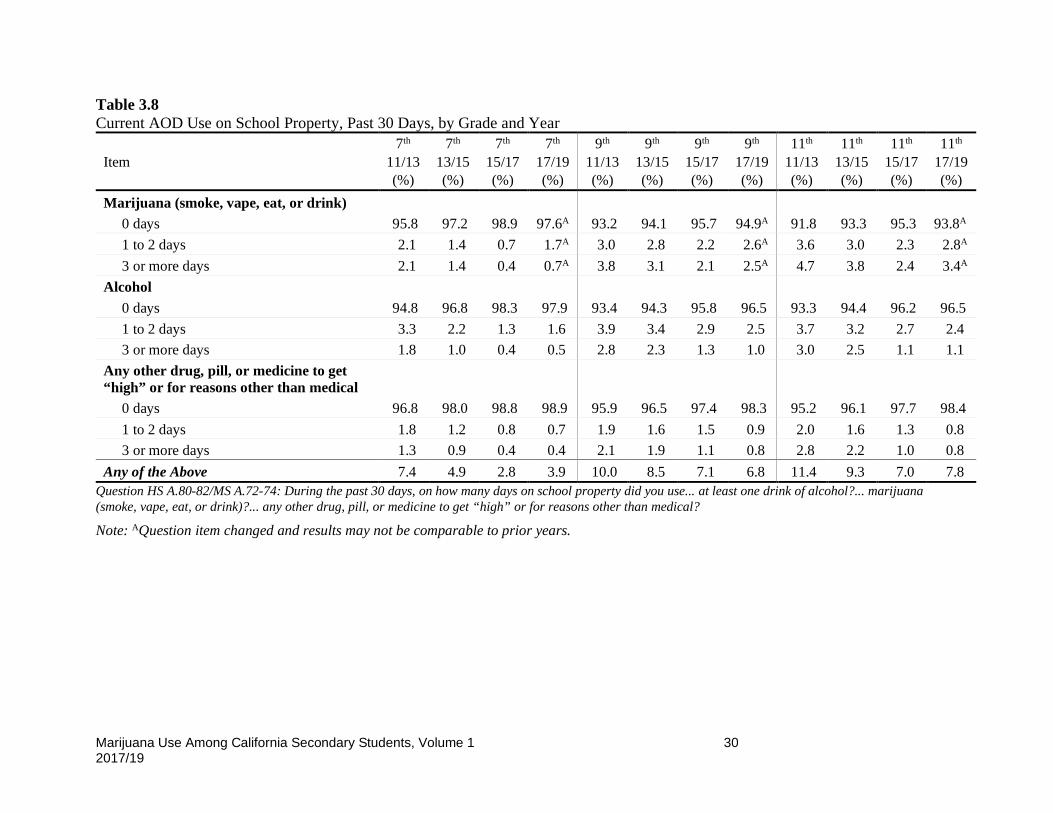
• Current use on school property, an indicator of both heavy involvement and school disengagement, increased by about one percentage point in 2017/19 in all grades to 2%, 5%, and 6%. About half of current users had used marijuana on school property in 7th and 9th grades, compared to 38% in 11th grade, suggesting that the earlier a student becomes a current user the more likely they are to be disengaged from school and engage in risky patterns of use. (Table 3.8)
• As an indicator of heavy use, 5% of 9th graders and 8% of 11th reported that they liked to use “marijuana or other drugs” until they felt it a lot or got really high, little changed from 2015/17.3 (Table 3.9. This question is not asked of 7th graders)
10.07.9
4.2 6.0
25.823.1
17.4 17.1
44.7
37.9
31.929.0
0.0
10.0
20.0
30.0
40.0
50.0
2011/13 2013/15 2015/17 2017/19
Perc
ent
7th grade 9th grade 11th grade

Marijuana Use Among California Secondary Students, Volume 1 2017/19
5
Demographic Differences in Current Use
Tables 3.6 and 3.7 show current use by race/ethnicity and gender. The lowest rates are consistently reported by Asian Americans and differences among other groups were relatively small (see Exhibit 3). Among 11th graders, there is very little variation across racial/ethnic groups (16%-18%), with the exception of Asians, who reported current use at about half the level of other groups (7%). Racial/ethnic differences were greater among 7th graders, with the highest rate among Native Hawaiian/Pacific Islanders at 8%, followed by Hispanics/Latinos, American Indians/Alaska Native, African Americans, and Mixed at 4.4%-5.6%, and Whites at 2% and Asians at 1%. The biggest difference by grade was among Whites, who reported the second lowest rates in 7th grade (2%) and the highest rate in 11th grade (18%).
EXHIBIT 3. Marijuana Use (30-day) by Race/Ethnicity and Grade, 2017/19
Source: Biennial State California Healthy Kids Survey Data, 2017/19 Question HS A.72/MS A.66: During the past 30 days, on how many days did you use marijuana (smoke, vape, eat, or drink)?
Among high school students, there was little change among Latinos, Asians, Whites, and Mixed between 2015/17 and 2017/19. Declines were reported by African Americans and American Indians, by five and six percentage points, respectively, in 11th grade. Current rates for these two groups are about half those of 2011/13. (Table 3.6)
Gender differences have been small in the last two surveys, with females only slightly higher in 9th grade and males slightly higher in 11th grade. Between 2011/13 and 2013/15, gender differences were also relatively small in 7th and 9th grades, but there has been a marked drop in gender differences among 11th graders since 2011/13 because use has declined more among males than females. Over the last four surveys, it has declined five percentage points among
5
10
15
1
4
76
10
16
4
11
16
8
12
16
2
9
18
5
12
18
0
5
10
15
20
Grade 7 Grade 9 Grade 11
Perc
ent
Amer Indian Asian African American Latino Pac Islander White Mixed
Marijuana Use Among California Secondary Students, Volume 1 2017/19
6
females (from 20% to 15%), whereas it has declined almost thirteen percentage points among males (from 29% to 16%). (Table 3.7)
Cessation Efforts
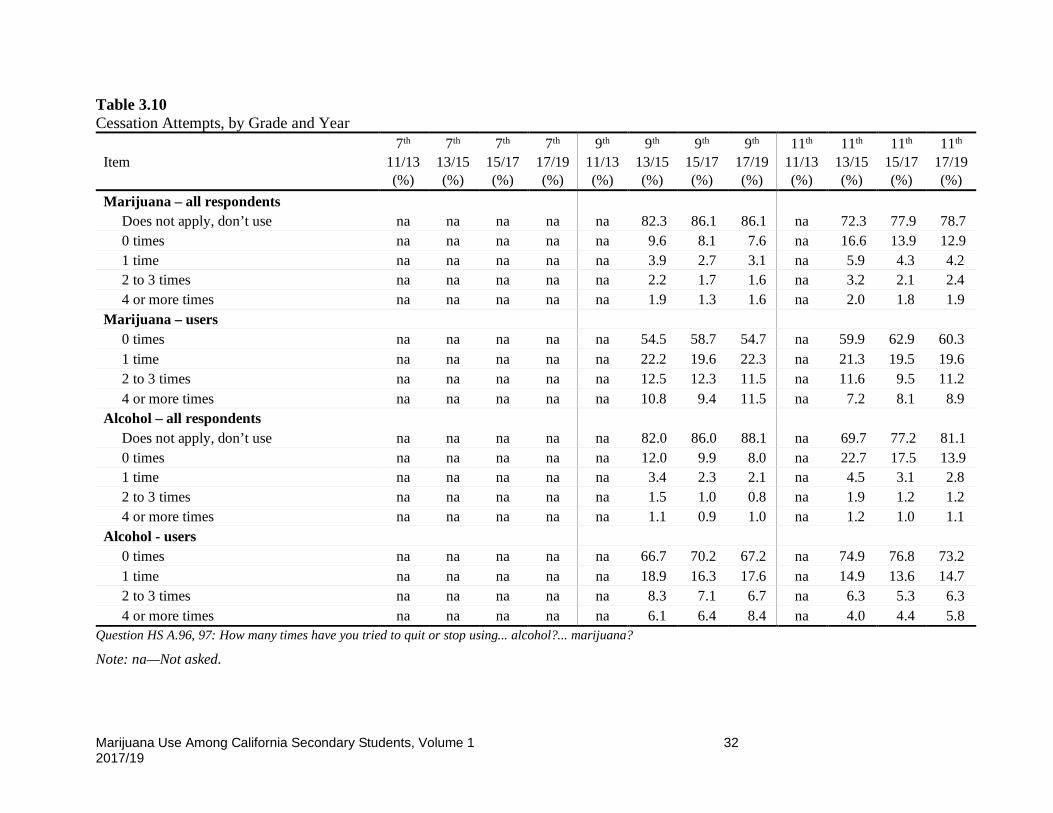
Among high school students, 6% of 9th graders and 9% of 11th reported making at least one attempt to quit or stop using marijuana, with about half of these respondents making two or more attempts. These results have been consistent for the past three surveys, with 45% of users in 9th grade and 40% of users in 11th grade reporting any attempts to stop using marijuana. The results continue to show that a substantial minority of users have tried to quit using marijuana. (Table 3.10)
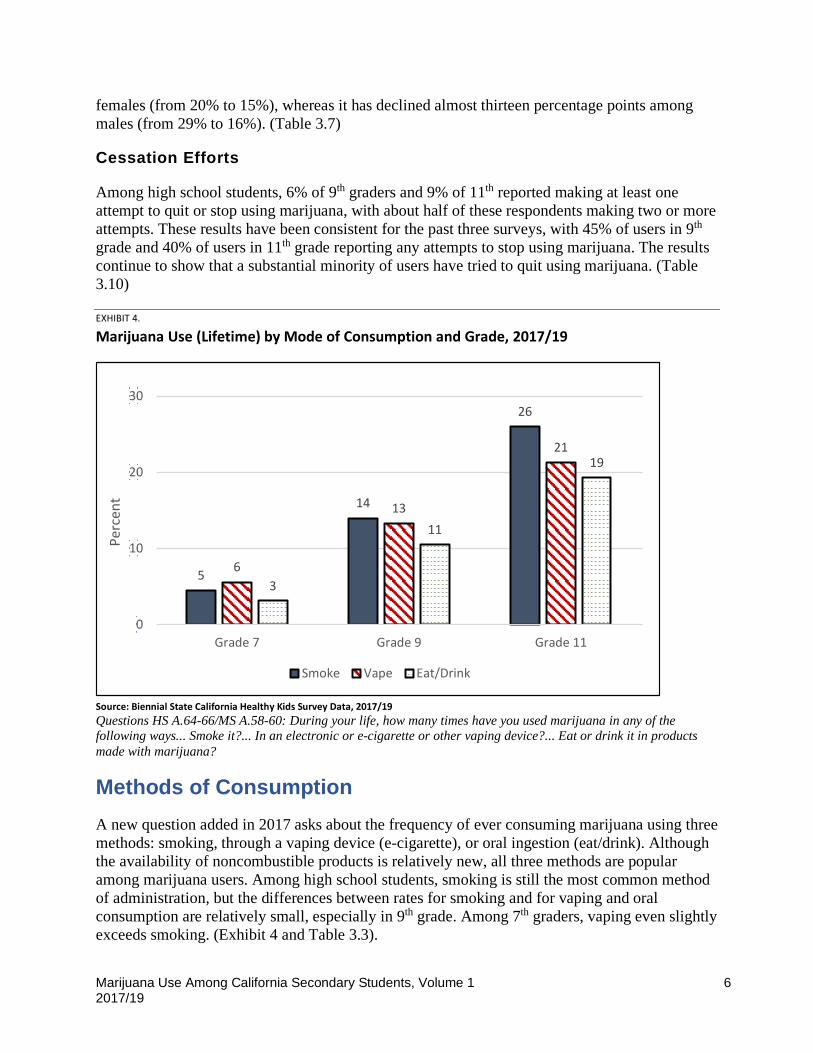
EXHIBIT 4. Marijuana Use (Lifetime) by Mode of Consumption and Grade, 2017/19
Source: Biennial State California Healthy Kids Survey Data, 2017/19 Questions HS A.64-66/MS A.58-60: During your life, how many times have you used marijuana in any of the following ways... Smoke it?... In an electronic or e-cigarette or other vaping device?... Eat or drink it in products made with marijuana?
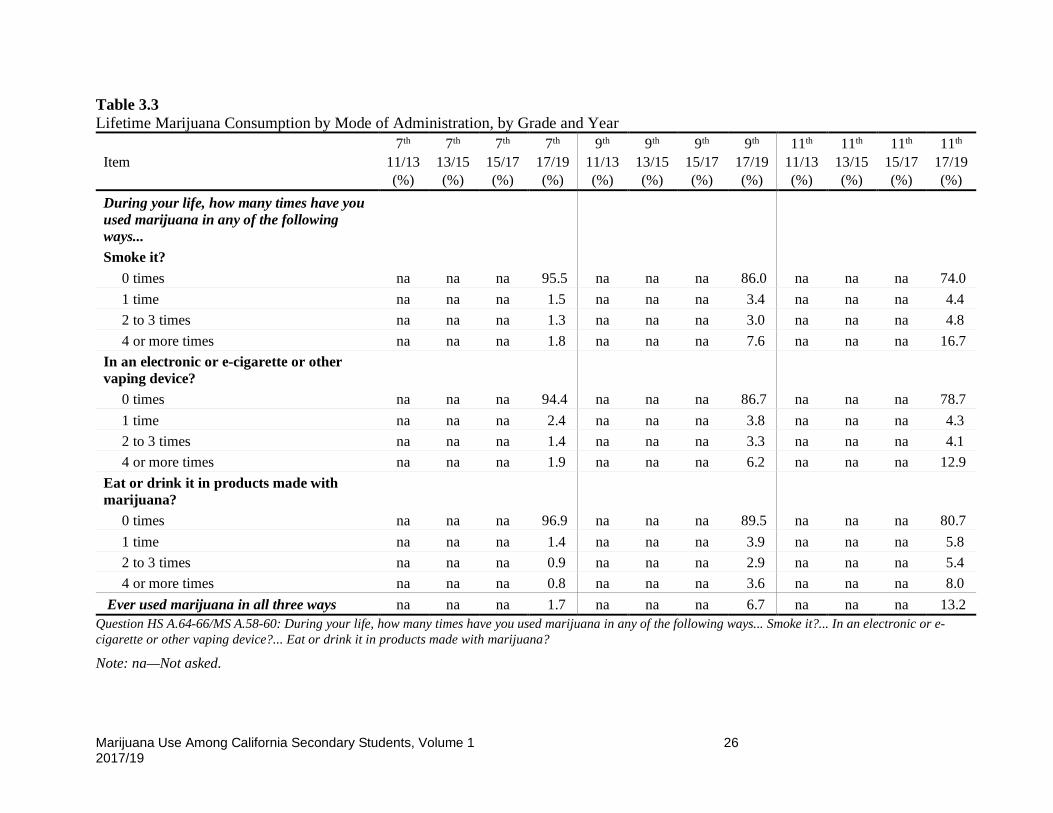
Methods of Consumption A new question added in 2017 asks about the frequency of ever consuming marijuana using three methods: smoking, through a vaping device (e-cigarette), or oral ingestion (eat/drink). Although the availability of noncombustible products is relatively new, all three methods are popular among marijuana users. Among high school students, smoking is still the most common method of administration, but the differences between rates for smoking and for vaping and oral consumption are relatively small, especially in 9th grade. Among 7th graders, vaping even slightly exceeds smoking. (Exhibit 4 and Table 3.3).
5
14
26
6
13
21
3
11
19
0
10
20
30
Grade 7 Grade 9 Grade 11
Perc
ent
Smoke Vape Eat/Drink
Marijuana Use Among California Secondary Students, Volume 1 2017/19
7
• Seventh graders were more likely to have vaped marijuana (6%) or smoked it (5%) than to orally ingested it (3%).
• Among 9th graders, smoking (14%) was only one percentage point higher than vaping (13%) and three percentage points higher than oral ingestion (11%).
• Among 11th graders, smoking was reported by 26%, five percentage points higher than vaping (21%) and seven percentage points higher than oral ingestion (19%).
Although policy makers and practitioners have paid a great deal of attention to vaping nicotine and/or tobacco substitutes, these Biennial results indicate that 60% of lifetime marijuana users in 7th grade and about two-thirds in high school have vaped it.
Consuming marijuana all three ways was reported by 2% of 7th graders, 7% of 9th, and 13% of 11th. These students constitute 28% of 7th graders who had ever tried marijuana, 39% in 9th grade, and 45% in 11th grade. More than half of the high school students who had ever smoked marijuana had also vaped and ingested it orally.
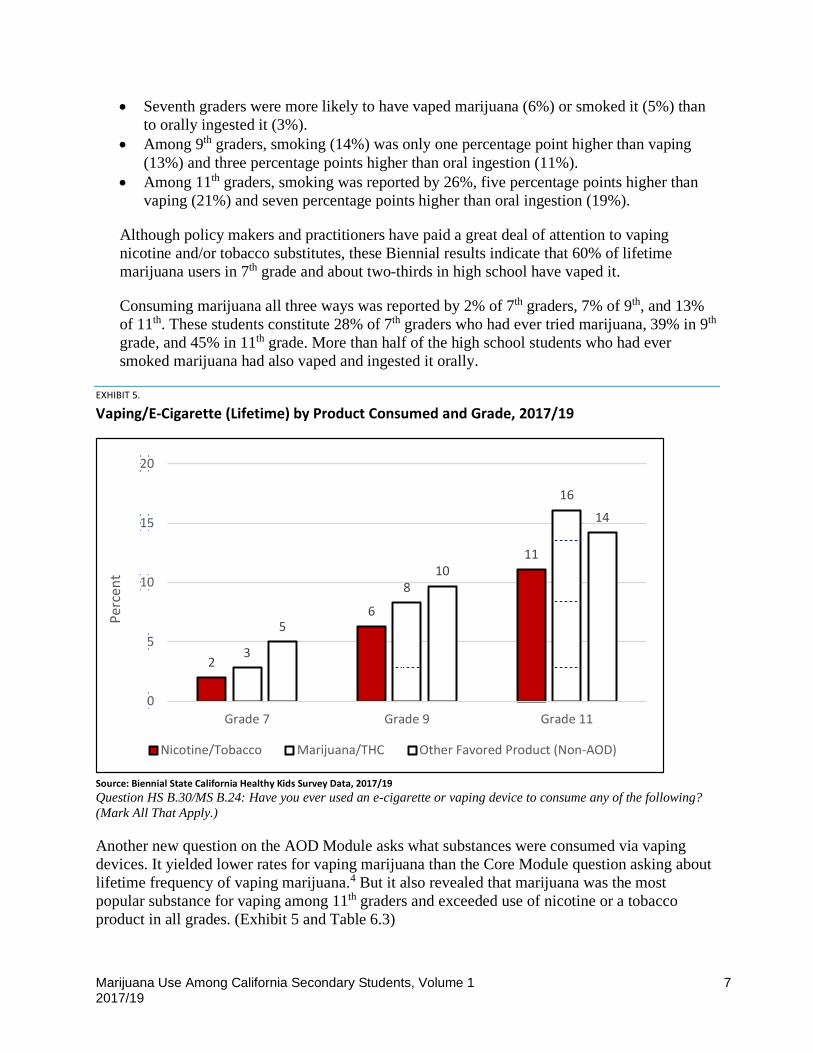
EXHIBIT 5. Vaping/E-Cigarette (Lifetime) by Product Consumed and Grade, 2017/19
Source: Biennial State California Healthy Kids Survey Data, 2017/19 Question HS B.30/MS B.24: Have you ever used an e-cigarette or vaping device to consume any of the following? (Mark All That Apply.)
Another new question on the AOD Module asks what substances were consumed via vaping devices. It yielded lower rates for vaping marijuana than the Core Module question asking about lifetime frequency of vaping marijuana.4 But it also revealed that marijuana was the most popular substance for vaping among 11th graders and exceeded use of nicotine or a tobacco product in all grades. (Exhibit 5 and Table 6.3)
2
6
11
3
8
16
5
10
14
0
5
10
15
20
Grade 7 Grade 9 Grade 11
Perc
ent
Nicotine/Tobacco Marijuana/THC Other Favored Product (Non-AOD)

Marijuana Use Among California Secondary Students, Volume 1 2017/19
8
• Ever consuming marijuana in a vaping device was reported by 3% in 7th grade, 8% in 9th, and 16% in 11th.
• Vaping of nicotine or a tobacco product was lower at 2%, 6%, and 11%, respectively.
• Marijuana was the most frequently-vaped substance among 11th graders (16%), followed by a flavored product without nicotine or other drug (14%) and nicotine/tobacco (11%). Among 7th and 9th graders, flavored products without nicotine or other drugs was the most frequently-vaped substance (5% and 10%), followed by marijuana or THC (3% and 8%) and tobacco/nicotine (2% and (6%).
Use Attitudes and Perceptions A weakening of negative attitudes towards marijuana and perceptions of parental and peer disapproval appears to have occurred.
Perceived Harm
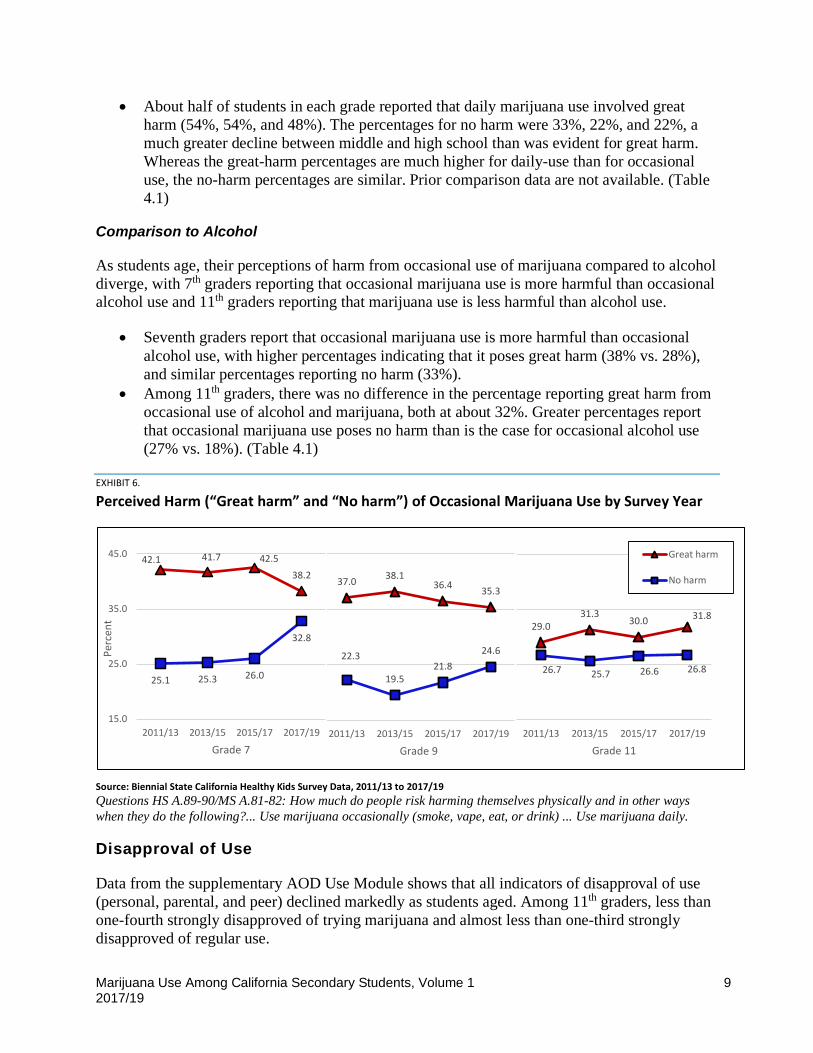
Students were asked to indicate “how much people risk harming themselves physically and in other ways” from using marijuana occasionally and daily (smoke, vape, eat, or drink). Perceived risk of great harm seems to be fairly well established by 7th grade. Although the percentages for both occasional use and daily use decline with age, the decline by 11th grade is only six percentage points. For occasional use, there were no major changes compaed to 2015/17 but some evidence that perceptions of harmfulness declined among 7th and 9th graders, especially in regard to no harm. Over one-fifth of high school students thought there was no harm from daily use.
Occasional Marijuana Use
The percentages perceiving great harm from occasional use ranged from 38% in 7th grade to 32% in 11th. Seventh graders, overall, had the most divergent attitudes. They had higher rates for both great harm and for no harm compared to 11th. Two-year trend results were mixed, with declines in perceptions of harmfulness among 7th and 9th graders, and slight increases among 11th graders. (Table 4.1 and Exhibit 6)
• The percentage of 7th graders selecting great harm declined by four percentage points to 38% between 2015/17 and 2017/19, and for no harm it rose seven percentage points to 33%.
• For 9th graders, great harm declined by one percentage point to 35% and no harm rose three percentage points, to 25%. Harm perceptions have been weakening consistently among 9th graders since 2013/15.
• For 11th graders, results were mixed. There was a two-point increase in perceptions of great harm after 2015/17, to 32%. However, this may be just a momentary fluctuation as great-harm levels have been steady at around three-in-ten 11th graders for the past decade. The no-harm rate was unchanged at 27%.
Daily Marijuana Use
Marijuana Use Among California Secondary Students, Volume 1 2017/19
9
• About half of students in each grade reported that daily marijuana use involved great harm (54%, 54%, and 48%). The percentages for no harm were 33%, 22%, and 22%, a much greater decline between middle and high school than was evident for great harm. Whereas the great-harm percentages are much higher for daily-use than for occasional use, the no-harm percentages are similar. Prior comparison data are not available. (Table 4.1)
Comparison to Alcohol
As students age, their perceptions of harm from occasional use of marijuana compared to alcohol diverge, with 7th graders reporting that occasional marijuana use is more harmful than occasional alcohol use and 11th graders reporting that marijuana use is less harmful than alcohol use.
• Seventh graders report that occasional marijuana use is more harmful than occasional alcohol use, with higher percentages indicating that it poses great harm (38% vs. 28%), and similar percentages reporting no harm (33%).
• Among 11th graders, there was no difference in the percentage reporting great harm from occasional use of alcohol and marijuana, both at about 32%. Greater percentages report that occasional marijuana use poses no harm than is the case for occasional alcohol use (27% vs. 18%). (Table 4.1)
EXHIBIT 6. Perceived Harm (“Great harm” and “No harm”) of Occasional Marijuana Use by Survey Year
Source: Biennial State California Healthy Kids Survey Data, 2011/13 to 2017/19 Questions HS A.89-90/MS A.81-82: How much do people risk harming themselves physically and in other ways when they do the following?... Use marijuana occasionally (smoke, vape, eat, or drink) ... Use marijuana daily.
Disapproval of Use
Data from the supplementary AOD Use Module shows that all indicators of disapproval of use (personal, parental, and peer) declined markedly as students aged. Among 11th graders, less than one-fourth strongly disapproved of trying marijuana and almost less than one-third strongly disapproved of regular use.
37.0 38.136.4 35.3
22.3
19.521.8
24.6
2011/13 2013/15 2015/17 2017/19
Grade 9
42.1 41.7 42.538.2
25.1 25.3 26.0
32.8
15.0
25.0
35.0
45.0
2011/13 2013/15 2015/17 2017/19
Perc
ent
Grade 7
29.031.3
30.0 31.8
26.7 25.7 26.6 26.8
2011/13 2013/15 2015/17 2017/19
Grade 11
Great harm
No harm

Marijuana Use Among California Secondary Students, Volume 1 2017/19
10
Personal, parental, and peer disapproval of marijuana use increased between 2013/15 and 2015/17 but either declined or remained stable in 2017/19. The greatest declines in perceived disapproval occurred among 7th graders, consistent with the greater decline in perceived harm from occasional use in that grade.
Personal Disapproval
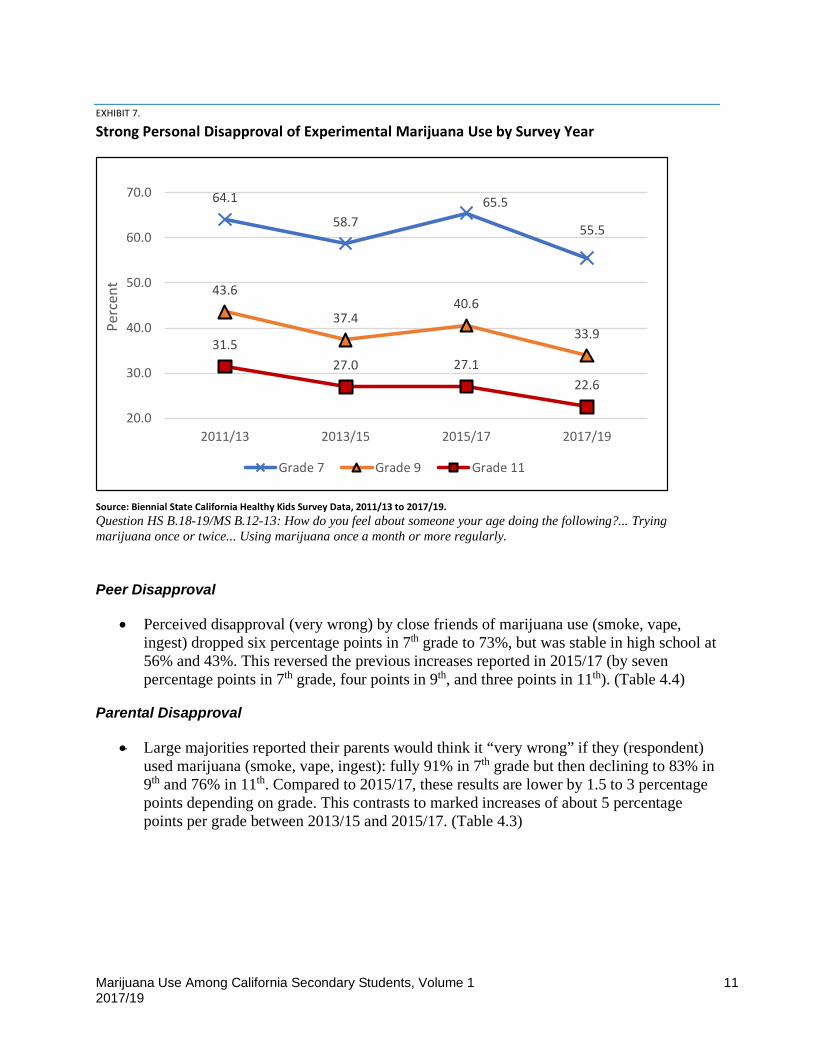
• The great majority of high school students and about half of 7th graders do not strongly disapprove of experimenting with marijuana. Strong personal disapproval of “someone your age” using once or twice dropped by half across grades, from 56% in 7th grade to 34% in 9th and only 23% in 11th.
• Compared to 2015/17 (when rates increased in 7th and 9th grades), in all grades a pronounced decline occurred on disapproval of marijuana experimentation, though the decline got smaller by ascending grade, by ten percentage points in 7th, seven percentage points in 9th, and five percentage points in 11th. These are the biggest declines for any disapproval indicator and the lowest rates in the past four surveys.5
• Strong personal disapproval of a peer using once a month or more regularly were only about ten percentage points higher than for experimenting, at 63%, 45%, and 32%, by ascending grade. Trends were mixed: down three percentage points in 7th grade, stable in 9th, and up two percentage points in 11th.6 (Table 4.2 and Exhibit 7)
Marijuana Use Among California Secondary Students, Volume 1 2017/19
11
EXHIBIT 7. Strong Personal Disapproval of Experimental Marijuana Use by Survey Year
Source: Biennial State California Healthy Kids Survey Data, 2011/13 to 2017/19. Question HS B.18-19/MS B.12-13: How do you feel about someone your age doing the following?... Trying marijuana once or twice... Using marijuana once a month or more regularly.
Peer Disapproval
• Perceived disapproval (very wrong) by close friends of marijuana use (smoke, vape, ingest) dropped six percentage points in 7th grade to 73%, but was stable in high school at 56% and 43%. This reversed the previous increases reported in 2015/17 (by seven percentage points in 7th grade, four points in 9th, and three points in 11th). (Table 4.4)
Parental Disapproval
• Large majorities reported their parents would think it “very wrong” if they (respondent) used marijuana (smoke, vape, ingest): fully 91% in 7th grade but then declining to 83% in 9th and 76% in 11th. Compared to 2015/17, these results are lower by 1.5 to 3 percentage points depending on grade. This contrasts to marked increases of about 5 percentage points per grade between 2013/15 and 2015/17. (Table 4.3)
64.1
58.765.5
55.5
43.6
37.440.6
33.931.5
27.0 27.122.6
20.0
30.0
40.0
50.0
60.0
70.0
2011/13 2013/15 2015/17 2017/19
Perc
ent
Grade 7 Grade 9 Grade 11
Marijuana Use Among California Secondary Students, Volume 1 2017/19
12
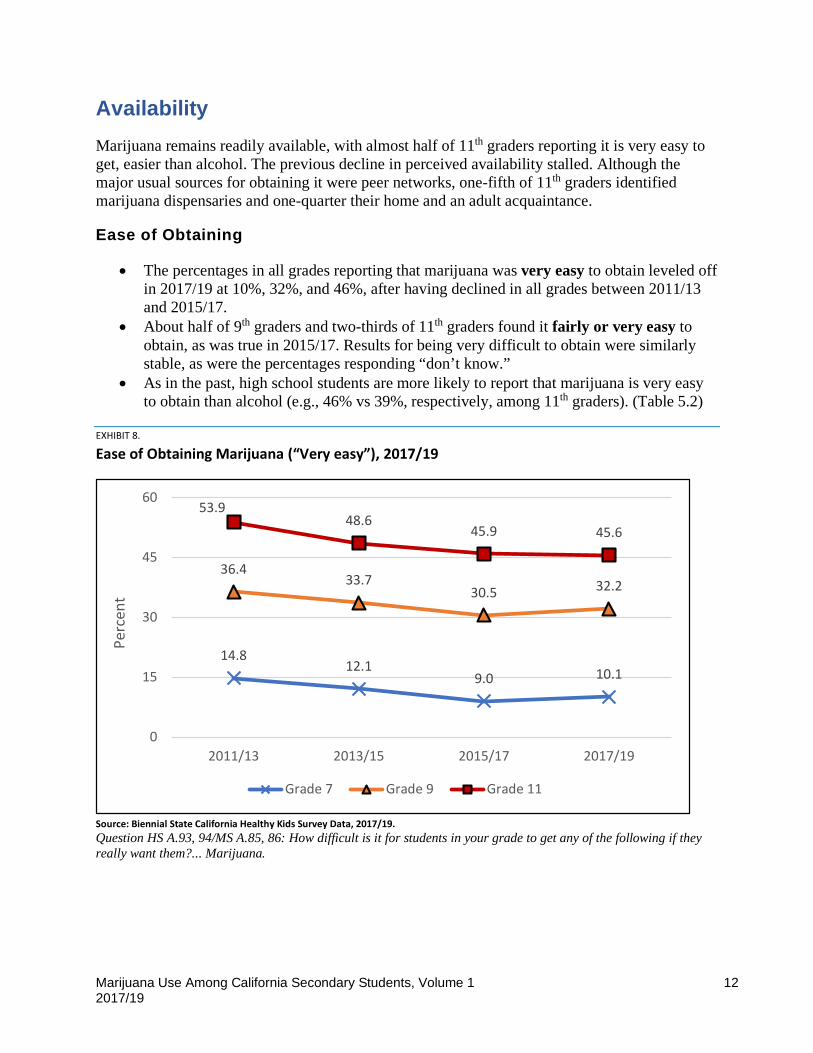
Availability Marijuana remains readily available, with almost half of 11th graders reporting it is very easy to get, easier than alcohol. The previous decline in perceived availability stalled. Although the major usual sources for obtaining it were peer networks, one-fifth of 11th graders identified marijuana dispensaries and one-quarter their home and an adult acquaintance.
Ease of Obtaining
• The percentages in all grades reporting that marijuana was very easy to obtain leveled off in 2017/19 at 10%, 32%, and 46%, after having declined in all grades between 2011/13 and 2015/17.
• About half of 9th graders and two-thirds of 11th graders found it fairly or very easy to obtain, as was true in 2015/17. Results for being very difficult to obtain were similarly stable, as were the percentages responding “don’t know.”
• As in the past, high school students are more likely to report that marijuana is very easy to obtain than alcohol (e.g., 46% vs 39%, respectively, among 11th graders). (Table 5.2)
EXHIBIT 8. Ease of Obtaining Marijuana (“Very easy”), 2017/19
Source: Biennial State California Healthy Kids Survey Data, 2017/19. Question HS A.93, 94/MS A.85, 86: How difficult is it for students in your grade to get any of the following if they really want them?... Marijuana.
14.812.1
9.0 10.1
36.433.7
30.5 32.2
53.948.6
45.9 45.6
0
15
30
45
60
2011/13 2013/15 2015/17 2017/19
Perc
ent
Grade 7 Grade 9 Grade 11
Marijuana Use Among California Secondary Students, Volume 1 2017/19
13
Sources of Marijuana
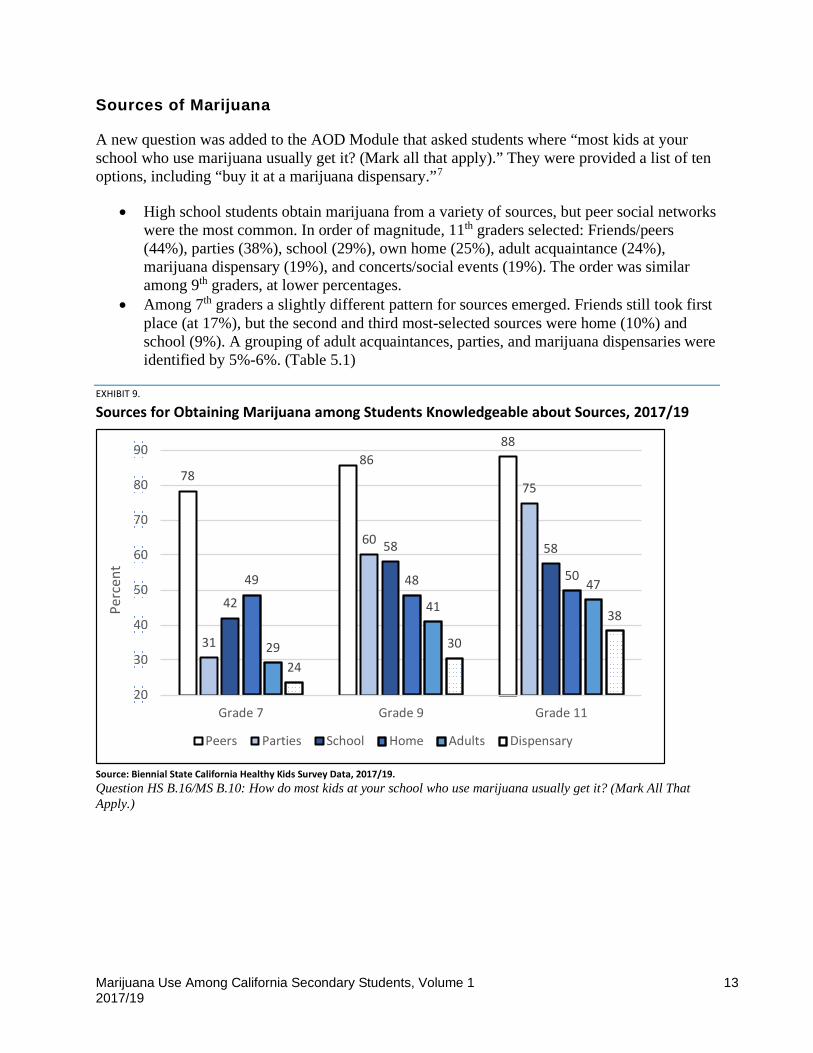
A new question was added to the AOD Module that asked students where “most kids at your school who use marijuana usually get it? (Mark all that apply).” They were provided a list of ten options, including “buy it at a marijuana dispensary.”7
• High school students obtain marijuana from a variety of sources, but peer social networks were the most common. In order of magnitude, 11th graders selected: Friends/peers (44%), parties (38%), school (29%), own home (25%), adult acquaintance (24%), marijuana dispensary (19%), and concerts/social events (19%). The order was similar among 9th graders, at lower percentages.
• Among 7th graders a slightly different pattern for sources emerged. Friends still took first place (at 17%), but the second and third most-selected sources were home (10%) and school (9%). A grouping of adult acquaintances, parties, and marijuana dispensaries were identified by 5%-6%. (Table 5.1)
EXHIBIT 9. Sources for Obtaining Marijuana among Students Knowledgeable about Sources, 2017/19
Source: Biennial State California Healthy Kids Survey Data, 2017/19. Question HS B.16/MS B.10: How do most kids at your school who use marijuana usually get it? (Mark All That Apply.)
7886
88
31
60
75
42
58 58
49 48 50
29
4147
24
30
38
20
30
40
50
60
70
80
90
Grade 7 Grade 9 Grade 11
Perc
ent
Peers Parties School Home Adults Dispensary
Marijuana Use Among California Secondary Students, Volume 1 2017/19
14
Discussion Even though overall marijuana use among California secondary students is at or near a historic low, the findings warrant the attention of researchers and practitioners, especially in regard to the new evidence about vaping and ingesting marijuana.
Among 11th graders:
• Students reported using marijuana during the past 30 days just as frequently as using alcohol, with one-sixth of students reporting use.
• Almost half reported it is very easy to obtain it, easier than alcohol. • Over half did not think there was great harm in using marijuana daily and 27% thought
there was no harm in occasional use, nine percentage percentage points more than for no harm from occasional drinking.
• Only about one-third strongly disapproved of their peers regularly using it once a month or more often.
• One-quarter reported ever ingesting marijuana and vaping it.
Perhaps even more disconcerting are the following results for 7th graders:
• Although the overall prevalence of current use was low (4%), about 40% of current users were already weekly users and a relatively high proportion (49%) compared to 11th graders (30%) had used on school property in the past 30 days.
• African American and Latino youth exhibit rates of current use that are two to three times higher than White youth. By 11th grade, this racial/ethnic disparity has ended, with Whites even two percentage percentage points more likely to be current users than Latinos and African Americans.
• About one-fifth of 7th graders reported it was easy or very easy to get marijuana. • Only just over half strongly disapproved of use and the percentage reporting there was no
harm in occasional use was higher among them than among high school students (33% vs. 25% and 27%). Moreover, as discussed further below, the decline in negative attitudes toward marijuana was largest among 7th graders, possibly portending future increases in use.
Assessing Trends
The pronounced decline in marijuana use in all grades that occurred between 2011/13 and 2015/17 was one of the most positive trends reported by students in the Biennial State CHKS over those four years. None of the major national adolescent behavioral surveys that assess substance use have reported a decline of similar magnitude, although none show any indication of an increase.
• Among high school students (grades 9-12) who participated in the Center for Disease Control’s biennial national Youth Behavior Risk Survey, current marijuana use did decline three percentage points between 2013 and 2017, but the change was not considered significant. Lifetime use declined five percentage points.8
Marijuana Use Among California Secondary Students, Volume 1 2017/19
15
• On the annual Monitoring the Future Survey (MTF), current use among 8th, 10th, and 12th graders has been fairly stable from 2011 through 2019, varying by two to three percentage points with no clear trend beyond a small dip in use around 2015 and 2016.9
• According to the 2018 National Survey on Drug Use and Health, an annual report produced by the Substance Abuse and Mental Health Services Administration, past-year and past-month marijuana use among youth age 12-17 remained relatively stable from 2011 through 2017.10 Past-year rates were around 14%-13% before dropping to 12% in 2016 and 2017.
Trends in CHKS questions related to attitudes provide no clear explanation for the decline in California. Perceived harm from occasional use changed little while use was declining. However, perceived availability did decline steadily and markedly in all grades consistent with a decline in use. The decline in marijuana use also could be related to the large declines in alcohol and cigarette smoking among CHKS respondents over this period. Declines in alcohol and cigarette use, which generally precede marijuana initiation and act as gateways to the use of other drugs, may have prevented larger increases in the era of liberalization of adult marijuana use.11,12 Biennial State CHKS data shows that between 2011/13 and 2015/17, cigarette smoking declined by two-thirds in 7th grade and one-third in high school, and by 2017/19 alcohol use declined by half in 7th grade, 45% in 9th, and 41% in 11th.
The 2017/19 Biennial State CHKS results suggest that the previous four-year declining trend has ended. The only prevalence indicator to continue to decline was lifetime use in 11th grade and both lifetime and current use increased two percentage points in 7th grade. And there were slight one-point increases in use at school in all grades. The change in the question wording to specify vaping and oral ingestion of marijuana as well as smoking complicates interpretation of these survey results between 2015/17 and 2017/19. Do they reflect a change in behavior or are they a product of the item change? Given the high rates of vaping and ingesting marijuana, the change in the survey questions to specifying smoking, vaping, eating, or drinking may have led more students to report that they used marijuana, especially those who had vaped and ingested but did not smoke. This suggests that the previous declines in reported marijuana use might reflect that asking just about use in general was not capturing the rising number of users consuming marijuana via vaping or oral ingestion. While this is speculative, there are reasons to believe that the current question more accurately captures all users and should be considered as a baseline on which to assess use in the future.
But national survey data would indicate stability (NSDUH) or increases (YRBS, MTF) in use between 2017 and 2019 and the negative trends in correlates of use on the Biennial State CHKS, in contrast to positive trends in 2015/17, are consistent with a leveling-off of prevalence rates. The questions assessing perceived risk from occasional marijuana use, and peer and parental disapproval, were also changed to ask specifically about smoking, vaping, and ingesting marijuana. Because research has documented that students perceive that ingesting and vaping marijuana are less harmful than smoking it, this change in modes of marijuana consumption may be weakening negative attitudes. A clear negative trend is also evident in two use correlates that did not have this change in wording and that would be associated with possible increases in use: (1) the pronounced decline across grades in personal disapproval of marijuana use; and (2) the stalling of the previous decline in perceived availability.
Marijuana Use Among California Secondary Students, Volume 1 2017/19
16
Taken as a whole, current CHKS results on marijuana use, attitudes, and availability are troubling and suggestive of an end of the previous decline in use. Data now being collected for the Eighteenth Biennial will shed light on whether these results are a precursor to future increases in marijuana use. As discussed below, two other factors have implications for trends in marijuana use among youth and student learning, health, and well-being: the rise in vaping and ingesting marijuana and the legalization of adult recreational marijuana.
The Spread of Alternative Modes of Administration
The survey questions asking about marijuana use were changed in 2017/18 to better capture the increasingly diverse modes for consuming marijuana. Although this change has complicated interpretation of trends across time, the results demonstrate the necessity of that change in providing much needed information on these behaviors and, as noted, likely more accurate prevalence estimates.
• One-quarter of 11th graders had ever vaped or ingested marijuana at least once, and 13% had consumed marijuana using all three modes (smoking, vaping, ingesting), almost half the lifetime marijuana use rate.
• Among 7th graders, vaping marijuana/THC (6%) is as common as smoking it (5%). • And in all grades, vaping marijuana/THC is more common than vaping nicotine or
tobacco substitutes.
Three perceived attributes of vaping and ingestion underlie the popularity of both methods among adolescents compared to smoking marijuana: (1) they are safer methods, (2) they are more socially acceptable, and (3) they are more discreet and make it easier to conceal and covertly use. 13,14,15,16,17,18 These perceived benefits of noncombustible marijuana products may be contributing to the observed decline in negative attitudes towards marijuana and the plateauing of trends in use prevalence on the Biennial State CHKS.
Critics warn that these attributes could result in earlier onset, more positive initial experiences, and higher use prevalence, especially among students who may be reluctant to smoke marijuana. The appeal of vaping devices in general may provide an alternative gateway to marijuana use among some students.19,20 Existing research on adolescents indicates that use of e-cigarettes to vaporize marijuana is more common than among adults and that the practice increases the risk of later initiation and current use of marijuana. In a Connecticut study of high school students, e-cigarette users were over three times more likely to vape marijuana than the total sample.21 MTF data indicates that e-cigarette users are more likely to be current marijuana users than youth who do not use e-cigarettes.22 About one quarter of e-cigarette users were concurrent marijuana users and adolescent e-cigarette users who had never smoked conventional cigarettes were particularly more likely than non-e-cigarette users to be current marijuana users.
The Seventeenth Biennial State CHKS data cannot be used to determine the effect of vaping and ingesting on overall use or whether their popularity is expanding the prevalence of marijuana use. That the percentage for ever-using all three methods was almost half the percentage for ever-using marijuana suggests a diversification effect, in that many users vape and/or ingest in addition to smoking. But it is unclear whether youth who only use noncombustibles are substituting them for smoking or they represent a new user population. Research on how
Marijuana Use Among California Secondary Students, Volume 1 2017/19
17
noncombustible marijuana use affects overall prevalence is still limited. Trend analysis of national MTF data (2015-2018) for 12th graders showed that vaping and edible use increased as marijuana smoking decreased.23 On the 2019 MTF, marijuana vaping increased significantly and substantially in 2019 in all grades.24 Among 12th graders marijuana vaping exhibited the second largest absolute increase ever measured for any substance monitored by MTF. Yet overall marijuana use did not increase.25 This suggests a substitution effect.
Little is known about the factors that influence vaping and ingesting marijuana among adolescents, the effects of these practices, and how prevention and treatment efforts may need to be adjusted to address the needs of youth who primarily, even exclusively, used these modes of consumption, especially oral ingestion. Methods other than smoking may carry differential risks for initiation and escalation of use as well as adverse effects.26 The evidence that does exist suggests these noncombustible methods may increase the frequency and level of use and use-related problems. Onset of marijuana use is earlier, and lifetime and current use is higher among edible users than smokers.27 Analysis of MTF data indicate that daily marijuana use is more common among students who vaped and ingested it in the past year than smokers and suggests that noncombustible marijuana use might be an identifier of heavy users.28 Adolescents may use vaping to increase the frequency and intensity of use because it is easier to conceal in locations where smoking it would carry high risk of getting caught (such as in school).29
The ease to which edibles can be covertly used raises the question of what role they may have played in the one-point increase in marijuana use on school property in every grade on the 2017/19 Biennial State CHKS, after major declines between 2011/13 and 2015/17. Prior research has found that edible users are more likely to use, and use frequently, on school property than marijuana users who do not use edibles because it leaves no odor.30, 31
Gaining a better understanding of the scope and nature of vaping and ingesting marijuana is particularly important given their potential for adverse effects. Despite their reputation for safety, their availability raises numerous concerns regarding their potential for adverse effects and overdosing due to their delayed intoxicating effects, interactions with other drugs, variability in dosages, high potency, and lack of quality control and safety standards.32,33,34,35 The reports that vaping marijuana can contribute to severe pulmonary injury, pneumonia, and acute respiratory failure has attracted the attention of the medical community.36 Edible marijuana has been attributed as the reason for the majority of the increases in health care visits for marijuana intoxication following the enactment of Colorado’s recreational marijuana law (RML).37,38 In general, there is little understanding and guidance on how to safely use edibles.39
The role of Legalization of Adult Recreational Use
Data collection on the Seventeenth Biennial State CHKS began one year following the passage in November 2016 of Proposition 64, the Adult Use of Marijuana Act (AUMA), officially the Control, Regulate and Tax Adult Use of Marijuana Act. Opponents of liberalization of adult marijuana use, particularly RMLs, have argued that it sends a wrong signal to youth that marijuana use is not dangerous (decreases perceptions of harm) and it increases access to it, thereby leading to increases in youth acceptance and use.40, 41,42
Marijuana Use Among California Secondary Students, Volume 1 2017/19
18
It is unclear whether AUMA contributed to the halt in the decline in youth marijuana use and correlates of use. This question cannot be answered with any certainty with CHKS cross-sectional data, particularly within such a short time-period since the legislation was enacted, although the long-running campaign for passage of AUMA could have influenced adolescent attitudes and behaviors before 2016. The findings are consistent with the observation that a weakening of negative attitudes toward marijuana related to RML would more likely occur among younger than older adolescents with more well-established attitudes.43 Coupled with concerns that the perceived benefits of noncombustibles will lower the age of initiation, the results suggest that increases in marijuana use may be apparent for this cohort in 2019/21.
The data on availability is also suggestive regarding the consequences of AUMA. Almost half of 11th graders reported that marijuana is easily available, ending the previous decline on this indicator, and almost one-fifth reported that their peers usually get marijuana from dispensaries. This suggests that the expanding adult retail market may be influencing current and future use among adolescents. However, very little is known about the potential influence of adolescents’ exposure to marijuana dispensaries, recreational outlets, and marketing, or the mechanisms through which such exposure may affect their marijuana use. Some studies have found positive associations between densities of medical marijuana dispensaries and marijuana use among adults.44,45 Evidence regarding adolescents is inconclusive, with mixed results across studies.46,47,48,49 Overall, research does not indicate that RML is associated with a major increase in adolescent marijuana use. State-specific research has occurred primarily in Colorado and Washington, the first two states to enact RML in 2012, and in Oregon, which enacted it in 2014. Most of the data from Colorado50,51 and Washington52,53 indicate no overall increase, although one study54 did find grade-level differences with an increase among 12th graders and a decrease among 8th graders (see also Cerdá and colleagues research summarized below).
Studies in Oregon have had even more mixed results, one study finding an increase in adolescent use55 and another finding no increase in the initiation of marijuana use but an increase among youth who were already using.56 Another study found no increase in overall use in a sample of adolescents in an intervention program but higher rates of negative consequences of use among a post-RML sample.57
Cerdá et al. (2017) examined changes in past 30-day marijuana use before (2010–2012) vs. after (2013–2015) enactment of RMLs in Washington and Colorado using a difference-in-difference analysis of Monitoring the Future data.58 They found a modest but statistically significant increase in use among 8th and 10th graders in Washington relative to those in non-RML states. Increases were not observed among Washington 12th graders nor among students in any grade level in Colorado.
Cerda and colleagues provide an explanation for the differences in results between the two states that may have relevance for California. They attribute the lack of any increase in Colorado, in contrast to Washington, to the prior effect on attitudes of established medical marijuana use. This might suggest that the effect of RML on adolescent marijuana use in California would be expected to be minimal due to the availability of medical marijuana 20 years prior to AUMA. But as shown in Exhibit 1, the passage of the Medical Marijuana Initiative (Proposition 215), in November 1996 was followed by a period of declining use.
Marijuana Use Among California Secondary Students, Volume 1 2017/19
19
RML and, prior to it, medical marijuana legalization (MML), may be a contributing factor in the rise in use of vaping devices and edibles among adolescents. One potential adverse effect of legalization is the proliferation of alternative products, particularly edibles, through the retail market. Research shows that use of alternative products is higher among youth in MML and RML states with expanded retail markets.59, 60,61,62 Even before RML in California, high school students were obtaining edibles from other students who had a medical marijuana card and from dispensaries, as well as other students who made them. As noted, however, the impact of the spread of noncombustible use on overall marijuana use prevalence is still not clear.
Overall, little currently can be concluded with certainty at this time about the effects of RML in California or elsewhere. On-going monitoring of adolescent use, attitudes, and access is clearly needed, particularly in the context of the weakening in negative attitudes and stall in the decline in perceived availability found in this study. Research does indicate that the impact may be complex and that there is a need to study that impact on variations in use among students based on their age/grade, prior use, and prior conditions.63
Conclusion The Seventeenth Biennial State CHKS indicates that marijuana use among California secondary students is at an historic low but declines since 2011/13 appear to have leveled off in 2017/19. The survey questions asking about marijuana use were changed in 2017/18 to better capture the increasingly diverse ways of consuming marijuana (smoking, vaping, eating, or drinking). This change adds a degree of uncertainty to interpreting trends in marijuana use, but concomitant declines in perceived harmfulness and personal, parental, and peer disapproval of marijuana use are consistent with the diminution of the downward trend in use in 2017/19. Two inter-related factors may be contributing to these changes in attitudes and use: the rise in vaping and ingesting marijuana, as documented by this survey, and the legalization of adult recreational use.
The implications of the rise in vaping and consumption of ingestibles is still poorly understood, but evidence suggests their attributes and perceived benefits may be reducing perceived harmfulness and disapproval, lowering age of initiation, expanding the user population, and increasing use frequency and related problems. Future research should focus on assessing the etiology, user characteristics, and short- and long-term impacts of the different modes and combinations of consumption, and whether these alternative modes of use may require different approaches to prevention and intervention.
The legalization of adult recreational use and the expansion of the retail market, which itself has been identified as a factor in the rise of noncombustible products, may also be contributing to the decline in use disapproval, particularly by parents.
The cross-sectional data in this survey provides little guidance into how changes in use and changes in attitudes, availability, or other putative influences are related, or in the reasons why they change. Despite these uncertainties, the results overall paint a picture of adolescent marijuana use that has become more complex in ways that may have implications for prevention and intervention. How the adolescent marijuana culture is changing and whether these Biennial State CHKS results portent future increases in use require ongoing investigation at both the state

Marijuana Use Among California Secondary Students, Volume 1 2017/19
20
and local levels. Minimally, these results direct both the research and prevention communities to devote attention toward better understanding and addressing adolescent marijuana use.
This report’s companion study examines how key Biennial State CHKS results vary based on levels of current marijuana use. It provides further insight into the characteristics of current users and the adverse use-related and other school, behavioral, and personal problems they experience. It includes a discussion of the prevention and intervention implications of survey results, including strategies schools might implement in collaboration with public health and community agencies.

Marijuana Use Among California Secondary Students, Volume 1 2017/19
21
Appendix A: Tables of Results 1. Survey Samples
Table 1.1 Student Sample Characteristics
7th 11/13
7th 13/15
7th 15/17
7th 17/19
9th 11/13
9th 13/15
9th 15/17
9th 17/19
11th 11/13
11th 13/15
11th 15/17
11th 17/19
Student Sample Size Number of Districts 48 41 43 39 50 42 44 37 54 43 45 40 Number of Schools 49 48 51 50 53 52 53 53 60 57 60 62 Number of Students 11,286 7,763 13,451 11,536 14,563 14,951 16,826 17,551 13,087 13,859 14,987 16,761
Table 1.2 Student Sample for AOD Module
7th 11/13
7th 13/15
7th 15/17
7th 17/19
9th 11/13
9th 13/15
9th 15/17
9th 17/19
11th 11/13
11th 13/15
11th 15/17
11th 17/19
Student Sample Size
Number of Districts 25 28 43 36 33 30 44 38 36 29 44 40
Number of Schools 25 30 50 49 34 36 54 52 39 39 60 59
Number of Students 4,610 3,890 9,535 8,968 8,055 8,456 12,907 12,900 7,488 7,249 11,797 11,753
Marijuana Use Among California Secondary Students, Volume 1 2017/19
22
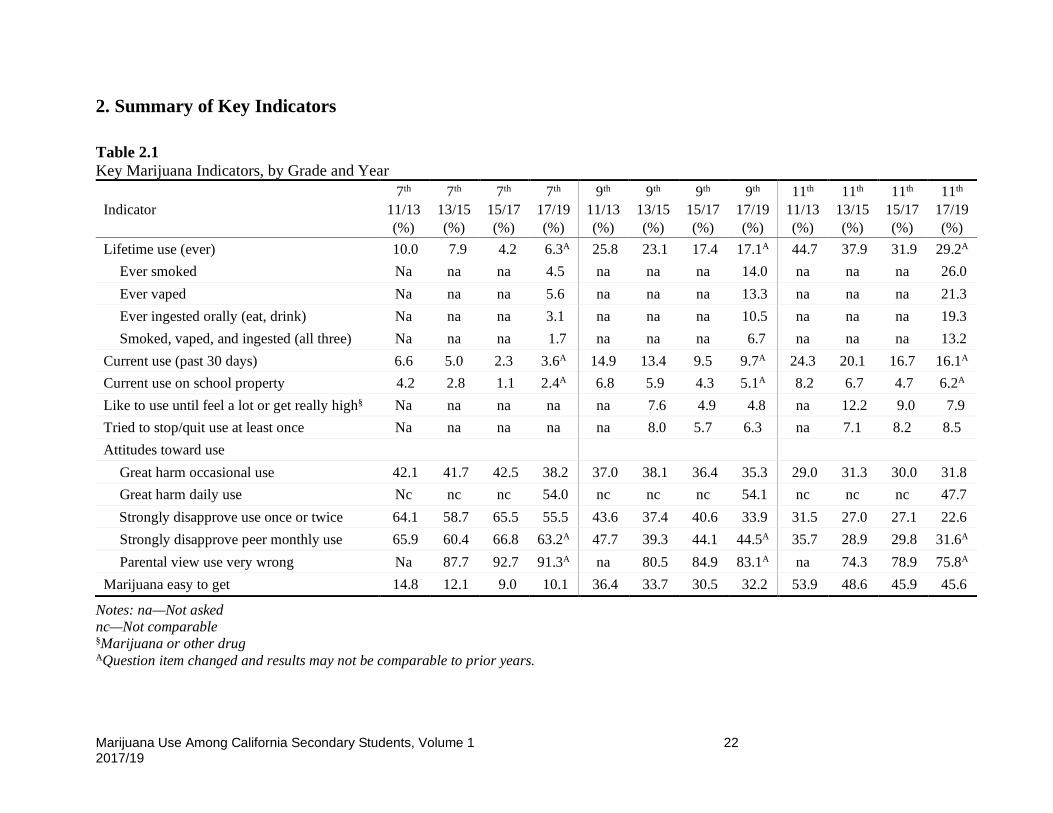
2. Summary of Key Indicators Table 2.1 Key Marijuana Indicators, by Grade and Year
Indicator 7th
11/13 (%)
7th 13/15 (%)
7th 15/17 (%)
7th 17/19 (%)
9th 11/13 (%)
9th 13/15 (%)
9th 15/17 (%)
9th 17/19 (%)
11th 11/13 (%)
11th 13/15 (%)
11th 15/17 (%)
11th 17/19 (%)
Lifetime use (ever) 10.0 7.9 4.2 6.3A 25.8 23.1 17.4 17.1A 44.7 37.9 31.9 29.2A Ever smoked Na na na 4.5 na na na 14.0 na na na 26.0 Ever vaped Na na na 5.6 na na na 13.3 na na na 21.3 Ever ingested orally (eat, drink) Na na na 3.1 na na na 10.5 na na na 19.3 Smoked, vaped, and ingested (all three) Na na na 1.7 na na na 6.7 na na na 13.2
Current use (past 30 days) 6.6 5.0 2.3 3.6A 14.9 13.4 9.5 9.7A 24.3 20.1 16.7 16.1A Current use on school property 4.2 2.8 1.1 2.4A 6.8 5.9 4.3 5.1A 8.2 6.7 4.7 6.2A Like to use until feel a lot or get really high§ Na na na na na 7.6 4.9 4.8 na 12.2 9.0 7.9 Tried to stop/quit use at least once Na na na na na 8.0 5.7 6.3 na 7.1 8.2 8.5 Attitudes toward use
Great harm occasional use 42.1 41.7 42.5 38.2 37.0 38.1 36.4 35.3 29.0 31.3 30.0 31.8 Great harm daily use Nc nc nc 54.0 nc nc nc 54.1 nc nc nc 47.7 Strongly disapprove use once or twice 64.1 58.7 65.5 55.5 43.6 37.4 40.6 33.9 31.5 27.0 27.1 22.6 Strongly disapprove peer monthly use 65.9 60.4 66.8 63.2A 47.7 39.3 44.1 44.5A 35.7 28.9 29.8 31.6A Parental view use very wrong Na 87.7 92.7 91.3A na 80.5 84.9 83.1A na 74.3 78.9 75.8A
Marijuana easy to get 14.8 12.1 9.0 10.1 36.4 33.7 30.5 32.2 53.9 48.6 45.9 45.6
Notes: na—Not asked nc—Not comparable §Marijuana or other drug AQuestion item changed and results may not be comparable to prior years.
Marijuana Use Among California Secondary Students, Volume 1 2017/19
23
3. Use Prevalence, Frequency, and Patterns
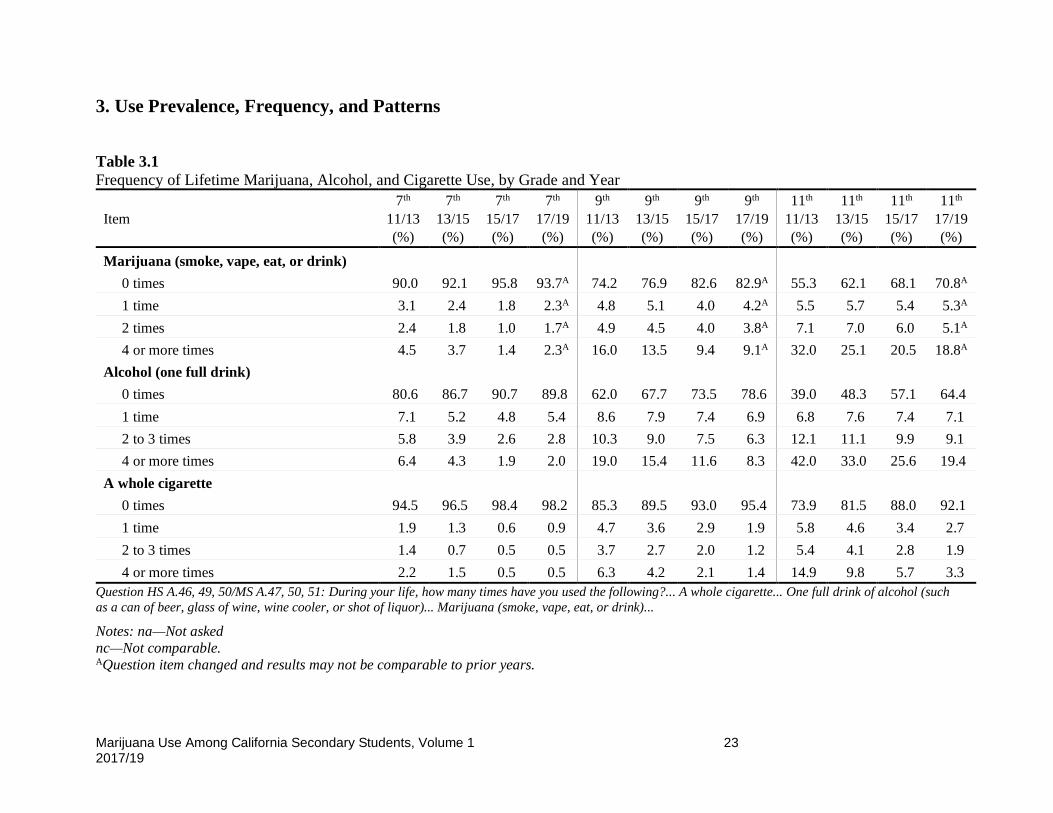
Table 3.1 Frequency of Lifetime Marijuana, Alcohol, and Cigarette Use, by Grade and Year
Item 7th
11/13 (%)
7th 13/15 (%)
7th 15/17 (%)
7th 17/19 (%)
9th 11/13 (%)
9th 13/15 (%)
9th 15/17 (%)
9th 17/19 (%)
11th 11/13 (%)
11th 13/15 (%)
11th 15/17 (%)
11th 17/19 (%)
Marijuana (smoke, vape, eat, or drink) 0 times 90.0 92.1 95.8 93.7A 74.2 76.9 82.6 82.9A 55.3 62.1 68.1 70.8A 1 time 3.1 2.4 1.8 2.3A 4.8 5.1 4.0 4.2A 5.5 5.7 5.4 5.3A 2 times 2.4 1.8 1.0 1.7A 4.9 4.5 4.0 3.8A 7.1 7.0 6.0 5.1A 4 or more times 4.5 3.7 1.4 2.3A 16.0 13.5 9.4 9.1A 32.0 25.1 20.5 18.8A Alcohol (one full drink) 0 times 80.6 86.7 90.7 89.8 62.0 67.7 73.5 78.6 39.0 48.3 57.1 64.4 1 time 7.1 5.2 4.8 5.4 8.6 7.9 7.4 6.9 6.8 7.6 7.4 7.1 2 to 3 times 5.8 3.9 2.6 2.8 10.3 9.0 7.5 6.3 12.1 11.1 9.9 9.1 4 or more times 6.4 4.3 1.9 2.0 19.0 15.4 11.6 8.3 42.0 33.0 25.6 19.4 A whole cigarette 0 times 94.5 96.5 98.4 98.2 85.3 89.5 93.0 95.4 73.9 81.5 88.0 92.1 1 time 1.9 1.3 0.6 0.9 4.7 3.6 2.9 1.9 5.8 4.6 3.4 2.7 2 to 3 times 1.4 0.7 0.5 0.5 3.7 2.7 2.0 1.2 5.4 4.1 2.8 1.9 4 or more times 2.2 1.5 0.5 0.5 6.3 4.2 2.1 1.4 14.9 9.8 5.7 3.3
Question HS A.46, 49, 50/MS A.47, 50, 51: During your life, how many times have you used the following?... A whole cigarette... One full drink of alcohol (such as a can of beer, glass of wine, wine cooler, or shot of liquor)... Marijuana (smoke, vape, eat, or drink)...
Notes: na—Not asked nc—Not comparable. AQuestion item changed and results may not be comparable to prior years.

Marijuana Use Among California Secondary Students, Volume 1 2017/19
24
Table 3.2 Age of Onset—Marijuana, Alcohol and Tobacco, by Grade and Year (AOD Module B)
Item 7th
11/13 (%)
7th 13/15 (%)
7th 15/17 (%)
7th 17/19 (%)
9th 11/13 (%)
9th 13/15 (%)
9th 15/17 (%)
9th 17/19 (%)
11th 11/13 (%)
11th 13/15 (%)
11th 15/17 (%)
11th 17/19 (%)
Marijuana (smoke, eat, or drink) Never 91.3 92.7 96.1 93.7A 76.0 78.9 83.6 83.6A 56.7 62.3 69.0 70.4A 10 years or under 2.2 1.5 0.6 0.9A 2.6 2.6 1.3 1.3A 3.0 1.9 1.4 1.2A 11/12 years old 4.7 4.1 2.4 4.3A 5.6 3.9 3.7 3.4A 5.2 4.2 3.3 2.5A 13/14 years old 1.4 1.3 0.7 0.7A 13.1 11.8 9.8 10.2A 15.3 13.1 10.3 8.4A 15/16 years old 0.1 0.1 0.0 0.1A 2.1 2.1 1.4 1.2A 18.3 16.4 14.8 16.1A 17 years or older 0.3 0.2 0.2 0.3A 0.5 0.6 0.2 0.3A 1.6 2.1 1.2 1.3A Any other illegal drug or pill to get “high” Never 95.3 96.5 97.4 97.2 88.6 91.5 92.7 94.4 79.6 85.2 88.3 90.7 10 years or under 1.4 0.9 0.5 0.5 1.6 1.4 0.8 0.5 1.7 1.2 0.7 0.6 11/12 years old 2.3 1.7 1.3 1.6 2.5 1.4 1.4 1.2 2.5 1.4 1.2 0.8 13/14 years old 0.7 0.8 0.5 0.4 6.0 4.5 4.1 3.2 6.6 4.6 3.0 2.3 15/16 years old 0.1 0.1 0.0 0.0 1.1 0.8 0.8 0.4 8.8 6.7 6.2 4.9 17 years or older 0.2 0.1 0.2 0.3 0.3 0.4 0.2 0.3 0.8 0.9 0.6 0.7 Alcohol (one full drink) Never 75.2 78.8 83.6 81.2 56.3 61.1 67.7 71.2 35.7 42.6 52.1 56.8 10 years or under 11.0 9.0 8.2 9.5 9.7 8.5 7.5 7.3 8.1 6.5 6.2 6.5 11/12 years old 11.1 9.6 6.9 8.1 10.6 8.4 7.3 7.1 8.6 6.3 5.4 5.1 13/14 years old 2.1 2.4 1.1 0.8 20.3 18.0 15.0 12.8 19.6 16.5 13.8 10.5 15/16 years old 0.1 0.0 0.0 0.1 2.6 3.5 2.0 1.2 25.7 25.0 20.5 19.6 17 years or older 0.5 0.3 0.3 0.4 0.5 0.5 0.3 0.3 2.3 3.1 2.1 1.5
Question HS/MS B.1, 4, 5: About how old were you the first time you tried any of these things?... A drink of an alcoholic beverage (other than a sip or two)... Marijuana (smoke, eat, or drink)... Any other illegal drug or pill to get “high.”
Note: AQuestion item changed and results may not be comparable to prior years.
Marijuana Use Among California Secondary Students, Volume 1 2017/19
25
Table 3.2 Age of Onset—Marijuana, Alcohol and Tobacco, by Grade and Year (AOD Module B) - Continued
Item 7th
11/13 (%)
7th 13/15 (%)
7th 15/17 (%)
7th 17/19 (%)
9th 11/13 (%)
9th 13/15 (%)
9th 15/17 (%)
9th 17/19 (%)
11th 11/13 (%)
11th 13/15 (%)
11th 15/17 (%)
11th 17/19 (%)
Smoked part or all of a cigarette Never 90.1 93.5 95.8 95.7 81.6 87.0 90.3 92.9 68.8 77.6 84.2 88.0 10 years or under 3.8 2.1 1.7 1.7 3.9 2.9 2.2 1.7 4.1 2.7 2.3 2.1 11/12 years old 4.9 3.4 2.1 2.1 4.8 3.2 2.4 1.9 5.2 3.0 2.6 1.7 13/14 years old 0.8 0.8 0.2 0.3 8.3 5.6 4.3 3.0 9.1 6.5 4.2 3.1 15/16 years old 0.1 0.0 0.0 0.0 1.0 0.9 0.6 0.3 11.7 9.1 6.1 4.5 17 years or older 0.3 0.1 0.3 0.3 0.3 0.4 0.2 0.2 1.2 1.1 0.6 0.5 Electronic cigarette Never na na na 90.8 na na na 81.5 na na na 71.8 10 years or under na na na 1.8 na na na 1.3 na na na 0.9 11/12 years old na na na 6.1 na na na 4.0 na na na 2.8 13/14 years old na na na 1.0 na na na 11.8 na na na 8.4 15/16 years old na na na 0.0 na na na 1.1 na na na 14.8 17 years or older na na na 0.3 na na na 0.3 na na na 1.2
Question HS/MS B.2, 3: About how old were you the first time you tried any of these things?... Part or all of a cigarette... An electronic cigarette (e-cigarette or vaping device).
Note: na—Not asked..
Marijuana Use Among California Secondary Students, Volume 1 2017/19
26
Table 3.3 Lifetime Marijuana Consumption by Mode of Administration, by Grade and Year
Item 7th
11/13 (%)
7th 13/15 (%)
7th 15/17 (%)
7th 17/19 (%)
9th 11/13 (%)
9th 13/15 (%)
9th 15/17 (%)
9th 17/19 (%)
11th 11/13 (%)
11th 13/15 (%)
11th 15/17 (%)
11th 17/19 (%)
During your life, how many times have you used marijuana in any of the following ways...
Smoke it? 0 times na na na 95.5 na na na 86.0 na na na 74.0 1 time na na na 1.5 na na na 3.4 na na na 4.4 2 to 3 times na na na 1.3 na na na 3.0 na na na 4.8 4 or more times na na na 1.8 na na na 7.6 na na na 16.7 In an electronic or e-cigarette or other vaping device?
0 times na na na 94.4 na na na 86.7 na na na 78.7 1 time na na na 2.4 na na na 3.8 na na na 4.3 2 to 3 times na na na 1.4 na na na 3.3 na na na 4.1 4 or more times na na na 1.9 na na na 6.2 na na na 12.9 Eat or drink it in products made with marijuana?
0 times na na na 96.9 na na na 89.5 na na na 80.7 1 time na na na 1.4 na na na 3.9 na na na 5.8 2 to 3 times na na na 0.9 na na na 2.9 na na na 5.4 4 or more times na na na 0.8 na na na 3.6 na na na 8.0 Ever used marijuana in all three ways na na na 1.7 na na na 6.7 na na na 13.2
Question HS A.64-66/MS A.58-60: During your life, how many times have you used marijuana in any of the following ways... Smoke it?... In an electronic or e-cigarette or other vaping device?... Eat or drink it in products made with marijuana?
Note: na—Not asked.

Marijuana Use Among California Secondary Students, Volume 1 2017/19
27
Table 3.4 Summary of Current ATOD Use, Past 30 Days, by Grade and Year
Item 7th
11/13 (%)
7th 13/15 (%)
7th 15/17 (%)
7th 17/19 (%)
9th 11/13 (%)
9th 13/15 (%)
9th 15/17 (%)
9th 17/19 (%)
11th 11/13 (%)
11th 13/15 (%)
11th 15/17 (%)
11th 17/19 (%)
Marijuana (smoke, vape, eat, or drink) 6.6 5.0 2.3 3.6A 14.9 13.4 9.5 9.7A 24.3 20.1 16.7 16.1A
Alcohol (one or more drinks of alcohol) 11.2 8.2 5.1 4.2A 20.2 18.6 14.6 9.3A 33.0 29.1 22.5 16.0A
Binge drinking (5 or more drinks in a row) 5.2 3.4 1.2 1.3 11.4 9.6 6.0 4.4 22.1 17.6 11.6 8.5
Current cigarette smoking 4.5 2.8 1.0 0.8 6.8 5.0 2.6 1.5 11.8 8.5 4.3 2.4
Inhalants 5.0 3.3 1.1 1.5 4.7 3.6 2.0 1.7 4.8 3.8 1.8 1.2
Prescription drugs to get “high” or for reasons other than prescribed na na na na na 4.8 3.5 2.0 na 6.0 4.4 2.0
Other drug, pill, or medicine to get “high” or for reasons other than medical nc 2.8 1.5 1.4 nc 4.2 2.9 2.0 nc 5.0 2.9 2.0
Any drug use nc 6.8 3.7 4.6 nc 15.6 11.8 10.4 nc 21.9 18.6 16.6
Heavy drug use* nc 4.1 1.8 2.0 nc 10.3 6.8 5.8 nc 14.8 11.3 10.1
Any AOD use (excluding tobacco) nc 11.2 7.2 6.9 nc 24.3 19.7 14.6 nc 35.2 29.4 23.4
Two or more substances at the same time na na na na 6.6 5.7 3.3 2.7 11.6 9.5 6.1 4.7 Question HS A.70-76/MS A.64-68: During the past 30 days, on how many days did you use... one or more drinks of alcohol... five or more drinks of alcohol in a row, that is, within a couple of hours... marijuana (smoke, vape, eat, or drink)... inhalants (things you sniff, huff, or breathe to get “high”)... prescription drugs to get “high” or for reasons other than prescribed ... any other drug, pill, or medicine to get “high” or for reasons other than medical... two or more substances at the same time (for example, alcohol with marijuana, ecstasy with mushrooms)?
Notes: na—Not asked. nc—Not comparable. AQuestion item changed and results may not be comparable to prior years. *Heavy drug use was calculated based on pattern of combined current drug use on three or more days (marijuana, inhalants, prescription pain medicine to get “high” (high school only), or any other illegal drug/pill to get “high”).

Marijuana Use Among California Secondary Students, Volume 1 2017/19
28
Table 3.5 Frequency of Current Marijuana and Alcohol Use, Past 30 Days, by Grade and Year
Item 7th
11/13 (%)
7th 13/15 (%)
7th 15/17 (%)
7th 17/19 (%)
9th 11/13 (%)
9th 13/15 (%)
9th 15/17 (%)
9th 17/19 (%)
11th 11/13 (%)
11th 13/15 (%)
11th 15/17 (%)
11th 17/19 (%)
Marijuana (smoke, vape, eat, or drink) 0 days 93.4 95.0 97.7 96.4A 85.1 86.6 90.5 90.3A 75.7 79.9 83.3 83.9A 1 or 2 days 3.2 2.3 1.4 2.3A 5.6 5.8 4.6 4.7A 8.4 7.8 7.4 6.8A 3 to 9 days 1.2 0.8 0.5 0.6A 3.5 2.9 2.1 2.0A 5.2 4.4 3.5 3.5A 10 to 19 days 0.7 0.5 0.2 0.3A 1.9 1.7 1.0 1.0A 3.1 2.6 1.8 1.8A 20 or more days 1.4 1.5 0.3 0.5A 3.8 3.0 1.8 2.0A 7.6 5.3 3.9 4.0A Alcohol (one or more drinks) 0 days 88.8 91.8 94.9 95.8 79.8 81.4 85.4 90.7 67.0 70.9 77.5 84.0 1 or 2 days 7.7 5.5 4.4 3.4 11.6 11.7 10.6 6.7 17.2 16.6 14.8 10.4 3 to 9 days 1.5 1.0 0.5 0.6 4.3 3.6 2.4 1.7 9.7 7.8 5.3 3.5 10 to 19 days 0.7 0.5 0.1 0.1 1.8 1.5 0.8 0.5 3.0 2.2 1.4 1.0 20 or more days 1.3 1.2 0.2 0.1 2.6 1.8 0.8 0.4 3.1 2.5 1.1 1.0 Binge drinking (5 or more drinks in a row)
0 days 94.8 96.6 98.8 98.7 88.6 90.4 94.0 95.6 77.9 82.4 88.4 91.5 1 or 2 days 2.9 1.7 0.9 1.0 6.1 5.0 3.9 2.8 11.0 9.5 6.8 4.9 3 to 9 days 0.9 0.5 0.2 0.2 2.3 2.2 1.1 0.9 6.3 4.8 3.1 2.2 10 to 19 days 0.5 0.4 0.1 0.1 1.0 1.0 0.5 0.3 2.3 1.4 0.9 0.6 20 or more days 1.0 0.8 0.1 0.0 1.9 1.4 0.5 0.3 2.5 1.9 0.8 0.7
Question HS A.70-72/MS A.64-66: During the past 30 days, on how many days did you use... one or more drinks of alcohol?... five or more drinks of alcohol in a row, that is, within a couple of hours?... marijuana (smoke, vape, eat, or drink)?
Note: AQuestion item changed and results may not be comparable to prior years.

Marijuana Use Among California Secondary Students, Volume 1 2017/19
29
Table 3.6 Current Marijuana Use, Past 30 Days, by Race/Ethnicity, by Grade and Year
Item 7th
11/13 (%)
7th 13/15 (%)
7th 15/17 (%)
7th 17/19 (%)
9th 11/13 (%)
9th 13/15 (%)
9th 15/17 (%)
9th 17/19 (%)
11th 11/13 (%)
11th 13/15 (%)
11th 15/17 (%)
11th 17/19 (%)
Hispanic or Latino 9.1 6.6 3.2 4.4 17.5 15.8 11.6 11.2 25.5 21.0 17.2 16.2 American Indian or Alaska Native 9.6 6.9 3.6 5.4 16.1 18.6 12.3 9.7 30.2 20.1 20.8 15.3 Asian 3.4 2.7 0.9 1.2 6.3 3.7 2.4 3.5 10.8 7.1 6.4 7.3 Black or African American 9.3 8.8 5.6 5.6 22.6 19.6 12.2 10.4 32.7 27.1 21.0 15.8 Native Hawaiian or Pacific Islander 8.4 7.8 3.8 7.5 13.9 13.1 9.0 11.8 24.1 22.4 19.5 16.4 White 4.0 2.8 0.8 2.2 12.4 11.3 8.1 9.3 25.1 21.7 17.8 18.0 Mixed (two or more) races 8.0 6.4 3.2 4.6 17.6 16.1 12.4 11.5 26.3 22.6 18.8 17.6
Question HS A.72/MS A.66: During the past 30 days, on how many days did you use... one or more drinks of alcohol?... marijuana (smoke, vape, eat, or drink)?
Table 3.7 Current Marijuana Use, Past 30 Days, by Gender, Grade, and Year
Female 11/13 (%)
Female 13/15 (%)
Female 15/17 (%)
Female 17/19 (%)
Male 11/13 (%)
Male 13/15 (%)
Male 15/17 (%)
Male 17/19 (%)
Grade 7 5.4 4.6 2.2 3.7 7.6 5.4 2.4 3.5 Grade 9 14.4 13.1 10.2 10.5 15.1 13.5 8.9 8.9 Grade 11 20.3 17.8 15.4 15.4 28.5 22.3 17.8 16.3
Question HS A.72/MS A.66: During the past 30 days, on how many days did you use... one or more drinks of alcohol?... marijuana (smoke, vape, eat, or drink)?
Marijuana Use Among California Secondary Students, Volume 1 2017/19
30
Table 3.8 Current AOD Use on School Property, Past 30 Days, by Grade and Year
Item 7th
11/13 (%)
7th 13/15 (%)
7th 15/17 (%)
7th 17/19 (%)
9th 11/13 (%)
9th 13/15 (%)
9th 15/17 (%)
9th 17/19 (%)
11th 11/13 (%)
11th 13/15 (%)
11th 15/17 (%)
11th 17/19 (%)
Marijuana (smoke, vape, eat, or drink) 0 days 95.8 97.2 98.9 97.6A 93.2 94.1 95.7 94.9A 91.8 93.3 95.3 93.8A 1 to 2 days 2.1 1.4 0.7 1.7A 3.0 2.8 2.2 2.6A 3.6 3.0 2.3 2.8A 3 or more days 2.1 1.4 0.4 0.7A 3.8 3.1 2.1 2.5A 4.7 3.8 2.4 3.4A Alcohol 0 days 94.8 96.8 98.3 97.9 93.4 94.3 95.8 96.5 93.3 94.4 96.2 96.5 1 to 2 days 3.3 2.2 1.3 1.6 3.9 3.4 2.9 2.5 3.7 3.2 2.7 2.4 3 or more days 1.8 1.0 0.4 0.5 2.8 2.3 1.3 1.0 3.0 2.5 1.1 1.1 Any other drug, pill, or medicine to get “high” or for reasons other than medical
0 days 96.8 98.0 98.8 98.9 95.9 96.5 97.4 98.3 95.2 96.1 97.7 98.4 1 to 2 days 1.8 1.2 0.8 0.7 1.9 1.6 1.5 0.9 2.0 1.6 1.3 0.8 3 or more days 1.3 0.9 0.4 0.4 2.1 1.9 1.1 0.8 2.8 2.2 1.0 0.8 Any of the Above 7.4 4.9 2.8 3.9 10.0 8.5 7.1 6.8 11.4 9.3 7.0 7.8
Question HS A.80-82/MS A.72-74: During the past 30 days, on how many days on school property did you use... at least one drink of alcohol?... marijuana (smoke, vape, eat, or drink)?... any other drug, pill, or medicine to get “high” or for reasons other than medical?
Note: AQuestion item changed and results may not be comparable to prior years.

Marijuana Use Among California Secondary Students, Volume 1 2017/19
31
Table 3.9 Usual Consumption Level of Marijuana or other Drugs, by Grade and Year (AOD Module B)
Item 7th
11/13 (%)
7th 13/15 (%)
7th 15/17 (%)
7th 17/19 (%)
9th 11/13 (%)
9th 13/15 (%)
9th 15/17 (%)
9th 17/19 (%)
11th 11/13 (%)
11th 13/15 (%)
11th 15/17 (%)
11th 17/19 (%)
I don’t use drugs na na na na na 81.3 85.3 86.4 na 69.7 74.7 76.2
Just enough to feel a little high na na na na na 5.2 5.2 4.9 na 7.7 7.3 6.9
Enough to feel it moderately na na na na na 5.8 4.6 3.8 na 10.3 9.0 9.0
Until I feel it a lot or get really high na na na na na 7.6 4.9 4.8 na 12.2 9.0 7.9 Question HS B.7: If you use marijuana or other drugs, how “high” (stoned, faded, wasted, trashed) do you usually like to get?
Note: na—Not asked.
Marijuana Use Among California Secondary Students, Volume 1 2017/19
32
Table 3.10 Cessation Attempts, by Grade and Year
Item 7th
11/13 (%)
7th 13/15 (%)
7th 15/17 (%)
7th 17/19 (%)
9th 11/13 (%)
9th 13/15 (%)
9th 15/17 (%)
9th 17/19 (%)
11th 11/13 (%)
11th 13/15 (%)
11th 15/17 (%)
11th 17/19 (%)
Marijuana – all respondents Does not apply, don’t use na na na na na 82.3 86.1 86.1 na 72.3 77.9 78.7 0 times na na na na na 9.6 8.1 7.6 na 16.6 13.9 12.9 1 time na na na na na 3.9 2.7 3.1 na 5.9 4.3 4.2 2 to 3 times na na na na na 2.2 1.7 1.6 na 3.2 2.1 2.4 4 or more times na na na na na 1.9 1.3 1.6 na 2.0 1.8 1.9 Marijuana – users 0 times na na na na na 54.5 58.7 54.7 na 59.9 62.9 60.3 1 time na na na na na 22.2 19.6 22.3 na 21.3 19.5 19.6 2 to 3 times na na na na na 12.5 12.3 11.5 na 11.6 9.5 11.2 4 or more times na na na na na 10.8 9.4 11.5 na 7.2 8.1 8.9 Alcohol – all respondents Does not apply, don’t use na na na na na 82.0 86.0 88.1 na 69.7 77.2 81.1 0 times na na na na na 12.0 9.9 8.0 na 22.7 17.5 13.9 1 time na na na na na 3.4 2.3 2.1 na 4.5 3.1 2.8 2 to 3 times na na na na na 1.5 1.0 0.8 na 1.9 1.2 1.2 4 or more times na na na na na 1.1 0.9 1.0 na 1.2 1.0 1.1 Alcohol - users 0 times na na na na na 66.7 70.2 67.2 na 74.9 76.8 73.2 1 time na na na na na 18.9 16.3 17.6 na 14.9 13.6 14.7 2 to 3 times na na na na na 8.3 7.1 6.7 na 6.3 5.3 6.3 4 or more times na na na na na 6.1 6.4 8.4 na 4.0 4.4 5.8
Question HS A.96, 97: How many times have you tried to quit or stop using... alcohol?... marijuana?
Note: na—Not asked.
Marijuana Use Among California Secondary Students, Volume 1 2017/19
33
4. Attitudes: Perceived Harm and Disapproval Table 4.1 Perceived Harm of AOD Use, by Grade and Year
Item 7th
11/13 (%)
7th 13/15 (%)
7th 15/17 (%)
7th 17/19 (%)
9th 11/13 (%)
9th 13/15 (%)
9th 15/17 (%)
9th 17/19 (%)
11th 11/13 (%)
11th 13/15 (%)
11th 15/17 (%)
11th 17/19 (%)
Marijuana - use occasionally Great 42.1 41.7 42.5 38.2A 37.0 38.1 36.4 35.3A 29.0 31.3 30.0 31.8A Moderate 22.3 22.3 21.2 19.9A 23.4 24.1 24.4 24.3A 20.2 20.2 21.2 22.0A Slight 10.5 10.7 10.3 9.1A 17.3 18.3 17.3 15.8A 24.2 22.8 22.2 19.3A None 25.1 25.3 26.0 32.8A 22.3 19.5 21.8 24.6A 26.7 25.7 26.6 26.8A Marijuana - use daily Great nc nc nc 54.0 nc nc nc 54.1 nc nc nc 47.7 Moderate nc nc nc 7.8 nc nc nc 14.7 nc nc nc 18.2 Slight nc nc nc 4.8 nc nc nc 8.8 nc nc nc 12.3 None nc nc nc 33.4 nc nc nc 22.3 nc nc nc 21.7 Alcohol - drink occasionally Great 28.5 26.6 29.3 27.7 29.2 31.5 30.9 31.9 26.0 30.4 30.6 32.7 Moderate 22.3 23.7 24.2 21.0 23.8 27.0 27.4 24.9 23.9 25.7 27.7 26.6 Slight 23.2 23.5 20.7 18.2 27.5 26.2 24.1 21.8 32.4 29.5 25.8 22.7 None 25.9 26.2 25.9 33.1 19.5 15.3 17.6 21.4 17.7 14.4 15.9 18.0 Alcohol - 5 or more drinks once or twice a week
Great 44.1 44.7 48.6 42.0 50.0 54.7 53.9 51.0 49.9 55.5 54.6 54.9 Moderate 22.2 21.6 18.7 17.6 24.2 24.2 22.4 21.3 26.4 25.5 24.9 22.0 Slight 9.6 9.9 7.7 7.9 10.1 9.5 8.8 7.9 11.6 10.0 9.3 8.2 None 24.2 23.9 24.9 32.5 15.7 11.5 14.9 19.7 12.1 8.9 11.2 14.9
Question HS A.87-90/MS A.79-82: How much do people risk harming themselves physically and in other ways when they do the following?... Drink alcohol (beer, wine, liquor ) occasionally... Have five or more drinks of alcohol once or twice a week... Use marijuana occasionally (smoke, vape, eat, or drink) ... Use marijuana daily.
Notes: nc—Not comparable; AQuestion item changed and results may not be comparable to prior years.
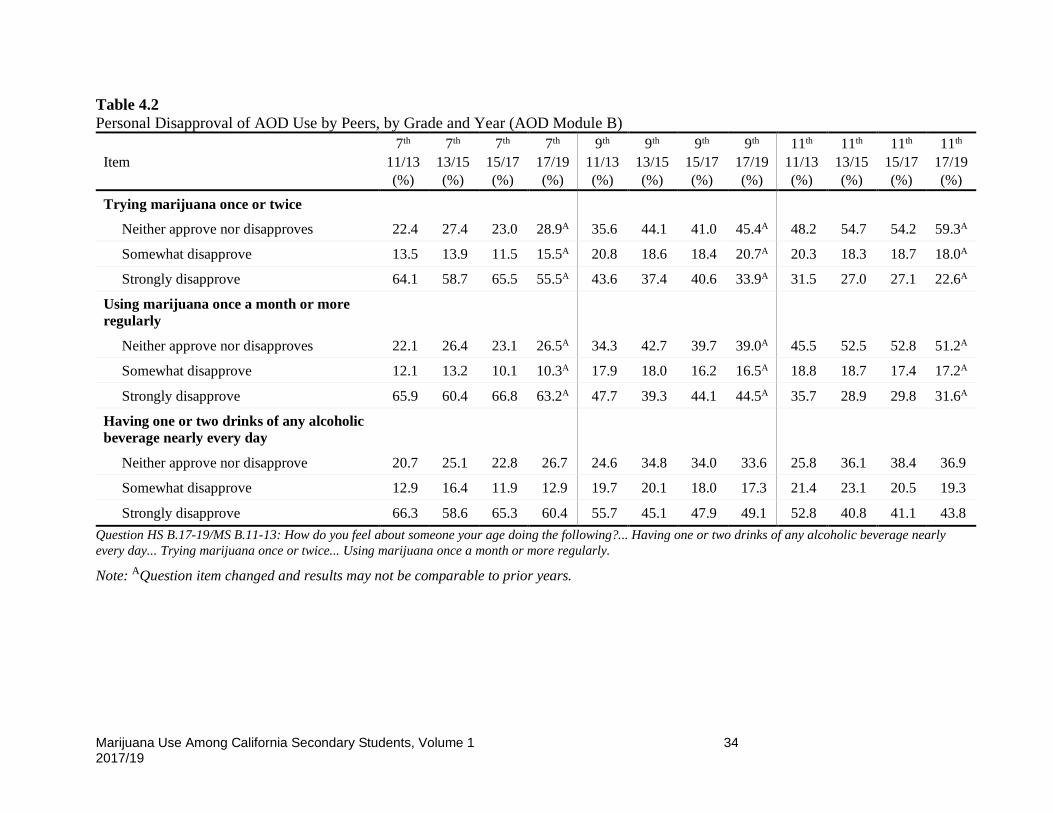
Marijuana Use Among California Secondary Students, Volume 1 2017/19
34
Table 4.2 Personal Disapproval of AOD Use by Peers, by Grade and Year (AOD Module B)
Item 7th
11/13 (%)
7th 13/15 (%)
7th 15/17 (%)
7th 17/19 (%)
9th 11/13 (%)
9th 13/15 (%)
9th 15/17 (%)
9th 17/19 (%)
11th 11/13 (%)
11th 13/15 (%)
11th 15/17 (%)
11th 17/19 (%)
Trying marijuana once or twice
Neither approve nor disapproves 22.4 27.4 23.0 28.9A 35.6 44.1 41.0 45.4A 48.2 54.7 54.2 59.3A
Somewhat disapprove 13.5 13.9 11.5 15.5A 20.8 18.6 18.4 20.7A 20.3 18.3 18.7 18.0A
Strongly disapprove 64.1 58.7 65.5 55.5A 43.6 37.4 40.6 33.9A 31.5 27.0 27.1 22.6A
Using marijuana once a month or more regularly
Neither approve nor disapproves 22.1 26.4 23.1 26.5A 34.3 42.7 39.7 39.0A 45.5 52.5 52.8 51.2A
Somewhat disapprove 12.1 13.2 10.1 10.3A 17.9 18.0 16.2 16.5A 18.8 18.7 17.4 17.2A
Strongly disapprove 65.9 60.4 66.8 63.2A 47.7 39.3 44.1 44.5A 35.7 28.9 29.8 31.6A
Having one or two drinks of any alcoholic beverage nearly every day
Neither approve nor disapprove 20.7 25.1 22.8 26.7 24.6 34.8 34.0 33.6 25.8 36.1 38.4 36.9
Somewhat disapprove 12.9 16.4 11.9 12.9 19.7 20.1 18.0 17.3 21.4 23.1 20.5 19.3
Strongly disapprove 66.3 58.6 65.3 60.4 55.7 45.1 47.9 49.1 52.8 40.8 41.1 43.8 Question HS B.17-19/MS B.11-13: How do you feel about someone your age doing the following?... Having one or two drinks of any alcoholic beverage nearly every day... Trying marijuana once or twice... Using marijuana once a month or more regularly.
Note: AQuestion item changed and results may not be comparable to prior years.

Marijuana Use Among California Secondary Students, Volume 1 2017/19
35
Table 4.3 Parent Disapproval of Respondent Use, by Grade and Year (AOD Module B)
Item 7th
11/13 (%)
7th 13/15 (%)
7th 15/17 (%)
7th 17/19 (%)
9th 11/13 (%)
9th 13/15 (%)
9th 15/17 (%)
9th 17/19 (%)
11th 11/13 (%)
11th 13/15 (%)
11th 15/17 (%)
11th 17/19 (%)
Use marijuana (smoke, eat, or drink) Very wrong na 87.7 92.7 91.3A na 80.5 84.9 83.1A na 74.3 78.9 75.8A Wrong na 6.6 4.0 5.0A na 10.6 8.2 9.7A na 13.3 11.3 12.8A A little wrong na 3.1 1.4 1.6A na 5.1 4.1 4.3A na 7.5 6.1 7.5A Not at all wrong na 2.7 1.8 2.1A na 3.8 2.8 3.0A na 4.9 3.7 3.9A Take one or two drinks of alcohol nearly every day Very wrong na 83.5 89.1 87.9 na 80.0 83.6 83.5 na 76.4 80.5 79.1 Wrong na 10.2 6.7 7.7 na 12.3 10.4 10.6 na 14.4 12.1 13.6 A little wrong na 3.6 2.4 2.3 na 4.8 3.9 3.6 na 5.7 4.8 4.8 Not at all wrong na 2.7 1.8 2.1 na 3.0 2.2 2.3 na 3.5 2.6 2.6 Smoke tobacco Very wrong na 88.7 93.5 92.4 na 85.0 89.1 88.0 na 81.5 87.1 86.1 Wrong na 7.3 3.9 4.9 na 9.6 7.5 8.4 na 12.0 9.2 10.3 A little wrong na 1.9 1.0 1.0 na 3.0 1.7 1.7 na 3.8 2.1 1.9 Not at all wrong na 2.0 1.6 1.7 na 2.4 1.7 1.8 na 2.7 1.7 1.8
Question HS B.22-24/MS B.16-18: How wrong do your parents or guardians feel it would be for you to do the following?... Take one or two drinks of alcohol nearly every day... Smoke tobacco... Use marijuana (smoke, eat, or drink).
Notes: na—Not asked. AQuestion item changed and results may not be comparable to prior years.
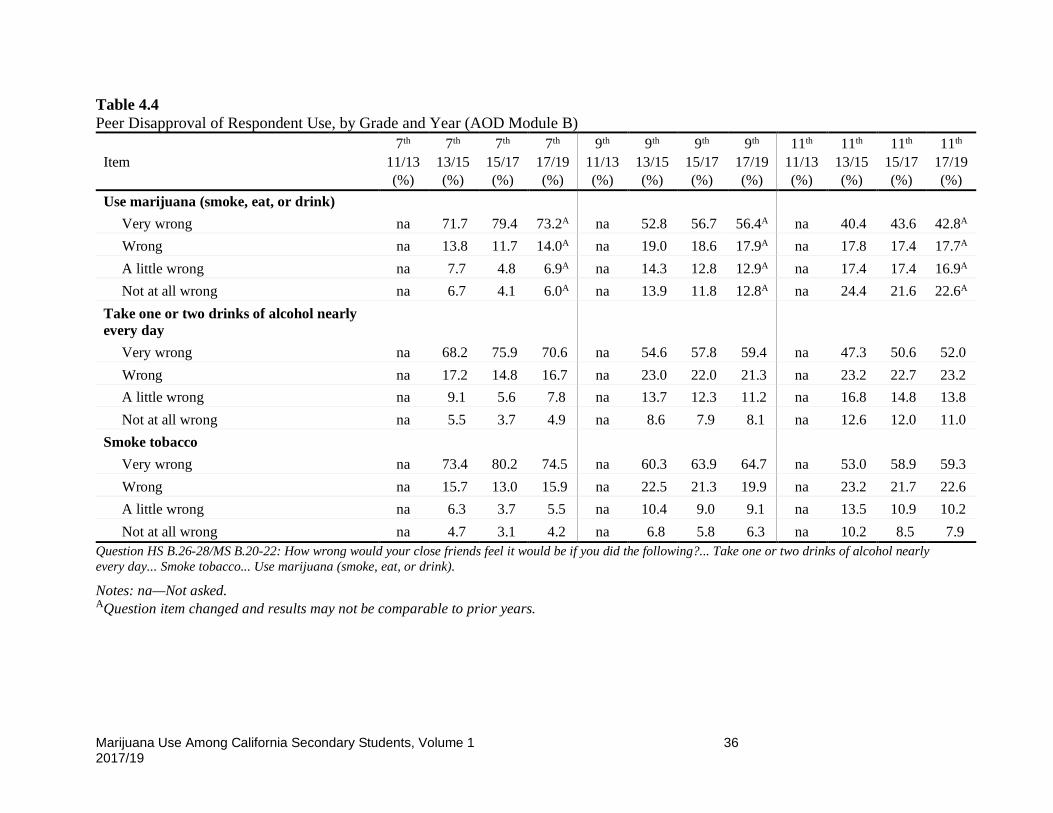
Marijuana Use Among California Secondary Students, Volume 1 2017/19
36
Table 4.4 Peer Disapproval of Respondent Use, by Grade and Year (AOD Module B)
Item 7th
11/13 (%)
7th 13/15 (%)
7th 15/17 (%)
7th 17/19 (%)
9th 11/13 (%)
9th 13/15 (%)
9th 15/17 (%)
9th 17/19 (%)
11th 11/13 (%)
11th 13/15 (%)
11th 15/17 (%)
11th 17/19 (%)
Use marijuana (smoke, eat, or drink) Very wrong na 71.7 79.4 73.2A na 52.8 56.7 56.4A na 40.4 43.6 42.8A Wrong na 13.8 11.7 14.0A na 19.0 18.6 17.9A na 17.8 17.4 17.7A A little wrong na 7.7 4.8 6.9A na 14.3 12.8 12.9A na 17.4 17.4 16.9A Not at all wrong na 6.7 4.1 6.0A na 13.9 11.8 12.8A na 24.4 21.6 22.6A Take one or two drinks of alcohol nearly every day Very wrong na 68.2 75.9 70.6 na 54.6 57.8 59.4 na 47.3 50.6 52.0 Wrong na 17.2 14.8 16.7 na 23.0 22.0 21.3 na 23.2 22.7 23.2 A little wrong na 9.1 5.6 7.8 na 13.7 12.3 11.2 na 16.8 14.8 13.8 Not at all wrong na 5.5 3.7 4.9 na 8.6 7.9 8.1 na 12.6 12.0 11.0 Smoke tobacco Very wrong na 73.4 80.2 74.5 na 60.3 63.9 64.7 na 53.0 58.9 59.3 Wrong na 15.7 13.0 15.9 na 22.5 21.3 19.9 na 23.2 21.7 22.6 A little wrong na 6.3 3.7 5.5 na 10.4 9.0 9.1 na 13.5 10.9 10.2 Not at all wrong na 4.7 3.1 4.2 na 6.8 5.8 6.3 na 10.2 8.5 7.9
Question HS B.26-28/MS B.20-22: How wrong would your close friends feel it would be if you did the following?... Take one or two drinks of alcohol nearly every day... Smoke tobacco... Use marijuana (smoke, eat, or drink).
Notes: na—Not asked. AQuestion item changed and results may not be comparable to prior years.
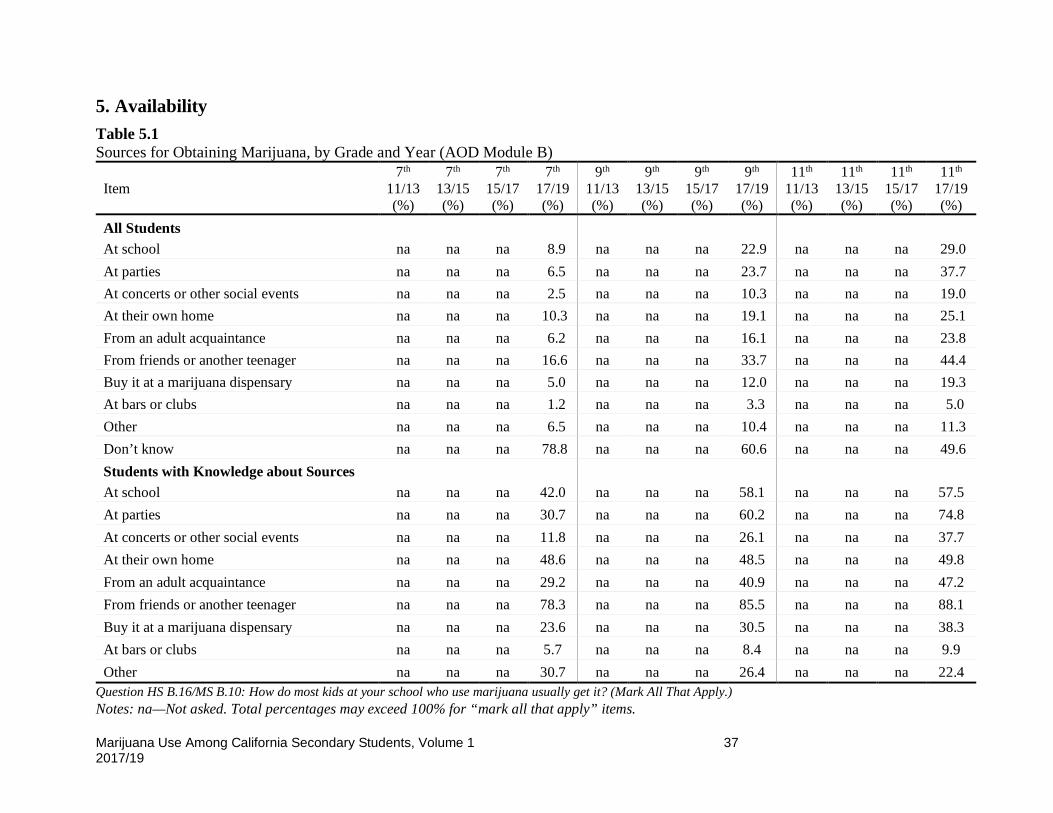
Marijuana Use Among California Secondary Students, Volume 1 2017/19
37
5. Availability Table 5.1 Sources for Obtaining Marijuana, by Grade and Year (AOD Module B)
Item 7th
11/13 (%)
7th 13/15 (%)
7th 15/17 (%)
7th 17/19 (%)
9th 11/13 (%)
9th 13/15 (%)
9th 15/17 (%)
9th 17/19 (%)
11th 11/13 (%)
11th 13/15 (%)
11th 15/17 (%)
11th 17/19 (%)
All Students At school na na na 8.9 na na na 22.9 na na na 29.0 At parties na na na 6.5 na na na 23.7 na na na 37.7 At concerts or other social events na na na 2.5 na na na 10.3 na na na 19.0 At their own home na na na 10.3 na na na 19.1 na na na 25.1 From an adult acquaintance na na na 6.2 na na na 16.1 na na na 23.8 From friends or another teenager na na na 16.6 na na na 33.7 na na na 44.4 Buy it at a marijuana dispensary na na na 5.0 na na na 12.0 na na na 19.3 At bars or clubs na na na 1.2 na na na 3.3 na na na 5.0 Other na na na 6.5 na na na 10.4 na na na 11.3 Don’t know na na na 78.8 na na na 60.6 na na na 49.6 Students with Knowledge about Sources At school na na na 42.0 na na na 58.1 na na na 57.5 At parties na na na 30.7 na na na 60.2 na na na 74.8 At concerts or other social events na na na 11.8 na na na 26.1 na na na 37.7 At their own home na na na 48.6 na na na 48.5 na na na 49.8 From an adult acquaintance na na na 29.2 na na na 40.9 na na na 47.2 From friends or another teenager na na na 78.3 na na na 85.5 na na na 88.1 Buy it at a marijuana dispensary na na na 23.6 na na na 30.5 na na na 38.3 At bars or clubs na na na 5.7 na na na 8.4 na na na 9.9 Other na na na 30.7 na na na 26.4 na na na 22.4
Question HS B.16/MS B.10: How do most kids at your school who use marijuana usually get it? (Mark All That Apply.) Notes: na—Not asked. Total percentages may exceed 100% for “mark all that apply” items.
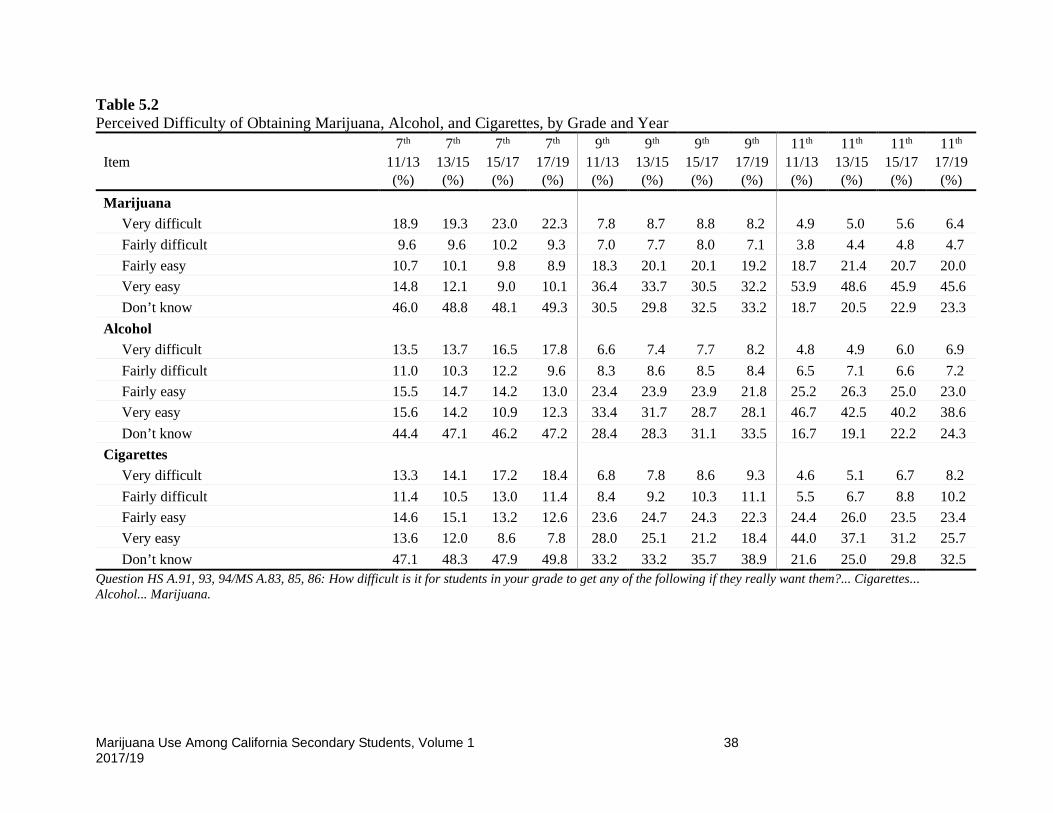
Marijuana Use Among California Secondary Students, Volume 1 2017/19
38
Table 5.2 Perceived Difficulty of Obtaining Marijuana, Alcohol, and Cigarettes, by Grade and Year
Item 7th
11/13 (%)
7th 13/15 (%)
7th 15/17 (%)
7th 17/19 (%)
9th 11/13 (%)
9th 13/15 (%)
9th 15/17 (%)
9th 17/19 (%)
11th 11/13 (%)
11th 13/15 (%)
11th 15/17 (%)
11th 17/19 (%)
Marijuana Very difficult 18.9 19.3 23.0 22.3 7.8 8.7 8.8 8.2 4.9 5.0 5.6 6.4 Fairly difficult 9.6 9.6 10.2 9.3 7.0 7.7 8.0 7.1 3.8 4.4 4.8 4.7 Fairly easy 10.7 10.1 9.8 8.9 18.3 20.1 20.1 19.2 18.7 21.4 20.7 20.0 Very easy 14.8 12.1 9.0 10.1 36.4 33.7 30.5 32.2 53.9 48.6 45.9 45.6 Don’t know 46.0 48.8 48.1 49.3 30.5 29.8 32.5 33.2 18.7 20.5 22.9 23.3 Alcohol Very difficult 13.5 13.7 16.5 17.8 6.6 7.4 7.7 8.2 4.8 4.9 6.0 6.9 Fairly difficult 11.0 10.3 12.2 9.6 8.3 8.6 8.5 8.4 6.5 7.1 6.6 7.2 Fairly easy 15.5 14.7 14.2 13.0 23.4 23.9 23.9 21.8 25.2 26.3 25.0 23.0 Very easy 15.6 14.2 10.9 12.3 33.4 31.7 28.7 28.1 46.7 42.5 40.2 38.6 Don’t know 44.4 47.1 46.2 47.2 28.4 28.3 31.1 33.5 16.7 19.1 22.2 24.3 Cigarettes Very difficult 13.3 14.1 17.2 18.4 6.8 7.8 8.6 9.3 4.6 5.1 6.7 8.2 Fairly difficult 11.4 10.5 13.0 11.4 8.4 9.2 10.3 11.1 5.5 6.7 8.8 10.2 Fairly easy 14.6 15.1 13.2 12.6 23.6 24.7 24.3 22.3 24.4 26.0 23.5 23.4 Very easy 13.6 12.0 8.6 7.8 28.0 25.1 21.2 18.4 44.0 37.1 31.2 25.7 Don’t know 47.1 48.3 47.9 49.8 33.2 33.2 35.7 38.9 21.6 25.0 29.8 32.5
Question HS A.91, 93, 94/MS A.83, 85, 86: How difficult is it for students in your grade to get any of the following if they really want them?... Cigarettes... Alcohol... Marijuana.
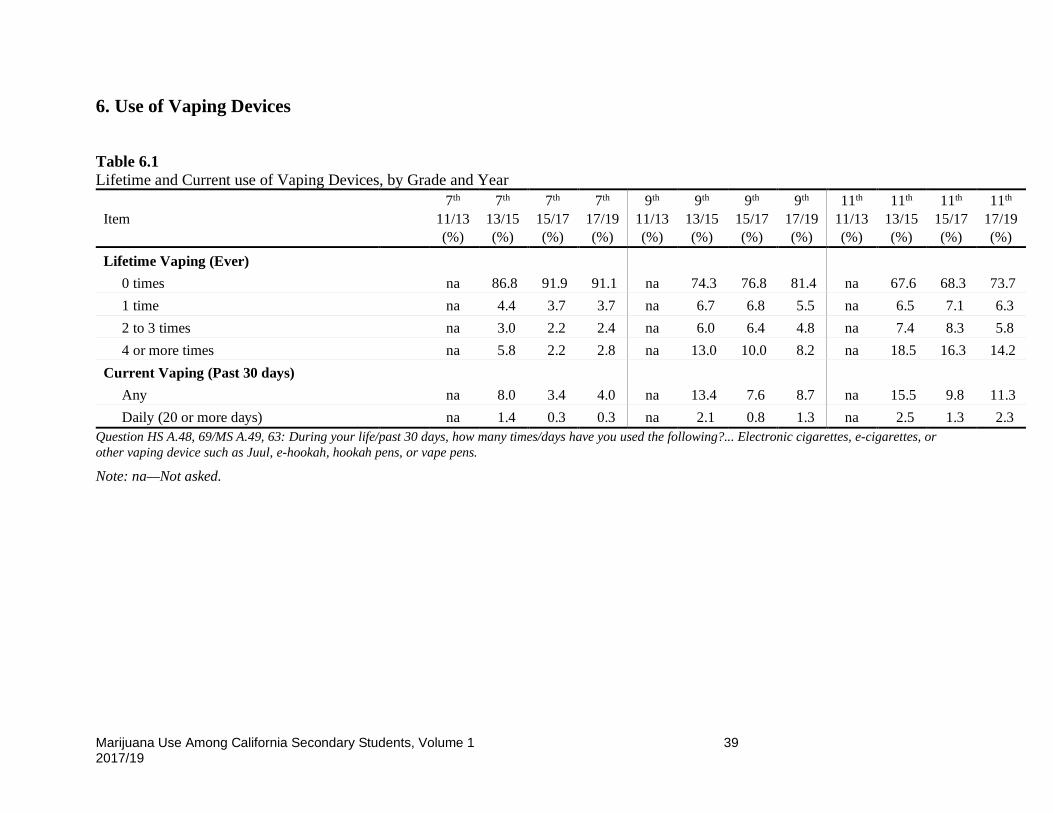
Marijuana Use Among California Secondary Students, Volume 1 2017/19
39
6. Use of Vaping Devices
Table 6.1 Lifetime and Current use of Vaping Devices, by Grade and Year
Item 7th
11/13 (%)
7th 13/15 (%)
7th 15/17 (%)
7th 17/19 (%)
9th 11/13 (%)
9th 13/15 (%)
9th 15/17 (%)
9th 17/19 (%)
11th 11/13 (%)
11th 13/15 (%)
11th 15/17 (%)
11th 17/19 (%)
Lifetime Vaping (Ever) 0 times na 86.8 91.9 91.1 na 74.3 76.8 81.4 na 67.6 68.3 73.7 1 time na 4.4 3.7 3.7 na 6.7 6.8 5.5 na 6.5 7.1 6.3 2 to 3 times na 3.0 2.2 2.4 na 6.0 6.4 4.8 na 7.4 8.3 5.8 4 or more times na 5.8 2.2 2.8 na 13.0 10.0 8.2 na 18.5 16.3 14.2 Current Vaping (Past 30 days) Any na 8.0 3.4 4.0 na 13.4 7.6 8.7 na 15.5 9.8 11.3 Daily (20 or more days) na 1.4 0.3 0.3 na 2.1 0.8 1.3 na 2.5 1.3 2.3
Question HS A.48, 69/MS A.49, 63: During your life/past 30 days, how many times/days have you used the following?... Electronic cigarettes, e-cigarettes, or other vaping device such as Juul, e-hookah, hookah pens, or vape pens.
Note: na—Not asked.
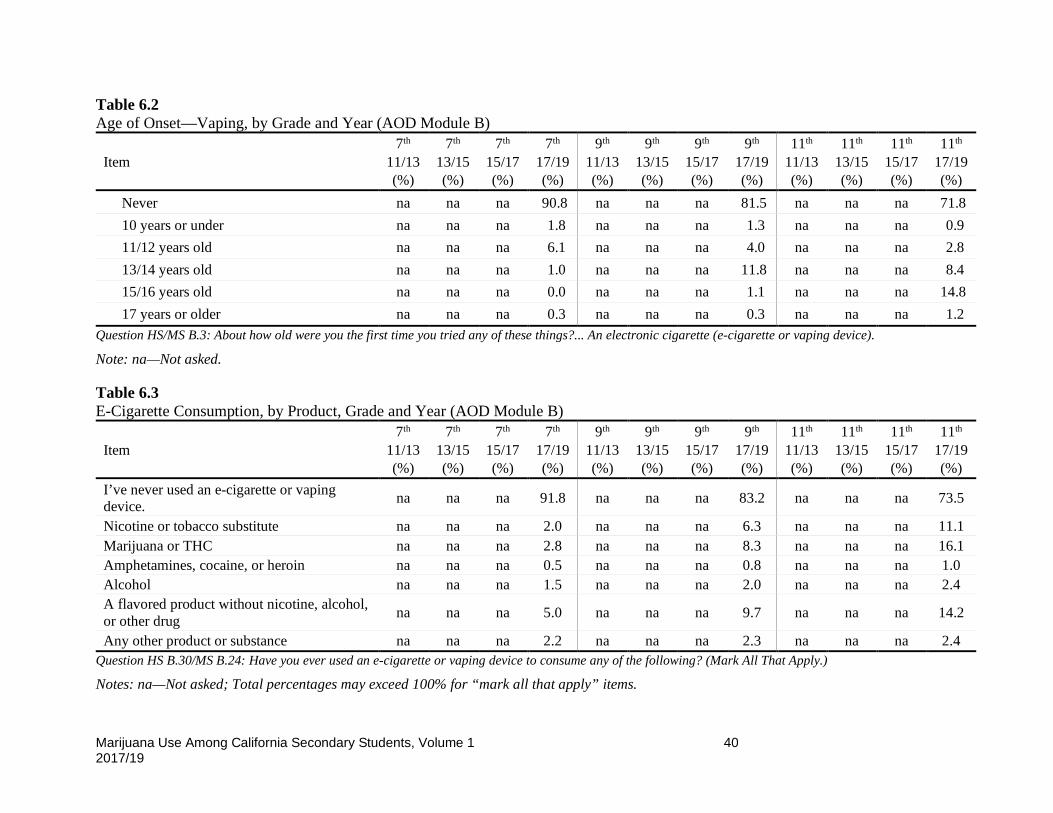
Marijuana Use Among California Secondary Students, Volume 1 2017/19
40
Table 6.2 Age of Onset—Vaping, by Grade and Year (AOD Module B)
Item 7th
11/13 (%)
7th 13/15 (%)
7th 15/17 (%)
7th 17/19 (%)
9th 11/13 (%)
9th 13/15 (%)
9th 15/17 (%)
9th 17/19 (%)
11th 11/13 (%)
11th 13/15 (%)
11th 15/17 (%)
11th 17/19 (%)
Never na na na 90.8 na na na 81.5 na na na 71.8 10 years or under na na na 1.8 na na na 1.3 na na na 0.9 11/12 years old na na na 6.1 na na na 4.0 na na na 2.8 13/14 years old na na na 1.0 na na na 11.8 na na na 8.4 15/16 years old na na na 0.0 na na na 1.1 na na na 14.8 17 years or older na na na 0.3 na na na 0.3 na na na 1.2
Question HS/MS B.3: About how old were you the first time you tried any of these things?... An electronic cigarette (e-cigarette or vaping device).
Note: na—Not asked.
Table 6.3 E-Cigarette Consumption, by Product, Grade and Year (AOD Module B)
Item 7th
11/13 (%)
7th 13/15 (%)
7th 15/17 (%)
7th 17/19 (%)
9th 11/13 (%)
9th 13/15 (%)
9th 15/17 (%)
9th 17/19 (%)
11th 11/13 (%)
11th 13/15 (%)
11th 15/17 (%)
11th 17/19 (%)
I’ve never used an e-cigarette or vaping device. na na na 91.8 na na na 83.2 na na na 73.5
Nicotine or tobacco substitute na na na 2.0 na na na 6.3 na na na 11.1 Marijuana or THC na na na 2.8 na na na 8.3 na na na 16.1 Amphetamines, cocaine, or heroin na na na 0.5 na na na 0.8 na na na 1.0 Alcohol na na na 1.5 na na na 2.0 na na na 2.4 A flavored product without nicotine, alcohol, or other drug na na na 5.0 na na na 9.7 na na na 14.2
Any other product or substance na na na 2.2 na na na 2.3 na na na 2.4 Question HS B.30/MS B.24: Have you ever used an e-cigarette or vaping device to consume any of the following? (Mark All That Apply.)
Notes: na—Not asked; Total percentages may exceed 100% for “mark all that apply” items.

Marijuana Use Among California Secondary Students, Volume 1 2017/19
41
Table 6.4 Perceived Difficulty of Obtaining E-Cigarettes, by Grade and Year
Item 7th
11/13 (%)
7th 13/15 (%)
7th 15/17 (%)
7th 17/19 (%)
9th 11/13 (%)
9th 13/15 (%)
9th 15/17 (%)
9th 17/19 (%)
11th 11/13 (%)
11th 13/15 (%)
11th 15/17 (%)
11th 17/19 (%)
Very difficult na na na 17.1 na na na 7.2 na na na 6.3 Fairly difficult na na na 10.2 na na na 6.8 na na na 5.7 Fairly easy na na na 13.5 na na na 21.7 na na na 22.6 Very easy na na na 11.5 na na na 31.3 na na na 39.0 Don’t know na na na 47.7 na na na 33.0 na na na 26.4
Question HS A. 92/MS A.84: How difficult is it for students in your grade to get any of the following if they really want them?... E-cigarettes (electronic) or vaping device
Note: na—Not asked.
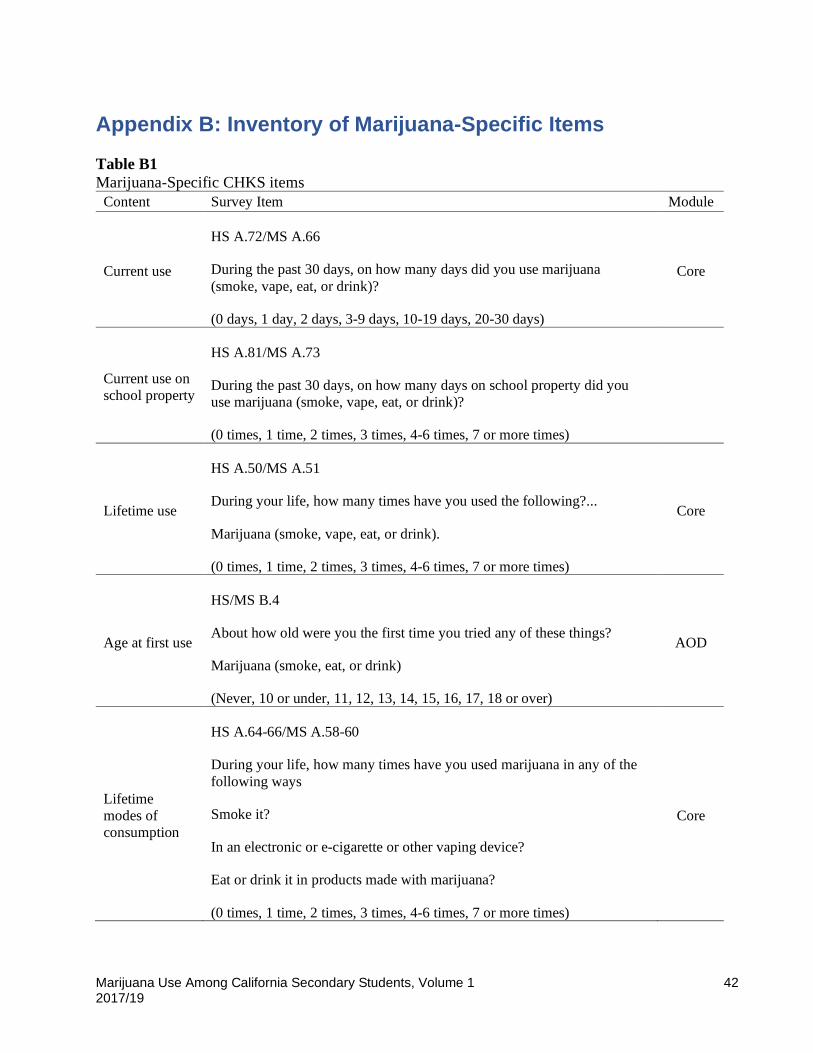
Marijuana Use Among California Secondary Students, Volume 1 2017/19
42
Appendix B: Inventory of Marijuana-Specific Items Table B1 Marijuana-Specific CHKS items
Content Survey Item Module
Current use
HS A.72/MS A.66
During the past 30 days, on how many days did you use marijuana (smoke, vape, eat, or drink)?
(0 days, 1 day, 2 days, 3-9 days, 10-19 days, 20-30 days)
Core
Current use on school property
HS A.81/MS A.73
During the past 30 days, on how many days on school property did you use marijuana (smoke, vape, eat, or drink)?
(0 times, 1 time, 2 times, 3 times, 4-6 times, 7 or more times)
Lifetime use
HS A.50/MS A.51
During your life, how many times have you used the following?...
Marijuana (smoke, vape, eat, or drink).
(0 times, 1 time, 2 times, 3 times, 4-6 times, 7 or more times)
Core
Age at first use
HS/MS B.4
About how old were you the first time you tried any of these things?
Marijuana (smoke, eat, or drink)
(Never, 10 or under, 11, 12, 13, 14, 15, 16, 17, 18 or over)
AOD
Lifetime modes of consumption
HS A.64-66/MS A.58-60
During your life, how many times have you used marijuana in any of the following ways
Smoke it?
In an electronic or e-cigarette or other vaping device?
Eat or drink it in products made with marijuana?
(0 times, 1 time, 2 times, 3 times, 4-6 times, 7 or more times)
Core
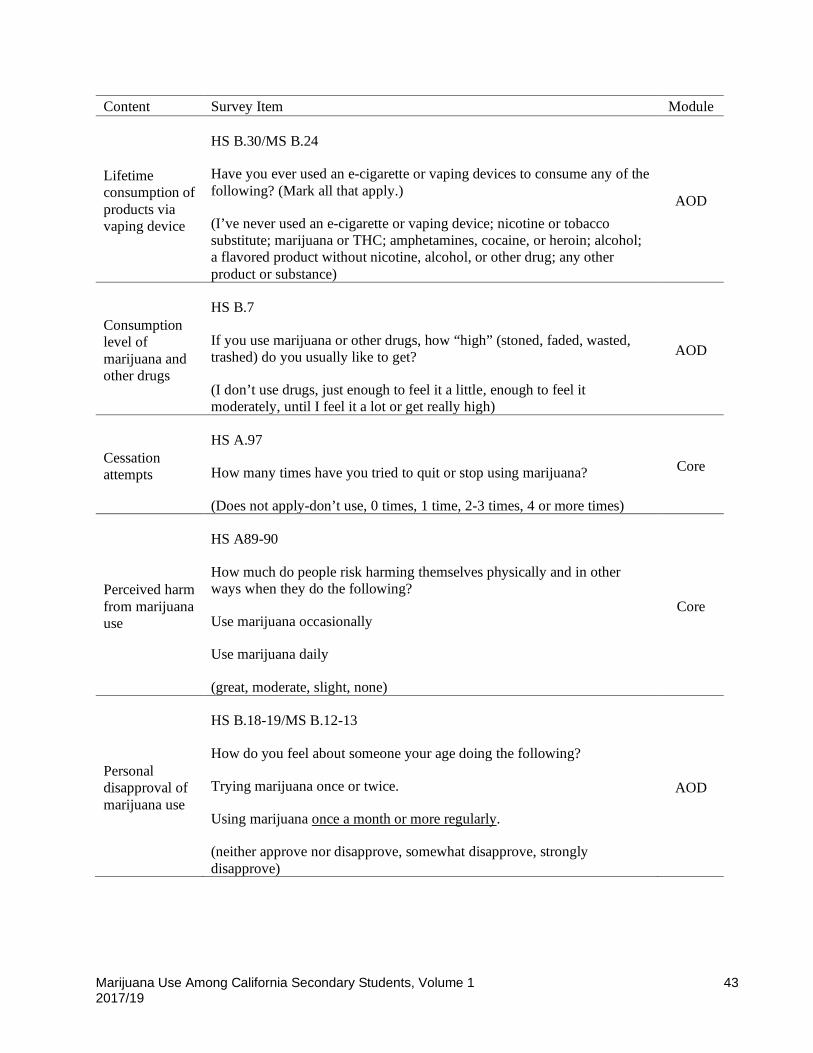
Marijuana Use Among California Secondary Students, Volume 1 2017/19
43
Content Survey Item Module
Lifetime consumption of products via vaping device
HS B.30/MS B.24
Have you ever used an e-cigarette or vaping devices to consume any of the following? (Mark all that apply.)
(I’ve never used an e-cigarette or vaping device; nicotine or tobacco substitute; marijuana or THC; amphetamines, cocaine, or heroin; alcohol; a flavored product without nicotine, alcohol, or other drug; any other product or substance)
AOD
Consumption level of marijuana and other drugs
HS B.7
If you use marijuana or other drugs, how “high” (stoned, faded, wasted, trashed) do you usually like to get?
(I don’t use drugs, just enough to feel it a little, enough to feel it moderately, until I feel it a lot or get really high)
AOD
Cessation attempts
HS A.97
How many times have you tried to quit or stop using marijuana?
(Does not apply-don’t use, 0 times, 1 time, 2-3 times, 4 or more times)
Core
Perceived harm from marijuana use
HS A89-90
How much do people risk harming themselves physically and in other ways when they do the following?
Use marijuana occasionally
Use marijuana daily
(great, moderate, slight, none)
Core
Personal disapproval of marijuana use
HS B.18-19/MS B.12-13
How do you feel about someone your age doing the following?
Trying marijuana once or twice.
Using marijuana once a month or more regularly.
(neither approve nor disapprove, somewhat disapprove, strongly disapprove)
AOD
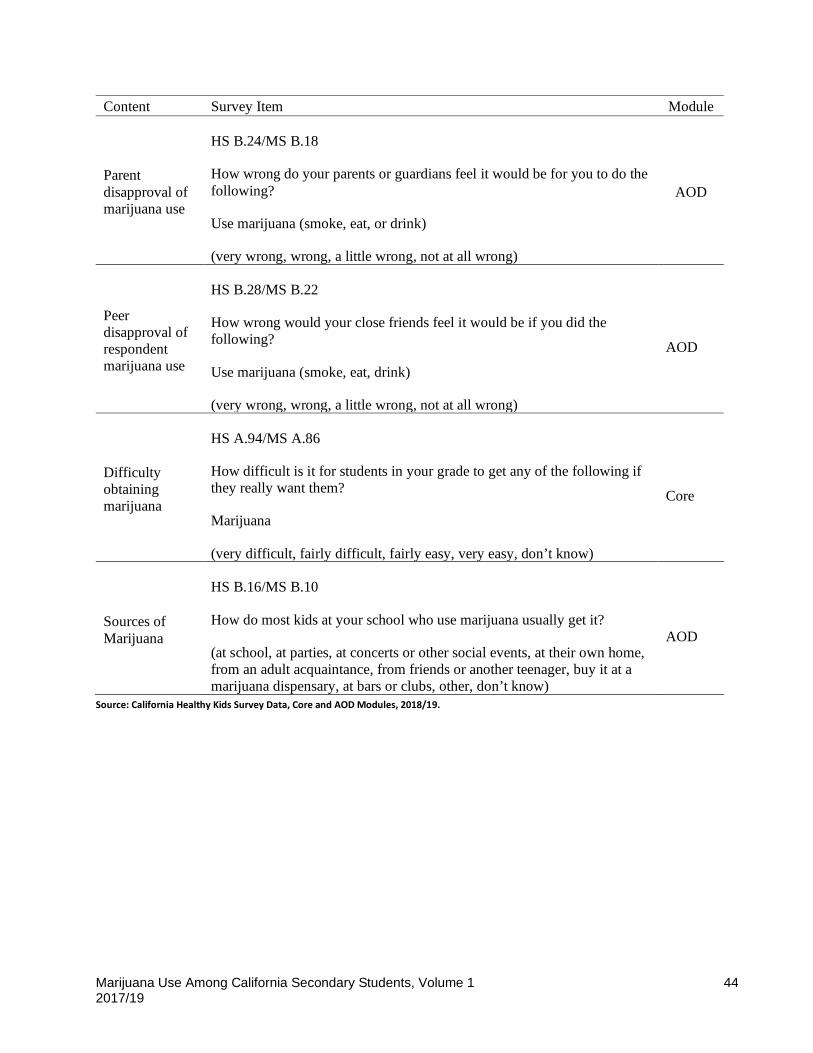
Marijuana Use Among California Secondary Students, Volume 1 2017/19
44
Content Survey Item Module
Parent disapproval of marijuana use
HS B.24/MS B.18
How wrong do your parents or guardians feel it would be for you to do the following?
Use marijuana (smoke, eat, or drink)
(very wrong, wrong, a little wrong, not at all wrong)
AOD
Peer disapproval of respondent marijuana use
HS B.28/MS B.22
How wrong would your close friends feel it would be if you did the following?
Use marijuana (smoke, eat, drink)
(very wrong, wrong, a little wrong, not at all wrong)
AOD
Difficulty obtaining marijuana
HS A.94/MS A.86
How difficult is it for students in your grade to get any of the following if they really want them?
Marijuana
(very difficult, fairly difficult, fairly easy, very easy, don’t know)
Core
Sources of Marijuana
HS B.16/MS B.10
How do most kids at your school who use marijuana usually get it?
(at school, at parties, at concerts or other social events, at their own home, from an adult acquaintance, from friends or another teenager, buy it at a marijuana dispensary, at bars or clubs, other, don’t know)
AOD
Source: California Healthy Kids Survey Data, Core and AOD Modules, 2018/19.

Marijuana Use Among California Secondary Students, Volume 1 2017/19
45
Endnotes 1 The full Biennial State CHKS report may be downloaded from calschls.org/reports.
2 The primary reasons for this modular difference in the sample size was because several large districts administered the Core Module in both survey years, and some of the schools that only administered the AOD Module were small. Data from schools that administered the Core Module two years in a row were weighted such that the weighted counts were equivalent to those obtained from one survey administration.
3 Reports of liking to drink until students felt it a lot or got really drunk were much lower, at 2% in 9th grade and 5% in 11th.
4 Although it is unclear why the AOD Module question resulted in lower rates of marijuana vaping than the Core Module question, the reason likely due to differences in question format. The question on the AOD Module asks which substances (e.g., nicotine or tobacco substitute, marijuana or THC, etc…) the respondent has ever consumed using an e-cigarette or vaping devices. A check-all-that-apply question format is used in which respondents are asked to select as many response options that apply to them. This type of question is known to be sensitive to primacy effects. On the Core Module, three questions (in matrix format) are included that ask how many times the respondent has used marijuana in her/his lifetime using different consumption methods: (1) smoking it, (2) in an electronic or e-cigarette or other vaping device, and (3) eating or drinking it. Sample differences are not likely to be responsible for the differences in marijuana vaping across the modules because estimates of lifetime marijuana use based on Core Module question are almost identical to those derived from the age of onset questions on the AOD Module.
5 In 2017/19, the words “or hashish” were deleted from this question as being out-of-date. This might have resulted in some decline in reported disapproval, but not likely of the magnitude of the declines across grades.
6 The word “regularly” was added to the item in 2017/19 to clarify the meaning of “using once a month or more.” Given the different trends across grades, the effect of this word addition is uncertain.
7 Although this question does not provide data on where respondents themselves may have obtained marijuana, respondents had the option of marking “don’t know.” The responses therefore come from students who believe they have knowledge about where their peers obtain marijuana (21%, 39%, and 50% in 7th, 9th, and 11th grade, respectively).
8 Kann, L., McManus, T., Harris, W.A., Shanklin, S.L., Flint, K.H., Queen, B., Lowry, M.D., et al. (2018). Youth risk behavior surveillance — United States, 2017. MMWR surveillance summaries, 67:1–114.
9 Johnston, L.D., Miech, R.A., O’Malley, P.M., Bachman, J.G., Schulenberg, J.E., & Patrick, M.E. (2020). Monitoring the Future national survey results on drug use 1975-2019: Overview, key findings on adolescent drug use. Ann Arbor: Institute for Social Research, University of Michigan. Retrieved from http://www.monitoringthefuture.org//pubs/monographs/mtf-overview2019.pdf.
10 Substance Abuse and Mental Health Services Administration. (2019). Key substance use and mental health indicators in the United States: Results from the 2018 National Survey on Drug Use and Health. Rockville, MD: Center for Behavioral Health Statistics and Quality, Substance Abuse and Mental Health Services Administration. Retrieved from https://www.samhsa.gov/data/.
11 Johnson, R.M. & Guttmannova, K. (2019). Marijuana use among adolescents and emerging adults in the midst of policy change: Introduction to the special issue. Prevention Science, 20:179–184.
12 Miech, R., Johnston, L., & O’Malley, P.M. (2017). Prevalence and attitudes regarding marijuana use among adolescents over the past decade. Pediatrics, 140:1-8.

Marijuana Use Among California Secondary Students, Volume 1 2017/19
46
13 Etter, J. (2015). Electronic cigarettes and cannabis: An exploratory study. European Addiction Research, 21:124-40.
14 Malouff, J.M., Rooke, S.E., & Copeland, J. (2014). Experiences of marijuana-vaporizer users. Substance Abuse, 35:127-128.
15 Schlienz, N.J., & Lee, D.C. (2018). Co-use of cannabis, tobacco, and alcohol during adolescence: Policy and regulatory implications. International Review of Psychiatry, 30:226-237.
16 Tormohlen, K.N., Brooks-Russell, A., Ma, M., Schneider, K.E., Levinson, A., & Johnson, R. (2019). Modes of marijuana consumption among Colorado high school students before and after the initiation of retail marijuana sales for adults. Journal of Studies on Alcohol and Drugs, 80:46-55.
17 MacCoun, R.J., & Mello, M.M. (2015). Half-Baked—The retail promotion of marijuana edibles. New England Journal of Medicine, 372:989-991.
18 Borodovsky, J.T., Lee, D.C., Crosier, B.S., Gabrielli, J.L., Sargent, J.D., & Budney, A.J. (2017). U.S. cannabis legalization and use of vaping and edible products among youth. Drug and Alcohol Dependence, 77:299‐306.
19 Eggers, M.E., Lee, Y.O., Jackson, K., Wiley, J.L., Porter, L., & Nonnemaker, J.M. (2017). Youth use of electronic vapor products and blunts for administering cannabis. Addictive Behaviors, 70:79‐82.
20 Borodovsky et al., 2017.
21 Morean, M. E., Kong, G., Camenga, D. R., Cavallo, D. A., & Krishnan-Sarin, S. (2015). High school students' use of electronic cigarettes to vaporize cannabis. Pediatrics, 136:611–616. See also: Audrain-McGovern, J., Stone, M.D., Barrington-Trimis, J., Unger, J.B., & Leventhal, A.M. (2018). Adolescent e-cigarette, hookah, and conventional cigarette use and subsequent marijuana use. Pediatrics, 142: 1-8.
22 Owotomo, O., & Maslowsky, J. (2017). Marijuana and e-cigarette use in a US national sample of 8th and 10th grade never-smokers of conventional cigarettes. Journal of Applied Research on Children: Informing Policy for Children at Risk, 8:1-17.
23 Patrick M.E., Miech R.A., Kloska D.D., Wagner A.C., & Johnston L.D. (2020). Trends in marijuana vaping and edible consumption from 2015 to 2018 among adolescents in the U.S. JAMA Pediatrics. Published online April 06,
24 Johnston et al., 2020.
25 Johnston et al., 2020.
26 Borodovsky et al., 2017.
27 Friese, B., Slater, M.D., & Battle, R.S. (2017). Use of marijuana edibles by adolescents in California. The Journal of Primary Prevention, 38:279-294.
28 Patrick et al., 2020.
29 Johnston et al., 2020.
30 Friese, B., Slater, M.D., Annechino, R., & Battle, R.S. (2016). Teen use of marijuana edibles: A focus group study of an emerging issue. The Journal of Primary Prevention, 37: 303–309.
31 Friese, Slater, & Battle, 2017.
32 Wang, J.B., Ramo, D.E., Lisha, N.E., & Cataldo, J.K. (2016). Medical marijuana legalization and cigarette and marijuana co-use in adolescents and adults. Drug and Alcohol Dependence, 166:32–38.
33 Borodovsky et al. 2017
34 Friese, Slater, & Battel, 2017.
Marijuana Use Among California Secondary Students, Volume 1 2017/19
47
35 Tormohlen et al., 2019.
36 Fryman, C., Lou, B., Weber, A.G., Steinberg, H.N., Khanijo, S., Iakovou, A., & Makaryus, M.R. (2020). Acute respiratory failure associated with vaping. Chest, 157: e63-e68.
37 Monte A.A., Zane R.D., & Heard K.J. (2015). The implications of marijuana legalization in Colorado. Journal of American Medical Association, 313: 241–242.
38 Barrus, D.G., Capogrossi, K.L., Cates, S.C., Gourdet, C.K., Peiper, N.C., Novak, S.P., Lefever, T.W., & Wiley, J.L. (2016). Tasty THC: Promises and challenges of cannabis edibles. Methods Report RTI Press, 1-22.
39 Doran, N., & Papadopoulos, A. (2019). Cannabis edibles: Behaviors, attitudes, and reasons for use. Environmental Health Review, 62:44-52. 40 Martins, S.S., Mauro, C.M., Santaella-Tenorio, J., Kim, J.H., Cerda, M., Keyes, K.M., Hasin, D.S., Galea, S., & Wall, M. (2016). State-level medical marijuana laws, marijuana use and perceived availability of marijuana among the general U.S. population. Drug and Alcohol Dependence, 169: 26–32.
41 Khatapous, S. & Hallfors, D. (2004). Sending the wrong message: Did medical marijuana legalization in California change attitudes about and use of marijuana? Journal of Drug Issues. 34:751-770.
42 American College of Pediatricians. (2016). Effect of marijuana legalization on risky behavior in adolescents and young adults. American College of Pediatricians statement. Retrieved from https://www.acpeds.org/the-college-speaks/position-statements/effect-of-marijuana-legalization-on-risky-behavior.
43 Cerdá, M., Wall, M., Feng, T., Keyes, K.M., Sarvet, A., Schulenberg, J., O'Malley, P.M., Pacula, R.L., Galea, S., & Hasin, D.S. (2017). Association of state recreational marijuana laws with adolescent marijuana use. JAMA Pediatrics, 171:142–149.
44 Freisthler, B., & Gruenewald, P.J. (2014). Examining the relationship between the physical availability of medical marijuana and marijuana use across fifty California cities. Drug and Alcohol Dependence, 143: 244–250.
45 Morrison, C., Gruenewald, P. J., Freisthler, B., Ponicki, W.R., & Remer, L.G. (2014). The economic geography of medical cannabis dispensaries in California. The International Journal on Drug Policy, 25: 508–515.
46 Brooks-Russell, A., Ma, M., Levinson, A.H., Kattari, L., Kirchner, T., Anderson Goodell, E.M., & Johnson, R.M. (2019). Adolescent marijuana use, marijuana-related perceptions, and use of other substances before and after initiation of retail marijuana sales in Colorado (2013-2015). Prevention Science, 20:185–193.
47 Harpin, S.B., Brooks-Russell, A., Ma, M., James, K.A., & Levinson, A.H. (2018). Adolescent marijuana use and perceived ease of access before and after recreational marijuana implementation in Colorado. Substance Use & Misuse, 53: 451–456.
48 Paschall, M.J., & Grube, J.W. (2020). Recreational marijuana availability in Oregon and use among adolescents. American Journal of Preventive Medicine, 58: e63–e69.
49 Shi Y. (2016). The availability of medical marijuana dispensary and adolescent marijuana use. Preventive Medicine, 91:1–7.
50 Harpin et al., 2018.
51 Brooks-Russell et al., 2019.
52 Fleming, C.B., Guttmannova, K., Cambron, C., Rhew, I.C., & Oesterle, S. (2016). Examination of the divergence in trends for adolescent marijuana use and marijuana-specific risk factors in Washington State. The Journal of Adolescent Health, 59: 269–275.
53 Johnson & Guttmannova, 2019.
54 Johnson & Guttmannova, 2019.

Marijuana Use Among California Secondary Students, Volume 1 2017/19
48
55 Paschall & Grube, 2020.
56 Rusby, J.C., Westling, E., Crowley, R., & Light, J.M. (2018). Legalization of recreational marijuana and community sales policy in Oregon: Impact on adolescent willingness and intent to use, parent use, and adolescent use. Psychology of Addictive Behaviors, 32: 84–92.
57 Estoup, A.C., Moise-Campbell, C., Varma, M., & Stewart, D.G. (2016). The impact of marijuana legalization on adolescent use, consequences, and perceived risk. Substance Use & Misuse, 51: 1881–1887.
58 Cerdá et al., 2017.
59 Tormohlen et al, 2019.
60 Borodovsky et al., 2017.
61 Wang et al., 2016.
62 Doran & Papadopoulos, 2019.
63 Regarding the legalization of medical marijuana use, the preponderance of recent research has shown no increase in use following enactment (Johnson et al. 2019, Martins et al. 2016, Cerdá et al. 2017). This was the case in California following passage of MML in November 1996. Biennial State CHKS data show that current marijuana use among 11th graders peaked at 26% in 1995 and 1997 and then dropped to 19% in 2005.
Marijuana Use Among California Secondary Students, Volume 1 2017/19
49
References American College of Pediatricians. (2016). Effect of marijuana legalization on risky behavior in adolescents and young adults. American College of Pediatricians statement. Retrieved from https://www.acpeds.org/the-college-speaks/position-statements/effect-of-marijuana-legalization-on-risky-behavior.
Barrus, D.G., Capogrossi, K.L., Cates, S.C., Gourdet, C.K., Peiper, N.C., Novak, S.P., Lefever, T.W., & Wiley, J.L. (2016). Tasty THC: Promises and challenges of cannabis edibles. Methods Report RTI Press, 1-22.
Borodovsky, J.T., Lee, D.C., Crosier, B.S., Gabrielli, J.L., Sargent, J.D., & Budney, A.J. (2017). U.S. cannabis legalization and use of vaping and edible products among youth. Drug and Alcohol Dependence, 77:299‐306.
Brooks-Russell, A., Ma, M., Levinson, A.H., Kattari, L., Kirchner, T., Anderson Goodell, E.M., & Johnson, R.M. (2019). Adolescent marijuana use, marijuana-related perceptions, and use of other substances before and after initiation of retail marijuana sales in Colorado (2013-2015). Prevention Science, 20:185–193.
Cerdá, M., Wall, M., Feng, T., Keyes, K.M., Sarvet, A., Schulenberg, J., O'Malley, P.M., Pacula, R.L., Galea, S., & Hasin, D.S. (2017). Association of state recreational marijuana laws with adolescent marijuana use. JAMA Pediatrics, 171:142–149.
Doran, N., & Papadopoulos, A. (2019). Cannabis edibles: Behaviors, attitudes, and reasons for use. Environmental Health Review, 62:44-52.
Eggers, M.E., Lee, Y.O., Jackson, K., Wiley, J.L., Porter, L., & Nonnemaker, J.M. (2017). Youth use of electronic vapor products and blunts for administering cannabis. Addictive Behaviors, 70:79‐82.
Estoup, A.C., Moise-Campbell, C., Varma, M., & Stewart, D.G. (2016). The impact of marijuana legalization on adolescent use, consequences, and perceived risk. Substance Use & Misuse, 51: 1881–1887.
Etter, J. (2015). Electronic cigarettes and cannabis: An exploratory study. European Addiction Research, 21:124-40.
Fleming, C.B., Guttmannova, K., Cambron, C., Rhew, I.C., & Oesterle, S. (2016). Examination of the divergence in trends for adolescent marijuana use and marijuana-specific risk factors in Washington State. The Journal of Adolescent Health, 59: 269–275.
Freisthler, B., & Gruenewald, P.J. (2014). Examining the relationship between the physical availability of medical marijuana and marijuana use across fifty California cities. Drug and Alcohol Dependence, 143: 244–250.

Marijuana Use Among California Secondary Students, Volume 1 2017/19
50
Friese, B., Slater, M.D., Annechino, R., & Battle, R.S. (2016). Teen use of marijuana edibles: A focus group study of an emerging issue. The Journal of Primary Prevention, 37: 303–309.
Friese, B., Slater, M.D., & Battle, R.S. (2017). Use of marijuana edibles by adolescents in California. The Journal of Primary Prevention, 38:279-294.
Fryman, C., Lou, B., Weber, A.G., Steinberg, H.N., Khanijo, S., Iakovou, A., & Makaryus, M.R. (2020). Acute respiratory failure associated with vaping. Chest, 157: e63-e68.
Harpin, S.B., Brooks-Russell, A., Ma, M., James, K.A., & Levinson, A.H. (2018). Adolescent marijuana use and perceived ease of access before and after recreational marijuana implementation in Colorado. Substance Use & Misuse, 53: 451–456.
Johnston, L.D., Miech, R.A., O’Malley, P.M., Bachman, J.G., Schulenberg, J.E., & Patrick, M.E. (2020). Monitoring the Future national survey results on drug use 1975-2019: Overview, key findings on adolescent drug use. Ann Arbor: Institute for Social Research, University of Michigan. Retrieved from http://www.monitoringthefuture.org//pubs/monographs/mtf-overview2019.pdf.
Johnson, R.M. & Guttmannova, K. (2019). Marijuana use among adolescents and emerging adults in the midst of policy change: Introduction to the special issue. Prevention Science, 20:179–184.
Kann, L., McManus, T., Harris, W.A., Shanklin, S.L., Flint, K.H., Queen, B., Lowry, M.D., et al. (2018). Youth risk behavior surveillance — United States, 2017. MMWR surveillance summaries, 67:1–114.
Khatapous, S. & Hallfors, D. (2004). Sending the wrong message: Did medical marijuana legalization in California change attitudes about and use of marijuana? Journal of Drug Issues. 34:751-770.
MacCoun, R.J., & Mello, M.M. (2015). Half-Baked—The retail promotion of marijuana edibles. New England Journal of Medicine, 372:989-991.
Malouff, J.M., Rooke, S.E., & Copeland, J. (2014). Experiences of marijuana-vaporizer users. Substance Abuse, 35:127-128.
Martins, S.S., Mauro, C.M., Santaella-Tenorio, J., Kim, J.H., Cerda, M., Keyes, K.M., Hasin, D.S., Galea, S., & Wall, M. (2016). State-level medical marijuana laws, marijuana use and perceived availability of marijuana among the general U.S. population. Drug and Alcohol Dependence, 169: 26–32.
Miech, R., Johnston, L., & O’Malley, P.M. (2017). Prevalence and attitudes regarding marijuana use among adolescents over the past decade. Pediatrics, 140:1-8.
Monte A.A., Zane R.D., & Heard K.J. (2015). The implications of marijuana legalization in Colorado. Journal of American Medical Association, 313: 241–242.
Marijuana Use Among California Secondary Students, Volume 1 2017/19
51
Morean, M. E., Kong, G., Camenga, D. R., Cavallo, D. A., & Krishnan-Sarin, S. (2015). High school students' use of electronic cigarettes to vaporize cannabis. Pediatrics, 136:611–616. See also: Audrain-McGovern, J., Stone, M.D., Barrington-Trimis, J., Unger, J.B., & Leventhal, A.M. (2018). Adolescent e-cigarette, hookah, and conventional cigarette use and subsequent marijuana use. Pediatrics, 142: 1-8.
Morrison, C., Gruenewald, P. J., Freisthler, B., Ponicki, W.R., & Remer, L.G. (2014). The economic geography of medical cannabis dispensaries in California. The International Journal on Drug Policy, 25: 508–515.
Owotomo, O., & Maslowsky, J. (2017). Marijuana and e-cigarette use in a US national sample of 8th and 10th grade never-smokers of conventional cigarettes. Journal of Applied Research on Children: Informing Policy for Children at Risk, 8:1-17.
Paschall, M.J., & Grube, J.W. (2020). Recreational marijuana availability in Oregon and use among adolescents. American Journal of Preventive Medicine, 58: e63–e69.
Patrick M.E., Miech R.A., Kloska D.D., Wagner A.C., & Johnston L.D. (2020). Trends in marijuana vaping and edible consumption from 2015 to 2018 among adolescents in the U.S. JAMA Pediatrics. Published online April 06,
Rusby, J.C., Westling, E., Crowley, R., & Light, J.M. (2018). Legalization of recreational marijuana and community sales policy in Oregon: Impact on adolescent willingness and intent to use, parent use, and adolescent use. Psychology of Addictive Behaviors, 32: 84–92.
Schlienz, N.J., & Lee, D.C. (2018). Co-use of cannabis, tobacco, and alcohol during adolescence: Policy and regulatory implications. International Review of Psychiatry, 30:226-237.
Shi Y. (2016). The availability of medical marijuana dispensary and adolescent marijuana use. Preventive Medicine, 91:1–7.
Substance Abuse and Mental Health Services Administration. (2019). Key substance use and mental health indicators in the United States: Results from the 2018 National Survey on Drug Use and Health. Rockville, MD: Center for Behavioral Health Statistics and Quality, Substance Abuse and Mental Health Services Administration. Retrieved from https://www.samhsa.gov/data/.
Tormohlen, K.N., Brooks-Russell, A., Ma, M., Schneider, K.E., Levinson, A., & Johnson, R. (2019). Modes of marijuana consumption among Colorado high school students before and after the initiation of retail marijuana sales for adults. Journal of Studies on Alcohol and Drugs, 80:46-55.
Wang, J.B., Ramo, D.E., Lisha, N.E., & Cataldo, J.K. (2016). Medical marijuana legalization and cigarette and marijuana co-use in adolescents and adults. Drug and Alcohol Dependence, 166:32–38.