Embed Size (px)
DESCRIPTION
az10k
Citation preview
Table of Contents
UNITED STATESSECURITIES AND EXCHANGE COMMISSION
Washington, D.C. 20549 ____________________________________
FORM 10-K____________________________________
(Mark One)
x ANNUAL REPORT PURSUANT TO SECTION 13 OR 15(d) OF THE SECURITIES EXCHANGE ACT OF 1934For the fiscal year ended December 31, 2013
or
¨ TRANSITION REPORT PURSUANT TO SECTION 13 OR 15(d) OF THE SECURITIES EXCHANGE ACT OF 1934For the transition period from to .
Commission File No. 000-22513____________________________________
AMAZON.COM, INC.(Exact Name of Registrant as Specified in its Charter)
Delaware 91-1646860(State or Other Jurisdiction of
Incorporation or Organization) (I.R.S. EmployerIdentification No.)
410 Terry Avenue NorthSeattle, Washington 98109-5210
(206) 266-1000(Address and telephone number, including area code, of registrant’s principal executive offices)
Securities registered pursuant to Section 12(b) of the Act:
Title of Each Class Name of Each Exchange on Which RegisteredCommon Stock, par value $.01 per share Nasdaq Global Select Market
Securities registered pursuant to Section 12(g) of the Act:None
____________________________________
Indicate by check mark if the registrant is a well-known seasoned issuer, as defined in Rule 405 of the Securities Act. Yes x No ¨
Indicate by check mark if the registrant is not required to file reports pursuant to Section 13 or Section 15(d) of the Exchange Act. Yes ¨ No x
Indicate by check mark whether the registrant (1) has filed all reports required to be filed by Section 13 or 15(d) of the Securities Exchange Act of 1934 during the preceding 12months (or for such shorter period that the registrant was required to file such reports), and (2) has been subject to such filing requirements for the past 90 days. Yes x No ¨
Indicate by check mark whether the registrant has submitted electronically and posted on its corporate Web site, if any, every Interactive Data File required to be submitted andposted pursuant to Rule 405 of Regulation S-T during the preceding 12 months (or for such shorter period that the registrant was required to submit and post suchfiles). Yes x No ¨
Indicate by check mark if disclosure of delinquent filers pursuant to Item 405 of Regulation S-K is not contained herein, and will not be contained, to the best of registrant’sknowledge, in definitive proxy or information statements incorporated by reference in Part III of this Form 10-K or any amendment to this Form 10-K. x
Indicate by check mark whether the registrant is a large accelerated filer, an accelerated filer, a non-accelerated filer, or a smaller reporting company. See definitions of “largeaccelerated filer,” “accelerated filer” and “smaller reporting company” in Rule 12b-2 of the Exchange Act.
Large accelerated filer x Accelerated filer ¨Non-accelerated filer ¨ (Do not check if a smaller reporting company) Smaller reporting company ¨
Indicate by check mark whether the registrant is a shell company (as defined in Rule 12b-2 of the Exchange Act). Yes ¨ No x
Aggregate market value of voting stock held by non-affiliates of the registrant as of June 30, 2013 $ 102,548,300,912Number of shares of common stock outstanding as of January 17, 2014 459,264,535
____________________________________
DOCUMENTS INCORPORATED BY REFERENCE
The information required by Part III of this Report, to the extent not set forth herein, is incorporated herein by reference from the registrant’s definitive proxy statement relating tothe Annual Meeting of Shareholders to be held in 2014, which definitive proxy statement shall be filed with the Securities and Exchange Commission within 120 days after the end of thefiscal year to which this Report relates.
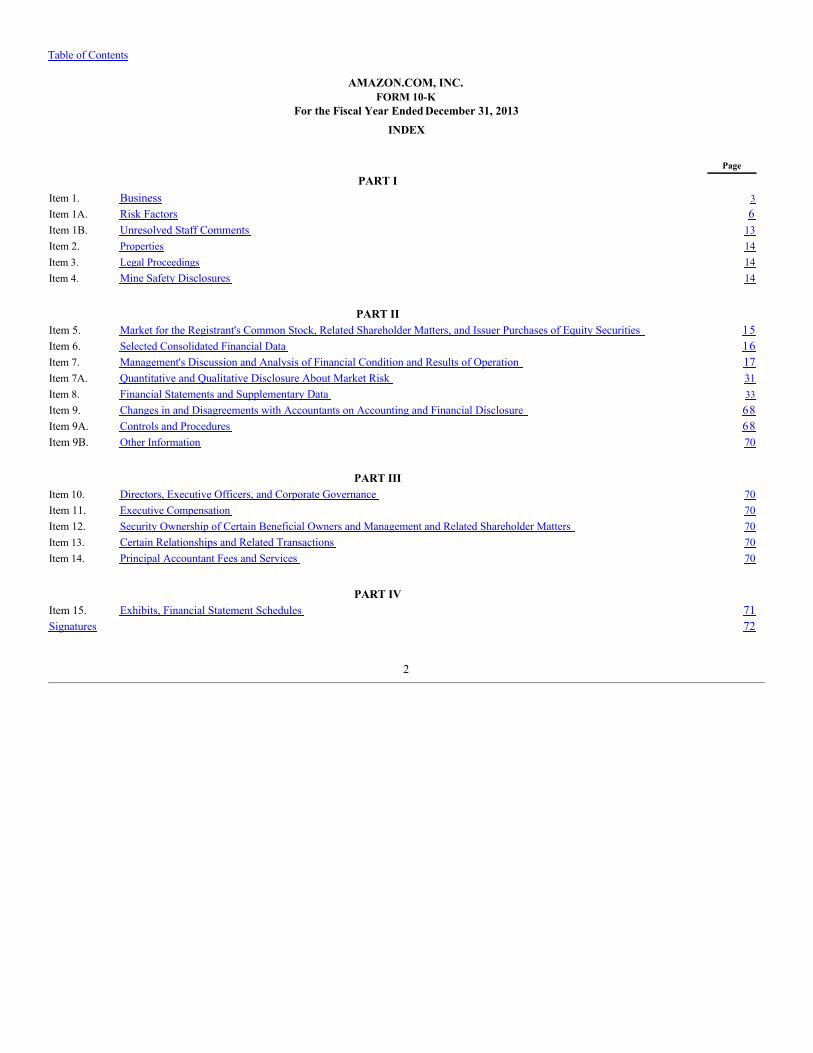
Table of Contents
AMAZON.COM, INC.FORM 10-K
For the Fiscal Year Ended December 31, 2013INDEX
Page
PART I Item 1. Business 3Item 1A. Risk Factors 6Item 1B. Unresolved Staff Comments 13Item 2. Properties 14Item 3. Legal Proceedings 14Item 4. Mine Safety Disclosures 14
PART II Item 5. Market for the Registrant's Common Stock, Related Shareholder Matters, and Issuer Purchases of Equity Securities 15Item 6. Selected Consolidated Financial Data 16Item 7. Management's Discussion and Analysis of Financial Condition and Results of Operation 17Item 7A. Quantitative and Qualitative Disclosure About Market Risk 31Item 8. Financial Statements and Supplementary Data 33Item 9. Changes in and Disagreements with Accountants on Accounting and Financial Disclosure 68Item 9A. Controls and Procedures 68Item 9B. Other Information 70
PART III Item 10. Directors, Executive Officers, and Corporate Governance 70Item 11. Executive Compensation 70Item 12. Security Ownership of Certain Beneficial Owners and Management and Related Shareholder Matters 70Item 13. Certain Relationships and Related Transactions 70Item 14. Principal Accountant Fees and Services 70
PART IV Item 15. Exhibits, Financial Statement Schedules 71Signatures 72
2
Table of Contents
AMAZON.COM, INC.
PART I
Item 1. BusinessThis Annual Report on Form 10-K and the documents incorporated herein by reference contain forward-looking statements based on
expectations, estimates, and projections as of the date of this filing. Actual results may differ materially from those expressed in forward-lookingstatements. See Item 1A of Part I—“Risk Factors.”
Amazon.com, Inc. was incorporated in 1994 in the state of Washington and reincorporated in 1996 in the state of Delaware. Our principal corporateoffices are located in Seattle, Washington. We completed our initial public offering in May 1997 and our common stock is listed on the Nasdaq Global SelectMarket under the symbol “AMZN.”
As used herein, “Amazon.com,” “we,” “our,” and similar terms include Amazon.com, Inc. and its subsidiaries, unless the context indicates otherwise.
GeneralAmazon.com opened its virtual doors on the World Wide Web in July 1995. We seek to be Earth’s most customer-centric company. In each of our two
geographic segments, we serve our primary customer sets, consisting of consumers, sellers, enterprises, and content creators. In addition, we provide services,such as advertising services and co-branded credit card agreements.
We manage our business primarily on a geographic basis. Accordingly, we have organized our operations into two segments: North America andInternational. While each reportable operating segment provides similar products and services, a majority of our technology costs are incurred in the U.S. andallocated to our North America segment. Additional information on our operating segments and product information is contained in Item 8 of Part II, “FinancialStatements and Supplementary Data—Note 12—Segment Information.” See Item 7 of Part II, “Management’s Discussion and Analysis of Financial Conditionand Results of Operations—Results of Operations—Supplemental Information” for supplemental information about our net sales.
ConsumersWe serve consumers through our retail websites and focus on selection, price, and convenience. We design our websites to enable millions of unique
products to be sold by us and by third parties across dozens of product categories. Customers access our websites directly and through our mobile websitesand apps. We also manufacture and sell electronic devices. We strive to offer our customers the lowest prices possible through low everyday product pricingand shipping offers, and to improve our operating efficiencies so that we can continue to lower prices for our customers. We also provide easy-to-usefunctionality, fast and reliable fulfillment, and timely customer service. In addition, we offer Amazon Prime, an annual membership program that includesunlimited free shipping on millions of items, access to unlimited instant streaming of thousands of movies and TV episodes, and access to hundreds ofthousands of books to borrow and read for free on a Kindle device.
We fulfill customer orders in a number of ways, including through the North America and International fulfillment centers and warehouses that weoperate, through co-sourced and outsourced arrangements in certain countries, and through digital delivery. We operate customer service centers globally,which are supplemented by co-sourced arrangements. See Item 2 of Part I, “Properties.”
SellersWe offer programs that enable sellers to sell their products on our websites and their own branded websites and to fulfill orders through us. We are not
the seller of record in these transactions, but instead earn fixed fees, revenue share fees, per-unit activity fees, or some combination thereof.
EnterprisesWe serve developers and enterprises of all sizes through Amazon Web Services (“AWS”), which provides technology infrastructure services that enable
virtually any type of business.
3
Table of Contents
Content CreatorsWe serve authors and independent publishers with Kindle Direct Publishing, an online platform that lets independent authors and publishers choose a
70% royalty option and make their books available in the Kindle Store, along with Amazon’s own publishing arm, Amazon Publishing. We also offerprograms that allow authors, musicians, filmmakers, app developers, and others to publish and sell content.
CompetitionOur businesses are rapidly evolving and intensely competitive. Our current and potential competitors include: (1) physical-world retailers, publishers,
vendors, distributors, manufacturers, and producers of our products; (2) other online e-commerce and mobile e-commerce sites, including sites that sell ordistribute digital content; (3) media companies, web portals, comparison shopping websites, and web search engines, either directly or in collaboration withother retailers; (4) companies that provide e-commerce services, including website development, fulfillment, customer service, and payment processing;(5) companies that provide information storage or computing services or products, including infrastructure and other web services; and (6) companies thatdesign, manufacture, market, or sell consumer electronics, telecommunication, and electronic devices. We believe that the principal competitive factors in ourretail businesses include selection, price, and convenience, including fast and reliable fulfillment. Additional competitive factors for our seller and enterpriseservices include the quality, speed, and reliability of our services and tools. Many of our current and potential competitors have greater resources, longerhistories, more customers, and greater brand recognition. They may secure better terms from suppliers, adopt more aggressive pricing, and devote moreresources to technology, infrastructure, fulfillment, and marketing. Other companies also may enter into business combinations or alliances that strengthentheir competitive positions.
Intellectual PropertyWe regard our trademarks, service marks, copyrights, patents, domain names, trade dress, trade secrets, proprietary technologies, and similar
intellectual property as critical to our success, and we rely on trademark, copyright, and patent law, trade-secret protection, and confidentiality and/or licenseagreements with our employees, customers, partners, and others to protect our proprietary rights. We have registered, or applied for the registration of, anumber of U.S. and international domain names, trademarks, service marks, and copyrights. Additionally, we have filed U.S. and international patentapplications covering certain of our proprietary technology. We have licensed in the past, and expect that we may license in the future, certain of ourproprietary rights to third parties.
SeasonalityOur business is affected by seasonality, which historically has resulted in higher sales volume during our fourth quarter, which ends December 31. We
recognized 34%, 35%, and 36% of our annual revenue during the fourth quarter of 2013, 2012, and 2011.
EmployeesWe employed approximately 117,300 full-time and part-time employees as of December 31, 2013. However, employment levels fluctuate due to seasonal
factors affecting our business. Additionally, we utilize independent contractors and temporary personnel to supplement our workforce. We have workscouncils and statutory employee representation obligations in certain countries. Except where required by law, unions are not the collective bargainingrepresentatives of our employees in any facility with more than five employees. We consider our employee relations to be good. Competition for qualifiedpersonnel in our industry has historically been intense, particularly for software engineers, computer scientists, and other technical staff.
Available InformationOur investor relations website is www.amazon.com/ir and we encourage investors to use it as a way of easily finding information about us. We promptly
make available on this website, free of charge, the reports that we file or furnish with the Securities and Exchange Commission (“SEC”), corporate governanceinformation (including our Code of Business Conduct and Ethics), and select press releases and social media postings.
4
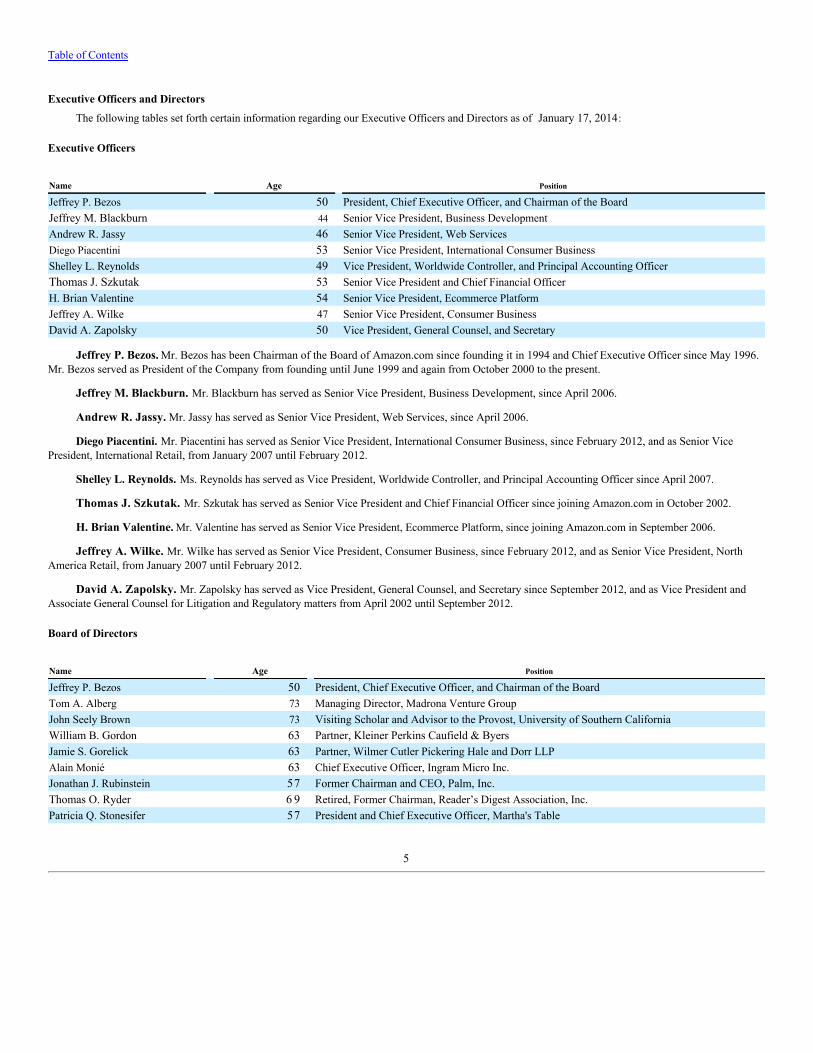
Table of Contents
Executive Officers and Directors
The following tables set forth certain information regarding our Executive Officers and Directors as of January 17, 2014:
Executive Officers
Name Age Position
Jeffrey P. Bezos 50 President, Chief Executive Officer, and Chairman of the BoardJeffrey M. Blackburn 44 Senior Vice President, Business DevelopmentAndrew R. Jassy 46 Senior Vice President, Web ServicesDiego Piacentini 53 Senior Vice President, International Consumer BusinessShelley L. Reynolds 49 Vice President, Worldwide Controller, and Principal Accounting OfficerThomas J. Szkutak 53 Senior Vice President and Chief Financial OfficerH. Brian Valentine 54 Senior Vice President, Ecommerce PlatformJeffrey A. Wilke 47 Senior Vice President, Consumer BusinessDavid A. Zapolsky 50 Vice President, General Counsel, and Secretary
Jeffrey P. Bezos. Mr. Bezos has been Chairman of the Board of Amazon.com since founding it in 1994 and Chief Executive Officer since May 1996.Mr. Bezos served as President of the Company from founding until June 1999 and again from October 2000 to the present.
Jeffrey M. Blackburn. Mr. Blackburn has served as Senior Vice President, Business Development, since April 2006.
Andrew R. Jassy. Mr. Jassy has served as Senior Vice President, Web Services, since April 2006.
Diego Piacentini. Mr. Piacentini has served as Senior Vice President, International Consumer Business, since February 2012, and as Senior VicePresident, International Retail, from January 2007 until February 2012.
Shelley L. Reynolds. Ms. Reynolds has served as Vice President, Worldwide Controller, and Principal Accounting Officer since April 2007.
Thomas J. Szkutak. Mr. Szkutak has served as Senior Vice President and Chief Financial Officer since joining Amazon.com in October 2002.
H. Brian Valentine. Mr. Valentine has served as Senior Vice President, Ecommerce Platform, since joining Amazon.com in September 2006.
Jeffrey A. Wilke. Mr. Wilke has served as Senior Vice President, Consumer Business, since February 2012, and as Senior Vice President, NorthAmerica Retail, from January 2007 until February 2012.
David A. Zapolsky. Mr. Zapolsky has served as Vice President, General Counsel, and Secretary since September 2012, and as Vice President andAssociate General Counsel for Litigation and Regulatory matters from April 2002 until September 2012.
Board of Directors
Name Age Position
Jeffrey P. Bezos 50 President, Chief Executive Officer, and Chairman of the BoardTom A. Alberg 73 Managing Director, Madrona Venture GroupJohn Seely Brown 73 Visiting Scholar and Advisor to the Provost, University of Southern CaliforniaWilliam B. Gordon 63 Partner, Kleiner Perkins Caufield & ByersJamie S. Gorelick 63 Partner, Wilmer Cutler Pickering Hale and Dorr LLPAlain Monié 63 Chief Executive Officer, Ingram Micro Inc.Jonathan J. Rubinstein 57 Former Chairman and CEO, Palm, Inc.Thomas O. Ryder 6 9 Retired, Former Chairman, Reader’s Digest Association, Inc.Patricia Q. Stonesifer 57 President and Chief Executive Officer, Martha's Table
5
Table of Contents
Item 1A. Risk FactorsPlease carefully consider the following risk factors. If any of the following risks occur, our business, financial condition, operating results, and cash
flows could be materially adversely affected. In addition, the current global economic climate amplifies many of these risks.
We Face Intense CompetitionOur businesses are rapidly evolving and intensely competitive, and we have many competitors in different industries, including retail, e-commerce
services, digital content and electronic devices, and web and infrastructure computing services. Some of our current and potential competitors have greaterresources, longer histories, more customers, and/or greater brand recognition. They may secure better terms from vendors, adopt more aggressive pricing, anddevote more resources to technology, infrastructure, fulfillment, and marketing.
Competition may intensify as our competitors enter into business combinations or alliances and established companies in other market segments expandto become competitive with our business. In addition, new and enhanced technologies, including search, web and infrastructure computing services, digitalcontent, and electronic devices, may increase our competition. The Internet facilitates competitive entry and comparison shopping, and increased competitionmay reduce our sales and profits.
Our Expansion Places a Significant Strain on our Management, Operational, Financial, and Other ResourcesWe are rapidly and significantly expanding our global operations, including increasing our product and service offerings and scaling our infrastructure
to support our retail and services businesses. This expansion increases the complexity of our business and places significant strain on our management,personnel, operations, systems, technical performance, financial resources, and internal financial control and reporting functions. We may not be able tomanage growth effectively, which could damage our reputation, limit our growth, and negatively affect our operating results.
Our Expansion into New Products, Services, Technologies, and Geographic Regions Subjects Us to Additional Business, Legal, Financial,and Competitive Risks
We may have limited or no experience in our newer market segments, and our customers may not adopt our new offerings. These offerings may presentnew and difficult technology challenges, and we may be subject to claims if customers of these offerings experience service disruptions or failures or otherquality issues. In addition, profitability, if any, in our newer activities may be lower than in our older activities, and we may not be successful enough in thesenewer activities to recoup our investments in them. If any of this were to occur, it could damage our reputation, limit our growth, and negatively affect ouroperating results.
We May Experience Significant Fluctuations in Our Operating Results and Growth RateWe may not be able to accurately forecast our growth rate. We base our expense levels and investment plans on sales estimates. A significant portion of
our expenses and investments is fixed, and we may not be able to adjust our spending quickly enough if our sales are less than expected.
Our revenue growth may not be sustainable, and our percentage growth rates may decrease. Our revenue and operating profit growth depends on thecontinued growth of demand for the products and services offered by us or our sellers, and our business is affected by general economic and businessconditions worldwide. A softening of demand, whether caused by changes in customer preferences or a weakening of the U.S. or global economies, may resultin decreased revenue or growth.
Our sales and operating results will also fluctuate for many other reasons, including due to risks described elsewhere in this section and the following:
• our ability to retain and increase sales to existing customers, attract new customers, and satisfy our customers’ demands;
• our ability to retain and expand our network of sellers;
• our ability to offer products on favorable terms, manage inventory, and fulfill orders;
• the introduction of competitive websites, products, services, price decreases, or improvements;
• changes in usage or adoption rates of the Internet, e-commerce, electronic devices, and web services, including outside the U.S.;
• timing, effectiveness, and costs of expansion and upgrades of our systems and infrastructure;
6
Table of Contents
• the success of our geographic, service, and product line expansions;
• the extent to which we finance, and the terms of any such financing for, our current operations and future growth;
• the outcomes of legal proceedings and claims, which may include significant monetary damages or injunctive relief and could have a materialadverse impact on our operating results;
• variations in the mix of products and services we sell;
• variations in our level of merchandise and vendor returns;
• the extent to which we offer free shipping, continue to reduce prices worldwide, and provide additional benefits to our customers;
• the extent to which we invest in technology and content, fulfillment, and other expense categories;
• increases in the prices of fuel and gasoline, as well as increases in the prices of other energy products and commodities like paper and packingsupplies;
• the extent to which our equity-method investees record significant operating and non-operating items;
• the extent to which operators of the networks between our customers and our websites successfully charge fees to grant our customers unimpairedand unconstrained access to our online services;
• our ability to collect amounts owed to us when they become due;
• the extent to which use of our services is affected by spyware, viruses, phishing and other spam emails, denial of service attacks, data theft,computer intrusions, outages, and similar events; and
• terrorist attacks and armed hostilities.
We May Not Be Successful in Our Efforts to Expand into International Market SegmentsOur international activities are significant to our revenues and profits, and we plan to further expand internationally. In certain international market
segments, we have relatively little operating experience and may not benefit from any first-to-market advantages or otherwise succeed. It is costly to establish,develop, and maintain international operations and websites, and promote our brand internationally. Our international operations may not be profitable on asustained basis.
In addition to risks described elsewhere in this section, our international sales and operations are subject to a number of risks, including:
• local economic and political conditions;
• government regulation of e-commerce and other services, electronic devices, and competition, and restrictive governmental actions (such as tradeprotection measures, including export duties and quotas and custom duties and tariffs), nationalization, and restrictions on foreign ownership;
• restrictions on sales or distribution of certain products or services and uncertainty regarding liability for products, services, and content, includinguncertainty as a result of less Internet-friendly legal systems, local laws, lack of legal precedent, and varying rules, regulations, and practicesregarding the physical and digital distribution of media products and enforcement of intellectual property rights;
• business licensing or certification requirements, such as for imports, exports, web services, and electronic devices;
• limitations on the repatriation and investment of funds and foreign currency exchange restrictions;
• limited fulfillment and technology infrastructure;
• shorter payable and longer receivable cycles and the resultant negative impact on cash flow;
• laws and regulations regarding consumer and data protection, privacy, network security, encryption, payments, and restrictions on pricing ordiscounts;
• lower levels of use of the Internet;
• lower levels of consumer spending and fewer opportunities for growth compared to the U.S.;
• lower levels of credit card usage and increased payment risk;
• difficulty in staffing, developing, and managing foreign operations as a result of distance, language, and cultural differences;
7
Table of Contents
• different employee/employer relationships and the existence of works councils and labor unions;
• laws and policies of the U.S. and other jurisdictions affecting trade, foreign investment, loans, and taxes; and
• geopolitical events, including war and terrorism.
As international e-commerce and other online and web services grow, competition will intensify. Local companies may have a substantial competitiveadvantage because of their greater understanding of, and focus on, the local customer, as well as their more established local brand names. We may not be ableto hire, train, retain, and manage required personnel, which may limit our international growth.
The People’s Republic of China (“PRC”) regulates Amazon’s and its affiliates’ businesses and operations in the PRC through regulations and licenserequirements restricting (i) foreign investment in the Internet, IT infrastructure, retail, delivery, and other sectors, (ii) Internet content, and (iii) the sale ofmedia and other products and services. For example, in order to meet local ownership and regulatory licensing requirements, www.amazon.cn is operated byPRC companies that are indirectly owned, either wholly or partially, by PRC nationals. Although we believe these structures comply with existing PRC laws,they involve unique risks. There are substantial uncertainties regarding the interpretation of PRC laws and regulations, and it is possible that the PRCgovernment will ultimately take a view contrary to ours. If our Chinese business interests were found to be in violation of any existing or future PRC laws orregulations or if interpretations of those laws and regulations were to change, the business could be subject to fines and other financial penalties, have licensesrevoked, or be forced to shut down entirely. In addition, the Chinese businesses and operations may be unable to continue to operate if we or our affiliates areunable to access sufficient funding or enforce contractual relationships with respect to management and control of such businesses.
If We Do Not Successfully Optimize and Operate Our Fulfillment Centers, Our Business Could Be HarmedIf we do not adequately predict customer demand or otherwise optimize and operate our fulfillment centers successfully, it could result in excess or
insufficient inventory or fulfillment capacity, result in increased costs, impairment charges, or both, or harm our business in other ways. A failure to optimizeinventory will increase our net shipping cost by requiring long-zone or partial shipments. Orders from several of our websites are fulfilled primarily from asingle location, and we have only a limited ability to reroute orders to third parties for drop-shipping. We and our co-sourcers may be unable to adequatelystaff our fulfillment and customer service centers. As we continue to add fulfillment and warehouse capability or add new businesses with different fulfillmentrequirements, our fulfillment network becomes increasingly complex and operating it becomes more challenging. If the other businesses on whose behalf weperform inventory fulfillment services deliver product to our fulfillment centers in excess of forecasts, we may be unable to secure sufficient storage space andmay be unable to optimize our fulfillment centers. There can be no assurance that we will be able to operate our network effectively.
We rely on a limited number of shipping companies to deliver inventory to us and completed orders to our customers. If we are not able to negotiateacceptable terms with these companies or they experience performance problems or other difficulties, it could negatively impact our operating results andcustomer experience. In addition, our ability to receive inbound inventory efficiently and ship completed orders to customers also may be negatively affected byinclement weather, fire, flood, power loss, earthquakes, labor disputes, acts of war or terrorism, acts of God, and similar factors.
Third parties either drop-ship or otherwise fulfill an increasing portion of our customers’ orders, and we are increasingly reliant on the reliability,quality, and future procurement of their services. Under some of our commercial agreements, we maintain the inventory of other companies, thereby increasingthe complexity of tracking inventory and operating our fulfillment centers. Our failure to properly handle such inventory or the inability of these othercompanies to accurately forecast product demand would result in unexpected costs and other harm to our business and reputation.
The Seasonality of Our Business Places Increased Strain on Our OperationsWe expect a disproportionate amount of our net sales to occur during our fourth quarter. If we do not stock or restock popular products in sufficient
amounts such that we fail to meet customer demand, it could significantly affect our revenue and our future growth. If we overstock products, we may berequired to take significant inventory markdowns or write-offs, which could reduce profitability. We may experience an increase in our net shipping cost dueto complimentary upgrades, split-shipments, and additional long-zone shipments necessary to ensure timely delivery for the holiday season. If too manycustomers access our websites within a short period of time due to increased holiday demand, we may experience system interruptions that make our websitesunavailable or prevent us from efficiently fulfilling orders, which may reduce the volume of goods we sell and the attractiveness of our products and services.In addition, we may be unable to adequately staff our fulfillment and customer service centers during these peak periods and delivery and other fulfillmentcompanies and customer
8
Table of Contents
service co-sourcers may be unable to meet the seasonal demand. We also face risks described elsewhere in this Item 1A relating to fulfillment centeroptimization and inventory.
We generally have payment terms with our retail vendors that extend beyond the amount of time necessary to collect proceeds from our consumercustomers. As a result of holiday sales, as of December 31 of each year, our cash, cash equivalents, and marketable securities balances typically reach theirhighest level (other than as a result of cash flows provided by or used in investing and financing activities). This operating cycle results in a correspondingincrease in accounts payable as of December 31. Our accounts payable balance generally declines during the first three months of the year, resulting in acorresponding decline in our cash, cash equivalents, and marketable securities balances.
Our Business Could Suffer if We Are Unsuccessful in Making, Integrating, and Maintaining Commercial Agreements, Strategic Alliances,and Other Business Relationships
We provide e-commerce and other services to businesses through commercial agreements, strategic alliances, and business relationships. Under theseagreements, we provide web services, technology, fulfillment, computing, digital storage, and other services, as well as enable sellers to offer products orservices through our websites. These arrangements are complex and require substantial infrastructure capacity, personnel, and other resource commitments,which may limit the amount of business we can service. We may not be able to implement, maintain, and develop the components of these commercialrelationships, which may include web services, fulfillment, customer service, inventory management, tax collection, payment processing, hardware, content,and third-party software, and engaging third parties to perform services. The amount of compensation we receive under certain of our commercial agreementsis partially dependent on the volume of the other company’s sales. Therefore, if the other company’s offering is not successful, the compensation we receivemay be lower than expected or the agreement may be terminated. Moreover, we may not be able to enter into additional commercial relationships and strategicalliances on favorable terms. We also may be subject to claims from businesses to which we provide these services if we are unsuccessful in implementing,maintaining, or developing these services.
As our agreements terminate, we may be unable to renew or replace these agreements on comparable terms, or at all. We may in the future enter intoamendments on less favorable terms or encounter parties that have difficulty meeting their contractual obligations to us, which could adversely affect ouroperating results.
Our present and future e-commerce services agreements, other commercial agreements, and strategic alliances create additional risks such as:
• disruption of our ongoing business, including loss of management focus on existing businesses;
• impairment of other relationships;
• variability in revenue and income from entering into, amending, or terminating such agreements or relationships; and
• difficulty integrating under the commercial agreements.
Our Business Could Suffer if We Are Unsuccessful in Making, Integrating, and Maintaining Acquisitions and InvestmentsWe have acquired and invested in a number of companies, and we may acquire or invest in or enter into joint ventures with additional companies. These
transactions create risks such as:
• disruption of our ongoing business, including loss of management focus on existing businesses;
• problems retaining key personnel;
• additional operating losses and expenses of the businesses we acquired or in which we invested;
• the potential impairment of tangible and intangible assets and goodwill, including as a result of acquisitions;
• the potential impairment of customer and other relationships of the company we acquired or in which we invested or our own customers as a resultof any integration of operations;
• the difficulty of incorporating acquired technology and rights into our offerings and unanticipated expenses related to such integration;
• the difficulty of integrating a new company’s accounting, financial reporting, management, information and information security, human resource,and other administrative systems to permit effective management, and the lack of control if such integration is delayed or not implemented;
9
Table of Contents
• for investments in which an investee’s financial performance is incorporated into our financial results, either in full or in part, the dependence onthe investee’s accounting, financial reporting, and similar systems, controls, and processes;
• the difficulty of implementing at companies we acquire the controls, procedures, and policies appropriate for a larger public company;
• potential unknown liabilities associated with a company we acquire or in which we invest; and
• for foreign transactions, additional risks related to the integration of operations across different cultures and languages, and the economic, political,and regulatory risks associated with specific countries.
As a result of future acquisitions or mergers, we might need to issue additional equity securities, spend our cash, or incur debt, contingent liabilities, oramortization expenses related to intangible assets, any of which could reduce our profitability and harm our business. In addition, valuations supporting ouracquisitions and strategic investments could change rapidly given the current global economic climate. We could determine that such valuations haveexperienced impairments or other-than-temporary declines in fair value which could adversely impact our financial results.
We Have Foreign Exchange RiskThe results of operations of, and certain of our intercompany balances associated with, our international websites and product and service offerings are
exposed to foreign exchange rate fluctuations. Upon translation, operating results may differ materially from expectations, and we may record significant gainsor losses on the remeasurement of intercompany balances. As we have expanded our international operations, our exposure to exchange rate fluctuations hasincreased. We also hold cash equivalents and/or marketable securities primarily in Euros, Japanese Yen, British Pounds, and Chinese Yuan. If theU.S. Dollar strengthens compared to these currencies, cash equivalents, and marketable securities balances, when translated, may be materially less thanexpected and vice versa.
The Loss of Key Senior Management Personnel Could Negatively Affect Our BusinessWe depend on our senior management and other key personnel, particularly Jeffrey P. Bezos, our President, CEO, and Chairman. We do not have “key
person” life insurance policies. The loss of any of our executive officers or other key employees could harm our business.
We Could Be Harmed by Data Loss or Other Security BreachesAs a result of our services being web-based and the fact that we process, store, and transmit large amounts of data, including personal information, for
our customers, failure to prevent or mitigate data loss or other security breaches, including breaches of our vendors’ technology and systems, could expose usor our customers to a risk of loss or misuse of such information, adversely affect our operating results, result in litigation or potential liability for us, andotherwise harm our business. We use third party technology and systems for a variety of reasons, including, without limitation, encryption and authenticationtechnology, employee email, content delivery to customers, back-office support, and other functions. Some subsidiaries had past security breaches, and,although they did not have a material adverse effect on our operating results, there can be no assurance of a similar result in the future. Although we havedeveloped systems and processes that are designed to protect customer information and prevent data loss and other security breaches, including systems andprocesses designed to reduce the impact of a security breach at a third party vendor, such measures cannot provide absolute security.
We Face Risks Related to System Interruption and Lack of RedundancyWe experience occasional system interruptions and delays that make our websites and services unavailable or slow to respond and prevent us from
efficiently fulfilling orders or providing services to third parties, which may reduce our net sales and the attractiveness of our products and services. If we areunable to continually add software and hardware, effectively upgrade our systems and network infrastructure, and take other steps to improve the efficiencyof our systems, it could cause system interruptions or delays and adversely affect our operating results.
Our computer and communications systems and operations could be damaged or interrupted by fire, flood, power loss, telecommunications failure,earthquakes, acts of war or terrorism, acts of God, computer viruses, physical or electronic break-ins, and similar events or disruptions. Any of these eventscould cause system interruption, delays, and loss of critical data, and could prevent us from accepting and fulfilling customer orders and providing services,which could make our product and service offerings less attractive and subject us to liability. Our systems are not fully redundant and our disaster recoveryplanning may not be sufficient. In addition, we may have inadequate insurance coverage to compensate for any related losses. Any of these events coulddamage our reputation and be expensive to remedy.
10

Table of Contents
We Face Significant Inventory RiskIn addition to risks described elsewhere in this Item 1A relating to fulfillment center and inventory optimization by us and third parties, we are exposed
to significant inventory risks that may adversely affect our operating results as a result of seasonality, new product launches, rapid changes in product cyclesand pricing, defective merchandise, changes in consumer demand and consumer spending patterns, changes in consumer tastes with respect to our products,and other factors. We endeavor to accurately predict these trends and avoid overstocking or understocking products we manufacture and/or sell. Demand forproducts, however, can change significantly between the time inventory or components are ordered and the date of sale. In addition, when we begin selling ormanufacturing a new product, it may be difficult to establish vendor relationships, determine appropriate product or component selection, and accuratelyforecast demand. The acquisition of certain types of inventory or components may require significant lead-time and prepayment and they may not bereturnable. We carry a broad selection and significant inventory levels of certain products, such as consumer electronics, and we may be unable to sellproducts in sufficient quantities or during the relevant selling seasons. Any one of the inventory risk factors set forth above may adversely affect our operatingresults.
We May Not Be Able to Adequately Protect Our Intellectual Property Rights or May Be Accused of Infringing Intellectual Property Rights ofThird Parties
We regard our trademarks, service marks, copyrights, patents, trade dress, trade secrets, proprietary technology, and similar intellectual property ascritical to our success, and we rely on trademark, copyright, and patent law, trade secret protection, and confidentiality and/or license agreements with ouremployees, customers, and others to protect our proprietary rights. Effective intellectual property protection may not be available in every country in which ourproducts and services are made available. We also may not be able to acquire or maintain appropriate domain names in all countries in which we do business.Furthermore, regulations governing domain names may not protect our trademarks and similar proprietary rights. We may be unable to prevent third partiesfrom acquiring domain names that are similar to, infringe upon, or diminish the value of our trademarks and other proprietary rights.
We may not be able to discover or determine the extent of any unauthorized use of our proprietary rights. Third parties that license our proprietary rightsalso may take actions that diminish the value of our proprietary rights or reputation. The protection of our intellectual property may require the expenditure ofsignificant financial and managerial resources. Moreover, the steps we take to protect our intellectual property may not adequately protect our rights or preventthird parties from infringing or misappropriating our proprietary rights. We also cannot be certain that others will not independently develop or otherwiseacquire equivalent or superior technology or other intellectual property rights.
Other parties also may claim that we infringe their proprietary rights. We have been subject to, and expect to continue to be subject to, claims and legalproceedings regarding alleged infringement by us of the intellectual property rights of third parties. Such claims, whether or not meritorious, may result in theexpenditure of significant financial and managerial resources, injunctions against us, or the payment of damages. We may need to obtain licenses from thirdparties who allege that we have infringed their rights, but such licenses may not be available on terms acceptable to us or at all. In addition, we may not be ableto obtain or utilize on terms that are favorable to us, or at all, licenses or other rights with respect to intellectual property we do not own. These risks have beenamplified by the increase in third parties whose sole or primary business is to assert such claims.
Our digital content offerings depend in part on effective digital rights management technology to control access to digital content. If the digital rightsmanagement technology that we use is compromised or otherwise malfunctions, we could be subject to claims, and content providers may be unwilling toinclude their content in our service.
We Have a Rapidly Evolving Business Model and Our Stock Price Is Highly VolatileWe have a rapidly evolving business model. The trading price of our common stock fluctuates significantly in response to, among other risks, the risks
described elsewhere in this Item 1A, as well as:
• changes in interest rates;
• conditions or trends in the Internet and the industry segments we operate in;
• quarterly variations in operating results;
• fluctuations in the stock market in general and market prices for Internet-related companies in particular;
• changes in financial estimates by us or securities analysts and recommendations by securities analysts;
• changes in our capital structure, including issuance of additional debt or equity to the public;
11

Table of Contents
• changes in the valuation methodology of, or performance by, other e-commerce or technology companies; and
• transactions in our common stock by major investors and certain analyst reports, news, and speculation.
Volatility in our stock price could adversely affect our business and financing opportunities and force us to increase our cash compensation toemployees or grant larger stock awards than we have historically, which could hurt our operating results or reduce the percentage ownership of our existingstockholders, or both.
Government Regulation Is Evolving and Unfavorable Changes Could Harm Our BusinessWe are subject to general business regulations and laws, as well as regulations and laws specifically governing the Internet, e-commerce, electronic
devices, and other services. Existing and future laws and regulations may impede our growth. These regulations and laws may cover taxation, privacy, dataprotection, pricing, content, copyrights, distribution, mobile communications, electronic device certification, electronic waste, energy consumption,environmental regulation, electronic contracts and other communications, competition, consumer protection, web services, the provision of online paymentservices, unencumbered Internet access to our services, the design and operation of websites, and the characteristics and quality of products and services. It isnot clear how existing laws governing issues such as property ownership, libel, and personal privacy apply to the Internet, e-commerce, digital content, andweb services. Jurisdictions may regulate consumer-to-consumer online businesses, including certain aspects of our seller programs. Unfavorable regulationsand laws could diminish the demand for our products and services and increase our cost of doing business.
We Do Not Collect Sales or Consumption Taxes in Some JurisdictionsU.S. Supreme Court decisions restrict the imposition of obligations to collect state and local sales taxes with respect to remote sales. However, an
increasing number of states have considered or adopted laws or administrative practices that attempt to impose obligations on out-of-state retailers to collecttaxes on their behalf. We support a Federal law that would allow states to require sales tax collection under a nationwide system. More than half of our revenueis already earned in jurisdictions where we collect sales tax or its equivalent. A successful assertion by one or more states or foreign countries requiring us tocollect taxes where we do not do so could result in substantial tax liabilities, including for past sales, as well as penalties and interest.
We Could be Subject to Additional Income Tax LiabilitiesWe are subject to income taxes in the United States and numerous foreign jurisdictions. Significant judgment is required in evaluating and estimating
our provision and accruals for these taxes. During the ordinary course of business, there are many transactions for which the ultimate tax determination isuncertain. Our effective tax rates could be adversely affected by earnings being lower than anticipated in countries where we have lower statutory rates andhigher than anticipated in countries where we have higher statutory rates, by losses incurred in jurisdictions for which we are not able to realize the related taxbenefit, by changes in foreign currency exchange rates, by entry into new businesses and geographies and changes to our existing businesses, by acquisitions(including integrations) and investments, by changes in the valuation of our deferred tax assets and liabilities, or by changes in the relevant tax, accountingand other laws, regulations, administrative practices, principles, and interpretations, including fundamental changes to the tax laws applicable to corporatemultinationals. The United States, many countries in the European Union, and a number of other countries are actively considering changes in this regard. Inaddition, we are subject to audit in various jurisdictions, and such jurisdictions may assess additional income tax liabilities against us. Although we believeour tax estimates are reasonable, the final outcome of tax audits and any related litigation could be materially different from our historical income taxprovisions and accruals. Developments in an audit, litigation, or the relevant laws, regulations, administrative practices, principles, and interpretations couldhave a material effect on our operating results or cash flows in the period or periods for which that development occurs, as well as for prior and subsequentperiods.
Our Supplier Relationships Subject Us to a Number of RisksWe have significant suppliers, including licensors, and in some cases, limited or single-sources of supply, that are important to our sourcing, services,
manufacturing, and any related ongoing servicing of merchandise and content. We do not have long-term arrangements with most of our suppliers to guaranteeavailability of merchandise, content, components, or services, particular payment terms, or the extension of credit limits. If our current suppliers were to stopselling or licensing merchandise, content, components, or services to us on acceptable terms, or delay delivery, including as a result of one or more supplierbankruptcies due to poor economic conditions, as a result of natural disasters, or for other reasons, we may be unable to procure alternatives from othersuppliers in a timely and efficient manner and on acceptable terms, or at all.
12
Table of Contents
We May be Subject to Risks Related to Government Contracts and Related Procurement RegulationsOur contracts with U.S., as well as state, local, and foreign, government entities are subject to various procurement regulations and other requirements
relating to their formation, administration, and performance. We may be subject to audits and investigations relating to our government contracts, and anyviolations could result in various civil and criminal penalties and administrative sanctions, including termination of contract, refunding or suspending ofpayments, forfeiture of profits, payment of fines, and suspension or debarment from future government business. In addition, such contracts may provide fortermination by the government at any time, without cause.
We May Be Subject to Product Liability Claims if People or Property Are Harmed by the Products We SellSome of the products we sell or manufacture may expose us to product liability claims relating to personal injury, death, or environmental or property
damage, and may require product recalls or other actions. Certain third parties also sell products using our e-commerce platform that may increase ourexposure to product liability claims, such as if these sellers do not have sufficient protection from such claims. Although we maintain liability insurance, wecannot be certain that our coverage will be adequate for liabilities actually incurred or that insurance will continue to be available to us on economicallyreasonable terms, or at all. In addition, some of our agreements with our vendors and sellers do not indemnify us from product liability.
We Are Subject to Payments-Related RisksWe accept payments using a variety of methods, including credit card, debit card, credit accounts (including promotional financing), gift cards, direct
debit from a customer’s bank account, consumer invoicing, physical bank check, and payment upon delivery. For existing and future payment options weoffer to our customers, we may become subject to additional regulations, compliance requirements, and fraud. For certain payment methods, including creditand debit cards, we pay interchange and other fees, which may increase over time and raise our operating costs and lower profitability. We rely on third partiesto provide payment processing services, including the processing of credit cards, debit cards, electronic checks, and promotional financing, and it coulddisrupt our business if these companies become unwilling or unable to provide these services to us. We are also subject to payment card association operatingrules, including data security rules, certification requirements, and rules governing electronic funds transfers, which could change or be reinterpreted to makeit difficult or impossible for us to comply. If we fail to comply with these rules or requirements, or if our data security systems are breached or compromised,we may be liable for card issuing banks’ costs, subject to fines and higher transaction fees, and lose our ability to accept credit and debit card payments fromour customers, process electronic funds transfers, or facilitate other types of online payments, and our business and operating results could be adverselyaffected. We also offer co-branded credit card programs, which could adversely affect our operating results if terminated.
In addition, we provide regulated services in certain jurisdictions because we enable customers to keep account balances with us and transfer money tothird parties, and because we provide services to third parties to facilitate payments on their behalf. In these jurisdictions, we may be subject to requirementsfor licensing, regulatory inspection, bonding and capital maintenance, the use, handling, and segregation of transferred funds, consumer disclosures, andauthentication. We are also subject to or voluntarily comply with a number of other laws and regulations relating to payments, money laundering, internationalmoney transfers, privacy and information security, and electronic fund transfers. If we were found to be in violation of applicable laws or regulations, wecould be subject to additional requirements and civil and criminal penalties, or forced to cease providing certain services.
We Could Be Liable for Fraudulent or Unlawful Activities of SellersThe law relating to the liability of providers of online payment services is currently unsettled. In addition, governmental agencies could require changes
in the way this business is conducted. Under our seller programs, we may be unable to prevent sellers from collecting payments, fraudulently or otherwise,when buyers never receive the products they ordered or when the products received are materially different from the sellers’ descriptions. Under our A2ZGuarantee, we reimburse buyers for payments up to certain limits in these situations, and as our marketplace seller sales grow, the cost of this program willincrease and could negatively affect our operating results. We also may be unable to prevent sellers on our sites or through other seller sites from sellingunlawful goods, selling goods in an unlawful manner, or violating the proprietary rights of others, and could face civil or criminal liability for unlawfulactivities by our sellers.
Item 1B. Unresolved Staff CommentsNone
13
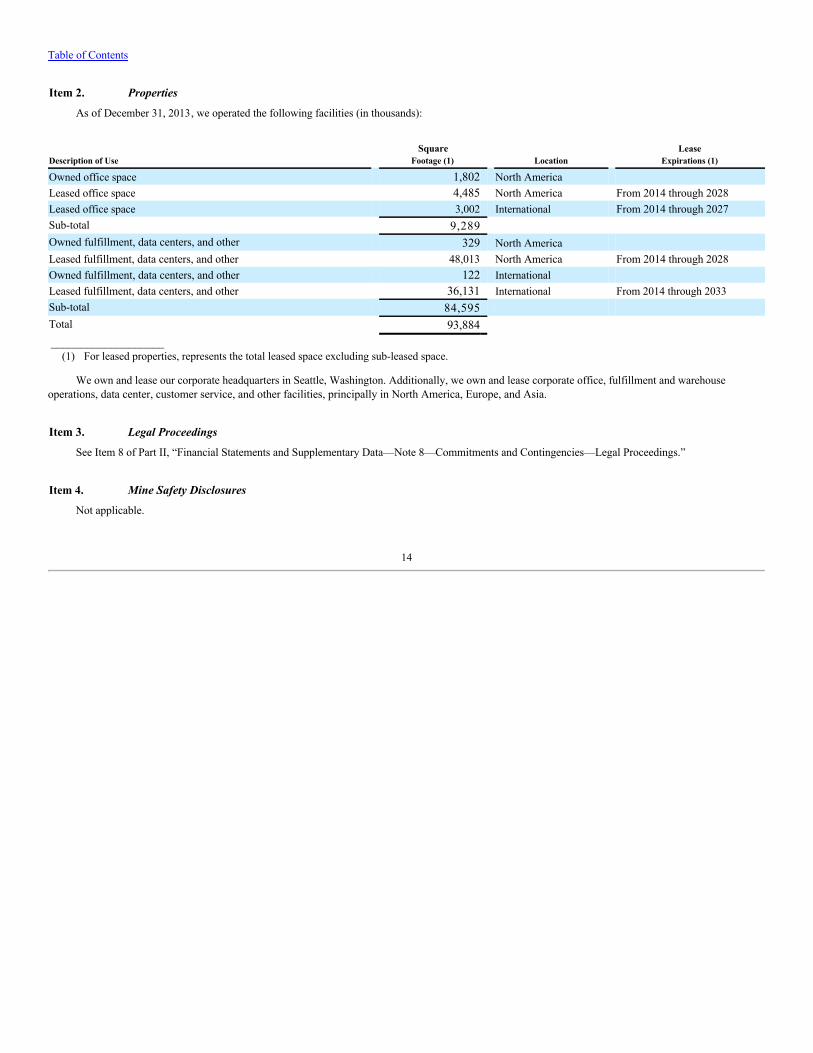
Table of Contents
Item 2. Properties
As of December 31, 2013, we operated the following facilities (in thousands):
Description of Use Square
Footage (1) Location Lease
Expirations (1)
Owned office space 1,802 North America Leased office space 4,485 North America From 2014 through 2028Leased office space 3,002 International From 2014 through 2027Sub-total 9,289 Owned fulfillment, data centers, and other 329 North America Leased fulfillment, data centers, and other 48,013 North America From 2014 through 2028Owned fulfillment, data centers, and other 122 International Leased fulfillment, data centers, and other 36,131 International From 2014 through 2033Sub-total 84,595 Total 93,884 ___________________
(1) For leased properties, represents the total leased space excluding sub-leased space.
We own and lease our corporate headquarters in Seattle, Washington. Additionally, we own and lease corporate office, fulfillment and warehouseoperations, data center, customer service, and other facilities, principally in North America, Europe, and Asia.
Item 3. Legal Proceedings
See Item 8 of Part II, “Financial Statements and Supplementary Data—Note 8—Commitments and Contingencies—Legal Proceedings.”
Item 4. Mine Safety Disclosures
Not applicable.
14
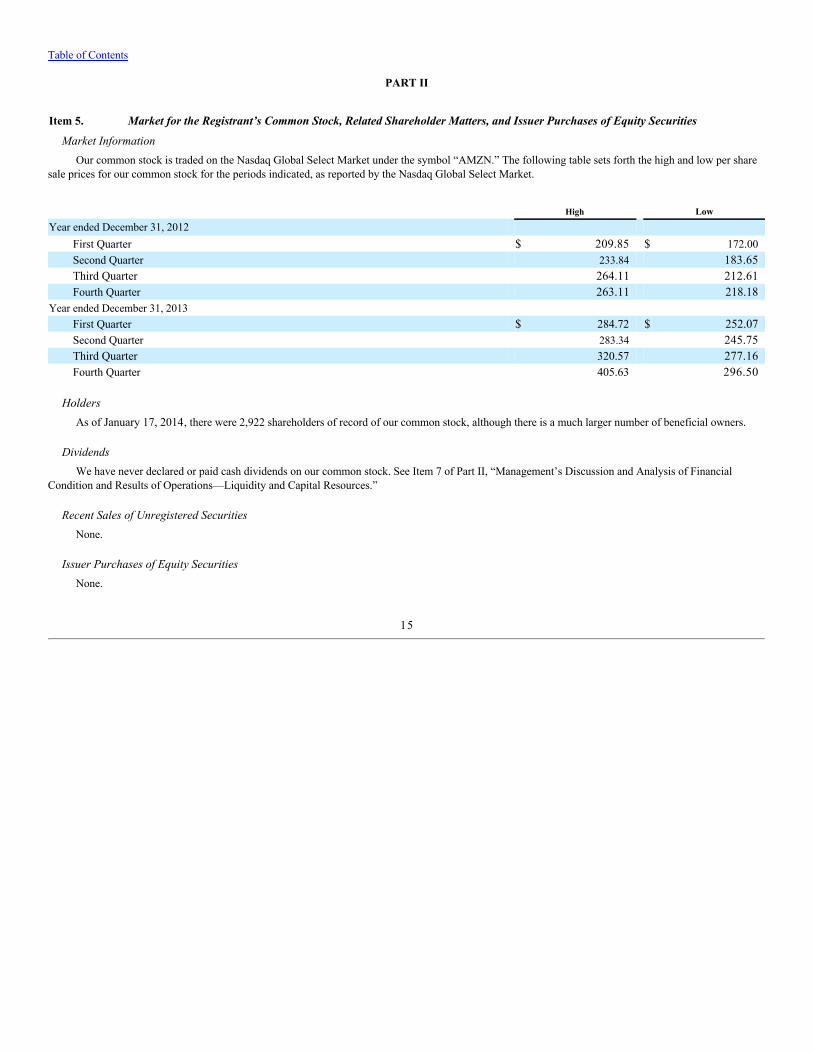
Table of Contents
PART II
Item 5. Market for the Registrant’s Common Stock, Related Shareholder Matters, and Issuer Purchases of Equity Securities
Market InformationOur common stock is traded on the Nasdaq Global Select Market under the symbol “AMZN.” The following table sets forth the high and low per share
sale prices for our common stock for the periods indicated, as reported by the Nasdaq Global Select Market.
High Low
Year ended December 31, 2012 First Quarter $ 209.85 $ 172.00Second Quarter 233.84 183.65Third Quarter 264.11 212.61Fourth Quarter 263.11 218.18
Year ended December 31, 2013 First Quarter $ 284.72 $ 252.07Second Quarter 283.34 245.75Third Quarter 320.57 277.16Fourth Quarter 405.63 296.50
HoldersAs of January 17, 2014, there were 2,922 shareholders of record of our common stock, although there is a much larger number of beneficial owners.
DividendsWe have never declared or paid cash dividends on our common stock. See Item 7 of Part II, “Management’s Discussion and Analysis of Financial
Condition and Results of Operations—Liquidity and Capital Resources.”
Recent Sales of Unregistered SecuritiesNone.
Issuer Purchases of Equity SecuritiesNone.
15
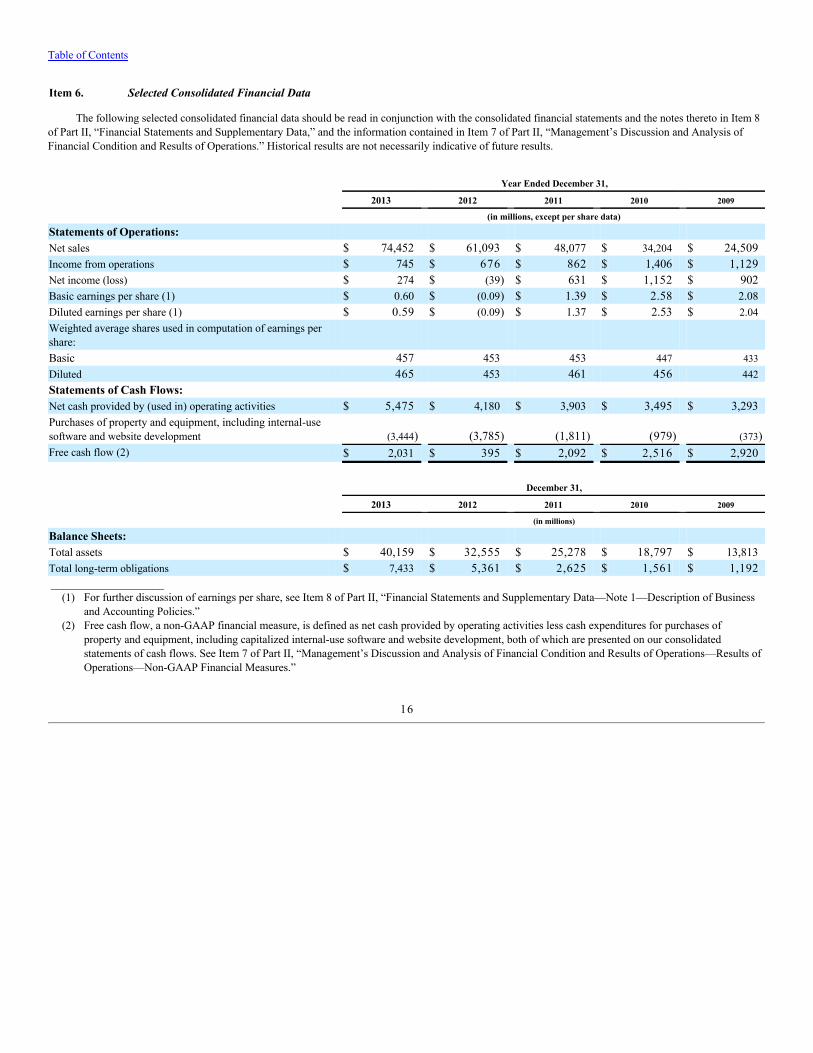
Table of Contents
Item 6. Selected Consolidated Financial Data
The following selected consolidated financial data should be read in conjunction with the consolidated financial statements and the notes thereto in Item 8of Part II, “Financial Statements and Supplementary Data,” and the information contained in Item 7 of Part II, “Management’s Discussion and Analysis ofFinancial Condition and Results of Operations.” Historical results are not necessarily indicative of future results.
Year Ended December 31,
2013 2012 2011 2010 2009
(in millions, except per share data)
Statements of Operations: Net sales $ 74,452 $ 61,093 $ 48,077 $ 34,204 $ 24,509Income from operations $ 745 $ 676 $ 862 $ 1,406 $ 1,129Net income (loss) $ 274 $ (39) $ 631 $ 1,152 $ 902Basic earnings per share (1) $ 0.60 $ (0.09) $ 1.39 $ 2.58 $ 2.08Diluted earnings per share (1) $ 0.59 $ (0.09) $ 1.37 $ 2.53 $ 2.04Weighted average shares used in computation of earnings pershare: Basic 457 453 453 447 433Diluted 465 453 461 456 442Statements of Cash Flows: Net cash provided by (used in) operating activities $ 5,475 $ 4,180 $ 3,903 $ 3,495 $ 3,293Purchases of property and equipment, including internal-usesoftware and website development (3,444) (3,785) (1,811) (979) (373)Free cash flow (2) $ 2,031 $ 395 $ 2,092 $ 2,516 $ 2,920 December 31,
2013 2012 2011 2010 2009
(in millions)
Balance Sheets: Total assets $ 40,159 $ 32,555 $ 25,278 $ 18,797 $ 13,813Total long-term obligations $ 7,433 $ 5,361 $ 2,625 $ 1,561 $ 1,192 ___________________
(1) For further discussion of earnings per share, see Item 8 of Part II, “Financial Statements and Supplementary Data—Note 1—Description of Businessand Accounting Policies.”
(2) Free cash flow, a non-GAAP financial measure, is defined as net cash provided by operating activities less cash expenditures for purchases ofproperty and equipment, including capitalized internal-use software and website development, both of which are presented on our consolidatedstatements of cash flows. See Item 7 of Part II, “Management’s Discussion and Analysis of Financial Condition and Results of Operations—Results ofOperations—Non-GAAP Financial Measures.”
16
Table of Contents
Item 7. Management’s Discussion and Analysis of Financial Condition and Results of Operations
Forward-Looking StatementsThis Annual Report on Form 10-K includes forward-looking statements within the meaning of the Private Securities Litigation Reform Act of 1995. All
statements other than statements of historical fact, including statements regarding guidance, industry prospects, or future results of operations or financialposition, made in this Annual Report on Form 10-K are forward-looking. We use words such as anticipates, believes, expects, future, intends, and similarexpressions to identify forward-looking statements. Forward-looking statements reflect management’s current expectations and are inherently uncertain. Actualresults could differ materially for a variety of reasons, including, among others, fluctuations in foreign exchange rates, changes in global economic conditionsand consumer spending, world events, the rate of growth of the Internet and online commerce, the amount that Amazon.com invests in new businessopportunities and the timing of those investments, the mix of products sold to customers, the mix of net sales derived from products as compared withservices, the extent to which we owe income taxes, competition, management of growth, potential fluctuations in operating results, international growth andexpansion, the outcomes of legal proceedings and claims, fulfillment and data center optimization, risks of inventory management, seasonality, the degree towhich the Company enters into, maintains, and develops commercial agreements, acquisitions and strategic transactions, payments risks, and risks offulfillment throughput and productivity. In addition, the current global economic climate amplifies many of these risks. These risks and uncertainties, as wellas other risks and uncertainties that could cause our actual results to differ significantly from management’s expectations, are described in greater detail inItem 1A of Part I, “Risk Factors.”
OverviewOur primary source of revenue is the sale of a wide range of products and services to customers . The products offered on our consumer-facing
websites primarily include merchandise and content we have purchased for resale from vendors and those offered by third-party sellers, and we alsomanufacture and sell electronic devices. Generally, we recognize gross revenue from items we sell from our inventory as product sales and recognize our netshare of revenue of items sold by other sellers as services sales. We also offer other services such as AWS, fulfillment, publishing, digital contentsubscriptions, advertising, and co-branded credit cards.
Our financial focus is on long-term, sustainable growth in free cash flow 1 per share. Free cash flow is driven primarily by increasing operatingincome and efficiently managing working capital 2 and capital expenditures. Increases in operating income primarily result from increases in sales of productsand services and efficiently managing our operating costs, partially offset by investments we make in longer-term strategic initiatives. To increase sales ofproducts and services, we focus on improving all aspects of the customer experience, including lowering prices, improving availability, offering faster deliveryand performance times, increasing selection, increasing product categories and service offerings, expanding product information, improving ease of use,improving reliability, and earning customer trust. We also seek to efficiently manage shareholder dilution while maintaining the flexibility to issue shares forstrategic purposes, such as financings, acquisitions, and aligning employee compensation with shareholders’ interests. We utilize restricted stock units as ourprimary vehicle for equity compensation because we believe they align the long-term interests of our shareholders and employees. In measuring shareholderdilution, we include all vested and unvested stock awards outstanding, without regard to estimated forfeitures. Total shares outstanding plus outstandingstock awards were 476 million and 470 million as of December 31, 2013 and 2012.
We seek to reduce our variable costs per unit and work to leverage our fixed costs. Our variable costs include product and content costs, paymentprocessing and related transaction costs, picking, packaging, and preparing orders for shipment, transportation, customer service support, costs necessary torun AWS, and a portion of our marketing costs. Our fixed costs include the costs necessary to run our technology infrastructure; to build, enhance, and addfeatures to our websites and web services, our electronic devices, and digital offerings; and to build and optimize our fulfillment centers. Variable costsgenerally change directly with sales volume, while fixed costs generally increase depending on the timing of capacity needs, geographic expansion, categoryexpansion, and other factors. To decrease our variable costs on a per unit basis and enable us to lower prices for customers, we seek to increase our directsourcing, increase discounts available to us from suppliers, and reduce defects in our processes. To minimize growth in fixed costs, we seek to improveprocess efficiencies and maintain a lean culture._______________________(1) Free cash flow, a non-GAAP financial measure, is defined as net cash provided by operating activities less cash expenditures for purchases of
property and equipment, including internal-use software and website development, both of which are presented on our consolidated statements of cashflows. See “Results of Operations—Non-GAAP Financial Measures” below.
(2) Working capital consists of accounts receivable, inventory, and accounts payable.
17
Table of Contents
Because of our model we are able to turn our inventory quickly and have a cash-generating operating cycle 3. On average, our high inventoryvelocity means we generally collect from consumers before our payments to suppliers come due. Inventory turnover 4 was 9, 9, and 10 for 2013, 2012, and2011. We expect variability in inventory turnover over time since it is affected by several factors, including our product mix, the mix of sales by us and byother sellers, our continuing focus on in-stock inventory availability and selection of product offerings, our investment in new geographies and product lines,and the extent to which we choose to utilize outsource fulfillment providers. Accounts payable days 5 were 74, 76, and 74 for 2013, 2012, and 2011. We expectsome variability in accounts payable days over time since they are affected by several factors, including the mix of product sales, the mix of sales by othersellers, the mix of suppliers, seasonality, and changes in payment terms over time, including the effect of balancing pricing and timing of payment terms withsuppliers.
We expect spending in technology and content will increase over time as we add computer scientists, designers, software and hardwareengineers, and merchandising employees. We seek to efficiently invest in several areas of technology and content such as web services, expansion ofnew and existing product categories and offerings, and initiatives to expand our ecosystem of digital products and services, as well as in technologyinfrastructure to enhance the customer experience and improve our process efficiencies. We believe that advances in technology, specifically the speed andreduced cost of processing power and the advances of wireless connectivity, will continue to improve the consumer experience on the Internet and increase itsubiquity in people’s lives. To best take advantage of these continued advances in technology, we are investing in initiatives to build and deploy innovative andefficient software and electronic devices. We are also investing in AWS, which provides technology services that give developers and enterprises of all sizesaccess to technology infrastructure that enables virtually any type of business.
Our financial reporting currency is the U.S. Dollar and changes in exchange rates significantly affect our reported results and consolidatedtrends. For example, if the U.S. Dollar weakens year-over-year relative to currencies in our international locations, our consolidated net sales and operatingexpenses will be higher than if currencies had remained constant. Likewise, if the U.S. Dollar strengthens year-over-year relative to currencies in ourinternational locations, our consolidated net sales and operating expenses will be lower than if currencies had remained constant. We believe that our increasingdiversification beyond the U.S. economy through our growing international businesses benefits our shareholders over the long term. We also believe it is usefulto evaluate our operating results and growth rates before and after the effect of currency changes.
In addition, the remeasurement of our intercompany balances can result in significant gains and charges associated with the effect of movements incurrency exchange rates. Currency volatilities may continue, which may significantly impact (either positively or negatively) our reported results andconsolidated trends and comparisons.
For additional information about each line item summarized above, refer to Item 8 of Part II, “Financial Statements and Supplementary Data—Note 1—Description of Business and Accounting Policies.”
Critical Accounting Judgments
The preparation of financial statements in conformity with generally accepted accounting principles of the United States (“GAAP”) requires estimatesand assumptions that affect the reported amounts of assets and liabilities, revenues and expenses, and related disclosures of contingent assets and liabilities inthe consolidated financial statements and accompanying notes. The SEC has defined a company’s critical accounting policies as the ones that are mostimportant to the portrayal of the company’s financial condition and results of operations, and which require the company to make its most difficult andsubjective judgments, often as a result of the need to make estimates of matters that are inherently uncertain. Based on this definition, we have identified thecritical accounting policies and judgments addressed below. We also have other key accounting policies, which involve the use of estimates, judgments, andassumptions that are significant to understanding our results. For additional information, see Item 8 of Part II, “Financial Statements and Supplementary Data—Note 1—Description of Business and Accounting Policies.” Although we believe that our estimates, assumptions, and judgments are reasonable, they arebased upon information presently available. Actual results may differ significantly from these estimates under different assumptions, judgments, orconditions._______________________(3) The operating cycle is the number of days of sales in inventory plus the number of days of sales in accounts receivable minus accounts payable days.(4) Inventory turnover is the quotient of trailing twelve month cost of sales to average inventory over five quarter ends.(5) Accounts payable days, calculated as the quotient of accounts payable to current quarter cost of sales, multiplied by the number of days in the current
quarter.
18
Table of Contents
InventoriesInventories, consisting of products available for sale, are primarily accounted for using the first-in first-out (“FIFO”) method, and are valued at the lower
of cost or market value. This valuation requires us to make judgments, based on currently-available information, about the likely method of disposition, suchas through sales to individual customers, returns to product vendors, or liquidations, and expected recoverable values of each disposition category. Theseassumptions about future disposition of inventory are inherently uncertain and changes in our estimates and assumptions may cause us to realize materialwrite-downs in the future. As a measure of sensitivity, for every 1% of additional inventory valuation allowance as of December 31, 2013, we would haverecorded an additional cost of sales of approximately $79 million.
GoodwillWe evaluate goodwill for impairment annually or more frequently when an event occurs or circumstances change that indicate that the carrying value
may not be recoverable. Our annual testing date is October 1. We test goodwill for impairment by first comparing the book value of net assets to the fair valueof the reporting units. If the fair value is determined to be less than the book value or qualitative factors indicate that it is more likely than not that goodwill isimpaired, a second step is performed to compute the amount of impairment as the difference between the estimated fair value of goodwill and the carryingvalue. We estimate the fair value of the reporting units using discounted cash flows. Forecasts of future cash flows are based on our best estimate of future netsales and operating expenses, based primarily on expected category expansion, pricing, market segment share, and general economic conditions. Certainestimates of discounted cash flows involve businesses and geographies with limited financial history and developing revenue models. Changes in theseforecasts could significantly change the amount of impairment recorded, if any.
During the year, management monitored the actual performance of the business relative to the fair value assumptions used during our annual goodwillimpairment test. For the periods presented, no triggering events were identified that required an update to our annual impairment test. As a measure ofsensitivity, a 10% decrease in the fair value of any of our reporting units as of December 31, 2013 would have had no impact on the carrying value of ourgoodwill.
Financial and credit market volatility directly impacts our fair value measurement through our weighted average cost of capital that we use to determineour discount rate and through our stock price that we use to determine our market capitalization. During times of volatility, significant judgment must beapplied to determine whether credit or stock price changes are a short-term swing or a longer-term trend. We have not made any significant changes to theaccounting methodology used to evaluate goodwill impairment. Changes in our estimated future cash flows and asset fair values may cause us to realizematerial impairment charges in the future. As a measure of sensitivity, a prolonged 20% decrease from our December 31, 2013 closing stock price would not bean indicator of possible impairment.
Stock-Based CompensationWe measure compensation cost for stock awards at fair value and recognize it as compensation expense over the service period for awards expected to
vest. The fair value of restricted stock units is determined based on the number of shares granted and the quoted price of our common stock. The estimation ofstock awards that will ultimately vest requires judgment for the amount that will be forfeited, and to the extent actual results or updated estimates differ fromour current estimates, such amounts will be recorded as a cumulative adjustment in the period estimates are revised. We consider many factors whenestimating expected forfeitures, including employee class, economic environment, and historical experience. We update our estimated forfeiture rate quarterly.We have not made any significant changes to the accounting methodology used to evaluate stock-based compensation. Changes in our estimates andassumptions may cause us to realize material changes in stock-based compensation expense in the future. As a measure of sensitivity, a 1% change to ourestimated forfeiture rate would have had an approximately $32 million impact on our 2013 operating income. Our estimated forfeiture rate as of December 31,2013 and 2012 was 27%.
We utilize the accelerated method, rather than the straight-line method, for recognizing compensation expense. For example, over 50% of thecompensation cost related to an award vesting ratably over four years is expensed in the first year. If forfeited early in the life of an award, the compensationexpense adjustment is much greater under an accelerated method than under a straight-line method.
19
Table of Contents
Income TaxesWe are subject to income taxes in the U.S. and numerous foreign jurisdictions. Significant judgment is required in evaluating and estimating our
provision and accruals for these taxes. During the ordinary course of business, there are many transactions for which the ultimate tax determination isuncertain. Our effective tax rates could be adversely affected by earnings being lower than anticipated in countries where we have lower statutory rates andhigher than anticipated in countries where we have higher statutory rates, losses incurred in jurisdictions for which we are not able to realize the related taxbenefit, changes in foreign currency exchange rates, entry into new businesses and geographies and changes to our existing businesses, acquisitions (includingintegrations) and investments, changes in the valuation of our deferred tax assets and liabilities, or changes in the relevant tax, accounting, and other laws,regulations, administrative practices, principles, and interpretations, including fundamental changes to the tax laws applicable to corporate multinationals.The U.S., many countries in the European Union, and a number of other countries are actively considering changes in this regard. In addition, we are subjectto audit in various jurisdictions, and such jurisdictions may assess additional income tax liabilities against us. Although we believe our tax estimates arereasonable, the final outcome of tax audits and any related litigation could be materially different from our historical income tax provisions and accruals.Developments in an audit, litigation, or the relevant laws, regulations, administrative practices, principles, and interpretations could have a material effect onour operating results or cash flows in the period or periods for which that development occurs, as well as for prior and subsequent periods.
20
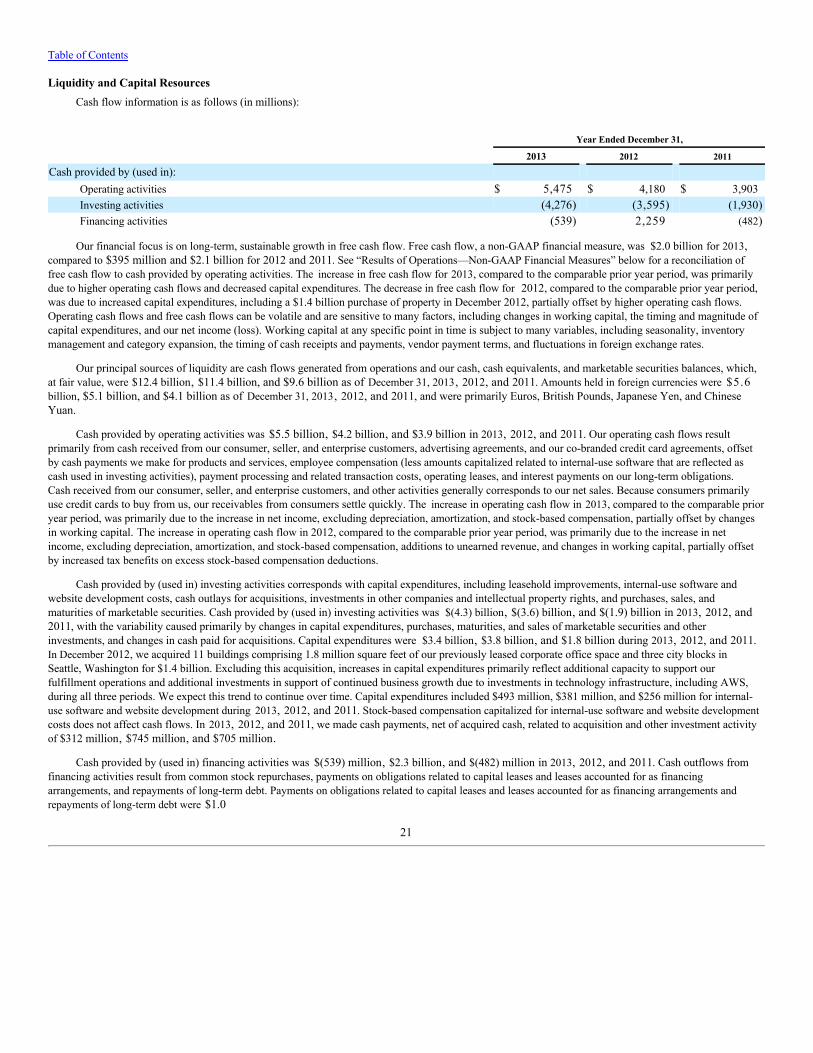
Table of Contents
Liquidity and Capital ResourcesCash flow information is as follows (in millions):
Year Ended December 31,
2013 2012 2011
Cash provided by (used in): Operating activities $ 5,475 $ 4,180 $ 3,903Investing activities (4,276) (3,595) (1,930)Financing activities (539) 2,259 (482)
Our financial focus is on long-term, sustainable growth in free cash flow. Free cash flow, a non-GAAP financial measure, was $2.0 billion for 2013,compared to $395 million and $2.1 billion for 2012 and 2011. See “Results of Operations—Non-GAAP Financial Measures” below for a reconciliation offree cash flow to cash provided by operating activities. The increase in free cash flow for 2013, compared to the comparable prior year period, was primarilydue to higher operating cash flows and decreased capital expenditures. The decrease in free cash flow for 2012, compared to the comparable prior year period,was due to increased capital expenditures, including a $1.4 billion purchase of property in December 2012, partially offset by higher operating cash flows.Operating cash flows and free cash flows can be volatile and are sensitive to many factors, including changes in working capital, the timing and magnitude ofcapital expenditures, and our net income (loss). Working capital at any specific point in time is subject to many variables, including seasonality, inventorymanagement and category expansion, the timing of cash receipts and payments, vendor payment terms, and fluctuations in foreign exchange rates.
Our principal sources of liquidity are cash flows generated from operations and our cash, cash equivalents, and marketable securities balances, which,at fair value, were $12.4 billion, $11.4 billion, and $9.6 billion as of December 31, 2013, 2012, and 2011. Amounts held in foreign currencies were $5.6billion, $5.1 billion, and $4.1 billion as of December 31, 2013, 2012, and 2011, and were primarily Euros, British Pounds, Japanese Yen, and ChineseYuan.
Cash provided by operating activities was $5.5 billion, $4.2 billion, and $3.9 billion in 2013, 2012, and 2011. Our operating cash flows resultprimarily from cash received from our consumer, seller, and enterprise customers, advertising agreements, and our co-branded credit card agreements, offsetby cash payments we make for products and services, employee compensation (less amounts capitalized related to internal-use software that are reflected ascash used in investing activities), payment processing and related transaction costs, operating leases, and interest payments on our long-term obligations.Cash received from our consumer, seller, and enterprise customers, and other activities generally corresponds to our net sales. Because consumers primarilyuse credit cards to buy from us, our receivables from consumers settle quickly. The increase in operating cash flow in 2013, compared to the comparable prioryear period, was primarily due to the increase in net income, excluding depreciation, amortization, and stock-based compensation, partially offset by changesin working capital. The increase in operating cash flow in 2012, compared to the comparable prior year period, was primarily due to the increase in netincome, excluding depreciation, amortization, and stock-based compensation, additions to unearned revenue, and changes in working capital, partially offsetby increased tax benefits on excess stock-based compensation deductions.
Cash provided by (used in) investing activities corresponds with capital expenditures, including leasehold improvements, internal-use software andwebsite development costs, cash outlays for acquisitions, investments in other companies and intellectual property rights, and purchases, sales, andmaturities of marketable securities. Cash provided by (used in) investing activities was $(4.3) billion, $(3.6) billion, and $(1.9) billion in 2013, 2012, and2011, with the variability caused primarily by changes in capital expenditures, purchases, maturities, and sales of marketable securities and otherinvestments, and changes in cash paid for acquisitions. Capital expenditures were $3.4 billion, $3.8 billion, and $1.8 billion during 2013, 2012, and 2011.In December 2012, we acquired 11 buildings comprising 1.8 million square feet of our previously leased corporate office space and three city blocks inSeattle, Washington for $1.4 billion. Excluding this acquisition, increases in capital expenditures primarily reflect additional capacity to support ourfulfillment operations and additional investments in support of continued business growth due to investments in technology infrastructure, including AWS,during all three periods. We expect this trend to continue over time. Capital expenditures included $493 million, $381 million, and $256 million for internal-use software and website development during 2013, 2012, and 2011. Stock-based compensation capitalized for internal-use software and website developmentcosts does not affect cash flows. In 2013, 2012, and 2011, we made cash payments, net of acquired cash, related to acquisition and other investment activityof $312 million, $745 million, and $705 million.
Cash provided by (used in) financing activities was $(539) million, $2.3 billion, and $(482) million in 2013, 2012, and 2011. Cash outflows fromfinancing activities result from common stock repurchases, payments on obligations related to capital leases and leases accounted for as financingarrangements, and repayments of long-term debt. Payments on obligations related to capital leases and leases accounted for as financing arrangements andrepayments of long-term debt were $1.0
21
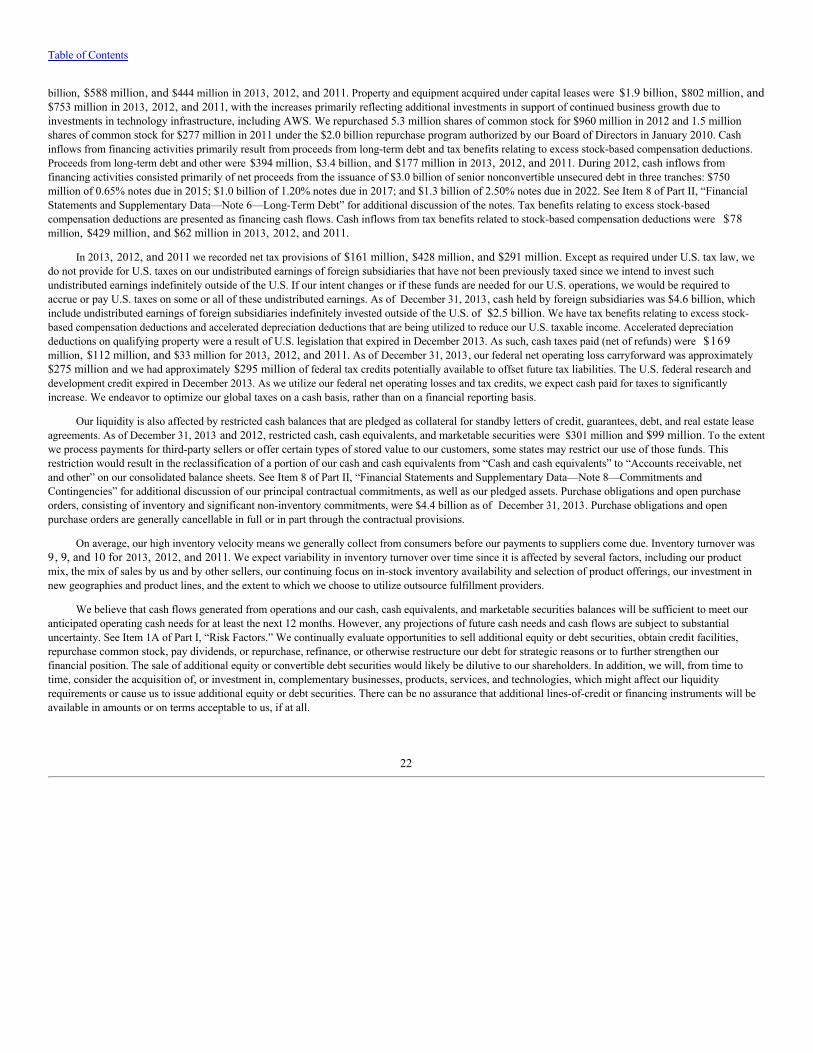
Table of Contents
billion, $588 million, and $444 million in 2013, 2012, and 2011. Property and equipment acquired under capital leases were $1.9 billion, $802 million, and$753 million in 2013, 2012, and 2011, with the increases primarily reflecting additional investments in support of continued business growth due toinvestments in technology infrastructure, including AWS. We repurchased 5.3 million shares of common stock for $960 million in 2012 and 1.5 millionshares of common stock for $277 million in 2011 under the $2.0 billion repurchase program authorized by our Board of Directors in January 2010. Cashinflows from financing activities primarily result from proceeds from long-term debt and tax benefits relating to excess stock-based compensation deductions.Proceeds from long-term debt and other were $394 million, $3.4 billion, and $177 million in 2013, 2012, and 2011. During 2012, cash inflows fromfinancing activities consisted primarily of net proceeds from the issuance of $3.0 billion of senior nonconvertible unsecured debt in three tranches: $750million of 0.65% notes due in 2015; $1.0 billion of 1.20% notes due in 2017; and $1.3 billion of 2.50% notes due in 2022. See Item 8 of Part II, “FinancialStatements and Supplementary Data—Note 6—Long-Term Debt” for additional discussion of the notes. Tax benefits relating to excess stock-basedcompensation deductions are presented as financing cash flows. Cash inflows from tax benefits related to stock-based compensation deductions were $78million, $429 million, and $62 million in 2013, 2012, and 2011.
In 2013, 2012, and 2011 we recorded net tax provisions of $161 million, $428 million, and $291 million. Except as required under U.S. tax law, wedo not provide for U.S. taxes on our undistributed earnings of foreign subsidiaries that have not been previously taxed since we intend to invest suchundistributed earnings indefinitely outside of the U.S. If our intent changes or if these funds are needed for our U.S. operations, we would be required toaccrue or pay U.S. taxes on some or all of these undistributed earnings. As of December 31, 2013, cash held by foreign subsidiaries was $4.6 billion, whichinclude undistributed earnings of foreign subsidiaries indefinitely invested outside of the U.S. of $2.5 billion. We have tax benefits relating to excess stock-based compensation deductions and accelerated depreciation deductions that are being utilized to reduce our U.S. taxable income. Accelerated depreciationdeductions on qualifying property were a result of U.S. legislation that expired in December 2013. As such, cash taxes paid (net of refunds) were $169million, $112 million, and $33 million for 2013, 2012, and 2011. As of December 31, 2013, our federal net operating loss carryforward was approximately$275 million and we had approximately $295 million of federal tax credits potentially available to offset future tax liabilities. The U.S. federal research anddevelopment credit expired in December 2013. As we utilize our federal net operating losses and tax credits, we expect cash paid for taxes to significantlyincrease. We endeavor to optimize our global taxes on a cash basis, rather than on a financial reporting basis.
Our liquidity is also affected by restricted cash balances that are pledged as collateral for standby letters of credit, guarantees, debt, and real estate leaseagreements. As of December 31, 2013 and 2012, restricted cash, cash equivalents, and marketable securities were $301 million and $99 million. To the extentwe process payments for third-party sellers or offer certain types of stored value to our customers, some states may restrict our use of those funds. Thisrestriction would result in the reclassification of a portion of our cash and cash equivalents from “Cash and cash equivalents” to “Accounts receivable, netand other” on our consolidated balance sheets. See Item 8 of Part II, “Financial Statements and Supplementary Data—Note 8—Commitments andContingencies” for additional discussion of our principal contractual commitments, as well as our pledged assets. Purchase obligations and open purchaseorders, consisting of inventory and significant non-inventory commitments, were $4.4 billion as of December 31, 2013. Purchase obligations and openpurchase orders are generally cancellable in full or in part through the contractual provisions.
On average, our high inventory velocity means we generally collect from consumers before our payments to suppliers come due. Inventory turnover was9, 9, and 10 for 2013, 2012, and 2011. We expect variability in inventory turnover over time since it is affected by several factors, including our productmix, the mix of sales by us and by other sellers, our continuing focus on in-stock inventory availability and selection of product offerings, our investment innew geographies and product lines, and the extent to which we choose to utilize outsource fulfillment providers.
We believe that cash flows generated from operations and our cash, cash equivalents, and marketable securities balances will be sufficient to meet ouranticipated operating cash needs for at least the next 12 months. However, any projections of future cash needs and cash flows are subject to substantialuncertainty. See Item 1A of Part I, “Risk Factors.” We continually evaluate opportunities to sell additional equity or debt securities, obtain credit facilities,repurchase common stock, pay dividends, or repurchase, refinance, or otherwise restructure our debt for strategic reasons or to further strengthen ourfinancial position. The sale of additional equity or convertible debt securities would likely be dilutive to our shareholders. In addition, we will, from time totime, consider the acquisition of, or investment in, complementary businesses, products, services, and technologies, which might affect our liquidityrequirements or cause us to issue additional equity or debt securities. There can be no assurance that additional lines-of-credit or financing instruments will beavailable in amounts or on terms acceptable to us, if at all.
22
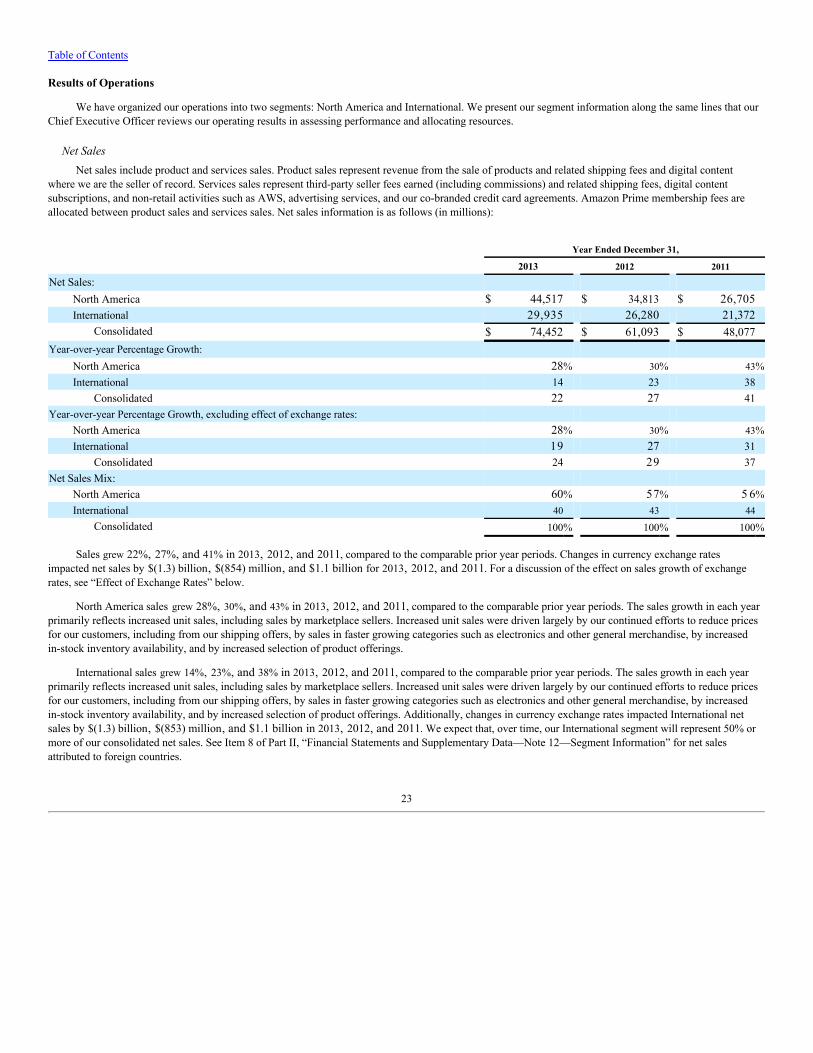
Table of Contents
Results of Operations
We have organized our operations into two segments: North America and International. We present our segment information along the same lines that ourChief Executive Officer reviews our operating results in assessing performance and allocating resources.
Net SalesNet sales include product and services sales. Product sales represent revenue from the sale of products and related shipping fees and digital content
where we are the seller of record. Services sales represent third-party seller fees earned (including commissions) and related shipping fees, digital contentsubscriptions, and non-retail activities such as AWS, advertising services, and our co-branded credit card agreements. Amazon Prime membership fees areallocated between product sales and services sales. Net sales information is as follows (in millions):
Year Ended December 31,
2013 2012 2011
Net Sales: North America $ 44,517 $ 34,813 $ 26,705International 29,935 26,280 21,372
Consolidated $ 74,452 $ 61,093 $ 48,077Year-over-year Percentage Growth:
North America 28% 30% 43%International 14 23 38
Consolidated 22 27 41Year-over-year Percentage Growth, excluding effect of exchange rates:
North America 28% 30% 43%International 19 27 31
Consolidated 24 29 37Net Sales Mix:
North America 60% 57% 5 6%International 40 43 44
Consolidated 100% 100% 100%
Sales grew 22%, 27%, and 41% in 2013, 2012, and 2011, compared to the comparable prior year periods. Changes in currency exchange ratesimpacted net sales by $(1.3) billion, $(854) million, and $1.1 billion for 2013, 2012, and 2011. For a discussion of the effect on sales growth of exchangerates, see “Effect of Exchange Rates” below.
North America sales grew 28%, 30%, and 43% in 2013, 2012, and 2011, compared to the comparable prior year periods. The sales growth in each yearprimarily reflects increased unit sales, including sales by marketplace sellers. Increased unit sales were driven largely by our continued efforts to reduce pricesfor our customers, including from our shipping offers, by sales in faster growing categories such as electronics and other general merchandise, by increasedin-stock inventory availability, and by increased selection of product offerings.
International sales grew 14%, 23%, and 38% in 2013, 2012, and 2011, compared to the comparable prior year periods. The sales growth in each yearprimarily reflects increased unit sales, including sales by marketplace sellers. Increased unit sales were driven largely by our continued efforts to reduce pricesfor our customers, including from our shipping offers, by sales in faster growing categories such as electronics and other general merchandise, by increasedin-stock inventory availability, and by increased selection of product offerings. Additionally, changes in currency exchange rates impacted International netsales by $(1.3) billion, $(853) million, and $1.1 billion in 2013, 2012, and 2011. We expect that, over time, our International segment will represent 50% ormore of our consolidated net sales. See Item 8 of Part II, “Financial Statements and Supplementary Data—Note 12—Segment Information” for net salesattributed to foreign countries.
23
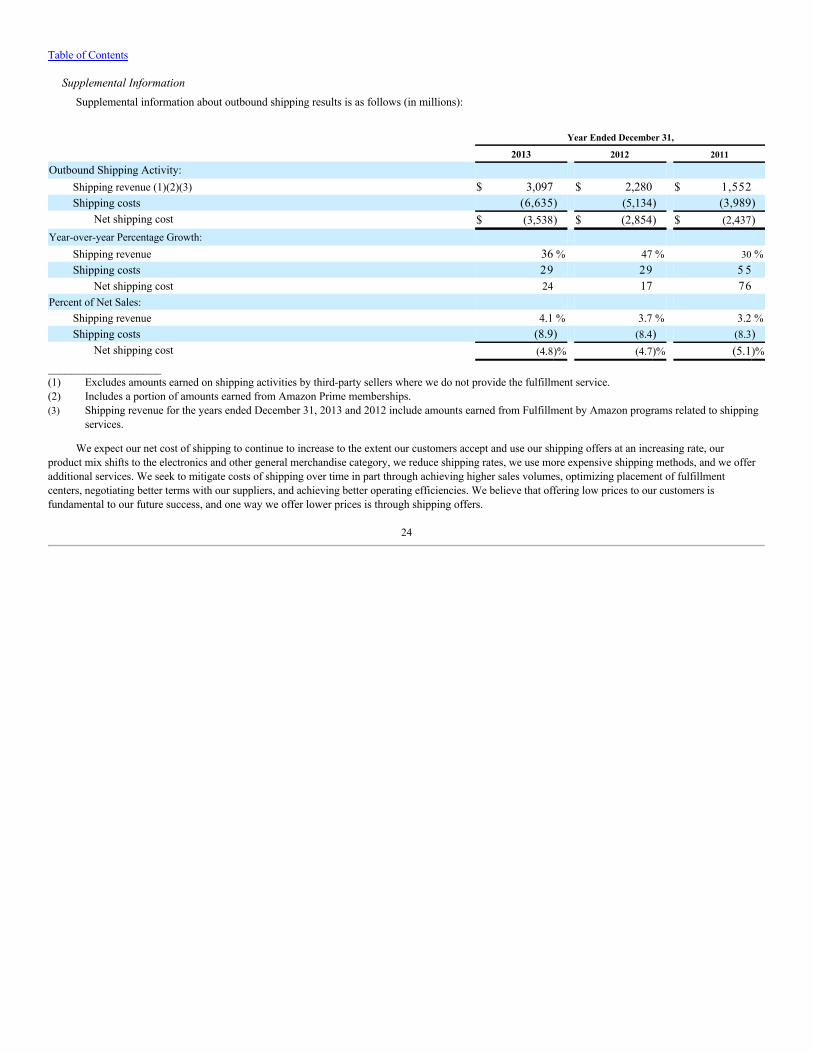
Table of Contents
Supplemental InformationSupplemental information about outbound shipping results is as follows (in millions):
Year Ended December 31,
2013 2012 2011
Outbound Shipping Activity: Shipping revenue (1)(2)(3) $ 3,097 $ 2,280 $ 1,552Shipping costs (6,635) (5,134) (3,989)
Net shipping cost $ (3,538) $ (2,854) $ (2,437)Year-over-year Percentage Growth:
Shipping revenue 36 % 47 % 30 %Shipping costs 29 29 5 5
Net shipping cost 24 17 76Percent of Net Sales:
Shipping revenue 4.1 % 3.7 % 3.2 %Shipping costs (8.9) (8.4) (8.3)
Net shipping cost (4.8)% (4.7)% (5.1)%___________________(1) Excludes amounts earned on shipping activities by third-party sellers where we do not provide the fulfillment service.(2) Includes a portion of amounts earned from Amazon Prime memberships.(3) Shipping revenue for the years ended December 31, 2013 and 2012 include amounts earned from Fulfillment by Amazon programs related to shipping
services.
We expect our net cost of shipping to continue to increase to the extent our customers accept and use our shipping offers at an increasing rate, ourproduct mix shifts to the electronics and other general merchandise category, we reduce shipping rates, we use more expensive shipping methods, and we offeradditional services. We seek to mitigate costs of shipping over time in part through achieving higher sales volumes, optimizing placement of fulfillmentcenters, negotiating better terms with our suppliers, and achieving better operating efficiencies. We believe that offering low prices to our customers isfundamental to our future success, and one way we offer lower prices is through shipping offers.
24
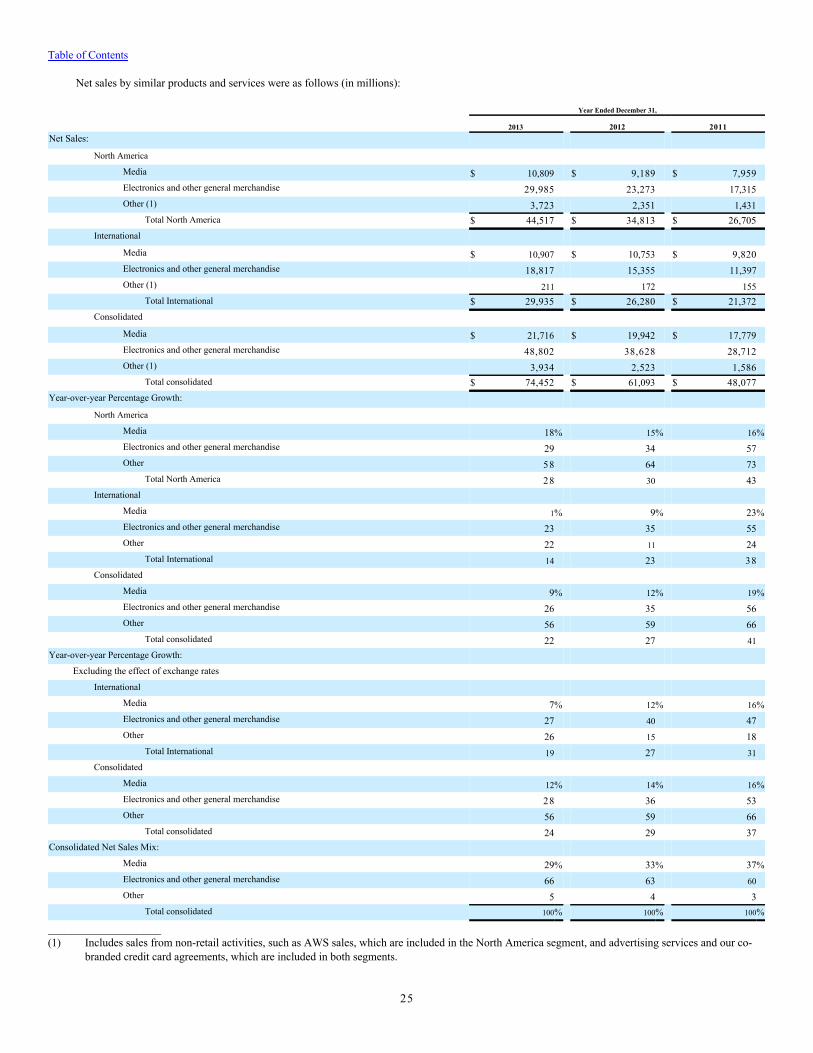
Table of Contents
Net sales by similar products and services were as follows (in millions):
Year Ended December 31,
2013 2012 2011Net Sales:
North America Media $ 10,809 $ 9,189 $ 7,959Electronics and other general merchandise 29,985 23,273 17,315Other (1) 3,723 2,351 1,431
Total North America $ 44,517 $ 34,813 $ 26,705International
Media $ 10,907 $ 10,753 $ 9,820Electronics and other general merchandise 18,817 15,355 11,397Other (1) 211 172 155
Total International $ 29,935 $ 26,280 $ 21,372Consolidated
Media $ 21,716 $ 19,942 $ 17,779Electronics and other general merchandise 48,802 38,628 28,712Other (1) 3,934 2,523 1,586
Total consolidated $ 74,452 $ 61,093 $ 48,077Year-over-year Percentage Growth:
North America Media 18% 15% 16%Electronics and other general merchandise 29 34 57Other 58 64 73
Total North America 28 30 43International
Media 1% 9% 23%Electronics and other general merchandise 23 35 55Other 22 11 24
Total International 14 23 38Consolidated
Media 9% 12% 19%Electronics and other general merchandise 26 35 56Other 56 59 66
Total consolidated 22 27 41Year-over-year Percentage Growth:
Excluding the effect of exchange rates International
Media 7% 12% 16%Electronics and other general merchandise 27 40 47Other 26 15 18
Total International 19 27 31Consolidated
Media 12% 14% 16%Electronics and other general merchandise 28 36 53Other 56 59 66
Total consolidated 24 29 37Consolidated Net Sales Mix:
Media 29% 33% 37%Electronics and other general merchandise 66 63 60Other 5 4 3
Total consolidated 100% 100% 100%
___________________(1) Includes sales from non-retail activities, such as AWS sales, which are included in the North America segment, and advertising services and our co-
branded credit card agreements, which are included in both segments.
25

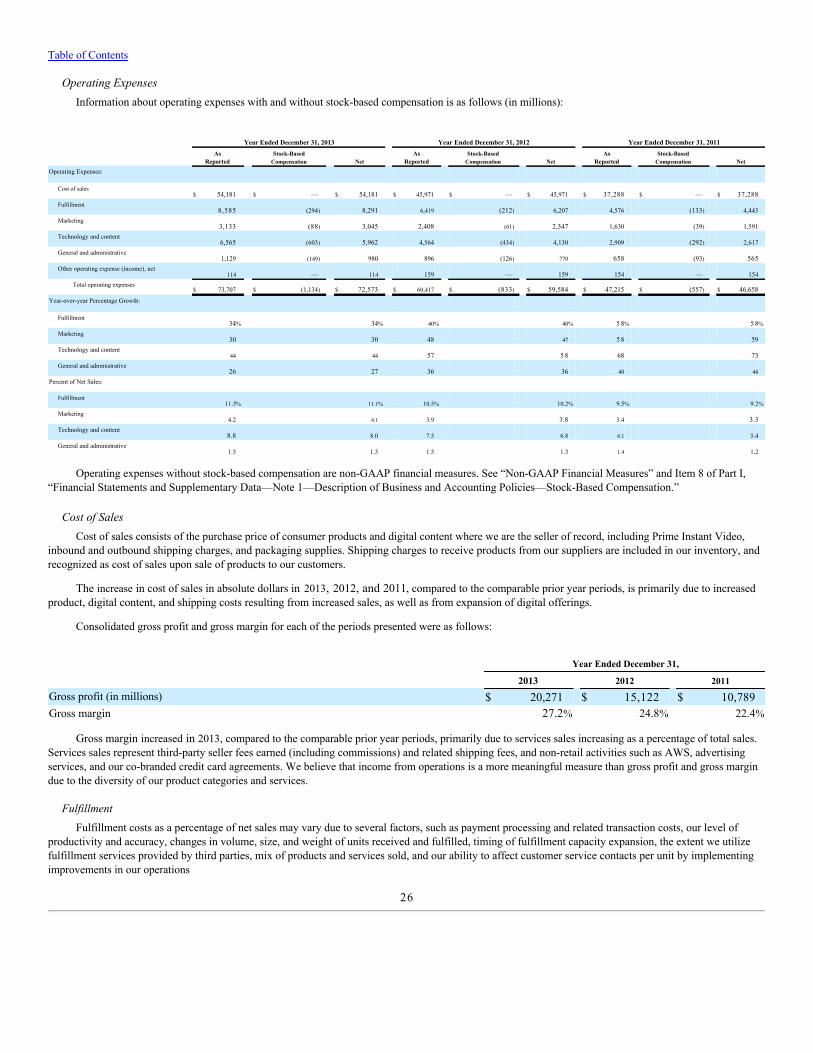
Table of Contents
Operating ExpensesInformation about operating expenses with and without stock-based compensation is as follows (in millions):
Year Ended December 31, 2013 Year Ended December 31, 2012 Year Ended December 31, 2011
As
Reported Stock-BasedCompensation Net As
Reported Stock-BasedCompensation Net As
Reported Stock-BasedCompensation Net
Operating Expenses: Cost of sales
$ 54,181 $ — $ 54,181 $ 45,971 $ — $ 45,971 $ 37,288 $ — $ 37,288Fulfillment
8,585 (294) 8,291 6,419 (212) 6,207 4,576 (133) 4,443Marketing
3,133 (88) 3,045 2,408 (61) 2,347 1,630 (39) 1,591Technology and content
6,565 (603) 5,962 4,564 (434) 4,130 2,909 (292) 2,617General and administrative
1,129 (149) 980 896 (126) 770 658 (93) 565Other operating expense (income), net
114 — 114 159 — 159 154 — 154Total operating expenses
$ 73,707 $ (1,134) $ 72,573 $ 60,417 $ (833) $ 59,584 $ 47,215 $ (557) $ 46,658Year-over-year Percentage Growth:
Fulfillment34% 34% 40% 40% 5 8% 5 8%
Marketing30 30 48 47 5 8 59
Technology and content44 44 57 5 8 68 73
General and administrative26 27 36 36 40 46
Percent of Net Sales: Fulfillment
11.5% 11.1% 10.5% 10.2% 9.5% 9.2%
Marketing4.2 4.1 3.9 3.8 3.4 3.3
Technology and content8.8 8.0 7.5 6.8 6.1 5.4
General and administrative1.5 1.3 1.5 1.3 1.4 1.2
Operating expenses without stock-based compensation are non-GAAP financial measures. See “Non-GAAP Financial Measures” and Item 8 of Part I,“Financial Statements and Supplementary Data—Note 1—Description of Business and Accounting Policies—Stock-Based Compensation.”
Cost of SalesCost of sales consists of the purchase price of consumer products and digital content where we are the seller of record, including Prime Instant Video,
inbound and outbound shipping charges, and packaging supplies. Shipping charges to receive products from our suppliers are included in our inventory, andrecognized as cost of sales upon sale of products to our customers.
The increase in cost of sales in absolute dollars in 2013, 2012, and 2011, compared to the comparable prior year periods, is primarily due to increasedproduct, digital content, and shipping costs resulting from increased sales, as well as from expansion of digital offerings.
Consolidated gross profit and gross margin for each of the periods presented were as follows:
Year Ended December 31,
2013 2012 2011
Gross profit (in millions) $ 20,271 $ 15,122 $ 10,789Gross margin 27.2% 24.8% 22.4%
Gross margin increased in 2013, compared to the comparable prior year periods, primarily due to services sales increasing as a percentage of total sales.Services sales represent third-party seller fees earned (including commissions) and related shipping fees, and non-retail activities such as AWS, advertisingservices, and our co-branded credit card agreements. We believe that income from operations is a more meaningful measure than gross profit and gross margindue to the diversity of our product categories and services.
FulfillmentFulfillment costs as a percentage of net sales may vary due to several factors, such as payment processing and related transaction costs, our level of
productivity and accuracy, changes in volume, size, and weight of units received and fulfilled, timing of fulfillment capacity expansion, the extent we utilizefulfillment services provided by third parties, mix of products and services sold, and our ability to affect customer service contacts per unit by implementingimprovements in our operations
26

Table of Contents
and enhancements to our customer self-service features. Additionally, because payment processing and fulfillment costs associated with seller transactions arebased on the gross purchase price of underlying transactions, and payment processing and related transaction and fulfillment costs are higher as a percentageof sales versus our retail sales, sales by our sellers have higher fulfillment costs as a percent of net sales.
The increase in fulfillment costs in absolute dollars in 2013, 2012, and 2011, compared to the comparable prior year periods, is primarily due tovariable costs corresponding with increased physical and digital product and services sales volume, inventory levels, and sales mix; costs from expandingfulfillment capacity; and payment processing and related transaction costs.
We seek to expand our fulfillment capacity to accommodate greater selection and in-stock inventory levels and meet anticipated shipment volumes fromsales of our own products as well as sales by third parties for which we provide the fulfillment services. We evaluate our facility requirements as necessary.
MarketingWe direct customers to our websites primarily through a number of targeted online marketing channels, such as our Associates program, sponsored
search, portal advertising, email marketing campaigns, and other initiatives. Our marketing expenses are largely variable, based on growth in sales andchanges in rates. To the extent there is increased or decreased competition for these traffic sources, or to the extent our mix of these channels shifts, we wouldexpect to see a corresponding change in our marketing expense.
The increase in marketing costs in absolute dollars in 2013, 2012, and 2011, compared to the comparable prior year periods, is primarily due toincreased spending on online marketing channels, such as our sponsored search programs and our Associates program, payroll and related expenses, andtelevision advertising.
While costs associated with Amazon Prime memberships and other shipping offers are not included in marketing expense, we view these offers aseffective worldwide marketing tools, and intend to continue offering them indefinitely.
Technology and ContentWe seek to efficiently invest in several areas of technology and content such as technology infrastructure, including AWS, expansion of new and existing
product categories and offerings, and initiatives to expand our ecosystem of digital products and services, as well as in technology infrastructure so we maycontinue to enhance the customer experience and improve our process efficiency. We expect spending in technology and content to increase over time as wecontinue to add employees and technology infrastructure.
The increase in technology and content costs in absolute dollars in 2013, 2012, and 2011, compared to the comparable prior year periods, is primarilydue to increases in payroll and related expenses, including those associated with our initiatives to expand our ecosystem of digital products and services, andincreased spending on technology infrastructure, including AWS. We expect these trends to continue over time as we invest in these areas by increasing payrolland related expenses and adding technology infrastructure.
For 2013, 2012, and 2011, we capitalized $581 million (including $87 million of stock-based compensation), $454 million (including $74 million ofstock-based compensation), and $307 million (including $51 million of stock-based compensation) of costs associated with internal-use software and websitedevelopment. Amortization of previously capitalized amounts was $451 million, $327 million, and $236 million for 2013, 2012, and 2011. A majority ofour technology costs are incurred in the U.S., most of which are allocated to our North America segment. Infrastructure, other technology, and operating costsincurred to support AWS are included in technology and content.
General and AdministrativeThe increase in general and administrative costs in absolute dollars in 2013, 2012, and 2011, compared to the comparable prior year periods, is
primarily due to increases in payroll and related expenses.
Stock-Based CompensationStock-based compensation was $1.1 billion, $833 million, and $557 million during 2013, 2012, and 2011. The increase in 2013, 2012, and 2011,
compared to the comparable prior year periods, is primarily due to an increase in the number of stock-based compensation awards granted to existing and newemployees.
27
Table of Contents
Other Operating Expense (Income), NetOther operating expense (income), net was $114 million, $159 million, and $154 million during 2013, 2012, and 2011, and was primarily related to
the amortization of intangible assets, partially offset by the settlement of certain unclaimed property and indemnification claims in Q3 2013.
Income from OperationsFor the reasons discussed above, income from operations increased 10% in 2013, decreased 22% in 2012, and decreased 39% in 2011.
Interest Income and ExpenseOur interest income was $38 million, $40 million, and $61 million during 2013, 2012, and 2011. We generally invest our excess cash in investment
grade short- to intermediate-term fixed income securities and AAA-rated money market funds. Our interest income corresponds with the average balance ofinvested funds and the prevailing rates we are earning on them, which vary depending on the geographies and currencies in which they are invested.
The primary components of our interest expense are related to our long-term debt and capital and financing lease arrangements. Interest expense was$141 million, $92 million, and $65 million in 2013, 2012, and 2011.
Our long-term debt was $3.2 billion and $3.1 billion as of December 31, 2013 and 2012. Our other long-term liabilities were $4.2 billion and $2.3billion as of December 31, 2013 and 2012. See Item 8 of Part II, “Financial Statements and Supplementary Data—Note 6—Long-Term Debt and Note 7—Other Long-Term Liabilities” for additional information.
Other Income (Expense), NetOther income (expense), net was $(136) million, $(80) million, and $76 million during 2013, 2012, and 2011. The primary component of other
income (expense), net is related to foreign-currency gains (losses) on intercompany balances.
Income TaxesOur effective tax rate is subject to significant variation due to several factors, including variability in our pre-tax and taxable income and loss and the
mix of jurisdictions to which they relate, changes in how we do business, acquisitions (including integrations) and investments, audit developments, foreigncurrency gains (losses), changes in law, regulations, and administrative practices, and relative changes of expenses or losses for which tax benefits are notrecognized.
We recorded a provision for income taxes of $161 million, $428 million, and $291 million in 2013, 2012, and 2011. Our effective tax rate in 2013 waslower than the 35% U.S. federal statutory rate and our effective tax rate in 2012 primarily due to the favorable impact of earnings in lower tax ratejurisdictions, a decline in the proportion of our losses for which we may not realize a related tax benefit, and the retroactive extension of the U.S. federalresearch and development credit, which expired in December 2013. The favorable impact of earnings in lower tax rate jurisdictions primarily relates to ourEuropean operations, which are headquartered in Luxembourg. Losses for which we may not realize a related tax benefit, primarily due to losses of foreignsubsidiaries, reduce our pre-tax income without a corresponding reduction in our tax expense, and therefore increase our effective tax rate. In 2013, werecognized tax benefits for a greater proportion of these losses as compared to 2012. We have recorded valuation allowances against the deferred tax assetsassociated with losses for which we may not realize a related tax benefit.
In 2012, our effective tax rate was higher than the 35% U.S. federal statutory rate and our effective tax rate in 2011 primarily due to the adverse impactof foreign jurisdiction losses of subsidiaries primarily located outside of Europe for which we may not realize a tax benefit. The adverse impact of these losseswas partially offset by the favorable impact of earnings in lower tax rate jurisdictions primarily related to our European operations. Additionally, our effectivetax rate in 2012 was more volatile as compared to 2011 due to the lower level of pre-tax income generated during the year, relative to our tax expense. Oureffective tax rate in 2012 was also adversely impacted by acquisitions (including integrations), audit developments, nondeductible expenses, and changes intax law such as the expiration of the U.S. federal research and development credit at the end of 2011.
We have tax benefits relating to excess stock-based compensation deductions that are being utilized to reduce our U.S. taxable income. As ofDecember 31, 2013, our federal net operating loss carryforward was approximately $275 million and we had approximately $295 million of federal taxcredits potentially available to offset future tax liabilities.
28
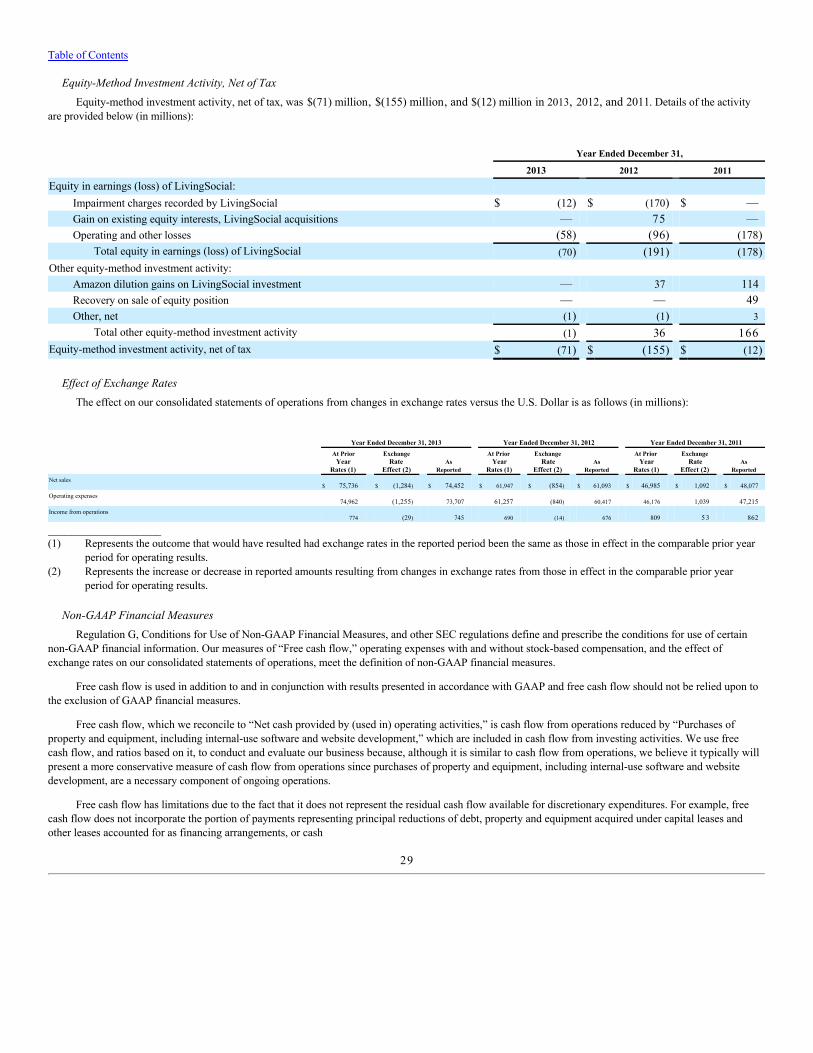
Table of Contents
Equity-Method Investment Activity, Net of TaxEquity-method investment activity, net of tax, was $(71) million, $(155) million, and $(12) million in 2013, 2012, and 2011. Details of the activity
are provided below (in millions):
Year Ended December 31,
2013 2012 2011
Equity in earnings (loss) of LivingSocial: Impairment charges recorded by LivingSocial $ (12) $ (170) $ —Gain on existing equity interests, LivingSocial acquisitions — 75 —Operating and other losses (58) (96) (178)
Total equity in earnings (loss) of LivingSocial (70) (191) (178)Other equity-method investment activity:
Amazon dilution gains on LivingSocial investment — 37 114Recovery on sale of equity position — — 49Other, net (1) (1) 3
Total other equity-method investment activity (1) 36 166Equity-method investment activity, net of tax $ (71) $ (155) $ (12)
Effect of Exchange RatesThe effect on our consolidated statements of operations from changes in exchange rates versus the U.S. Dollar is as follows (in millions):
Year Ended December 31, 2013 Year Ended December 31, 2012 Year Ended December 31, 2011
At PriorYear
Rates (1) Exchange
RateEffect (2) As
Reported At Prior
YearRates (1)
ExchangeRate
Effect (2) AsReported
At PriorYear
Rates (1) Exchange
RateEffect (2) As
ReportedNet sales
$ 75,736 $ (1,284) $ 74,452 $ 61,947 $ (854) $ 61,093 $ 46,985 $ 1,092 $ 48,077Operating expenses
74,962 (1,255) 73,707 61,257 (840) 60,417 46,176 1,039 47,215Income from operations
774 (29) 745 690 (14) 676 809 5 3 862
___________________(1) Represents the outcome that would have resulted had exchange rates in the reported period been the same as those in effect in the comparable prior year
period for operating results.(2) Represents the increase or decrease in reported amounts resulting from changes in exchange rates from those in effect in the comparable prior year
period for operating results.
Non-GAAP Financial MeasuresRegulation G, Conditions for Use of Non-GAAP Financial Measures, and other SEC regulations define and prescribe the conditions for use of certain
non-GAAP financial information. Our measures of “Free cash flow,” operating expenses with and without stock-based compensation, and the effect ofexchange rates on our consolidated statements of operations, meet the definition of non-GAAP financial measures.
Free cash flow is used in addition to and in conjunction with results presented in accordance with GAAP and free cash flow should not be relied upon tothe exclusion of GAAP financial measures.
Free cash flow, which we reconcile to “Net cash provided by (used in) operating activities,” is cash flow from operations reduced by “Purchases ofproperty and equipment, including internal-use software and website development,” which are included in cash flow from investing activities. We use freecash flow, and ratios based on it, to conduct and evaluate our business because, although it is similar to cash flow from operations, we believe it typically willpresent a more conservative measure of cash flow from operations since purchases of property and equipment, including internal-use software and websitedevelopment, are a necessary component of ongoing operations.
Free cash flow has limitations due to the fact that it does not represent the residual cash flow available for discretionary expenditures. For example, freecash flow does not incorporate the portion of payments representing principal reductions of debt, property and equipment acquired under capital leases andother leases accounted for as financing arrangements, or cash
29
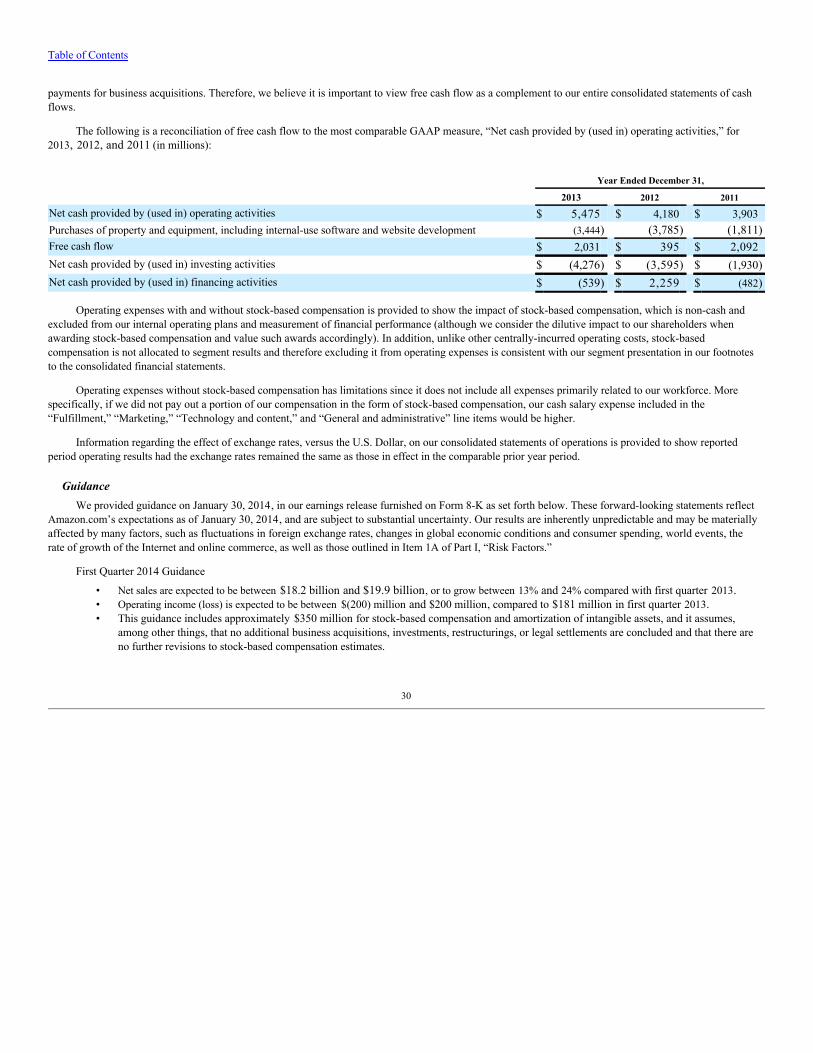
Table of Contents
payments for business acquisitions. Therefore, we believe it is important to view free cash flow as a complement to our entire consolidated statements of cashflows.
The following is a reconciliation of free cash flow to the most comparable GAAP measure, “Net cash provided by (used in) operating activities,” for2013, 2012, and 2011 (in millions):
Year Ended December 31,
2013 2012 2011
Net cash provided by (used in) operating activities $ 5,475 $ 4,180 $ 3,903Purchases of property and equipment, including internal-use software and website development (3,444) (3,785) (1,811)Free cash flow $ 2,031 $ 395 $ 2,092Net cash provided by (used in) investing activities $ (4,276) $ (3,595) $ (1,930)Net cash provided by (used in) financing activities $ (539) $ 2,259 $ (482)
Operating expenses with and without stock-based compensation is provided to show the impact of stock-based compensation, which is non-cash andexcluded from our internal operating plans and measurement of financial performance (although we consider the dilutive impact to our shareholders whenawarding stock-based compensation and value such awards accordingly). In addition, unlike other centrally-incurred operating costs, stock-basedcompensation is not allocated to segment results and therefore excluding it from operating expenses is consistent with our segment presentation in our footnotesto the consolidated financial statements.
Operating expenses without stock-based compensation has limitations since it does not include all expenses primarily related to our workforce. Morespecifically, if we did not pay out a portion of our compensation in the form of stock-based compensation, our cash salary expense included in the“Fulfillment,” “Marketing,” “Technology and content,” and “General and administrative” line items would be higher.
Information regarding the effect of exchange rates, versus the U.S. Dollar, on our consolidated statements of operations is provided to show reportedperiod operating results had the exchange rates remained the same as those in effect in the comparable prior year period.
GuidanceWe provided guidance on January 30, 2014, in our earnings release furnished on Form 8-K as set forth below. These forward-looking statements reflect
Amazon.com’s expectations as of January 30, 2014, and are subject to substantial uncertainty. Our results are inherently unpredictable and may be materiallyaffected by many factors, such as fluctuations in foreign exchange rates, changes in global economic conditions and consumer spending, world events, therate of growth of the Internet and online commerce, as well as those outlined in Item 1A of Part I, “Risk Factors.”
First Quarter 2014 Guidance
• Net sales are expected to be between $18.2 billion and $19.9 billion, or to grow between 13% and 24% compared with first quarter 2013.• Operating income (loss) is expected to be between $(200) million and $200 million, compared to $181 million in first quarter 2013.• This guidance includes approximately $350 million for stock-based compensation and amortization of intangible assets, and it assumes,
among other things, that no additional business acquisitions, investments, restructurings, or legal settlements are concluded and that there areno further revisions to stock-based compensation estimates.
30
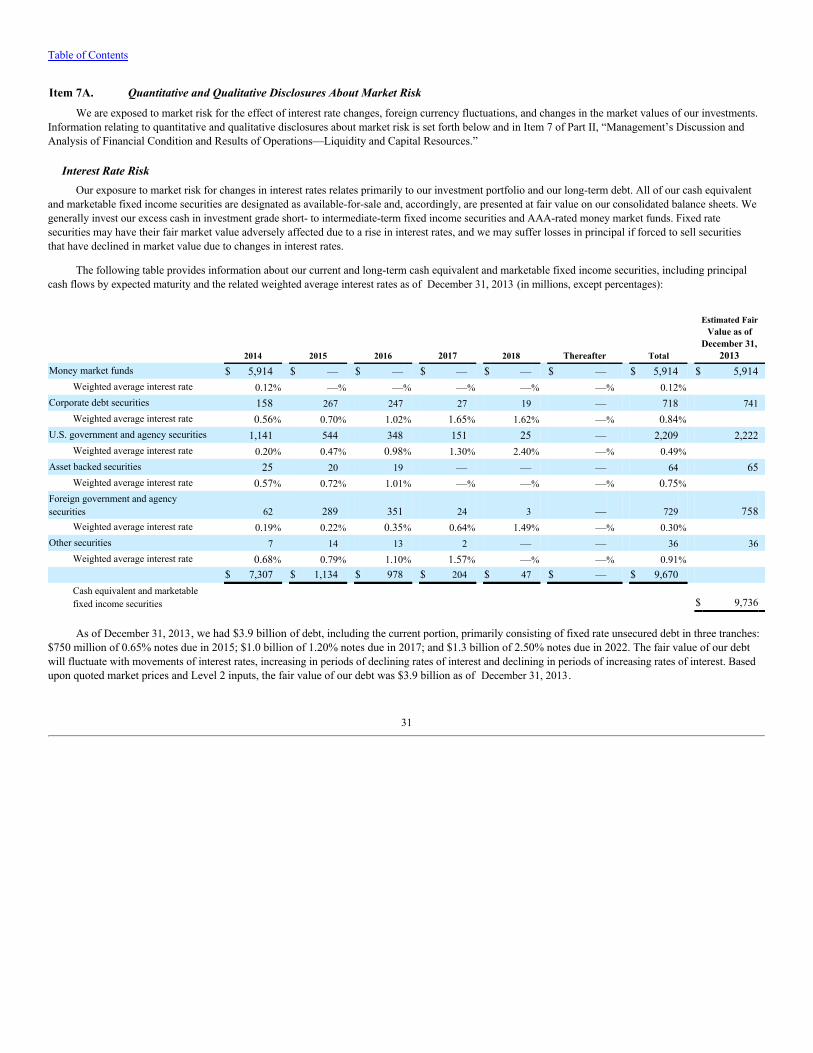
Table of Contents
Item 7A. Quantitative and Qualitative Disclosures About Market Risk
We are exposed to market risk for the effect of interest rate changes, foreign currency fluctuations, and changes in the market values of our investments.Information relating to quantitative and qualitative disclosures about market risk is set forth below and in Item 7 of Part II, “Management’s Discussion andAnalysis of Financial Condition and Results of Operations—Liquidity and Capital Resources.”
Interest Rate RiskOur exposure to market risk for changes in interest rates relates primarily to our investment portfolio and our long-term debt. All of our cash equivalent
and marketable fixed income securities are designated as available-for-sale and, accordingly, are presented at fair value on our consolidated balance sheets. Wegenerally invest our excess cash in investment grade short- to intermediate-term fixed income securities and AAA-rated money market funds. Fixed ratesecurities may have their fair market value adversely affected due to a rise in interest rates, and we may suffer losses in principal if forced to sell securitiesthat have declined in market value due to changes in interest rates.
The following table provides information about our current and long-term cash equivalent and marketable fixed income securities, including principalcash flows by expected maturity and the related weighted average interest rates as of December 31, 2013 (in millions, except percentages):
2014 2015 2016 2017 2018 Thereafter Total
Estimated FairValue as of
December 31,2013
Money market funds $ 5,914 $ — $ — $ — $ — $ — $ 5,914 $ 5,914Weighted average interest rate 0.12% —% —% —% —% —% 0.12%
Corporate debt securities 158 267 247 27 19 — 718 741Weighted average interest rate 0.56% 0.70% 1.02% 1.65% 1.62% —% 0.84%
U.S. government and agency securities 1,141 544 348 151 25 — 2,209 2,222Weighted average interest rate 0.20% 0.47% 0.98% 1.30% 2.40% —% 0.49%
Asset backed securities 25 20 19 — — — 64 65Weighted average interest rate 0.57% 0.72% 1.01% —% —% —% 0.75%
Foreign government and agencysecurities 62 289 351 24 3 — 729 758
Weighted average interest rate 0.19% 0.22% 0.35% 0.64% 1.49% —% 0.30% Other securities 7 14 13 2 — — 36 36
Weighted average interest rate 0.68% 0.79% 1.10% 1.57% —% —% 0.91% $ 7,307 $ 1,134 $ 978 $ 204 $ 47 $ — $ 9,670
Cash equivalent and marketablefixed income securities $ 9,736
As of December 31, 2013, we had $3.9 billion of debt, including the current portion, primarily consisting of fixed rate unsecured debt in three tranches:$750 million of 0.65% notes due in 2015; $1.0 billion of 1.20% notes due in 2017; and $1.3 billion of 2.50% notes due in 2022. The fair value of our debtwill fluctuate with movements of interest rates, increasing in periods of declining rates of interest and declining in periods of increasing rates of interest. Basedupon quoted market prices and Level 2 inputs, the fair value of our debt was $3.9 billion as of December 31, 2013.
31
Table of Contents
Foreign Exchange RiskDuring 2013, net sales from our International segment accounted for 40% of our consolidated revenues. Net sales and related expenses generated from our
international websites, as well as those relating to www.amazon.ca (which is included in our North America segment), are denominated in the functionalcurrencies of the corresponding websites and primarily include Euros, British Pounds, Japanese Yen, and Chinese Yuan. The functional currency of oursubsidiaries that either operate or support these websites is the same as the corresponding local currency. The results of operations of, and certain of ourintercompany balances associated with, our internationally-focused websites are exposed to foreign exchange rate fluctuations. Upon consolidation, asexchange rates vary, net sales and other operating results may differ materially from expectations, and we may record significant gains or losses on theremeasurement of intercompany balances. For example, as a result of fluctuations in foreign exchange rates during 2013, International segment revenuesdecreased $1.3 billion in comparison with the prior year.
We have foreign exchange risk related to foreign-denominated cash, cash equivalents, and marketable securities (“foreign funds”). Based on the balanceof foreign funds as of December 31, 2013, of $5.6 billion, an assumed 5%, 10%, and 20% negative currency movement would result in fair value declines of$280 million, $560 million, and $1.1 billion. All investments are classified as “available-for-sale.” Fluctuations in fair value are recorded in “Accumulatedother comprehensive loss,” a separate component of stockholders’ equity.
We have foreign exchange risk related to our intercompany balances denominated in various foreign currencies. Based on the intercompany balances asof December 31, 2013, an assumed 5%, 10%, and 20% adverse change to foreign exchange would result in losses of $55 million, $120 million, and $270million, recorded to “Other income (expense), net.”
See Item 7 of Part II, “Management’s Discussion and Analysis of Financial Condition and Results of Operations—Results of Operations—Effect ofExchange Rates” for additional information on the effect on reported results of changes in exchange rates.
Investment RiskAs of December 31, 2013, our recorded basis in equity investments was $127 million. These investments primarily relate to equity and cost method
investments in private companies. We review our investments for impairment when events and circumstances indicate that the decline in fair value of suchassets below the carrying value is other-than-temporary. Our analysis includes review of recent operating results and trends, recent sales/acquisitions of theinvestee securities, and other publicly available data. The current global economic climate provides additional uncertainty. Valuations of private companies areinherently more difficult due to the lack of readily available market data. As such, we believe that market sensitivities are not practicable.
32
Table of Contents
Item 8. Financial Statements and Supplementary Data
INDEX TO CONSOLIDATED FINANCIAL STATEMENTS
Page
Report of Ernst & Young LLP, Independent Registered Public Accounting Firm 34Consolidated Statements of Cash Flows 35Consolidated Statements of Operations 36Consolidated Statements of Comprehensive Income 37Consolidated Balance Sheets 38Consolidated Statements of Stockholders’ Equity 39Notes to Consolidated Financial Statements 40
33
Table of Contents
Report of Independent Registered Public Accounting Firm
The Board of Directors and ShareholdersAmazon.com, Inc.
We have audited the accompanying consolidated balance sheets of Amazon.com, Inc. as of December 31, 2013 and 2012, and the related consolidatedstatements of operations, comprehensive income, stockholders’ equity, and cash flows for each of the three years in the period ended December 31, 2013.These financial statements are the responsibility of the Company’s management. Our responsibility is to express an opinion on these financial statementsbased on our audits.
We conducted our audits in accordance with the standards of the Public Company Accounting Oversight Board (United States). Those standardsrequire that we plan and perform the audit to obtain reasonable assurance about whether the financial statements are free of material misstatement. An auditalso includes examining, on a test basis, evidence supporting the amounts and disclosures in the financial statements. An audit also includes assessing theaccounting principles used and significant estimates made by management, as well as evaluating the overall financial statement presentation. We believe thatour audits provide a reasonable basis for our opinion.
In our opinion, the financial statements referred to above present fairly, in all material respects, the consolidated financial position of Amazon.com, Inc.at December 31, 2013 and 2012, and the consolidated results of its operations and its cash flows for each of the three years in the period ended December 31,2013, in conformity with U.S. generally accepted accounting principles.
We also have audited, in accordance with the standards of the Public Company Accounting Oversight Board (United States), Amazon.com, Inc.’sinternal control over financial reporting as of December 31, 2013, based on criteria established in Internal Control—Integrated Framework issued by theCommittee of Sponsoring Organizations of the Treadway Commission (1992 framework) and our report dated January 30, 2014 expressed an unqualifiedopinion thereon.
/s/ Ernst & Young LLP
Seattle, WashingtonJanuary 30, 2014
34
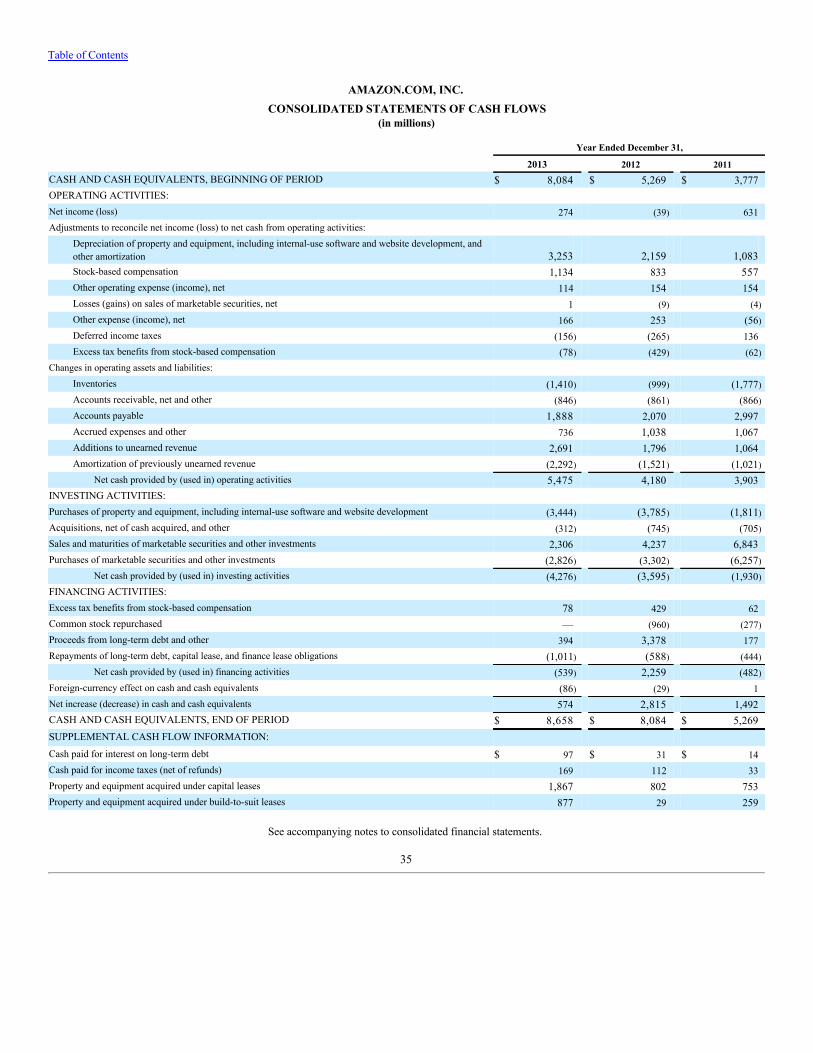
Table of Contents
AMAZON.COM, INC.CONSOLIDATED STATEMENTS OF CASH FLOWS
(in millions)
Year Ended December 31,
2013 2012 2011CASH AND CASH EQUIVALENTS, BEGINNING OF PERIOD $ 8,084 $ 5,269 $ 3,777OPERATING ACTIVITIES: Net income (loss) 274 (39) 631Adjustments to reconcile net income (loss) to net cash from operating activities:
Depreciation of property and equipment, including internal-use software and website development, andother amortization 3,253 2,159 1,083Stock-based compensation 1,134 833 557Other operating expense (income), net 114 154 154Losses (gains) on sales of marketable securities, net 1 (9) (4)
Other expense (income), net 166 253 (56)
Deferred income taxes (156) (265) 136Excess tax benefits from stock-based compensation (78) (429) (62)
Changes in operating assets and liabilities: Inventories (1,410) (999) (1,777)
Accounts receivable, net and other (846) (861) (866)
Accounts payable 1,888 2,070 2,997Accrued expenses and other 736 1,038 1,067Additions to unearned revenue 2,691 1,796 1,064Amortization of previously unearned revenue (2,292) (1,521) (1,021)
Net cash provided by (used in) operating activities 5,475 4,180 3,903INVESTING ACTIVITIES: Purchases of property and equipment, including internal-use software and website development (3,444) (3,785) (1,811)
Acquisitions, net of cash acquired, and other (312) (745) (705)
Sales and maturities of marketable securities and other investments 2,306 4,237 6,843Purchases of marketable securities and other investments (2,826) (3,302) (6,257)
Net cash provided by (used in) investing activities (4,276) (3,595) (1,930)
FINANCING ACTIVITIES: Excess tax benefits from stock-based compensation 78 429 62Common stock repurchased — (960) (277)
Proceeds from long-term debt and other 394 3,378 177Repayments of long-term debt, capital lease, and finance lease obligations (1,011) (588) (444)
Net cash provided by (used in) financing activities (539) 2,259 (482)
Foreign-currency effect on cash and cash equivalents (86) (29) 1Net increase (decrease) in cash and cash equivalents 574 2,815 1,492CASH AND CASH EQUIVALENTS, END OF PERIOD $ 8,658 $ 8,084 $ 5,269SUPPLEMENTAL CASH FLOW INFORMATION: Cash paid for interest on long-term debt $ 97 $ 31 $ 14Cash paid for income taxes (net of refunds) 169 112 33Property and equipment acquired under capital leases 1,867 802 753Property and equipment acquired under build-to-suit leases 877 29 259
See accompanying notes to consolidated financial statements.
35
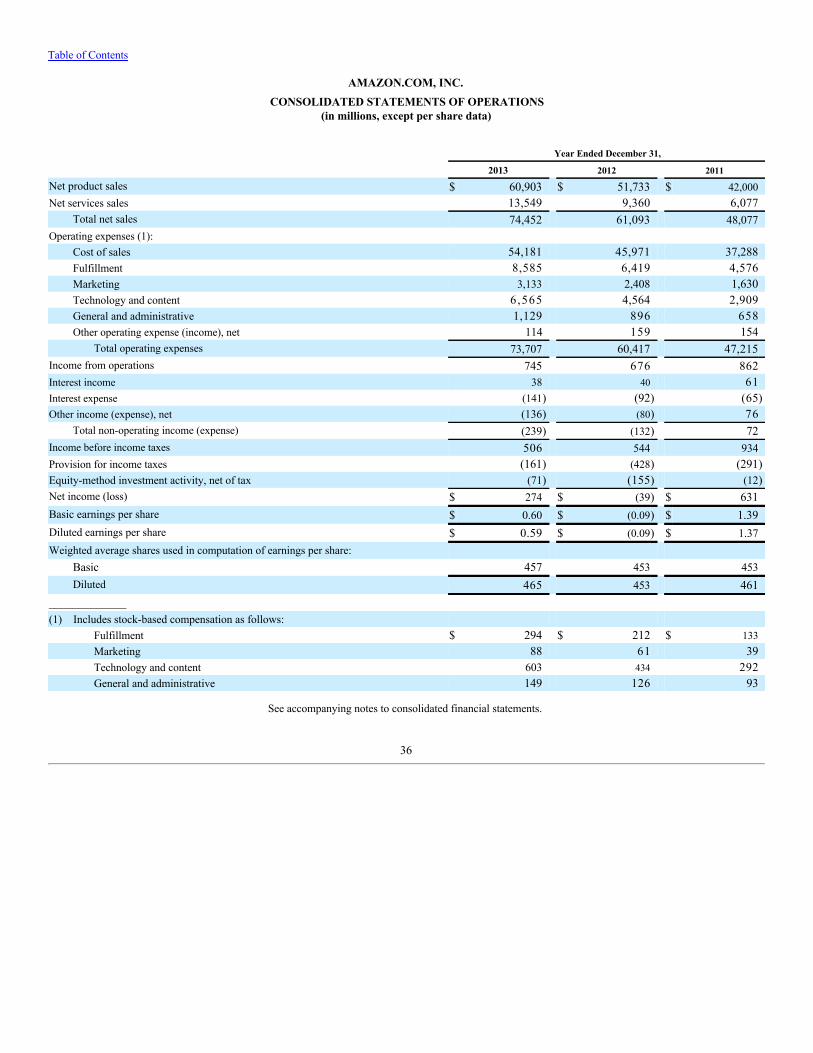
Table of Contents
AMAZON.COM, INC.CONSOLIDATED STATEMENTS OF OPERATIONS
(in millions, except per share data)
Year Ended December 31,
2013 2012 2011
Net product sales $ 60,903 $ 51,733 $ 42,000Net services sales 13,549 9,360 6,077
Total net sales 74,452 61,093 48,077Operating expenses (1):
Cost of sales 54,181 45,971 37,288Fulfillment 8,585 6,419 4,576Marketing 3,133 2,408 1,630Technology and content 6,565 4,564 2,909General and administrative 1,129 896 658Other operating expense (income), net 114 159 154
Total operating expenses 73,707 60,417 47,215Income from operations 745 676 862Interest income 38 40 61Interest expense (141) (92) (65)Other income (expense), net (136) (80) 76
Total non-operating income (expense) (239) (132) 72Income before income taxes 506 544 934Provision for income taxes (161) (428) (291)Equity-method investment activity, net of tax (71) (155) (12)Net income (loss) $ 274 $ (39) $ 631Basic earnings per share $ 0.60 $ (0.09) $ 1.39Diluted earnings per share $ 0.59 $ (0.09) $ 1.37Weighted average shares used in computation of earnings per share:
Basic 457 453 453Diluted 465 453 461
_____________ (1) Includes stock-based compensation as follows:
Fulfillment $ 294 $ 212 $ 133Marketing 88 61 39Technology and content 603 434 292General and administrative 149 126 93
See accompanying notes to consolidated financial statements.
36
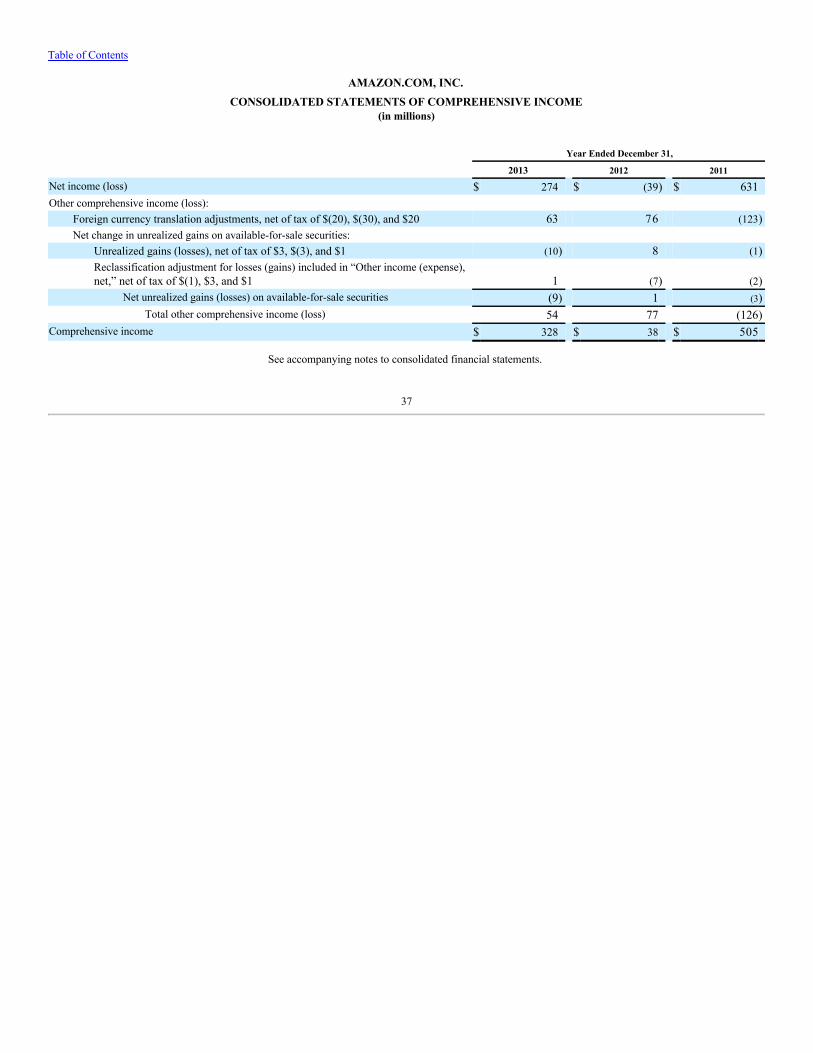
Table of Contents
AMAZON.COM, INC.CONSOLIDATED STATEMENTS OF COMPREHENSIVE INCOME
(in millions)
Year Ended December 31,
2013 2012 2011
Net income (loss) $ 274 $ (39) $ 631Other comprehensive income (loss):
Foreign currency translation adjustments, net of tax of $(20), $(30), and $20 63 76 (123)Net change in unrealized gains on available-for-sale securities:
Unrealized gains (losses), net of tax of $3, $(3), and $1 (10) 8 (1)Reclassification adjustment for losses (gains) included in “Other income (expense),net,” net of tax of $(1), $3, and $1 1 (7) (2)
Net unrealized gains (losses) on available-for-sale securities (9) 1 (3)Total other comprehensive income (loss) 54 77 (126)
Comprehensive income $ 328 $ 38 $ 505
See accompanying notes to consolidated financial statements.
37
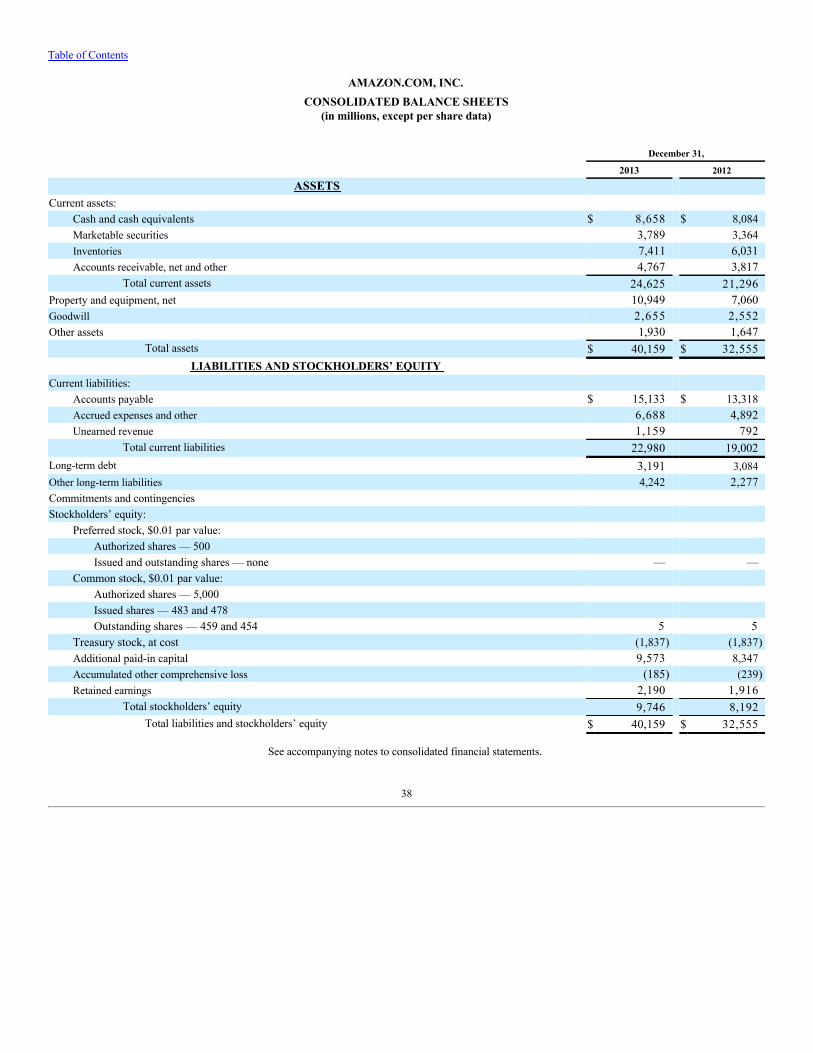
Table of Contents
AMAZON.COM, INC.CONSOLIDATED BALANCE SHEETS
(in millions, except per share data)
December 31,
2013 2012
ASSETS Current assets:
Cash and cash equivalents $ 8,658 $ 8,084Marketable securities 3,789 3,364Inventories 7,411 6,031Accounts receivable, net and other 4,767 3,817
Total current assets 24,625 21,296Property and equipment, net 10,949 7,060Goodwill 2,655 2,552Other assets 1,930 1,647
Total assets $ 40,159 $ 32,555LIABILITIES AND STOCKHOLDERS’ EQUITY
Current liabilities: Accounts payable $ 15,133 $ 13,318Accrued expenses and other 6,688 4,892Unearned revenue 1,159 792
Total current liabilities 22,980 19,002Long-term debt 3,191 3,084Other long-term liabilities 4,242 2,277Commitments and contingencies Stockholders’ equity:
Preferred stock, $0.01 par value: Authorized shares — 500 Issued and outstanding shares — none — —
Common stock, $0.01 par value: Authorized shares — 5,000 Issued shares — 483 and 478 Outstanding shares — 459 and 454 5 5
Treasury stock, at cost (1,837) (1,837)Additional paid-in capital 9,573 8,347Accumulated other comprehensive loss (185) (239)Retained earnings 2,190 1,916
Total stockholders’ equity 9,746 8,192Total liabilities and stockholders’ equity $ 40,159 $ 32,555
See accompanying notes to consolidated financial statements.
38
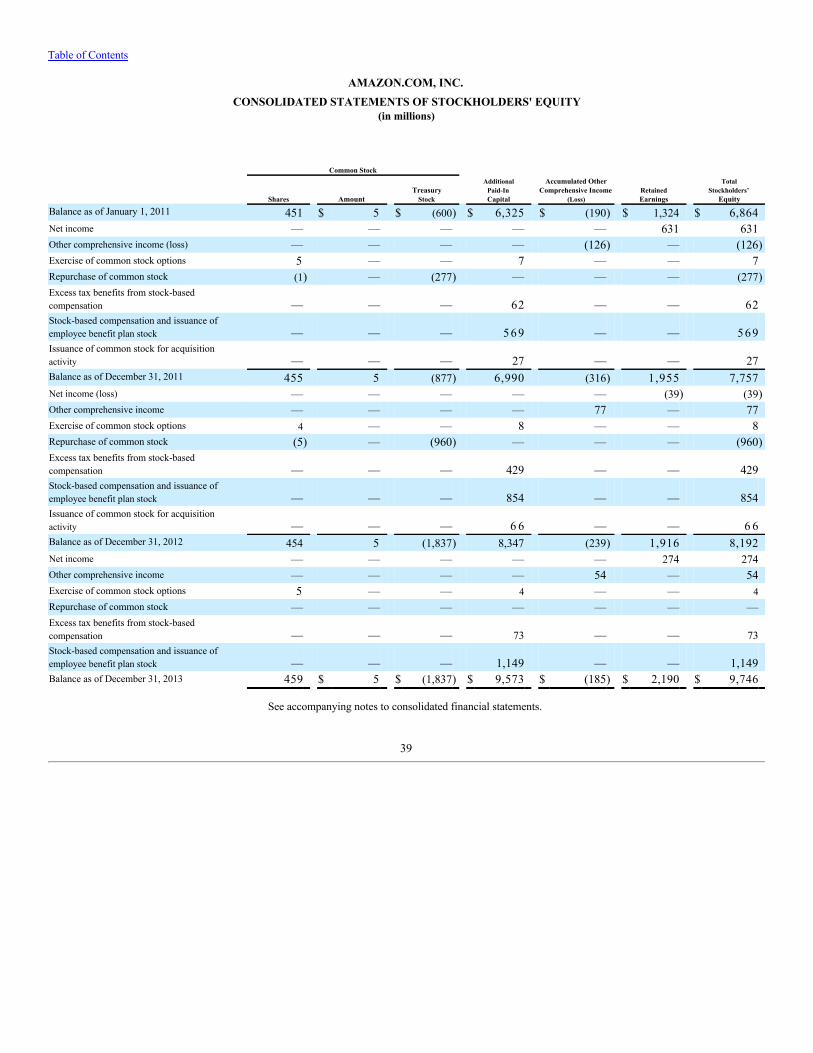
Table of Contents
AMAZON.COM, INC.CONSOLIDATED STATEMENTS OF STOCKHOLDERS' EQUITY
(in millions)
Common Stock
Shares Amount TreasuryStock
AdditionalPaid-InCapital
Accumulated OtherComprehensive Income
(Loss) RetainedEarnings
TotalStockholders’
Equity
Balance as of January 1, 2011 451 $ 5 $ (600) $ 6,325 $ (190) $ 1,324 $ 6,864Net income — — — — — 631 631Other comprehensive income (loss) — — — — (126) — (126)Exercise of common stock options 5 — — 7 — — 7Repurchase of common stock (1) — (277) — — — (277)Excess tax benefits from stock-basedcompensation — — — 62 — — 62Stock-based compensation and issuance ofemployee benefit plan stock — — — 5 6 9 — — 5 6 9Issuance of common stock for acquisitionactivity — — — 27 — — 27Balance as of December 31, 2011 455 5 (877) 6,990 (316) 1,955 7,757Net income (loss) — — — — — (39) (39)Other comprehensive income — — — — 77 — 77Exercise of common stock options 4 — — 8 — — 8Repurchase of common stock (5) — (960) — — — (960)Excess tax benefits from stock-basedcompensation — — — 429 — — 429Stock-based compensation and issuance ofemployee benefit plan stock — — — 854 — — 854Issuance of common stock for acquisitionactivity — — — 6 6 — — 6 6Balance as of December 31, 2012 454 5 (1,837) 8,347 (239) 1,916 8,192Net income — — — — — 274 274Other comprehensive income — — — — 54 — 54Exercise of common stock options 5 — — 4 — — 4Repurchase of common stock — — — — — — —Excess tax benefits from stock-basedcompensation — — — 73 — — 73Stock-based compensation and issuance ofemployee benefit plan stock — — — 1,149 — — 1,149Balance as of December 31, 2013 459 $ 5 $ (1,837) $ 9,573 $ (185) $ 2,190 $ 9,746
See accompanying notes to consolidated financial statements.
39
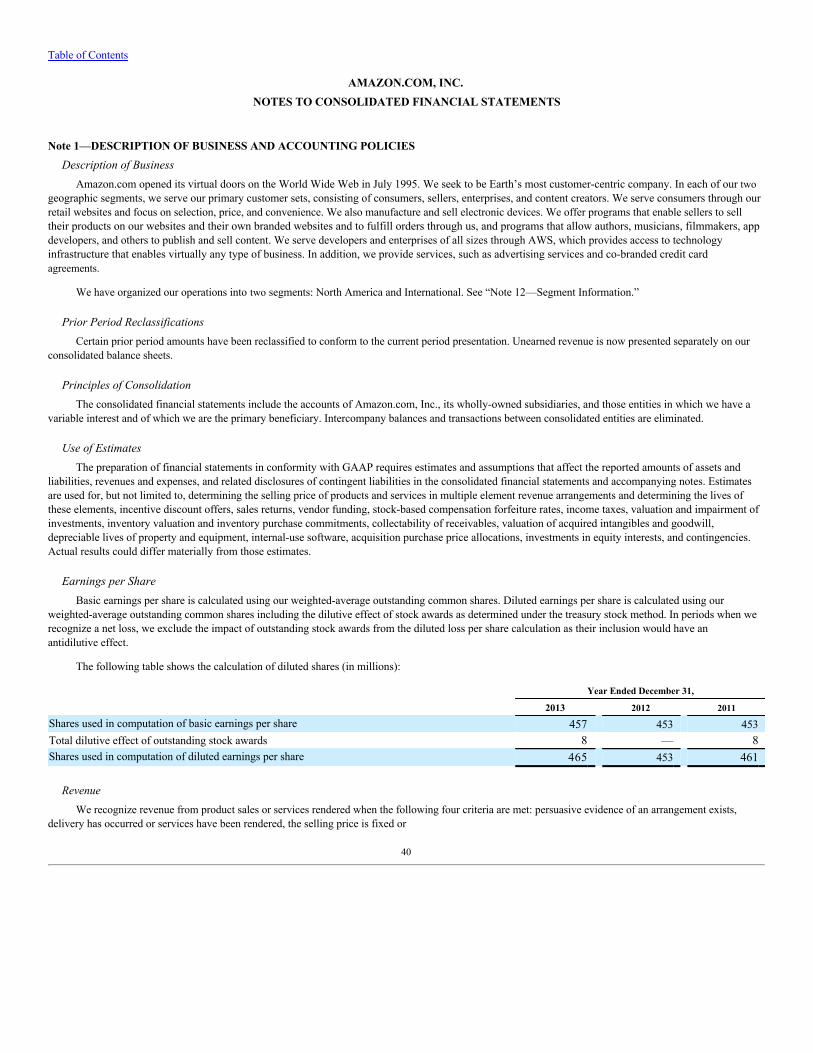
Table of Contents
AMAZON.COM, INC.NOTES TO CONSOLIDATED FINANCIAL STATEMENTS
Note 1—DESCRIPTION OF BUSINESS AND ACCOUNTING POLICIESDescription of Business
Amazon.com opened its virtual doors on the World Wide Web in July 1995. We seek to be Earth’s most customer-centric company. In each of our twogeographic segments, we serve our primary customer sets, consisting of consumers, sellers, enterprises, and content creators. We serve consumers through ourretail websites and focus on selection, price, and convenience. We also manufacture and sell electronic devices. We offer programs that enable sellers to selltheir products on our websites and their own branded websites and to fulfill orders through us, and programs that allow authors, musicians, filmmakers, appdevelopers, and others to publish and sell content. We serve developers and enterprises of all sizes through AWS, which provides access to technologyinfrastructure that enables virtually any type of business. In addition, we provide services, such as advertising services and co-branded credit cardagreements.
We have organized our operations into two segments: North America and International. See “Note 12—Segment Information.”
Prior Period ReclassificationsCertain prior period amounts have been reclassified to conform to the current period presentation. Unearned revenue is now presented separately on our
consolidated balance sheets.
Principles of ConsolidationThe consolidated financial statements include the accounts of Amazon.com, Inc., its wholly-owned subsidiaries, and those entities in which we have a
variable interest and of which we are the primary beneficiary. Intercompany balances and transactions between consolidated entities are eliminated.
Use of EstimatesThe preparation of financial statements in conformity with GAAP requires estimates and assumptions that affect the reported amounts of assets and
liabilities, revenues and expenses, and related disclosures of contingent liabilities in the consolidated financial statements and accompanying notes. Estimatesare used for, but not limited to, determining the selling price of products and services in multiple element revenue arrangements and determining the lives ofthese elements, incentive discount offers, sales returns, vendor funding, stock-based compensation forfeiture rates, income taxes, valuation and impairment ofinvestments, inventory valuation and inventory purchase commitments, collectability of receivables, valuation of acquired intangibles and goodwill,depreciable lives of property and equipment, internal-use software, acquisition purchase price allocations, investments in equity interests, and contingencies.Actual results could differ materially from those estimates.
Earnings per ShareBasic earnings per share is calculated using our weighted-average outstanding common shares. Diluted earnings per share is calculated using our
weighted-average outstanding common shares including the dilutive effect of stock awards as determined under the treasury stock method. In periods when werecognize a net loss, we exclude the impact of outstanding stock awards from the diluted loss per share calculation as their inclusion would have anantidilutive effect.
The following table shows the calculation of diluted shares (in millions):
Year Ended December 31,
2013 2012 2011
Shares used in computation of basic earnings per share 457 453 453Total dilutive effect of outstanding stock awards 8 — 8Shares used in computation of diluted earnings per share 465 453 461
RevenueWe recognize revenue from product sales or services rendered when the following four criteria are met: persuasive evidence of an arrangement exists,
delivery has occurred or services have been rendered, the selling price is fixed or
40
Table of Contents
determinable, and collectability is reasonably assured. Revenue arrangements with multiple deliverables are divided into separate units and revenue is allocatedusing estimated selling prices if we do not have vendor-specific objective evidence or third-party evidence of the selling prices of the deliverables. We allocatethe arrangement price to each of the elements based on the estimated selling prices of each element. Estimated selling prices are management’s best estimates ofthe prices that we would charge our customers if we were to sell the standalone elements separately and include considerations of customer demand, pricescharged by us and others for similar deliverables, and the price if largely based on costs. Sales of our Kindle device are considered arrangements with multipledeliverables, consisting of the device, 3G wireless access and delivery for some models, and software upgrades. The revenue related to the device, which is thesubstantial portion of the total sale price, and related costs are recognized upon delivery as cost of sales. Revenue related to 3G wireless access and delivery andsoftware upgrades is amortized over the average life of the device. Sales of Amazon Prime memberships are considered arrangements with multipledeliverables, including shipping benefits, Prime Instant Video, and access to the Kindle Owners' Lending Library. The revenue related to the deliverables isamortized over the life of the membership according to the estimated delivery of services. Amazon Prime membership fees are allocated between product salesand services sales. Costs to deliver Amazon Prime benefits are recognized as cost of sales as incurred.
We evaluate whether it is appropriate to record the gross amount of product sales and related costs or the net amount earned as commissions. Generally,when we are primarily obligated in a transaction, are subject to inventory risk, have latitude in establishing prices and selecting suppliers, or have several butnot all of these indicators, revenue is recorded at the gross sale price. We generally record the net amounts as commissions earned if we are not primarilyobligated and do not have latitude in establishing prices. Such amounts earned are determined using a fixed percentage, a fixed-payment schedule, or acombination of the two.
Product sales represent revenue from the sale of products and related shipping fees and digital content where we are the seller of record. Product sales andshipping revenues, net of promotional discounts, rebates, and return allowances, are recorded when the products are shipped and title passes to customers.Kindle devices sold through retailers are recognized at the point of sale to consumers. Retail sales to customers are made pursuant to a sales contract thatprovides for transfer of both title and risk of loss upon our delivery to the carrier.
Services sales represent third-party seller fees earned (including commissions) and related shipping fees, and non-retail activities such as AWS,advertising services, and our co-branded credit card agreements. Services sales, net of promotional discounts and return allowances, are recognized whenservices have been rendered.
Return allowances, which reduce revenue, are estimated using historical experience. Allowance for returns was $167 million, $198 million, and $155million as of December 31, 2013, 2012, and 2011. Additions to the allowance were $907 million, $702 million, and $542 million, and deductions to theallowance were $938 million, $659 million, and $490 million as of December 31, 2013, 2012, and 2011. Revenue from product sales and services renderedis recorded net of sales and consumption taxes. Additionally, we periodically provide incentive offers to our customers to encourage purchases. Such offersinclude current discount offers, such as percentage discounts off current purchases, inducement offers, such as offers for future discounts subject to aminimum current purchase, and other similar offers. Current discount offers, when accepted by our customers, are treated as a reduction to the purchase priceof the related transaction, while inducement offers, when accepted by our customers, are treated as a reduction to purchase price based on estimated futureredemption rates. Redemption rates are estimated using our historical experience for similar inducement offers. Current discount offers and inducement offersare presented as a net amount in “Total net sales.”
Cost of SalesCost of sales consists of the purchase price of consumer products and digital content where we are the seller of record, inbound and outbound shipping
charges, and packaging supplies. Shipping charges to receive products from our suppliers are included in our inventory, and recognized as cost of sales uponsale of products to our customers. Payment processing and related transaction costs, including those associated with seller transactions, are classified in“Fulfillment” on our consolidated statements of operations.
Vendor AgreementsWe have agreements with our vendors to receive funds for cooperative marketing efforts, promotions, and volume rebates. We generally consider
amounts received from vendors to be a reduction of the prices we pay for their goods or services, and therefore record those amounts as a reduction of the costof inventory or cost of services. Vendor rebates are typically dependent upon reaching minimum purchase thresholds. We evaluate the likelihood of reachingpurchase thresholds using past experience and current year forecasts. When volume rebates can be reasonably estimated, we record a portion of the rebate aswe make progress towards the purchase threshold.
41
Table of Contents
When we receive direct reimbursements for costs incurred by us in advertising the vendor’s product or service, the amount we receive is recorded as anoffset to “Marketing” on our consolidated statements of operations.
FulfillmentFulfillment costs represent those costs incurred in operating and staffing our fulfillment and customer service centers, including costs attributable to
buying, receiving, inspecting, and warehousing inventories; picking, packaging, and preparing customer orders for shipment; payment processing andrelated transaction costs, including costs associated with our guarantee for certain seller transactions; responding to inquiries from customers; and supplychain management for our manufactured electronic devices. Fulfillment costs also include amounts paid to third parties that assist us in fulfillment andcustomer service operations.
MarketingMarketing costs consist primarily of targeted online advertising, television advertising, public relations expenditures, and payroll and related expenses
for personnel engaged in marketing, business development, and selling activities. We pay commissions to participants in our Associates program when theircustomer referrals result in product sales and classify such costs as “Marketing” on our consolidated statements of operations. We also participate incooperative advertising arrangements with certain of our vendors, and other third parties.
Advertising and other promotional costs are expensed as incurred and were $2.4 billion, $2.0 billion, and $1.4 billion in 2013, 2012, and 2011.Prepaid advertising costs were not significant as of December 31, 2013 and 2012.
Technology and ContentTechnology and content expenses consist principally of technology infrastructure expenses and payroll and related expenses for employees involved in
application, product, and platform development, category expansion, editorial content, buying, merchandising selection, systems support, and initiatives toexpand our ecosystem of digital products and services, as well as costs associated with AWS.
Technology and content costs are expensed as incurred, except for certain costs relating to the development of internal-use software and websitedevelopment, including software used to upgrade and enhance our websites and applications supporting our business, which are capitalized and amortizedover two years.
General and AdministrativeGeneral and administrative expenses consist of payroll and related expenses for employees involved in general corporate functions, including accounting,
finance, tax, legal, and human resources, among others; costs associated with use by these functions of facilities and equipment, such as depreciation expenseand rent; professional fees and litigation costs; and other general corporate costs.
Stock-Based CompensationCompensation cost for all stock awards expected to vest is measured at fair value on the date of grant and recognized over the service period. The fair
value of restricted stock units is determined based on the number of shares granted and the quoted price of our common stock. Such value is recognized asexpense over the service period, net of estimated forfeitures, using the accelerated method. The estimation of stock awards that will ultimately vest requiresjudgment, and to the extent actual results or updated estimates differ from our current estimates, such amounts will be recorded as a cumulative adjustment inthe period estimates are revised. We consider many factors when estimating expected forfeitures, including employee class, economic environment, andhistorical experience.
Other Operating Expense (Income), NetOther operating expense (income), net, consists primarily of intangible asset amortization expense and expenses related to legal settlements.
Other Income (Expense), NetOther income (expense), net, consists primarily of foreign currency gains and losses of $(137) million, $(95) million, and $64 million in 2013, 2012,
and 2011, and realized gains and losses on marketable securities sales of $(1) million, $10 million, and $4 million in 2013, 2012, and 2011.
42
Table of Contents
Income TaxesIncome tax expense includes U.S. and international income taxes. Except as required under U.S. tax law, we do not provide for U.S. taxes on our
undistributed earnings of foreign subsidiaries that have not been previously taxed since we intend to invest such undistributed earnings indefinitely outside ofthe U.S. If our intent changes or if these funds are needed for our U.S. operations, we would be required to accrue or pay U.S. taxes on some or all of theseundistributed earnings. Undistributed earnings of foreign subsidiaries that are indefinitely invested outside of the U.S were $2.5 billion as of December 31,2013. Determination of the unrecognized deferred tax liability that would be incurred if such amounts were repatriated is not practicable.
Deferred income tax balances reflect the effects of temporary differences between the carrying amounts of assets and liabilities and their tax bases and arestated at enacted tax rates expected to be in effect when taxes are actually paid or recovered.
Deferred tax assets are evaluated for future realization and reduced by a valuation allowance to the extent we believe a portion will not be realized. Weconsider many factors when assessing the likelihood of future realization of our deferred tax assets, including our recent cumulative earnings experience andexpectations of future taxable income and capital gains by taxing jurisdiction, the carry-forward periods available to us for tax reporting purposes, and otherrelevant factors. We allocate our valuation allowance to current and long-term deferred tax assets on a pro-rata basis.
We utilize a two-step approach to recognizing and measuring uncertain income tax positions (tax contingencies). The first step is to evaluate the taxposition for recognition by determining if the weight of available evidence indicates it is more likely than not that the position will be sustained on audit,including resolution of related appeals or litigation processes. The second step is to measure the tax benefit as the largest amount which is more than 50%likely of being realized upon ultimate settlement. We consider many factors when evaluating and estimating our tax positions and tax benefits, which mayrequire periodic adjustments and which may not accurately forecast actual outcomes. We include interest and penalties related to our tax contingencies inincome tax expense.
Fair Value of Financial InstrumentsFair value is defined as the price that would be received to sell an asset or paid to transfer a liability in an orderly transaction between market
participants at the measurement date. To increase the comparability of fair value measures, the following hierarchy prioritizes the inputs to valuationmethodologies used to measure fair value:
Level 1—Valuations based on quoted prices for identical assets and liabilities in active markets.
Level 2—Valuations based on observable inputs other than quoted prices included in Level 1, such as quoted prices for similar assets andliabilities in active markets, quoted prices for identical or similar assets and liabilities in markets that are not active, or other inputs that are observableor can be corroborated by observable market data.
Level 3—Valuations based on unobservable inputs reflecting our own assumptions, consistent with reasonably available assumptions made byother market participants. These valuations require significant judgment.
We measure the fair value of money market funds and equity securities based on quoted prices in active markets for identical assets or liabilities. Allother financial instruments were valued either based on recent trades of securities in inactive markets or based on quoted market prices of similar instrumentsand other significant inputs derived from or corroborated by observable market data. We did not hold any cash, cash equivalents, or marketable securitiescategorized as Level 3 as of December 31, 2013, or December 31, 2012.
Cash and Cash EquivalentsWe classify all highly liquid instruments with an original maturity of three months or less at the time of purchase as cash equivalents.
InventoriesInventories, consisting of products available for sale, are primarily accounted for using the FIFO method, and are valued at the lower of cost or market
value. This valuation requires us to make judgments, based on currently-available information, about the likely method of disposition, such as through salesto individual customers, returns to product vendors, or liquidations, and expected recoverable values of each disposition category.
43
Table of Contents
We provide Fulfillment by Amazon services in connection with certain of our sellers’ programs. Third-party sellers maintain ownership of theirinventory, regardless of whether fulfillment is provided by us or the third-party sellers, and therefore these products are not included in our inventories.
Accounts Receivable, Net and OtherIncluded in “Accounts receivable, net and other” on our consolidated balance sheets are amounts primarily related to vendor and customer receivables.
As of December 31, 2013 and 2012, vendor receivables, net, were $1.3 billion and $1.1 billion, and customer receivables, net, were $1.7 billion and $1.5billion.
Allowance for Doubtful AccountsWe estimate losses on receivables based on known troubled accounts and historical experience of losses incurred. Receivables are considered impaired
and written-off when it is probable that all contractual payments due will not be collected in accordance with the terms of the agreement. The allowance fordoubtful accounts was $153 million, $116 million, and $82 million as of December 31, 2013, 2012, and 2011. Additions to the allowance were $172million, $136 million, and $87 million, and deductions to the allowance were $135 million, $102 million, and $82 million as of December 31, 2013, 2012,and 2011.
Internal-use Software and Website DevelopmentCosts incurred to develop software for internal use and our websites are capitalized and amortized over the estimated useful life of the software . Costs
related to design or maintenance of internal-use software and website development are expensed as incurred. For the years ended 2013, 2012, and 2011, wecapitalized $581 million (including $87 million of stock-based compensation), $454 million (including $74 million of stock-based compensation), and $307million (including $51 million of stock-based compensation) of costs associated with internal-use software and website development. Amortization ofpreviously capitalized amounts was $451 million, $327 million, and $236 million for 2013, 2012, and 2011.
Property and Equipment, NetProperty and equipment are stated at cost less accumulated depreciation. Property includes buildings and land that we own, along with property we have
acquired under build-to-suit, financing, and capital lease arrangements. Equipment includes assets such as furniture and fixtures, heavy equipment, serversand networking equipment, and internal-use software and website development. Depreciation is recorded on a straight-line basis over the estimated useful livesof the assets (generally the lesser of 40 years or the remaining life of the underlying building, two years for assets such as internal-use software, three years forour servers, five years for networking equipment, five years for furniture and fixtures, and ten years for heavy equipment). Depreciation expense is classifiedwithin the corresponding operating expense categories on our consolidated statements of operations.
Leases and Asset Retirement ObligationsWe categorize leases at their inception as either operating or capital leases. On certain of our lease agreements, we may receive rent holidays and other
incentives. We recognize lease costs on a straight-line basis without regard to deferred payment terms, such as rent holidays that defer the commencement dateof required payments. Additionally, incentives we receive are treated as a reduction of our costs over the term of the agreement. Leasehold improvements arecapitalized at cost and amortized over the lesser of their expected useful life or the non-cancellable term of the lease.
We establish assets and liabilities for the estimated construction costs incurred under build-to-suit lease arrangements to the extent we are involved in theconstruction of structural improvements or take construction risk prior to commencement of a lease. Upon occupancy of facilities under build-to-suit leases,we assess whether these arrangements qualify for sales recognition under the sale-leaseback accounting guidance. If we continue to be the deemed owner, thefacilities are accounted for as financing leases.
We establish assets and liabilities for the present value of estimated future costs to retire long-lived assets at the termination or expiration of a lease. Suchassets are depreciated over the lease period into operating expense, and the recorded liabilities are accreted to the future value of the estimated retirement costs.
GoodwillWe evaluate goodwill for impairment annually or more frequently when an event occurs or circumstances change that indicate that the carrying value
may not be recoverable. We test goodwill for impairment by first comparing the book value of net assets to the fair value of the reporting units. If the fair valueis determined to be less than the book value or qualitative
44
Table of Contents
factors indicate that it is more likely than not that goodwill is impaired, a second step is performed to compute the amount of impairment as the differencebetween the estimated fair value of goodwill and the carrying value. We estimate the fair value of the reporting units using discounted cash flows. Forecasts offuture cash flows are based on our best estimate of future net sales and operating expenses, based primarily on expected category expansion, pricing, marketsegment share, and general economic conditions.
We conduct our annual impairment test as of October 1 of each year, and have determined there to be no impairment for any of the periods presented.There were no triggering events identified from the date of our assessment through December 31, 2013 that would require an update to our annual impairmenttest. See “Note 4—Acquisitions, Goodwill, and Acquired Intangible Assets.”
Other AssetsIncluded in “Other assets” on our consolidated balance sheets are amounts primarily related to acquired intangible assets, net of amortization; digital
video content, net of amortization; long-term deferred tax assets; certain equity investments; marketable securities restricted for longer than one year, themajority of which are attributable to collateralization of bank guarantees and debt related to our international operations; and intellectual property rights, net ofamortization.
Content Costs
We obtain digital video content through licensing agreements that have a wide range of licensing provisions and generally have terms from one to fiveyears with fixed payment schedules. When the license fee for a specific movie or television title is determinable or reasonably estimable and available forstreaming, we recognize an asset representing the fee per title and a corresponding liability for the amounts owed. We relieve the liability as payments are madeand we amortize the asset as cost of sales on a straight-line basis over each title’s contractual window of availability, which typically ranges from six monthsto five years. If we are unable to reasonably estimate the cost per title, no asset or liability is recorded and licensing costs are expensed as incurred.
InvestmentsWe generally invest our excess cash in investment grade short- to intermediate-term fixed income securities and AAA-rated money market funds. Such
investments are included in “Cash and cash equivalents,” or “Marketable securities” on the accompanying consolidated balance sheets, classified asavailable-for-sale, and reported at fair value with unrealized gains and losses included in “Accumulated other comprehensive loss.”
Equity investments are accounted for using the equity method of accounting if the investment gives us the ability to exercise significant influence, butnot control, over an investee. The total of our investments in equity-method investees, including identifiable intangible assets, deferred tax liabilities, andgoodwill, is included within “Other assets” on our consolidated balance sheets. Our share of the earnings or losses as reported by equity-method investees,amortization of the related intangible assets, and related gains or losses, if any, are classified as “Equity -method investment activity, net of tax” on ourconsolidated statements of operations. Our share of the net income or loss of our equity -method investees includes operating and non-operating gains andcharges, which can have a significant impact on our reported equity-method investment activity and the carrying value of those investments. In the event thatnet losses of the investee reduce our equity-method investment carrying amount to zero, additional net losses may be recorded if other investments in theinvestee, not accounted for under the equity method, are at-risk even if we have not committed to provide financial support to the investee. We regularlyevaluate these investments, which are not carried at fair value, for other-than-temporary impairment. We also consider whether our equity-method investmentsgenerate sufficient cash flows from their operating or financing activities to meet their obligations and repay their liabilities when they come due.
We record purchases, including incremental purchases, of shares in equity-method investees at cost. Reductions in our ownership percentage of aninvestee, including through dilution, are generally valued at fair value, with the difference between fair value and our recorded cost reflected as a gain or loss inour equity-method investment activity. In the event we no longer have the ability to exercise significant influence over an equity-method investee, we woulddiscontinue accounting for the investment under the equity method.
Equity investments without readily determinable fair values for which we do not have the ability to exercise significant influence are accounted for usingthe cost method of accounting and classified as “Other assets” on our consolidated balance sheets. Under the cost method, investments are carried at cost andare adjusted only for other-than-temporary declines in fair value, certain distributions, and additional investments.
45
Table of Contents
Equity investments that have readily determinable fair values are classified as available-for-sale and are included in “Marketable securities” in ourconsolidated balance sheets and are recorded at fair value with unrealized gains and losses, net of tax, included in “Accumulated other comprehensive loss.”
We periodically evaluate whether declines in fair values of our investments below their book value are other-than-temporary. This evaluation consists ofseveral qualitative and quantitative factors regarding the severity and duration of the unrealized loss as well as our ability and intent to hold the investmentuntil a forecasted recovery occurs. Additionally, we assess whether we have plans to sell the security or it is more likely than not we will be required to sell anyinvestment before recovery of its amortized cost basis. Factors considered include quoted market prices; recent financial results and operating trends; impliedvalues from any recent transactions or offers of investee securities; credit quality of debt instrument issuers; other publicly available information that mayaffect the value of our investments; duration and severity of the decline in value; and our strategy and intentions for holding the investment.
Long-Lived AssetsLong-lived assets, other than goodwill, are reviewed for impairment whenever events or changes in circumstances indicate that the carrying amount of
the assets might not be recoverable. Conditions that would necessitate an impairment assessment include a significant decline in the observable market value ofan asset, a significant change in the extent or manner in which an asset is used, or any other significant adverse change that would indicate that the carryingamount of an asset or group of assets may not be recoverable.
For long-lived assets used in operations, impairment losses are only recorded if the asset’s carrying amount is not recoverable through its undiscounted,probability-weighted future cash flows. We measure the impairment loss based on the difference between the carrying amount and estimated fair value. Long-lived assets are considered held for sale when certain criteria are met, including when management has committed to a plan to sell the asset, the asset isavailable for sale in its immediate condition, and the sale is probable within one year of the reporting date. Assets held for sale are reported at the lower of costor fair value less costs to sell. Assets held for sale were not significant as of December 31, 2013 or 2012.
Accrued Expenses and OtherIncluded in “Accrued expenses and other” as of December 31, 2013 and 2012 were liabilities of $1.4 billion and $1.1 billion for unredeemed gift cards.
We reduce the liability for a gift card when redeemed by a customer. If a gift card is not redeemed, we recognize revenue when it expires or when the likelihoodof its redemption becomes remote, generally two years from the date of issuance.
Unearned RevenueUnearned revenue is recorded when payments are received in advance of performing our service obligations and is recognized over the service period.
Unearned revenue primarily relates to Amazon Prime memberships and AWS.
Foreign CurrencyWe have internationally-focused websites for the United Kingdom, Germany, France, Japan, Canada, China, Italy, Spain, Brazil, India, Mexico, and
Australia. Net sales generated from these websites, as well as most of the related expenses directly incurred from those operations, are denominated in localfunctional currencies. The functional currency of our subsidiaries that either operate or support these websites is the same as the local currency. Assets andliabilities of these subsidiaries are translated into U.S. Dollars at period-end exchange rates, and revenues and expenses are translated at average ratesprevailing throughout the period. Translation adjustments are included in “Accumulated other comprehensive loss,” a separate component of stockholders’equity, and in the “Foreign-currency effect on cash and cash equivalents,” on our consolidated statements of cash flows. Transaction gains and lossesincluding intercompany transactions denominated in a currency other than the functional currency of the entity involved are included in “Other income(expense), net” on our consolidated statements of operations. In connection with the settlement and remeasurement of intercompany balances, we recorded gains(losses) of $(84) million, $(95) million, and $70 million in 2013, 2012, and 2011.
46
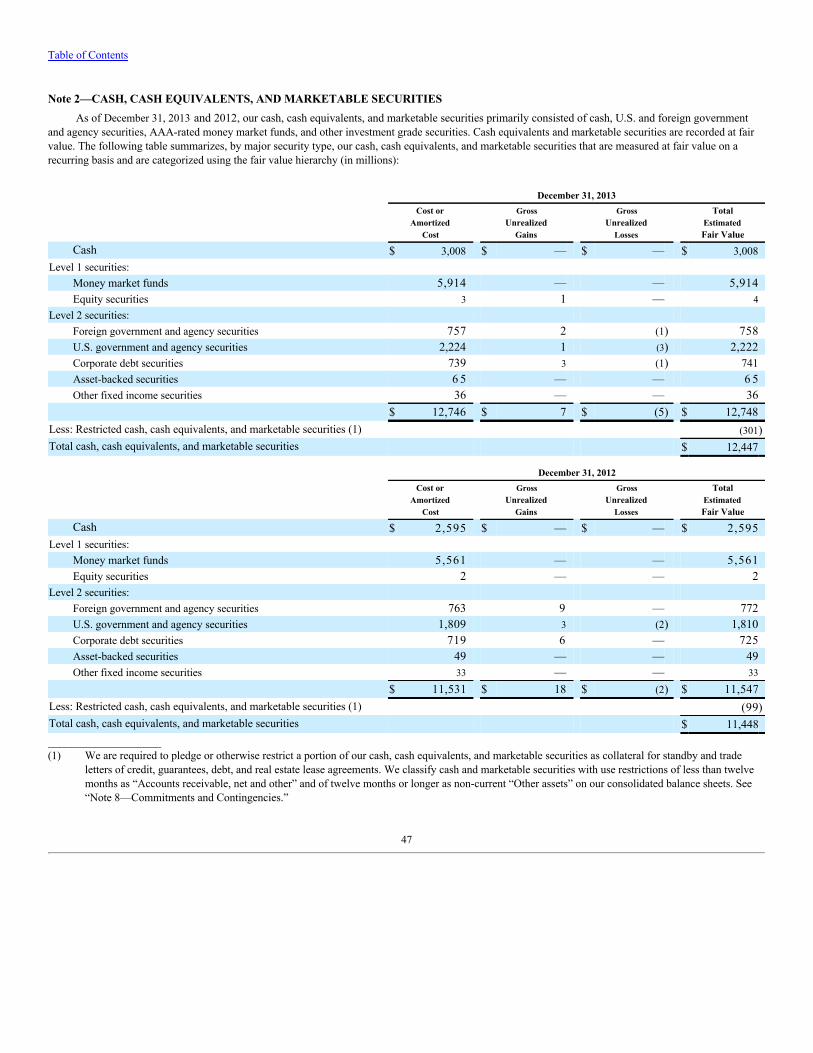
Table of Contents
Note 2—CASH, CASH EQUIVALENTS, AND MARKETABLE SECURITIESAs of December 31, 2013 and 2012, our cash, cash equivalents, and marketable securities primarily consisted of cash, U.S. and foreign government
and agency securities, AAA-rated money market funds, and other investment grade securities. Cash equivalents and marketable securities are recorded at fairvalue. The following table summarizes, by major security type, our cash, cash equivalents, and marketable securities that are measured at fair value on arecurring basis and are categorized using the fair value hierarchy (in millions):
December 31, 2013
Cost orAmortized
Cost
GrossUnrealized
Gains
GrossUnrealized
Losses
TotalEstimatedFair Value
Cash $ 3,008 $ — $ — $ 3,008Level 1 securities:
Money market funds 5,914 — — 5,914Equity securities 3 1 — 4
Level 2 securities: Foreign government and agency securities 757 2 (1) 758U.S. government and agency securities 2,224 1 (3) 2,222Corporate debt securities 739 3 (1) 741Asset-backed securities 6 5 — — 6 5Other fixed income securities 36 — — 36
$ 12,746 $ 7 $ (5) $ 12,748Less: Restricted cash, cash equivalents, and marketable securities (1) (301)Total cash, cash equivalents, and marketable securities $ 12,447
December 31, 2012
Cost orAmortized
Cost
GrossUnrealized
Gains
GrossUnrealized
Losses
TotalEstimatedFair Value
Cash $ 2,595 $ — $ — $ 2,595Level 1 securities:
Money market funds 5,561 — — 5,561Equity securities 2 — — 2
Level 2 securities: Foreign government and agency securities 763 9 — 772U.S. government and agency securities 1,809 3 (2) 1,810Corporate debt securities 719 6 — 725Asset-backed securities 49 — — 49Other fixed income securities 33 — — 33
$ 11,531 $ 18 $ (2) $ 11,547Less: Restricted cash, cash equivalents, and marketable securities (1) (99)Total cash, cash equivalents, and marketable securities $ 11,448___________________(1) We are required to pledge or otherwise restrict a portion of our cash, cash equivalents, and marketable securities as collateral for standby and trade
letters of credit, guarantees, debt, and real estate lease agreements. We classify cash and marketable securities with use restrictions of less than twelvemonths as “Accounts receivable, net and other” and of twelve months or longer as non-current “Other assets” on our consolidated balance sheets. See“Note 8—Commitments and Contingencies.”
47
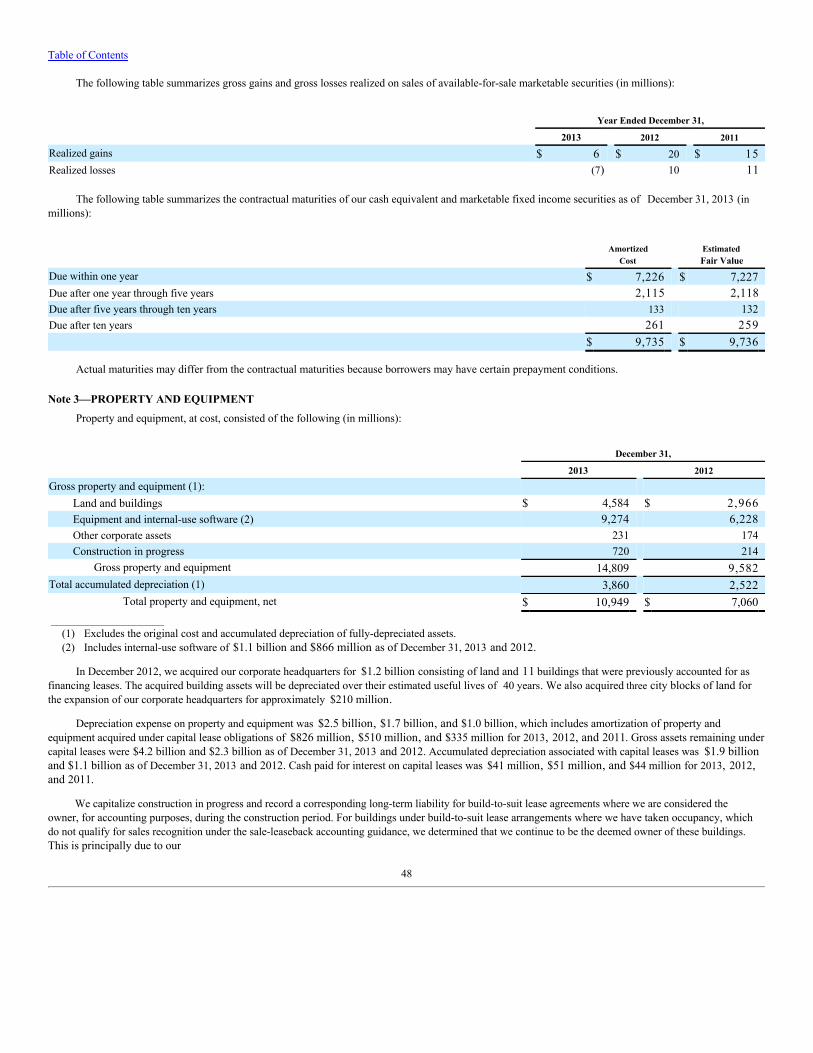
Table of Contents
The following table summarizes gross gains and gross losses realized on sales of available-for-sale marketable securities (in millions):
Year Ended December 31,
2013 2012 2011
Realized gains $ 6 $ 20 $ 15Realized losses (7) 10 11
The following table summarizes the contractual maturities of our cash equivalent and marketable fixed income securities as of December 31, 2013 (inmillions):
Amortized
Cost EstimatedFair Value
Due within one year $ 7,226 $ 7,227Due after one year through five years 2,115 2,118Due after five years through ten years 133 132Due after ten years 261 259 $ 9,735 $ 9,736
Actual maturities may differ from the contractual maturities because borrowers may have certain prepayment conditions.
Note 3—PROPERTY AND EQUIPMENTProperty and equipment, at cost, consisted of the following (in millions):
December 31,
2013 2012
Gross property and equipment (1): Land and buildings $ 4,584 $ 2,966Equipment and internal-use software (2) 9,274 6,228Other corporate assets 231 174Construction in progress 720 214
Gross property and equipment 14,809 9,582Total accumulated depreciation (1) 3,860 2,522
Total property and equipment, net $ 10,949 $ 7,060 ___________________
(1) Excludes the original cost and accumulated depreciation of fully-depreciated assets.(2) Includes internal-use software of $1.1 billion and $866 million as of December 31, 2013 and 2012.
In December 2012, we acquired our corporate headquarters for $1.2 billion consisting of land and 11 buildings that were previously accounted for asfinancing leases. The acquired building assets will be depreciated over their estimated useful lives of 40 years. We also acquired three city blocks of land forthe expansion of our corporate headquarters for approximately $210 million.
Depreciation expense on property and equipment was $2.5 billion, $1.7 billion, and $1.0 billion, which includes amortization of property andequipment acquired under capital lease obligations of $826 million, $510 million, and $335 million for 2013, 2012, and 2011. Gross assets remaining undercapital leases were $4.2 billion and $2.3 billion as of December 31, 2013 and 2012. Accumulated depreciation associated with capital leases was $1.9 billionand $1.1 billion as of December 31, 2013 and 2012. Cash paid for interest on capital leases was $41 million, $51 million, and $44 million for 2013, 2012,and 2011.
We capitalize construction in progress and record a corresponding long-term liability for build-to-suit lease agreements where we are considered theowner, for accounting purposes, during the construction period. For buildings under build-to-suit lease arrangements where we have taken occupancy, whichdo not qualify for sales recognition under the sale-leaseback accounting guidance, we determined that we continue to be the deemed owner of these buildings.This is principally due to our
48
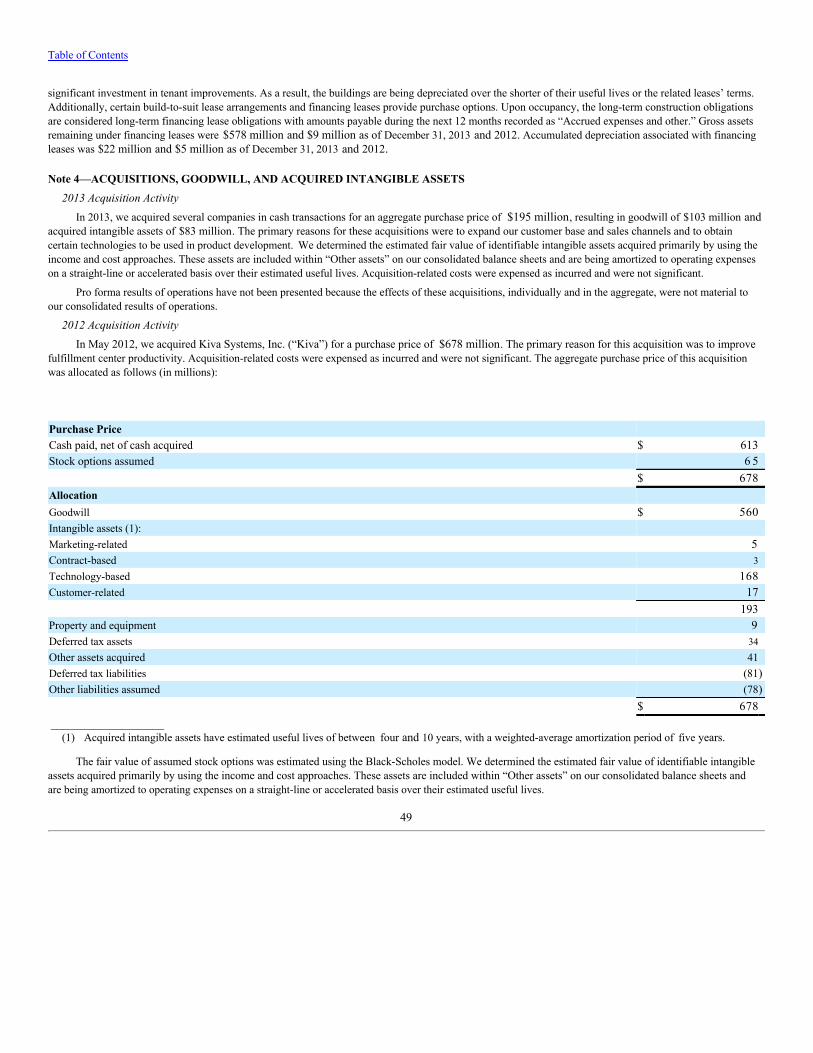
Table of Contents
significant investment in tenant improvements. As a result, the buildings are being depreciated over the shorter of their useful lives or the related leases’ terms.Additionally, certain build-to-suit lease arrangements and financing leases provide purchase options. Upon occupancy, the long-term construction obligationsare considered long-term financing lease obligations with amounts payable during the next 12 months recorded as “Accrued expenses and other.” Gross assetsremaining under financing leases were $578 million and $9 million as of December 31, 2013 and 2012. Accumulated depreciation associated with financingleases was $22 million and $5 million as of December 31, 2013 and 2012.
Note 4—ACQUISITIONS, GOODWILL, AND ACQUIRED INTANGIBLE ASSETS2013 Acquisition Activity
In 2013, we acquired several companies in cash transactions for an aggregate purchase price of $195 million, resulting in goodwill of $103 million andacquired intangible assets of $83 million. The primary reasons for these acquisitions were to expand our customer base and sales channels and to obtaincertain technologies to be used in product development. We determined the estimated fair value of identifiable intangible assets acquired primarily by using theincome and cost approaches. These assets are included within “Other assets” on our consolidated balance sheets and are being amortized to operating expenseson a straight-line or accelerated basis over their estimated useful lives. Acquisition-related costs were expensed as incurred and were not significant.
Pro forma results of operations have not been presented because the effects of these acquisitions, individually and in the aggregate, were not material toour consolidated results of operations.
2012 Acquisition ActivityIn May 2012, we acquired Kiva Systems, Inc. (“Kiva”) for a purchase price of $678 million. The primary reason for this acquisition was to improve
fulfillment center productivity. Acquisition-related costs were expensed as incurred and were not significant. The aggregate purchase price of this acquisitionwas allocated as follows (in millions):
Purchase Price Cash paid, net of cash acquired $ 613Stock options assumed 6 5 $ 678Allocation Goodwill $ 560Intangible assets (1): Marketing-related 5Contract-based 3Technology-based 168Customer-related 17 193Property and equipment 9Deferred tax assets 34Other assets acquired 41Deferred tax liabilities (81)Other liabilities assumed (78) $ 678 ___________________
(1) Acquired intangible assets have estimated useful lives of between four and 10 years, with a weighted-average amortization period of five years.
The fair value of assumed stock options was estimated using the Black-Scholes model. We determined the estimated fair value of identifiable intangibleassets acquired primarily by using the income and cost approaches. These assets are included within “Other assets” on our consolidated balance sheets andare being amortized to operating expenses on a straight-line or accelerated basis over their estimated useful lives.
49
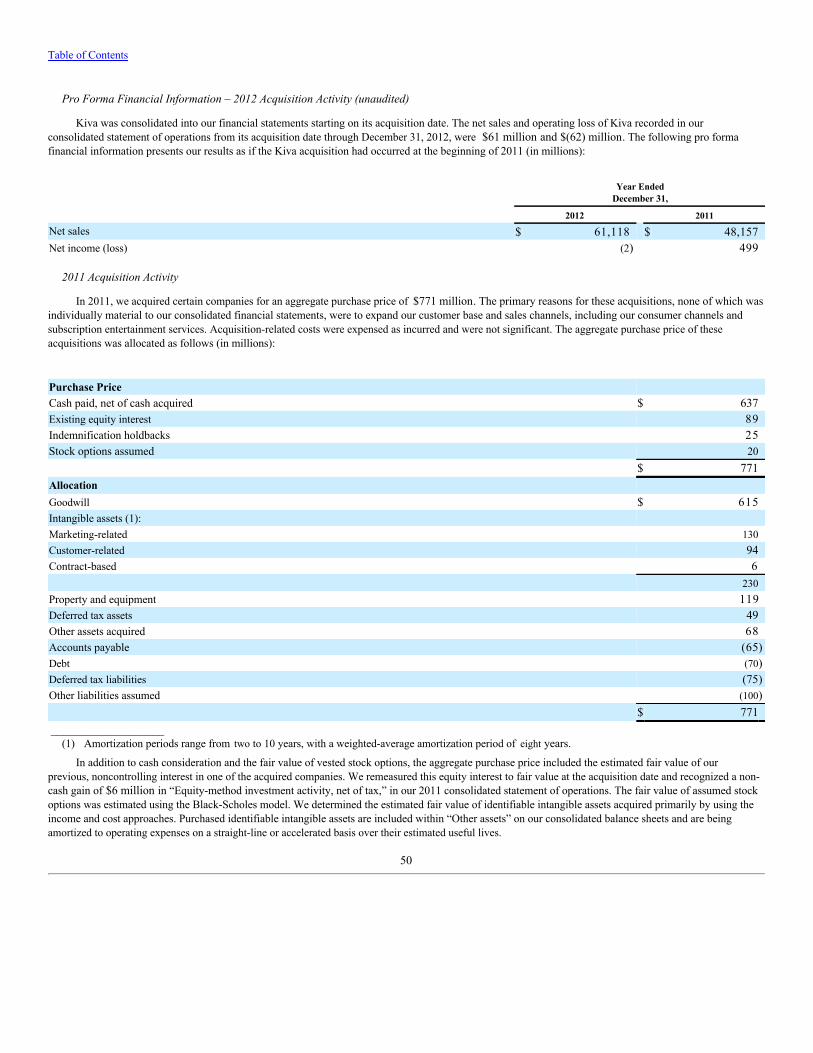
Table of Contents
Pro Forma Financial Information – 2012 Acquisition Activity (unaudited)
Kiva was consolidated into our financial statements starting on its acquisition date. The net sales and operating loss of Kiva recorded in ourconsolidated statement of operations from its acquisition date through December 31, 2012, were $61 million and $(62) million. The following pro formafinancial information presents our results as if the Kiva acquisition had occurred at the beginning of 2011 (in millions):
Year Ended
December 31,
2012 2011
Net sales $ 61,118 $ 48,157Net income (loss) (2) 499
2011 Acquisition Activity
In 2011, we acquired certain companies for an aggregate purchase price of $771 million. The primary reasons for these acquisitions, none of which wasindividually material to our consolidated financial statements, were to expand our customer base and sales channels, including our consumer channels andsubscription entertainment services. Acquisition-related costs were expensed as incurred and were not significant. The aggregate purchase price of theseacquisitions was allocated as follows (in millions):
Purchase Price Cash paid, net of cash acquired $ 637Existing equity interest 89Indemnification holdbacks 25Stock options assumed 20 $ 771Allocation Goodwill $ 615Intangible assets (1): Marketing-related 130Customer-related 94Contract-based 6 230Property and equipment 119Deferred tax assets 49Other assets acquired 68Accounts payable (65)Debt (70)Deferred tax liabilities (75)Other liabilities assumed (100) $ 771 ___________________
(1) Amortization periods range from two to 10 years, with a weighted-average amortization period of eight years.
In addition to cash consideration and the fair value of vested stock options, the aggregate purchase price included the estimated fair value of ourprevious, noncontrolling interest in one of the acquired companies. We remeasured this equity interest to fair value at the acquisition date and recognized a non-cash gain of $6 million in “Equity-method investment activity, net of tax,” in our 2011 consolidated statement of operations. The fair value of assumed stockoptions was estimated using the Black-Scholes model. We determined the estimated fair value of identifiable intangible assets acquired primarily by using theincome and cost approaches. Purchased identifiable intangible assets are included within “Other assets” on our consolidated balance sheets and are beingamortized to operating expenses on a straight-line or accelerated basis over their estimated useful lives.
50
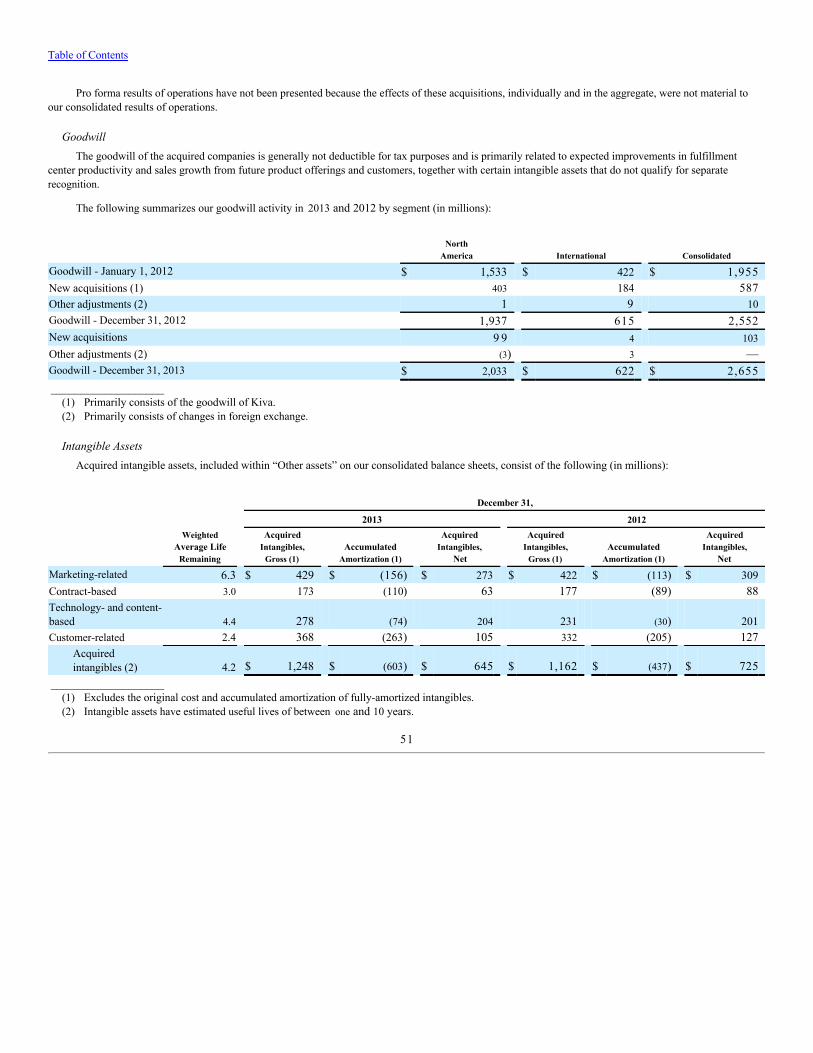
Table of Contents
Pro forma results of operations have not been presented because the effects of these acquisitions, individually and in the aggregate, were not material toour consolidated results of operations.
GoodwillThe goodwill of the acquired companies is generally not deductible for tax purposes and is primarily related to expected improvements in fulfillment
center productivity and sales growth from future product offerings and customers, together with certain intangible assets that do not qualify for separaterecognition.
The following summarizes our goodwill activity in 2013 and 2012 by segment (in millions):
North
America International Consolidated
Goodwill - January 1, 2012 $ 1,533 $ 422 $ 1,955New acquisitions (1) 403 184 587Other adjustments (2) 1 9 10Goodwill - December 31, 2012 1,937 615 2,552New acquisitions 9 9 4 103Other adjustments (2) (3) 3 —Goodwill - December 31, 2013 $ 2,033 $ 622 $ 2,655 ___________________
(1) Primarily consists of the goodwill of Kiva.(2) Primarily consists of changes in foreign exchange.
Intangible AssetsAcquired intangible assets, included within “Other assets” on our consolidated balance sheets, consist of the following (in millions):
December 31,
2013 2012
WeightedAverage Life
Remaining
AcquiredIntangibles,
Gross (1) Accumulated
Amortization (1)
AcquiredIntangibles,
Net
AcquiredIntangibles,
Gross (1) Accumulated
Amortization (1)
AcquiredIntangibles,
Net
Marketing-related 6.3 $ 429 $ (156) $ 273 $ 422 $ (113) $ 309Contract-based 3.0 173 (110) 63 177 (89) 88Technology- and content-based 4.4 278 (74) 204 231 (30) 201Customer-related 2.4 368 (263) 105 332 (205) 127
Acquiredintangibles (2) 4.2 $ 1,248 $ (603) $ 645 $ 1,162 $ (437) $ 725
___________________(1) Excludes the original cost and accumulated amortization of fully-amortized intangibles.(2) Intangible assets have estimated useful lives of between one and 10 years.
51
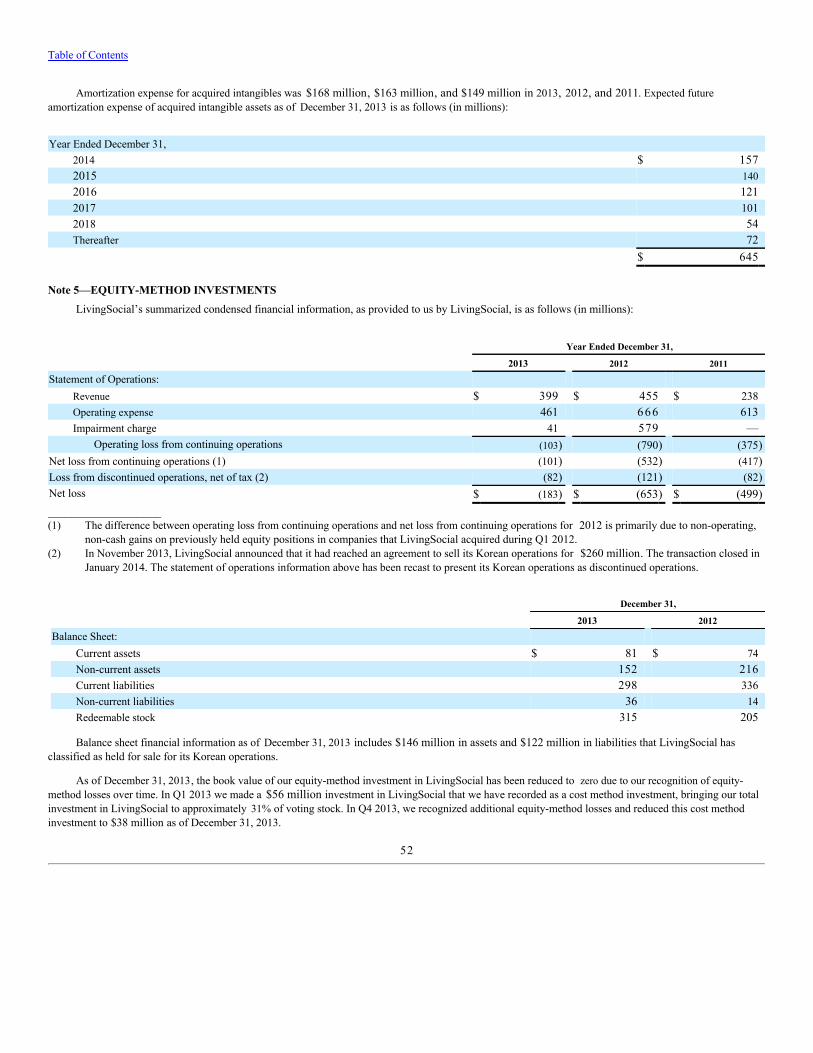
Table of Contents
Amortization expense for acquired intangibles was $168 million, $163 million, and $149 million in 2013, 2012, and 2011. Expected futureamortization expense of acquired intangible assets as of December 31, 2013 is as follows (in millions):
Year Ended December 31,2014 $ 1572015 1402016 1212017 1012018 54Thereafter 72
$ 645
Note 5—EQUITY-METHOD INVESTMENTSLivingSocial’s summarized condensed financial information, as provided to us by LivingSocial, is as follows (in millions):
Year Ended December 31,
2013 2012 2011
Statement of Operations: Revenue $ 399 $ 455 $ 238Operating expense 461 6 6 6 613Impairment charge 41 579 —
Operating loss from continuing operations (103) (790) (375)Net loss from continuing operations (1) (101) (532) (417)Loss from discontinued operations, net of tax (2) (82) (121) (82)Net loss $ (183) $ (653) $ (499)___________________(1) The difference between operating loss from continuing operations and net loss from continuing operations for 2012 is primarily due to non-operating,
non-cash gains on previously held equity positions in companies that LivingSocial acquired during Q1 2012.(2) In November 2013, LivingSocial announced that it had reached an agreement to sell its Korean operations for $260 million. The transaction closed in
January 2014. The statement of operations information above has been recast to present its Korean operations as discontinued operations.
December 31,
2013 2012
Balance Sheet: Current assets $ 81 $ 74Non-current assets 152 216Current liabilities 298 336Non-current liabilities 36 14Redeemable stock 315 205
Balance sheet financial information as of December 31, 2013 includes $146 million in assets and $122 million in liabilities that LivingSocial hasclassified as held for sale for its Korean operations.
As of December 31, 2013, the book value of our equity-method investment in LivingSocial has been reduced to zero due to our recognition of equity-method losses over time. In Q1 2013 we made a $56 million investment in LivingSocial that we have recorded as a cost method investment, bringing our totalinvestment in LivingSocial to approximately 31% of voting stock. In Q4 2013, we recognized additional equity-method losses and reduced this cost methodinvestment to $38 million as of December 31, 2013.
52
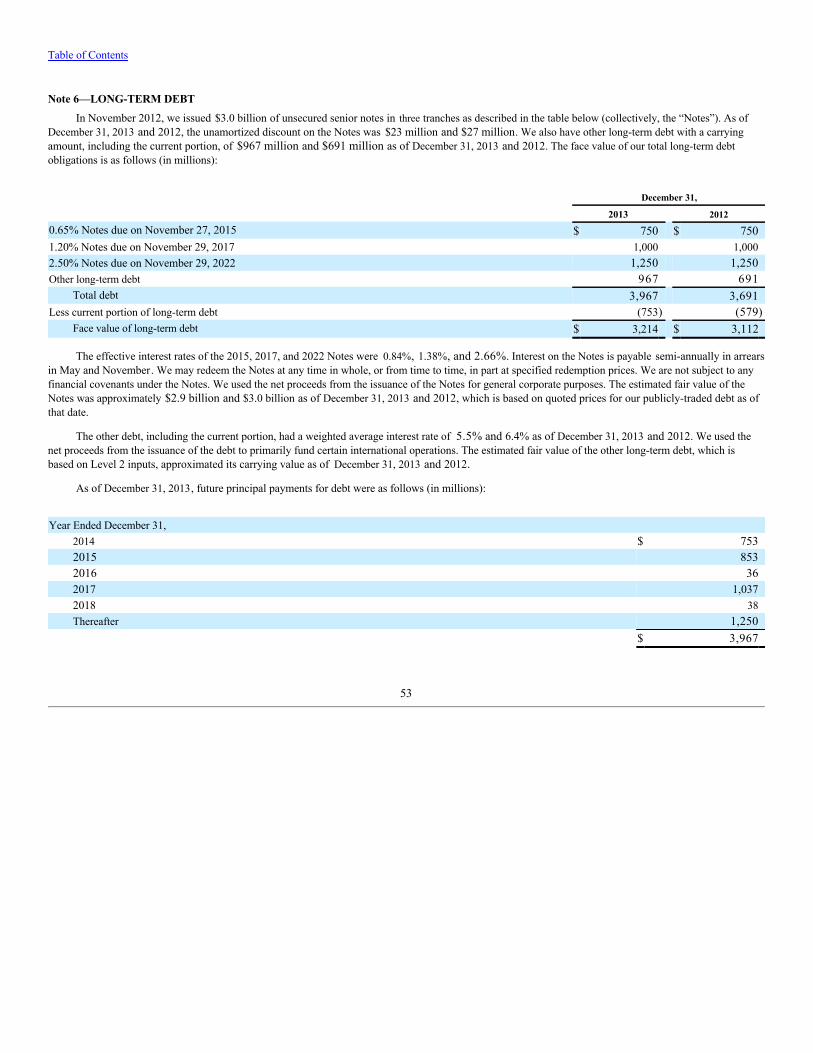
Table of Contents
Note 6—LONG-TERM DEBT
In November 2012, we issued $3.0 billion of unsecured senior notes in three tranches as described in the table below (collectively, the “Notes”). As ofDecember 31, 2013 and 2012, the unamortized discount on the Notes was $23 million and $27 million. We also have other long-term debt with a carryingamount, including the current portion, of $967 million and $691 million as of December 31, 2013 and 2012. The face value of our total long-term debtobligations is as follows (in millions):
December 31,
2013 2012
0.65% Notes due on November 27, 2015 $ 750 $ 7501.20% Notes due on November 29, 2017 1,000 1,0002.50% Notes due on November 29, 2022 1,250 1,250Other long-term debt 967 691
Total debt 3,967 3,691Less current portion of long-term debt (753) (579)
Face value of long-term debt $ 3,214 $ 3,112
The effective interest rates of the 2015, 2017, and 2022 Notes were 0.84%, 1.38%, and 2.66%. Interest on the Notes is payable semi-annually in arrearsin May and November . We may redeem the Notes at any time in whole, or from time to time, in part at specified redemption prices. We are not subject to anyfinancial covenants under the Notes. We used the net proceeds from the issuance of the Notes for general corporate purposes. The estimated fair value of theNotes was approximately $2.9 billion and $3.0 billion as of December 31, 2013 and 2012, which is based on quoted prices for our publicly-traded debt as ofthat date.
The other debt, including the current portion, had a weighted average interest rate of 5.5% and 6.4% as of December 31, 2013 and 2012. We used thenet proceeds from the issuance of the debt to primarily fund certain international operations. The estimated fair value of the other long-term debt, which isbased on Level 2 inputs, approximated its carrying value as of December 31, 2013 and 2012.
As of December 31, 2013, future principal payments for debt were as follows (in millions):
Year Ended December 31,2014 $ 7532015 8532016 362017 1,0372018 38Thereafter 1,250
$ 3,967
53
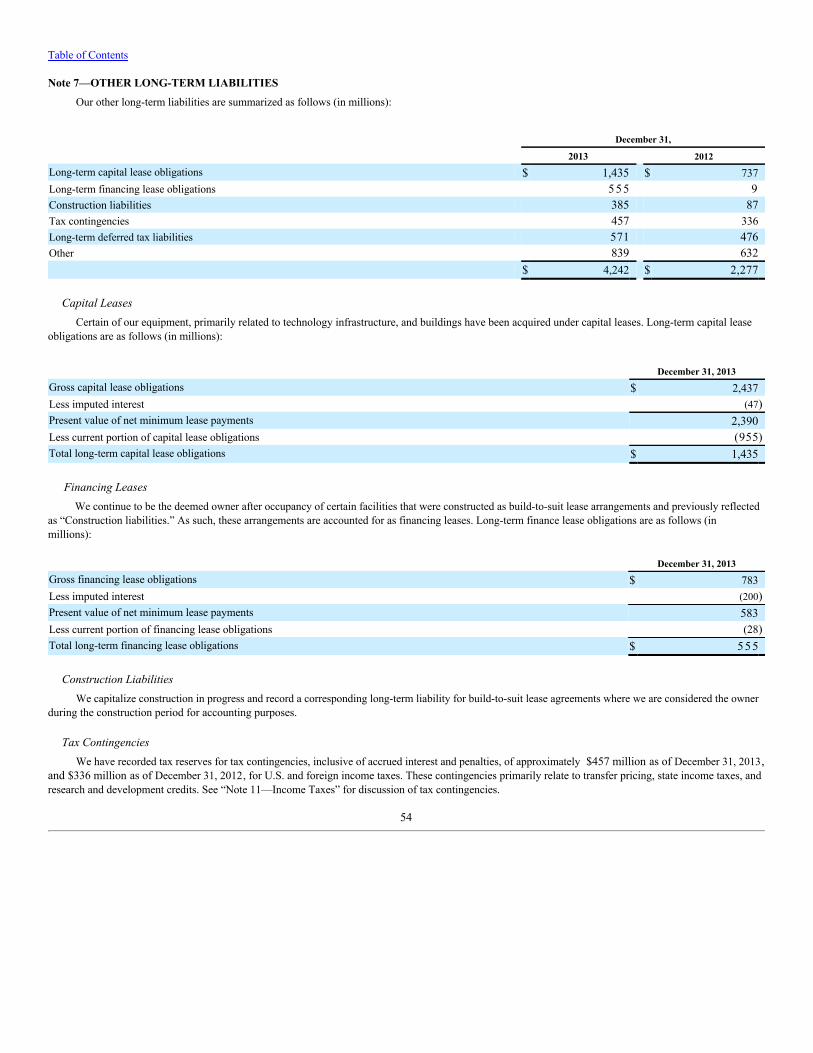
Table of Contents
Note 7—OTHER LONG-TERM LIABILITIESOur other long-term liabilities are summarized as follows (in millions):
December 31,
2013 2012
Long-term capital lease obligations $ 1,435 $ 737Long-term financing lease obligations 5 5 5 9Construction liabilities 385 87Tax contingencies 457 336Long-term deferred tax liabilities 571 476Other 839 632 $ 4,242 $ 2,277
Capital LeasesCertain of our equipment, primarily related to technology infrastructure, and buildings have been acquired under capital leases. Long-term capital lease
obligations are as follows (in millions):
December 31, 2013Gross capital lease obligations $ 2,437Less imputed interest (47)Present value of net minimum lease payments 2,390Less current portion of capital lease obligations (955)Total long-term capital lease obligations $ 1,435
Financing LeasesWe continue to be the deemed owner after occupancy of certain facilities that were constructed as build-to-suit lease arrangements and previously reflected
as “Construction liabilities.” As such, these arrangements are accounted for as financing leases. Long-term finance lease obligations are as follows (inmillions):
December 31, 2013Gross financing lease obligations $ 783Less imputed interest (200)Present value of net minimum lease payments 583Less current portion of financing lease obligations (28)Total long-term financing lease obligations $ 5 5 5
Construction LiabilitiesWe capitalize construction in progress and record a corresponding long-term liability for build-to-suit lease agreements where we are considered the owner
during the construction period for accounting purposes.
Tax ContingenciesWe have recorded tax reserves for tax contingencies, inclusive of accrued interest and penalties, of approximately $457 million as of December 31, 2013,
and $336 million as of December 31, 2012, for U.S. and foreign income taxes. These contingencies primarily relate to transfer pricing, state income taxes, andresearch and development credits. See “Note 11—Income Taxes” for discussion of tax contingencies.
54
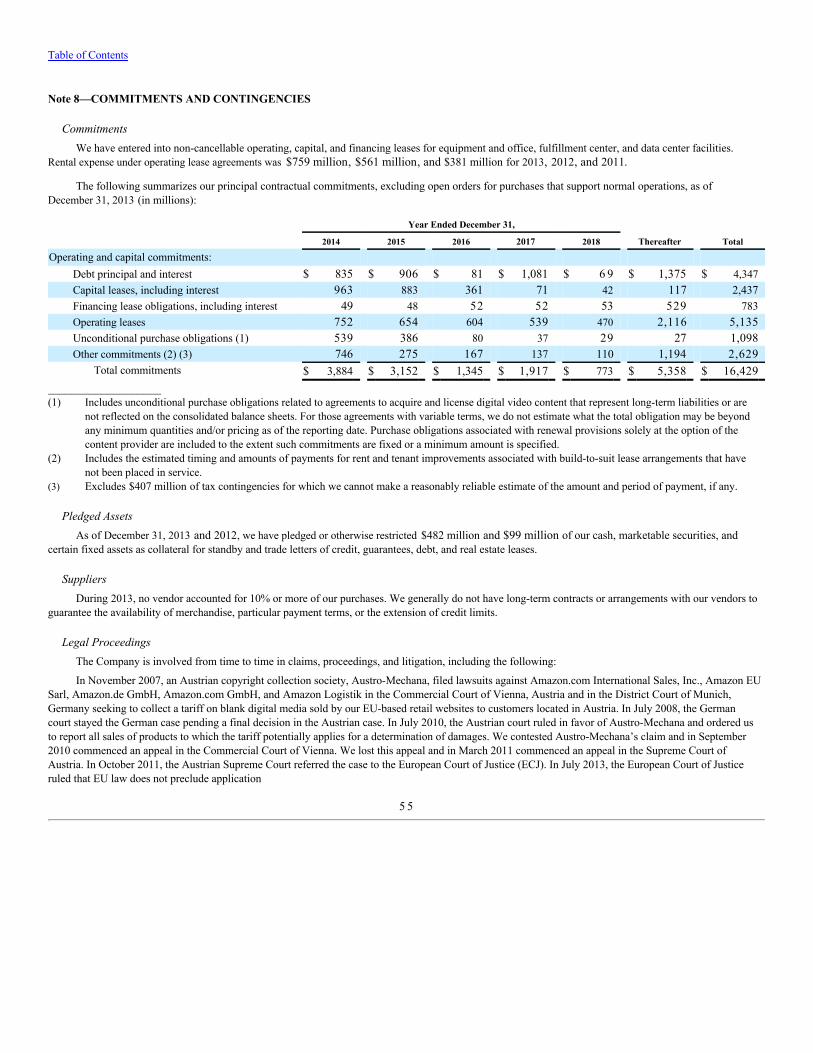
Table of Contents
Note 8—COMMITMENTS AND CONTINGENCIES
CommitmentsWe have entered into non-cancellable operating, capital, and financing leases for equipment and office, fulfillment center, and data center facilities.
Rental expense under operating lease agreements was $759 million, $561 million, and $381 million for 2013, 2012, and 2011.
The following summarizes our principal contractual commitments, excluding open orders for purchases that support normal operations, as ofDecember 31, 2013 (in millions):
Year Ended December 31,
2014 2015 2016 2017 2018 Thereafter Total
Operating and capital commitments: Debt principal and interest $ 835 $ 906 $ 81 $ 1,081 $ 6 9 $ 1,375 $ 4,347Capital leases, including interest 963 883 361 71 42 117 2,437Financing lease obligations, including interest 49 48 52 52 53 529 783Operating leases 752 654 604 539 470 2,116 5,135Unconditional purchase obligations (1) 539 386 80 37 29 27 1,098Other commitments (2) (3) 746 275 167 137 110 1,194 2,629
Total commitments $ 3,884 $ 3,152 $ 1,345 $ 1,917 $ 773 $ 5,358 $ 16,429___________________(1) Includes unconditional purchase obligations related to agreements to acquire and license digital video content that represent long-term liabilities or are
not reflected on the consolidated balance sheets. For those agreements with variable terms, we do not estimate what the total obligation may be beyondany minimum quantities and/or pricing as of the reporting date. Purchase obligations associated with renewal provisions solely at the option of thecontent provider are included to the extent such commitments are fixed or a minimum amount is specified.
(2) Includes the estimated timing and amounts of payments for rent and tenant improvements associated with build-to-suit lease arrangements that havenot been placed in service.
(3) Excludes $407 million of tax contingencies for which we cannot make a reasonably reliable estimate of the amount and period of payment, if any.
Pledged AssetsAs of December 31, 2013 and 2012, we have pledged or otherwise restricted $482 million and $99 million of our cash, marketable securities, and
certain fixed assets as collateral for standby and trade letters of credit, guarantees, debt, and real estate leases.
SuppliersDuring 2013, no vendor accounted for 10% or more of our purchases. We generally do not have long-term contracts or arrangements with our vendors to
guarantee the availability of merchandise, particular payment terms, or the extension of credit limits.
Legal ProceedingsThe Company is involved from time to time in claims, proceedings, and litigation, including the following:
In November 2007, an Austrian copyright collection society, Austro-Mechana, filed lawsuits against Amazon.com International Sales, Inc., Amazon EUSarl, Amazon.de GmbH, Amazon.com GmbH, and Amazon Logistik in the Commercial Court of Vienna, Austria and in the District Court of Munich,Germany seeking to collect a tariff on blank digital media sold by our EU-based retail websites to customers located in Austria. In July 2008, the Germancourt stayed the German case pending a final decision in the Austrian case. In July 2010, the Austrian court ruled in favor of Austro-Mechana and ordered usto report all sales of products to which the tariff potentially applies for a determination of damages. We contested Austro-Mechana’s claim and in September2010 commenced an appeal in the Commercial Court of Vienna. We lost this appeal and in March 2011 commenced an appeal in the Supreme Court ofAustria. In October 2011, the Austrian Supreme Court referred the case to the European Court of Justice (ECJ). In July 2013, the European Court of Justiceruled that EU law does not preclude application
5 5
Table of Contents
of the tariff where certain conditions are met and directed the case back to the Austrian Supreme Court for further proceedings. In October 2013, the AustrianSupreme Court referred the case back to the Commercial Court of Vienna for further fact finding to determine whether the tariff on blank digital media meetsthe conditions set by the ECJ. In December 2012, a German copyright collection society, Zentralstelle für private Überspielungsrechte (ZPU), filed a complaintagainst Amazon EU Sarl, Amazon Media EU Sarl, Amazon Services Europe Sarl, Amazon Payments Europe SCA, Amazon Europe Holding TechnologiesSCS, and Amazon Eurasia Holdings Sarl in the District Court of Luxembourg seeking to collect a tariff on blank digital media sold by the Amazon.de retailwebsite to customers located in Germany. In January 2013, a Belgian copyright collection society, AUVIBEL, filed a complaint against Amazon EU Sarl inthe Court of First Instance of Brussels, Belgium, seeking to collect a tariff on blank digital media sold by the Amazon.fr retail website to customers located inBelgium. In November 2013, the Belgian court ruled in favor of AUVIBEL and ordered us to report all sales of products to which the tariff potentially appliesfor a determination of damages. We dispute the allegations of wrongdoing and intend to defend ourselves vigorously in these matters.
In May 2009, Big Baboon, Inc. filed a complaint against Amazon.com, Inc. and Amazon Payments, Inc. for patent infringement in the United StatesDistrict Court for the Central District of California. The complaint alleges, among other things, that our third-party selling and payments technology infringespatents owned by Big Baboon, Inc. purporting to cover an “Integrated Business-to-Business Web Commerce And Business Automation System” (U.S. PatentNos. 6,115,690 and 6,343,275) and seeks injunctive relief, monetary damages, treble damages, costs, and attorneys’ fees. In February 2011, the Courtentered an order staying the lawsuit pending the outcome of the Patent and Trademark Office’s re-examination of the patent. We dispute the allegations ofwrongdoing and intend to defend ourselves vigorously in this matter.
In April 2011, Walker Digital LLC filed several complaints against Amazon.com, Inc. for patent infringement in the United States District Court for theDistrict of Delaware. The complaints allege that we infringe several of the plaintiff’s U.S. patents by, among other things, providing “cross benefits” tocustomers through our promotions (U.S. Patent Nos. 7,831,470 and 7,827,056), using a customer’s identified original product to offer a substitute product(U.S. Patent No. 7,236,942), using our product recommendations and personalization features to offer complementary products together (U.S. Patent Nos.6,601,036 and 6,138,105), enabling customers to subscribe to a delivery schedule for products they routinely use at reduced prices (U.S. PatentNo. 5,970,470), and offering personalized advertising based on customers’ preferences identified using a data pattern (U.S. Patent No. 7,933,893). Anothercomplaint, filed in the same court in October 2011, alleges that we infringe plaintiff’s U.S. Patent No. 8,041,711 by offering personalized advertising basedon customer preferences that associate data with resource locators. Another complaint, filed in the same court in February 2012, alleges that we infringeplaintiff’s U.S. Patent No. 8,112,359 by using product information received from customers to identify and offer substitute products using a manufacturerdatabase. In January 2013, the plaintiff filed another complaint in the same court alleging that we infringe U.S. Patent No. 6,381,582 by allowing customersto make local payments for products ordered online. All of the complaints seek monetary damages, interest, injunctive relief, costs, and attorneys’ fees. InMarch 2013, the complaints asserting U.S. Patent Nos. 7,236,942 and 7,933,893 were voluntarily dismissed with prejudice. In April 2013, the caseasserting U.S. Patent No. 8,041,711 was stayed pending final resolution of the reexamination of that patent. In June 2013, the court granted defendants’motions to dismiss the complaints asserting U.S. Patent Nos. 7,831,470, 7,827,056, and 8,112,359 for lack of standing. In July 2013, we filed motionsseeking entry of a final judgment dismissing those claims with prejudice and for attorneys' fees, and plaintiff filed notices of appeal from the June 2013 ordergranting the motions to dismiss. In October 2013, the court ruled that its dismissals are with prejudice, and Walker has appealed those rulings. We disputethe remaining allegations of wrongdoing and intend to defend ourselves vigorously in these matters.
In December 2011, Personalweb Technologies, LLC filed a complaint against Amazon.com, Inc. and Amazon Web Services, LLC in the United StatesDistrict Court for the Eastern District of Texas. The complaint alleges, among other things, that “Amazon Simple Storage Service (S3) and AmazonElastiCache” infringe U.S. Patent No. 5,978,791, entitled “Data Processing System Using Substantially Unique Identifiers To Identify Data Items, WherebyData Items Have The Same Identifiers”; U.S. Patent No. 6,415,280, entitled “Identifying And Requesting Data In Network Using Identifiers Which AreBased On Contents Of Data”; U.S. Patent No. 6,928,442, entitled “Enforcement And Policing Of Licensed Content Using Content-Based Identifiers”;U.S. Patent No. 7,802,310, entitled “Controlling Access To Data In A Data Processing System”; U.S. Patent No. 7,945,539, entitled “Distributing AndAccessing Data In A Data Processing System”; U.S. Patent No. 7,945,544, entitled “Similarity-Based Access Control Of Data In A Data ProcessingSystem”; U.S. Patent No. 7,949,662, entitled “De-Duplication Of Data In A Data Processing System”; and U.S. Patent No. 8,001,096, entitled “ComputerFile System Using Content-Dependent File Identifiers.” The complaint seeks an unspecified amount of damages, interest, attorneys’ fees, and aninjunction. We dispute the allegations of wrongdoing and intend to defend ourselves vigorously in this matter.
In December 2011, Round Rock Research, LLC filed a complaint against Amazon.com, Inc. in the United States District Court for the District ofDelaware. The complaint alleges, among other things, that “RFID products” and “Kindle products with unlicensed DRAM” infringe: U.S. Patent Nos.5,500,650 and 5,627,544, entitled “Data Communication Method Using Identification Protocol”; U.S. Patent No. 5,974,078, entitled “Modulated SpreadSpectrum In RF Identification Systems Method”; U.S. Patent No. 6,459,726, entitled “Backscatter Interrogators, Communication Systems And Backscatter
5 6
Table of Contents
Communication Methods”; U.S. Patent No. RE41,531, entitled “Communications Systems For Radio Frequency Identification (RFID)”; U.S. Patent Nos.6,975,556 and 7,106,646, entitled “Circuit And Method For Controlling A Clock Synchronizing Circuit For Low Power Refresh Operation”; U.S. PatentNo. 7,221,020, entitled “Method To Construct A Self Aligned Recess Gate For DRAM Access Devices”; and U.S. Patent No. 7,389,369, entitled “ActiveTermination Control.” In February 2012, the plaintiff filed an amended complaint that further alleges, among other things, that Kindle products allegedlyincluding “unlicensed flash memory” infringe U.S. Patent No. 5,801,985, entitled “Memory System Having Programmable Control Parameters” and U.S.Patent No. 5,880,996, entitled “Memory System Having Non-Volatile Data Storage Structure For Memory Control Parameters And Method.” In April 2012,the plaintiff filed a second amended complaint further alleging, among other things, that “RFID products” infringe U.S. Patent No. 5,266,925, entitled“Electronic Tag Interrogation Method,” U.S. Patent No. 5,583,850, entitled “Data Communication System Using Identification Protocol,” U.S. Patent No.5,986,570, entitled “Method For Resolving Signal Collisions Between Multiple RFID Transponders In A Field,” U.S. Patent No. 7,265,674, entitled “Thin,Flexible RFID Labels, And Methods And Apparatus For Use,” and U.S. Patent No. RE41,562, entitled “System And Method For Electronic Tracking OfUnits Associated With A Batch.” The second amended complaint seeks an unspecified amount of damages, enhanced damages, interest, costs, and attorneys’fees. In April 2012, the case was stayed pending reexamination of ten of the asserted patents. We dispute the allegations of wrongdoing and intend to defendourselves vigorously in this matter.
In March 2012, OIP Technologies, Inc. filed a complaint against Amazon.com, Inc. for patent infringement in the United States District Court for theNorthern District of California. The complaint alleged, among other things, that certain aspects of our pricing methods infringed U.S. Patent No. 7,970,713,entitled “Method And Apparatus For Automatic Pricing In Electronic Commerce.” The complaint sought three times an unspecified amount of damages,attorneys’ fees, and interest. In September 2012, the Court invalidated the plaintiff’s patent and dismissed the case with prejudice. In September 2012, OIPappealed the judgment of the district court to the United States Court of Appeals for the Federal Circuit, which, in November 2012, stayed all proceedingspending its decision in a separate case that raises a related question of law and, in June 2013, continued the stay pending a decision by the United StatesSupreme Court. We dispute the allegations of wrongdoing and intend to defend ourselves vigorously in this matter.
In May 2012, Clouding IP, LLC f/k/a/ STEC IP, LLC filed a complaint against Amazon.com, Inc. and Amazon Web Services, LLC in the UnitedStates District Court for the District of Delaware. The complaint alleges, among other things, that our “Elastic Compute Cloud,” “WhisperSync,” “VirtualPrivate Cloud,” “Cloud Drive,” and “Kindle Store” services infringe one or more of 11 patents: U.S. Patent Nos. 7,596,784, entitled “Method System AndApparatus For Providing Pay-Per-Use Distributed Computing Resources”; 7,065,637, entitled “System For Configuration Of Dynamic ComputingEnvironments Using A Visual Interface”; 6,738,799, entitled “Methods And Apparatuses For File Synchronization And Updating Using A Signature List”;5,944,839, entitled “System And Method For Automatically Maintaining A Computer System”; 5,825,891, entitled “Key Management For NetworkCommunication”; 5,495,607, entitled “Network Management System Having Virtual Catalog Of Files Distributively Stored Across Network Domain”;6,925,481 and 7,254,621, entitled “Technique For Enabling Remote Data Access And Manipulation From A Pervasive Device”; 6,631,449 and 6,918,014,entitled “Dynamic Distributed Data System And Method”; and 6,963,908, entitled “System For Transferring Customized Hardware And Software SettingsFrom One Computer To Another Computer To Provide Personalized Operating Environments.” In August 2012, Clouding amended its complaint to also assertU.S. Patent No. 7,032,089, entitled “Replica Synchronization Using Copy-On-Read Technique,” against WhisperSync. In February 2013, Clouding servedits notice of accused products in which it also identified “AWS Market Place,” “AWS Storage Gateway,” “Cloud Player,” “DynamoDB,” “Elastic BlockStore (EBS),” “Elastic Load Balancing,” “Elastic Map Reduce,” “Relational Database Service,” “Simple Storage Service,” “Simple DB,” “Cloud Watch,”“Kindle,” and “Elastic Compute Cloud AutoScaling” as allegedly infringing. The complaint seeks an unspecified amount of damages together withinterest. We dispute the allegations of wrongdoing and intend to defend ourselves vigorously in this matter.
In June 2012, Hand Held Products, Inc., a subsidiary of Honeywell, filed a complaint against Amazon.com, Inc., AMZN Mobile, LLC, AmazonFresh,LLC, A9.com, Inc., A9 Innovations, LLC, and Quidsi, Inc. in the United States District Court for the District of Delaware. The complaint alleges, amongother things, that the use of mobile barcode reader applications, including Amazon Mobile, Amazon Price Check, Flow, and AmazonFresh, infringes U.S.Patent No. 6,015,088, entitled “Decoding Of Real Time Video Imaging.” The complaint seeks an unspecified amount of damages, interest, and an injunction.We dispute the allegations of wrongdoing and intend to defend ourselves vigorously in this matter.
In July 2012, Norman Blagman filed a purported class-action complaint against Amazon.com, Inc. for copyright infringement in the United StatesDistrict Court for the Southern District of New York. The complaint alleges, among other things, that Amazon.com, Inc. sells digital music in our AmazonMP3 Store obtained from defendant Orchard Enterprises and other unnamed “digital music aggregators” without obtaining mechanical licenses for thecompositions embodied in that music. The complaint seeks certification as a class action, statutory damages, attorneys’ fees, and interest. We dispute theallegations of wrongdoing and intend to defend ourselves vigorously in this matter.
57
Table of Contents
In August 2012, an Australian quasi-government entity named Commonwealth Scientific and Industrial Research Organization filed a complaint againstAmazon.com, Inc. in the United States District Court for the Eastern District of Texas. The complaint alleges, among other things, that the sale of “productswhich are operable according to the Institute of Electrical and Electronics Engineers (“IEEE”) 802.11a, g, n, and/or draft n standards” infringe U.S. PatentNo. 5,487,069, entitled “Wireless LAN.” The complaint seeks an unspecified amount of damages, enhanced damages, attorneys’ fees, and injunctive relief.We dispute the allegations of wrongdoing and intend to defend ourselves vigorously in this matter.
In November 2012, Lexington Luminance LLC filed a complaint against Amazon.com, Inc. and Amazon Digital Services, Inc. in the United StatesDistrict Court for the District of Massachusetts. The complaint alleges, among other things, that certain light-emitting diodes in certain Kindle devices infringeU.S. Patent No. 6,936,851, entitled “Semiconductor Light-Emitting Device And Method For Manufacturing Same.” The complaint seeks an unspecifiedamount of damages and an injunction or, in the absence of an injunction, a compulsory ongoing royalty. We dispute the allegations of wrongdoing and intendto defend ourselves vigorously in this matter.
In May 2013, Adaptix, Inc. filed a complaint against Amazon.com, Inc. in the United States District Court for the Eastern District of Texas. Thecomplaint alleges, among other things, that certain Kindle devices infringe U.S. Patent Nos. 7,454,212 and 6,947,748, both entitled “OFDMA WithAdaptive Subcarrier-Cluster Configuration And Selective Loading.” The complaint seeks an unspecified amount of damages, interest, injunctive relief, andattorneys’ fees. We dispute the allegations of wrongdoing and intend to defend ourselves vigorously in this matter.
In July 2013, Telebuyer, LLC filed a complaint against Amazon.com, Inc., Amazon Web Services, LLC, and VADATA, Inc. in the United StatesDistrict Court for the Eastern District of Virginia. The complaint alleges, among other things, that certain features used on our retail website-including highresolution video and still images, user-indicated areas of interest, targeted follow-up communications, vendor proposals, on-line chat, Gold Box and LightningDeals, and vendor ratings-infringe seven U.S. patents: Nos. 6,323,894, 7,835,508, 7,835,509, 7,839,984, 8,059,796, and 8,098,272, all entitled“Commercial Product Routing System With Video Vending Capability,” and 8,315,364, entitled “Commercial Product Routing System With Mobile WirelessAnd Video Vending Capability.” The complaint seeks an unspecified amount of damages, interest, and injunctive relief. In September 2013, the case wastransferred to the United States District Court for the Western District of Washington. We dispute the allegations of wrongdoing and intend to defend ourselvesvigorously in this matter.
In August 2013, Cellular Communications Equipment, LLC filed a complaint against Amazon.com, Inc. in the United States District Court for theEastern District of Texas. The complaint alleges, among other things, that certain Kindle devices infringe U.S. Patent Nos.: 6,819,923, entitled “Method ForCommunication Of Neighbor Cell Information”; 7,215,962, entitled “Method For An Intersystem Connection Handover”; 7,941,174, entitled “Method ForMulticode Transmission By A Subscriber Station”; and 8,055,820, entitled “Apparatus, System, And Method For Designating A Buffer Status ReportingFormat Based On Detected Pre-Selected Buffer Conditions.” The complaint seeks an unspecified amount of damages and interest. We dispute the allegationsof wrongdoing and intend to defend ourselves vigorously in this matter.
Beginning in August 2013, a number of complaints were filed alleging, among other things, that Amazon.com, Inc. and several of its subsidiaries failedto compensate hourly workers for time spent waiting in security lines and otherwise violated federal and state wage and hour statutes and common law. InAugust 2013, Busk v. Integrity Staffing Solutions, Inc. and Amazon.com, Inc. was filed in the United States District Court for the District of Nevada, andVance v. Amazon.com, Inc., Zappos.com Inc., another affiliate of Amazon.com, Inc., and Kelly Services, Inc. was filed in the United States District Court forthe Western District of Kentucky. In September 2013, Allison v. Amazon.com, Inc. and Integrity Staffing Solutions, Inc. was filed in the United StatesDistrict Court for the Western District of Washington, and Johnson v. Amazon.com, Inc. and an affiliate of Amazon.com, Inc. was filed in the United StatesDistrict Court for the Western District of Kentucky. In October 2013, Davis v. Amazon.com, Inc., an affiliate of Amazon.com, Inc., and Integrity StaffingSolutions, Inc. was filed in the United States District Court for the Middle District of Tennessee. The plaintiffs variously purport to represent a nationwideclass of certain current and former employees under the Fair Labor Standards Act and/or state-law-based subclasses for certain current and former employeesin states including Arizona, California, Pennsylvania, South Carolina, Kentucky, and Nevada, and one complaint asserts nationwide breach of contract andunjust enrichment claims. The complaints seek an unspecified amount of damages, interest, injunctive relief, and attorneys’ fees. We have been named inseveral other similar cases. We dispute the allegations of wrongdoing and intend to defend ourselves vigorously in these matters.
In September 2013, Personalized Media Communications, LLC filed a complaint against Amazon.com, Inc. and Amazon Web Services, LLC in theUnited States District Court for the District of Delaware. The complaint alleges, among other things, that the use of certain Kindle devices, Kindle appsand/or Amazon.com, Inc.’s website to purchase and receive electronic media infringes nine U.S. Patents: Nos. 5,887,243, 7,801,304, 7,805,749,7,940,931, 7,769,170, 7,864,956, 7,827,587, 8,046,791, and 7,883,252, all entitled “Signal Processing Apparatus And Methods.” The complaint alsoalleges, among other things, that CloudFront, S3, and EC2 web services infringe three of those patents, Nos. 7,801,304, 7,864,956, and 7,827,587. Thecomplaint seeks an unspecified amount of damages, interest, and injunctive relief. We dispute the allegations of wrongdoing and intend to defend ourselvesvigorously in this matter.
58
Table of Contents
In October 2013, Mobile Telecommunications Technologies, LLC filed a complaint against Amazon.com, Inc. for patent infringement in the UnitedStates District Court for the Eastern District of Texas. The complaint alleges, among other things, that our network operation centers and our mobile devices,such as Kindle Fire models based on the Android operating system that provide XMPP-compliant messaging services and applications, infringe U.S. PatentNo. 5,809,428, entitled “Method And Device For Processing Undelivered Data Messages In A Two-Way Wireless Communications System.” The complaintalso alleges that Amazon’s mobile devices infringe U.S. Patent No. 5,754,946, entitled “Nationwide Communication System,” and that Amazon.com, Inc.infringes U.S. Patent No. 5,786,748, entitled “Method And Apparatus For Giving Notification Of Express Mail Delivery,” by providing tracking andnotification services to customers who purchase products directly from Amazon.com, Inc. The complaint seeks an unspecified amount of damages, enhanceddamages, attorneys’ fees, costs, interest, and injunctive relief. We dispute the allegations of wrongdoing and intend to defend ourselves vigorously in thismatter.
In October 2013, Tuxis Technologies, LLC filed a complaint against Amazon.com, Inc. for patent infringement in the United States District Court forDistrict of Delaware. The complaint alleges, among other things, that “the Amazon.com website” with “recommendation features” infringes U.S. Patent No.6,055,513, entitled “Methods And Apparatus For Intelligent Selection Of Goods And Services In Telephonic And Electronic Commerce.” The complaint seeksan unspecified amount of damages, attorneys’ fees, costs, and interest. We dispute the allegations of wrongdoing and intend to defend ourselves vigorously inthis matter.
In November 2013, Memory Integrity, LLC filed a complaint against Amazon.com, Inc. for patent infringement in the United States District Court forthe District of Delaware. The complaint alleges, among other things, that certain Kindle devices infringe U.S. Patent No. 7,296,121, entitled “Reducing ProbeTraffic In Multiprocessor Systems.” The complaint seeks an unspecified amount of damages, costs, expenses, and interest. We dispute the allegations ofwrongdoing and intend to defend ourselves vigorously in this matter.
In November 2013, Vantage Point Technology, Inc. filed a complaint against Amazon.com, Inc. for patent infringement in the United States DistrictCourt for the Eastern District of Texas. The complaint alleges, among other things, that Kindle devices with a Cortex A-9 core processor and OMAP 4430chipset, Kindle device HD tablets with a Cortex A-9 core processor and OMAP 4470 chipset, and Kindle devices with a Cortex A-8 core processor andFreescale MX50 family chipset infringe U.S. Patent No. 5,463,750, entitled “Method And Apparatus For Translating Virtual Addresses In A Data ProcessingSystem Having Multiple Instruction Pipelines And Separate TLB’s For Each Pipeline.” The complaint seeks an unspecified amount of damages, enhanceddamages, costs, and interest. We dispute the allegations of wrongdoing and intend to defend ourselves vigorously in this matter.
In December 2013, Appistry, Inc. filed a complaint against Amazon.com, Inc. and Amazon Web Services, Inc. for patent infringement in the UnitedStates District Court for the Eastern District of Missouri. The complaint alleges, among other things, that Amazon’s Elastic Compute Cloud infringes U.S.Patent Nos. 8,200,746, entitled “System And Method For Territory-Based Processing Of Information,” and 8,341,209, entitled “System And Method ForProcessing Information Via Networked Computers Including Request Handlers, Process Handlers, And Task Handlers.” The complaint seeks injunctiverelief, an unspecified amount of monetary damages, trebled damages, costs, and interest. We dispute the allegations of wrongdoing and intend to defendourselves vigorously in this matter.
In December 2013, Delaware Display Group LLC and Innovative Display Technologies LLC filed a complaint against Amazon.com, Inc. for patentinfringement in the United States District Court for the District of Delaware. The complaint alleges, among other things, that Amazon’s tablets with liquidcrystal displays infringe U.S. Patent Nos.: 6,755,547, 7,300,194, 7,384,177, 7,404,660, 7,434,974, 7,357,370, and 8,215,816, all entitled “LightEmitting Panel Assemblies.” The complaint also alleges that tablets with liquid crystal displays infringe U.S. Patent No. 7,914,196, entitled “LightRedirecting Film Systems Having Pattern Of Variable Optical Elements.” The complaint seeks injunctive relief, an unspecified amount of monetary damages,costs, interest, and attorneys’ fees. We dispute the allegations of wrongdoing and intend to defend ourselves vigorously in this matter.
In December 2013, ContentGuard Holdings, Inc. filed a complaint against Amazon.com, Inc. for patent infringement in the United States District Courtfor Eastern District of Texas. The complaint alleges, among other things, that certain digital rights management software used by various Kindle Fire softwareapplications, including the Kindle Reader and Amazon Instant Video, infringe seven U.S. Patents: Nos. 6,963,859, entitled “Content RenderingRepository”; 7,523,072, entitled “System For Controlling The Distribution And Use Of Digital Works”; 7,269,576, entitled “Content RenderingApparatus”; 8,370,956, entitled “System And Method For Rendering Digital Content In Accordance With Usage Rights Information”; 8,393,007, entitled“System And Method For Distributing Digital Content In Accordance With Usage Rights Information”; 7,225,160, entitled “Digital Works Having UsageRights And Method For Creating The Same”; and 8,583,556, entitled “Method For Providing A Digital Asset For Distribution.” The complaint seeks anunspecified amount of damages, an injunction, enhanced damages, attorneys’ fees, costs, and interest. We dispute the allegations of wrongdoing and intend todefend ourselves vigorously in this matter.
5 9
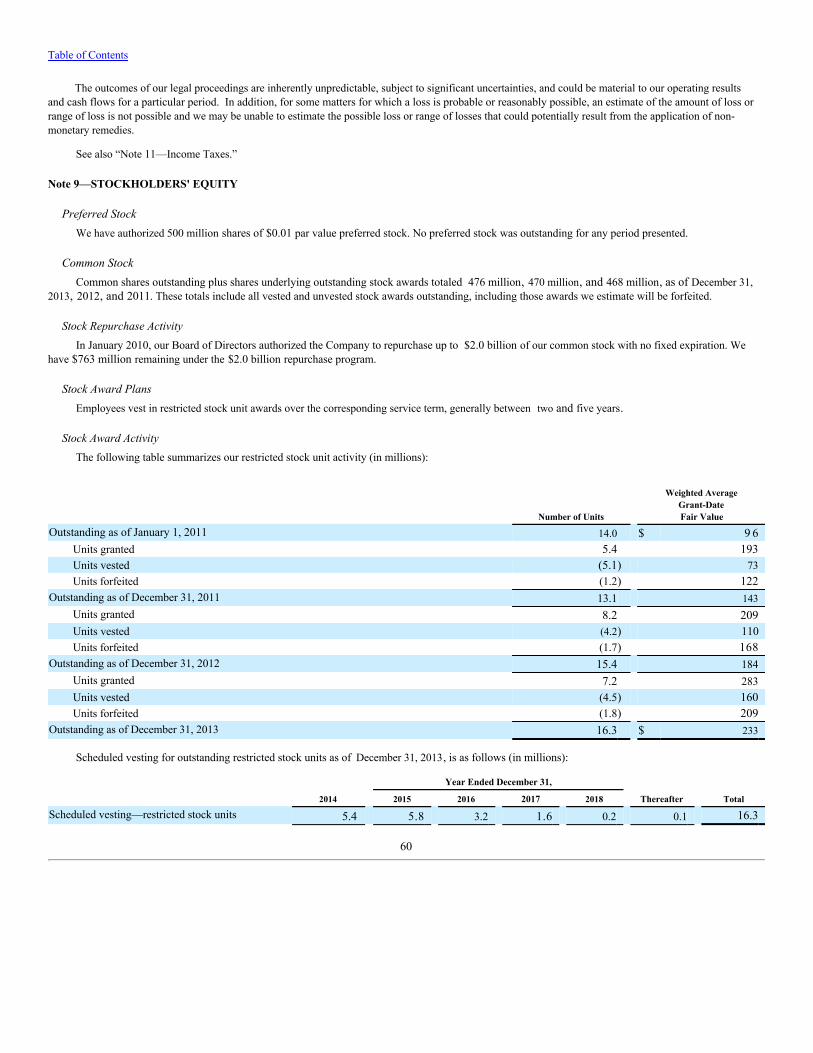
Table of Contents
The outcomes of our legal proceedings are inherently unpredictable, subject to significant uncertainties, and could be material to our operating resultsand cash flows for a particular period. In addition, for some matters for which a loss is probable or reasonably possible, an estimate of the amount of loss orrange of loss is not possible and we may be unable to estimate the possible loss or range of losses that could potentially result from the application of non-monetary remedies.
See also “Note 11—Income Taxes.”
Note 9—STOCKHOLDERS' EQUITY
Preferred StockWe have authorized 500 million shares of $0.01 par value preferred stock. No preferred stock was outstanding for any period presented.
Common StockCommon shares outstanding plus shares underlying outstanding stock awards totaled 476 million, 470 million, and 468 million, as of December 31,
2013, 2012, and 2011. These totals include all vested and unvested stock awards outstanding, including those awards we estimate will be forfeited.
Stock Repurchase ActivityIn January 2010, our Board of Directors authorized the Company to repurchase up to $2.0 billion of our common stock with no fixed expiration. We
have $763 million remaining under the $2.0 billion repurchase program.
Stock Award PlansEmployees vest in restricted stock unit awards over the corresponding service term, generally between two and five years.
Stock Award ActivityThe following table summarizes our restricted stock unit activity (in millions):
Number of Units
Weighted AverageGrant-DateFair Value
Outstanding as of January 1, 2011 14.0 $ 9 6Units granted 5.4 193Units vested (5.1) 73Units forfeited (1.2) 122
Outstanding as of December 31, 2011 13.1 143Units granted 8.2 209Units vested (4.2) 110Units forfeited (1.7) 168
Outstanding as of December 31, 2012 15.4 184Units granted 7.2 283Units vested (4.5) 160Units forfeited (1.8) 209
Outstanding as of December 31, 2013 16.3 $ 233
Scheduled vesting for outstanding restricted stock units as of December 31, 2013, is as follows (in millions):
Year Ended December 31,
2014 2015 2016 2017 2018 Thereafter Total
Scheduled vesting—restricted stock units 5.4 5.8 3.2 1.6 0.2 0.1 16.3
60
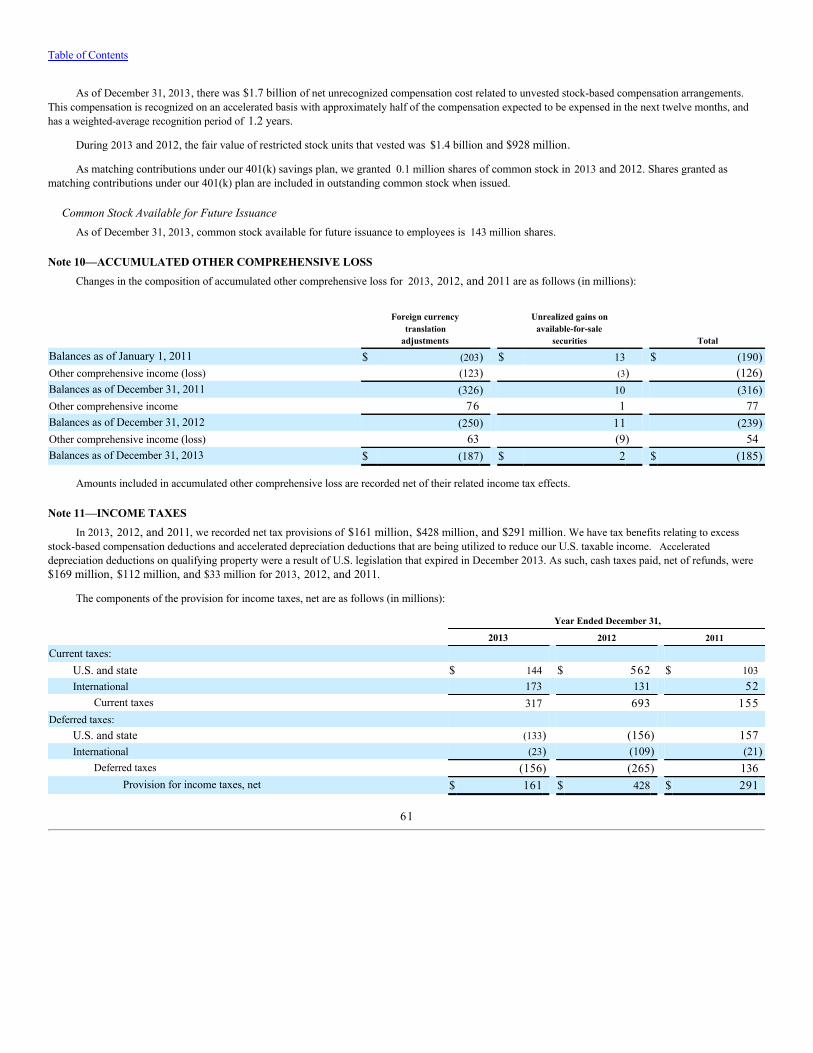
Table of Contents
As of December 31, 2013, there was $1.7 billion of net unrecognized compensation cost related to unvested stock-based compensation arrangements.This compensation is recognized on an accelerated basis with approximately half of the compensation expected to be expensed in the next twelve months, andhas a weighted-average recognition period of 1.2 years.
During 2013 and 2012, the fair value of restricted stock units that vested was $1.4 billion and $928 million.
As matching contributions under our 401(k) savings plan, we granted 0.1 million shares of common stock in 2013 and 2012. Shares granted asmatching contributions under our 401(k) plan are included in outstanding common stock when issued.
Common Stock Available for Future IssuanceAs of December 31, 2013, common stock available for future issuance to employees is 143 million shares.
Note 10—ACCUMULATED OTHER COMPREHENSIVE LOSSChanges in the composition of accumulated other comprehensive loss for 2013, 2012, and 2011 are as follows (in millions):
Foreign currencytranslation
adjustments
Unrealized gains onavailable-for-sale
securities Total
Balances as of January 1, 2011 $ (203) $ 13 $ (190)Other comprehensive income (loss) (123) (3) (126)Balances as of December 31, 2011 (326) 10 (316)Other comprehensive income 76 1 77Balances as of December 31, 2012 (250) 11 (239)Other comprehensive income (loss) 63 (9) 54Balances as of December 31, 2013 $ (187) $ 2 $ (185)
Amounts included in accumulated other comprehensive loss are recorded net of their related income tax effects.
Note 11—INCOME TAXESIn 2013, 2012, and 2011, we recorded net tax provisions of $161 million, $428 million, and $291 million. We have tax benefits relating to excess
stock-based compensation deductions and accelerated depreciation deductions that are being utilized to reduce our U.S. taxable income. Accelerateddepreciation deductions on qualifying property were a result of U.S. legislation that expired in December 2013. As such, cash taxes paid, net of refunds, were$169 million, $112 million, and $33 million for 2013, 2012, and 2011.
The components of the provision for income taxes, net are as follows (in millions):
Year Ended December 31,
2013 2012 2011
Current taxes: U.S. and state $ 144 $ 562 $ 103International 173 131 52
Current taxes 317 693 155Deferred taxes:
U.S. and state (133) (156) 157International (23) (109) (21)
Deferred taxes (156) (265) 136Provision for income taxes, net $ 161 $ 428 $ 291
61
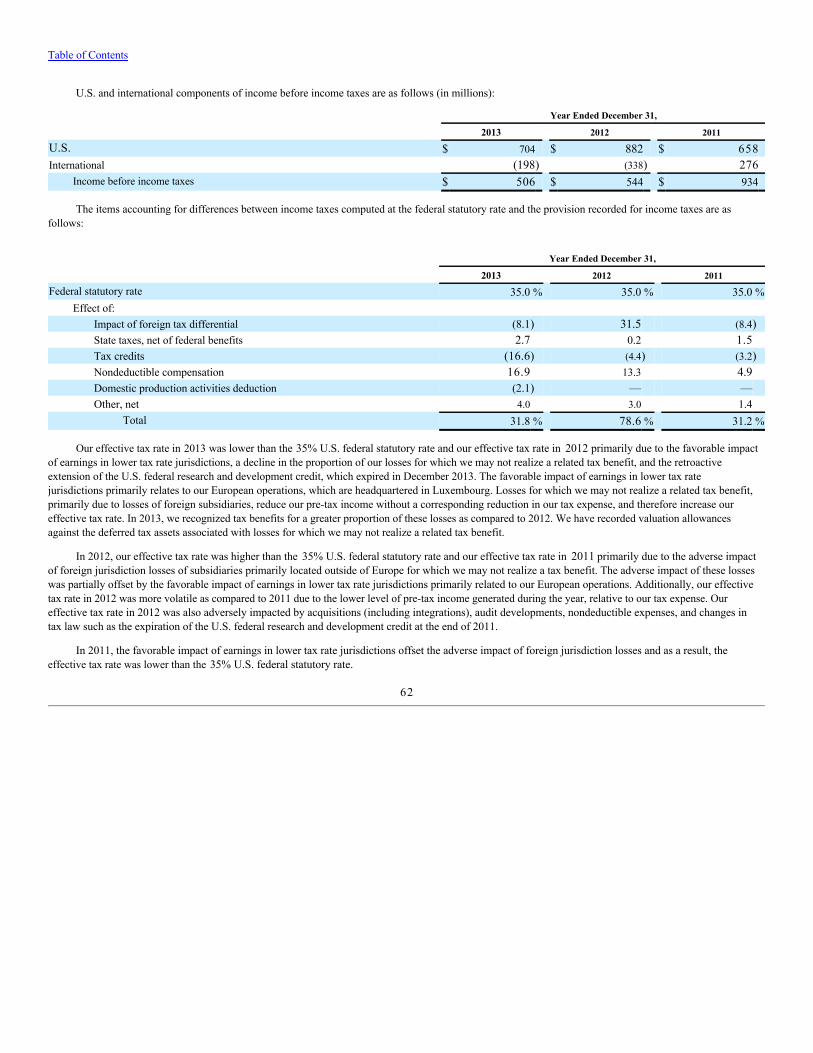
Table of Contents
U.S. and international components of income before income taxes are as follows (in millions):
Year Ended December 31,
2013 2012 2011
U.S. $ 704 $ 882 $ 658International (198) (338) 276
Income before income taxes $ 506 $ 544 $ 934
The items accounting for differences between income taxes computed at the federal statutory rate and the provision recorded for income taxes are asfollows:
Year Ended December 31,
2013 2012 2011
Federal statutory rate 35.0 % 35.0 % 35.0 %Effect of:
Impact of foreign tax differential (8.1) 31.5 (8.4)State taxes, net of federal benefits 2.7 0.2 1.5Tax credits (16.6) (4.4) (3.2)Nondeductible compensation 16.9 13.3 4.9Domestic production activities deduction (2.1) — —Other, net 4.0 3.0 1.4
Total 31.8 % 78.6 % 31.2 %
Our effective tax rate in 2013 was lower than the 35% U.S. federal statutory rate and our effective tax rate in 2012 primarily due to the favorable impactof earnings in lower tax rate jurisdictions, a decline in the proportion of our losses for which we may not realize a related tax benefit, and the retroactiveextension of the U.S. federal research and development credit, which expired in December 2013. The favorable impact of earnings in lower tax ratejurisdictions primarily relates to our European operations, which are headquartered in Luxembourg. Losses for which we may not realize a related tax benefit,primarily due to losses of foreign subsidiaries, reduce our pre-tax income without a corresponding reduction in our tax expense, and therefore increase oureffective tax rate. In 2013, we recognized tax benefits for a greater proportion of these losses as compared to 2012. We have recorded valuation allowancesagainst the deferred tax assets associated with losses for which we may not realize a related tax benefit.
In 2012, our effective tax rate was higher than the 35% U.S. federal statutory rate and our effective tax rate in 2011 primarily due to the adverse impactof foreign jurisdiction losses of subsidiaries primarily located outside of Europe for which we may not realize a tax benefit. The adverse impact of these losseswas partially offset by the favorable impact of earnings in lower tax rate jurisdictions primarily related to our European operations. Additionally, our effectivetax rate in 2012 was more volatile as compared to 2011 due to the lower level of pre-tax income generated during the year, relative to our tax expense. Oureffective tax rate in 2012 was also adversely impacted by acquisitions (including integrations), audit developments, nondeductible expenses, and changes intax law such as the expiration of the U.S. federal research and development credit at the end of 2011.
In 2011, the favorable impact of earnings in lower tax rate jurisdictions offset the adverse impact of foreign jurisdiction losses and as a result, theeffective tax rate was lower than the 35% U.S. federal statutory rate.
62
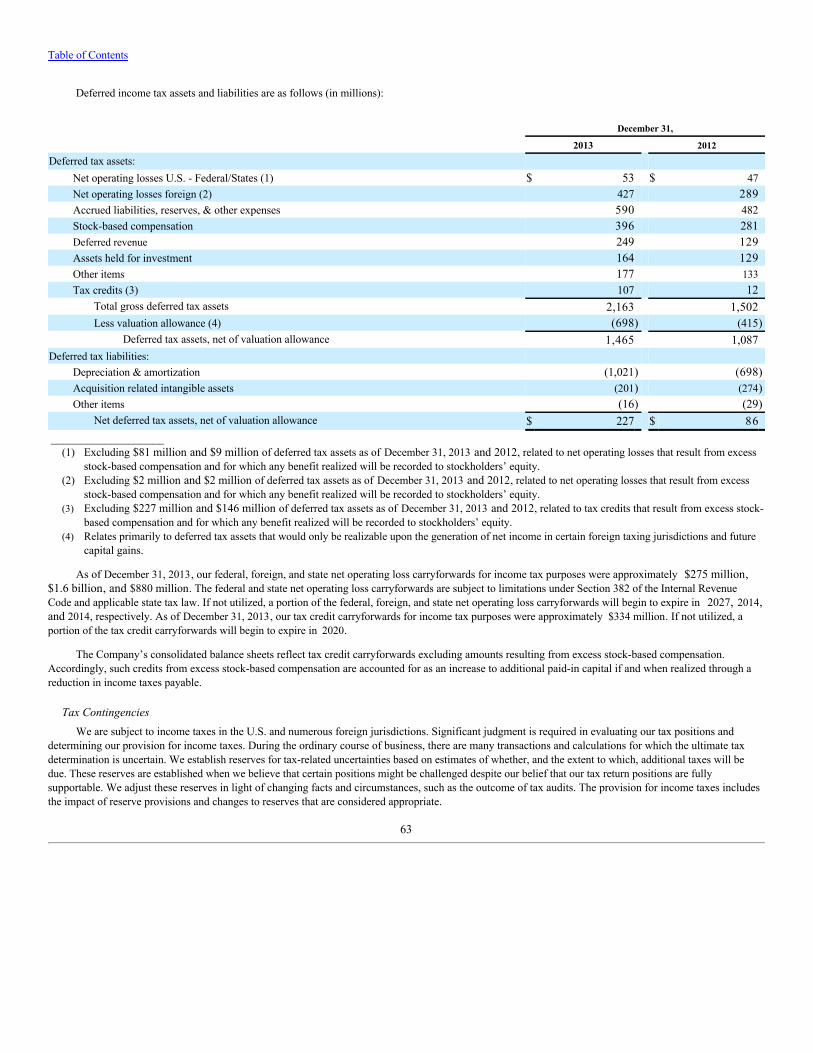
Table of Contents
Deferred income tax assets and liabilities are as follows (in millions):
December 31,
2013 2012
Deferred tax assets: Net operating losses U.S. - Federal/States (1) $ 53 $ 47Net operating losses foreign (2) 427 289Accrued liabilities, reserves, & other expenses 590 482Stock-based compensation 396 281Deferred revenue 249 129Assets held for investment 164 129Other items 177 133Tax credits (3) 107 12
Total gross deferred tax assets 2,163 1,502Less valuation allowance (4) (698) (415)
Deferred tax assets, net of valuation allowance 1,465 1,087Deferred tax liabilities:
Depreciation & amortization (1,021) (698)Acquisition related intangible assets (201) (274)Other items (16) (29)
Net deferred tax assets, net of valuation allowance $ 227 $ 86 ___________________
(1) Excluding $81 million and $9 million of deferred tax assets as of December 31, 2013 and 2012, related to net operating losses that result from excessstock-based compensation and for which any benefit realized will be recorded to stockholders’ equity.
(2) Excluding $2 million and $2 million of deferred tax assets as of December 31, 2013 and 2012, related to net operating losses that result from excessstock-based compensation and for which any benefit realized will be recorded to stockholders’ equity.
(3) Excluding $227 million and $146 million of deferred tax assets as of December 31, 2013 and 2012, related to tax credits that result from excess stock-based compensation and for which any benefit realized will be recorded to stockholders’ equity.
(4) Relates primarily to deferred tax assets that would only be realizable upon the generation of net income in certain foreign taxing jurisdictions and futurecapital gains.
As of December 31, 2013, our federal, foreign, and state net operating loss carryforwards for income tax purposes were approximately $275 million,$1.6 billion, and $880 million. The federal and state net operating loss carryforwards are subject to limitations under Section 382 of the Internal RevenueCode and applicable state tax law. If not utilized, a portion of the federal, foreign, and state net operating loss carryforwards will begin to expire in 2027, 2014,and 2014, respectively. As of December 31, 2013, our tax credit carryforwards for income tax purposes were approximately $334 million. If not utilized, aportion of the tax credit carryforwards will begin to expire in 2020.
The Company’s consolidated balance sheets reflect tax credit carryforwards excluding amounts resulting from excess stock-based compensation.Accordingly, such credits from excess stock-based compensation are accounted for as an increase to additional paid-in capital if and when realized through areduction in income taxes payable.
Tax ContingenciesWe are subject to income taxes in the U.S. and numerous foreign jurisdictions. Significant judgment is required in evaluating our tax positions and
determining our provision for income taxes. During the ordinary course of business, there are many transactions and calculations for which the ultimate taxdetermination is uncertain. We establish reserves for tax-related uncertainties based on estimates of whether, and the extent to which, additional taxes will bedue. These reserves are established when we believe that certain positions might be challenged despite our belief that our tax return positions are fullysupportable. We adjust these reserves in light of changing facts and circumstances, such as the outcome of tax audits. The provision for income taxes includesthe impact of reserve provisions and changes to reserves that are considered appropriate.
63
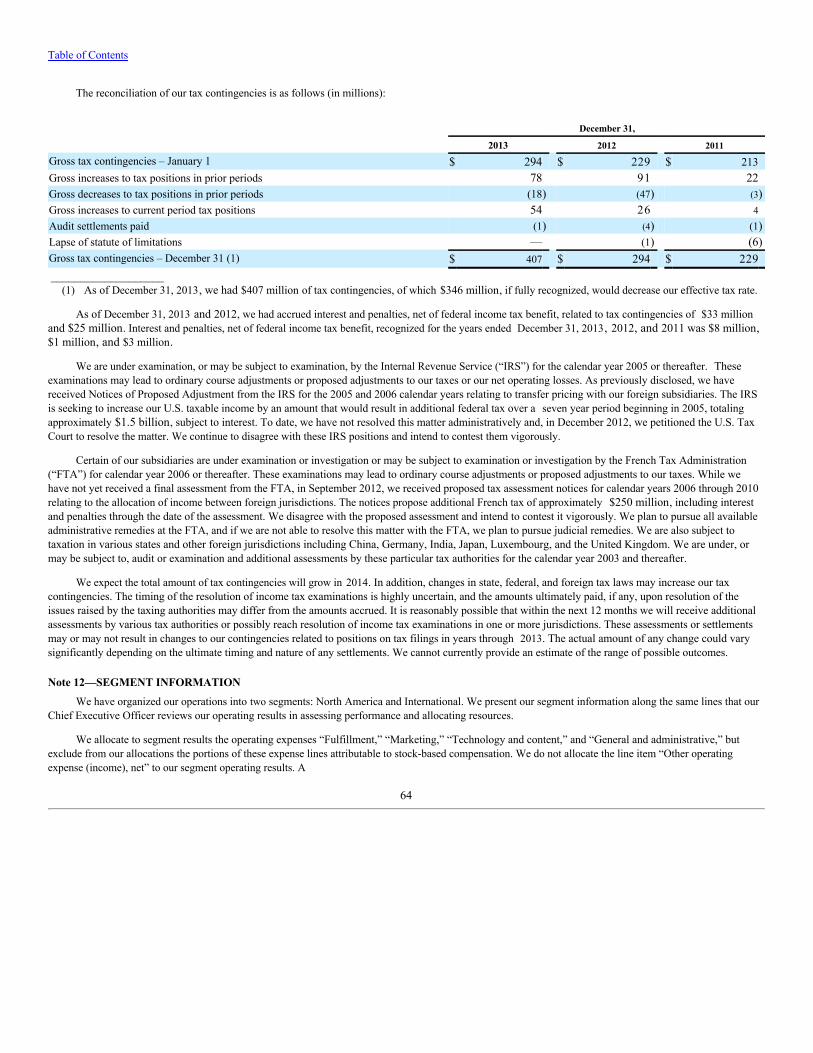
Table of Contents
The reconciliation of our tax contingencies is as follows (in millions):
December 31,
2013 2012 2011
Gross tax contingencies – January 1 $ 294 $ 229 $ 213Gross increases to tax positions in prior periods 78 91 22Gross decreases to tax positions in prior periods (18) (47) (3)Gross increases to current period tax positions 54 26 4Audit settlements paid (1) (4) (1)Lapse of statute of limitations — (1) (6)Gross tax contingencies – December 31 (1) $ 407 $ 294 $ 229 ___________________
(1) As of December 31, 2013, we had $407 million of tax contingencies, of which $346 million, if fully recognized, would decrease our effective tax rate.
As of December 31, 2013 and 2012, we had accrued interest and penalties, net of federal income tax benefit, related to tax contingencies of $33 millionand $25 million. Interest and penalties, net of federal income tax benefit, recognized for the years ended December 31, 2013, 2012, and 2011 was $8 million,$1 million, and $3 million.
We are under examination, or may be subject to examination, by the Internal Revenue Service (“IRS”) for the calendar year 2005 or thereafter. Theseexaminations may lead to ordinary course adjustments or proposed adjustments to our taxes or our net operating losses. As previously disclosed, we havereceived Notices of Proposed Adjustment from the IRS for the 2005 and 2006 calendar years relating to transfer pricing with our foreign subsidiaries. The IRSis seeking to increase our U.S. taxable income by an amount that would result in additional federal tax over a seven year period beginning in 2005, totalingapproximately $1.5 billion, subject to interest. To date, we have not resolved this matter administratively and, in December 2012, we petitioned the U.S. TaxCourt to resolve the matter. We continue to disagree with these IRS positions and intend to contest them vigorously.
Certain of our subsidiaries are under examination or investigation or may be subject to examination or investigation by the French Tax Administration(“FTA”) for calendar year 2006 or thereafter. These examinations may lead to ordinary course adjustments or proposed adjustments to our taxes. While wehave not yet received a final assessment from the FTA, in September 2012, we received proposed tax assessment notices for calendar years 2006 through 2010relating to the allocation of income between foreign jurisdictions. The notices propose additional French tax of approximately $250 million, including interestand penalties through the date of the assessment. We disagree with the proposed assessment and intend to contest it vigorously. We plan to pursue all availableadministrative remedies at the FTA, and if we are not able to resolve this matter with the FTA, we plan to pursue judicial remedies. We are also subject totaxation in various states and other foreign jurisdictions including China, Germany, India, Japan, Luxembourg, and the United Kingdom. We are under, ormay be subject to, audit or examination and additional assessments by these particular tax authorities for the calendar year 2003 and thereafter.
We expect the total amount of tax contingencies will grow in 2014. In addition, changes in state, federal, and foreign tax laws may increase our taxcontingencies. The timing of the resolution of income tax examinations is highly uncertain, and the amounts ultimately paid, if any, upon resolution of theissues raised by the taxing authorities may differ from the amounts accrued. It is reasonably possible that within the next 12 months we will receive additionalassessments by various tax authorities or possibly reach resolution of income tax examinations in one or more jurisdictions. These assessments or settlementsmay or may not result in changes to our contingencies related to positions on tax filings in years through 2013. The actual amount of any change could varysignificantly depending on the ultimate timing and nature of any settlements. We cannot currently provide an estimate of the range of possible outcomes.
Note 12—SEGMENT INFORMATIONWe have organized our operations into two segments: North America and International. We present our segment information along the same lines that our
Chief Executive Officer reviews our operating results in assessing performance and allocating resources.
We allocate to segment results the operating expenses “Fulfillment,” “Marketing,” “Technology and content,” and “General and administrative,” butexclude from our allocations the portions of these expense lines attributable to stock-based compensation. We do not allocate the line item “Other operatingexpense (income), net” to our segment operating results. A
64
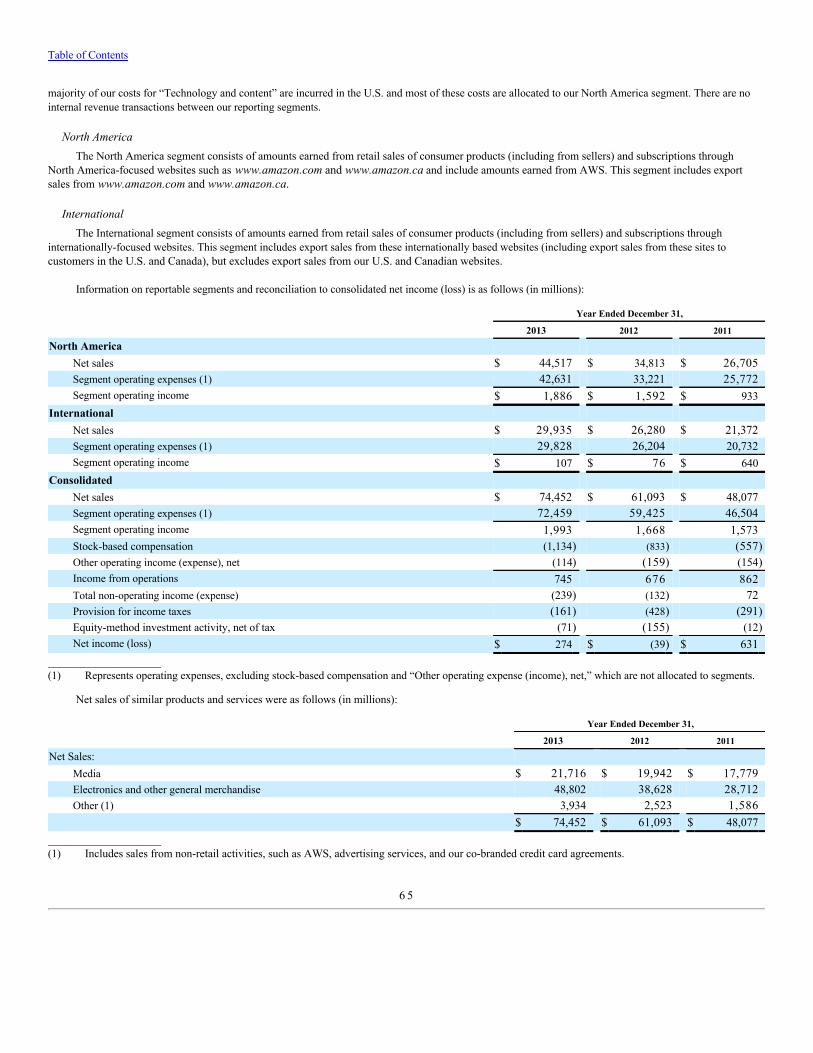
Table of Contents
majority of our costs for “Technology and content” are incurred in the U.S. and most of these costs are allocated to our North America segment. There are nointernal revenue transactions between our reporting segments.
North AmericaThe North America segment consists of amounts earned from retail sales of consumer products (including from sellers) and subscriptions through
North America-focused websites such as www.amazon.com and www.amazon.ca and include amounts earned from AWS. This segment includes exportsales from www.amazon.com and www.amazon.ca.
InternationalThe International segment consists of amounts earned from retail sales of consumer products (including from sellers) and subscriptions through
internationally-focused websites. This segment includes export sales from these internationally based websites (including export sales from these sites tocustomers in the U.S. and Canada), but excludes export sales from our U.S. and Canadian websites.
Information on reportable segments and reconciliation to consolidated net income (loss) is as follows (in millions):
Year Ended December 31,
2013 2012 2011
North America Net sales $ 44,517 $ 34,813 $ 26,705Segment operating expenses (1) 42,631 33,221 25,772Segment operating income $ 1,886 $ 1,592 $ 933
International Net sales $ 29,935 $ 26,280 $ 21,372Segment operating expenses (1) 29,828 26,204 20,732Segment operating income $ 107 $ 76 $ 640
Consolidated Net sales $ 74,452 $ 61,093 $ 48,077Segment operating expenses (1) 72,459 59,425 46,504Segment operating income 1,993 1,668 1,573Stock-based compensation (1,134) (833) (557)Other operating income (expense), net (114) (159) (154)Income from operations 745 676 862Total non-operating income (expense) (239) (132) 72Provision for income taxes (161) (428) (291)Equity-method investment activity, net of tax (71) (155) (12)Net income (loss) $ 274 $ (39) $ 631
___________________(1) Represents operating expenses, excluding stock-based compensation and “Other operating expense (income), net,” which are not allocated to segments.
Net sales of similar products and services were as follows (in millions):
Year Ended December 31,
2013 2012 2011
Net Sales: Media $ 21,716 $ 19,942 $ 17,779Electronics and other general merchandise 48,802 38,628 28,712Other (1) 3,934 2,523 1,586
$ 74,452 $ 61,093 $ 48,077___________________(1) Includes sales from non-retail activities, such as AWS, advertising services, and our co-branded credit card agreements.
6 5
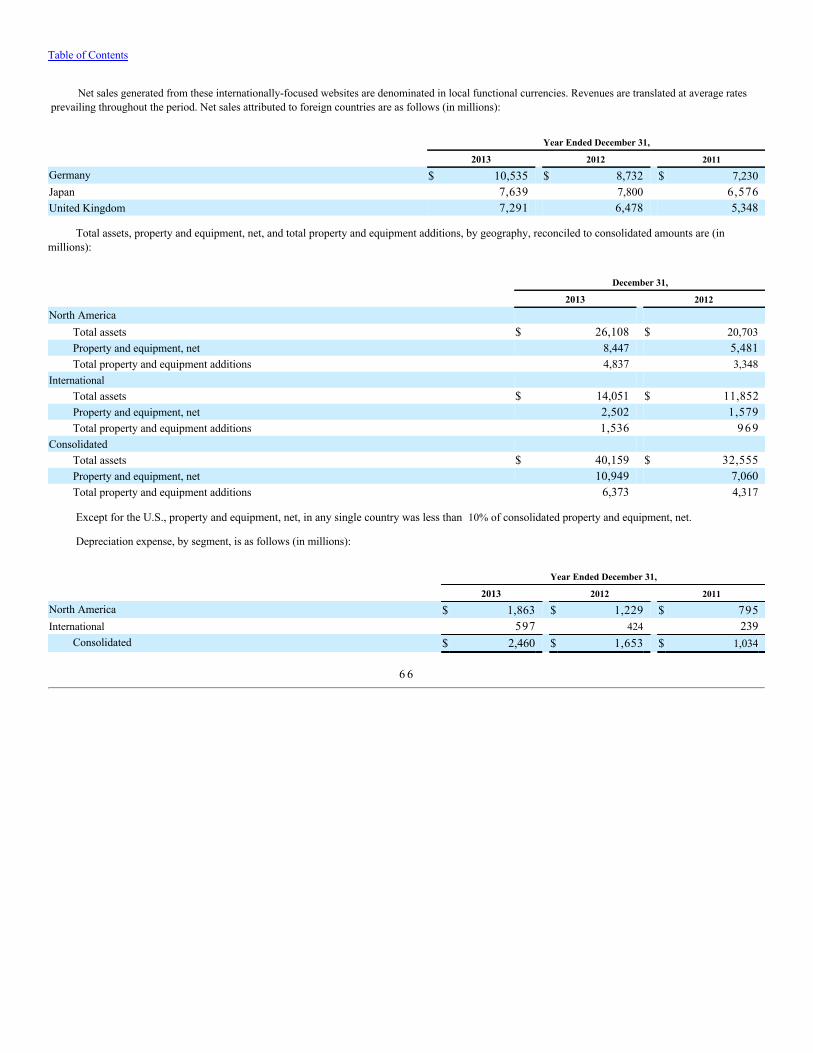
Table of Contents
Net sales generated from these internationally-focused websites are denominated in local functional currencies. Revenues are translated at average ratesprevailing throughout the period. Net sales attributed to foreign countries are as follows (in millions):
Year Ended December 31,
2013 2012 2011
Germany $ 10,535 $ 8,732 $ 7,230Japan 7,639 7,800 6,576United Kingdom 7,291 6,478 5,348
Total assets, property and equipment, net, and total property and equipment additions, by geography, reconciled to consolidated amounts are (inmillions):
December 31,
2013 2012
North America Total assets $ 26,108 $ 20,703Property and equipment, net 8,447 5,481Total property and equipment additions 4,837 3,348
International Total assets $ 14,051 $ 11,852Property and equipment, net 2,502 1,579Total property and equipment additions 1,536 9 6 9
Consolidated Total assets $ 40,159 $ 32,555Property and equipment, net 10,949 7,060Total property and equipment additions 6,373 4,317
Except for the U.S., property and equipment, net, in any single country was less than 10% of consolidated property and equipment, net.
Depreciation expense, by segment, is as follows (in millions):
Year Ended December 31,
2013 2012 2011
North America $ 1,863 $ 1,229 $ 795International 597 424 239
Consolidated $ 2,460 $ 1,653 $ 1,034
6 6
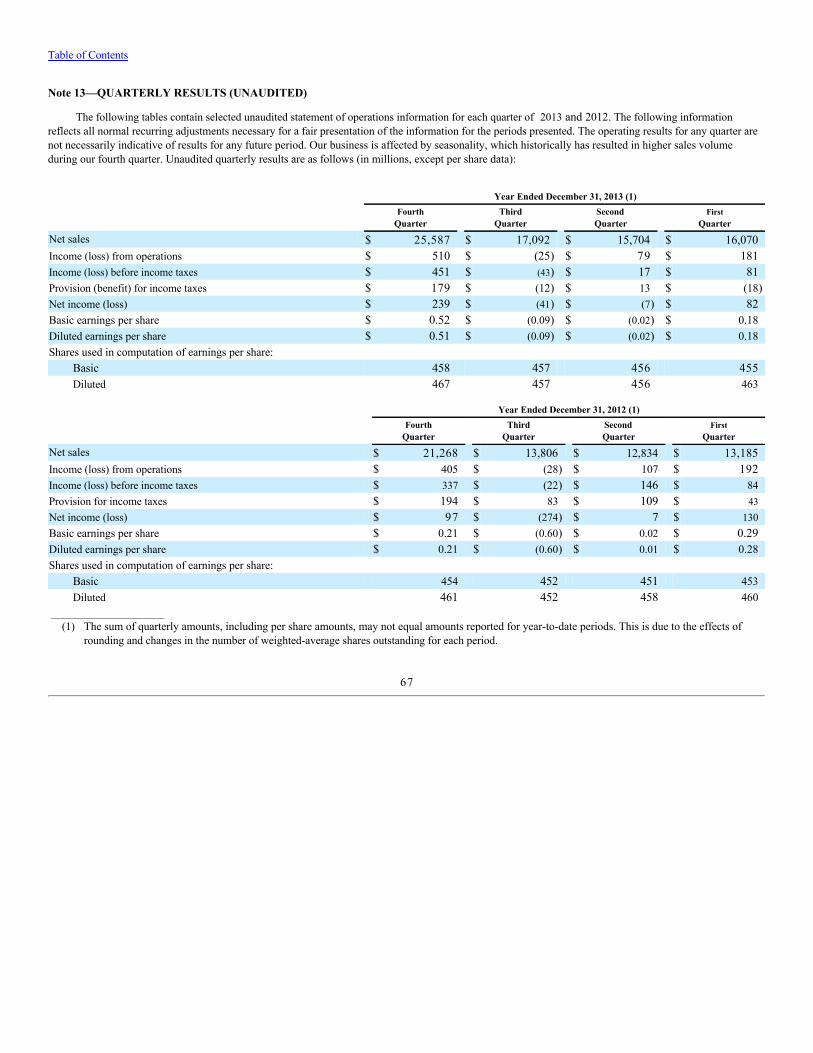
Table of Contents
Note 13—QUARTERLY RESULTS (UNAUDITED)
The following tables contain selected unaudited statement of operations information for each quarter of 2013 and 2012. The following informationreflects all normal recurring adjustments necessary for a fair presentation of the information for the periods presented. The operating results for any quarter arenot necessarily indicative of results for any future period. Our business is affected by seasonality, which historically has resulted in higher sales volumeduring our fourth quarter. Unaudited quarterly results are as follows (in millions, except per share data):
Year Ended December 31, 2013 (1)
Fourth
Quarter Third
Quarter SecondQuarter
FirstQuarter
Net sales $ 25,587 $ 17,092 $ 15,704 $ 16,070Income (loss) from operations $ 510 $ (25) $ 79 $ 181Income (loss) before income taxes $ 451 $ (43) $ 17 $ 81Provision (benefit) for income taxes $ 179 $ (12) $ 13 $ (18)Net income (loss) $ 239 $ (41) $ (7) $ 82Basic earnings per share $ 0.52 $ (0.09) $ (0.02) $ 0.18Diluted earnings per share $ 0.51 $ (0.09) $ (0.02) $ 0.18Shares used in computation of earnings per share:
Basic 458 457 456 455Diluted 467 457 456 463
Year Ended December 31, 2012 (1)
Fourth
Quarter Third
Quarter SecondQuarter
FirstQuarter
Net sales $ 21,268 $ 13,806 $ 12,834 $ 13,185Income (loss) from operations $ 405 $ (28) $ 107 $ 192Income (loss) before income taxes $ 337 $ (22) $ 146 $ 84Provision for income taxes $ 194 $ 83 $ 109 $ 43Net income (loss) $ 97 $ (274) $ 7 $ 130Basic earnings per share $ 0.21 $ (0.60) $ 0.02 $ 0.29Diluted earnings per share $ 0.21 $ (0.60) $ 0.01 $ 0.28Shares used in computation of earnings per share:
Basic 454 452 451 453Diluted 461 452 458 460
___________________(1) The sum of quarterly amounts, including per share amounts, may not equal amounts reported for year-to-date periods. This is due to the effects of
rounding and changes in the number of weighted-average shares outstanding for each period.
67
Table of Contents
Item 9. Changes in and Disagreements with Accountants On Accounting and Financial Disclosure
None.
Item 9A. Controls and ProceduresEvaluation of Disclosure Controls and Procedures
We carried out an evaluation required by the Securities Exchange Act of 1934 (the “1934 Act”), under the supervision and with the participation of ourprincipal executive officer and principal financial officer, of the effectiveness of the design and operation of our disclosure controls and procedures, as definedin Rule 13a-15(e) of the 1934 Act, as of December 31, 2013. Based on this evaluation, our principal executive officer and principal financial officer concludedthat, as of December 31, 2013, our disclosure controls and procedures were effective to provide reasonable assurance that information required to be disclosedby us in the reports that we file or submit under the 1934 Act is recorded, processed, summarized, and reported within the time periods specified in the SEC’srules and forms and to provide reasonable assurance that such information is accumulated and communicated to our management, including our principalexecutive officer and principal financial officer, as appropriate to allow timely decisions regarding required disclosure.
Management’s Report on Internal Control over Financial ReportingManagement is responsible for establishing and maintaining adequate internal control over financial reporting, as defined in Rule 13a-15(f) of the 1934
Act. Management has assessed the effectiveness of our internal control over financial reporting as of December 31, 2013 based on criteria established inInternal Control-Integrated Framework (1992) issued by the Committee of Sponsoring Organizations of the Treadway Commission. As a result of thisassessment, management concluded that, as of December 31, 2013, our internal control over financial reporting was effective in providing reasonableassurance regarding the reliability of financial reporting and the preparation of financial statements for external purposes in accordance with generally acceptedaccounting principles. Ernst & Young has independently assessed the effectiveness of our internal control over financial reporting and its report is includedbelow.
Changes in Internal Control Over Financial ReportingThere were no changes in our internal control over financial reporting during the quarter ended December 31, 2013 that materially affected, or are
reasonably likely to materially affect, our internal control over financial reporting.
Limitations on ControlsOur disclosure controls and procedures and internal control over financial reporting are designed to provide reasonable assurance of achieving their
objectives as specified above. Management does not expect, however, that our disclosure controls and procedures or our internal control over financial reportingwill prevent or detect all error and fraud. Any control system, no matter how well designed and operated, is based upon certain assumptions and can provideonly reasonable, not absolute, assurance that its objectives will be met. Further, no evaluation of controls can provide absolute assurance that misstatementsdue to error or fraud will not occur or that all control issues and instances of fraud, if any, within the Company have been detected.
68
Table of Contents
Report of Independent Registered Public Accounting Firm
The Board of Directors and ShareholdersAmazon.com, Inc.
We have audited Amazon.com, Inc.’s internal control over financial reporting as of December 31, 2013, based on criteria established in Internal Control—Integrated Framework issued by the Committee of Sponsoring Organizations of the Treadway Commission (1992 framework) (the COSO criteria).Amazon.com, Inc.’s management is responsible for maintaining effective internal control over financial reporting, and for its assessment of the effectiveness ofinternal control over financial reporting included in the accompanying Management’s Report on Internal Control over Financial Reporting. Our responsibility isto express an opinion on the Company’s internal control over financial reporting based on our audit.
We conducted our audit in accordance with the standards of the Public Company Accounting Oversight Board (United States). Those standards requirethat we plan and perform the audit to obtain reasonable assurance about whether effective internal control over financial reporting was maintained in allmaterial respects. Our audit included obtaining an understanding of internal control over financial reporting, assessing the risk that a material weaknessexists, testing and evaluating the design and operating effectiveness of internal control based on the assessed risk, and performing such other procedures as weconsidered necessary in the circumstances. We believe that our audit provides a reasonable basis for our opinion.
A company’s internal control over financial reporting is a process designed to provide reasonable assurance regarding the reliability of financial reportingand the preparation of financial statements for external purposes in accordance with generally accepted accounting principles. A company’s internal controlover financial reporting includes those policies and procedures that (1) pertain to the maintenance of records that, in reasonable detail, accurately and fairlyreflect the transactions and dispositions of the assets of the company; (2) provide reasonable assurance that transactions are recorded as necessary to permitpreparation of financial statements in accordance with generally accepted accounting principles, and that receipts and expenditures of the company are beingmade only in accordance with authorizations of management and directors of the company; and (3) provide reasonable assurance regarding prevention ortimely detection of unauthorized acquisition, use, or disposition of the company’s assets that could have a material effect on the financial statements.
Because of its inherent limitations, internal control over financial reporting may not prevent or detect misstatements. Also, projections of any evaluationof effectiveness to future periods are subject to the risk that controls may become inadequate because of changes in conditions, or that the degree of compliancewith the policies or procedures may deteriorate.
In our opinion, Amazon.com, Inc. maintained, in all material respects, effective internal control over financial reporting as of December 31, 2013, basedon the COSO criteria.
We also have audited, in accordance with the standards of the Public Company Accounting Oversight Board (United States), the consolidated balancesheets of Amazon.com, Inc. as of December 31, 2013 and 2012, and the related consolidated statements of operations, comprehensive income, stockholders’equity, and cash flows for each of the three years in the period ended December 31, 2013 of Amazon.com, Inc. and our report dated January 30, 2014expressed an unqualified opinion thereon.
/s/ Ernst & Young LLP
Seattle, WashingtonJanuary 30, 2014
6 9
Table of Contents
Item 9B. Other InformationNone.
PART III
Item 10. Directors, Executive Officers, and Corporate GovernanceInformation regarding our Executive Officers required by Item 10 of Part III is set forth in Item 1 of Part I “Business—Executive Officers and Directors.”
Information required by Item 10 of Part III regarding our Directors and any material changes to the process by which security holders may recommendnominees to the Board of Directors is included in our Proxy Statement relating to our 2014 Annual Meeting of Shareholders, and is incorporated herein byreference. Information relating to our Code of Business Conduct and Ethics and to compliance with Section 16(a) of the 1934 Act is set forth in our ProxyStatement relating to our 2014 Annual Meeting of Shareholders and is incorporated herein by reference. To the extent permissible under Nasdaq rules, weintend to disclose amendments to our Code of Business Conduct and Ethics, as well as waivers of the provisions thereof, on our investor relations websiteunder the heading “Corporate Governance” at www.amazon.com/ir.
Item 11. Executive CompensationInformation required by Item 11 of Part III is included in our Proxy Statement relating to our 2014 Annual Meeting of Shareholders and is incorporated
herein by reference.
Item 12. Security Ownership of Certain Beneficial Owners and Management and Related Shareholder MattersInformation required by Item 12 of Part III is included in our Proxy Statement relating to our 2014 Annual Meeting of Shareholders and is incorporated
herein by reference.
Item 13. Certain Relationships and Related TransactionsInformation required by Item 13 of Part III is included in our Proxy Statement relating to our 2014 Annual Meeting of Shareholders and is incorporated
herein by reference.
Item 14. Principal Accountant Fees and ServicesInformation required by Item 14 of Part III is included in our Proxy Statement relating our 2014 Annual Meeting of Shareholders and is incorporated
herein by reference.
70
Table of Contents
PART IV Item 15. Exhibits, Financial Statement Schedules
(a) List of Documents Filed as a Part of This Report:(1) Index to Consolidated Financial Statements:
Report of Ernst & Young LLP, Independent Registered Public Accounting Firm
Consolidated Statements of Cash Flows for each of the three years ended December 31, 2013
Consolidated Statements of Operations for each of the three years ended December 31, 2013
Consolidated Statements of Comprehensive Income for each of the three years ended December 31, 2013
Consolidated Balance Sheets as of December 31, 2013 and 2012
Consolidated Statements of Stockholders’ Equity for each of the three years ended December 31, 2013
Notes to Consolidated Financial Statements
Report of Ernst & Young LLP, Independent Registered Public Accounting Firm
(2) Index to Financial Statement Schedules:All schedules have been omitted because the required information is included in the consolidated financial statements or the notes thereto, or
because it is not required.
(3) Index to ExhibitsSee exhibits listed under the Exhibit Index below.
71
Table of Contents
SIGNATURES
Pursuant to the requirements of Section 13 or 15(d) of the Securities Exchange Act of 1934, the registrant has duly caused this Report to be signed on itsbehalf by the undersigned, thereunto duly authorized, as of January 30, 2014.
AMAZON.COM, INC.
By: /s/ Jeffrey P. Bezos Jeffrey P. Bezos
President, Chief Executive Officer,
and Chairman of the Board
Pursuant to the requirements of the Securities Exchange Act of 1934, this Report has been signed below by the following persons on behalf of theregistrant and in the capacities indicated as of January 30, 2014.
Signature Title
/s/ Jeffrey P. Bezos Jeffrey P. Bezos
Chairman of the Board, President, and Chief Executive Officer (Principal ExecutiveOfficer)
/s/ Thomas J. Szkutak Thomas J. Szkutak Senior Vice President and Chief Financial Officer (Principal Financial Officer)
/s/ Shelley Reynolds Shelley Reynolds Vice President, Worldwide Controller (Principal Accounting Officer)
/s/ Tom A. Alberg Tom A. Alberg Director
/s/ John Seely Brown John Seely Brown Director
/s/ William B. Gordon William B. Gordon Director
/s/ Jamie S. Gorelick Jamie S. Gorelick Director
/s/ Alain Monié Alain Monié Director
/s/ Jonathan J. Rubinstein Jonathan J. Rubinstein Director
/s/ Thomas O. Ryder Thomas O. Ryder Director
/s/ Patricia Q. Stonesifer Patricia Q. Stonesifer Director
72
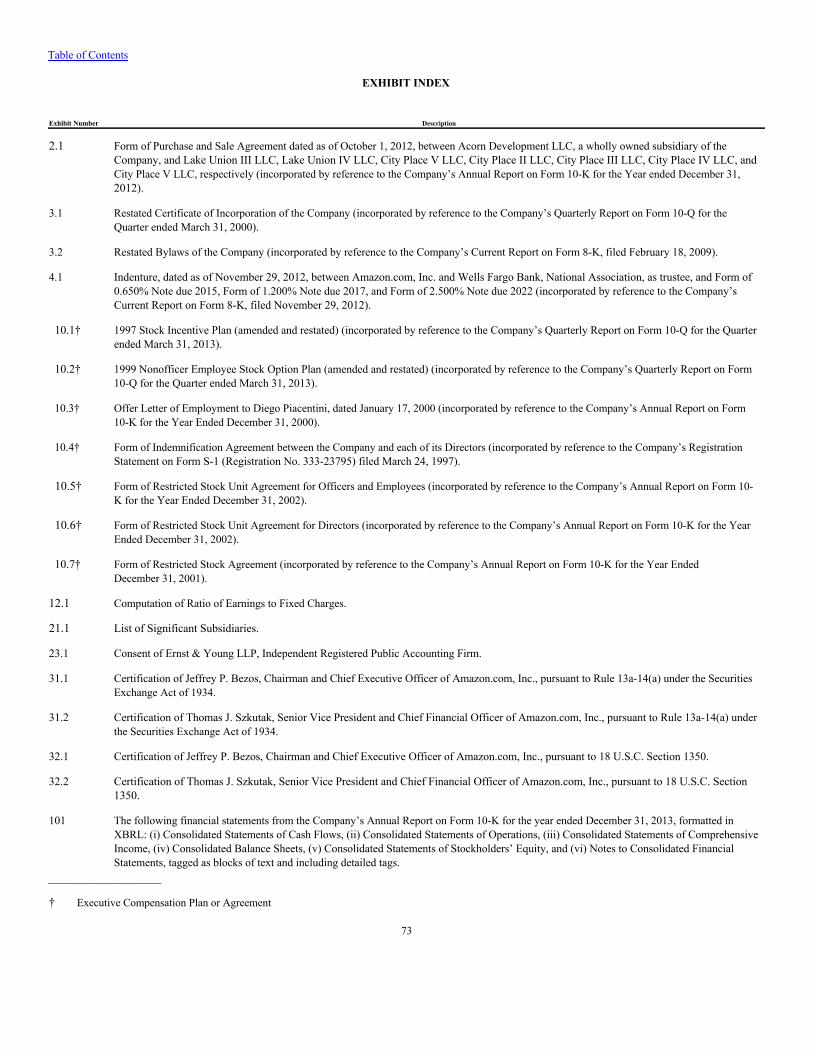
Table of Contents
EXHIBIT INDEX
Exhibit Number Description
2.1
Form of Purchase and Sale Agreement dated as of October 1, 2012, between Acorn Development LLC, a wholly owned subsidiary of theCompany, and Lake Union III LLC, Lake Union IV LLC, City Place V LLC, City Place II LLC, City Place III LLC, City Place IV LLC, andCity Place V LLC, respectively (incorporated by reference to the Company’s Annual Report on Form 10-K for the Year ended December 31,2012).
3.1
Restated Certificate of Incorporation of the Company (incorporated by reference to the Company’s Quarterly Report on Form 10-Q for theQuarter ended March 31, 2000).
3.2 Restated Bylaws of the Company (incorporated by reference to the Company’s Current Report on Form 8-K, filed February 18, 2009). 4.1
Indenture, dated as of November 29, 2012, between Amazon.com, Inc. and Wells Fargo Bank, National Association, as trustee, and Form of0.650% Note due 2015, Form of 1.200% Note due 2017, and Form of 2.500% Note due 2022 (incorporated by reference to the Company’sCurrent Report on Form 8-K, filed November 29, 2012).
10.1†
1997 Stock Incentive Plan (amended and restated) (incorporated by reference to the Company’s Quarterly Report on Form 10-Q for the Quarterended March 31, 2013).
10.2†
1999 Nonofficer Employee Stock Option Plan (amended and restated) (incorporated by reference to the Company’s Quarterly Report on Form10-Q for the Quarter ended March 31, 2013).
10.3†
Offer Letter of Employment to Diego Piacentini, dated January 17, 2000 (incorporated by reference to the Company’s Annual Report on Form10-K for the Year Ended December 31, 2000).
10.4†
Form of Indemnification Agreement between the Company and each of its Directors (incorporated by reference to the Company’s RegistrationStatement on Form S-1 (Registration No. 333-23795) filed March 24, 1997).
10.5†
Form of Restricted Stock Unit Agreement for Officers and Employees (incorporated by reference to the Company’s Annual Report on Form 10-K for the Year Ended December 31, 2002).
10.6†
Form of Restricted Stock Unit Agreement for Directors (incorporated by reference to the Company’s Annual Report on Form 10-K for the YearEnded December 31, 2002).
10.7†
Form of Restricted Stock Agreement (incorporated by reference to the Company’s Annual Report on Form 10-K for the Year EndedDecember 31, 2001).
12.1 Computation of Ratio of Earnings to Fixed Charges. 21.1 List of Significant Subsidiaries. 23.1 Consent of Ernst & Young LLP, Independent Registered Public Accounting Firm. 31.1
Certification of Jeffrey P. Bezos, Chairman and Chief Executive Officer of Amazon.com, Inc., pursuant to Rule 13a-14(a) under the SecuritiesExchange Act of 1934.
31.2
Certification of Thomas J. Szkutak, Senior Vice President and Chief Financial Officer of Amazon.com, Inc., pursuant to Rule 13a-14(a) underthe Securities Exchange Act of 1934.
32.1 Certification of Jeffrey P. Bezos, Chairman and Chief Executive Officer of Amazon.com, Inc., pursuant to 18 U.S.C. Section 1350. 32.2
Certification of Thomas J. Szkutak, Senior Vice President and Chief Financial Officer of Amazon.com, Inc., pursuant to 18 U.S.C. Section1350.
101
The following financial statements from the Company’s Annual Report on Form 10-K for the year ended December 31, 2013, formatted inXBRL: (i) Consolidated Statements of Cash Flows, (ii) Consolidated Statements of Operations, (iii) Consolidated Statements of ComprehensiveIncome, (iv) Consolidated Balance Sheets, (v) Consolidated Statements of Stockholders’ Equity, and (vi) Notes to Consolidated FinancialStatements, tagged as blocks of text and including detailed tags.
___________________
† Executive Compensation Plan or Agreement
73
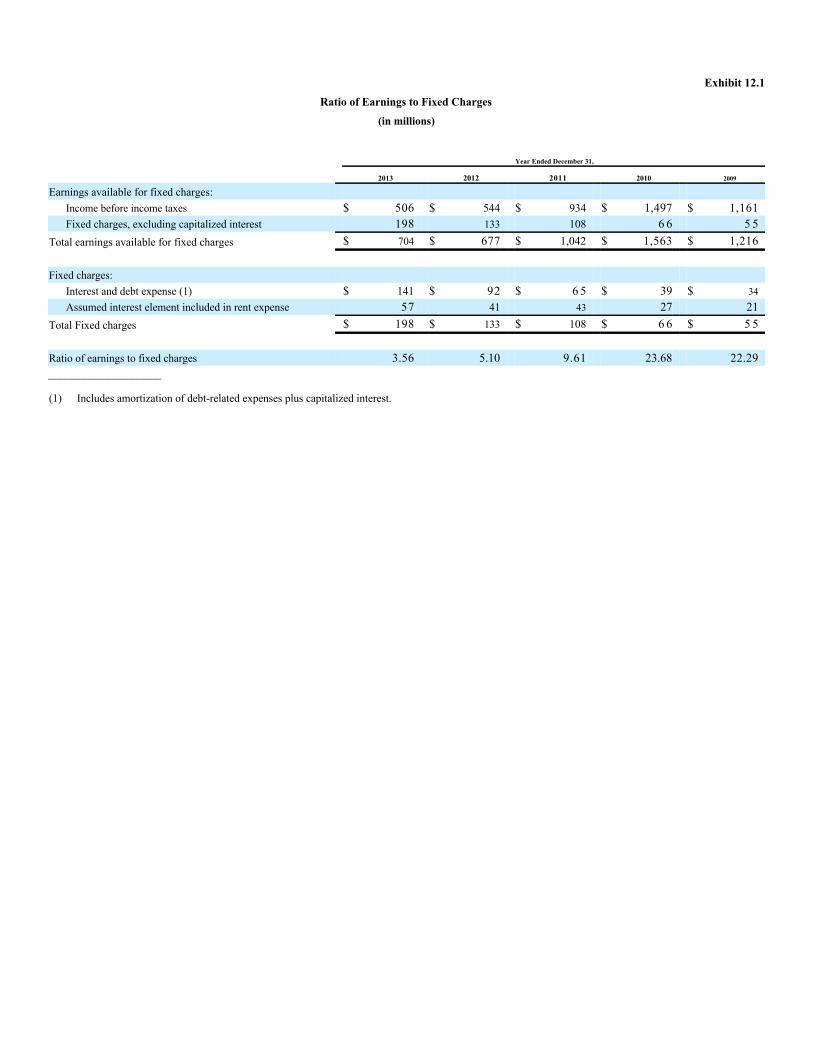
Exhibit 12.1Ratio of Earnings to Fixed Charges
(in millions)
Year Ended December 31,
2013 2012 2011 2010 2009
Earnings available for fixed charges:
Income before income taxes $ 506 $ 544 $ 934 $ 1,497 $ 1,161Fixed charges, excluding capitalized interest 198 133 108 6 6 5 5
Total earnings available for fixed charges $ 704 $ 677 $ 1,042 $ 1,563 $ 1,216
Fixed charges:
Interest and debt expense (1) $ 141 $ 92 $ 6 5 $ 39 $ 34Assumed interest element included in rent expense 57 41 43 27 21
Total Fixed charges $ 198 $ 133 $ 108 $ 6 6 $ 5 5
Ratio of earnings to fixed charges 3.56 5.10 9.61 23.68 22.29___________________
(1) Includes amortization of debt-related expenses plus capitalized interest.
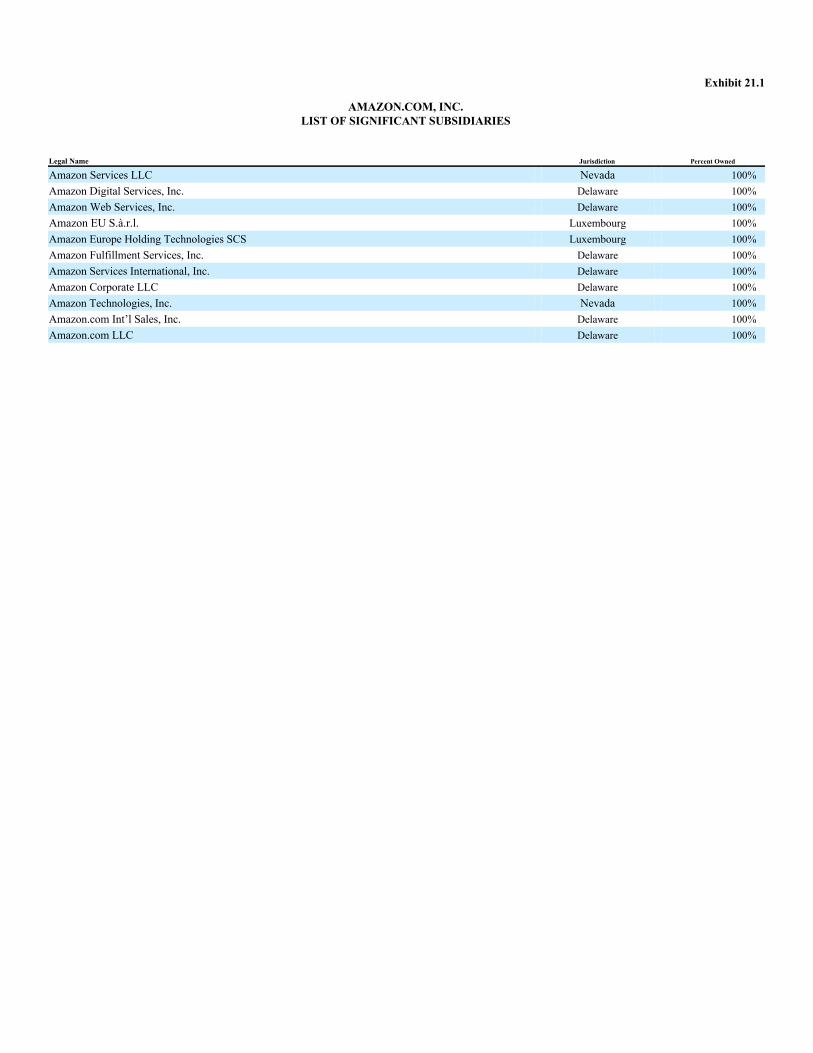
Exhibit 21.1
AMAZON.COM, INC.LIST OF SIGNIFICANT SUBSIDIARIES
Legal Name Jurisdiction Percent Owned
Amazon Services LLC Nevada 100%Amazon Digital Services, Inc. Delaware 100%Amazon Web Services, Inc. Delaware 100%Amazon EU S.à.r.l. Luxembourg 100%Amazon Europe Holding Technologies SCS Luxembourg 100%Amazon Fulfillment Services, Inc. Delaware 100%Amazon Services International, Inc. Delaware 100%Amazon Corporate LLC Delaware 100%Amazon Technologies, Inc. Nevada 100%Amazon.com Int’l Sales, Inc. Delaware 100%Amazon.com LLC Delaware 100%
Exhibit 23.1
Consent of Ernst & Young LLP,Independent Registered Public Accounting Firm
We consent to the incorporation by reference in the following Registration Statements:
(a) Registration Statement (Form S-4 No. 333-55943), as amended, pertaining to the acquisition shelf-registration of up to 30 million shares ofcommon stock,
(b) Registration Statement (Form S-8 No. 333-28763), as amended, pertaining to the Amazon.com, Inc. 1997 Stock Incentive Plan (formerly the“1997 Stock Option Plan”) and the Amended and Restated 1994 Stock Option Plan of Amazon.com, Inc.,
(c) Registration Statement (Form S-8 No. 333-88825) pertaining to the Convergence Corporation Stock Option Plan,
(d) Registration Statement (Form S-8 No. 333-80491) pertaining to the Alexa Internet Amended and Restated 1997 Stock Option Plan,
(e) Registration Statement (Form S-8 No. 333-80495) pertaining to the Accept.com Financial Services Corporation 1998 Stock Plan,
(f) Registration Statement (Form S-8 No. 333-78651) pertaining to the Innerlinx Technologies, Incorporated 1997 Stock Option Plan,
(g) Registration Statement (Form S-8 No. 333-78653) pertaining to the e-Niche Incorporated Amended and Restated 1998 Stock Option and GrantPlan,
(h) Registration Statement (Form S-8 No. 333-74419) pertaining to the Amazon.com, Inc. 1999 Nonofficer Employee Stock Option Plan,
(i) Registration Statement (Form S-8 No. 333-63311), as amended, pertaining to the Junglee Corp. 1996 Stock Plan, the Junglee Corp. 1998 EquityIncentive Plan, the Sage Enterprises, Inc. 1997 Amended Stock Option Plan, and the Sage Enterprises, Inc. MVP Stock Option Plan,
(j) Registration Statement (Form S-8 No. 333-118818) pertaining to the Joyo.com Limited 2004 Share Option Plan,
(k) Registration Statement (Form S-8 No. 333-149845) pertaining to the Audible, Inc. 1999 Stock Incentive Plan,
(l) Registration Statement (Form S-4 No. 333-160831), as amended, pertaining to the acquisition of the outstanding capital stock of Zappos.com,Inc.,
(m) Registration Statement (Form S-8 POS No. 333-160831) pertaining to the Zappos.com, Inc. 2009 Stock Plan,
(n) Registration Statement (Form S-8 No. 333-169470) pertaining to 25,000,000 shares of Common Stock, par value $0.01 per share, to be issuedpursuant to the Company’s 1997 Stock Incentive Plan,
(o) Registration Statement (Form S-8 No. 333-173054), pertaining to the Quidsi, Inc. (fka1800Diapers, Inc.) 2006 Stock Option/Stock IssuancePlan,
(p) Registration Statement (Form S-8 No. 333-181073) pertaining to the Kiva Systems, Inc. 2003 Stock Plan, as amended, and
(q) Registration Statement (Form S-3 No. 333-185137) pertaining to the shelf-registration of Amazon.com, Inc. securities
of our reports dated January 30, 2014, with respect to the consolidated financial statements of Amazon.com, Inc. and the effectiveness of internal control overfinancial reporting of Amazon.com, Inc. included in this Annual Report (Form 10-K) of Amazon.com, Inc. for the year ended December 31, 2013.
/s/ Ernst & Young LLP
Seattle, WashingtonJanuary 30, 2014

Exhibit 31.1
CERTIFICATIONS
I, Jeffrey P. Bezos, certify that:
1. I have reviewed this Form 10-K of Amazon.com, Inc.;
2. Based on my knowledge, this report does not contain any untrue statement of a material fact or omit to state a material fact necessary to make thestatements made, in light of the circumstances under which such statements were made, not misleading with respect to the period covered by this report;
3. Based on my knowledge, the financial statements, and other financial information included in this report, fairly present in all material respects thefinancial condition, results of operations and cash flows of the registrant as of, and for, the periods presented in this report;
4. The registrant’s other certifying officer(s) and I are responsible for establishing and maintaining disclosure controls and procedures (as defined inExchange Act Rules 13a-15(e) and 15d-15(e)) and internal control over financial reporting (as defined in Exchange Act Rules 13a-15(f) and 15d-15(f)) for theregistrant and have:
(a) Designed such disclosure controls and procedures, or caused such disclosure controls and procedures to be designed under our supervision, toensure that material information relating to the registrant, including its consolidated subsidiaries, is made known to us by others within those entities,particularly during the period in which this report is being prepared;
(b) Designed such internal control over financial reporting, or caused such internal control over financial reporting to be designed under oursupervision, to provide reasonable assurance regarding the reliability of financial reporting and the preparation of financial statements for externalpurposes in accordance with generally accepted accounting principles;
(c) Evaluated the effectiveness of the registrant’s disclosure controls and procedures and presented in this report our conclusions about theeffectiveness of the disclosure controls and procedures, as of the end of the period covered by this report based on such evaluation; and
(d) Disclosed in this report any change in the registrant’s internal control over financial reporting that occurred during the registrant’s most recentfiscal quarter (the registrant’s fourth fiscal quarter in the case of an annual report) that has materially affected, or is reasonably likely to materiallyaffect, the registrant’s internal control over financial reporting; and
5. The registrant’s other certifying officer(s) and I have disclosed, based on our most recent evaluation of internal control over financial reporting, to theregistrant’s auditors and the audit committee of the registrant’s board of directors (or persons performing the equivalent functions):
(a) All significant deficiencies and material weaknesses in the design or operation of internal control over financial reporting which are reasonablylikely to adversely affect the registrant’s ability to record, process, summarize and report financial information; and
(b) Any fraud, whether or not material, that involves management or other employees who have a significant role in the registrant’s internal controlover financial reporting.
/s/ Jeffrey P. Bezos Jeffrey P. Bezos
Chairman and Chief Executive Officer
(Principal Executive Officer)
Date: January 30, 2014

Exhibit 31.2
CERTIFICATIONS
I, Thomas J. Szkutak, certify that:1. I have reviewed this Form 10-K of Amazon.com, Inc.;
2. Based on my knowledge, this report does not contain any untrue statement of a material fact or omit to state a material fact necessary to make thestatements made, in light of the circumstances under which such statements were made, not misleading with respect to the period covered by this report;
3. Based on my knowledge, the financial statements, and other financial information included in this report, fairly present in all material respects thefinancial condition, results of operations and cash flows of the registrant as of, and for, the periods presented in this report;
4. The registrant’s other certifying officer(s) and I are responsible for establishing and maintaining disclosure controls and procedures (as defined inExchange Act Rules 13a-15(e) and 15d-15(e)) and internal control over financial reporting (as defined in Exchange Act Rules 13a-15(f) and 15d-15(f)) for theregistrant and have:
(a) Designed such disclosure controls and procedures, or caused such disclosure controls and procedures to be designed under our supervision, toensure that material information relating to the registrant, including its consolidated subsidiaries, is made known to us by others within those entities,particularly during the period in which this report is being prepared;
(b) Designed such internal control over financial reporting, or caused such internal control over financial reporting to be designed under oursupervision, to provide reasonable assurance regarding the reliability of financial reporting and the preparation of financial statements for externalpurposes in accordance with generally accepted accounting principles;
(c) Evaluated the effectiveness of the registrant’s disclosure controls and procedures and presented in this report our conclusions about theeffectiveness of the disclosure controls and procedures, as of the end of the period covered by this report based on such evaluation; and
(d) Disclosed in this report any change in the registrant’s internal control over financial reporting that occurred during the registrant’s most recentfiscal quarter (the registrant’s fourth fiscal quarter in the case of an annual report) that has materially affected, or is reasonably likely to materiallyaffect, the registrant’s internal control over financial reporting; and
5. The registrant’s other certifying officer(s) and I have disclosed, based on our most recent evaluation of internal control over financial reporting, to theregistrant’s auditors and the audit committee of the registrant’s board of directors (or persons performing the equivalent functions):
(a) All significant deficiencies and material weaknesses in the design or operation of internal control over financial reporting which are reasonablylikely to adversely affect the registrant’s ability to record, process, summarize and report financial information; and
(b) Any fraud, whether or not material, that involves management or other employees who have a significant role in the registrant’s internal controlover financial reporting.
/s/ Thomas J. Szkutak Thomas J. Szkutak
Senior Vice President andChief Financial Officer
(Principal Financial Officer)
Date: January 30, 2014
Exhibit 32.1
Certification Pursuant to 18 U.S.C. Section 1350
In connection with the Annual Report of Amazon.com, Inc. (the “Company”) on Form 10-K for the year ended December 31, 2013, as filed with theSecurities and Exchange Commission (the “SEC”) on or about the date hereof (the “Report”), I, Jeffrey P. Bezos, Chairman and Chief Executive Officer of theCompany, certify, pursuant to 18 U.S.C. Section 1350, as adopted pursuant to Section 906 of the Sarbanes-Oxley Act of 2002, that:
(1) The Report fully complies with the requirements of Section 13(a) or 15(d) of the Securities Exchange Act of 1934; and
(2) The information contained in the Report fairly presents, in all material respects, the financial condition and results of operations of theCompany.
A signed original of this written statement has been provided to the Company and will be retained by the Company and furnished to the SEC or its staffupon request.
/s/ Jeffrey P. Bezos Jeffrey P. Bezos Chairman and Chief Executive Officer (Principal Executive Officer)
Date: January 30, 2014
Exhibit 32.2
Certification Pursuant to 18 U.S.C. Section 1350
In connection with the Annual Report of Amazon.com, Inc. (the “Company”) on Form 10-K for the year ended December 31, 2013 as filed with theSecurities and Exchange Commission (the “SEC”) on or about the date hereof (the “Report”), I, Thomas J. Szkutak, Senior Vice President and ChiefFinancial Officer of the Company, certify, pursuant to 18 U.S.C. Section 1350, as adopted pursuant to Section 906 of the Sarbanes-Oxley Act of 2002, that:
(1) The Report fully complies with the requirements of Section 13(a) or 15(d) of the Securities Exchange Act of 1934; and
(2) The information contained in the Report fairly presents, in all material respects, the financial condition and results of operations of theCompany.
A signed original of this written statement has been provided to the Company and will be retained by the Company and furnished to the SEC or its staffupon request.
/s/ Thomas J. Szkutak Thomas J. Szkutak
Senior Vice President and
Chief Financial Officer (Principal Financial Officer)
Date: January 30, 2014