Embed Size (px)
Citation preview

AmIslamic Master
30 September 2017
AmIttikalAmBon IslamAmAl-AminAmIslamic BalancedAmIslamic GrowthAmOasis Global Islamic Equity
Annual Reportfor Islamic Funds

AmInvest Islamic Master
TRUST DIRECTORY
Manager
AmFunds Management Berhad 9th & 10th Floor, Bangunan AmBank Group
55, Jalan Raja Chulan 50200 Kuala Lumpur
Board of Directors Raja Teh Maimunah Raja Abdul Aziz
Mustafa Mohd Nor Tai Terk Lin
Goh Wee Peng Sum Leng Kuang
Investment Committee Sum Leng Kuang
Tai Terk Lin Mustafa Mohd Nor
Zainal Abidin Mohd Kassim
Shariah Adviser Amanie Advisors Sdn Bhd
Investment Manager AmIslamic Funds Management Sdn Bhd
Trustee AmanahRaya Trustees Berhad
Auditors and Reporting Accountants Ernst &Young
Taxation Adviser Deloitte Tax Services Sdn Bhd

AmInvest Islamic Master
CONTENTS AmIttikal AmIslamic Balanced
1 Manager’s Report 114 Manager’s Report
10 Independent Auditor’s Report to the Unitholders
124 Independent Auditor’s Report to the Unitholders
13 Statement of Financial Position 127 Statement of Financial Position 14 Statement of Comprehensive Income 128 Statement of Comprehensive Income 15 Statement of Changes in Equity 129 Statement of Changes in Equity 16 Statement of Cash Flows 130 Statement of Cash Flows 17 Notes to the Financial Statements 131 Notes to the Financial Statements 36 Statement by the Manager 154 Statement by the Manager 37 Trustee’s Report 155 Trustee’s Report
AmBon Islam AmIslamic Growth 38 Manager’s Report 156 Manager’s Report 45 Independent Auditor’s Report to the
Unitholders 165 Independent Auditor’s Report to the
Unitholders 48 Statement of Financial Position 168 Statement of Financial Position 49 Statement of Comprehensive Income 169 Statement of Comprehensive Income 50 Statement of Changes in Equity 170 Statement of Changes in Equity 51 Statement of Cash Flows 171 Statement of Cash Flows 52 Notes to the Financial Statements 172 Notes to the Financial Statements 73 Statement by the Manager 191 Statement by the Manager 74 Trustee’s Report 192 Trustee’s Report
AmAl-Amin AmOasis Global Islamic Equity
75 Manager’s Report 193 Manager’s Report 83 Independent Auditor’s Report to the
Unitholders 201 Independent Auditor’s Report to the
Unitholders 86 Statement of Financial Position 204 Statement of Financial Position 87 Statement of Comprehensive Income 205 Statement of Comprehensive Income 89 Statement of Changes in Equity 207 Statement of Changes in Equity 90 Statement of Cash Flows 208 Statement of Cash Flows 91 Notes to the Financial Statements 209 Notes to the Financial Statements 112 Statement by the Manager 227 Statement by the Manager 113 Trustee’s Report 228 Trustee’s Report 229 Report of the Shariah Adviser to
Unitholders 230 Directory

1
MANAGER’S REPORT Dear Unitholders, We are pleased to present you the Manager’s report and the audited accounts of AmIttikal (“Fund”) for the financial year ended 30 September 2017. Salient Information of the Fund Name AmIttikal (“Fund”)
Category/Type
Equity (Islamic) / Income and to a lesser extent growth.
Objective Amlttikal is designed as a medium to long-term investment with an objective of producing “halal” income* and to a lesser extent capital growth. Note: *The income could be in the form of units or cash.
Duration The Fund was established on 12 January 1993 and shall exist for as long as it appears to the Manager and the Trustee that it is in the interests of the unitholders for it to continue. In some circumstances, the unitholders can resolve at a meeting to terminate AmIttikal.
Performance Benchmark
Malayan Banking Berhad 12-month Islamic General Investment Account plus 3% spread. (obtainable from: www.maybank2u.com.my) Note: The benchmark does not imply that the risk profile of the Fund is the same as the risk profile of the benchmark. Investors of the Fund will assume a higher risk compared to the benchmark. Hence, the returns of the Fund may be potentially higher due to the higher risk faced by the investors.
Income Distribution Policy
Income distribution (if any) is paid at least once every year.
Breakdown of Unit Holdings by Size
For the financial year under review, the size of the Fund stood at 238,025,628 units. Size of holding As at 30 September 2017 As at 30 September 2016
No of units held
Number of unitholders
No of units held
Number of unitholders
5,000 and below 2,783,942 898 5,207,996 1,823 5,001-10,000 5,499,391 742 1,1042,461 1,492 10,001-50,000 31,609,470 1,471 76,447,103 3,389 50,001-500,000 29,822,599 299 100,319,601 955 500,001 and above 168,310,226 11 108,970,396 31

2
Fund Performance Data Portfolio Composition
Details of portfolio composition of the Fund for the financial years as at 30 September are as follows: FY
2017 %
FY 2016 %
FY 2015 %
Construction 12.27 13.06 9.37 Consumer products 1.26 2.26 - Finance 4.26 4.20 3.53 Industrial products 12.54 8.53 18.13 Infrastructure 5.40 7.91 5.98 Plantation 4.19 5.49 7.09 Properties 2.64 6.26 1.28 Technology 2.70 2.16 - Trading/Services 32.70 30.01 43.34 Cash and others 22.04 20.12 11.28 Total 100.00 100.00 100.00
Note: The abovementioned percentages are calculated based on total net asset value.
Performance Details
Performance details of the Fund for the financial years ended 30 September are as follows: FY
2017 FY
2016 FY
2015 Net asset value (RM)* 151,309,309 192,201,158 222,717,078 Units in circulation* 238,025,628 301,987,557 345,696,067 Net asset value per unit (RM)* 0.6357 0.6365 0.6443 Highest net asset value per unit
(RM)* 0.6767
0.6758 0.7234 Lowest net asset value per unit
(RM)* 0.6193
0.6190 0.6008 Benchmark performance (%) 6.42 6.93 6.48 Total return (%)(1) 4.07 5.01 -5.04 - Capital growth (%) -0.12 -1.20 -9.27 - Income distribution (%) 4.19 6.21 4.23 Gross distribution (sen per unit) 2.67 4.00 3.00 Net distribution (sen per unit) 2.67 4.00 3.00 Management expense ratio
(%)(2) 1.65
1.51 2.05 Portfolio turnover ratio
(times)(3) 1.09
1.21 0.69
* Above prices and net asset value per unit are shown as ex-distribution. Note: (1) Total return is the actual return of the Fund for the respective financial
years computed based on the net asset value per unit and net of all fees.

3
(2) Management expense ratio (“MER”) is calculated based on the total fees and expenses incurred by the Fund divided by the average fund size calculated on a daily basis. The MER increased by 0.14% as compared to 1.51% per annum for the financial year ended 30 September 2016 mainly due to decrease in average fund size.
(3) Portfolio turnover ratio (“PTR”) is calculated based on the average of the total acquisitions and total disposals of investment securities of the Fund divided by the average fund size calculated on a daily basis. The PTR decreased by 0.12 times (9.9%) as compared to 1.21 times for the financial year ended 30 September 2016 mainly due to decrease in investing activities.
Average Total Return (as at 30 September 2017)
AmIttikal(a) %
MBB(b) %
One year 4.07 6.42 Three years 1.24 6.60 Five years 5.39 6.44 Ten years 5.22 6.26
Annual Total Return
Financial Years Ended (30 September)
AmIttikal(a) %
MBB(b) %
2017 4.07 6.42 2016 5.01 6.93 2015 -5.04 6.48 2014 10.71 6.22 2013 13.15 6.18
(a) Source: Novagni Analytics and Advisory Sdn Bhd. (b) Malayan Banking Berhad 12-months Islamic General Investment Accounts
plus 3% Spread (“MBB”) (Obtainable from: www.maybank2u.com.my). The Fund performance is calculated based on the net asset value per unit of the Fund. Average total return of the Fund and its benchmark for a period is computed based on the absolute return for that period annualised over one year. Note: Past performance is not necessarily indicative of future performance and that unit prices and investment returns may go down, as well as up.
Fund Performance
For the financial year ending 30 September 2017, the NAV per unit of the Fund decreased by 0.13% from RM0.6365 to RM0.6357, while units in circulation decreased by 21.18% from 301,987,557 units as at 30 September 2016 to 238,025,628 units as at 30 September 2017. The Fund registered a return of 4.07% for the financial year ended 30 September 2017, comprising of negative 0.12% capital and 4.19% income distribution. Comparatively, for the same period, the benchmark, Malayan Banking Berhad twelve (12) months Islamic General Investment Accounts plus 3% spread registered a return of 6.42%. As such the Fund underperformed the benchmark by 2.35%.

4
The line chart below shows comparison between the annual performance of AmIttikal and its benchmark, MBB, for the financial years ended 30 September.
Note: Past performance is not necessarily indicative of future performance and that unit prices and investment returns may go down, as well as up.
Has the Fund achieved its objective?
The Fund has achieved its objective over the medium to long term investment time frame in producing “halal” income* and to a lesser extent capital growth. For the year under review, the Fund has declared a dividend of 2.67 sen per unit translating to income distribution of 4.19%, meeting the objective of the Fund to meet halal income distribution. However, telecommunication and plantation sectors were a drag to the Fund’s performance, causing it to underperformed the benchmark.
Strategies and Policies Employed
For the financial year under review, the Fund’s strategy was to invest mainly in big cap stocks that were backed with strong balance sheets, cash flow and consistent dividend payments. The Fund also had high exposure in big cap stocks. While the blue chips anchored the portfolio, a smaller exposure to small to medium cap stocks with high earnings visibility but more cyclical in nature helped to contribute to the capital growth of the Fund.

5
Portfolio Structure
This table below is the asset allocation of the Fund for the financial years under review. As at
30-9-2017 %
As at 30-9-2016
%
Changes
% Construction 12.27 13.06 -0.79 Consumer products 1.26 2.26 -1.00 Finance 4.26 4.20 0.06 Industrial products 12.54 8.53 4.01 Infrastructure 5.40 7.91 -2.51 Plantation 4.19 5.49 -1.30 Properties 2.64 6.26 -3.62 Technology 2.70 2.16 0.54 Trading/Services 32.70 30.01 2.69 Cash and others 22.04 20.12 1.92 Total 100.00 100.00
The Fund’s equity exposure for the financial year under review was 77.96% as compared to 79.88% as at 30 September 2016 mainly to realize profits. The big changes were in the Industrial Products, Properties and Trading/Services sectors. The Industrial Products sector saw the most increase in weight of 4% as the Fund was increasingly optimistic on the global economy on the back of positive GDP growth from US and turnaround in China. The Fund took profits from Top Glove and VS Industry but plough the money back into Heveaboard, Petron and Wellcall. Meanwhile, the exposure in the properties sector came down by 3.6% due to profit takings on Eastern Oriental, SP Setia, Sunway and UOA Development. The Trading/Services exposure increased by 2.7% as the fund added Bermaz Auto, Dialog Group, MyEg, Pos and Uzma while zerorising Tiong Nam Logistic.
Distribution/ Unit splits
During the financial year under review, the Fund declared income distributions, detailed as follows: 2.67 sen per unit income distribution
Change in the unit price prior and
subsequent to the income distribution
Before income distribution on
29 September 2017 (RM)
After income distribution on
29 September 2017 (RM)
Net asset value per unit 0.6624 0.6357 There was no unit split declared for the financial year under review.
State of Affairs
There has been neither significant changes to the state of affairs of the Fund nor any circumstances that materially affect any interests of the unitholders during the financial year under review.
Rebates and Soft Commission
It is our policy to pay all rebates to the Fund. Soft commission received from brokers/dealers are retained by the Manager only if the goods and services provided are of demonstrable benefit to unitholders of the Fund. During the financial year under review, the Manager had received on behalf of the Fund, soft commissions in the form of fundamental database, financial wire

6
services, technical analysis software and stock quotation system incidental to investment management of the Fund. These soft commissions received by the Manager are deem to be beneficial to the unitholders of the Fund.
Market Review
The market started the period under review on a positive note. The Government announced its Budget 2017 with Gross Domestic Product (“GDP”) growth is forecasted to be within 4%-5%. 2017 Budget includes plans to set up small to mid-cap research Public Listed Companies (“PLC”) and allocation of a special fund of up to RM3bn to fund managers to invest in small to mid-cap PLC. The ringgit ended higher against the US dollar following the tabling of Budget 2017 which lifted foreign investors' confidence, thus creating a better demand for the local currency. In November 2016, market underwent heavy selling pressure due to surge in US Treasury yields and the measure of its full impact to emerging markets currencies. This was on the back of the outcomes of the recent US presidential election. The Ringgit weakened 6% and 10Y MGS yield spiked up to 4.35% on fears of Fed rate hike. The external negative sentiments outweigh better than expected 3Q2016 GDP numbers of 4.3%. Malaysia's economy grew 4.3 per cent in the third quarter from year-ago levels, accelerating after five straight quarters of decline. The growth was stronger than the median forecast of 4.1 per cent and better than the 4.0 per cent growth posted in the second quarter. Sentiment recovered in December 2016, following Organization of the Petroleum Exporting Countries (“OPEC”) agreeing to reduce production by c1.2 million barrels per day (“mbd”) bringing its output ceiling to 32.5mbd. The duration of the cut is 6 months effective 1 Jan 2017, with a possibility to extend for another 6 months, sending oil prices from the level of USD50/barrel to almost USD54/barrel at the peak in the month of December. BNM introduced six measures to enhance the liquidity and depth of the onshore market effective 5 Dec. But, in the month, we still saw the ringgit weakening against the USD moving from RM4.45/USD to RM4.49/USD as foreigners kept selling out of the Malaysian bond and equity market. It also did not help that the 3Q16 results performance came in weaker than expected. We saw negative revisions to earnings but believe that the pace of downward revisions has slowed. The Federal Reserve increased its key interest rate by 0.25% on 14 Dec 2016 which led to the weakening of all EM currencies including the ringgit. But, as we approached the end of the year, we saw some window dressing activities taking place. Year 2017 started on a positive note, spurred by foreign inflow on the back of an improving ringgit from 4.48RM/USD to 4.43RM/USD, and stabilizing oil prices at USD50-55/bbl. The market was also be boosted by some repositioning and reallocation of funds at the start of the year. Improving sentiment on local banks, and M&A news flow on major GLCs such as Sime Darby and UMW further boosted the buoyant mood on local equities. Apart from that, deferment of punitive regulations (i.e. levy for foreign workers) until 2018 helped to recover investor confidence on less downside risk to future earnings.

7
The month of February 2017 started off with another round of rallies in equities, supported by further net foreign inflows of c. RM1 bil (YTD 2017:RM1.5 bil), with oil prices hovering within the USD52-55/bbl band and ringgit averaging 4.44RM/USD. We saw trading interest on all fronts i.e. big to small cap stocks. The index peaked above 1700 towards the end of February, but ended the month slightly lower at 1694 on profit taking. Post the February result season (for 4Q 2016 results), data shows that 21% of companies recorded results above our expectations - the best quarter so far in the past one year. MSCI Malaysia 2017 earnings were revised lower by -0.1% mom in February. However more significantly, it shows a bottoming of 2017 earnings expectation as this was the lowest negative revision since January 2016. Most upgrades came from Materials, Energy and Consumers sectors, whilst downgrades were from Real Estate, Telco and Utilities. In March 2017, the global and regional equity markets continued their rallies. For the local bourse, trading interest shifted to mid and small-cap stocks and on property and technology stocks. Highlight of the month was the announcement of the Digital Free Trade Zone by the PM during Jack Ma’s visit in KL. Maybank and CIMB also announced partnership with Ant Financial Services Group to enable the Alipay mobile wallet in Malaysia. Furthermore, Malaysian Digital Economy Corp announced that Multimedia Super Corridor companies have recorded new investments of RM16.3 bil in 2016.
The upward momentum continued in April 2017, as sentiment was supported by a stronger ringgit, improving outlook for corporate earnings and strong inflow of foreign funds. The broader market outperformed the KLCI, with the FBM EMAS up 2.2% mom to 12,631pts. However, average daily value traded on Bursa in April fell by 8% mom to RM2.8bn. The finance, technology and energy sectors outperformed the market. The energy sector outperformed, on the back of continued optimism about Saudi Aramco’s potential USD7 bil investment in RAPID. The financial sector outperformed, presumably on reflation trade. Materials were a major underperformer, led by Lafarge and PChem, on a weaker pricing environment. Consumer staples underperformed on lower CPO prices, while defensive utilities continued to underperform. After a strong performance in the first 4 months of 2017, the market paused its uptrend in May 2017. News of the Bandar Malaysia deal cancellation by the Malaysian government caused dampened sentiment on fears of reversal of capital inflows from China; these were subsequently eased when Malaysia signed more MoUs with China at the One Belt One Road Initiative (“OBOR”) conference one week later. Stronger-than-expected GDP growth for 1Q17 was offset by an earnings season that did not see much surprise on the upside due to high expectations. In June, the market started the month trending higher but failed to hold on to its gain as profit-taking sets in due to concerns over valuations. The results release for the period of April-June saw substantial downgrades in consensus estimates in telcos, utilities, consumer discretionary & staples, whilst substantial upgrades were on technology, healthcare and energy.

8
The market was range bound in the month of July, with a lack of catalysts to drive the market. Invest Malaysia saw a higher turnout however, indicating renewed investor interest in Malaysia. As usual, the government announced several measures at the event, including (1) the Leading Entrepreneur Accelerator Platform (“LEAP”) market (2) a single regulator for the property sector. The listing of Lotte Chemical Titan, the largest IPO since 2012, turned out terribly for investors as the stock dropped 23% in a single day on 31 July after it announced a headline 67% QoQ and 72% YoY drop in 2Q17 net profit. Adjusted for exceptionals, the decline was more moderate at 17% QoQ and 36% YoY. However, due to the ineffective guidance by management, the damage to the stock’s marketability has been substantial. The lackluster performance continued in the month of August. After seven consecutive months of net buy, foreign investors turned marginal net sellers of Malaysia equities at RM0.3 bil. This brought the eight months cumulative foreign buy to RM10.9 bil. This was consistent with their retracement in the other ASEAN emerging markets. For the month of August, the key attraction to the market development was the 2Q17 corporate results reporting season, where corporate results have been lackluster in general. Although 2Q17 corporate earnings report card has been somewhat subdued and unexciting, we believe that 2H17 earnings should be stronger due to 1) 2Q17 5.8% GDP growth is the strongest in the past 2 years; 2) Ringgit has been stabilising; 3) improving labour market coupled with continued wage growth and moderating inflation will support and spur domestic economy and 4) government's continuous effort in the ongoing roll-out of infrastructure projects. In September, foreign outflows continue, with net outflow of RM0.8 bil (Aug: -RM0.3 bil), bringing down the Year-to-Date (“YTD”) cumulative foreign buy to RM10.0 bil. Crude oil price spiked 13.0% m.o.m to US$58/bbl, leading to outperformance in the Energy sector. The oil price were driven by hurricanes in US which have disrupted some oil logistics; Geopolitical issue in middle-east where Turkey is threatening to stop oil flow from Iraq’s Kurdish area which will affect up to 1.5% of global oil supply; Opec’s rhetoric to extend production cut to Dec18 from Mac18. Telco and Material sectors were outperformers too. For the period under review, FBM Shariah Index (FBMS) ended at 12,797.37 points, a gain of 3.64%.
Market Outlook
The key focus for the local market in October was the Budget 2018, which is also known as the pre-election budget. The continuous BR1M handout and income tax reduction is expected to lift private consumption, hence further strengthened our overweight call on the consumer sector. Furthermore, we view that the local consumer spending is poised to recover since the implementation of GST more than 2 years ago. In the budget, the government reiterated its commitment towards the main stream transportation-led projects which will continue to drive the construction sector. On top of this, the special end-financing scheme for PR1MA buyers has now been extended to private

9
developers as well, with the aim of helping first-time home buyers to obtain loans. This will benefit the banks as loan approvals are expected to escalate going forward. The GDP growth forecast for this year has also been raised to 5.2-5.7% during the budget, up from 4.3-4.8%. Authority expects growth to remain sanguine, albeit slightly lower at 5.0-5.5% in 2018. Overall, we believe that the Budget 2018 is positive to most of the sectors that we previously favored and continue to favor such as financial, consumer, construction/infrastructure, technology and export players. Going forward, we believe the market will refocus on external developments, namely 1) US-North Korea conflicts; 2) US tax reform; 3) Fed rate hike and 4) Middle Eastern tensions while on the local front, we are watchful on 1) the upcoming 3Q17 reporting season and 2) election developments.
Additional Information
Following the renewal of the Master Prospectus effective from 10 September 2017, the “Counterparty Credit Risk” has been included on page 43 as the inclusion in the Fund explicitly describes the risk in counterparty dealing instead of issuer/obligor credit. The insertion of this risk is for clarity purposes. Counterparty Credit Risk Counterparty credit risk is the risk arising from the possibility that the counterparty may default or not able to fulfill a trade settlement prior or on the settlement date of the trade. This could adversely affect the value of the Fund. For more details, kindly refer to the Master Prospectus dates 10 September 2017.
Kuala Lumpur, Malaysia AmFunds Management Berhad 7 November 2017

Independent auditors’ report to the unitholders of AmIttikal
Report on the audit of the financial statements
Opinion
Basis for opinion
Independence and other ethical responsibilities
Information other than the financial statements and auditors’ report thereon
We have audited the financial statements of AmIttikal (“the Fund”), which comprise the statementof financial position as at 30 September 2017, and the statement of comprehensive income,statement of changes in equity and statement of cash flows for the year then ended, and notes to thefinancial statements, including a summary of significant accounting policies, as set out on pages 13to 35.
In our opinion, the accompanying financial statements give a true and fair view of the financialposition of the Fund as at 30 September 2017 and of its financial performance and its cash flows forthe year then ended in accordance with Malaysian Financial Reporting Standards and InternationalFinancial Reporting Standards.
We conducted our audit in accordance with approved standards on auditing in Malaysia andInternational Standards on Auditing. Our responsibilities under those standards are further describedin the Auditor’s Responsibilities for the Audit of the Financial Statements section of our report. Webelieve that the audit evidence we have obtained is sufficient and appropriate to provide a basis forour opinion.
We are independent of the Fund in accordance with the By-Laws (on Professional Ethics, Conductand Practice) of the Malaysian Institute of Accountants (“By-Laws”) and the International EthicsStandards Board for Accountants’ Code of Ethics for Professional Accountants (“IESBA Code”),and we have fulfilled our other ethical responsibilities in accordance with the By-Laws and theIESBA Code.
The Manager is responsible for the other information. The other information comprises informationin the Annual Report, but does not include the financial statements of the Fund and our auditors’report thereon.
Our opinion on the financial statements of the Fund does not cover the other information and we donot express any form of assurance conclusion thereon.
In connection with our audit of the financial statements of the Fund, our responsibility is to read theother information and, in doing so, consider whether the other information is materially inconsistentwith the financial statements of the Fund or our knowledge obtained in the audit or otherwiseappears to be materially misstated.
10

Independent auditors’ report to the unitholders of AmIttikal (cont’d.)
Responsibilities of the Manager and the Trustees for the financial statements
Auditor’s responsibilities for the audit of the financial statements
Our objectives are to obtain reasonable assurance about whether the financial statements of theFund, as a whole are free from material misstatement, whether due to fraud or error, and to issue anauditors’ report that includes our opinion. Reasonable assurance is a high level of assurance, but isnot a guarantee that an audit conducted in accordance approved standards on auditing in Malaysiaand International Standards on Auditing will always detect a material misstatement when it exists.Misstatements can arise from fraud or error and are considered material if, individually or in theaggregate, they could reasonably be expected to influence the economic decisions of users taken onthe basis of these financial statements.
If based on the work we have performed, we conclude that there is a material misstatement of thisother information, we are required to report that fact. We have nothing to report in this regard.
The Manager is responsible for the preparation of the financial statements of the Fund that give atrue and fair view in accordance with Malaysian Financial Reporting Standards and InternationalFinancial Reporting Standards. The Manager is also responsible for such internal control as theManager determines is necessary to enable the preparation of financial statements of the Fund thatare free from material misstatement, whether due to fraud or error.
In preparing the financial statements of the Fund, the Manager is responsible for assessing theFund’s ability to continue as a going concern, disclosing, as applicable, matters related to goingconcern and using the going concern basis of accounting unless the Manager either intends toliquidate the Fund or to cease operations, or has no realistic alternative to do so.
The Trustee is responsible for ensuring that the Manager maintains proper accounting and otherrecords as are necessary to enable true and fair presentation of these financial statements.
As part of an audit in accordance with the approved standards on auditing in Malaysia andInternational Standards on Auditing, we exercise professional judgment and maintain professionalskepticism throughout the planning and performance of the audit. We also:
Identify and assess the risks of material misstatement of the financial statements of the Fund,whether due to fraud or error, design and perform audit procedures responsive to those risks,and obtain audit evidence that is sufficient and appropriate to provide a basis for our opinion.The risk of not detecting a material misstatement resulting from fraud is higher than for oneresulting from error, as fraud may involve collusion, forgery, intentional omissions,misrepresentations, or the override of internal control.
Obtain an understanding of internal control relevant to the audit in order to design auditprocedures that are appropriate in the circumstances, but not for the purpose of expressing anopinion on the effectiveness of the Fund’s internal control.
11

Independent auditors’ report to the unitholders of AmIttikal (cont’d.)
Other matters
Ernst & Young Wan Daneena Liza Bt Wan Abdul RahmanAF: 0039 No. 2978/03/18(J)Chartered Accountants Chartered Accountant
Kuala Lumpur, Malaysia7 November 2017
We communicate with the Manager regarding, among other matters, the planned scope and timingof the audit and significant audit findings, including any significant deficiencies in internal controlthat we identify during our audit.
This report is made solely to the unitholders of the Fund, as a body, and for no other purpose. We donot assume responsibility to any other person for the content of this report.
Evaluate the appropriateness of accounting policies used and the reasonableness of accountingestimates and related disclosures made by the Manager.
Conclude on the appropriateness of the Manager’s use of the going concern basis ofaccounting and, based on the audit evidence obtained, whether a material uncertainty existsrelated to events or conditions that may cast significant doubt on the Fund’s ability to continue as a going concern. If we conclude that a material uncertainty exists, we are required to drawattention in our auditors’ report to the related disclosures in the financial statements or, if suchdisclosures are inadequate, to modify our opinion. Our conclusions are based on the auditevidence obtained up to the date of our auditors’ report. However, future events or conditionsmay cause the Fund to cease to continue as a going concern.
Evaluate the overall presentation, structure and content of the financial statements of theFund, including the disclosures, and whether the financial statements of the Fund representthe underlying transactions and events in a manner that achieves fair presentation.
12

AmIttikal
STATEMENT OF FINANCIAL POSITIONAS AT 30 SEPTEMBER 2017
2017 2016Note RM RM
ASSETSShariah-compliant investments 4 117,959,881 153,522,563Deposits with financial institutions 5 30,002,795 4,000,329 Dividends receivable 145,347 282,076Sundry receivables 6 900,120 532,131Cash at banks 12,812,482 37,217,316
TOTAL ASSETS 161,820,625 195,554,415
LIABILITIESNet amount due to Manager 7 2,760,110 3,146,024Amount due to Trustee 8 9,334 12,333 Distribution payable and to be reinvested 6,355,284 - Sundry payables and accrued expenses 6 1,386,588 194,900
TOTAL LIABILITIES 10,511,316 3,353,257
EQUITYUnitholders’ capital 11(a) 306,601,066 348,325,358 Accumulated losses 11(b)(c) (155,291,757) (156,124,200)
TOTAL EQUITY 11 151,309,309 192,201,158
TOTAL EQUITY AND LIABILITIES 161,820,625 195,554,415
UNITS IN CIRCULATION 11(a) 238,025,628 301,987,557
NET ASSET VALUE PER UNIT 63.57 sen 63.65 sen
The accompanying notes form an integral part of the financial statements.
13

AmIttikal
STATEMENT OF COMPREHENSIVE INCOMEFOR THE FINANCIAL YEAR ENDED 30 SEPTEMBER 2017
2017 2016Note RM RM
SHARIAH-COMPLIANT INVESTMENT INCOMEGross dividend income 3,897,457 4,331,084Profit income 771,092 1,354,292Net gain fromShariah-compliant investments:− Financial assets at fair value through profit or loss (“FVTPL”) 9 5,416,842 7,883,207
Gross Income 10,085,391 13,568,583
EXPENDITUREManager’s profit 7 (2,507,698) (2,709,334) Trustee’s fee 8 (122,678) (147,121) Auditors’ remuneration (7,000) (7,000) Tax agent’s fee (5,000) (5,000) Custodian’s fee (3,944) - Other expenses 10 (251,344) (297,939)
Total Expenditure (2,897,664) (3,166,394)
NET INCOME BEFORE TAX 7,187,727 10,402,189 LESS: INCOME TAX 13 - -
NET INCOME AFTER TAX 7,187,727 10,402,189
OTHER COMPREHENSIVE INCOME - -
TOTAL COMPREHENSIVE INCOME FOR THE FINANCIAL YEAR 7,187,727 10,402,189
Total comprehensive income comprises the following: Realised income 9,880,331 10,673,387 Unrealised loss (2,692,604) (271,198)
7,187,727 10,402,189
Distributions for the financial year:Net distributions 14 6,355,284 13,143,085
Gross/net distributions per unit (sen) 14 2.67 4.00
The accompanying notes form an integral part of the financial statements.
14

AmIttikal
STATEMENT OF CHANGES IN EQUITYFOR THE FINANCIAL YEAR ENDED 30 SEPTEMBER 2017
Unitholders’ Accumulated Total capital losses equity
Note RM RM RM
At 1 October 2015 376,100,382 (153,383,304) 222,717,078 Total comprehensive income for the
financial year - 10,402,189 10,402,189 Creation of units 11(a) 15,580,034 - 15,580,034 Reinvestments of distributions 11(a),14 10,166,338 - 10,166,338 Cancellation of units 11(a) (53,521,396) - (53,521,396)Distributions 14 - (13,143,085) (13,143,085)
Balance at 30 September 2016 348,325,358 (156,124,200) 192,201,158
At 1 October 2016 348,325,358 (156,124,200) 192,201,158 Total comprehensive income for the
financial year - 7,187,727 7,187,727 Creation of units 11(a) 55,696,164 - 55,696,164 Cancellation of units 11(a) (97,420,456) - (97,420,456) Distributions 14 - (6,355,284) (6,355,284)
Balance at 30 September 2017 306,601,066 (155,291,757) 151,309,309
The accompanying notes form an integral part of the financial statements.
15

AmIttikal
STATEMENT OF CASH FLOWSFOR THE FINANCIAL YEAR ENDED 30 SEPTEMBER 2017
2017 2016Note RM RM
CASH FLOWS FROM OPERATING ANDINVESTING ACTIVITIES
Proceeds from sale of Shariah-compliant investments 211,898,167 280,986,467 Dividends received 4,034,186 4,486,859 Profit received 771,092 1,354,292 Tax refunded - 22,951 Manager’s profit paid (2,709,334) (4,526,434)Trustee’s fee paid (125,677) (148,748)Tax agent’s fee paid (5,000) (5,000)Custodian’s fee paid (3,944) - Payments for other expenses (261,787) (277,620)Purchase of Shariah-compliant investments (170,091,501) (228,455,717)
Net cash generated from operating and investing activities 43,506,202 53,437,050
CASH FLOWS FROM FINANCING ACTIVITIESProceeds from creation of units 55,715,094 15,561,104 Payments for cancellation of units (97,623,664) (53,267,122)Distributions paid - (2,976,747)
Net cash used in financing activities (41,908,570) (40,682,765)
NET INCREASE IN CASH AND CASH EQUIVALENTS 1,597,632 12,754,285
CASH AND CASH EQUIVALENTS AT BEGINNING OF FINANCIAL YEAR 41,217,645 28,463,360
CASH AND CASH EQUIVALENTS AT END OF FINANCIAL YEAR 42,815,277 41,217,645
Cash and cash equivalents comprise:Deposits with financial institutions 5 30,002,795 4,000,329 Cash at banks 12,812,482 37,217,316
42,815,277 41,217,645
The accompanying notes form an integral part of the financial statements.
16

AmIttikal
NOTES TO THE FINANCIAL STATEMENTS
1. GENERAL INFORMATION
2. BASIS OF PREPARATION OF FINANCIAL STATEMENTS
Standards effective during the financial year
Standards issued but not yet effective
Effective for financial periods
beginning on or after
MFRS 9: Financial InstrumentsMFRS 15: Revenue From Contracts With Customers
The Fund plans to adopt the above pronouncements when they become effective in the respectivefinancial periods. These pronouncements are expected to have no significant impact to the financialstatements of the Fund upon their initial application except as described below:
1 January 20181 January 2018
AmIttikal (“the Fund”) was established pursuant to a Deed dated 19 October 1992 as amended byDeeds Supplemental thereto (“the Deed”), between AmFunds Management Berhad as the Manager,AmanahRaya Trustees Berhad as the Trustee and all unitholders.
As at the date of authorisation of these financial statements, the following Standards, which arerelevant to the Fund, have been issued by MASB but are not yet effective and have not beenadopted by the Fund.
The Fund was set up with the objective of providing investors with a means to pool and invest theirfunds in a professionally managed portfolio of Shariah-compliant equities and other non-interestbearing securities. The Fund aims to provide an investment alternative where profits earned are inaccordance with Principles of Shariah. The Fund is managed based on the concept of Al-Mudharabah. As provided in the Deed, the “accrual period” or the financial year shall end on 30September and the units in the Fund were first offered for sale on 18 December 1992.
The financial statements of the Fund have been prepared in accordance with Malaysian FinancialReporting Standards (“MFRS”) as issued by the Malaysian Accounting Standards Board(“MASB”) and are in compliance with International Financial Reporting Standards.
The financial statements of the Fund have been prepared under the historical cost convention,unless otherwise stated in the accounting policies.
The adoption of MFRS which have been effective during the financial year did not have anymaterial financial impact to the financial statements.
17

MFRS 9 Financial Instruments
3. SIGNIFICANT ACCOUNTING POLICIES
Income recognition
Income tax
Functional and presentation currency
Statement of cash flows
Distribution
Current tax assets and liabilities are measured at the amount expected to be recovered from or paidto the tax authorities. The tax rates and tax laws used to compute the amount are those that areenacted or substantively enacted at the reporting date.
Current taxes are recognised in profit or loss except to the extent that the tax relates to itemsrecognised outside profit or loss, either in other comprehensive income or directly in equity.
Functional currency is the currency of the primary economic environment in which the Fundoperates that most faithfully represents the economic effects of the underlying transactions. Thefunctional currency of the Fund is Ringgit Malaysia which reflects the currency in which the Fundcompetes for funds, issues and redeems units. The Fund has also adopted Ringgit Malaysia as itspresentation currency.
The Fund adopts the direct method in the preparation of the statement of cash flows.
Cash equivalents are short-term, highly liquid Shariah-compliant investments that are readilyconvertible to cash with insignificant risk of changes in value.
Distributions are at the discretion of the Fund. A distribution to the Fund’s unitholders is accountedfor as a deduction from realised reserves. A proposed distribution is recognised as a liability in theperiod in which it is approved.
MFRS 9 reflects International Accounting Standards Board’s (“IASB”) work on the replacement ofMFRS 139 Financial Instruments: Recognition and Measurement (“MFRS 139”). MFRS 9 will beeffective for financial year beginning on or after 1 January 2018. The Fund is in the process ofquantifying the impact of the first adoption of MFRS 9.
Income is recognised to the extent that it is probable that the economic benefits will flow to theFund and the income can be reliably measured. Income is measured at the fair value ofconsideration received or receivable.
Dividend income is recognised when the Fund’s right to receive payment is established. Profitincome on Islamic short-term deposits is recognised on an accrual basis using the effective profitmethod.
18

Unitholders’ capital
Financial assets
(i) Financial assets at FVTPL
(ii) Receivables
Subsequent to initial recognition, receivables are measured at amortised cost using the effectiveprofit method. Gains and losses are recognised in profit or loss when the receivables arederecognised or impaired, and through the amortisation process.
For Shariah-compliant investments in quoted securities, market value is determined based onthe closing price quoted on Bursa Malaysia Securities Berhad. Unrealised gains or lossesrecognised in profit or loss are not distributable in nature.
On disposal of Shariah-compliant investments, the net realised gain or loss on disposal ismeasured as the difference between the net disposal proceeds and the carrying amount of theShariah-compliant investments. The net realised gain or loss is recognised in profit or loss.
Financial assets with fixed or determinable payments that are not quoted in an active market areclassified as receivables.
Financial assets are recognised in the statement of financial position when, and only when, theFund becomes a party to the contractual provisions of the financial instrument.
When financial assets are recognised initially, they are measured at fair value, plus, in the case offinancial assets not at fair value through profit or loss, directly attributable transaction costs.
The Fund determines the classification of its financial assets at initial recognition, and thecategories applicable to the Fund include financial assets at fair value through profit or loss(“FVTPL”) and receivables.
Financial assets are classified as financial assets at FVTPL if they are held for trading or aredesignated as such upon initial recognition. Financial assets held for trading by the Fundinclude Shariah-compliant equity securities acquired principally for the purpose of selling inthe near term.
Subsequent to initial recognition, financial assets at FVTPL are measured at fair value.Changes in the fair value of those financial instruments are recorded in ‘Net gain or loss onfinancial assets at fair value through profit or loss’. Dividend revenue and profit earnedelements of such instruments are recorded separately in ‘Gross dividend income’ and ‘Profitincome’ respectively.
The unitholders’ capital of the Fund meets the definition of puttable instruments and is classified asequity instruments under MFRS 132 Financial Instruments: Presentation (“MFRS 132”).
19

Impairment of financial assets
(i) Receivables carried at amortised cost
Financial liabilities
Classification of realised and unrealised gains and losses
The Fund assesses at each reporting date whether there is any objective evidence that a financialasset is impaired.
To determine whether there is objective evidence that an impairment loss on financial assetshas been incurred, the Fund considers factors such as the probability of insolvency orsignificant financial difficulties of the debtor and default or significant delay in payments.
If any such evidence exists, the amount of impairment loss is measured as the differencebetween the asset’s carrying amount and the present value of estimated future cash flowsdiscounted at the financial asset’s original effective profit rate. The impairment loss isrecognised in profit or loss.
The carrying amount of the financial asset is reduced through the use of an allowance account.When a receivable become uncollectible, it is written off against the allowance account.
If in a subsequent period, the amount of the impairment loss decreases and the decrease can berelated objectively to an event occurring after the impairment was recognised, the previouslyrecognised impairment loss is reversed to the extent that the carrying amount of the asset doesnot exceed its amortised cost at the reversal date. The amount of reversal is recognised in profitor loss.
The Fund’s financial liabilities are recognised initially at fair value plus directly attributabletransaction costs and subsequently measured at amortised cost using the effective profit method.
Financial liabilities are classified according to the substance of the contractual arrangementsentered into and the definitions of a financial liability.
Financial liabilities, within the scope of MFRS 139, are recognised in the statement of financialposition when, and only when, the Fund becomes a party to the contractual provisions of thefinancial instrument.
Unrealised gains and losses comprise changes in the fair value of financial instruments for theperiod and from reversal of prior period’s unrealised gains and losses for financial instrumentswhich were realised (i.e. sold, redeemed or matured) during the reporting period.
A financial liability is derecognised when the obligation under the liability is extinguished. Gainsand losses are recognised in profit or loss when the liabilities are derecognised, and through theamortisation process.
20

Significant accounting estimates and judgments
4. SHARIAH-COMPLIANT INVESTMENTS2017 2016RM RM
Financial assets at FVTPL
Quoted Shariah-compliant equity securities in Malaysia 117,959,881 153,522,563
Details of Shariah-compliant investments as at 30 September 2017 are as follows:Market
value as a percentage of
Number of Market Purchase net assetName of company shares value cost value
RM RM %
Quoted Shariah-compliant equity securities in Malaysia
ConstructionGadang Holdings Berhad 2,648,400 3,257,532 3,375,860 2.15Gamuda Berhad 1,062,700 5,611,056 5,448,233 3.71IJM Corporation Berhad 968,800 3,197,040 3,240,390 2.11Kerjaya Prospek Group Berhad 446,300 1,633,458 1,637,735 1.08Sunway Construction
Group Berhad 1,112,000 2,535,360 2,601,944 1.68WCT Holdings Berhad 1,331,993 2,330,988 2,629,435 1.54
7,570,193 18,565,434 18,933,597 12.27
(Forward)
The preparation of the Fund’s financial statements requires the Manager to make judgments,estimates and assumptions that affect the reported amounts of revenues, expenses, assets andliabilities, and the disclosure of contingent liabilities at the reporting date. However, uncertaintyabout these assumptions and estimates could result in outcomes that could require a materialadjustment to the carrying amount of the asset or liability in the future.
The Fund classifies its Shariah-compliant investments as financial assets at FVTPL as the Fundmay sell its Shariah-compliant investments in the short-term for profit-taking or to meetunitholders’ cancellation of units.
No major judgments have been made by the Manager in applying the Fund’s accounting policies.There are no key assumptions concerning the future and other key sources of estimation uncertaintyat the reporting date, that have a significant risk of causing a material adjustment to the carryingamounts of assets and liabilities within the next financial year.
Realised gains and losses on disposals of financial instruments classified at fair value through profitor loss are calculated using the weighted average method. They represent the difference between aninstrument’s initial carrying amount and disposal amount.
21

Marketvalue as a
percentage ofNumber of Market Purchase net asset
Name of company shares value cost valueRM RM %
Quoted Shariah-compliant equity securities in Malaysia
ConsumerHong Leong Industries Berhad 202,600 1,904,440 1,892,774 1.26
FinanceBIMB Holdings Berhad 723,100 3,174,409 2,997,410 2.10Syarikat Takaful Malaysia
Berhad 860,400 3,269,520 3,503,491 2.16
1,583,500 6,443,929 6,500,901 4.26
Industrial productsDRB-Hicom Berhad 969,900 1,580,937 2,647,479 1.05Heveaboard Berhad 961,200 1,528,308 1,635,137 1.01Petron Malaysia Refining &
Marketing Bhd 320,700 3,303,210 3,279,032 2.18PETRONAS Gas Berhad 222,400 3,980,960 4,812,221 2.63SKP Resources Bhd 2,109,400 3,164,100 3,140,440 2.09Thong Guan Industries Berhad 776,300 3,128,489 3,391,571 2.07Wellcall Holdings Berhad 1,775,200 2,290,008 2,472,269 1.51
7,135,100 18,976,012 21,378,149 12.54
Infrastructure projectsDiGi.Com Berhad 1,032,200 5,057,780 5,561,900 3.34TIME dotCom Berhad 350,800 3,115,104 3,266,921 2.06
1,383,000 8,172,884 8,828,821 5.40
PlantationGenting Plantations Berhad 234,700 2,417,410 2,540,090 1.60IJM Plantations Berhad 1,065,600 3,079,584 3,855,994 2.03IOI Corporation Berhad 186,900 848,526 836,090 0.56
1,487,200 6,345,520 7,232,174 4.19
PropertiesEco World Development
Group Berhad 1,549,700 2,402,035 2,431,413 1.59Mah Sing Group Berhad 1,070,900 1,595,641 1,610,083 1.05
2,620,600 3,997,676 4,041,496 2.64
(Forward)
22

Marketvalue as a
percentage ofNumber of Market Purchase net asset
Name of company shares value cost valueRM RM %
Quoted Shariah-compliant equity securities in Malaysia
TechnologyGlobetronics Technology Berhad 258,600 1,590,390 1,481,704 1.05Malaysian Pacific Industries
Berhad 186,800 2,499,384 2,628,417 1.65
445,400 4,089,774 4,110,121 2.70
Trading/ServicesAxiata Group Berhad 1,628,600 8,533,864 9,989,196 5.64Bermaz Auto Berhad 869,100 1,833,801 1,949,277 1.21Dayang Enterprise Holdings
Berhad 913,000 903,870 2,325,850 0.60Dialog Group Berhad 2,465,700 4,931,400 4,835,532 3.27IHH Healthcare Berhad 859,100 4,939,825 5,704,032 3.26Maxis Berhad 679,900 3,943,420 4,752,690 2.61My E.G. Services Berhad 1,250,600 2,563,730 2,629,963 1.69Pos Malaysia Berhad 295,800 1,552,950 1,414,456 1.03Sime Darby Berhad 1,590,400 14,345,408 14,192,353 9.48Telekom Malaysia Berhad 633,200 4,115,800 3,912,631 2.72Uzma Berhad 1,250,100 1,800,144 1,819,702 1.19
12,435,500 49,464,212 53,525,682 32.70
Total financial assets at FVTPL 34,863,093 117,959,881 126,443,715 77.96
Shortfall of market value over cost (8,483,834)
5. DEPOSITS WITH FINANCIAL INSTITUTIONS
2017 2016RM RM
At nominal value:Short-term deposits with licensed Islamic banks 30,000,000 4,000,000
At carrying value:Short-term deposits with licensed Islamic banks 30,002,795 4,000,329
23

Details of deposit with financial institution as at 30 September 2017 are as follows:
Carryingvalue as a
percentage of Maturity Nominal Carrying Purchase net asset
date Bank value value cost valueRM RM RM %
Short-term deposit with a licensed Islamic bank
Maybank Islamic Berhad 30,000,000 30,002,795 30,000,000 19.83
Weighted average effective Remaining profit rate maturity
2017 2016 2017 2016% % Days Days
Short-term deposits with licensed Islamic banks 3.40 3.00 2 4
6. SUNDRY RECEIVABLES/PAYABLES AND ACCRUED EXPENSES
2017 2016RM RM
Amounts owing from financial institutions 900,120 532,131 Amounts owing to brokers/financial institutions (1,195,131) -
The normal trade credit period is three business days.
7. NET AMOUNT DUE TO MANAGER2017 2016RM RM
Net redemption of units* (252,412) (436,690)Manager’s profit payable (2,507,698) (2,709,334)
(2,760,110) (3,146,024)
*
Manager’s profit is up to 20% of the net realised profits.
02.10.2017
The amount represents net amount payable to the Manager for units redeemed.
Included in sundry receivables/payables and accrued expenses were amounts owing from/tobrokers/financial institutions for outstanding contracts where settlement were not due as follows:
The weighted average effective profit rate and average remaining maturity of short-term depositsare as follows:
24

8. AMOUNT DUE TO TRUSTEE
9. NET GAIN FROM SHARIAH-COMPLIANT INVESTMENTS
2017 2016RM RM
Net gain on financial assets at FVTPL comprised:− Net realised gain on sale of Shariah-compliant investments 8,109,446 8,154,405 − Net unrealised loss on changes in fair values of
Shariah-compliant investments (2,692,604) (271,198)
5,416,842 7,883,207
10. OTHER EXPENSES
11. TOTAL EQUITY
Total equity is represented by:
2017 2016Note RM RM
Unitholders’ capital (a) 306,601,066 348,325,358Accumulated losses- Realised loss (b) (146,807,923) (150,332,970)- Unrealised loss (c) (8,483,834) (5,791,230)
151,309,309 192,201,158
Included in other expenses is Goods and Services Tax incurred by the Fund during the financialyear amounting to RM164,506 (2016: RM172,778).
The normal credit period in the previous and current financial years for Trustee’s fee payable is onemonth.
Trustee’s fee is at a rate of 0.07% (2016: 0.07%) per annum on the net asset value of the Fund,calculated on a daily basis.
The normal credit period in the previous and current financial years for creation and redemption ofunits is three business days.
The normal credit period in the previous and current financial years for Manager’s profit payable isone month.
25

(a) UNITHOLDERS’ CAPITAL/UNITS IN CIRCULATION
Number of Number of units RM units RM
At beginning of the financial year 301,987,557 348,325,358 345,696,067 376,100,382Creation during the financial year 84,047,148 55,696,164 23,826,330 15,580,034Distributions reinvested (Note 14) - - 15,627,507 10,166,338Cancellation during the financial year (148,009,077) (97,420,456) (83,162,347) (53,521,396)
At end of the financial year 238,025,628 306,601,066 301,987,557 348,325,358
(b) REALISED – DISTRIBUTABLE
2017 2016RM RM
At beginning of the financial year (150,332,970) (147,863,272)
Total comprehensive income for the financial year 7,187,727 10,402,189 Net unrealised loss attributable to Shariah-compliant
investments held transferred to unrealised reserve[Note 11(c)] 2,692,604 271,198
Distributions out of realised reserve (Note 14) (6,355,284) (13,143,085)
Net increase/(decrease) in realised reserve for the financial year 3,525,047 (2,469,698)
At end of the financial year (146,807,923) (150,332,970)
(c) UNREALISED – NON-DISTRIBUTABLE
2017 2016RM RM
At beginning of the financial year (5,791,230) (5,520,032)Net unrealised loss attributable to Shariah-compliant
investments held transferred from realised reserve[Note 11(b)] (2,692,604) (271,198)
At end of the financial year (8,483,834) (5,791,230)
12. UNITS HELD BY RELATED PARTIES
20162017
The Manager and parties related to the Manager did not hold any units in the Fund as at 30September 2017 and 30 September 2016.
26

13. INCOME TAX
2017 2016RM RM
Net income before tax 7,187,727 10,402,189
Taxation at Malaysian statutory rate of 24% 1,725,054 2,496,500Tax effects of:
Income not subject to tax (3,066,719) (3,321,500)Loss not deductible for tax purposes 646,225 65,100Restriction on tax deductible expenses for unit trust fund 561,555 611,300Non-permitted expenses for tax purposes 71,490 80,700Permitted expenses not used and not available for future financial years 62,395 67,900
Tax expense for the financial year - -
14. DISTRIBUTIONS
2017 2016RM RM
Undistributed net income brought forward - 2,469,698Gross dividend income 2,822,271 4,331,084Profit income 558,372 1,354,292Net realised gain on sale of Shariah-compliant investments 5,872,305 8,154,405
9,252,948 16,309,479Less: Expenses (2,897,664) (3,166,394)
Total amount of distributions 6,355,284 13,143,085
Gross/net distributions per unit (sen) 2.67 4.00
Distributions made out of:- Realised reserve [Note 11(b)] 6,355,284 13,143,085
(Forward)
Distributions to unitholders declared on 29 September 2017 (28 October 2015, 7 January 2016, 8April 2016 and 29 August 2016 for the previous financial year) are from the following sources:
Pursuant to Schedule 6 of the Income Tax Act, 1967, local profit income derived by the Fund isexempted from tax.
A reconciliation of income tax expense applicable to net income before tax at the statutory incometax rate to income tax expense at the effective income tax rate of the Fund is as follows:
Income tax payable is calculated on Shariah-compliant investment income less deduction forpermitted expenses as provided for under Section 63B of the Income Tax Act, 1967.
27

2017 2016RM RM
Comprising:Distributions reinvested [Note 11(a)] - 10,166,338Distribution payable and to be reinvested 6,355,284 - Cash distributions - 2,976,747
6,355,284 13,143,085
15. MANAGEMENT EXPENSE RATIO (“MER”)
2017 2016% p.a. % p.a.
Manager’s fee 1.43 1.29Trustee’s fee 0.07 0.07Fund’s other expenses 0.15 0.15
Total MER 1.65 1.51
16. PORTFOLIO TURNOVER RATIO (“PTR”)
17. SEGMENTAL REPORTING
− A portfolio of Shariah-compliant equity instruments; and− A portfolio of Shariah-compliant fixed income instruments, including deposit with financial
institution.
Included in the distributions for the financial year ended 30 September 2016 was RM2,469,698distributed from previous financial years’ realised income.
The above distributions for the financial year ended 30 September 2017 have been proposed beforetaking into account the net unrealised loss of RM8,483,834 (2016: RM5,791,230) which are carriedforward to the next financial year.
The Fund’s MER is as follows:
The MER of the Fund is the ratio of the sum of annualised fees and expenses incurred by the Fund tothe average net asset value of the Fund calculated on a daily basis.
The PTR of the Fund, which is the ratio of average total acquisitions and disposals of Shariah-compliant investments to the average net asset value of the Fund calculated on a daily basis, is 1.09times (2016: 1.21 times).
The Manager and Investment Committee of the Fund are responsible for allocating resources availableto the Fund in accordance with the overall investment strategies as set out in the Investment Guidelinesof the Fund. The Fund is managed by two segments:
28

Fixed Fixed Equity income Equity income
portfolio portfolio Total portfolio portfolio TotalRM RM RM RM RM RM
Gross dividend income 3,897,457 - 3,897,457 4,331,084 - 4,331,084
income - 771,092 771,092 - 1,354,292 1,354,292
Shariah-compliant investments:
‒ Financialassetsat FVTPL 5,416,842 - 5,416,842 7,883,207 - 7,883,207
Total segment investment income forthe financial year 9,314,299 771,092 10,085,391 12,214,291 1,354,292 13,568,583
Financial assets at FVTPL 117,959,881 - 117,959,881 153,522,563 - 153,522,563
Deposits with financial institutions - 30,002,795 30,002,795 - 4,000,329 4,000,329
Dividends receivable 145,347 - 145,347 282,076 - 282,076
Amount owing from broker 900,120 - 900,120 532,131 - 532,131
Total segment assets -119,005,348 30,002,795 149,008,143 154,336,770 4,000,329 158,337,099
Amount owing tobroker 1,195,131 - 1,195,131 - - -
Total segment liabilities 1,195,131 - 1,195,131 - - -
2017 2016
The investment objective of each segment is to achieve consistent returns from the Shariah-compliantinvestments in each segment while safeguarding capital by investing in diversified portfolios. Therehave been no changes in reportable segments in the current financial year. The segment informationprovided is presented to the Manager and Investment Committee of the Fund.
Profit
Net gain from
29

2017 2016RM RM
Net reportable segment investment income 10,085,391 13,568,583Less: Expenses (2,897,664) (3,166,394)
Net income before tax 7,187,727 10,402,189Less: Income tax - -
Net income after tax 7,187,727 10,402,189
2017 2016RM RM
Total segment assets 149,008,143 158,337,099Cash at banks 12,812,482 37,217,316
Total assets of the Fund 161,820,625 195,554,415
Total segment liabilities 1,195,131 -Net amount due to Manager 2,760,110 3,146,024Amount due to Trustee 9,334 12,333 Distribution payable and to be reinvested 6,355,284 - Sundry payables and accrued expenses 191,457 194,900
Total liabilities of the Fund 10,511,316 3,353,257
18. TRANSACTIONS WITH BROKERS AND FINANCIAL INSTITUTIONS
Brokerage fee, stampBrokers/Financial institutions Transaction value duty and clearing fee
RM % RM %
AmInvestment Bank Berhad* 96,003,031 25.03 310,238 23.61 Affin Investment Bank Berhad 29,510,873 7.69 117,810 8.97 Maybank Investment Bank Berhad 28,129,455 7.33 115,045 8.76 CIMB Investment Bank Berhad 25,727,111 6.71 95,264 7.25 Citigroup Global Markets Malaysia
Sdn Bhd 21,232,763 5.54 67,090 5.11 KAF Seagroatt & Campbell Securities
Sdn Bhd 20,364,845 5.31 64,351 4.90 CLSA Securities Sdn Bhd 19,431,633 5.07 61,377 4.67
(Forward)
Details of transactions with brokers and financial institutions for the financial year ended 30September 2017 are as follows:
In addition, certain assets and liabilities are not considered to be part of the net assets or liabilities ofan individual segment. The following table provides reconciliation between the net reportable segmentassets and liabilities and total assets and liabilities of the Fund.
Expenses of the Fund are not considered part of the performance of any investment segment. Thefollowing table provides reconciliation between the net reportable segment income and net incomeafter tax:
30

Brokerage fee, stampBrokers/Financial institutions Transaction value duty and clearing fee
RM % RM %
Macquarie Capital Securities (M) Sdn Bhd 17,495,505 4.56 57,140 4.35 RHB Investment Bank Berhad 16,472,172 4.29 62,215 4.74 Public Investment Bank Berhad 15,674,616 4.09 51,281 3.90 Other brokers and financial institutions 93,510,784 24.38 311,869 23.74
Total 383,552,788 100.00 1,313,680 100.00
*
19. FINANCIAL INSTRUMENTS
(a) Classification of financial instruments
Financial Financial Receivables liabilities at
assets at amortised amortisedat FVTPL cost cost Total
RM RM RM RM
AssetsShariah-compliant investments 117,959,881 - - 117,959,881Deposits with financial institutions - 30,002,795 - 30,002,795Dividends receivable - 145,347 - 145,347Sundry receivables - 900,120 - 900,120Cash at banks - 12,812,482 - 12,812,482
Total financial assets 117,959,881 43,860,744 - 161,820,625
LiabilitiesNet amount due to Manager - - 2,760,110 2,760,110Amount due to Trustee - - 9,334 9,334Distribution payable and to be
reinvested - - 6,355,284 6,355,284Sundry payables and accrued
expenses - - 1,386,588 1,386,588
Total financial liabilities - - 10,511,316 10,511,316
(Forward)
2017
A financial institution related to the Manager. The Manager and the Trustee are of the opinionthat the above transactions have been entered in the normal course of business and have beenestablished under terms that are no less favourable than those arranged with independent thirdparties.
The above transactions were in respect of Shariah-compliant listed securities.
The significant accounting policies in Note 3 describe how the classes of financial instruments aremeasured, and how income and expenses, including fair value gains and losses, are recognised.The following table analyses the financial assets and liabilities of the Fund in the statement offinancial position by the class of financial instrument to which they are assigned, and therefore bythe measurement basis.
31

Financial Financial Receivables liabilities at
assets at amortised amortisedat FVTPL cost cost Total
RM RM RM RM
AssetsShariah-compliant investments 153,522,563 - - 153,522,563 Deposits with financial institutions - 4,000,329 - 4,000,329 Dividends receivable - 282,076 - 282,076 Sundry receivables - 532,131 - 532,131 Cash at banks - 37,217,316 - 37,217,316
Total financial assets 153,522,563 42,031,852 - 195,554,415
LiabilitiesNet amount due to Manager - - 3,146,024 3,146,024 Amount due to Trustee - - 12,333 12,333 Sundry payables and accrued
expenses - - 194,900 194,900
Total financial liabilities - - 3,353,257 3,353,257
Income, expense, gainsand losses
2017 2016RM RM
Net gain from financial assets at FVTPL 5,416,842 7,883,207 Income, of which derived from:– Gross dividend income from financial assets at FVTPL 3,897,457 4,331,084- Profit income from receivables 771,092 1,354,292
(b) Financial instruments that are carried at fair value
Level 1: quoted (unadjusted) prices in active markets for identical assets or liabilities;
Level 2:
Level 3:
The following table shows an analysis of financial instruments recorded at fair value by the levelof the fair value hierarchy:
techniques which use inputs which have a significant effect on the recorded fair valuethat are not based on observable market data.
The Fund’s financial assets and liabilities at FVTPL are carried at fair value.
other techniques for which all inputs which have a significant effect on the recordedfair values are observable; either directly or indirectly; or
2016
The Fund uses the following hierarchy for determining and disclosing the fair value of financialinstruments by valuation technique:
32

Level 1 Level 2 Level 3 TotalRM RM RM RM
117,959,881 - - 117,959,881
153,522,563 - - 153,522,563
(c)
Deposits with financial institutions Dividends receivable Sundry receivables Cash at banks Net amount due to Manager Amount due to Trustee Distribution payable and to be reinvested Sundry payables and accrued expenses
20. RISK MANAGEMENT POLICIES
Market risk
Financial assets at FVTPL
Financial instruments that are not carried at fair value and whose carrying amounts arereasonable approximation of fair value
The Fund is exposed to a variety of risks that include market risk, credit risk, liquidity risk, singleissuer risk, regulatory risk, management risk and non-compliance/Shariah non-compliance risk.
Risk management is carried out by closely monitoring, measuring and mitigating the above said risks,careful selection of Shariah-compliant investments coupled with stringent compliance to Shariah-compliant investment restrictions as stipulated by the Capital Market and Services Act 2007, SecuritiesCommission’s Guidelines on Unit Trust Funds and the Deed as the backbone of risk management ofthe Fund.
Market risk, in general, is the risk that the value of a portfolio would decrease due to changes in marketrisk factors such as equity prices, foreign exchange rates, rate of return (yield curve) and commodityprices.
The following are classes of financial instruments that are not carried at fair value and whosecarrying amounts are reasonable approximation of fair value due to their short period to maturityor short credit period:
2016Financial assets at FVTPL
There are no financial instruments which are not carried at fair values and whose carrying amountsare not reasonable approximation of their respective fair values.
2017
33

(i) Price risk
Percentage movements in price by: 2017 2016
RM RM
-5.00% (5,897,944) (7,676,128)+5.00% 5,897,994 7,676,128
(ii) Profit rate risk
Parallel shift in yield curve by: 2017 2016
RM RM
+100 bps (2,373) (424)-100 bps 2,397 428
Credit risk
Domestic profit rate on deposits and placements with licensed financial institutions are determinedbased on prevailing market rates.
The result below summarised the profit rate sensitivity of the Fund’s NAV, or theoretical value(applicable to Islamic money market deposit) due to the parallel movement assumption of theyield curve by +100bps and -100bps respectively:
Credit risk is the risk that the counterparty to a financial instrument will cause a financial loss to theFund by failing to discharge an obligation. Credit risk applies to Islamic short-term deposits anddividends receivable. The issuer of such instruments may not be able to fulfill the required profitpayments or repay the principal invested or amount owing. These risks may cause the Fund’s Shariah-compliant investments to fluctuate in value.
For deposits with financial institutions, the Fund makes placements with financial institutions withsound rating of P1/MARC-1 and above. Cash at banks are held for liquidity purposes and are notexposed to significant credit risk.
Price risk refers to the uncertainty of an investment’s future prices. In the event of adverse pricemovements, the Fund might endure potential loss on its quoted Shariah-compliant investments. Inmanaging price risk, the Manager actively monitors the performance and risk profile of theinvestment portfolio.
The result below summarised the price risk sensitivity of the Fund’s NAV due to movements ofprice by -5.00% and +5.00% respectively:
Sensitivity of the Fund’s NAV
Sensitivity of the Fund’s NAV, or theoretical value
Profit rate risk will affect the value of the Fund’s Shariah-compliant investments, given the profitrate movements, which are influenced by regional and local economic developments as well aspolitical developments.
34

Liquidity risk
Single issuer risk
Regulatory risk
Management risk
Non-compliance/Shariah non-compliance risk
21. CAPITAL MANAGEMENT
No changes were made in the objective, policies or processes during the financial years ended 30September 2017 and 30 September 2016.
The primary objective of the Fund’s capital management is to ensure that it maximises unitholders’value by expanding its fund size to benefit from economies of scale and achieving growth in net assetvalue from the performance of its Shariah-compliant investments.
The Fund manages its capital structure and makes adjustments to it, in light of changes in economicconditions. To maintain or adjust the capital structure, the Fund may issue new or bonus units, makedistribution payment, or return capital to unitholders by way of redemption of units.
Poor management of the Fund may cause considerable losses to the Fund that in turn may affect the netasset value of the Fund.
This is the risk of the Manager, the Trustee or the Fund not complying with internal policies, the Deedof the Fund, securities law or guidelines issued by the regulators. In the case of an Islamic Fund, thisincludes the risk of the Fund not conforming to Shariah Investment Guidelines. Non-compliance riskmay adversely affect the Shariah-compliant investments of the Fund when the Fund is forced to rectifythe non-compliance.
Any changes in national policies and regulations may have effects on the capital market and the netasset value of the Fund.
Internal policy restricts the Fund from investing in securities issued by any issuer of not more than acertain percentage of its net asset value. Under such restriction, the risk exposure to the securities ofany single issuer is diversified and managed based on internal/external ratings.
The Fund maintains sufficient level of liquid assets, after consultation with the Trustee, to meetanticipated payments and cancellations of units by unitholders. Liquid assets comprise of deposits withlicensed financial institutions and other instruments, which are capable of being converted into cashwithin 5 to 7 days. The Fund’s policy is to always maintain a prudent level of liquid assets so as toreduce liquidity risk.
Liquidity risk is defined as the risk of being unable to raise funds or borrowings to meet paymentobligations as they fall due. This is also the risk of the Fund experiencing large redemptions, when theInvestment Manager could be forced to sell large volumes of its holdings at unfavourable prices tomeet redemption requirements.
35

AmIttikal
STATEMENT BY THE MANAGER
Kuala Lumpur, Malaysia
I, GOH WEE PENG, for and on behalf of the Manager, AmFunds Management Berhad, for
AmIttikal do hereby state that in the opinion of the Manager, the accompanying statement of
financial position, statement of comprehensive income, statement of changes in equity, statement of
cash flows and the accompanying notes are drawn up in accordance with Malaysian Financial
Reporting Standards and International Financial Reporting Standards so as to give a true and fair
view of the financial position of the Fund as at 30 September 2017 and the comprehensive income,
the changes in equity and cash flows of the Fund for the financial year then ended.
7 November 2017
GOH WEE PENGFor and on behalf of the ManagerAmFunds Management Berhad
36

37
TRUSTEE’S REPORT
38
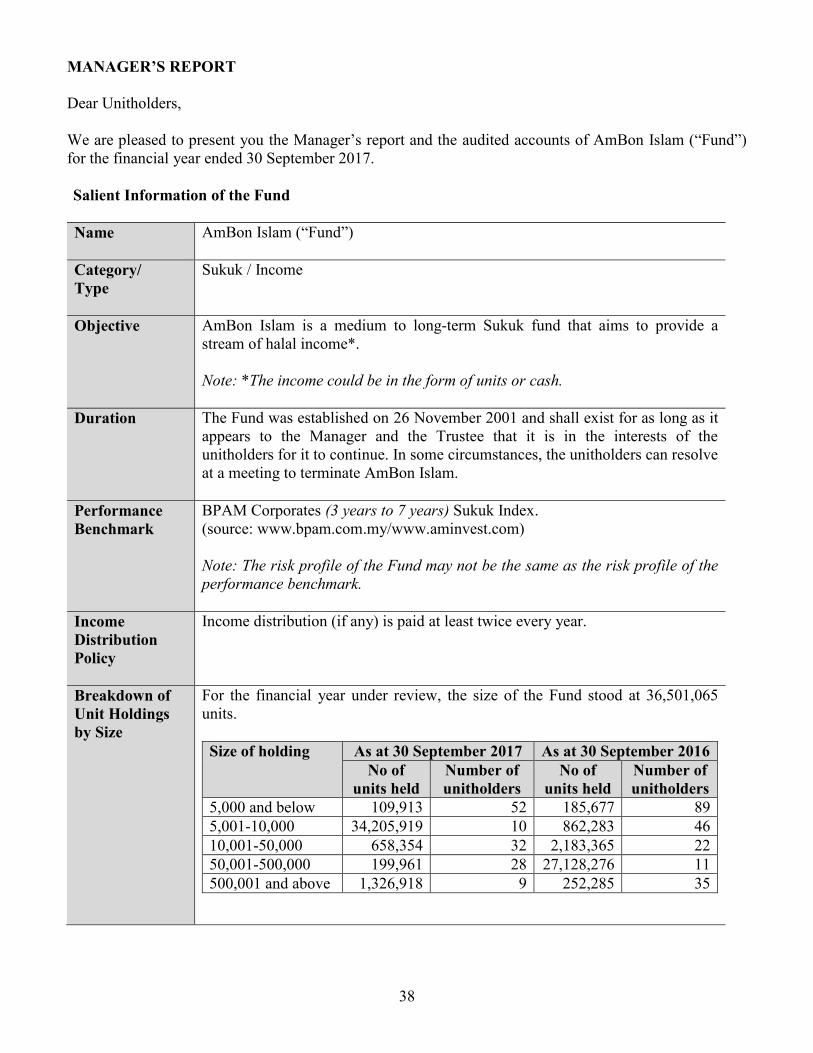
MANAGER’S REPORT Dear Unitholders, We are pleased to present you the Manager’s report and the audited accounts of AmBon Islam (“Fund”) for the financial year ended 30 September 2017. Salient Information of the Fund Name AmBon Islam (“Fund”)
Category/ Type
Sukuk / Income
Objective AmBon Islam is a medium to long-term Sukuk fund that aims to provide a stream of halal income*. Note: *The income could be in the form of units or cash.
Duration The Fund was established on 26 November 2001 and shall exist for as long as it appears to the Manager and the Trustee that it is in the interests of the unitholders for it to continue. In some circumstances, the unitholders can resolve at a meeting to terminate AmBon Islam.
Performance Benchmark
BPAM Corporates (3 years to 7 years) Sukuk Index. (source: www.bpam.com.my/www.aminvest.com) Note: The risk profile of the Fund may not be the same as the risk profile of the performance benchmark.
Income Distribution Policy
Income distribution (if any) is paid at least twice every year.
Breakdown of Unit Holdings by Size
For the financial year under review, the size of the Fund stood at 36,501,065 units. Size of holding As at 30 September 2017 As at 30 September 2016
No of units held
Number of unitholders
No of units held
Number of unitholders
5,000 and below 109,913 52 185,677 89 5,001-10,000 34,205,919 10 862,283 46 10,001-50,000 658,354 32 2,183,365 22 50,001-500,000 199,961 28 27,128,276 11 500,001 and above 1,326,918 9 252,285 35

39
Fund Performance Data Portfolio Composition
Details of portfolio composition of the Fund for the financial years as at 30 September are as follows:
FY 2017 %
FY 2016 %
FY 2015 %
Corporate sukuk 95.95 89.88 66.32 Cash and others 4.05 10.12 33.68 Total 100.00 100.00 100.00
Note: The abovementioned percentages are calculated based on total net asset value.
Performance Details
Performance details of the Fund for the financial years ended 30 September are as follows: FY
2017 FY
2016 FY
2015 Net asset value (RM)* 46,019,117 38,093,654 40,072,623 Units in circulation* 36,501,065 30,611,886 32,794,231 Net asset value per unit (RM)* 1.2608 1.2444 1.2219 Highest net asset value per unit (RM)*
1.2609 1.2723 1.2518
Lowest net asset value per unit (RM)*
1.2305 1.2223 1.2185
Benchmark performance (%) 3.84 7.93 3.17 Total return (%)(1) 3.79 6.86 2.84 - Capital growth (%) 1.38 1.95 -0.81 - Income distribution (%) 2.41 4.91 3.65 Gross distribution (sen per unit) 3.00 6.00 4.50 Net distribution (sen per unit) 3.00 6.00 4.50 Management expense ratio (%)(2) 1.18 1.19 1.14 Portfolio turnover ratio (times)(3) 0.22 0.68 0.81
* Above price and net asset value per unit are shown as ex-distribution. Note: (1) Total return is the annualised return of the Fund for the respective financial
years computed based on the net asset value per unit and net of all fees. (2) Management expense ratio (“MER”) is calculated based on the total fees
and expenses incurred by the Fund divided by the average fund size calculated on a daily basis. The MER decreased by 0.01% as compared to 1.19% per annum for the financial year ended 30 September 2016 mainly due to increase in average fund size.
(3) Portfolio turnover ratio (“PTR”) is calculated based on the average of the total acquisitions and total disposals of investment securities of the Fund divided by the average fund size calculated on a daily basis. The PTR decreased by 0.46 times (67.6%) as compared to 0.68 times for the financial year ended 30 September 2016 mainly due to decrease in investing activities.

40
Average Total Return (as at 30 September 2017)
AmBon Islam(a)
%
BPAM 3Y – 7Y Sukuk
Index/MGII(b) %
One year 3.79 3.84 Three years 4.48 4.96 Five years 3.74 4.20 Ten years 4.43 4.63
Annual Total Return Financial Years Ended (30 September)
AmBon Islam(a)
%
BPAM 3Y – 7Y Sukuk
Index/MGII(b) %
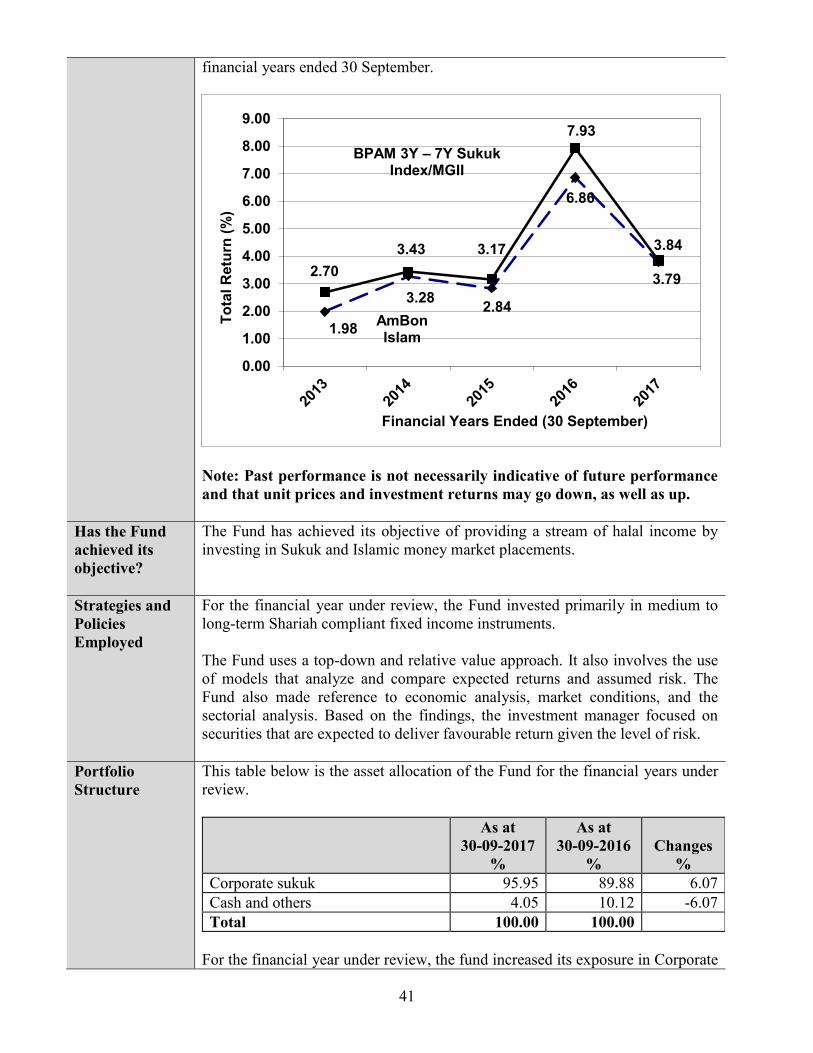
2017 3.79 3.84 2016 6.86 7.93 2015 2.84 3.17 2014 3.28 3.43 2013 1.98 2.70
(a) Source: Novagni Analytics and Advisory Sdn Bhd. (b) Medium Government Investment Issues Index (“MGII”)
(Source: www.fundslogic.com). Performance benchmark has been changed to BPAM Corporates (3 years to 7 years) Sukuk Index with effect from 1 October 2016.
The Fund performance is calculated based on the net asset value per unit of the Fund. Average total return of the Fund and its benchmark for a period is computed on the absolute return for that period annualised over one year. Note: Past performance is not necessarily indicative of future performance and that unit prices and investment returns may go down, as well as up.
Fund Performance
For the financial year under review, the Fund registered a return of 3.79% comprising of 1.38% capital growth and 2.41% income distribution. Thus, the Fund’s return of 3.79% has underperformed the benchmark’s return of 3.84% by 0.05%. As compared with the financial year ended 30 September 2016, the net asset value (“NAV”) per unit of the Fund increased by 1.32% from RM1.2444 to RM1.2608, while units in circulation decreased by 19.24% from 30,611,886 units to 36,501,065 units. The Line Chart below shows comparison between the annual performances of AmBon Islam and its benchmark, BPAM 3Y – 7Y Sukuk Index /MGII, for the
41
financial years ended 30 September.
Note: Past performance is not necessarily indicative of future performance and that unit prices and investment returns may go down, as well as up.
Has the Fund achieved its objective?
The Fund has achieved its objective of providing a stream of halal income by investing in Sukuk and Islamic money market placements.
Strategies and Policies Employed
For the financial year under review, the Fund invested primarily in medium to long-term Shariah compliant fixed income instruments. The Fund uses a top-down and relative value approach. It also involves the use of models that analyze and compare expected returns and assumed risk. The Fund also made reference to economic analysis, market conditions, and the sectorial analysis. Based on the findings, the investment manager focused on securities that are expected to deliver favourable return given the level of risk.
Portfolio Structure
This table below is the asset allocation of the Fund for the financial years under review. As at
30-09-2017 %
As at 30-09-2016
%
Changes
% Corporate sukuk 95.95 89.88 6.07 Cash and others 4.05 10.12 -6.07 Total 100.00 100.00
For the financial year under review, the fund increased its exposure in Corporate
1.98
3.28 2.84
6.86
3.79 2.70 3.43 3.17
7.93
3.84
0.00
1.00
2.00
3.00
4.00
5.00
6.00
7.00
8.00
9.00
Tota
l Ret
urn
(%)
Financial Years Ended (30 September)
AmBon Islam
BPAM 3Y – 7Y Sukuk Index/MGII

42
Sukuk from 89.88% to 95.95% on the back a more stable market dynamics.
Cross Trades
Cross trades are conducted between the Fund and other funds; and private mandates managed by the Manager amounting to: Financial Institutions
Transaction Value (RM)
RHB Investment Bank Berhad 5,628,376.46 Maybank Group 3,083,750.96 Hong Leong Investment Bank 2,017,717.81 Total 10,729,845.23
Funds
Transaction Value (RM)
AmAl-Amin 2,034,614.55 AmIslamic Fixed Income Conservative 3,040,793.42 AmDynamic Sukuk 552,968.49 AmIncome Institutional 3 3,083,750.96 AmDynamic Bond 2,017,717.81 Total 10,729,845.23
Distribution/ Unit splits
During the financial year under review, the Fund declared income distribution, detailed as follows: 3.00 sen per unit income distribution
Change in the unit price prior and
subsequent to the income distribution
Before income distribution on 21 March 2017
(RM)
After income distribution on 21 March 2017
(RM) Net asset value per unit 1.2603 1.2303
There was no unit split declared for the financial year under review.
State of Affairs
There has been neither significant changes to the state of affairs of the Fund nor any circumstances that materially affect any interests of the unitholders during the financial year under review.
Rebates and Soft Commission
It is our policy to pay all rebates to the Fund. Soft commission received from brokers/dealers are retained by the Manager only if the goods and services provided are of demonstrable benefit to unitholders of the Fund. During the financial year under review, the Manager had received on behalf of the Fund, soft commissions in the form of fundamental database, financial wire services, technical analysis software and stock quotation system incidental to investment management of the Fund. These soft commissions received by the Manager are deem to be beneficial to the unitholders of the Fund.

43
Market Review
Malaysian Government Securities (“MGS”) yields rose during the financial year, with the 10Y MGS yield climbing from 3.54% to 3.91%. There was significant volatility in the MGS market, with yields climbing sharply towards the end of 2016 before broadly trending down in 1H2017. The increase in yields was due to a rise in US Treasury yields and a withdrawal of foreign funds from the domestic bond market, foreign holding of Malaysian government debt declined from MYR 185b to 149b during the financial year. Malaysia’s real GDP growth recorded a stronger growth of 5.6% YoY in 1Q2017 (4Q2016: +4.5%), on the back of stronger external activities and domestic demand. 2Q2017 GDP grew 5.8% YoY, supported mainly by private sector spending. As a result of stronger imports, the current account surplus narrowed to MYR5.3b in 1Q2017. For the whole of 2017, Bank Negara Malaysia (“BNM”) expects our current account surplus to remain positive albeit narrowing YoY. Malaysia’s Consumer Price Index (“CPI”) surged to a high of 5.1% YoY in March 2017 due to the impact of the two 20 cent price hikes on RON95 in January and February. However, it has subsequently moderated down to 4.4% YoY in April and 3.9% YoY in May in line with the drop-in retail petrol prices. BNM foreign reserves stood at USD98.7b as at mid-June 2017. This was after 6 consecutive months of increase, aided by a reversal of foreign flows in Malaysia’s bond market as foreign funds bought +RM10.1b in May and +RM6.8b in April respectively. The reserves are equivalent to 8.1 months of retained imports and provide a 1.1 times coverage of short-term external debt. During the financial year S&P reaffirmed Malaysia at A-/Sta on expectations of continued prudence by the Government in undertaking Malaysia’s economic and budgetary policies. Nevertheless, S&P did raise concerns on the country’s high household debt as well as uncertainty in refinancing cost amidst negative news flow from 1MDB. The Federal Reserve hiked rates 3 times during the financial year, hiking by 25bps each during its December, March and June meetings.
Market Outlook
The two main takeaways from the US FOMC (“Fed”) meeting in September 2017, was that the Fed would finally start the rollback of its balance sheet via the BSR program but more importantly, members of the Fed saw no reason yet to waver from the forecast of another rate hike for the year. As such, the futures market reacted swiftly with implied probability of a rate hike in December 2017 pushed up to above 65% from around 45% previously. The possibility of another rate hike and the escalation of rhetoric’s between North Korea and the United States would likely keep markets on the defensive in the near term. Domestically, Malaysia’s strong growth of 5.7% YoY in 1H2017 will likely see the Government announcing a higher full year 2017 GDP growth forecast in the upcoming budget to be tabled on the 27 October 2017. With stronger revenue from GST collection and generally higher commodities prices, the Government’s fiscal deficit of 3.0% is expected to be met comfortably if not

44
exceeded. We opine that BNM will maintain the OPR at 3.0% while it continues to assess the balance of risks surrounding domestic growth and inflation. The 2Q2017 GDP growth of 5.8% lends credence to BNM’s monetary policy. Also, given that the general election is now likely to be pushed back to 2018, the budget would likely be election focused. An expansionary budget targeting on specific assistance to the lower and middle-income segments while addressing cost of living and affordable housing issues will be on the agenda. At the same time and with an eye towards balancing the budget deficit by 2020, the Government is expected to introduce measures to expand exports, improve the current account balance and widen the tax base to include foreign digital service providers. With no significant surprises expected from Budget 2018, any reaction from the bond market is likely to be muted. The final monetary policy meeting scheduled for 8 - 9 November is not likely to yield any surprise given BNM’s neutral stance. As such, we believe that external events and factors would likely be the key driver for the local bond market in the coming months. In the bond and Sukuk market, the return of net portfolio inflows has been beneficial to Ringgit and hence the sovereign sukuk market. While there may be maturity-driven outflows, indications are that it will be manageable as the positive sentiment on Ringgit will likely attract rollovers positions. Nevertheless, we remain cautious as we head into the final quarter of 2017. The possibility of headwinds from further hawkish comments from the central banks in US, UK and the ECB does increase the potential for a reversal in risk-on sentiment and trigger a correction in Emerging Markets, including Malaysia.
Additional Information
Following the renewal of the Master Prospectus effective from 10 September 2017, the “Counterparty Credit Risk” has been included on page 43 as the inclusion in the Fund explicitly describes the risk in counterparty dealing instead of issuer/obligor credit. The insertion of this risk is for clarity purposes. Counterparty Credit Risk Counterparty credit risk is the risk arising from the possibility that the counterparty may default or not able to fulfill a trade settlement prior or on the settlement date of the trade. This could adversely affect the value of the Fund. For more details, kindly refer to the Master Prospectus dated 10 September 2017.
Kuala Lumpur, Malaysia AmFunds Management Berhad 7 November 2017

Independent auditors’ report to the unitholders of AmBon Islam
Report on the audit of the financial statements
Opinion
Basis for opinion
Independence and other ethical responsibilities
Information other than the financial statements and auditors’ report thereon
We have audited the financial statements of AmBon Islam (“the Fund”), which comprise thestatement of financial position as at 30 September 2017, and the statement of comprehensiveincome, statement of changes in equity and statement of cash flows for the year then ended, andnotes to the financial statements, including a summary of significant accounting policies, as set outon pages 48 to 72.
In our opinion, the accompanying financial statements give a true and fair view of the financialposition of the Fund as at 30 September 2017 and of its financial performance and its cash flows forthe year then ended in accordance with Malaysian Financial Reporting Standards and InternationalFinancial Reporting Standards.
We conducted our audit in accordance with approved standards on auditing in Malaysia andInternational Standards on Auditing. Our responsibilities under those standards are further describedin the Auditor’s Responsibilities for the Audit of the Financial Statements section of our report. Webelieve that the audit evidence we have obtained is sufficient and appropriate to provide a basis forour opinion.
We are independent of the Fund in accordance with the By-Laws (on Professional Ethics, Conductand Practice) of the Malaysian Institute of Accountants (“By-Laws”) and the International EthicsStandards Board for Accountants’ Code of Ethics for Professional Accountants (“IESBA Code”),and we have fulfilled our other ethical responsibilities in accordance with the By-Laws and theIESBA Code.
The Manager is responsible for the other information. The other information comprises informationin the Annual Report, but does not include the financial statements of the Fund and our auditors’report thereon.
Our opinion on the financial statements of the Fund does not cover the other information and we donot express any form of assurance conclusion thereon.
In connection with our audit of the financial statements of the Fund, our responsibility is to read theother information and, in doing so, consider whether the other information is materially inconsistentwith the financial statements of the Fund or our knowledge obtained in the audit or otherwiseappears to be materially misstated.
45

Independent auditors’ report to the unitholders of AmBon Islam(cont’d.)
Responsibilities of the Manager and the Trustees for the financial statements
Auditor’s responsibilities for the audit of the financial statements
As part of an audit in accordance with the approved standards on auditing in Malaysia andInternational Standards on Auditing, we exercise professional judgment and maintain professionalskepticism throughout the planning and performance of the audit. We also:
Identify and assess the risks of material misstatement of the financial statements of the Fund,whether due to fraud or error, design and perform audit procedures responsive to those risks,and obtain audit evidence that is sufficient and appropriate to provide a basis for our opinion.The risk of not detecting a material misstatement resulting from fraud is higher than for oneresulting from error, as fraud may involve collusion, forgery, intentional omissions,misrepresentations, or the override of internal control.
Obtain an understanding of internal control relevant to the audit in order to design auditprocedures that are appropriate in the circumstances, but not for the purpose of expressing anopinion on the effectiveness of the Fund’s internal control.
Our objectives are to obtain reasonable assurance about whether the financial statements of the Fund,as a whole are free from material misstatement, whether due to fraud or error, and to issue anauditors’ report that includes our opinion. Reasonable assurance is a high level of assurance, but isnot a guarantee that an audit conducted in accordance approved standards on auditing in Malaysiaand International Standards on Auditing will always detect a material misstatement when it exists.Misstatements can arise from fraud or error and are considered material if, individually or in theaggregate, they could reasonably be expected to influence the economic decisions of users taken onthe basis of these financial statements.
If based on the work we have performed, we conclude that there is a material misstatement of thisother information, we are required to report that fact. We have nothing to report in this regard.
The Manager is responsible for the preparation of the financial statements of the Fund that give atrue and fair view in accordance with Malaysian Financial Reporting Standards and InternationalFinancial Reporting Standards. The Manager is also responsible for such internal control as theManager determines is necessary to enable the preparation of financial statements of the Fund thatare free from material misstatement, whether due to fraud or error.
In preparing the financial statements of the Fund, the Manager is responsible for assessing theFund’s ability to continue as a going concern, disclosing, as applicable, matters related to goingconcern and using the going concern basis of accounting unless the Manager either intends toliquidate the Fund or to cease operations, or has no realistic alternative to do so.
The Trustee is responsible for ensuring that the Manager maintains proper accounting and otherrecords as are necessary to enable true and fair presentation of these financial statements.
46

Independent auditors’ report to the unitholders of AmBon Islam(cont’d.)
Other matters
Ernst & Young Wan Daneena Liza Bt Wan Abdul RahmanAF: 0039 No. 2978/03/18(J)Chartered Accountants Chartered Accountant
Kuala Lumpur, Malaysia7 November 2017
We communicate with the Manager regarding, among other matters, the planned scope and timing ofthe audit and significant audit findings, including any significant deficiencies in internal control thatwe identify during our audit.
This report is made solely to the unitholders of the Fund, as a body, and for no other purpose. We donot assume responsibility to any other person for the content of this report.
Evaluate the appropriateness of accounting policies used and the reasonableness ofaccounting estimates and related disclosures made by the Manager.
Conclude on the appropriateness of the Manager’s use of the going concern basis ofaccounting and, based on the audit evidence obtained, whether a material uncertainty existsrelated to events or conditions that may cast significant doubt on the Fund’s ability tocontinue as a going concern. If we conclude that a material uncertainty exists, we arerequired to draw attention in our auditors’ report to the related disclosures in the financialstatements or, if such disclosures are inadequate, to modify our opinion. Our conclusions arebased on the audit evidence obtained up to the date of our auditors’ report. However, futureevents or conditions may cause the Fund to cease to continue as a going concern.
Evaluate the overall presentation, structure and content of the financial statements of theFund, including the disclosures, and whether the financial statements of the Fund representthe underlying transactions and events in a manner that achieves fair presentation.
47

AmBon Islam
STATEMENT OF FINANCIAL POSITIONAS AT 30 SEPTEMBER 2017
2017 2016Note RM RM
ASSETSShariah-compliant investments 4 44,154,998 34,238,067 Deposits with financial institutions 5 1,962,483 - Cash at banks 1,344 7,654,870
TOTAL ASSETS 46,118,825 41,892,937
LIABILITIESNet amount due to Manager 6 67,280 3,762,099 Amount due to Trustee 7 2,709 2,481 Distribution payable - 6,963 Sundry payables and accrued expenses 29,719 27,740
TOTAL LIABILITIES 99,708 3,799,283
EQUITYUnitholders’ capital 10(a) 43,051,787 35,751,933 Retained earnings 10(b)(c) 2,967,330 2,341,721
TOTAL EQUITY 10 46,019,117 38,093,654
TOTAL EQUITY AND LIABILITIES 46,118,825 41,892,937
UNITS IN CIRCULATION 10(a) 36,501,065 30,611,886
NET ASSET VALUE PER UNIT 126.08 sen 124.44 sen
The accompanying notes form an integral part of the financial statements.
‒ EX DISTRIBUTION
48

AmBon Islam
STATEMENT OF COMPREHENSIVE INCOMEFOR THE FINANCIAL YEAR ENDED 30 SEPTEMBER 2017
2017 2016Note RM RM
SHARIAH-COMPLIANT INVESTMENTINCOME/(LOSS)
Profit income 2,302,100 1,981,958 Net (loss)/gain from Shariah-compliant investments:− Financial assets at fair value through profit or loss (“FVTPL”) 8 (44,684) 1,104,563
Gross Income 2,257,416 3,086,521
EXPENDITUREManager’s fee 6 (462,797) (398,067)Trustee’s fee 7 (32,396) (27,865)Auditors’ remuneration − current financial year (9,500) (8,500)Auditors’ remuneration − underprovision in prior
financial year (1,000) - Tax agent’s fee (4,100) (4,000)Other expenses 9 (35,028) (34,346)
Total Expenditure (544,821) (472,778)
NET INCOME BEFORE TAX 1,712,595 2,613,743 LESS: INCOME TAX 12 - -
NET INCOME AFTER TAX 1,712,595 2,613,743
OTHER COMPREHENSIVE INCOME - -
TOTAL COMPREHENSIVE INCOME FOR THEFINANCIAL YEAR 1,712,595 2,613,743
Total comprehensive income comprises the following: Realised income 1,786,461 1,896,238 Unrealised (loss)/gain (73,866) 717,505
1,712,595 2,613,743
Distributions for the financial year:Net distributions 13 1,086,986 2,008,246
Gross/net distributions per unit (sen) 13 3.00 6.00
The accompanying notes form an integral part of the financial statements.
49

AmBon Islam
STATEMENT OF CHANGES IN EQUITYFOR THE FINANCIAL YEAR ENDED 30 SEPTEMBER 2017
Unitholders’ Retained Total capital earnings equity
Note RM RM RM
At 1 October 2015 38,336,399 1,736,224 40,072,623 Total comprehensive income for
the financial year - 2,613,743 2,613,743 Creation of units 10(a) 40,046,429 - 40,046,429 Reinvestments of distributions 10(a),13 1,994,741 - 1,994,741 Cancellation of units 10(a) (44,625,636) - (44,625,636)Distributions 13 - (2,008,246) (2,008,246)
Balance at 30 September 2016 35,751,933 2,341,721 38,093,654
At 1 October 2016 35,751,933 2,341,721 38,093,654 Total comprehensive income for
the financial year - 1,712,595 1,712,595 Creation of units 10(a) 25,188,556 - 25,188,556 Reinvestments of distributions 10(a),13 1,081,215 - 1,081,215 Cancellation of units 10(a) (18,969,917) - (18,969,917)Distributions 13 - (1,086,986) (1,086,986)
Balance at 30 September 2017 43,051,787 2,967,330 46,019,117
The accompanying notes form an integral part of the financial statements.
50

AmBon Islam
STATEMENT OF CASH FLOWSFOR THE FINANCIAL YEAR ENDED 30 SEPTEMBER 2017
2017 2016Note RM RM
CASH FLOWS FROM OPERATING ANDINVESTING ACTIVITIES
Proceeds from maturity/sale of Shariah-compliant investments 5,119,800 23,394,050
Profit received 2,485,285 2,160,730 Manager’s fee paid (456,914) (397,060)Trustee’s fee paid (32,168) (27,794)Tax agent’s fee paid (4,000) (4,000)Payments for other expenses (43,649) (46,985)Purchase of Shariah-compliant investments (15,264,600) (30,128,520)
Net cash used in operating and investing activities (8,196,246) (5,049,579)
CASH FLOWS FROM FINANCING ACTIVITIES Proceeds from creation of units 25,240,332 40,599,316 Payments for cancellation of units (22,722,395) (41,260,435)Distributions paid (12,734) (10,047)
Net cash generated from/(used in) financing activities 2,505,203 (671,166)
NET DECREASE IN CASH AND CASH EQUIVALENTS (5,691,043) (5,720,745)CASH AND CASH EQUIVALENTS AT
BEGINNING OF FINANCIAL YEAR 7,654,870 13,375,615
CASH AND CASH EQUIVALENTS AT END OF FINANCIAL YEAR 1,963,827 7,654,870
Cash and cash equivalents comprise:Deposits with financial institutions 5 1,962,483 - Cash at banks 1,344 7,654,870
1,963,827 7,654,870
The accompanying notes form an integral part of the financial statements.
51

AmBon Islam
NOTES TO THE FINANCIAL STATEMENTS
1. GENERAL INFORMATION
2. BASIS OF PREPARATION OF FINANCIAL STATEMENTS
Standards effective during the financial year
Standards issued but not yet effective
Effective for financial periods
beginning on or after
MFRS 9: Financial InstrumentsMFRS 15: Revenue From Contracts With Customers
AmBon Islam (“the Fund”) was established pursuant to a Deed dated 30 October 2001 as amendedby Deeds Supplemental thereto (“the Deed”), between AmFunds Management Berhad as theManager, AmanahRaya Trustees Berhad as the Trustee and all unitholders.
The financial statements of the Fund have been prepared in accordance with Malaysian FinancialReporting Standards (“MFRS”) as issued by the Malaysian Accounting Standards Board (“MASB”)and are in compliance with International Financial Reporting Standards.
The financial statements of the Fund have been prepared under the historical cost convention, unlessotherwise stated in the accounting policies.
The adoption of MFRS which have been effective during the financial year did not have anymaterial financial impact to the financial statements.
As at the date of authorisation of these financial statements, the following Standards, which arerelevant to the Fund, have been issued by MASB but are not yet effective and have not been adoptedby the Fund.
1 January 2018
The Fund plans to adopt the above pronouncements when they become effective in the respectivefinancial periods. These pronouncements are expected to have no significant impact to the financialstatements of the Fund upon their initial application except as described below:
1 January 2018
The Fund aims to provide investors with a consistent stream of “halal income”, derived frominvestments based on Principles of Shariah. As provided in the Deed, the financial year shall end on30 September and the units in the Fund were first offered for sale on 26 November 2001.
52

MFRS 9 Financial Instruments
3. SIGNIFICANT ACCOUNTING POLICIES
Income recognition
Income tax
Functional and presentation currency
Statement of cash flows
The Fund adopts the direct method in the preparation of the statement of cash flows.
Distribution
Income is recognised to the extent that it is probable that the economic benefits will flow to theFund and the income can be reliably measured. Income is measured at the fair value ofconsideration received or receivable.
Cash equivalents are short-term, highly liquid Shariah-compliant investments that are readilyconvertible to cash with insignificant risk of changes in value.
Distributions are at the discretion of the Fund. A distribution to the Fund’s unitholders is accountedfor as a deduction from realised reserves. A proposed distribution is recognised as a liability in theperiod in which it is approved.
Profit income on Shariah-compliant fixed income securities and Islamic short-term deposits arerecognised on an accrual basis using the effective profit method, which includes the accretion ofdiscounts and amortisation of premiums.
Current taxes are recognised in profit or loss except to the extent that the tax relates to itemsrecognised outside profit or loss, either in other comprehensive income or directly in equity.
Functional currency is the currency of the primary economic environment in which the Fundoperates that most faithfully represents the economic effects of the underlying transactions. Thefunctional currency of the Fund is Ringgit Malaysia which reflects the currency in which the Fundcompetes for funds, issues and redeems units. The Fund has also adopted Ringgit Malaysia as itspresentation currency.
Current tax assets and liabilities are measured at the amount expected to be recovered from or paidto the tax authorities. The tax rates and tax laws used to compute the amount are those that areenacted or substantively enacted at the reporting date.
MFRS 9 reflects International Accounting Standards Board’s (“IASB”) work on the replacement ofMFRS 139 Financial Instruments: Recognition and Measurement (“MFRS 139”). MFRS 9 will beeffective for financial year beginning on or after 1 January 2018. The Fund is in the process ofquantifying the impact of the first adoption of MFRS 9.
53

Unitholders’ capital
Financial assets
(i) Financial assets at FVTPL
(ii) Receivables
Financial assets with fixed or determinable payments that are not quoted in an active market areclassified as receivables.
Financial assets are classified as financial assets at FVTPL if they are held for trading or aredesignated as such upon initial recognition. Financial assets held for trading by the Fund includeShariah-compliant fixed income securities acquired principally for the purpose of selling in thenear term.
When financial assets are recognised initially, they are measured at fair value, plus, in the case offinancial assets not at fair value through profit or loss, directly attributable transaction costs.
Financial assets are recognised in the statement of financial position when, and only when, the Fundbecomes a party to the contractual provisions of the financial instrument.
The Fund determines the classification of its financial assets at initial recognition, and the categoriesapplicable to the Fund include financial assets at fair value through profit or loss (“FVTPL”) andreceivables.
For Shariah-compliant investments in local fixed income securities, fair value is determinedbased on the indicative prices from Bond Pricing Agency Malaysia Sdn Bhd plus accrued profit,which includes the accretion of discount and amortisation of premium. Adjusted cost of Shariah-compliant investments relates to the purchase cost plus accrued profit, adjusted for amortisationof premium and accretion of discount, if any, calculated over the period from the date ofacquisition to the date of maturity of the respective securities as approved by the Manager andthe Trustee. Unrealised gains or losses recognised in profit or loss are not distributable in nature.
On disposal of Shariah-compliant investments, the net realised gain or loss on disposal ismeasured as the difference between the net disposal proceeds and the carrying amount of theShariah-compliant investments. The net realised gain or loss is recognised in profit or loss.
The unitholders’ capital of the Fund meets the definition of puttable instruments and is classified asequity instruments under MFRS 132 Financial Instruments: Presentation (“MFRS 132”).
Subsequent to initial recognition, financial assets at FVTPL are measured at fair value. Changesin the fair value of those financial instruments are recorded in ‘Net gain or loss on financialassets at fair value through profit or loss’. Profit earned element of such instrument is recordedseparately in ‘Profit income’.
Subsequent to initial recognition, receivables are measured at amortised cost using the effectiveprofit method. Gains and losses are recognised in profit or loss when the receivables arederecognised or impaired, and through the amortisation process.
54

Impairment of financial assets
(i) Receivables carried at amortised cost
Financial liabilities
Classification of realised and unrealised gains and losses
The Fund’s financial liabilities are recognised initially at fair value plus directly attributabletransaction costs and subsequently measured at amortised cost using the effective profit method.
To determine whether there is objective evidence that an impairment loss on financial assets hasbeen incurred, the Fund considers factors such as the probability of insolvency or significantfinancial difficulties of the debtor and default or significant delay in payments.
Financial liabilities are classified according to the substance of the contractual arrangements enteredinto and the definitions of a financial liability.
If in a subsequent period, the amount of the impairment loss decreases and the decrease can berelated objectively to an event occurring after the impairment was recognised, the previouslyrecognised impairment loss is reversed to the extent that the carrying amount of the asset doesnot exceed its amortised cost at the reversal date. The amount of reversal is recognised in profitor loss.
The Fund assesses at each reporting date whether there is any objective evidence that a financialasset is impaired.
Unrealised gains and losses comprise changes in the fair value of financial instruments for theperiod and from reversal of prior period’s unrealised gains and losses for financial instrumentswhich were realised (i.e. sold, redeemed or matured) during the reporting period.
A financial liability is derecognised when the obligation under the liability is extinguished. Gainsand losses are recognised in profit or loss when the liabilities are derecognised, and through theamortisation process.
Financial liabilities, within the scope of MFRS 139, are recognised in the statement of financialposition when, and only when, the Fund becomes a party to the contractual provisions of thefinancial instrument.
If any such evidence exists, the amount of impairment loss is measured as the differencebetween the asset’s carrying amount and the present value of estimated future cash flowsdiscounted at the financial asset’s original effective profit rate. The impairment loss isrecognised in profit or loss.
The carrying amount of the financial asset is reduced through the use of an allowance account.When a receivable become uncollectible, it is written off against the allowance account.
55

Significant accounting estimates and judgments
4. SHARIAH-COMPLIANT INVESTMENTS
2017 2016RM RM
Financial assets at FVTPL
At nominal value:Corporate sukuk 41,150,000 31,000,000
At fair value:Corporate sukuk 44,154,998 34,238,067
Details of Shariah-compliant investments as at 30 September 2017 are as follows:
Fairvalue as a
percentage ofMaturity Credit Nominal Fair Adjusted net asset
date Issuer rating value value cost valueRM RM RM %
Corporate sukuk
27.07.2018 Besraya (M) Sdn Bhd AA 1,000,000 1,011,858 1,009,792 2.20
(Forward)
Realised gains and losses on disposals of financial instruments classified at fair value through profitor loss are calculated using the weighted average method. They represent the difference between aninstrument’s initial carrying amount and disposal amount.
The preparation of the Fund’s financial statements requires the Manager to make judgments,estimates and assumptions that affect the reported amounts of revenues, expenses, assets andliabilities, and the disclosure of contingent liabilities at the reporting date. However, uncertaintyabout these assumptions and estimates could result in outcomes that could require a materialadjustment to the carrying amount of the asset or liability in the future.
The Fund classifies its Shariah-compliant investments as financial assets at FVTPL as the Fund maysell its Shariah-compliant investments in the short-term for profit-taking or to meet unitholders’cancellation of units.
No major judgments have been made by the Manager in applying the Fund’s accounting policies.There are no key assumptions concerning the future and other key sources of estimation uncertaintyat the reporting date, that have a significant risk of causing a material adjustment to the carryingamounts of assets and liabilities within the next financial year.
56

Fairvalue as a
percentage ofMaturity Credit Nominal Fair Adjusted net asset
date Issuer rating value value cost valueRM RM RM %
Corporate sukuk
23.01.2019 Mudajaya Corporation Berhad A 4,000,000 3,979,930 4,044,266 8.65
02.09.2019 Bumitama Agri Ltd AA 1,500,000 1,519,413 1,507,533 3.30
25.09.2019 CIMB Islamic Bank Berhad AA 2,000,000 2,060,107 2,050,650 4.48
27.12.2019 BGSMManagement Sdn Bhd AA 2,500,000 2,658,143 2,644,794 5.77
15.04.2020 DRB-Hicom Berhad A 2,000,000 2,050,539 2,045,664 4.45
15.05.2020 KT Kira Sertifikalari Varlik Kiralama A.S. AA 2,000,000 2,056,173 2,043,560 4.47
19.05.2020 Special Power Vehicle Berhad A 1,500,000 2,180,015 2,149,784 4.74
21.05.2020 TF Varlik Kiralama A.S. AA 2,000,000 2,039,574 2,041,274 4.43
19.05.2021 Special Power Vehicle Berhad A 1,000,000 1,576,394 1,245,507 3.43
25.11.2021 Bank Muamalat Malaysia Berhad A 2,000,000 2,058,929 2,037,850 4.47
29.08.2022 Celcom Networks Sdn Bhd AA 1,000,000 1,011,102 1,005,612 2.20
10.11.2023 Jimah Energy Ventures Sdn Bhd AA 500,000 652,829 635,956 1.42
(Forward)
57

Fairvalue as a
percentage ofMaturity Credit Nominal Fair Adjusted net asset
date Issuer rating value value cost valueRM RM RM %
Corporate sukuk
10.12.2024 Malaysia Building Society Berhad AA 1,500,000 1,531,832 1,530,149 3.33
03.05.2027 YTL Power International Berhad AA 1,000,000 1,032,913 1,020,753 2.24
09.12.2027 First Abu Dhabi BankPJSC (FkaNational Bank of Abu Dhabi P.J.S.C.) AA 3,500,000 3,548,282 3,549,647 7.71
16.03.2028 Tanjung Bin Energy Issuer Berhad AA 1,500,000 1,618,870 1,583,554 3.52
28.07.2028 Besraya (M) Sdn Bhd AA 2,000,000 2,106,923 2,089,969 4.58
01.12.2028 Konsortium Lebuhraya Utara-Timur (Kl) Sdn Bhd AA 1,650,000 1,664,382 1,665,915 3.62
15.09.2031 Tanjung Bin Energy Issuer Berhad AA 1,500,000 1,661,868 1,633,952 3.61
04.12.2031 Jimah East Power Sdn Bhd AA 2,000,000 2,273,188 2,176,277 4.94
16.03.2032 Tanjung Bin Energy Issuer Berhad AA 500,000 555,199 544,447 1.21
(Forward)
58

Fairvalue as a
percentage ofMaturity Credit Nominal Fair Adjusted net asset
date Issuer rating value value cost valueRM RM RM %
Corporate sukuk
23.08.2035 Lebuhraya Duke Fasa 3 Sdn Bhd AA 3,000,000 3,306,535 3,084,800 7.18
Total financial assets at FVTPL 41,150,000 44,154,998 43,341,705 95.95
Excess of fair value over cost 813,293
The weighted average effective yield on unquoted Shariah-compliant investments are as follows:
2017 2016% %
Corporate sukuk 5.15 5.12
Less than 1 year to More than 1 year 5 years 5 years
RM RM RM
2017At nominal value:Corporate sukuk 1,000,000 21,500,000 18,650,000
2016At nominal value:Corporate sukuk - 15,500,000 15,500,000
Effective yield
Analyses of the remaining maturity of unquoted Shariah-compliant investments as at 30 September2017 and 30 September 2016 are as follows:
59
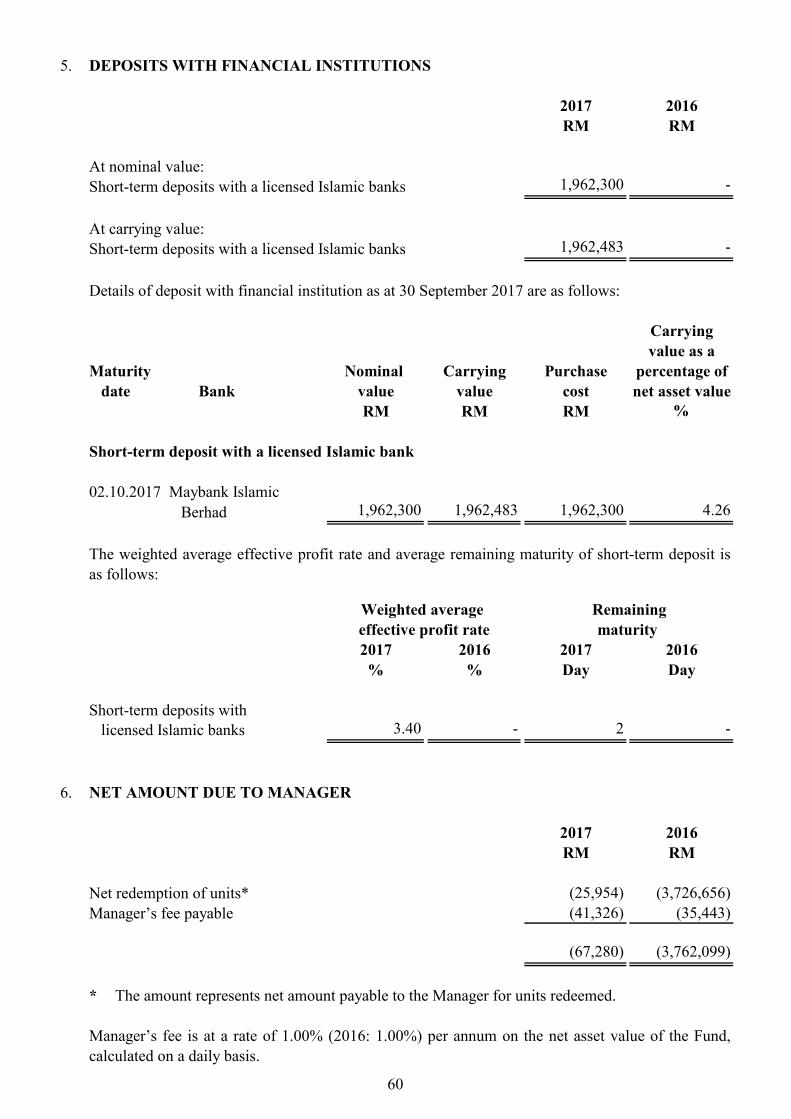
5. DEPOSITS WITH FINANCIAL INSTITUTIONS
2017 2016RM RM
At nominal value:Short-term deposits with a licensed Islamic banks 1,962,300 -
At carrying value:Short-term deposits with a licensed Islamic banks 1,962,483 -
Details of deposit with financial institution as at 30 September 2017 are as follows:
Carryingvalue as a
Maturity Nominal Carrying Purchase percentage ofdate Bank value value cost net asset value
RM RM RM %
Short-term deposit with a licensed Islamic bank
02.10.2017 Maybank IslamicBerhad 1,962,300 1,962,483 1,962,300 4.26
2017 2016 2017 2016% % Day Day
Short-term deposits with licensed Islamic banks 3.40 - 2 -
6. NET AMOUNT DUE TO MANAGER
2017 2016RM RM
Net redemption of units* (25,954) (3,726,656)Manager’s fee payable (41,326) (35,443)
(67,280) (3,762,099)
* The amount represents net amount payable to the Manager for units redeemed.
Weighted average
The weighted average effective profit rate and average remaining maturity of short-term deposit isas follows:
effective profit rate maturity
Manager’s fee is at a rate of 1.00% (2016: 1.00%) per annum on the net asset value of the Fund,calculated on a daily basis.
Remaining
60

7. AMOUNT DUE TO TRUSTEE
8. NET (LOSS)/GAIN FROM SHARIAH-COMPLIANT INVESTMENTS
2017 2016RM RM
Net (loss)/gain on financial assets at FVTPL comprised:− Net realised gain on sale of Shariah-compliant
investments 29,182 387,058 − Net unrealised (loss)/gain on changes in fair values of
Shariah-compliant investments (73,866) 717,505
(44,684) 1,104,563
9. OTHER EXPENSES
10. TOTAL EQUITY
Total equity is represented by:
2017 2016Note RM RM
Unitholders’ capital (a) 43,051,787 35,751,933 Retained earnings− Realised income (b) 2,154,037 1,454,562 − Unrealised gain (c) 813,293 887,159
46,019,117 38,093,654
The normal credit period in the previous and current financial years for Manager’s fee payable isone month.
The normal credit period in the previous and current financial years for redemption and creation ofunits is three business days.
Trustee’s fee is at a rate of 0.07% (2016: 0.07%) per annum on the net asset value of the Fund,calculated on a daily basis.
Included in other expenses is Goods and Services Tax incurred by the Fund during the financial yearamounting to RM30,835 (2016: RM27,666).
The normal credit period in the previous and current financial years for Trustee’s fee payable is onemonth.
61

(a) UNITHOLDERS’ CAPITAL/UNITS IN CIRCULATION
Number of Number of units RM units RM
At beginning of the financial year 30,611,886 35,751,933 32,794,231 38,336,399
Creation during thefinancial year 20,215,783 25,188,556 32,169,820 40,046,429
Distributions reinvested (Note 13) 878,822 1,081,215 1,618,139 1,994,741
Cancellation during the financial year (15,205,426) (18,969,917) (35,970,304) (44,625,636)
At end of the financial year 36,501,065 43,051,787 30,611,886 35,751,933
(b) REALISED – DISTRIBUTABLE
2017 2016RM RM
At beginning of the financial year 1,454,562 1,566,570
Total comprehensive income for the financial year 1,712,595 2,613,743 Net unrealised loss/(gain) attributable to Shariah-compliant
investments held transferred to unrealised reserve [Note 10(c)] 73,866 (717,505)
Distribution out of realised reserve (Note 13) (1,086,986) (2,008,246)
Net increase/(decrease) in realised reserve for thefinancial year 699,475 (112,008)
At end of the financial year 2,154,037 1,454,562
(c) UNREALISED – NON-DISTRIBUTABLE
2017 2016RM RM
At beginning of the financial year 887,159 169,654 Net unrealised (loss)/gain attributable to Shariah-compliant
investments held transferred from realised reserve [Note 10(b)] (73,866) 717,505
At end of the financial year 813,293 887,159
20162017
62
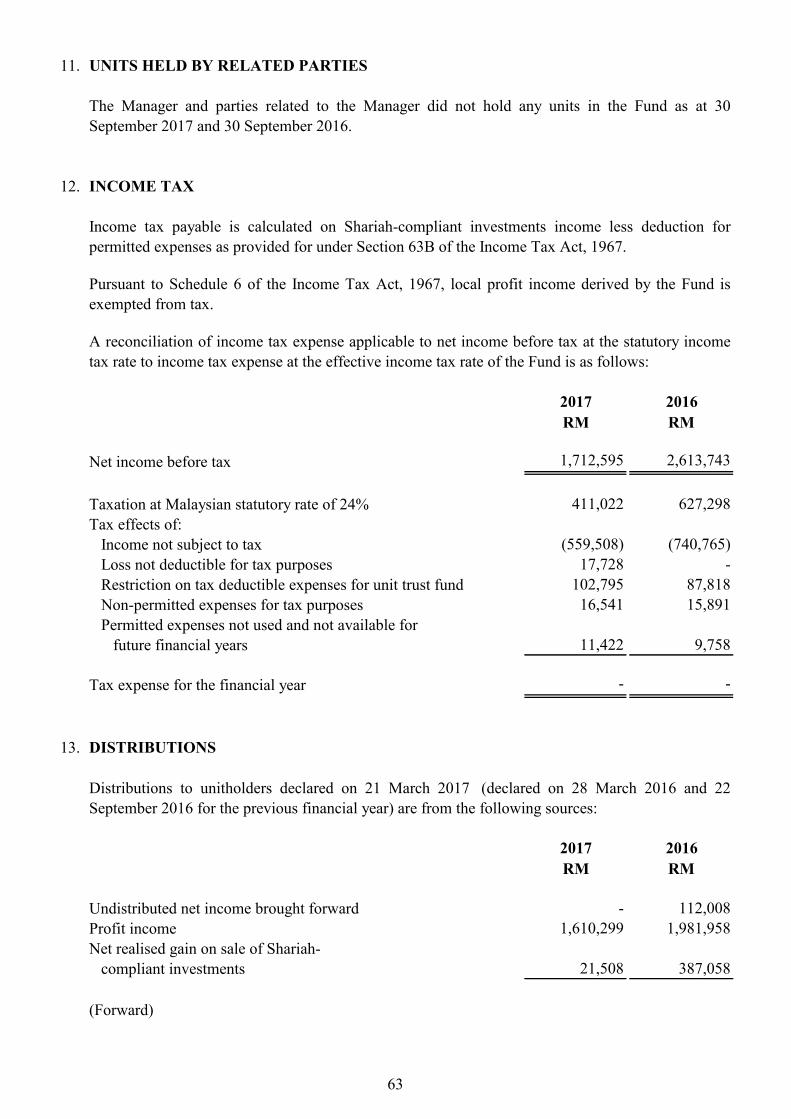
11. UNITS HELD BY RELATED PARTIES
12. INCOME TAX
2017 2016RM RM
Net income before tax 1,712,595 2,613,743
Taxation at Malaysian statutory rate of 24% 411,022 627,298 Tax effects of:
Income not subject to tax (559,508) (740,765)Loss not deductible for tax purposes 17,728 - Restriction on tax deductible expenses for unit trust fund 102,795 87,818 Non-permitted expenses for tax purposes 16,541 15,891 Permitted expenses not used and not available for
future financial years 11,422 9,758
Tax expense for the financial year - -
13. DISTRIBUTIONS
2017 2016RM RM
Undistributed net income brought forward - 112,008 Profit income 1,610,299 1,981,958 Net realised gain on sale of Shariah-
compliant investments 21,508 387,058
(Forward)
The Manager and parties related to the Manager did not hold any units in the Fund as at 30September 2017 and 30 September 2016.
Pursuant to Schedule 6 of the Income Tax Act, 1967, local profit income derived by the Fund isexempted from tax.
A reconciliation of income tax expense applicable to net income before tax at the statutory incometax rate to income tax expense at the effective income tax rate of the Fund is as follows:
Distributions to unitholders declared on 21 March 2017 (declared on 28 March 2016 and 22September 2016 for the previous financial year) are from the following sources:
Income tax payable is calculated on Shariah-compliant investments income less deduction forpermitted expenses as provided for under Section 63B of the Income Tax Act, 1967.
63

2017 2016RM RM
1,631,807 2,481,024 Less: Expenses (544,821) (472,778)
Total amount of distributions 1,086,986 2,008,246
Gross/net distributions per unit (sen) 3.00 6.00
Distributions made out of:− Realised reserve [Note 10(b)] 1,086,986 2,008,246
Comprising:Distributions reinvested [Note10(a)] 1,081,215 1,994,741 Distributions payable - 6,963 Cash distributions 5,771 6,542
1,086,986 2,008,246
14. MANAGEMENT EXPENSE RATIO (“MER”)
The Fund’s MER is as follows:
2017 2016% p.a. % p.a.
Manager’s fee 1.00 1.00 Trustee’s fee 0.07 0.07 Fund’s other expenses 0.11 0.12
Total MER 1.18 1.19
15. PORTFOLIO TURNOVER RATIO (“PTR”)
The PTR of the Fund, which is the ratio of average total acquisitions and disposals of Shariah-compliant investments to the average net asset value of the Fund calculated on a daily basis, is 0.22times (2016: 0.68 times).
The MER of the Fund is the ratio of the sum of annualised fees and expenses incurred by the Fundto the average net asset value of the Fund calculated on a daily basis.
Included in the distribution for the previous financial year ended 30 September 2016 wasRM112,008 distributed from previous financial years’ realised income.
64
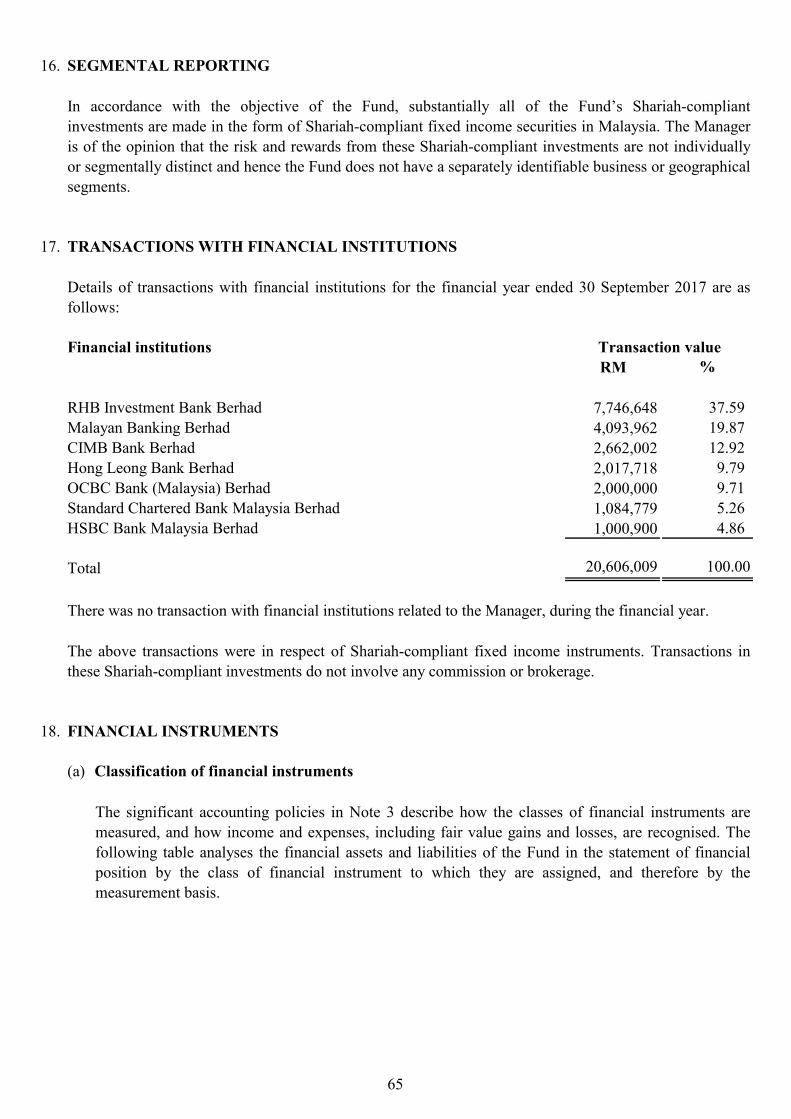
16. SEGMENTAL REPORTING
17. TRANSACTIONS WITH FINANCIAL INSTITUTIONS
Financial institutionsRM %
RHB Investment Bank Berhad 7,746,648 37.59 Malayan Banking Berhad 4,093,962 19.87 CIMB Bank Berhad 2,662,002 12.92 Hong Leong Bank Berhad 2,017,718 9.79 OCBC Bank (Malaysia) Berhad 2,000,000 9.71 Standard Chartered Bank Malaysia Berhad 1,084,779 5.26 HSBC Bank Malaysia Berhad 1,000,900 4.86
Total 20,606,009 100.00
There was no transaction with financial institutions related to the Manager, during the financial year.
18. FINANCIAL INSTRUMENTS
(a) Classification of financial instruments
In accordance with the objective of the Fund, substantially all of the Fund’s Shariah-compliantinvestments are made in the form of Shariah-compliant fixed income securities in Malaysia. The Manageris of the opinion that the risk and rewards from these Shariah-compliant investments are not individuallyor segmentally distinct and hence the Fund does not have a separately identifiable business or geographicalsegments.
Transaction value
Details of transactions with financial institutions for the financial year ended 30 September 2017 are asfollows:
The above transactions were in respect of Shariah-compliant fixed income instruments. Transactions inthese Shariah-compliant investments do not involve any commission or brokerage.
The significant accounting policies in Note 3 describe how the classes of financial instruments aremeasured, and how income and expenses, including fair value gains and losses, are recognised. Thefollowing table analyses the financial assets and liabilities of the Fund in the statement of financialposition by the class of financial instrument to which they are assigned, and therefore by themeasurement basis.
65

Financial Financial Receivables liabilities at
assets at amortised amortisedat FVTPL cost cost Total
RM RM RM RM
2017AssetsShariah-compliant investments 44,154,998 - - 44,154,998 Deposit with financial institution - 1,962,483 - 1,962,483 Cash at banks - 1,344 - 1,344
Total financial assets 44,154,998 1,963,827 - 46,118,825
LiabilitiesNet amount due to Manager - - 67,280 67,280 Amount due to Trustee - - 2,709 2,709 Sundry payables and accrued expenses - - 29,719 29,719
Total financial liabilities - - 99,708 99,708
2016AssetsShariah-compliant investments 34,238,067 - - 34,238,067 Cash at banks - 7,654,870 - 7,654,870
Total financial assets 34,238,067 7,654,870 - 41,892,937
LiabilitiesNet amount due to Manager - - 3,762,099 3,762,099 Amount due to Trustee - - 2,481 2,481 Distribution payable - - 6,963 6,963 Sundry payables and accrued expenses - - 27,740 27,740
Total financial liabilities - - 3,799,283 3,799,283
and losses2017 2016RM RM
Net (loss)/gain from financial assets at FVTPL (44,684) 1,104,563 Income, of which derived from:– Profit income from financial assets at FVTPL 2,133,936 1,793,013 – Profit income from receivables 168,164 188,945
Income, expense, gains
66

(b) Financial instruments that are carried at fair value
Level 1: quoted (unadjusted) prices in active markets for identical assets or liabilities;
Level 2:
Level 3:
Level 1 Level 2 Level 3 TotalRM RM RM RM
Financial assets at FVTPL - 44,154,998 - 44,154,998
Financial assets at FVTPL - 34,238,067 - 34,238,067
(c)
Deposit with financial institution Cash at banks Net amount due to Manager Amount due to Trustee Distributions payable Sundry payables and accrued expenses
19. RISK MANAGEMENT POLICIES
The following are classes of financial instruments that are not carried at fair value and whose carryingamounts are reasonable approximation of fair value due to their short period to maturity or short creditperiod:
2016
The Fund uses the following hierarchy for determining and disclosing the fair value of financialinstruments by valuation technique:
There are no financial instruments which are not carried at fair values and whose carrying amounts arenot reasonable approximation of their respective fair values.
2017
The Fund is exposed to a variety of risks that include market risk, credit risk, liquidity risk, single issuerrisk, regulatory risk, management risk and non-compliance/Shariah non-compliance risk.
other techniques for which all inputs which have a significant effect on the recorded fairvalues are observable; either directly or indirectly; or
techniques which use inputs which have a significant effect on the recorded fair value thatare not based on observable market data.
Financial instruments that are not carried at fair value and whose carrying amounts arereasonable approximation of fair value
The following table shows an analysis of financial instruments recorded at fair value by the level ofthe fair value hierarchy:
The Fund’s financial assets and liabilities at FVTPL are carried at fair value.
67

Market risk
(i) Rate of return risk
Parallel shift in yieldcurve by: 2017 2016
RM RM
+100 bps (2,136,300) (1,927,916)-100 bps 2,354,928 2,139,531
Credit risk
(i) Credit quality of financial assets
Market risk, in general, is the risk that the value of a portfolio would decrease due to changes in marketrisk factors such as equity prices, foreign exchange rates, rate of return (yield curve) and commodityprices.
Risk management is carried out by closely monitoring, measuring and mitigating the above said risks,careful selection of Shariah-compliant investments coupled with stringent compliance to Shariah-complaint investment restrictions as stipulated by the Capital Market and Services Act 2007, SecuritiesCommission’s Guidelines on Unit Trust Funds and the Deed as the backbone of risk management of theFund.
Rate of return risk will affect the value of the Fund’s Shariah-compliant investments, given the rate ofreturn movements, which are influenced by regional and local economic developments as well aspolitical developments.
Domestic profit rate on deposits and placements with licensed financial institutions are determinedbased on prevailing market rates.
The result below summarised the rate of return sensitivity of the Fund’s NAV, or theoretical value(applicable to Islamic money market deposit) due to the parallel movement assumption of the yieldcurve by +100bps and -100bps respectively.
Credit risk is the risk that the counterparty to a financial instrument will cause a financial loss to the Fundby failing to discharge an obligation. The Fund can invest up to 100% of the net asset value in Shariah-compliant fixed income instruments. As such the Fund would be exposed to the risk of sukuk issuers andfinancial institutions defaulting on its repayment obligations which in turn would affect the net asset valueof the Fund.
Sensitivity of the Fund’s NAV, or theoretical value
The following table analyses the Fund’s portfolio of debt securities by rating category as at 30September 2017 and 30 September 2016:
68

As a % of As a % ofdebt net asset
Credit rating RM securities value
2017AA 32,309,191 73.17 70.21 A 11,845,807 26.83 25.74
44,154,998 100.00 95.95
2016AA 26,339,440 76.93 69.15A 7,898,627 23.07 20.73
34,238,067 100.00 89.88
As a % ofAs a % of net asset
Credit rating RM deposit value
2017P1/MARC-1 1,962,483 100.00 4.26
Cash at banks are held for liquidity purposes and are not exposed to significant credit risk.
(ii) Credit risk concentration
As a % of As a % ofdebt net asset
Sector RM securities value
2017Construction and engineering 3,979,930 9.01 8.65 Diversified holdings 6,764,855 15.33 14.70 Financial services 11,238,724 25.45 24.42 Infrastructures and utilities 20,652,076 46.77 44.88 Plantation and agriculture 1,519,413 3.44 3.30
44,154,998 100.00 95.95(Forward)
For deposits with financial institutions, the Fund only makes placements with financial institutionswith sound rating. The following table presents the Fund’s portfolio of deposit by rating category as at30 September 2017:
Concentration of risk is monitored and managed based on sectorial distribution. The table belowanalyses the Fund’s portfolio of Islamic debt securities by sectorial distribution as at 30 September2017 and 30 September 2016:
69

As a % of As a % ofdebt net asset
Sector RM securities value
2016Construction and engineering 3,903,730 11.40 10.25Diversified holdings 5,850,472 17.09 15.36Financial services 7,221,927 21.09 18.96Infrastructures and utilities 15,729,384 45.94 41.29Plantation and agriculture 1,532,554 4.48 4.02
34,238,067 100.00 89.88
There is no geographical risk as the Fund invests only in Shariah-compliant investments in Malaysia.
Liquidity risk
Objectives and assumptions
(i) For sukuk(a) For zero-coupon sukuk, the nominal amount will be returned at maturity date.(b) For coupon-bearing sukuk, the coupons could be paid on annual, bi-annual or quarterly basis.
Cash received from sukuk are calculated as follows:
$ = cash receivedR = coupon rate p.a.F = coupon frequency
For zero coupon sukuk, F = 0 At maturity: $ = Nominal
For F > 0 Before maturity: coupon payment, $ = Nominal * (R/F) At maturity: maturity payment, $ = Nominal + (Nominal * R/F)
Liquidity risk is defined as the risk of being unable to raise funds or borrowing to meet paymentobligations as they fall due. The Fund maintains sufficient level of liquid assets, after consultation with theTrustee, to meet anticipated payments and cancellations of units by unitholders. Liquid assets comprise ofdeposits with licensed financial institutions and other instruments, which are capable of being convertedinto cash within 5 to 7 days. The Fund’s policy is to always maintain a prudent level of liquid assets so asto reduce liquidity risk.
For each security in the Fund, the cash flows are projected according to its asset class. Each assetclass, if any, follows the calculation method as below:
70

(ii) For money market instruments and deposits
$ = cash receivedR = profit rate p.aF = time to maturity (days)At maturity: $ = Nominal + (Nominal*R*F/365)
0 – 1 1 – 2 2 – 3 3 – 4 4 – 5 More thanyear years years years years 5 yearsRM RM RM RM RM RM
2017Financial assetsShariah-compliant
investments 3,680,883 10,042,222 12,176,085 2,403,856 4,146,724 26,368,414Deposit with financial
institution 1,962,848 - - - - - Cash at banks 1,344 - - - - -
Total assets 5,645,075 10,042,222 12,176,085 2,403,856 4,146,724 26,368,414
Financial liabilitiesOther liabilities 99,708 - - - - -
2016Financial assetsShariah-compliant
investments 2,119,611 2,117,012 7,523,473 10,739,533 2,085,354 23,044,955 Cash at banks 7,654,870 - - - - -
Total assets 9,774,481 2,117,012 7,523,473 10,739,533 2,085,354 23,044,955
Financial liabilitiesOther liabilities 3,799,283 - - - - -
Single issuer risk
Internal policy restricts the Fund from investing in securities issued by any issuer of not more than acertain percentage of its net asset value. Under such restriction, the risk exposure to the securities of anysingle issuer is diversified and managed based on internal/external ratings.
Contractual cash flows (undiscounted)
The nominal amount and profit will be paid at maturity date. Cash received are calculated asfollows:
The following table presents the undiscounted contractual cash flows from different asset and liabilityclasses in the Fund:
71

Regulatory risk
Management risk
Non-compliance/Shariah non-compliance risk
20. CAPITAL MANAGEMENT
No changes were made in the objective, policies or processes during the financial years ended 30September 2017 and 30 September 2016.
The primary objective of the Fund’s capital management is to ensure that it maximises unitholders’ valueby expanding its fund size to benefit from economies of scale and achieving growth in net asset value fromthe performance of its Shariah-compliant investments.
Poor management of the Fund may cause considerable losses to the Fund that in turn may affect the netasset value of the Fund.
Any changes in national policies and regulations may have effects on the capital market and the net assetvalue of the Fund.
The Fund manages its capital structure and makes adjustments to it, in light of changes in economicconditions. To maintain or adjust the capital structure, the Fund may issue new or bonus units, makedistribution payment, or return capital to unitholders by way of redemption of units.
This is the risk of the Manager, the Trustee or the Fund not complying with internal policies, the Deed ofthe Fund, securities law or guidelines issued by the regulators. In the case of an Islamic Fund, this includesthe risk of the Fund not conforming to Shariah Investment Guidelines. Non-compliance risk may adverselyaffect the Shariah-compliant investments of the Fund when the Fund is forced to rectify the non-compliance.
72

AmBon Islam
STATEMENT BY THE MANAGER
Kuala Lumpur, Malaysia7 November 2017
I, GOH WEE PENG, for and on behalf of the Manager, AmFunds Management Berhad, for
AmBon Islam do hereby state that in the opinion of the Manager, the accompanying statement of
financial position, statement of comprehensive income, statement of changes in equity, statement of
cash flows and the accompanying notes are drawn up in accordance with Malaysian Financial
Reporting Standards and International Financial Reporting Standards so as to give a true and fair
view of the financial position of the Fund as at 30 September 2017 and the comprehensive income,
the changes in equity and cash flows of the Fund for the financial year then ended.
GOH WEE PENGFor and on behalf of the ManagerAmFunds Management Berhad
73

74
TRUSTEE’S REPORT
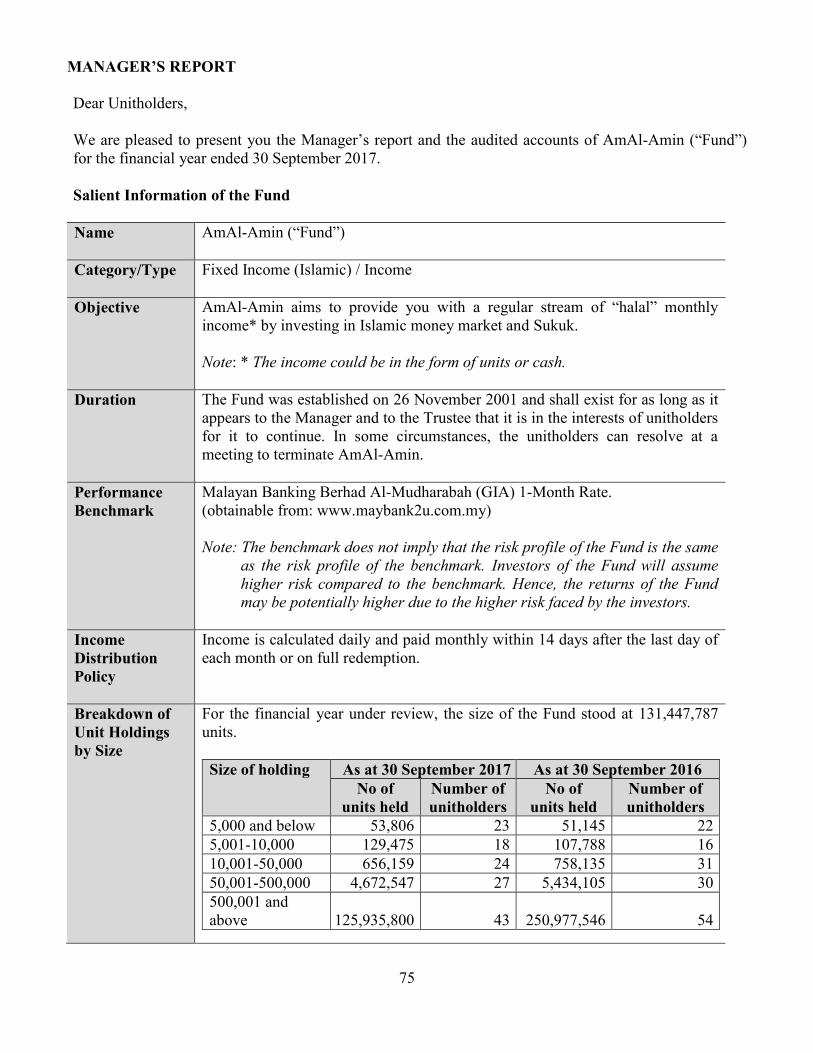
75
MANAGER’S REPORT Dear Unitholders, We are pleased to present you the Manager’s report and the audited accounts of AmAl-Amin (“Fund”) for the financial year ended 30 September 2017. Salient Information of the Fund Name AmAl-Amin (“Fund”)
Category/Type
Fixed Income (Islamic) / Income
Objective AmAl-Amin aims to provide you with a regular stream of “halal” monthly income* by investing in Islamic money market and Sukuk. Note: * The income could be in the form of units or cash.
Duration The Fund was established on 26 November 2001 and shall exist for as long as it appears to the Manager and to the Trustee that it is in the interests of unitholders for it to continue. In some circumstances, the unitholders can resolve at a meeting to terminate AmAl-Amin.
Performance Benchmark
Malayan Banking Berhad Al-Mudharabah (GIA) 1-Month Rate. (obtainable from: www.maybank2u.com.my) Note: The benchmark does not imply that the risk profile of the Fund is the same
as the risk profile of the benchmark. Investors of the Fund will assume higher risk compared to the benchmark. Hence, the returns of the Fund may be potentially higher due to the higher risk faced by the investors.
Income Distribution Policy
Income is calculated daily and paid monthly within 14 days after the last day of each month or on full redemption.
Breakdown of Unit Holdings by Size
For the financial year under review, the size of the Fund stood at 131,447,787 units. Size of holding As at 30 September 2017 As at 30 September 2016
No of units held
Number of unitholders
No of units held
Number of unitholders
5,000 and below 53,806 23 51,145 22 5,001-10,000 129,475 18 107,788 16 10,001-50,000 656,159 24 758,135 31 50,001-500,000 4,672,547 27 5,434,105 30 500,001 and above 125,935,800 43 250,977,546 54

76
Fund Performance Data Portfolio Composition
Details of portfolio composition of the Fund for the financial years as at 30 September are as follows: FY
2017 %
FY 2016 %
FY 2015 %
Corporate sukuk 55.87 60.40 66.04 Cash and others 44.13 39.60 33.96 Total 100.00 100.00 100.00
Note: The abovementioned percentages are calculated based on total net asset value.
Performance Details
Performance details of the Fund for the financial years ended 30 September are as follows: FY
2017 FY
2016 FY
2015 Net asset value (RM)* 133,642,184 259,685,723 334,928,148 Units in circulation* 131,447,787 257,328,719 333,523,662 Net asset value per unit (RM)* (1) 1.0167 1.0092 1.0042 Highest net asset value per unit
(RM)*
1.0167
1.0092 1.0042 Lowest net asset value per unit
(RM)*
1.0072
1.0000 1.0000 Benchmark performance (%) 3.34 3.92 3.25 Total return (%)(2) 3.03 3.21 3.11 - Capital growth (%) - - - - Income distribution (%) 3.03 3.21 3.11 Gross distribution (RM) 5,722,381 9,709,381 13,114,815 Net distribution (RM) 5,722,381 9,709,381 13,114,815 Management expense ratio (%)(3) 0.83 0.77 0.76 Portfolio turnover ratio (times)(4) 0.37 0.30 0.28
* Above price and net asset value per unit are shown as ex-distribution.
Note: (1) With the exemption granted by the authority in relation to determine the unit
pricing of the Fund, subscription/redemption price for the unit of the Fund may differ from the NAV per unit stated above.
(2) Total return is computed based on the income return of the Fund net of all fees.
(3) Management expense ratio (“MER”) is calculated based on the total fees and expenses incurred by the Fund divided by the average fund size calculated on a daily basis. The MER increased by 0.06% as compared to 0.77% per annum for the financial year ended 30 September 2016 mainly

77
due to decrease in average fund size. (4) Portfolio turnover ratio (“PTR”) is calculated based on the average of the
total acquisitions and total disposals of investment securities of the Fund divided by the average fund size calculated on a daily basis. The PTR increased by 0.07 times (23.3%) as compared to 0.30 times for the financial year ended 30 September 2016 mainly due to decrease in average fund size.
Average Total Return (as at 30 September 2017)
AmAl-Amin(a) %
MBB(b) %
One year 3.03 3.34 Three years 3.11 3.50 Five years 2.99 3.21 Ten years 2.81 2.95
Annual Total Return
Financial Years Ended (30 September)
AmAl-Amin(a) %
MBB(b) %
2017 3.03 3.34 2016 3.21 3.92 2015 3.11 3.25 2014 2.79 2.81 2013 2.81 2.75
(a) Source: Novagni Analytics and Advisory Sdn Bhd. (b) Malayan Banking Berhad Al-Mudharabah (GIA) 1-Month Rate (“MBB”)
(Obtainable from: www.maybank2u.com.my). The Fund performance is calculated based on the net asset value per unit of the Fund. Average total return of the Fund and its benchmark for a period is computed based on the absolute return for that period annualised over one year. Note: Past performance is not necessarily indicative of future performance and that unit prices and investment returns may go down, as well as up.
Fund Performance
For the financial year under review, the Fund registered a return of 3.03% which was entirely income distribution in nature. Thus, the Fund’s return of 3.03% has underperformed the benchmark’s return of 3.34% by 0.31%. As compared with the financial year ended 30 September 2016, the net asset value (“NAV”) per unit of the Fund increased by 0.74% from RM1.0092 to RM1.0167, while units in circulations decreased 48.92% from 257,328,719 units to 131,447,787 units. (Forward)

78
The line chart below shows the comparison between the annual performances of AmAl-Amin and its benchmark, MBB, for the financial years ended 30 September.
Note: Past performance is not necessarily indicative of future performance and that unit prices and investment returns may go down, as well as up.
Has the Fund achieved its objective?
The Fund has achieved its objective of providing a regular stream of “halal” monthly income by investing in Islamic money market and Sukuk.
Strategies and Policies Employed
For the financial year under review, the Fund invested primarily in short to medium term debt securities with minimum short-term local credit rating of P2 (by RAM) or MARC 2 (by MARC) or long-term credit rating of A3 (by RAM) or A- (by MARC) that conforms to the principles of Shariah. In buying and selling securities for AmAl-Amin the Investment Manager used a relative value approach. This approach involves an analysis of general economic and market conditions. It also involves the use of models that analyse and compare expected returns and assumed risk. Under this approach, the Investment Manager focused on securities that would deliver favourable return given an acceptable level of risk. The Investment Manager also considered obligations with more favourable or improving credit or industry outlook that provide the potential for capital appreciation. AmAl-Amin’s weighted average maturity of investments would not exceed 1 year.
2.81
2.79
3.11 3.21
3.03
2.75
2.81
3.25
3.92
3.34
1.50
2.00
2.50
3.00
3.50
4.00
Tota
l Ret
urn
(%)
Financial Years Ended (30 September)
MBB
AmAl-Amin

79
Portfolio Structure
This table below is the asset allocation of the Fund for the financial years under review.
As at 30-9-2017
%
As at 30-9-2016
%
Changes
% Corporate sukuk 55.87 60.40 -4.53 Cash and others 44.13 39.60 4.53 Total 100.00 100.00
For the financial year under review, the Fund’s exposure in Corporate Sukuk decrease from 60.04% to 55.87%, while the remaining 44.13% of its NAV in cash and others.
Cross Trades Cross trades are conducted between the Fund and other funds; and private mandates managed by the Manager amounting to: Financial Institutions
Transaction Value (RM)
RHB Investment Bank Berhad 16,957,527.93 Maybank Group 403,803.23 Total 17,361,331.16
Funds
Transaction Value (RM)
Private Mandates managed by the Manager 606,166.30 AmBon Islam 2,034,414.55 AmIslamic Fixed Income Conservative 2,062,306.85 AmIncome Management 5,578,373.59 AmIncome Extra 1,015,412.33 AmIncome 1,007,034.25 AmIncome Plus 5,057,623.29 Total 17,361,331.16
Distribution/ Unit splits
The Fund distributes the entire income on a monthly basis. For the financial year under review, the Fund has distributed income totaling RM5,722,381 and no unit split was declared.
State of Affairs
There has been neither significant changes to the state of affairs of the Fund nor any circumstances that materially affect any interests of the unitholders during the financial year under review.
Rebates and Soft Commission
It is our policy to pay all rebates to the Fund. Soft commission received from brokers/dealers are retained by the Manager only if the goods and services provided are of demonstrable benefit to unitholders of the Fund.

80
During the financial year under review, the Manager had received on behalf of the Fund, soft commissions in the form of fundamental database, financial wire services, technical analysis software and stock quotation system incidental to investment management of the Fund. These soft commissions received by the Manager are deem to be beneficial to the unitholders of the Fund.
Market Review
Malaysian Government Securities (“MGS”) yields rose during the financial year, with the 10Y MGS yield climbing from 3.54% to 3.91%. There was significant volatility in the MGS market, with yields climbing sharply towards the end of 2016 before broadly trending down in 1H2017. The increase in yields was due to a rise in US Treasury yields and a withdrawal of foreign funds from the domestic bond market, foreign holding of Malaysian government debt declined from MYR 185b to 149b during the financial year. Malaysia’s real GDP growth recorded a stronger growth of 5.6% YoY in 1Q2017 (4Q2016: +4.5%), on the back of stronger external activities and domestic demand. 2Q2017 GDP grew 5.8% YoY, supported mainly by private sector spending. As a result of stronger imports, the current account surplus narrowed to MYR5.3b in 1Q2017. For the whole of 2017, Bank Negara Malaysia (“BNM”) expects our current account surplus to remain positive albeit narrowing YoY. Malaysia’s Consumer Price Index (“CPI”) surged to a high of 5.1% YoY in March 2017 due to the impact of the two 20 cent price hikes on RON95 in January and February. However, it has subsequently moderated down to 4.4% YoY in April and 3.9% YoY in May in line with the drop-in retail petrol prices. BNM foreign reserves stood at USD98.7b as at mid-June 2017. This was after 6 consecutive months of increase, aided by a reversal of foreign flows in Malaysia’s bond market as foreign funds bought +RM10.1b in May and +RM6.8b in April respectively. The reserves are equivalent to 8.1 months of retained imports and provide a 1.1 times coverage of short-term external debt. During the financial year S&P reaffirmed Malaysia at A-/Sta on expectations of continued prudence by the Government in undertaking Malaysia’s economic and budgetary policies. Nevertheless, S&P did raise concerns on the country’s high household debt as well as uncertainty in refinancing cost amidst negative news flow from 1MDB. The Federal Reserve hiked rates 3 times during the financial year, hiking by 25bps each during its December, March and June meetings.
Market Outlook
The two main takeaways from the US Federal Open Market Committee (“FOMC”) (“Fed”) meeting in September 2017, was that the Fed would finally start the rollback of its balance sheet via the BSR program but more importantly, members of the Fed saw no reason yet to waver from the forecast of another rate hike for the year. As such, the futures market reacted swiftly with implied probability of a rate hike in December 2017 pushed up to above 65% from around 45% previously. The possibility of another rate hike and the escalation

81
of rhetoric’s between North Korea and the United States would likely keep markets on the defensive in the near term. Domestically, Malaysia’s strong growth of 5.7% YoY in 1H2017 will likely see the Government announcing a higher full year 2017 Gross Domestic Product (“GDP”) growth forecast in the upcoming budget to be tabled on the 27 October 2017. With stronger revenue from GST collection and generally higher commodities prices, the Government’s fiscal deficit of 3.0% is expected to be met comfortably if not exceeded. We opine that BNM will maintain the Overnight Policy Rate (“OPR”) at 3.0% while it continues to assess the balance of risks surrounding domestic growth and inflation. The 2Q2017 GDP growth of 5.8% lends credence to BNM’s monetary policy. Also, given that the general election is now likely to be pushed back to 2018, the budget would likely be election focused. An expansionary budget targeting on specific assistance to the lower and middle-income segments while addressing cost of living and affordable housing issues will be on the agenda. At the same time and with an eye towards balancing the budget deficit by 2020, the Government is expected to introduce measures to expand exports, improve the current account balance and widen the tax base to include foreign digital service providers. With no significant surprises expected from Budget 2018, any reaction from the bond market is likely to be muted. The final monetary policy meeting scheduled for 8 - 9 November is not likely to yield any surprise given BNM’s neutral stance. As such, we believe that external events and factors would likely be the key driver for the local bond market in the coming months. In the bond and Sukuk market, the return of net portfolio inflows has been beneficial to Ringgit and hence the sovereign sukuk market. While there may be maturity-driven outflows, indications are that it will be manageable as the positive sentiment on Ringgit will likely attract rollovers positions. Nevertheless, we remain cautious as we head into the final quarter of 2017. The possibility of headwinds from further hawkish comments from the central banks in US, UK and the ECB does increase the potential for a reversal in risk-on sentiment and trigger a correction in Emerging Markets, including Malaysia.
Additional Information
Following the renewal of the Master Prospectus effective from 10 September 2017, the “Counterparty Credit Risk” has been included on page 42 as the inclusion in the Fund explicitly describes the risk in counterparty dealing instead of issuer/obligor credit. The insertion of this risk is for clarity purposes. Counterparty Credit Risk Counterparty credit risk is the risk arising from the possibility that the counterparty may default or not able to fulfill a trade settlement prior or on the settlement date of the trade. This could adversely affect the value of the Fund.

82
For more details, kindly refer to the Master Prospectus dates 10 September 2017.
Kuala Lumpur, Malaysia AmFunds Management Berhad 7 November 2017

Independent auditors’ report to the unitholders of AmAl-Amin
Report on the audit of the financial statements
Opinion
Basis for opinion
Independence and other ethical responsibilities
Information other than the financial statements and auditors’ report thereon
We have audited the financial statements of AmAl-Amin (“the Fund”), which comprise thestatement of financial position as at 30 September 2017, and the statement of comprehensiveincome, statement of changes in equity and statement of cash flows for the year then ended, andnotes to the financial statements, including a summary of significant accounting policies, as set outon pages 86 to 111.
In our opinion, the accompanying financial statements give a true and fair view of the financialposition of the Fund as at 30 September 2017 and of its financial performance and its cash flows forthe year then ended in accordance with Malaysian Financial Reporting Standards and InternationalFinancial Reporting Standards.
We conducted our audit in accordance with approved standards on auditing in Malaysia andInternational Standards on Auditing. Our responsibilities under those standards are further describedin the Auditor’s Responsibilities for the Audit of the Financial Statements section of our report. Webelieve that the audit evidence we have obtained is sufficient and appropriate to provide a basis forour opinion.
We are independent of the Fund in accordance with the By-Laws (on Professional Ethics, Conductand Practice) of the Malaysian Institute of Accountants (“By-Laws”) and the International EthicsStandards Board for Accountants’ Code of Ethics for Professional Accountants (“IESBA Code”),and we have fulfilled our other ethical responsibilities in accordance with the By-Laws and theIESBA Code.
The Manager is responsible for the other information. The other information comprises informationin the Annual Report, but does not include the financial statements of the Fund and our auditors’report thereon.
Our opinion on the financial statements of the Fund does not cover the other information and we donot express any form of assurance conclusion thereon.
In connection with our audit of the financial statements of the Fund, our responsibility is to read theother information and, in doing so, consider whether the other information is materially inconsistentwith the financial statements of the Fund or our knowledge obtained in the audit or otherwiseappears to be materially misstated.
83

Independent auditors’ report to the unitholders of AmAl-Amin (cont’d.)
Responsibilities of the Manager and the Trustees for the financial statements
Auditor’s responsibilities for the audit of the financial statements
Our objectives are to obtain reasonable assurance about whether the financial statements of the Fund,as a whole are free from material misstatement, whether due to fraud or error, and to issue anauditors’ report that includes our opinion. Reasonable assurance is a high level of assurance, but isnot a guarantee that an audit conducted in accordance approved standards on auditing in Malaysiaand International Standards on Auditing will always detect a material misstatement when it exists.Misstatements can arise from fraud or error and are considered material if, individually or in theaggregate, they could reasonably be expected to influence the economic decisions of users taken onthe basis of these financial statements.
If based on the work we have performed, we conclude that there is a material misstatement of thisother information, we are required to report that fact. We have nothing to report in this regard.
The Manager is responsible for the preparation of the financial statements of the Fund that give atrue and fair view in accordance with Malaysian Financial Reporting Standards and InternationalFinancial Reporting Standards. The Manager is also responsible for such internal control as theManager determines is necessary to enable the preparation of financial statements of the Fund thatare free from material misstatement, whether due to fraud or error.
In preparing the financial statements of the Fund, the Manager is responsible for assessing theFund’s ability to continue as a going concern, disclosing, as applicable, matters related to goingconcern and using the going concern basis of accounting unless the Manager either intends toliquidate the Fund or to cease operations, or has no realistic alternative to do so.
The Trustee is responsible for ensuring that the Manager maintains proper accounting and otherrecords as are necessary to enable true and fair presentation of these financial statements.
As part of an audit in accordance with the approved standards on auditing in Malaysia andInternational Standards on Auditing, we exercise professional judgment and maintain professionalskepticism throughout the planning and performance of the audit. We also:
Identify and assess the risks of material misstatement of the financial statements of the Fund,whether due to fraud or error, design and perform audit procedures responsive to those risks,and obtain audit evidence that is sufficient and appropriate to provide a basis for our opinion.The risk of not detecting a material misstatement resulting from fraud is higher than for oneresulting from error, as fraud may involve collusion, forgery, intentional omissions,misrepresentations, or the override of internal control.
Obtain an understanding of internal control relevant to the audit in order to design auditprocedures that are appropriate in the circumstances, but not for the purpose of expressing anopinion on the effectiveness of the Fund’s internal control.
84

Independent auditors’ report to the unitholders of AmAl-Amin (cont’d.)
Other matters
Ernst & Young Wan Daneena Liza Bt Wan Abdul RahmanAF: 0039 No. 2978/03/18(J)Chartered Accountants Chartered Accountant
Kuala Lumpur, Malaysia7 November 2017
We communicate with the Manager regarding, among other matters, the planned scope and timing ofthe audit and significant audit findings, including any significant deficiencies in internal control thatwe identify during our audit.
This report is made solely to the unitholders of the Fund, as a body, and for no other purpose. We donot assume responsibility to any other person for the content of this report.
Evaluate the appropriateness of accounting policies used and the reasonableness ofaccounting estimates and related disclosures made by the Manager.
Conclude on the appropriateness of the Manager’s use of the going concern basis ofaccounting and, based on the audit evidence obtained, whether a material uncertainty existsrelated to events or conditions that may cast significant doubt on the Fund’s ability tocontinue as a going concern. If we conclude that a material uncertainty exists, we arerequired to draw attention in our auditors’ report to the related disclosures in the financialstatements or, if such disclosures are inadequate, to modify our opinion. Our conclusions arebased on the audit evidence obtained up to the date of our auditors’ report. However, futureevents or conditions may cause the Fund to cease to continue as a going concern.
Evaluate the overall presentation, structure and content of the financial statements of theFund, including the disclosures, and whether the financial statements of the Fund representthe underlying transactions and events in a manner that achieves fair presentation.
85

AmAl-Amin
STATEMENT OF FINANCIAL POSITIONAS AT 30 SEPTEMBER 2017
2017 2016Note RM RM
ASSETSShariah-compliant investments 4 74,719,118 157,376,963 Deposits with financial institutions 5 55,057,534 90,137,193 Cash at banks 4,312,835 13,008,777
TOTAL ASSETS 134,089,487 260,522,933
LIABILITIESAmount due to Manager 6 102,855 127,162 Amount due to Trustee 7 8,703 15,275 Distributions payable and to be reinvested 309,412 665,566 Sundry payables and accrued expenses 26,333 29,207
TOTAL LIABILITIES 447,303 837,210
EQUITYUnitholders’ capital 9(a) 131,447,787 257,328,719 Retained earnings 9(b) 6,539 3,262 Available-for-sale reserve 9(c) 67,269 297,566 Capital reserve 11 2,120,589 2,056,176
TOTAL EQUITY 9 133,642,184 259,685,723
TOTAL EQUITY AND LIABILITIES 134,089,487 260,522,933
UNITS IN CIRCULATION 9(a) 131,447,787 257,328,719
NET ASSET VALUE PER UNIT− EX DISTRIBUTION 101.67 sen 100.92 sen
The accompanying notes form an integral part of the financial statements.
86

AmAl-Amin
STATEMENT OF COMPREHENSIVE INCOMEFOR THE FINANCIAL YEAR ENDED 30 SEPTEMBER 2017
2017 2016Note RM RM
SHARIAH-COMPLIANT INVESTMENT INCOME/(LOSS)Profit income 7,422,324 12,246,080 Other income 11,859 3,500 Net loss from Shariah-compliant investments:− Loss on disposals of available-for-sale investments (43,218) (15,903)
Gross Income 7,390,965 12,233,677
EXPENDITUREManager’s fee 6 (1,358,502) (2,016,788)Trustee’s fee 7 (136,361) (217,370)Auditors’ remuneration - current financial year (7,500) (7,500)Auditors’ remuneration - over provision in prior financial year - 3,600 Tax agent’s fee - current financial year (4,100) (4,000)Tax agent’s fee - over provision in prior financial year - 1,000 Other expenses 8 (94,431) (139,740)
Total Expenditure (1,600,894) (2,380,798)
NET INCOME BEFORE TAX 5,790,071 9,852,879 LESS: INCOME TAX 13 - -
NET INCOME AFTER TAX 5,790,071 9,852,879
OTHER COMPREHENSIVE (LOSS)/INCOME THAT MAY BERECLASSIFIED TO PROFIT OR LOSS IN SUBSEQUENT PERIODS:
(273,515) 793,117 – Reclassification of gain on financial investments
available-for-sale to profit or loss, net 43,218 15,903
(230,297) 809,020
TOTAL COMPREHENSIVE INCOME FOR THE FINANCIAL YEAR 5,559,774 10,661,899
(Forward)
– Fair value revaluation gain
87

AmAl-Amin
STATEMENT OF COMPREHENSIVE INCOMEFOR THE FINANCIAL YEAR ENDED 30 SEPTEMBER 2017 (CONT’D)
2017 2016Note RM RM
Total comprehensive income comprises the following:Realised income 5,790,071 9,852,879 Unrealised (loss)/gain (230,297) 809,020
5,559,774 10,661,899
Distributions for the financial year:Net distributions 14 5,722,381 9,709,381
The accompanying notes form an integral part of the financial statements.
88
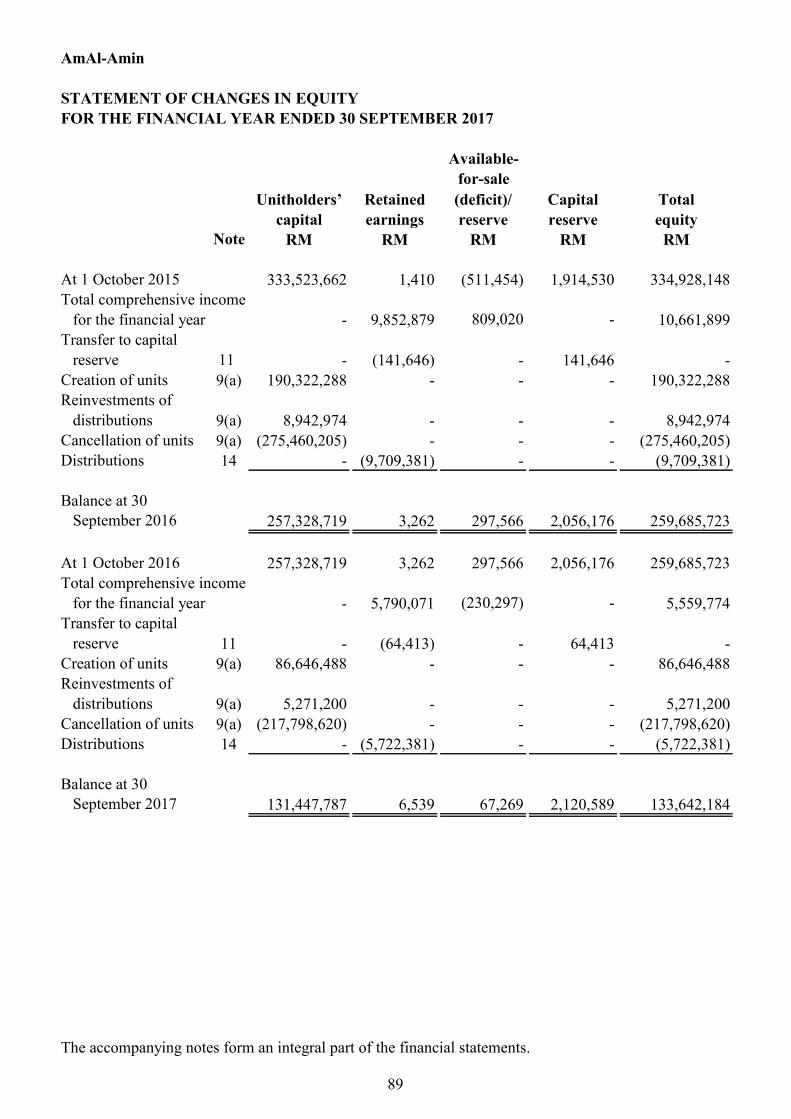
AmAl-Amin
STATEMENT OF CHANGES IN EQUITYFOR THE FINANCIAL YEAR ENDED 30 SEPTEMBER 2017
Available-for-sale
Unitholders’ Retained (deficit)/ Capital Total capital earnings reserve reserve equity
Note RM RM RM RM RM
At 1 October 2015 333,523,662 1,410 (511,454) 1,914,530 334,928,148 Total comprehensive income
for the financial year - 9,852,879 809,020 - 10,661,899 Transfer to capital
reserve 11 - (141,646) - 141,646 - Creation of units 9(a) 190,322,288 - - - 190,322,288 Reinvestments of
distributions 9(a) 8,942,974 - - - 8,942,974 Cancellation of units 9(a) (275,460,205) - - - (275,460,205)Distributions 14 - (9,709,381) - - (9,709,381)
Balance at 30September 2016 257,328,719 3,262 297,566 2,056,176 259,685,723
At 1 October 2016 257,328,719 3,262 297,566 2,056,176 259,685,723 Total comprehensive income
for the financial year - 5,790,071 (230,297) - 5,559,774 Transfer to capital
reserve 11 - (64,413) - 64,413 - Creation of units 9(a) 86,646,488 - - - 86,646,488 Reinvestments of
distributions 9(a) 5,271,200 - - - 5,271,200 Cancellation of units 9(a) (217,798,620) - - - (217,798,620)Distributions 14 - (5,722,381) - - (5,722,381)
Balance at 30September 2017 131,447,787 6,539 67,269 2,120,589 133,642,184
The accompanying notes form an integral part of the financial statements.
89

AmAl-Amin
STATEMENT OF CASH FLOWSFOR THE FINANCIAL YEAR ENDED 30 SEPTEMBER 2017
2017 2016Note RM RM
CASH FLOWS FROM OPERATING ANDINVESTING ACTIVITIES
Proceeds from maturity/sale of Shariah-compliantinvestments 112,070,950 123,596,232
Profit received 8,540,444 13,598,818 Other income received 11,859 3,500 Manager’s fee paid (1,382,809) (2,091,142)Trustee’s fee paid (142,933) (221,421)Tax agent’s fee paid (4,000) (4,000)Payments for other expenses (104,905) (152,465)Purchase of Shariah-compliant investments (30,804,740) (59,992,620)
Net cash generated from operating andinvesting activities 88,183,866 74,736,902
CASH FLOWS FROM FINANCING ACTIVITIES
Proceeds from creation of units 86,646,488 190,322,288 Payment for cancellation of units (217,798,620) (275,460,205)Distributions paid (807,335) (923,365)
Net cash used in financing activities (131,959,467) (86,061,282)
NET DECREASE IN CASH ANDCASH EQUIVALENTS (43,775,601) (11,324,380)
CASH AND CASH EQUIVALENTS AT BEGINNING OF FINANCIAL YEAR 103,145,970 114,470,350
CASH AND CASH EQUIVALENTS AT END OF FINANCIAL YEAR 59,370,369 103,145,970
Cash and cash equivalents comprise:Deposits with financial institutions 5 55,057,534 90,137,193 Cash at banks 4,312,835 13,008,777
59,370,369 103,145,970
The accompanying notes form an integral part of the financial statements.
90

AmAl-Amin
NOTES TO THE FINANCIAL STATEMENTS
1. GENERAL INFORMATION
2. BASIS OF PREPARATION OF FINANCIAL STATEMENTS
Standards effective during the financial year
Standards issued but not yet effective
Effective forfinancial periods
or after
MFRS 9: Financial InstrumentsMFRS 15: Revenue From Contracts With Customers
The Fund was set up with the objective of providing investors with a regular stream of “halal income”,by investing in Islamic money market and other Islamic debt securities. As provided in the Deed, the“accrual period” or the financial year shall end on 30 September and the units in the Fund were firstoffered for sale on 26 November 2001.
AmAl-Amin (“the Fund”) was established pursuant to a Deed dated 30 October 2001 as amended byDeeds Supplemental thereto (“the Deed”), between AmFunds Management Berhad as the Manager,AmanahRaya Trustees Berhad as the Trustee and all unitholders.
The Fund plans to adopt the above pronouncements when they become effective in the respectivefinancial periods. These pronouncements are expected to have no significant impact to the financialstatements of the Fund upon their initial application except as described below:
1 January 20181 January 2018
The financial statements of the Fund have been prepared in accordance with Malaysian FinancialReporting Standards (“MFRS”) as issued by the Malaysian Accounting Standards Board (“MASB”) andare in compliance with International Financial Reporting Standards.
The financial statements of the Fund have been prepared under the historical cost convention, unlessotherwise stated in the accounting policies.
The adoption of MFRS which have been effective during the financial year did not have any materialfinancial impact to the financial statements.
As at the date of authorisation of these financial statements, the following Standards which are relevantto the Fund, have been issued by MASB but are not yet effective and have not been adopted by the Fund.
beginning on
91

MFRS 9 Financial Instruments
3. SIGNIFICANT ACCOUNTING POLICIES
Income recognition
Income tax
Functional and presentation currency
Statement of cash flows
Distribution
Current taxes are recognised in profit or loss except to the extent that the tax relates to items recognisedoutside profit or loss, either in other comprehensive income or directly in equity.
Distributions are at the discretion of the Fund. A distribution to the Fund’s unitholders is accounted foras a deduction from realised reserves. A proposed distribution is recognised as a liability in the period inwhich it is approved.
Functional currency is the currency of the primary economic environment in which the Fund operatesthat most faithfully represents the economic effects of the underlying transactions. The functionalcurrency of the Fund is Ringgit Malaysia which reflects the currency in which the Fund competes forfunds, issues and redeems units. The Fund has also adopted Ringgit Malaysia as its presentationcurrency.
The Fund adopts the direct method in the preparation of the statement of cash flows.
Cash equivalents are short-term, highly liquid Shariah-compliant investments that are readily convertibleto cash with insignificant risk of changes in value.
MFRS 9 reflects International Accounting Standards Board’s (“IASB”) work on the replacement ofMFRS 139 Financial Instruments: Recognition and Measurement (“MFRS 139”). MFRS 9 will beeffective for financial year beginning on or after 1 January 2018. The Fund is in the process ofquantifying the impact of the first adoption of MFRS 9.
Income is recognised to the extent that it is probable that the economic benefits will flow to the Fund and the income can be reliably measured. Income is measured at the fair value of consideration received orreceivable.
Profit income on Shariah-compliant fixed income securities and Islamic short-term deposits arerecognised on an accrual basis using the effective profit method, which includes the accretion ofdiscounts and amortisation of premiums.
Current tax assets and liabilities are measured at the amount expected to be recovered from or paid to thetax authorities. The tax rates and tax laws used to compute the amount are those that are enacted orsubstantively enacted at the reporting date.
92

Unitholders’ capital
Capital reserve
Financial assets
(i) Available-for-sale investments
(ii) Receivables
The Fund determines the classification of its financial assets at initial recognition, and the categoriesapplicable to the Fund include available-for-sale investments and receivables.
Capital reserve of the Fund represents non-distributable amount as determined by the Manager that maybe applied to make good any losses incurred by the Fund, in order to maintain the Fund’s prices atRM1.00 per unit, as approved by the Securities Commission.
Financial assets are recognised in the statement of financial position when, and only when, the Fundbecomes a party to the contractual provisions of the financial instrument.
The unitholders’ capital of the Fund meets the definition of puttable instruments and is classified asequity instruments under MFRS 132 Financial Instruments: Presentation (“MFRS 132”).
When financial assets are recognised initially, they are measured at fair value, plus, in the case offinancial assets not at fair value through profit or loss, directly attributable transaction costs.
Subsequent to initial recognition, receivables are measured at amortised cost using the effectiveprofit method. Gains and losses are recognised in profit or loss when the receivables arederecognised or impaired, and through the amortisation process.
Financial assets with fixed or determinable payments that are not quoted in an active market areclassified as receivables.
Available-for-sale investments are measured at fair value. Any gains or losses from changes in fairvalue of the investments are recognised in other comprehensive income, except that impairmentlosses, foreign exchange gains and losses on monetary instruments and interest calculated using theeffective profit method are recognised in profit or loss. The cumulative gain or loss previouslyrecognised in other comprehensive income is reclassified from equity to profit or loss as areclassification adjustment when the investment is derecognised.
For investments in fixed income securities, fair value is determined based on the indicatives pricesfrom Bond Pricing Agency Malaysia Sdn Bhd plus accrued profit, which includes the accretion ofdiscount and amortisation of premium.
93

Impairment of available-for-sale
Impairment of receivables
Financial liabilities
Financial liabilities are classified according to the substance of the contractual arrangements entered intoand the definitions of a financial liability.
Financial liabilities, within the scope of MFRS 139, are recognised in the statement of financial positionwhen, and only when, the Fund becomes a party to the contractual provisions of the financial instrument.
The Fund’s financial liabilities are recognised initially at fair value plus directly attributable transactioncosts and subsequently measured at amortised cost using the effective profit method.
A financial liability is derecognised when the obligation under the liability is extinguished. Gains andlosses are recognised in profit or loss when the liabilities are derecognised, and through the amortisationprocess.
If, in a subsequent year, the fair value of a debt instrument increases and the increase can be objectivelyrelated to an event occurring after the impairment loss was recognised in the profit or loss, theimpairment loss is reversed through the profit or loss.
For financial investments AFS, the Fund assesses at each reporting date whether there is objectiveevidence that an investment is impaired. The amount of any impairment loss identified is measured asthe difference between the asset’s carrying amount and the present value of estimated future cash flows(excluding future expected credit losses that have not yet been incurred).
The present value of the estimated future cash flows is discounted at the financial asset’s originaleffective profit rate. However, the amount recorded for impairment is the cumulative loss measured asthe difference between the amortised cost and the current fair value, less any impairment loss on thatinvestment previously recognised in profit or loss.
The Fund assesses at each reporting date whether there is any objective evidence that a financial asset isimpaired.
To determine whether there is objective evidence that an impairment loss on financial assets has beenincurred, the Fund considers factors such as the probability of insolvency or significant financialdifficulties of the debtor and default or significant delay in payments.
If any such evidence exists, the amount of impairment loss is measured as the difference between theassets’s carrying amount and the present value of estimated future cash flows discounted at the financialasset’s original effective profit rate. The impairment loss is recognised in profit or loss.
If in a subsequent period, the amount of the impairment loss decreases and the decrease can be relatedobjectively to an event occurring after the impairment was recognised, the previously recognisedimpairment loss is reversed to the extent that the carrying amount of the asset does not exceed itsamortised cost at the reversal date. The amount of reversal is recognised in profit or loss.
The carrying amount of the financial asset is reduced through the use of an allowance account. When areceivable becomes uncollectible, it is written off against the allowance account.
94

Classification of realised gains and losses
Significant accounting estimates and judgments
4. SHARIAH-COMPLIANT INVESTMENTS
2017 2016Available-for-sale investments RM RM
At nominal value:Corporate sukuk 73,500,000 154,900,000
At amortised cost:Corporate sukuk 74,651,849 157,079,397
At fair value:Corporate sukuk 74,719,118 157,376,963
Details of Shariah-compliant investments as at 30 September 2017 are as follows:Fair
value as apercentage
Maturity Credit Nominal Fair Amortised of net assetdate Issuer rating value value cost value
RM RM RM %
Corporate sukuk
05.10.2017 Putrajaya Holdings Sdn Bhd AAA 5,000,000 5,100,459 5,100,302 3.81
29.11.2017 TNB Northern Energy Berhad AAA 5,000,000 5,060,823 5,057,036 3.79
(Forward)
The preparation of the Fund’s financial statements requires the Manager to make judgments, estimatesand assumptions that affect the reported amounts of revenues, expenses, assets and liabilities, and thedisclosure of contingent liabilities at the reporting date. However, uncertainty about these assumptionsand estimates could result in outcomes that could require a material adjustment to the carrying amount ofthe asset or liability in the future.
No major judgments have been made by the Manager in applying the Fund’s accounting policies. Thereare no key assumptions concerning the future and other key sources of estimation uncertainty at thereporting date, that have a significant risk of causing a material adjustment to the carrying amounts ofassets and liabilities within the next financial year.
Realised gains and losses on disposals of financial instruments are calculated using the weighted averagemethod. They represent the difference between an instrument’s initial carrying amount and disposalamount.
95

Fairvalue as apercentage
Maturity Credit Nominal Fair Amortised of net assetdate Issuer rating value value cost value
RM RM RM %
Corporate sukuk
08.12.2017 Malaysia Building Society Berhad AA 4,000,000 4,052,110 4,049,522 3.03
08.12.2017 First Resources Limited AA 5,000,000 5,068,294 5,064,430 3.79
21.12.2017 UEM Sunrise Berhad AA 3,700,000 3,744,832 3,742,194 2.80
26.12.2017 AmBank Islamic Berhad* AA 200,000 202,574 202,631 0.15
27.12.2017 Mukah Power GenerationSdn Bhd AA 5,000,000 5,149,493 5,147,493 3.85
28.12.2017 BGSM Management Sdn Bhd AA 4,000,000 4,082,507 4,080,415 3.05
25.01.2018 Putrajaya Holdings Sdn Bhd AAA 2,000,000 2,028,735 2,027,035 1.52
21.03.2018 Gamuda Berhad AA 5,000,000 5,009,910 5,007,503 3.75 15.06.2018 Ranhill Powertron II
Sdn Bhd AA 4,000,000 4,084,406 4,075,116 3.05 22.06.2018 Sarawak Energy
Berhad AA 2,000,000 2,037,153 2,032,571 1.52 05.07.2018 Kapar Energy
Ventures SdnBhd AA 5,000,000 5,063,836 5,062,751 3.79
27.07.2018 Besraya (M)Sdn Bhd AA 1,000,000 1,011,981 1,010,222 0.76
16.11.2018 Encorp Systembilt Sdn Bhd AA 5,200,000 5,313,336 5,295,149 3.97
30.05.2019 Etiqa Takaful Berhad AA 5,700,000 5,802,575 5,784,900 4.34
05.07.2019 Kapar Energy Ventures Sdn Bhd AA 200,000 202,893 202,688 0.15
09.08.2019 Sarawak HidroSdn Bhd AAA 4,000,000 4,028,531 4,026,480 3.01
04.10.2019 UMW HoldingsBerhad AA 3,000,000 3,093,840 3,083,446 2.31
(Forward)
96

Fairvalue as apercentage
Maturity Credit Nominal Fair Amortised of net assetdate Issuer rating value value cost value
RM RM RM %
Corporate sukuk
01.11.2019 Gas Malaysia Berhad AAA 4,500,000 4,580,830 4,599,965 3.43
Total Shariah-compliant investments 73,500,000 74,719,118 74,651,849 55.87
Excess of fair value over cost 67,269
* A licensed financial institution related to the Manager
The weighted average effective yield on unquoted Shariah-compliant investments are as follows:
2017 2016% %
Corporate sukuk 4.01 4.01
Less than 1 year to1 year 5 years
RM RM
At nominal value:Corporate sukuk 50,900,000 22,600,000
At nominal value:Corporate sukuk 79,500,000 75,400,000
Analyses of the remaining maturity of unquoted Shariah-compliant investments as at 30 September 2017and 30 September 2016 are as follows:
Effective yield
2017
2016
97

5. DEPOSITS WITH FINANCIAL INSTITUTIONS
2017 2016RM RM
At nominal value:Short-term deposits with licensed Islamic banks 55,000,000 90,000,000
At carrying value:Short-term deposits with licensed Islamic banks 55,057,534 90,137,193
Details of deposits with financial institutions as at 30 September 2017 are as follows:Carryingvalue as apercentage
Maturity Nominal Carrying Purchase of net assetdate value value cost value
RM RM RM %
Short-term deposits with Islamic licensed banks
02.10.2017 CIMB Islamic Bank Berhad 10,000,000 10,001,644 10,000,000 7.48
02.10.2017 Maybank Islamic Berhad 15,000,000 15,002,795 15,000,000 11.23
05.10.2017 Kuwait Finance House (Malaysia) Berhad 10,000,000 10,025,643 10,000,000 7.50
05.10.2017 Maybank Islamic Berhad 10,000,000 10,002,794 10,000,000 7.49
06.10.2017 Kuwait Finance House (Malaysia) Berhad 10,000,000 10,024,658 10,000,000 7.50
Total 55,000,000 55,057,534 55,000,000 41.20
2017 2016 2017 2016% % Days Days
Short-term deposits with licensedIslamic banks 3.40 3.32 4 6
Weighted average effective
The weighted average effective profit rate and average remaining maturity of short-term deposits are asfollows:
Bank
profit rateRemaining
maturity
98

6. AMOUNT DUE TO MANAGER
7. AMOUNT DUE TO TRUSTEE
8. OTHER EXPENSES
9. TOTAL EQUITY
Total equity is represented by:
2017 2016Note RM RM
Unitholders’ capital (a) 131,447,787 257,328,719 Retained earnings− Realised income (b) 6,539 3,262 Available-for-sale reserve (c) 67,269 297,566 Capital reserve 11 2,120,589 2,056,176
133,642,184 259,685,723
(a) UNITHOLDERS’ CAPITAL/UNITS IN CIRCULATION
Number of Number of units RM units RM
At beginning of the financial year 257,328,719 257,328,719 333,523,662 333,523,662
(Forward)
Trustee’s fee is at a rate of 0.07% (2016: 0.07%) per annum on the net asset value of the Fund,calculated on a daily basis.
Included in other expenses is Goods and Services Tax incurred by the Fund during the financial yearamounting to RM92,709 (2016: RM135,026).
2017
The normal credit period in the previous and current financial years for Manager’s fee payable is onemonth.
The normal credit period in the previous and current financial years for Trustee’s fee payable is onemonth.
2016
Manager’s fee is at a rate of up to 0.75% (2016: 0.75%) per annum on the net asset value of the Fund,calculated on a daily basis.
99

Number of Number of units RM units RM
Creation during thefinancial year 86,646,488 86,646,488 190,322,288 190,322,288
Distributions reinvested 5,271,200 5,271,200 8,942,974 8,942,974 Cancellation during the
financial year (217,798,620) (217,798,620) (275,460,205) (275,460,205)
At end of the financial year 131,447,787 131,447,787 257,328,719 257,328,719
(b) REALISED – DISTRIBUTABLE2017 2016RM RM
At beginning of the financial year 3,262 1,410
Total comprehensive income for the financial year 5,790,071 9,852,879 Transfer to capital reserve (Note 11) (64,413) (141,646)Distributions out of realised reserve (Note 14) (5,722,381) (9,709,381)
Net increase in realised reserve for the financial year 3,277 1,852
At end of the financial year 6,539 3,262
(c) AVAILABLE-FOR-SALE RESERVE
2017 2016RM RM
At beginning of the financial year 297,566 (511,454)Fair value revaluation gain (273,515) 793,117 Reclassification of gain on financial investments
available-for-sale to profit or loss, net 43,218 15,903
At end of the financial year 67,269 297,566
10. NET ASSET VALUE ATTRIBUTABLE TO UNITHOLDERS
In line with the adoption of MFRS 139, unquoted available-for-sale Shariah-compliant investments havebeen valued at the indicative prices at the close of business. However, the valuation, creation andcancellation of units are based on RM1.00 per unit as stated in the trust deed.
2017 2016
100

11. CAPITAL RESERVE
2017 2016RM RM
At beginning of the financial year 2,056,176 1,914,530 Transfer from realised income [Note 9(b)] 64,413 141,646
At end of the financial year 2,120,589 2,056,176
12. UNITS HELD BY RELATED PARTIES
Number of Number of units RM units RM
Parties related to the Manager* 6,389 6,389 6,216 6,216
*
13. INCOME TAX
2017 2016 RM RM
Net income before tax 5,790,071 9,852,879
Taxation at Malaysian statutory rate of 24% 1,389,617 2,364,700 Tax effects of:
Income not subject to tax (1,781,358) (2,939,100)Loss not deductible for tax purposes 10,372 3,800 Restriction on tax deductible expenses for unit trust fund 295,067 436,500 Non-permitted expenses for tax purposes 56,362 86,400 Permitted expenses not used and not available for
future financial years 29,940 47,700
Tax expense for the financial year - -
The parties related to the Manager are the legal and beneficial owners of the units. The Manager didnot hold any units in the Fund as at 30 September 2017 and 30 September 2016.
Income tax payable is calculated on Shariah-compliant investment income less deduction for permittedexpenses as provided for under Section 63B of the Income Tax Act, 1967.
Pursuant to Schedule 6 of the Income Tax Act, 1967, local profit income derived by the Fund isexempted from tax.
2017 2016
A reconciliation of income tax expense applicable to net income before tax at the statutory income taxrate to income tax expense at the effective income tax rate of the Fund is as follows:
101

14. DISTRIBUTIONS
2017 2016 RM RM
On redemption of units 99,545 16,081 Income entitlement declared on:
31 October 2016/2015 618,432 881,708 30 November 2016/2015 549,021 852,661 31 December 2016/2015 563,269 917,871 31 January 2017/2016 522,646 906,155 28 February 2017/29 February 2016 455,092 860,412 31 March 2017/2016 484,282 847,899 30 April 2017/2016 462,526 764,705 31 May 2017/2016 469,764 783,677 30 June 2017/2016 414,420 744,793 31 July 2017/2016 402,893 744,791 31 August 2017/2016 371,079 723,062 30 September 2017/2016 309,412 665,566
5,722,381 9,709,381
Distributions to unitholders are from the following sources:2017 2016 RM RM
Profit income 7,323,275 12,090,179 Less: Expenses (1,600,894) (2,380,798)
Total amount of distributions 5,722,381 9,709,381
Distributions made out of:Realised reserve [Note 9(b)] 5,722,381 9,709,381
Comprising:Distributions reinvested 4,665,846 8,203,975 Distributions payables and to be reinvested 309,412 665,566 Cash distributions 747,123 839,840
5,722,381 9,709,381
The gross and net distributions of the Fund are of the similar amount as the Fund is not subject to tax.The above distributions have no implication on unit prices as the net asset value per unit of the Fund wasmaintained at RM1.00 throughout the financial year.
102

15. MANAGEMENT EXPENSE RATIO (“MER”)
The Fund’s MER is as follows:2017 2016
% p.a. % p.a.
Manager’s fee 0.70 0.65 Trustee’s fee 0.07 0.07 Fund’s other expenses 0.06 0.05
Total MER 0.83 0.77
16. PORTFOLIO TURNOVER RATIO (“PTR”)
17. SEGMENTAL REPORTING
18. TRANSACTIONS WITH FINANCIAL INSTITUTIONS
Financial institutionsRM %
RHB Investment Bank Berhad 39,263,869 59.44 Standard Chartered Bank Malaysia Berhad 8,068,355 12.22 Hong Leong Bank Berhad 5,096,828 7.72 Hong Leong Investment Bank Berhad 5,095,891 7.71 CIMB Bank Berhad 5,093,717 7.71 Malayan Banking Berhad 3,434,436 5.20
Total 66,053,096 100.00
Transaction value
There was no transaction with financial institutions related to the Manager during the financial year.
Details of transactions with financial institutions for the financial year ended 30 September 2017 are asfollows:
The PTR of the Fund, which is the ratio of average total acquisitions and disposals of Shariah-compliantinvestments to the average net asset value of the Fund calculated on a daily basis, is 0.37 times (2016:0.30 times).
In accordance with the objective of the Fund, substantially all of the Fund’s Shariah-compliantinvestments are made in the form of Shariah-compliant fixed income securities in Malaysia. TheManager is of the opinion that the risk and rewards from these Shariah-compliant investments are notindividually or segmentally distinct and hence the Fund does not have a separately identifiable businessor geographical segments.
The MER of the Fund is the ratio of the sum of annualised fees and expenses incurred by the Fund to theaverage net asset value of the Fund calculated on a daily basis.
103

19. FINANCIAL INSTRUMENTS
(a) Classification of financial instruments
Financial Available- Receivables liabilities at
for-sale at amortised amortisedinvestments cost cost Total
RM RM RM RM
2017AssetsShariah-compliant investments 74,719,118 - - 74,719,118 Deposits with financial - 55,057,534 - 55,057,534
institutionsCash at banks - 4,312,835 - 4,312,835
Total financial assets 74,719,118 59,370,369 - 134,089,487
LiabilitiesAmount due to Manager - - 102,855 102,855 Amount due to Trustee - - 8,703 8,703 Distributions payables and to be reinvested - - 309,412 309,412 Sundry payables and
accrued expenses - - 26,333 26,333
Total financial liabilities - - 447,303 447,303
2016AssetsShariah-compliant investments 157,376,963 - - 157,376,963Deposits with financial -
institutions - 90,137,193 - 90,137,193 Cash at bank - 13,008,777 - 13,008,777
Total financial assets 157,376,963 103,145,970 - 260,522,933
(Forward)
The above transactions were in respect of Shariah-compliant fixed income instruments. Transactions in theseShariah-compliant investments do not involve any commission or brokerage.
The significant accounting policies in Note 3 describe how the classes of financial instruments aremeasured, and how income and expenses, including fair value gains and losses, are recognised. Thefollowing table analyses the financial assets and liabilities of the Fund in the statement of financial positionby the class of financial instrument to which they are assigned, and therefore by the measurement basis.
104

Financial Available- Receivables liabilities at
for-sale at amortised amortisedinvestments cost cost Total
RM RM RM RM
LiabilitiesAmount due to Manager - - 127,162 127,162 Amount due to Trustee - - 15,275 15,275 Distributions to be reinvested - - 665,566 665,566 Sundry payables and accrued
expenses - - 29,207 29,207
Total financial liabilities - - 837,210 837,210
Income, expense, gainsand losses
2017 2016RM RM
Net loss from disposals of investments- Available-for-sale investments (43,218) (15,903)Income, of which derived from:- Profit income from available-for-sale investments 4,949,543 7,554,853 - Profit income from receivables 2,472,781 4,691,227
(b) Financial instruments that are carried at fair value
Level 1: quoted (unadjusted) prices in active markets for identical assets or liabilities;
Level 2:
Level 3:
Level 1 Level 2 Level 3 TotalRM RM RM RM
2017Shariah-compliant investments - 74,719,118 - 74,719,118
(Forward)
The Fund uses the following hierarchy for determining and disclosing the fair value of financial instrumentsby valuation technique:
The Fund’s financial assets and liabilities are carried at fair value.
other techniques for which all inputs which have a significant effect on the recorded fair values areobservable; either directly or indirectly; or
techniques which use inputs which have a significant effect on the recorded fair value that are notbased on observable market data.
The following table shows an analysis of financial instruments recorded at fair value by the level of the fairvalue hierarchy:
105

2016Shariah-compliant investments - 157,376,963 - 157,376,963
(c)
Deposits with financial institutions Cash at banks Amount due to Manager Amount due to Trustee Distributions payable and to be reinvested Sundry payables and accrued expenses
20. RISK MANAGEMENT POLICIES
Market risk
(i) Rate of return risk
Financial instruments that are not carried at fair value and whose carrying amounts are reasonableapproximation of fair value
The following are classes of financial instruments that are not carried at fair value and whose carryingamounts are reasonable approximation of fair value due to their short period to maturity or short creditperiod:
There are no other financial instruments which are not carried at fair values and whose carrying amounts arenot reasonable approximation of their respective fair values.
Rate of return risk will affect the value of the Fund’s Shariah-compliant investments, given the rate of returnmovements, which are influenced by regional and local economic developments as well as politicaldevelopments.
Domestic profit rate on deposits and placements with licensed financial institutions are determined based onprevailing market rates.
Risk management is carried out by closely monitoring, measuring and mitigating the above said risks, carefulselection of Shariah-compliant investments coupled with stringent compliance to Shariah-compliant investmentrestrictions as stipulated by the Capital Market and Services Act 2007, Securities Commission’s Guidelines onUnit Trust Funds and the Deed as the backbone of risk management of the Fund.
Market risk, in general, is the risk that the value of a portfolio would decrease due to changes in market riskfactors such as equity prices, rate of return (yield curve), foreign exchange rates and commodity prices.
The result below summarised the rate of return sensitivity of the Fund’s NAV, or theoretical value(applicable to Islamic money market deposit) due to the parallel movement assumption of the yield curve by+100bps and -100bps respectively:
The Fund is exposed to a variety of risks that include market risk, credit risk, liquidity risk, single issuer risk,regulatory risk, management risk, non-compliance/Shariah non-compliance risk and unstable NAV risk.
106

Parallel shift in yield curve by: 2017 2016
RM RM
+100 bps (547,051) (1,548,082)-100 bps 557,166 1,581,211
Credit risk
(i) Credit quality of financial assets
As a % of As a % ofdebt net asset
Credit rating RM securities value
2017AAA 20,799,378 27.84 15.57AA 53,919,740 72.16 40.34
74,719,118 100.00 55.91
2016AAA 33,458,150 21.26 12.89AA 107,822,495 68.51 41.51A 16,096,318 10.23 6.20
157,376,963 100.00 60.60
As a % ofAs a % of net asset
Credit rating RM deposits value
2017P1/MARC-1 55,057,534 100.00 41.20
2016P1/MARC-1 90,137,193 100.00 34.71
For deposits with financial institutions, the Fund only makes placements with financial institutions withsound rating. The following table presents the Fund’s portfolio of deposits by rating category as at 30September 2017 and 30 September 2016:
Credit risk is the risk that the counterparty to a financial instrument will cause a financial loss to the Fund byfailing to discharge an obligation. The Fund can invest up to 100% of the net asset value in Shariah-compliantfixed income instruments. As such the Fund would be exposed to the risk of sukuk issuers and financialinstitutions defaulting on its repayment obligations which in turn would affect the net asset value of the Fund.
The following table analyses the Fund’s portfolio of debt securities by rating category as at 30 September2017 and 30 September 2016:
Sensitivity of the Fund’s NAV, or theoretical value
107

Cash at banks are held for liquidity purposes and are not exposed to significant credit risk.
(ii) Credit risk concentration
As a % of As a % ofdebt net asset
Sector RM securities value
2017Construction and engineering 10,323,246 13.82 7.72Diversified holdings 7,176,347 9.61 5.36Financial services 10,057,259 13.46 7.52Insfrastructure and utilities 26,639,116 35.65 19.92Mining and petroleum 4,580,830 6.13 3.43Plantation and agriculture 5,068,294 6.78 3.79Property and real estate 10,874,026 14.55 8.13
74,719,118 100.00 55.87
2016Construction and engineering 21,227,295 13.49 8.18Diversified holdings 15,442,682 9.81 5.95Financial services 29,094,791 18.49 11.20Insfrastructure and utilities 63,400,737 40.29 24.40Plantation and agriculture 2,036,940 1.29 0.78Property and real estate 26,174,518 16.63 10.09
157,376,963 100.00 60.60
Liquidity risk
There is no geographical risk as the Fund invests only in Shariah-compliant investments in Malaysia.
Concentration of risk is monitored and managed based on sectorial distribution. The table below analysesthe Fund’s portfolio of debt securities by sectorial distribution as at 30 September 2017 and 30 September2016:
Liquidity risk is defined as the risk of being unable to raise funds or borrowing to meet payment obligations asthey fall due. The Fund maintains sufficient level of liquid assets, after consultation with the Trustee, to meetanticipated payments and cancellations of units by unitholders. Liquid assets comprise of deposits with licensedfinancial institutions and other instruments, which are capable of being converted into cash within 5 to 7 days.The Fund’s policy is to always maintain a prudent level of liquid assets so as to reduce liquidity risk.
108

Objectives and assumptions
(i) For sukuk(a) For zero-coupon sukuk, the nominal amount will be returned at maturity date.(b)
Cash received from sukuk are calculated as follows:
$ = cash receivedR = coupon rate p.a. F = coupon frequency
For zero coupon sukuk, F = 0 At maturity: $ = Nominal
For F > 0 Before maturity: coupon payment, $ = Nominal * (R/F) At maturity: maturity payment, $ = Nominal + (Nominal * R/F)
(ii) For money market instruments and deposits
$ = cash receivedR = profit rate p.a. F = time to maturity (days)At maturity: $ = Nominal + (Nominal*R*F/365)
0 – 1 1 – 2 2 – 3 3 – 4 4 – 5 More thanyear years years years years 5 yearsRM RM RM RM RM RM
2017Financial assetsShariah-compliant
investments 53,392,577 15,976,270 7,666,129 - - -Deposits with
financial institutions 55,072,356 - - - - -
Cash at banks 4,312,835 - - - - -
Total assets 112,777,768 15,976,270 7,666,129 - - -
(Forward)
Contractual cash flows (undiscounted)
For each security in the Fund, the cash flows are projected according to its asset class. Each asset class, ifany, follows the calculation method as below:
The nominal amount and profit will be paid at maturity date. Cash received are calculated as follows:
For coupon-bearing sukuk, the coupons could be paid on annual, bi-annual or quarterly basis.
The following table presents the undiscounted contractual cash flows from different asset and liabilityclasses in the Fund:
109

0 – 1 1 – 2 2 – 3 3 – 4 4 – 5 More thanyear years years years years 5 yearsRM RM RM RM RM RM
Financial liabilitiesOther liabilities 143,475 - - - - -
2016Financial assetsShariah-compliant
investments 85,200,390 57,206,065 21,480,390 - - -Deposits with
financial institutions 90,178,399 - - - - -
Cash at banks 13,008,777 - - - - -
Total assets 188,387,566 57,206,065 21,480,390 - - -
Financial liabilitiesOther liabilities 231,856 - - - - -
Single issuer risk
Regulatory risk
Management risk
Non-compliance/Shariah non-compliance risk
Unstable NAV risk
Internal policy restricts the Fund from investing in securities issued by any issuer of not more than a certainpercentage of its net asset value. Under such restriction, the risk exposure to the securities of any single issuer isdiversified and managed based on internal/external ratings.
This is the risk of the Manager, the Trustee or the Fund not complying with internal policies, the Deed of theFund, securities law or guidelines issued by the regulators. In the case of an Islamic Fund, this includes the riskof the Fund not conforming to Shariah Investment Guidelines. Non-compliance risk may adversely affect theShariah-compliant investments of the Fund when the Fund is forced to rectify the non-compliance.
Poor management of the Fund may cause considerable losses to the Fund that in turn may affect the net assetvalue of the Fund.
Any changes in national policies and regulations may have effects on the capital market and the net asset valueof the Fund.
Unstable NAV risk means that the actual NAV per unit of the Fund may fluctuate with the market and may notbe maintained at or above its initial price (usually RM1.00) at all times. This is the risk especially applicable tomoney market and short-to medium-term fixed income funds that are priced at RM1.00.
Contractual cash flows (undiscounted)
110

21. CAPITAL MANAGEMENT
No changes were made in the objective, policies or processes during the financial years ended 30 September2017 and 30 September 2016.
The primary objective of the Fund’s capital management is to ensure that it maximises unitholders’ value byexpanding its fund size to benefit from economies of scale and achieving growth in net asset value from theperformance of its Shariah-compliant investments.
The Fund manages its capital structure and makes adjustments to it, in light of changes in economic conditions.To maintain or adjust the capital structure, the Fund may issue new or bonus units, make distribution payment,or return capital to unitholders by way of redemption of units.
111

AmAl-Amin
STATEMENT BY THE MANAGER
Kuala Lumpur, Malaysia7 November 2017
I, GOH WEE PENG, for and on behalf of the Manager, AmFunds Management Berhad, for AmAl-
Amin do hereby state that in the opinion of the Manager, the accompanying statement of financial
position, statement of comprehensive income, statement of changes in equity, statement of cash
flows and the accompanying notes are drawn up in accordance with Malaysian Financial Reporting
Standards and International Financial Reporting Standards so as to give a true and fair view of the
financial position of the Fund as at 30 September 2017 and the comprehensive income, the changes
in equity and cash flows of the Fund for the financial year then ended.
GOH WEE PENGFor and on behalf of the ManagerAmFunds Management Berhad
112

113
TRUSTEE’S REPORT

114
MANAGER’S REPORT Dear Unitholders, We are pleased to present you the Manager’s report and the audited accounts of AmIslamic Balanced (“Fund”) for the financial year ended 30 September 2017. Salient Information of the Fund Name AmIslamic Balanced (“Fund”)
Category/Type
Balanced (Islamic) / Growth
Objective AmIslamic Balanced aims to grow the value of investments in the longer term with lower volatility through asset diversification, which conforms to principles of Shariah.
Duration The Fund was established on 10 September 2004 and shall exist for as long as it appears to the Manager and the Trustee that it is in the interests of the unitholders for it to continue. In some circumstances, the unitholders can resolve at a meeting to terminate AmIslamic Balanced.
Performance Benchmark
50% FTSE Bursa Malaysia Emas Shariah Index. 50% Quantshop Medium GII Index. (obtainable from: www.aminvest.com) Note: The composite benchmark index is a reflection of the Fund’s average asset allocation over the medium to long-term. For the equities portion of the Fund the performance benchmark will be FTSE Bursa Malaysia EMAS Shariah Index and for the fixed income investment portion it will be the Quantshop Medium GII Index. The benchmark is for the performance comparison only. The risk profile of the performance benchmark is not the same as the risk profile of the Fund.
Income Distribution Policy
Income distribution (if any) is incidental.
Breakdown of Unit Holdings by Size
For the financial year under review, the size of the Fund stood at 12,938,024 units. Size of holding As at 30 September 2017 As at 30 September 2016
No of units held
Number of unitholders
No of units held
Number of unitholders
5,000 and below 104,632 35 159,469 50 5,001-10,000 436,476 58 788,098 118 10,001-50,000 3,744,766 169 5,961,575 271 50,001-500,000 3,981,151 43 8,856,021 89 500,001 and above 4,670,999 1 602,540 1

115
Fund Performance Data Portfolio Composition
Details of portfolio composition of the Fund for the financial years as at 30 September are as follows: FY
2017 %
FY 2016 %
FY 2015 %
Construction 6.38 6.32 2.60 Consumer products - 1.61 4.34 Industrial products 10.13 12.14 7.87 Infrastructure 3.45 0.61 2.37 Plantation 3.41 3.37 5.22 Properties 1.58 2.87 0.11 Technology 11.47 3.41 1.54 Trading/Services 23.12 26.00 28.64 Corporate sukuk 26.48 29.76 26.33 Cash and others 13.98 13.91 20.98 Total 100.00 100.00 100.00
Note: The abovementioned percentages are calculated based on total net asset value.
Performance Details
Performance details of the Fund for the financial years ended 30 September are as follows: FY
2017 FY
2016 FY
2015 Net asset value (RM)* 5,817,668 6,810,496 7,389,580 Units in circulation* 12,938,024 16,367,703 18,627,990 Net asset value per unit (RM)* 0.4497 0.4161 0.3967 Highest net asset value per unit (RM)*
0.4523 0.4189 0.4151
Lowest net asset value per unit (RM)*
0.4117 0.3976 0.3742
Benchmark performance (%) 2.84 5.95 -3.23 Total return (%)(1) 8.07 4.89 -1.02 - Capital growth (%) 8.07 4.89 -1.02 - Income distribution (%) - - - Gross distribution (sen per unit) - - - Net distribution (sen per unit) - - - Management expense ratio (%)(2) 1.94 1.98 1.90 Portfolio turnover ratio (times)(3) 0.58 0.63 0.56
* Above prices and net asset value per unit are not shown as ex-distribution. Note: (1) Total return is the annualised return of the Fund for the respective financial
years computed based on the net asset value per unit and net of all fees.

116
(2) Management expense ratio (“MER”) is calculated based on the total fees and expenses incurred by the Fund divided by the average fund size calculated on a daily basis. The MER decreased by 0.04% as compared to 1.98% per annum for the financial year ended 30 September 2016 mainly due to decrease in expenses.
(3) Portfolio turnover ratio (“PTR”) is calculated based on the average of the total acquisitions and total disposals of investment securities of the Fund divided by the average fund size calculated on a daily basis. The PTR decreased by 0.05 times (7.9%) as compared to 0.63 times for the financial year ended 30 September 2016 mainly due to decrease in investing activities.
Average Total Return (as at 30 September 2017) AmIslamic
Balanced(a) %
50% FBM SI/ 50% MGII(b)
% One year 8.07 2.84 Three years 3.91 1.72 Five years 5.73 3.22 Ten years 5.29 3.99
Annual Total Return
Financial Years Ended (30 September)
AmIslamic Balanced(a)
%
50% FBM SI/ 50% MGII(b)
% 2017 8.07 2.84 2016 4.89 5.95 2015 -1.02 -3.23 2014 8.71 5.08 2013 8.35 5.98
(a) Source: Novagni Analytics and Advisory Sdn Bhd. (b) 50% FTSE Bursa Malaysia Emas Shariah Index (“FBM SI”) (obtainable
from: www.bursamalaysia.com.my or www.aminvest.com) and 50% RAM Quantshop Medium Index (“MGII”) (source: www.fundslogic.com).
The Fund performance is calculated based on the net asset value per unit of the Fund. Average total return of the Fund and its benchmark for a period is computed based on the absolute return for that period annualised over one year. Note: Past performance is not necessarily indicative of future performance and that unit prices and investment returns may go down, as well as up.
Fund Performance
For the financial year under review, the Fund registered a return of 8.07% which was entirely capital growth in nature. (Forward)

117
Thus, the Fund’s return of 8.07% has outperformed the benchmark’s return of 2.84% by 5.23%. As compared with the financial year ended 30 September 2016, the net asset value (“NAV”) per unit of the Fund increased by 8.07% from RM0.4161 to RM0.4497, while units in circulation decreased by 20.95% from 16,367,703 units to 12,938,024 units. The Line Chart below shows comparison between the annual performance of AmIslamic Balanced and its benchmark, FBM SI and MGII, for the financial years ended 30 September.
Note: Past performance is not necessarily indicative of future performance and that unit prices and investment returns may go down, as well as up.
Has the Fund achieved its objective?
The Fund achieved an average total return of 8.07% over the 5 years as compared to benchmark which registered an average total return of 2.84% over the same period. The Fund has met its objective of growing the value of investments in the longer term.
Strategies and Policies Employed
For the financial year under review, the Fund invested generally according to a balanced mix between Shariah-compliant equities and Sukuk ranging between 40% and 60% for either asset class. Investment Manager may opt to invest in the investments either directly or via unit trust funds. Islamic Equity The Fund investing up to a maximum 60% of its NAV in Shariah-compliant equities. Value-add from equities investments is derived from active stock selection with focus on undervalued Shariah-compliant stock relative to its
8.35 8.71
-1.02 4.89
8.07
5.98 5.08
-3.23
5.95
2.84
-10.00
-5.00
0.00
5.00
10.00
15.00
Tota
l Ret
urn
(%)
Financial Years Ended (30 September)
AmIslamic Balanced
50% FBM SI & 50% MGII

118
earnings growth potential and/or its intrinsic value. In the event that outlook for equity investments is not conducive, the Fund can choose to have a minimum exposure of 40% in Shariah-compliant equity securities. Islamic Debt Securities The Fund investing up to a maximum 60% of its NAV in Sukuk and Islamic money market instruments. In buying and selling such instruments for the Fund, the Investment Manager used active tactical duration management, yield curve positioning and credit spread arbitraging. This approach also involves an analysis of general economic and market conditions. This approach also involves an analysis of general economic and market conditions. It also involves the use of models that analyse and compare expected returns and assumed risk. Under this approach, the Investment Manager focused on Shariah-compliant instruments that would deliver favourable return in light of the risk. The Investment Manager also considered Shariah-compliant investments with a more favourable or improving credit or industry outlook that provide the potential for capital appreciation. The investment management team adopted an active trading stance, and will not consider portfolio turnover as a limiting factor in ensuring that the Fund meets its investment objective.
Portfolio Structure
This table below is the asset allocation of the Fund for the financial years under review. As at
30-9-2017 %
As at 30-9-2016
%
Changes
% Construction 6.38 6.32 0.06 Consumer products - 1.61 -1.61 Industrial products 10.13 12.14 -2.01 Infrastructure 3.45 0.61 2.84 Plantation 3.41 3.37 0.04 Properties 1.58 2.87 -1.29 Technology 11.47 3.41 8.06 Trading/Services 23.12 26.00 -2.88 Corporate sukuk 26.48 29.76 -3.28 Cash and others 13.98 13.91 0.07 Total 100.00 100.00
For the financial year under review, while the Fund overall exposure was relatively unchanged at 86.02%, the Fund exposure to equity was raised to 59.54% from 56.33%. On equities, the Fund increased exposure in technology, infrastructure while maintaining exposure in the construction sector. Meanwhile, exposure in trading and services, properties, industrial products and consumer products were reduced. As at end financial year under review, the Fund exposure on corporate sukuk and cash were at 26.48% and 13.98% respectively.

119
Distribution/ Unit splits
There was no income distribution and unit split declared for the financial year under review.
State of Affairs
There has been neither significant changes to the state of affairs of the Fund nor any circumstances that materially affect any interests of the unitholders during the financial year under review.
Rebates and Soft Commission
It is our policy to pay all rebates to the Fund. Soft commission received from brokers/dealers are retained by the Manager only if the goods and services provided are of demonstrable benefit to unitholders of the Fund. During the financial year under review, the Manager had received on behalf of the Fund, soft commissions in the form of fundamental database, financial wire services, technical analysis software and stock quotation system incidental to investment management of the Fund. These soft commissions received by the Manager are deem to be beneficial to the unitholders of the Fund.
Market Review
Equity The market started the period under review on a positive note. The Government announced its Budget 2017 with Gross Domestic Product (“GDP”) growth is forecasted to be within 4-5%. 2017 Budget includes plans to set up small to mid-cap research PLC and allocation of a special fund of up to RM3bn to fund managers to invest in small to mid-cap Public Listed Companies (“PLC”). The ringgit ended higher against the US dollar following the tabling of Budget 2017 which lifted foreign investors' confidence, thus creating a better demand for the local currency. In November 2016, market underwent heavy selling pressure due to surge in US Treasury yields and the measure of its full impact to emerging markets currencies. This was on the back of the outcomes of the recent US presidential election. The Ringgit weakened 6% and 10Y Malaysian Government Securities (“MGS”) yield spiked up to 4.35% on fears of Fed rate hike. The external negative sentiments outweigh better than expected 3Q2016 GDP numbers of 4.3%. Malaysia's economy grew 4.3 per cent in the third quarter from year-ago levels, accelerating after five straight quarters of decline. The growth was stronger than the median forecast of 4.1 per cent and better than the 4.0 per cent growth posted in the second quarter. Sentiment recovered in December 2016, following Organization of Petroleum Exporting Countries (“OPEC”) agreeing to reduce production by c1.2 million barrels per day (“mbd”) bringing its output ceiling to 32.5mbd. The duration of the cut is 6 months effective 1 Jan 2017, with a possibility to extend for another 6 months, sending oil prices from the level of USD50/barrel to almost USD54/barrel at the peak in the month of December. BNM introduced six measures to enhance the liquidity and depth of the onshore market effective 5 Dec. But, in the month, we still saw the ringgit weakening against the USD moving from RM4.45/USD to RM4.49/USD as foreigners kept
120
selling out of the Malaysian bond and equity market. It also did not help that the 3Q16 results performance came in weaker than expected. We saw negative revisions to earnings but believe that the pace of downward revisions has slowed. The Federal Reserve increased its key interest rate by 0.25% on 14 Dec 2016 which led to the weakening of all EM currencies including the ringgit. But, as we approached the end of the year, we saw some window dressing activities taking place. Year 2017 started on a positive note, spurred by foreign inflow on the back of an improving ringgit from 4.48RM/USD to 4.43RM/USD, and stabilizing oil prices at USD50-55/bbl. The market was also be boosted by some repositioning and reallocation of funds at the start of the year. Improving sentiment on local banks and M&A news flow on major GLCs such as Sime Darby and UMW further boosted the buoyant mood on local equities. Apart from that, deferment of punitive regulations (i.e. levy for foreign workers) until 2018 helped to recover investor confidence on less downside risk to future earnings. The month of February 2017 started off with another round of rallies in equities, supported by further net foreign inflows of c. RM1 bil (YTD 2017:RM1.5 bil), with oil prices hovering within the USD52-55/bbl band and ringgit averaging 4.44RM/USD. We saw trading interest on all fronts i.e. big to small cap stocks. The index peaked above 1700 towards the end of February, but ended the month slightly lower at 1694 on profit taking. Post the February result season (for 4Q 2016 results), data shows that 21% of companies recorded results above our expectations - the best quarter so far in the past one year. MSCI Malaysia 2017 earnings were revised lower by -0.1% mom in February. However more significantly, it shows a bottoming of 2017 earnings expectation as this was the lowest negative revision since January 2016. Most upgrades came from Materials, Energy and Consumers sectors, whilst downgrades were from Real Estate, Telco and Utilities. In March 2017, the global and regional equity markets continued their rallies. For the local bourse, trading interest shifted to mid and small-cap stocks and on property and technology stocks. Highlight of the month was the announcement of the Digital Free Trade Zone by the PM during Jack Ma’s visit in KL. Maybank and CIMB also announced partnership with Ant Financial Services Group to enable the Alipay mobile wallet in Malaysia. Furthermore, Malaysian Digital Economy Corp announced that Multimedia Super Corridor companies have recorded new investments of RM16.3 bil in 2016.
The upward momentum continued in April, as sentiment was supported by a stronger ringgit, improving outlook for corporate earnings and strong inflow of foreign funds. The broader market outperformed the KLCI, with the FBM EMAS up 2.2% mom to 12,631pts. However, average daily value traded on Bursa in April fell by 8% mom to RM2.8bn.

121
The finance, technology and energy sectors outperformed the market. The energy sector outperformed, on the back of continued optimism about Saudi Aramco’s potential USD7 bil investment in RAPID. The financial sector outperformed, presumably on reflation trade. Materials were a major underperformer, led by Lafarge and PChem, on a weaker pricing environment. Consumer staples underperformed on lower CPO prices, while defensive utilities continued to underperform. After a strong performance in the first 4 months of 2017, the market paused its uptrend in May. News of the Bandar Malaysia deal cancellation by the Malaysian government caused dampened sentiment on fears of reversal of capital inflows from China; these were subsequently eased when Malaysia signed more MoUs with China at the One Belt One Road (“OBOR”) conference one week later. Stronger-than-expected GDP growth for 1Q17 was offset by an earnings season that did not see much surprise on the upside due to high expectations. In June, the market started the month trending higher but failed to hold on to its gain as profit-taking sets in due to concerns over valuations. The results release for the period of April-June saw substantial downgrades in consensus estimates in telcos, utilities, consumer discretionary & staples, whilst substantial upgrades were on technology, healthcare and energy.
The market was range bound in the month of July, with a lack of catalysts to drive the market. Invest Malaysia saw a higher turnout however, indicating renewed investor interest in Malaysia. As usual, the government announced several measures at the event, including (1) the Leading Entrepreneur Accelerator Platform (“LEAP”) market (2) a single regulator for the property sector. The listing of Lotte Chemical Titan, the largest IPO since 2012, turned out terribly for investors as the stock dropped 23% in a single day on 31 July after it announced a headline 67% QoQ and 72% YoY drop in 2Q17 net profit. Adjusted for exceptionals, the decline was more moderate at 17% QoQ and 36% YoY. However, due to the ineffective guidance by management, the damage to the stock’s marketability has been substantial. The lackluster performance continued in the month of August 2017. After seven consecutive months of net buy, foreign investors turned marginal net sellers of Malaysia equities at RM0.3 bil. This brought the eight months cumulative foreign buy to RM10.9 bil. This was consistent with their retracement in the other ASEAN emerging markets. For the month of August 2017, the key attraction to the market development was the 2Q17 corporate results reporting season, where corporate results have been lackluster in general. Although 2Q17 corporate earnings report card has been somewhat subdued and unexciting, we believe that 2H17 earnings should be stronger due to 1) 2Q17 5.8% GDP growth is the strongest in the past 2 years; 2) Ringgit has been stabilising; 3) improving labour market coupled with continued wage growth and moderating inflation will support and spur domestic economy

122
and 4) government's continuous effort in the ongoing roll-out of infrastructure projects. In September 2017, foreign outflows continue, with net outflow of RM0.8 bil (Aug: -RM0.3 bil), bringing down the Year-to-Date (“YTD”) cumulative foreign buy to RM10.0 bil. Crude oil price spiked 13.0% m.o.m to US$58/bbl, leading to outperformance in the Energy sector. The oil price were driven by hurricanes in US which have disrupted some oil logistics; Geopolitical issue in middle-east where Turkey is threatening to stop oil flow from Iraq’s Kurdish area which will affect up to 1.5% of global oil supply; OPEC’s rhetoric to extend production cut to Dec18 from Mac18. Telco and Material sectors were outperformers too. For the period under review, FBM Shariah Index (FBMS) ended at 12,797.37 points, a gain of 3.64%. Fixed Income Malaysian Government Securities (“MGS”) yields rose during the financial year, with the 10Y MGS yield climbing from 3.54% to 3.91%. There was significant volatility in the MGS market, with yields climbing sharply towards the end of 2016 before broadly trending down in 1H2017. The increase in yields was due to a rise in US Treasury yields and a withdrawal of foreign funds from the domestic bond market, foreign holding of Malaysian government debt declined from MYR 185b to 149b during the financial year. Malaysia’s real GDP growth recorded a stronger growth of 5.6% YoY in 1Q2017 (4Q2016: +4.5%), on the back of stronger external activities and domestic demand. 2Q2017 GDP grew 5.8% YoY, supported mainly by private sector spending. As a result of stronger imports, the current account surplus narrowed to MYR5.3b in 1Q2017. For the whole of 2017, Bank Negara Malaysia (“BNM”) expects our current account surplus to remain positive albeit narrowing YoY. Malaysia’s Consumer Price Index (“CPI”) surged to a high of 5.1% YoY in March 2017 due to the impact of the two 20 cent price hikes on RON95 in January and February. However, it has subsequently moderated down to 4.4% YoY in April and 3.9% YoY in May in line with the drop-in retail petrol prices. BNM foreign reserves stood at USD98.7b as at mid-June 2017. This was after 6 consecutive months of increase, aided by a reversal of foreign flows in Malaysia’s bond market as foreign funds bought +RM10.1b in May and +RM6.8b in April respectively. The reserves are equivalent to 8.1 months of retained imports and provide a 1.1 times coverage of short-term external debt. During the financial year S&P reaffirmed Malaysia at A-/Sta on expectations of continued prudence by the Government in undertaking Malaysia’s economic and budgetary policies. Nevertheless, S&P did raise concerns on the country’s high household debt as well as uncertainty in refinancing cost amidst negative

123
news flow from 1MDB. The Federal Reserve hiked rates 3 times during the financial year, hiking by 25bps each during its December, March and June meetings.
Market Outlook
The key focus for the local market in October was the Budget 2018, which is also known as the pre-election budget. The continuous BR1M handout and income tax reduction is expected to lift private consumption, hence further strengthened our overweight call on the consumer sector. Furthermore, we view that the local consumer spending is poised to recover since the implementation of GST more than 2 years ago. In the budget, the government reiterated its commitment towards the main stream transportation-led projects which will continue to drive the construction sector. On top of this, the special end-financing scheme for PR1MA buyers has now been extended to private developers as well, with the aim of helping first-time home buyers to obtain loans. This will benefit the banks as loan approvals are expected to escalate going forward. The GDP growth forecast for this year has also been raised to 5.2-5.7% during the budget, up from 4.3-4.8%. Authority expects growth to remain sanguine, albeit slightly lower at 5.0-5.5% in 2018. Overall, we believe that the Budget 2018 is positive to most of the sectors that we previously favored and continue to favor such as financial, consumer, construction/infrastructure, technology and export players. Going forward, we believe the market will refocus on external developments, namely 1) US-North Korea conflicts; 2) US tax reform; 3) Fed rate hike and 4) Middle Eastern tensions while on the local front, we are watchful on 1) the upcoming 3Q17 reporting season and 2) election developments
Additional Information
Following the renewal of the Master Prospectus effective from 10 September 2017, the “Counterparty Credit Risk” has been included on page 43 as the inclusion in the Fund explicitly describes the risk in counterparty dealing instead of issuer/obligor credit. The insertion of this risk is for clarity purposes. Counterparty Credit Risk Counterparty credit risk is the risk arising from the possibility that the counterparty may default or not able to fulfill a trade settlement prior or on the settlement date of the trade. This could adversely affect the value of the Fund. For more details, kindly refer to the Master Prospectus dated 10 September 2017.
Kuala Lumpur, Malaysia AmFunds Management Berhad 7 November 2017

Independent auditors’ report to the unitholders of AmIslamic Balanced
Report on the audit of the financial statements
Opinion
Basis for opinion
Independence and other ethical responsibilities
Information other than the financial statements and auditors’ report thereon
We have audited the financial statements of AmIslamic Balanced (“the Fund”), which comprise thestatement of financial position as at 30 September 2017, and the statement of comprehensiveincome, statement of changes in equity and statement of cash flows for the year then ended, andnotes to the financial statements, including a summary of significant accounting policies, as set outon pages 127 to 153.
In our opinion, the accompanying financial statements give a true and fair view of the financialposition of the Fund as at 30 September 2017 and of its financial performance and its cash flows forthe year then ended in accordance with Malaysian Financial Reporting Standards and InternationalFinancial Reporting Standards.
We conducted our audit in accordance with approved standards on auditing in Malaysia andInternational Standards on Auditing. Our responsibilities under those standards are further describedin the Auditor’s Responsibilities for the Audit of the Financial Statements section of our report. Webelieve that the audit evidence we have obtained is sufficient and appropriate to provide a basis forour opinion.
We are independent of the Fund in accordance with the By-Laws (on Professional Ethics, Conductand Practice) of the Malaysian Institute of Accountants (“By-Laws”) and the International EthicsStandards Board for Accountants’ Code of Ethics for Professional Accountants (“IESBA Code”),and we have fulfilled our other ethical responsibilities in accordance with the By-Laws and theIESBA Code.
The Manager is responsible for the other information. The other information comprises informationin the Annual Report, but does not include the financial statements of the Fund and our auditors’report thereon.
Our opinion on the financial statements of the Fund does not cover the other information and we donot express any form of assurance conclusion thereon.
In connection with our audit of the financial statements of the Fund, our responsibility is to read theother information and, in doing so, consider whether the other information is materially inconsistentwith the financial statements of the Fund or our knowledge obtained in the audit or otherwiseappears to be materially misstated.
124

Independent auditors’ report to the unitholders of AmIslamic Balanced (cont’d.)
Responsibilities of the Manager and the Trustees for the financial statements
Auditor’s responsibilities for the audit of the financial statements
As part of an audit in accordance with the approved standards on auditing in Malaysia andInternational Standards on Auditing, we exercise professional judgment and maintain professionalskepticism throughout the planning and performance of the audit. We also:
Our objectives are to obtain reasonable assurance about whether the financial statements of the Fund,as a whole are free from material misstatement, whether due to fraud or error, and to issue anauditors’ report that includes our opinion. Reasonable assurance is a high level of assurance, but isnot a guarantee that an audit conducted in accordance approved standards on auditing in Malaysiaand International Standards on Auditing will always detect a material misstatement when it exists.Misstatements can arise from fraud or error and are considered material if, individually or in theaggregate, they could reasonably be expected to influence the economic decisions of users taken onthe basis of these financial statements.
If based on the work we have performed, we conclude that there is a material misstatement of thisother information, we are required to report that fact. We have nothing to report in this regard.
The Manager is responsible for the preparation of the financial statements of the Fund that give atrue and fair view in accordance with Malaysian Financial Reporting Standards and InternationalFinancial Reporting Standards. The Manager is also responsible for such internal control as theManager determines is necessary to enable the preparation of financial statements of the Fund thatare free from material misstatement, whether due to fraud or error.
In preparing the financial statements of the Fund, the Manager is responsible for assessing theFund’s ability to continue as a going concern, disclosing, as applicable, matters related to goingconcern and using the going concern basis of accounting unless the Manager either intends toliquidate the Fund or to cease operations, or has no realistic alternative to do so.
The Trustee is responsible for ensuring that the Manager maintains proper accounting and otherrecords as are necessary to enable true and fair presentation of these financial statements.
Identify and assess the risks of material misstatement of the financial statements of the Fund,whether due to fraud or error, design and perform audit procedures responsive to those risks,and obtain audit evidence that is sufficient and appropriate to provide a basis for our opinion.The risk of not detecting a material misstatement resulting from fraud is higher than for oneresulting from error, as fraud may involve collusion, forgery, intentional omissions,misrepresentations, or the override of internal control.
Obtain an understanding of internal control relevant to the audit in order to design auditprocedures that are appropriate in the circumstances, but not for the purpose of expressing anopinion on the effectiveness of the Fund’s internal control.
125

Independent auditors’ report to the unitholders of AmIslamic Balanced (cont’d.)
Other matters
Ernst & Young Wan Daneena Liza Bt Wan Abdul RahmanAF: 0039 No. 2978/03/18(J)Chartered Accountants Chartered Accountant
Kuala Lumpur, Malaysia7 November 2017
We communicate with the Manager regarding, among other matters, the planned scope and timing ofthe audit and significant audit findings, including any significant deficiencies in internal control thatwe identify during our audit.
This report is made solely to the unitholders of the Fund, as a body, and for no other purpose. We donot assume responsibility to any other person for the content of this report.
Evaluate the appropriateness of accounting policies used and the reasonableness ofaccounting estimates and related disclosures made by the Manager.
Conclude on the appropriateness of the Manager’s use of the going concern basis ofaccounting and, based on the audit evidence obtained, whether a material uncertainty existsrelated to events or conditions that may cast significant doubt on the Fund’s ability tocontinue as a going concern. If we conclude that a material uncertainty exists, we arerequired to draw attention in our auditors’ report to the related disclosures in the financialstatements or, if such disclosures are inadequate, to modify our opinion. Our conclusions arebased on the audit evidence obtained up to the date of our auditors’ report. However, futureevents or conditions may cause the Fund to cease to continue as a going concern.
Evaluate the overall presentation, structure and content of the financial statements of theFund, including the disclosures, and whether the financial statements of the Fund representthe underlying transactions and events in a manner that achieves fair presentation.
126

AmIslamic Balanced
STATEMENT OF FINANCIAL POSITIONAS AT 30 SEPTEMBER 2017
2017 2016Note RM RM
ASSETSShariah-compliant investments 4 5,004,245 5,863,187 Deposit with financial institution 5 833,878 - Dividends receivable 7,065 5,397 Sundry receivables 6 - 86,605 Cash at banks 1,352 915,375
TOTAL ASSETS 5,846,540 6,870,564
LIABILITIESAmount due to Manager 7 7,748 12,465 Amount due to Trustee 8 290 346 Sundry payables and accrued expenses 6 20,834 47,257
TOTAL LIABILITIES 28,872 60,068
EQUITYUnitholders’ capital 11(a) (4,024,509) (2,522,130)Retained earnings 11(b)(c) 9,842,177 9,332,626
TOTAL EQUITY 11 5,817,668 6,810,496
TOTAL EQUITY AND LIABILITIES 5,846,540 6,870,564
UNITS IN CIRCULATION 11(a) 12,938,024 16,367,703
NET ASSET VALUE PER UNIT 44.97 sen 41.61 sen
The accompanying notes form an integral part of the financial statements.
127

AmIslamic Balanced
STATEMENT OF COMPREHENSIVE INCOMEFOR THE FINANCIAL YEAR ENDED 30 SEPTEMBER 2017
2017 2016Note RM RM
SHARIAH-COMPLIANT INVESTMENT INCOMEGross dividend income 88,390 92,874 Profit income 119,376 155,005 Net gain from Shariah-compliant investments:− Financial assets at fair value through profit or loss (“FVTPL”) 9 428,716 252,117
Gross Income 636,482 499,996
EXPENDITUREManager’s fee 7 (98,122) (111,624)Trustee’s fee 8 (3,925) (4,465)Auditors’ remuneration - current financial year (5,500) (5,000)Auditors’ remuneration - over provision in prior financial year 4,000 - Tax agent’s fee (5,000) (5,000)Custodian’s fee (658) (927)Other expenses 10 (17,726) (20,670)
Total Expenditure (126,931) (147,686)
NET INCOME BEFORE TAX 509,551 352,310 LESS: INCOME TAX 13 - -
NET INCOME AFTER TAX 509,551 352,310
OTHER COMPREHENSIVE INCOME - -
TOTAL COMPREHENSIVE INCOME FOR THE FINANCIAL YEAR 509,551 352,310
Total comprehensive income comprises the following: Realised income 337,618 294,090 Unrealised gain 171,933 58,220
509,551 352,310
The accompanying notes form an integral part of the financial statements.
128

AmIslamic Balanced
STATEMENT OF CHANGES IN EQUITYFOR THE FINANCIAL YEAR ENDED 30 SEPTEMBER 2017
Unitholders’ Retained Total capital earnings equity
Note RM RM RM
At 1 October 2015 (1,590,736) 8,980,316 7,389,580 Total comprehensive income for
the financial year - 352,310 352,310 Creation of units 11(a) 381,078 - 381,078 Cancellation of units 11(a) (1,312,472) - (1,312,472)
Balance at 30 September 2016 (2,522,130) 9,332,626 6,810,496
At 1 October 2016 (2,522,130) 9,332,626 6,810,496 Total comprehensive income for
the financial year - 509,551 509,551 Creation of units 11(a) 2,561,090 - 2,561,090 Cancellation of units 11(a) (4,063,469) - (4,063,469)
Balance at 30 September 2017 (4,024,509) 9,842,177 5,817,668
The accompanying notes form an integral part of the financial statements.
129

AmIslamic Balanced
STATEMENT OF CASH FLOWSFOR THE FINANCIAL YEAR ENDED 30 SEPTEMBER 2017
2017 2016Note RM RM
CASH FLOWS FROM OPERATING ANDINVESTING ACTIVITIES
Proceeds from maturity/sale of Shariah-compliant investments 4,510,816 4,745,232
Dividends received 86,722 93,904 Profit received 117,170 158,357 Tax refunded - 1,424 Manager’s fee paid (99,037) (112,735)Trustee’s fee paid (3,981) (4,510)Tax agent’s fee paid (5,000) (5,000)Custodian’s fee paid (658) (927)Payments for other expenses (19,706) (25,210)Purchase of Shariah-compliant investments (3,160,290) (4,580,816)
Net cash generated from operating and investing activities 1,426,036 269,719
CASH FLOWS FROM FINANCING ACTIVITIES Proceeds from creation of units 2,561,090 381,078 Payments for cancellation of units (4,067,271) (1,312,802)
Net cash used in financing activities (1,506,181) (931,724)
NET DECREASE IN CASH AND CASH EQUIVALENTS (80,145) (662,005)
CASH AND CASH EQUIVALENTS AT BEGINNING OF FINANCIAL YEAR 915,375 1,577,380
CASH AND CASH EQUIVALENTS AT END OF FINANCIAL YEAR 835,230 915,375
Cash and cash equivalents comprise:Deposit with financial institution 5 833,878 - Cash at banks 1,352 915,375
835,230 915,375
The accompanying notes form an integral part of the financial statements.
130
AmIslamic Balanced
NOTES TO THE FINANCIAL STATEMENTS
1. GENERAL INFORMATION
2. BASIS OF PREPARATION OF FINANCIAL STATEMENTS
Standards effective during the financial year
Standards issued but not yet effective
Effective for financial periods
beginning on or after
MFRS 9: Financial InstrumentsMFRS 15: Revenue From Contracts With Customers
AmIslamic Balanced (“the Fund”) was established pursuant to a Deed dated 2 September 2004 asamended by Deeds Supplemental thereto (“the Deed”), between AmFunds Management Berhad asthe Manager, AmanahRaya Trustees Berhad as the Trustee and all unitholders.
The financial statements of the Fund have been prepared in accordance with Malaysian FinancialReporting Standards (“MFRS”) as issued by the Malaysian Accounting Standards Board (“MASB”)and are in compliance with International Financial Reporting Standards.
The financial statements of the Fund have been prepared under the historical cost convention, unlessotherwise stated in the accounting policies.
The adoption of MFRS which have been effective during the financial year did not have any materialfinancial impact to the financial statements.
As at the date of authorisation of these financial statements, the following Standards, which arerelevant to the Fund, have been issued by MASB but are not yet effective and have not been adoptedby the Fund.
1 January 2018
The Fund plans to adopt the above pronouncements when they become effective in the respectivefinancial periods. These pronouncements are expected to have no significant impact to the financialstatements of the Fund upon their initial application except as described below:
1 January 2018
The Fund was set up with the objective of providing investors with a means to pool and invest theirfunds in a professionally managed portfolio of Shariah-compliant equities and other non-interestbearing securities. The Fund aims to grow the value of investment in the longer term with lowervolatility through asset diversification, which conforms to Principles of Shariah. As provided in theDeed, the “accrual period” or the financial year shall end on 30 September and the units of the Fundwere first offered for sale on 10 September 2004.
131

MFRS 9 Financial Instruments
3. SIGNIFICANT ACCOUNTING POLICIES
Income recognition
Income tax
Functional and presentation currency
Statement of cash flows
The Fund adopts the direct method in the preparation of the statement of cash flows.
Distribution
Dividend income is recognised when the Fund’s right to receive payment is established. Profitincome on Shariah-compliant fixed income securities and Islamic short-term deposits are recognisedon an accrual basis using the effective profit method, which includes the accretion of discounts andamortisation of premiums.
Current taxes are recognised in profit or loss except to the extent that the tax relates to itemsrecognised outside profit or loss, either in other comprehensive income or directly in equity.
Functional currency is the currency of the primary economic environment in which the Fundoperates that most faithfully represents the economic effects of the underlying transactions. Thefunctional currency of the Fund is Ringgit Malaysia which reflects the currency in which the Fundcompetes for funds, issues and redeems units. The Fund has also adopted Ringgit Malaysia as itspresentation currency.
Current tax assets and liabilities are measured at the amount expected to be recovered from or paidto the tax authorities. The tax rates and tax laws used to compute the amount are those that areenacted or substantively enacted at the reporting date.
Income is recognised to the extent that it is probable that the economic benefits will flow to the Fundand the income can be reliably measured. Income is measured at the fair value of considerationreceived or receivable.
MFRS 9 reflects International Accounting Standards Board’s (“IASB”) work on the replacement ofMFRS 139 Financial Instruments: Recognition and Measurement (“MFRS 139”). MFRS 9 will beeffective for financial year beginning on or after 1 January 2018. The Fund is in the process ofquantifying the impact of the first adoption of MFRS 9.
Cash equivalents are short-term, highly liquid Shariah-compliant investments that are readilyconvertible to cash with insignificant risk of changes in value.
Distributions are at the discretion of the Fund. A distribution to the Fund’s unitholders is accountedfor as a deduction from realised reserves. A proposed distribution is recognised as a liability in theperiod in which it is approved.
132

Unitholders’ capital
Financial assets
(i) Financial assets at FVTPL
(ii) Receivables
On disposal of Shariah-compliant investments, the net realised gain or loss on disposal ismeasured as the difference between the net disposal proceeds and the carrying amount of theShariah-compliant investments. The net realised gain or loss is recognised in profit or loss.
The unitholders’ capital of the Fund meets the definition of puttable instruments and is classified asequity instruments under MFRS 132 Financial Instruments: Presentation (“MFRS 132”).
Financial assets are recognised in the statement of financial position when, and only when, the Fundbecomes a party to the contractual provisions of the financial instrument.
For Shariah-compliant investments in quoted securities, market value is determined based on theclosing price quoted on Bursa Malaysia Securities Berhad and for Shariah-compliantinvestments in unquoted fixed income securities, fair value is determined based on the indicativeprices from Bond Pricing Agency Malaysia Sdn Bhd plus accrued profit, which includes theaccretion of discount and amortisation of premium. Adjusted cost of Shariah-compliantinvestments relates to the purchase cost plus accrued profit, adjusted for amortisation ofpremium and accretion of discount, if any, calculated over the period from the date of acquisitionto the date of maturity of the respective securities as approved by the Manager and the Trustee.Unrealised gains or losses recognised in profit or loss are not distributable in nature.
Financial assets are classified as financial assets at FVTPL if they are held for trading or aredesignated as such upon initial recognition. Financial assets held for trading by the Fund includeShariah-compliant equity securities and Shariah-compliant fixed income securities acquiredprincipally for the purpose of selling in the near term.
Financial assets with fixed or determinable payments that are not quoted in an active market areclassified as receivables.
When financial assets are recognised initially, they are measured at fair value, plus, in the case offinancial assets not at fair value through profit or loss, directly attributable transaction costs.
The Fund determines the classification of its financial assets at initial recognition, and the categoriesapplicable to the Fund include financial assets at fair value through profit or loss (“FVTPL”) andreceivables.
Subsequent to initial recognition, financial assets at FVTPL are measured at fair value. Changesin the fair value of those financial instruments are recorded in ‘Net gain or loss on financialassets at fair value through profit or loss’. Dividend revenue and profit earned elements of suchinstruments are recorded separately in ‘Gross dividend income’ and ‘Profit income’ respectively.
133

Impairment of financial assets
(i) Receivables carried at amortised cost
Financial liabilities
A financial liability is derecognised when the obligation under the liability is extinguished. Gainsand losses are recognised in profit or loss when the liabilities are derecognised, and through theamortisation process.
Financial liabilities, within the scope of MFRS 139, are recognised in the statement of financialposition when, and only when, the Fund becomes a party to the contractual provisions of thefinancial instrument.
Subsequent to initial recognition, receivables are measured at amortised cost using the effectiveprofit method. Gains and losses are recognised in profit or loss when the receivables arederecognised or impaired, and through the amortisation process.
If any such evidence exists, the amount of impairment loss is measured as the difference between the asset’s carrying amount and the present value of estimated future cash flows discounted atthe financial asset’s original effective profit rate. The impairment loss is recognised in profit orloss.
The carrying amount of the financial asset is reduced through the use of an allowance account.When a receivable becomes uncollectible, it is written off against the allowance account.
The Fund’s financial liabilities are recognised initially at fair value plus directly attributabletransaction costs and subsequently measured at amortised cost using the effective profit method.
If in a subsequent period, the amount of the impairment loss decreases and the decrease can berelated objectively to an event occurring after the impairment was recognised, the previouslyrecognised impairment loss is reversed to the extent that the carrying amount of the asset doesnot exceed its amortised cost at the reversal date. The amount of reversal is recognised in profitor loss.
The Fund assesses at each reporting date whether there is any objective evidence that a financialasset is impaired.
To determine whether there is objective evidence that an impairment loss on financial assets hasbeen incurred, the Fund considers factors such as the probability of insolvency or significantfinancial difficulties of the debtor and default or significant delay in payments.
Financial liabilities are classified according to the substance of the contractual arrangements enteredinto and the definitions of a financial liability.
134

Classification of realised and unrealised gains and losses
Significant accounting estimates and judgments
4. SHARIAH-COMPLIANT INVESTMENTS
2017 2016RM RM
Financial assets at FVTPL
Quoted Shariah-compliant equity securities in Malaysia 3,463,870 3,818,278 Quoted Shariah-compliant warrants in Malaysia - 17,967 Unquoted Shariah-compliant fixed income securities
in Malaysia 1,540,375 2,026,942
5,004,245 5,863,187
The Fund classifies its Shariah-compliant investments as financial assets at FVTPL as the Fund maysell its Shariah-compliant investments in the short-term for profit-taking or to meet unitholders’cancellation of units.
No major judgments have been made by the Manager in applying the Fund’s accounting policies.There are no key assumptions concerning the future and other key sources of estimation uncertaintyat the reporting date, that have a significant risk of causing a material adjustment to the carryingamounts of assets and liabilities within the next financial year.
The preparation of the Fund’s financial statements requires the Manager to make judgments,estimates and assumptions that affect the reported amounts of revenues, expenses, assets andliabilities, and the disclosure of contingent liabilities at the reporting date. However, uncertaintyabout these assumptions and estimates could result in outcomes that could require a materialadjustment to the carrying amount of the asset or liability in the future.
Unrealised gains and losses comprise changes in the fair value of financial instruments for the periodand from reversal of prior period’s unrealised gains and losses for financial instruments which wererealised (i.e. sold, redeemed or matured) during the reporting period.
Realised gains and losses on disposals of financial instruments classified at fair value through profitor loss are calculated using the weighted average method. They represent the difference between aninstrument’s initial carrying amount and disposal amount.
135

Details of Shariah-compliant investments as at 30 September 2017 are as follows:
Marketvalue as a
percentage ofNumber Market Purchase net asset
Name of company of shares value cost valueRM RM %
Quoted Shariah-compliant equity securities in Malaysia
ConstructionEconpile Holdings Berhad 38,900 118,645 49,582 2.04Gamuda Berhad 8,800 46,464 39,773 0.80 IJM Corporation Berhad 36,200 119,460 95,965 2.05WCT Holdings Berhad 49,498 86,621 87,443 1.49
133,398 371,190 272,763 6.38
Industrial productsCahya Mata Sarawak Berhad 25,000 100,250 102,907 1.72DRB-Hicom Berhad 28,500 46,455 51,504 0.80 Kossan Rubber Industries Berhad 16,600 114,540 108,995 1.97PETRONAS Chemicals Group
Berhad 20,500 149,445 135,079 2.57V.S. Industry Berhad 67,100 178,486 84,964 3.07
157,700 589,176 483,449 10.13
Infrastructure DiGi.Com Berhad 16,300 79,870 65,667 1.37TIME dotCom Berhad 13,600 120,768 122,095 2.08
29,900 200,638 187,762 3.45
PlantationGenting Plantations Berhad 9,000 92,700 104,092 1.59Kuala Lumpur Kepong Berhad 4,300 105,608 82,456 1.82
13,300 198,308 186,548 3.41
PropertiesEco World Development
Group Berhad 59,300 91,915 81,469 1.58
(Forward)
136

Marketvalue as a
percentage ofNumber Market Purchase net asset
Name of company of shares value cost valueRM RM %
Quoted Shariah-compliant equity securities in Malaysia
TechnologyGlobetronics Technology Berhad 29,200 179,580 163,558 3.09Inari Amertron Berhad 62,600 159,004 93,632 2.73KESM Industries Berhad 12,000 192,000 67,872 3.30 Vitrox Corporation Berhad 30,800 136,752 101,732 2.35
134,600 667,336 426,794 11.47
Trading/ServicesAxiata Group Berhad 26,000 136,240 124,513 2.34Dialog Group Berhad 52,008 104,016 71,945 1.79IHH Healthcare Berhad 10,000 57,500 63,023 0.99PETRONAS Dagangan Berhad 2,000 48,640 51,002 0.84Pos Malaysia Berhad 24,700 129,675 112,973 2.23Sime Darby Berhad 37,564 338,827 327,108 5.82Telekom Malaysia Berhad 20,105 130,683 113,737 2.24Tenaga Nasional Berhad 25,200 360,864 245,269 6.20 Westports Holdings Berhad 10,200 38,862 36,209 0.67
207,777 1,345,307 1,145,779 23.12
Total quoted Shariah-compliant equity securities 735,975 3,463,870 2,784,564 59.54
Fairvalue as a
percentage ofMaturity Credit Nominal Fair Adjusted net asset
date Issuer rating value value cost valueRM RM RM %
Unquoted Shariah-compliant fixed income securities in Malaysia
Corporate sukuk
15.04.2020 DRB-Hicom Berhad A 300,000 307,581 311,734 5.29
(Forward)
137

Fairvalue as a
percentage ofMaturity Credit Nominal Fair Adjusted net asset
date Issuer rating value value cost valueRM RM RM %
Unquoted Shariah-compliant fixed income securities in Malaysia
Corporate sukuk
03.05.2027 YTL PowerInternationalBerhad AA 700,000 723,039 714,527 12.43
27.08.2027 Celcom NetworksSdn Bhd AA 500,000 509,755 506,407 8.76
Total unquoted Shariah-compliant fixed income securities 1,500,000 1,540,375 1,532,668 26.48
Total financial assets at FVTPL 2,235,975 5,004,245 4,317,232 86.02
Excess of fair value over cost 687,013
The weighted average effective yield on unquoted Shariah-compliant investments are as follows:
2017 2016% %
Corporate sukuk 5.53 5.04
Less than 1 year to More than 1 year 5 years 5 years
RM RM RM
2017At nominal value:Corporate sukuk - 300,000 1,200,000
(Forward)
Effective yield
Analyses of the remaining maturity of unquoted Shariah-compliant investments as at 30 September2017 and 30 September 2016 are as follows:
138

Less than 1 year to More than 1 year 5 years 5 years
RM RM RM
2016At nominal value:Corporate sukuk - 1,200,000 700,000
5. DEPOSIT WITH FINANCIAL INSTITUTION
2017 2016RM RM
At nominal value:Short-term deposit with a licensed Islamic bank 833,800 -
At carrying value:Short-term deposit with a licensed Islamic bank 833,878 -
Details of deposit with financial institution as at 30 September 2017 are as follows:
Carryingvalue as a
Maturity Nominal Carrying Purchase percentage ofdate Bank value value cost net asset value
RM RM RM %
Short-term deposit with a licensed Islamic bank
02.10.2017 Maybank IslamicBerhad 833,800 833,878 833,800 14.33
2017 2016 2017 2016% % Days Day
Short-term deposit with alicensed Islamic bank 3.40 - 2 -
Weighted average
The weighted average effective profit rate and average remaining maturity of short-term deposits areas follows:
effective profit rateRemainingmaturity
139

6. SUNDRY RECEIVABLES/PAYABLES AND ACCRUED EXPENSES
2017 2016RM RM
Amount owing from financial institutions - 86,605Amount owing to financial institutions - (25,943)
The normal trade credit period is three business days.
7. AMOUNT DUE TO MANAGER
2017 2016RM RM
Redemption of units* - (3,802)Manager’s fee payable (7,748) (8,663)
(7,748) (12,465)
* The amount represents amount payable to the Manager for units redeemed.
8. AMOUNT DUE TO TRUSTEE
The normal credit period in the previous and current financial years for Manager’s fee payable is onemonth.
The normal credit period in the previous and current financial years for creation and redemption ofunits is three business days.
Manager’s fee is at a rate of 1.50% (2016: 1.50%) per annum on the net asset value of the Fund,calculated on a daily basis.
Included in sundry receivables/payables and accrued expenses were amounts owing from/to financialinstitutions for outstanding contracts where settlement were not due as follows:
Trustee’s fee is at a rate of 0.06% (2016: 0.06%) per annum on the net asset value of the Fund,calculated on a daily basis.
The normal credit period in the previous and current financial years for Trustee’s fee payable is onemonth.
140

9. NET GAIN FROM SHARIAH-COMPLIANT INVESTMENTS
2017 2016RM RM
Net gain on financial assets at FVTPL comprised:− Net realised gain on sale of Shariah-compliant
investments 256,783 193,897 − Net unrealised gain on changes in fair values of
Shariah-compliant investments 171,933 58,220
428,716 252,117
10. OTHER EXPENSES
11. TOTAL EQUITY
Total equity is represented by:
2017 2016Note RM RM
Unitholders’ capital (a) (4,024,509) (2,522,130)Retained earnings− Realised income (b) 9,155,164 8,817,546 − Unrealised gain (c) 687,013 515,080
5,817,668 6,810,496
(a) UNITHOLDERS’ CAPITAL/UNITS IN CIRCULATION
Number of Number of units RM units RM
At beginning of the financial year 16,367,703 (2,522,130) 18,627,990 (1,590,736)
Creation during thefinancial year 6,132,473 2,561,090 930,483 381,078
Cancellation during the financial year (9,562,152) (4,063,469) (3,190,770) (1,312,472)
At end of the financial year 12,938,024 (4,024,509) 16,367,703 (2,522,130)
2016
Included in other expenses is Goods and Services Tax incurred by the Fund during the financial yearamounting to RM7,464 (2016: RM9,122).
2017
141

(b) REALISED – DISTRIBUTABLE
2017 2016RM RM
At beginning of the financial year 8,817,546 8,523,456
Total comprehensive income for the financial year 509,551 352,310 Net unrealised gain attributable to Shariah-
compliant investments held transferred to unrealised reserve [Note 11(c)] (171,933) (58,220)
Net increase in realised reserve for the financial year 337,618 294,090
At end of the financial year 9,155,164 8,817,546
(c) UNREALISED – NON-DISTRIBUTABLE
2017 2016RM RM
At beginning of the financial year 515,080 456,860 Net unrealised gain attributable to Shariah-
compliant investments held transferred from realised reserve [Note 11(b)] 171,933 58,220
At end of the financial year 687,013 515,080
12. UNITS HELD BY RELATED PARTIES
13. INCOME TAX
Income tax payable is calculated on Shariah-compliant investments income less deduction forpermitted expenses as provided for under Section 63B of the Income Tax Act, 1967.
Pursuant to Schedule 6 of the Income Tax Act, 1967, local profit income derived by the Fund isexempted from tax.
A reconciliation of income tax expense applicable to net income before tax at the statutory incometax rate to income tax expense at the effective income tax rate of the Fund is as follows:
The negative balance of unitholders’ capital was due to the cancellation of units at a higher netasset value per unit following the price appreciation of the Fund as compared to the units beingcreated at a lower net asset value per unit in prior years.
The Manager and parties related to the Manager did not hold any units in the Fund as at 30September 2017 and 30 September 2016.
142

2017 2016RM RM
Net income before tax 509,551 352,310
Taxation at Malaysian statutory rate of 24% 122,292 84,554 Tax effects of:
Income not subject to tax (152,756) (119,999)Restriction on tax deductible expenses for unit trust fund 23,374 26,296 Non-permitted expenses for tax purposes 4,493 6,227 Permitted expenses not used and not available for
future financial years 2,597 2,922
Tax expense for the financial year - -
14. DISTRIBUTION
15. MANAGEMENT EXPENSE RATIO (“MER”)
The Fund’s MER is as follows:
2017 2016% p.a. % p.a.
Manager’s fee 1.50 1.50 Trustee’s fee 0.06 0.06 Fund’s other expenses 0.38 0.42
Total MER 1.94 1.98
16. PORTFOLIO TURNOVER RATIO (“PTR”)
The MER of the Fund is the ratio of the sum of annualised fees and expenses incurred by the Fund tothe average net asset value of the Fund calculated on a daily basis.
No distribution was declared by the Fund for the financial years ended 30 September 2017 and 30September 2016.
The PTR of the Fund, which is the ratio of average total acquisitions and disposals of Shariah-compliant investments to the average net asset value of the Fund calculated on a daily basis, is 0.58times (2016: 0.63 times).
143

17. SEGMENTAL REPORTING
‒ A portfolio of Shariah-compliant equity instruments; and‒
Fixed Fixed Equity income Equity income
portfolio portfolio Total portfolio portfolio TotalRM RM RM RM RM RM
Gross dividend income 88,390 - 88,390 92,874 - 92,874
Profit income - 119,376 119,376 - 155,005 155,005 Net gain from
investments:‒ Financial assets
at FVTPL 424,299 4,417 428,716 167,273 84,844 252,117
Total segment investment incomefor the financialyear 512,689 123,793 636,482 260,147 239,849 499,996
Financial assets at FVTPL 3,463,870 1,540,375 5,004,245 3,836,245 2,026,942 5,863,187
Deposit with financialinstitution - 833,878 833,878 - - -
Dividends receivable 7,065 - 7,065 5,397 - 5,397 Amount owing from
brokers - - - 86,605 - 86,605
Total segment assets 3,470,935 2,374,253 5,845,188 3,928,247 2,026,942 5,955,189
Amount owing tobrokers - - - 25,943 - 25,943
Total segment liabilities - - - 25,943 - 25,943
The Manager and Investment Committee of the Fund are responsible for allocating resources available tothe Fund in accordance with the overall investment strategies as set out in the Investment Guidelines ofthe Fund. The Fund is managed by two segments:
A portfolio of Shariah-compliant fixed income instruments, including deposits with financialinstitutions.
The investment objective of each segment is to achieve consistent returns from the Shariah-compliantinvestments in each segment while safeguarding capital by investing in diversified portfolios. There havebeen no changes in reportable segments in the current financial year. The segment information providedis presented to the Manager and Investment Committee of the Fund.
20162017
144

2017 2016RM RM
Net reportable segment investment income 636,482 499,996 Less: Expenses (126,931) (147,686)
Net income before tax 509,551 352,310 Less: Income tax - -
Net income after tax 509,551 352,310
2017 2016RM RM
Total segment assets 5,845,188 5,955,189 Cash at banks 1,352 915,375
Total assets of the Fund 5,846,540 6,870,564
Total segment liabilities - 25,943 Amount due to Manager 7,748 12,465 Amount due to Trustee 290 346 Sundry payables and accrued expenses 20,834 21,314
Total liabilities of the Fund 28,872 60,068
18. TRANSACTIONS WITH BROKERS AND FINANCIAL INSTITUTIONS
Brokers/Financial institutionsRM % RM %
Standard Chartered Bank Malaysia Berhad 1,705,124 22.53 - - AmInvestment Bank Berhad* 1,662,308 21.97 6,629 33.05 JF Apex Securities Berhad 893,104 11.80 4,086 20.37 CIMB Bank Berhad 700,000 9.25 - -
(Forward)
Expenses of the Fund are not considered part of the performance of any investment segment. Thefollowing table provides reconciliation between the net reportable segment income and net income aftertax:
Transaction value duty and clearing feeBrokerage fee, stamp
In addition, certain assets and liabilities are not considered to be part of the net assets or liabilities of anindividual segment. The following table provides reconciliation between the net reportable segmentassets and liabilities and total assets and liabilities of the Fund.
Details of transactions with brokers and financial institutions for the financial year ended 30 September2017 are as follows:
145

Brokers/Financial institutionsRM % RM %
Alliance Investment Bank Berhad 529,171 7.00 2,387 11.90 HSBC Bank Malaysia Berhad 503,900 6.66 - - Maybank Investment Bank Berhad 307,940 4.07 1,392 6.94Credit Suisse Securities (Malaysia)
Sdn. Bhd. 305,244 4.04 1,215 6.06Citigroup Global Markets Malaysia
Sdn Bhd 247,865 3.28 988 4.93Affin Hwang Investment Bank Berhad 237,173 3.13 1,397 6.97Other brokers and financial institutions 474,763 6.27 1,962 9.78
Total 7,566,592 100.00 20,056 100.00
*
19. FINANCIAL INSTRUMENTS
(a) Classification of financial instruments
Financial Financial Receivables liabilities at
assets at amortised amortisedat FVTPL cost cost Total
RM RM RM RM
2017AssetsShariah-compliant investments 5,004,245 - - 5,004,245 Deposit with financial institution - 833,878 - 833,878 Dividends receivable - 7,065 - 7,065 Cash at banks - 1,352 - 1,352
Total financial assets 5,004,245 842,295 - 5,846,540
A financial institution related to the Manager. The Manager and the Trustee are of the opinion thatthe above transactions have been entered in the normal course of business and have been establishedunder terms that are no less favourable than those arranged with independent third parties.
The above transaction values were in respect of Shariah-compliant listed securities and Shariah-compliant fixed income instruments. Transactions in Shariah-compliant fixed income instruments do not involveany commission or brokerage.
Brokerage fee, stampTransaction value duty and clearing fee
The significant accounting policies in Note 3 describe how the classes of financial instruments aremeasured, and how income and expenses, including fair value gains and losses, are recognised. Thefollowing table analyses the financial assets and liabilities of the Fund in the statement of financialposition by the class of financial instrument to which they are assigned, and therefore by themeasurement basis.
146

Financial Financial Receivables liabilities at
assets at amortised amortisedat FVTPL cost cost Total
RM RM RM RM
2017LiabilitiesAmount due to Manager - - 7,748 7,748 Amount due to Trustee - - 290 290 Sundry payables and accrued expenses - - 20,834 20,834
Total financial liabilities - - 28,872 28,872
2016AssetsShariah-compliant investments 5,863,187 - - 5,863,187 Dividends receivable - 5,397 - 5,397 Sundry receivables - 86,605 - 86,605 Cash at banks - 915,375 - 915,375
Total financial assets 5,863,187 1,007,377 - 6,870,564
LiabilitiesAmount due to Manager - - 12,465 12,465 Amount due to Trustee - - 346 346 Sundry payables and accrued expenses - - 47,257 47,257
Total financial liabilities - - 60,068 60,068
and losses2017 2016RM RM
Net gain from financial assets at FVTPL 428,716 252,117 Income, of which derived from:– Gross dividend income from financial assets at FVTPL 88,390 92,874 – Profit income from financial assets at FVTPL 76,963 107,066 – Profit income from receivables 42,413 47,939
(b) Financial instruments that are carried at fair value
The Fund uses the following hierarchy for determining and disclosing the fair value of financialinstruments by valuation technique:
Income, expense, gains
The Fund’s financial assets and liabilities at FVTPL are carried at fair value.
147

Level 1: quoted (unadjusted) prices in active markets for identical assets or liabilities;
Level 2:
Level 3:
Level 1 Level 2 Level 3 TotalRM RM RM RM
Financial assets at FVTPL 3,463,870 1,540,375 - 5,004,245
Financial assets at FVTPL 3,836,245 2,026,942 - 5,863,187
(c)
Deposit with financial institution Dividends receivable Sundry receivables Cash at banks Amount due to Manager Amount due to Trustee Sundry payables and accrued expenses
20. RISK MANAGEMENT POLICIES
other techniques for which all inputs which have a significant effect on the recorded fairvalues are observable; either directly or indirectly; or
techniques which use inputs which have a significant effect on the recorded fair value thatare not based on observable market data.
The following table shows an analysis of financial instruments recorded at fair value by the level ofthe fair value hierarchy:
Financial instruments that are not carried at fair value and whose carrying amounts arereasonable approximation of fair value
The following are classes of financial instruments that are not carried at fair value and whosecarrying amounts are reasonable approximation of fair value due to their short period to maturity orshort credit period:
2016
There are no financial instruments which are not carried at fair values and whose carrying amountsare not reasonable approximation of their respective fair values.
Risk management is carried out by closely monitoring, measuring and mitigating the above said risks,careful selection of Shariah-compliant investments coupled with stringent compliance to Shariah-complaint investments restrictions as stipulated by the Capital Market and Services Act 2007, SecuritiesCommission’s Guidelines on Unit Trust Funds and the Deed as the backbone of risk management of theFund.
2017
The Fund is exposed to a variety of risks that include market risk, credit risk, liquidity risk, single issuerrisk, regulatory risk, management risk and non-compliance/Shariah non-compliance risk.
148

Market risk
(i) Price risk
Percentage movements in price by: 2017 2016
RM RM
-5.00% (173,194) (191,812)+5.00% 173,194 191,812
(ii) Rate of return risk
Parallel shift in yieldcurve by: 2017 2016
RM RM
+100 bps (95,152) (103,880)-100 bps 103,888 115,857
Market risk, in general, is the risk that the value of a portfolio would decrease due to changes in marketrisk factors such as equity prices, foreign exchange rates, rate of return (yield curve) and commodityprices.
Rate of return risk will affect the value of the Fund’s Shariah-compliant investments, given the rateof return movements, which are influenced by regional and local economic developments as well aspolitical developments.
Domestic profit rates on deposits and placements with licensed financial institutions are determinedbased on prevailing market rates.
Sensitivity of the Fund’s NAV, or theoretical value
Sensitivity of the Fund’s NAV
Price risk refers to the uncertainty of an investment’s future prices. In the event of adverse pricemovements, the Fund might endure potential loss on its Shariah-compliant quoted investments. Inmanaging price risk, the Manager actively monitors the performance and risk profile of theinvestment portfolio.
The result below summarised the price risk sensitivity of the Fund’s NAV due to movements of priceby -5.00% and +5.00% respectively:
The result below summarised the rate of return sensitivity of the Fund’s NAV, or theoretical value(applicable to Islamic money market deposit) due to the parallel movement assumption of the yieldcurve by +100bps and -100bps respectively.
149

Credit risk
(i) Credit quality of financial assets
As a % of As a % ofdebt net asset
Credit rating RM securities value
2017AA 1,232,794 80.03 21.19A 307,581 19.97 5.29
1,540,375 100.00 26.48
2016AA 1,717,751 84.75 25.22A 309,191 15.25 4.54
2,026,942 100.00 29.76
As a % ofAs a % of net asset
Credit rating RM deposit value
2017P1/MARC-1 833,878 100.00 14.33
Cash at banks are held for liquidity purposes and are not exposed to significant credit risk.
(ii) Credit risk concentration
The following table analyses the Fund’s portfolio of Islamic debt securities by rating category as at30 September 2017 and 30 September 2016:
Credit risk is the risk that the counterparty to a financial instrument will cause a financial loss for theFund by failing to discharge an obligation. The Fund can invest up to 100% of the net asset value inShariah-compliant fixed income instruments. As such the Fund would be exposed to the risk of sukukissuers and financial institutions defaulting on its repayment obligations which in turn would affect thenet asset value of the Fund.
Concentration of risk is monitored and managed based on sectorial distribution. The table belowanalyses the Fund’s portfolio of debt securities by sectorial distribution as at 30 September 2017 and30 September 2016:
For deposits with financial institutions, the Fund only makes placements with financial institutionswith sound rating. The following table presents the Fund’s portfolio of deposit by rating category asat 30 September 2017:
150

As a % of As a % ofdebt net asset
Sector RM securities value
2017Diversified holdings 307,581 19.97 5.29Infrastructure and utilities 1,232,794 80.03 21.19
1,540,375 100.00 26.48
2016Diversified holdings 1,233,521 60.86 18.11Infrastructure and utilities 793,421 39.14 11.65
2,026,942 100.00 29.76
There is no geographical risk as the Fund invests only in Shariah-compliant investments in Malaysia.
Liquidity risk
Objectives and assumptions
(i) For sukuk(a) For zero-coupon sukuk, the nominal amount will be returned at maturity date.(b) For coupon-bearing sukuk, the coupons could be paid on annual, bi-annual or quarterly basis.
Cash received from sukuk are calculated as follows:
$ = cash receivedR = coupon rate p.a.F = coupon frequency
For zero coupon sukuk, F = 0 At maturity: $ = Nominal
For F > 0 Before maturity: coupon payment, $ = Nominal * (R/F) At maturity: maturity payment, $ = Nominal + (Nominal * R/F)
Liquidity risk is defined as the risk of being unable to raise funds or borrowing to meet paymentobligations as they fall due. The Fund maintains sufficient level of liquid assets, after consultation withthe Trustee, to meet anticipated payments and cancellations of units by unitholders. Liquid assetscomprise of deposits with licensed financial institutions and other instruments, which are capable ofbeing converted into cash within 5 to 7 days. The Fund’s policy is to always maintain a prudent level ofliquid assets so as to reduce liquidity risk.
For each security in the Fund, the cash flows are projected according to its asset class. Each assetclass, if any, follows the calculation method as below:
151

(ii) For money market instruments and deposits
$ = cash receivedR = profit rate p.a.F = time to maturity (days)At maturity: $ = Nominal + (Nominal*R*F/365)
0 – 1 1 – 2 2 – 3 3 – 4 4 – 5 More thanyear years years years years 5 yearsRM RM RM RM RM RM
2017Financial assetsShariah-compliant
investments 83,788 83,788 384,105 61,396 61,279 1,506,776 Deposit with financial
institution 834,033 - - - - - Cash at banks 1,352 - - - - - Other assets 7,065 - - - - -
Total assets 926,238 83,788 384,105 61,396 61,279 1,506,776
Financial liabilitiesOther liabilities 28,872 - - - - -
2016Financial assetsShariah-compliant
investments 110,004 109,819 987,828 366,081 43,400 1,155,759 Cash at banks 915,375 - - - - - Other assets 92,002 - - - - -
Total assets 1,117,381 109,819 987,828 366,081 43,400 1,155,759
Financial liabilitiesOther liabilities 60,068 - - - - -
Single issuer risk
Internal policy restricts the Fund from investing in securities issued by any issuer of not more than acertain percentage of its net asset value. Under such restriction, the risk exposure to the securities of anysingle issuer is diversified and managed based on internal/external ratings.
The following table presents the undiscounted contractual cash flows from different asset and liabilityclasses in the Fund:
Contractual cash flows (undiscounted)
The nominal amount and profit will be paid at maturity date. Cash received are calculated asfollows:
152

Regulatory risk
Management risk
Non-compliance/Shariah non-compliance risk
21. CAPITAL MANAGEMENT
No changes were made in the objective, policies or processes during the financial years ended 30September 2017 and 30 September 2016.
The primary objective of the Fund’s capital management is to ensure that it maximises unitholders’ valueby expanding its fund size to benefit from economies of scale and achieving growth in net asset valuefrom the performance of its Shariah-compliant investments.
Poor management of the Fund may cause considerable losses to the Fund that in turn may affect the netasset value of the Fund.
Any changes in national policies and regulations may have effects on the capital market and the net assetvalue of the Fund.
The Fund manages its capital structure and makes adjustments to it, in light of changes in economicconditions. To maintain or adjust the capital structure, the Fund may issue new or bonus units, makedistribution payment, or return capital to unitholders by way of redemption of units.
This is the risk of the Manager, the Trustee or the Fund not complying with internal policies, the Deed ofthe Fund, securities law or guidelines issued by the regulators. In the case of an Islamic Fund, thisincludes the risk of the Fund not conforming to Shariah Investment Guidelines. Non-compliance risk mayadversely affect the Shariah-compliant investments of the Fund when the Fund is forced to rectify the non-compliance.
153

AmIslamic Balanced
STATEMENT BY THE MANAGER
Kuala Lumpur, Malaysia
I, GOH WEE PENG, for and on behalf of the Manager, AmFunds Management Berhad, for
AmIslamic Balanced do hereby state that in the opinion of the Manager, the accompanying
statement of financial position, statement of comprehensive income, statement of changes in equity,
statement of cash flows and the accompanying notes are drawn up in accordance with Malaysian
Financial Reporting Standards and International Financial Reporting Standards so as to give a true
and fair view of the financial position of the Fund as at 30 September 2017 and the comprehensive
income, the changes in equity and cash flows of the Fund for the financial year then ended.
7 November 2017
GOH WEE PENGFor and on behalf of the ManagerAmFunds Management Berhad
154

155
TRUSTEE’S REPORT

156
MANAGER’S REPORT Dear Unitholders, We are pleased to present you the Manager’s report and the audited accounts of AmIslamic Growth (“Fund”) for the financial year ended 30 September 2017. Salient Information of the Fund Name AmIslamic Growth (“Fund”)
Category/Type
Equity (Islamic) / Growth
Objective AmIslamic Growth aims to provide long-term capital growth mainly through investments in securities with superior growth potential*, which conforms to principles of Shariah. As such, income** will be incidental to the overall capital growth objective and a substantial portion of the income from investments will be reinvested, rather than distributed. Note: *Superior growth potential refers to earnings growth higher than the market average. **The income could be in the term of unit or cash.
Duration The Fund was established on 10 September 2004 and shall exist for as long as it appears to the Manager and the Trustee that it is in the interests of the unitholders for it to continue. In some circumstances, the unitholders can resolve at a meeting to terminate AmIslamic Growth.
Performance Benchmark
FTSE Bursa Malaysia Emas Shariah Index. (obtainable from: www.bursamalaysia.com) Note: The benchmark does not imply that the risk profile of the Fund is the same as the risk profile of the benchmark. Investors of the Fund will assume a higher risk compared to the benchmark. Hence, the returns of the Fund may be potentially higher due to the higher risk faced by the investors.
Income Distribution Policy
Income distribution (if any) is incidental.
Breakdown of Unit Holdings by Size
For the financial year under review, the size of the Fund stood at 33,957,051 units.

157
Size of holding As at 30 September 2017 As at 30 September 2016 No of
units held Number of unitholders
No of units held
Number of unitholders
5,000 and below 259,219 77 387,566 117 5,001-10,000 995,150 133 1,576,199 226 10,001-50,000 7,104,052 316 9,951,064 439 50,001-500,000 8,159,391 85 14,840,673 148 500,001 and above 17,439,239 4 10,654,858 5
Fund Performance Data Portfolio Composition
Details of portfolio composition of the Fund for the financial years as at 30 September are as follows: FY
2017 %
FY 2016 %
FY 2015 %
Construction 15.97 11.83 9.77 Consumer products - 0.28 - Finance 2.61 - 2.96 Industrial products 7.27 6.92 10.46 Infrastructure project companies 5.79 5.48 5.87 Plantation 7.93 7.78 7.77 Properties 2.11 1.78 - REITs - 1.05 - Technology 5.57 1.99 2.11 Trading/Services 37.69 44.53 49.49 Cash and others 15.06 18.36 11.57 Total 100.00 100.00 100.00
Note: The abovementioned percentages are calculated based on total net asset value.
Performance Details
Performance details of the Fund for the financial years ended 30 September are as follows: FY
2017 FY
2016 FY
2015 Net asset value (RM)* 17,188,024 17,566,862 20,378,996 Units in circulation* 33,957,051 37,410,360 44,423,214 Net asset value per unit (RM)* 0.5062 0.4696 0.4587 Highest net asset value per unit (RM)* 0.5119 0.4884 0.4963 Lowest net asset value per unit (RM)* 0.4583 0.4566 0.4264
(Forward)

158
FY 2017
FY 2016
FY 2015
Benchmark performance (%) 3.64 3.86 -9.83 Total return (%)(1) 7.79 2.38 -3.88 - Capital growth (%) 7.79 2.38 -3.88 - Income distribution (%) - - - Gross distribution (sen per unit) - - - Net distribution (sen per unit) - - - Management expense ratio (%)(2) 1.81 1.80 1.71 Portfolio turnover ratio (times)(3) 0.33 0.52 0.49
* Above prices and net asset value per unit are not shown as ex-distribution. Note: (1) Total return is the actual return of the Fund for the respective financial years
computed based on the net asset value per unit and net of all fees. (2) Management expense ratio (“MER”) is calculated based on the total fees
and expenses incurred by the Fund divided by the average fund size calculated on a daily basis. The MER increased by 0.01% as compared to 1.80% per annum for the financial year ended 30 September 2016 mainly due to decrease in average fund size.
(3) Portfolio turnover ratio (“PTR”) is calculated based on the average of the total acquisitions and total disposals of investment securities of the Fund divided by the average fund size calculated on a daily basis. The PTR decreased by 0.19 times (36.5%) as compared to 0.52 times for the financial year ended 30 September 2016 mainly due to decrease in investing activities.
Average Total Return (as at 30 September 2017)
AmIslamic Growth(a)
%
FBM SI(b)
% One year 7.79 3.64 Three years 1.99 -0.99 Five years 6.84 2.44 Ten years 6.29 3.08
Annual Total Return
Financial Years Ended (30 September)
AmIslamic Growth(a)
%
FBM SI(b)
% 2017 7.79 3.64 2016 2.38 3.86 2015 -3.88 -9.83 2014 10.82 6.64 2013 18.43 9.02

159
(a) Source: Novagni Analytics and Advisory Sdn Bhd. (b) FTSE Bursa Malaysia EMAS Shariah Index (“FBM SI”)
(Obtainable via: www.ambankgroup.com) The Fund performance is calculated based on the net asset value per unit of the Fund. Average total return of the Fund and its benchmark for a period is computed based on the absolute return for that period annualised over one year. Note: Past performance is not necessarily indicative of future performance and that unit prices and investment returns may go down, as well as up.
Fund Performance
For the financial year under review, the Fund’s net asset value (“NAV”) per unit increased by 7.79% from RM0.4696 to RM0.5062. Meanwhile, the Fund’s NAV fell by 2.16% to RM17.188 million as at 30 September 2016 from RM17.567 million as at 30 September 2016. As at the end of financial year under review, units in circulation were 9.23% lower at 33,957,051 units as compared to 37,410,360 units as at 30 September 2016. The Fund registered a return of 7.79% for the financial year ended 30 September 2017, which was entirely capital growth in nature. Comparatively, for the same year, the benchmark, FBM SI registered a return of 3.64%. As such the Fund outperformed the benchmark by 4.15%. The outperformance was attributed to stock selection and asset allocation.
The Line Chart below shows the comparison between the annual performances of AmIslamic Growth and its benchmark, FBM SI, for the financial years ended 30 September.
Note: Past performance is not necessarily indicative of future performance and that unit prices and investment returns may go down, as well as up.
18.43 10.82
-3.88 2.38
7.79 9.02
6.64
-9.83
3.86
3.64
-15.00
-10.00
-5.00
0.00
5.00
10.00
15.00
20.00
Tota
l Ret
urn
(%)
Financial Years Ended (30 September)
FBMSI
AmIslamic Growth
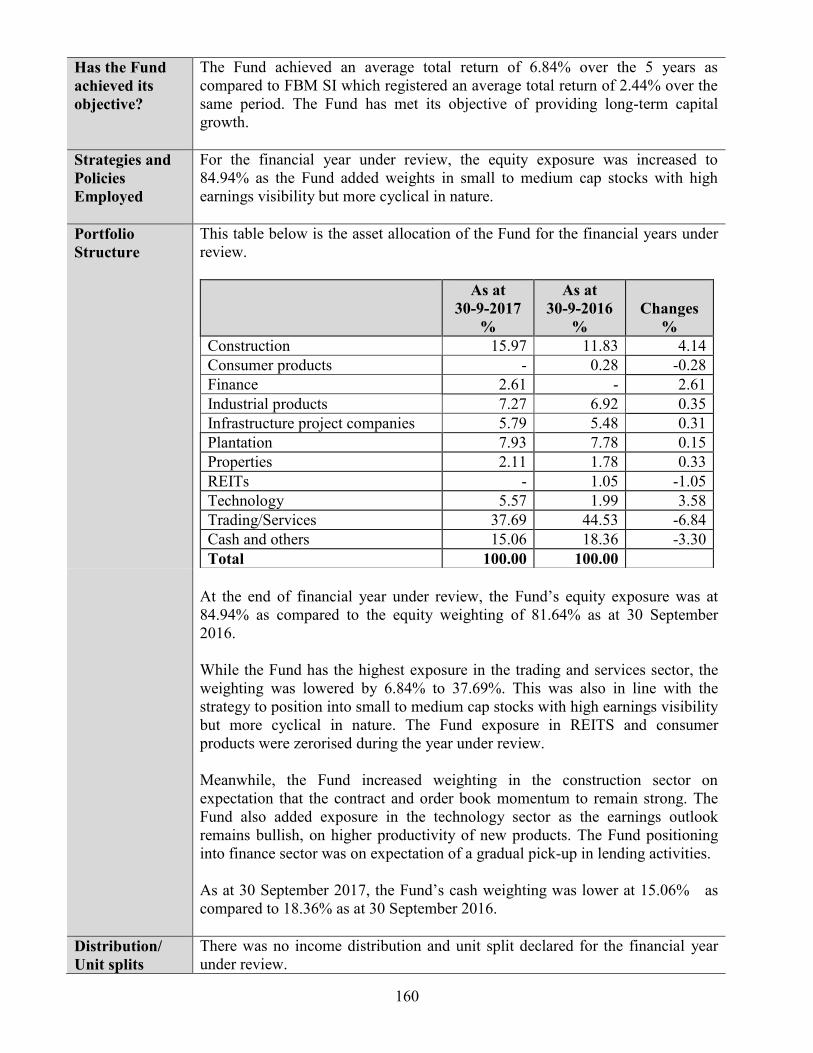
160
Has the Fund achieved its objective?
The Fund achieved an average total return of 6.84% over the 5 years as compared to FBM SI which registered an average total return of 2.44% over the same period. The Fund has met its objective of providing long-term capital growth.
Strategies and Policies Employed
For the financial year under review, the equity exposure was increased to 84.94% as the Fund added weights in small to medium cap stocks with high earnings visibility but more cyclical in nature.
Portfolio Structure
This table below is the asset allocation of the Fund for the financial years under review.
As at 30-9-2017
%
As at 30-9-2016
%
Changes
% Construction 15.97 11.83 4.14 Consumer products - 0.28 -0.28 Finance 2.61 - 2.61 Industrial products 7.27 6.92 0.35 Infrastructure project companies 5.79 5.48 0.31 Plantation 7.93 7.78 0.15 Properties 2.11 1.78 0.33 REITs - 1.05 -1.05 Technology 5.57 1.99 3.58 Trading/Services 37.69 44.53 -6.84 Cash and others 15.06 18.36 -3.30 Total 100.00 100.00
At the end of financial year under review, the Fund’s equity exposure was at 84.94% as compared to the equity weighting of 81.64% as at 30 September 2016. While the Fund has the highest exposure in the trading and services sector, the weighting was lowered by 6.84% to 37.69%. This was also in line with the strategy to position into small to medium cap stocks with high earnings visibility but more cyclical in nature. The Fund exposure in REITS and consumer products were zerorised during the year under review. Meanwhile, the Fund increased weighting in the construction sector on expectation that the contract and order book momentum to remain strong. The Fund also added exposure in the technology sector as the earnings outlook remains bullish, on higher productivity of new products. The Fund positioning into finance sector was on expectation of a gradual pick-up in lending activities. As at 30 September 2017, the Fund’s cash weighting was lower at 15.06% as compared to 18.36% as at 30 September 2016.
Distribution/ Unit splits
There was no income distribution and unit split declared for the financial year under review.

161
State of Affairs
There have been neither significant changes to the state of affairs of the Fund nor any circumstances that materially affect any interests of the unitholders during the financial year under review.
Rebates and Soft Commission
It is our policy to pay all rebates to the Fund. Soft commission received from brokers/ dealers are retained by the Manager only if the goods and services provided are of demonstrable benefit to unitholders of the Fund. During the financial year under review, the Manager had received on behalf of the Fund, soft commissions in the form of fundamental database, financial wire services, technical analysis software and stock quotation system incidental to investment management of the Fund. These soft commissions received by the Manager are deem to be beneficial to the unitholders of the Fund.
Market Review
The market started the period under review on a positive note. The Government announced its Budget 2017 with Gross Domestic Product (“GDP”) growth is forecasted to be within 4%-5%. 2017 Budget includes plans to set up small to mid-cap research Public Listed Companies (“PLC”) and allocation of a special fund of up to RM3bn to fund managers to invest in small to mid-cap PLC. The ringgit ended higher against the US dollar following the tabling of Budget 2017 which lifted foreign investors' confidence, thus creating a better demand for the local currency. In November 2016, market underwent heavy selling pressure due to surge in US Treasury yields and the measure of its full impact to emerging markets currencies. This was on the back of the outcomes of the recent US presidential election. The Ringgit weakened 6% and 10Y MGS yield spiked up to 4.35% on fears of Fed rate hike. The external negative sentiments outweigh better than expected 3Q2016 GDP numbers of 4.3%. Malaysia's economy grew 4.3 per cent in the third quarter from year-ago levels, accelerating after five straight quarters of decline. The growth was stronger than the median forecast of 4.1 per cent and better than the 4.0 per cent growth posted in the second quarter. Sentiment recovered in December 2016, following Organization of the Petroleum Exporting Countries (“OPEC”) agreeing to reduce production by c1.2 million barrels per day (“mbd”) bringing its output ceiling to 32.5mbd. The duration of the cut is 6 months effective 1 Jan 2017, with a possibility to extend for another 6 months, sending oil prices from the level of USD50/barrel to almost USD54/barrel at the peak in the month of December. BNM introduced six measures to enhance the liquidity and depth of the onshore market effective 5 Dec. But, in the month, we still saw the ringgit weakening against the USD moving from RM4.45/USD to RM4.49/USD as foreigners kept selling out of the Malaysian bond and equity market. It also did not help that the 3Q16 results performance came in weaker than expected. We saw negative revisions to earnings but believe that the pace of downward revisions has slowed. The Federal Reserve increased its key interest rate by 0.25% on 14 Dec 2016

162
which led to the weakening of all EM currencies including the ringgit. But, as we approached the end of the year, we saw some window dressing activities taking place. Year 2017 started on a positive note, spurred by foreign inflow on the back of an improving ringgit from 4.48RM/USD to 4.43RM/USD, and stabilizing oil prices at USD50-55/bbl. The market was also be boosted by some repositioning and reallocation of funds at the start of the year. Improving sentiment on local banks, and M&A news flow on major GLCs such as Sime Darby and UMW further boosted the buoyant mood on local equities. Apart from that, deferment of punitive regulations (i.e. levy for foreign workers) until 2018 helped to recover investor confidence on less downside risk to future earnings. The month of February 2017 started off with another round of rallies in equities, supported by further net foreign inflows of c. RM1 bil (YTD 2017:RM1.5 bil), with oil prices hovering within the USD52-55/bbl band and ringgit averaging 4.44RM/USD. We saw trading interest on all fronts i.e. big to small cap stocks. The index peaked above 1700 towards the end of February, but ended the month slightly lower at 1694 on profit taking. Post the February result season (for 4Q 2016 results), data shows that 21% of companies recorded results above our expectations - the best quarter so far in the past one year. MSCI Malaysia 2017 earnings were revised lower by -0.1% mom in February. However more significantly, it shows a bottoming of 2017 earnings expectation as this was the lowest negative revision since January 2016. Most upgrades came from Materials, Energy and Consumers sectors, whilst downgrades were from Real Estate, Telco and Utilities. In March 2017, the global and regional equity markets continued their rallies. For the local bourse, trading interest shifted to mid and small-cap stocks and on property and technology stocks. Highlight of the month was the announcement of the Digital Free Trade Zone by the PM during Jack Ma’s visit in KL. Maybank and CIMB also announced partnership with Ant Financial Services Group to enable the Alipay mobile wallet in Malaysia. Furthermore, Malaysian Digital Economy Corp announced that Multimedia Super Corridor companies have recorded new investments of RM16.3 bil in 2016.
The upward momentum continued in April 2017, as sentiment was supported by a stronger ringgit, improving outlook for corporate earnings and strong inflow of foreign funds. The broader market outperformed the KLCI, with the FBM EMAS up 2.2% mom to 12,631pts. However, average daily value traded on Bursa in April fell by 8% mom to RM2.8bn. The finance, technology and energy sectors outperformed the market. The energy sector outperformed, on the back of continued optimism about Saudi Aramco’s potential USD7 bil investment in RAPID. The financial sector outperformed, presumably on reflation trade. Materials were a major underperformer, led by Lafarge and PChem, on a weaker pricing environment.

163
Consumer staples underperformed on lower CPO prices, while defensive utilities continued to underperform. After a strong performance in the first 4 months of 2017, the market paused its uptrend in May. News of the Bandar Malaysia deal cancellation by the Malaysian government caused dampened sentiment on fears of reversal of capital inflows from China; these were subsequently eased when Malaysia signed more MoUs with China at the One Belt and One Road (“OBOR”) conference one week later. Stronger-than-expected GDP growth for 1Q17 was offset by an earnings season that did not see much surprise on the upside due to high expectations. In June 2017, the market started the month trending higher but failed to hold on to its gain as profit-taking sets in due to concerns over valuations. The results release for the period of April-June saw substantial downgrades in consensus estimates in telcos, utilities, consumer discretionary & staples, whilst substantial upgrades were on technology, healthcare and energy.
The market was range bound in the month of July, with a lack of catalysts to drive the market. Invest Malaysia saw a higher turnout however, indicating renewed investor interest in Malaysia. As usual, the government announced several measures at the event, including (1) the Leading Entrepreneur Accelerator Platform (“LEAP”) market (2) a single regulator for the property sector. The listing of Lotte Chemical Titan, the largest IPO since 2012, turned out terribly for investors as the stock dropped 23% in a single day on 31 July after it announced a headline 67% QoQ and 72% YoY drop in 2Q17 net profit. Adjusted for exceptionals, the decline was more moderate at 17% QoQ and 36% YoY. However, due to the ineffective guidance by management, the damage to the stock’s marketability has been substantial. The lackluster performance continued in the month of August 2017. After seven consecutive months of net buy, foreign investors turned marginal net sellers of Malaysia equities at RM0.3 bil. This brought the eight months cumulative foreign buy to RM10.9 bil. This was consistent with their retracement in the other ASEAN emerging markets. For the month of August 2017, the key attraction to the market development was the 2Q17 corporate results reporting season, where corporate results have been lackluster in general. Although 2Q17 corporate earnings report card has been somewhat subdued and unexciting, we believe that 2H17 earnings should be stronger due to 1) 2Q17 5.8% GDP growth is the strongest in the past 2 years; 2) Ringgit has been stabilising; 3) improving labour market coupled with continued wage growth and moderating inflation will support and spur domestic economy and 4) government's continuous effort in the ongoing roll-out of infrastructure projects. In September 2017, foreign outflows continue, with net outflow of RM0.8 bil (Aug: -RM0.3 bil), bringing down the YTD cumulative foreign buy to RM10.0 bil.

164
Crude oil price spiked 13.0% m.o.m to US$58/bbl, leading to outperformance in the Energy sector. The oil price were driven by hurricanes in US which have disrupted some oil logistics; Geopolitical issue in middle-east where Turkey is threatening to stop oil flow from Iraq’s Kurdish area which will affect up to 1.5% of global oil supply; OPEC’s rhetoric to extend production cut to Dec18 from Mac18. Telco and Material sectors were outperformers too. For the period under review, FBM Shariah Index (“FBMS”) ended at 12,797.37 points, a gain of 3.64%.
Market Outlook
The key focus for the local market in October 2017 was the Budget 2018, which is also known as the pre-election budget. The continuous BR1M handout and income tax reduction is expected to lift private consumption, hence, further strengthened our overweight call on the consumer sector. Furthermore, we view that the local consumer spending is poised to recover since the implementation of GST more than 2 years ago. In the budget, the government reiterated its commitment towards the main stream transportation-led projects which will continue to drive the construction sector. On top of this, the special end-financing scheme for PR1MA buyers has now been extended to private developers as well, with the aim of helping first-time home buyers to obtain loans. This will benefit the banks as loan approvals are expected to escalate going forward. The GDP growth forecast for this year has also been raised to 5.2-5.7% during the budget, up from 4.3-4.8%. Authority expects growth to remain sanguine, albeit slightly lower at 5.0-5.5% in 2018. Overall, we believe that the Budget 2018 is positive to most of the sectors that we previously favored and continue to favor such as financial, consumer, construction/infrastructure, technology and export players. Going forward, we believe the market will refocus on external developments, namely 1) US-North Korea conflicts; 2) US tax reform; 3) Fed rate hike and 4) Middle Eastern tensions while on the local front, we are watchful on 1) the upcoming 3Q17 reporting season and 2) election developments.
Kuala Lumpur, Malaysia AmFunds Management Berhad 7 November 2017

Independent auditors’ report to the unitholders of AmIslamic Growth
Report on the audit of the financial statements
Opinion
Basis for opinion
Independence and other ethical responsibilities
Information other than the financial statements and auditors’ report thereon
We have audited the financial statements of AmIslamic Growth (“the Fund”), which comprise thestatement of financial position as at 30 September 2017, and the statement of comprehensiveincome, statement of changes in equity and statement of cash flows for the year then ended, andnotes to the financial statements, including a summary of significant accounting policies, as set outon pages 168 to 190.
In our opinion, the accompanying financial statements give a true and fair view of the financialposition of the Fund as at 30 September 2017 and of its financial performance and its cash flows forthe year then ended in accordance with Malaysian Financial Reporting Standards and InternationalFinancial Reporting Standards.
We conducted our audit in accordance with approved standards on auditing in Malaysia andInternational Standards on Auditing. Our responsibilities under those standards are further describedin the Auditor’s Responsibilities for the Audit of the Financial Statements section of our report. Webelieve that the audit evidence we have obtained is sufficient and appropriate to provide a basis forour opinion.
We are independent of the Fund in accordance with the By-Laws (on Professional Ethics, Conductand Practice) of the Malaysian Institute of Accountants (“By-Laws”) and the International EthicsStandards Board for Accountants’ Code of Ethics for Professional Accountants (“IESBA Code”),and we have fulfilled our other ethical responsibilities in accordance with the By-Laws and theIESBA Code.
The Manager is responsible for the other information. The other information comprises informationin the Annual Report, but does not include the financial statements of the Fund and our auditors’report thereon.
Our opinion on the financial statements of the Fund does not cover the other information and we donot express any form of assurance conclusion thereon.
In connection with our audit of the financial statements of the Fund, our responsibility is to read theother information and, in doing so, consider whether the other information is materially inconsistentwith the financial statements of the Fund or our knowledge obtained in the audit or otherwiseappears to be materially misstated.
165

Independent auditors’ report to the unitholders of AmIslamic Growth (cont’d.)
Responsibilities of the Manager and the Trustees for the financial statements
Auditor’s responsibilities for the audit of the financial statements
Our objectives are to obtain reasonable assurance about whether the financial statements of the Fund,as a whole are free from material misstatement, whether due to fraud or error, and to issue anauditors’ report that includes our opinion. Reasonable assurance is a high level of assurance, but isnot a guarantee that an audit conducted in accordance approved standards on auditing in Malaysiaand International Standards on Auditing will always detect a material misstatement when it exists.Misstatements can arise from fraud or error and are considered material if, individually or in theaggregate, they could reasonably be expected to influence the economic decisions of users taken onthe basis of these financial statements.
If based on the work we have performed, we conclude that there is a material misstatement of thisother information, we are required to report that fact. We have nothing to report in this regard.
The Manager is responsible for the preparation of the financial statements of the Fund that give atrue and fair view in accordance with Malaysian Financial Reporting Standards and InternationalFinancial Reporting Standards. The Manager is also responsible for such internal control as theManager determines is necessary to enable the preparation of financial statements of the Fund thatare free from material misstatement, whether due to fraud or error.
In preparing the financial statements of the Fund, the Manager is responsible for assessing theFund’s ability to continue as a going concern, disclosing, as applicable, matters related to goingconcern and using the going concern basis of accounting unless the Manager either intends toliquidate the Fund or to cease operations, or has no realistic alternative to do so.
The Trustee is responsible for ensuring that the Manager maintains proper accounting and otherrecords as are necessary to enable true and fair presentation of these financial statements.
As part of an audit in accordance with the approved standards on auditing in Malaysia andInternational Standards on Auditing, we exercise professional judgment and maintain professionalskepticism throughout the planning and performance of the audit. We also:
Identify and assess the risks of material misstatement of the financial statements of the Fund,whether due to fraud or error, design and perform audit procedures responsive to those risks,and obtain audit evidence that is sufficient and appropriate to provide a basis for our opinion.The risk of not detecting a material misstatement resulting from fraud is higher than for oneresulting from error, as fraud may involve collusion, forgery, intentional omissions,misrepresentations, or the override of internal control.
Obtain an understanding of internal control relevant to the audit in order to design auditprocedures that are appropriate in the circumstances, but not for the purpose of expressing anopinion on the effectiveness of the Fund’s internal control.
166

Independent auditors’ report to the unitholders of AmIslamic Growth (cont’d.)
Other matters
Ernst & Young Wan Daneena Liza Bt Wan Abdul RahmanAF: 0039 No. 2978/03/18(J)Chartered Accountants Chartered Accountant
Kuala Lumpur, Malaysia7 November 2017
We communicate with the Manager regarding, among other matters, the planned scope and timing ofthe audit and significant audit findings, including any significant deficiencies in internal control thatwe identify during our audit.
This report is made solely to the unitholders of the Fund, as a body, and for no other purpose. We donot assume responsibility to any other person for the content of this report.
Evaluate the appropriateness of accounting policies used and the reasonableness ofaccounting estimates and related disclosures made by the Manager.
Conclude on the appropriateness of the Manager’s use of the going concern basis ofaccounting and, based on the audit evidence obtained, whether a material uncertainty existsrelated to events or conditions that may cast significant doubt on the Fund’s ability tocontinue as a going concern. If we conclude that a material uncertainty exists, we arerequired to draw attention in our auditors’ report to the related disclosures in the financialstatements or, if such disclosures are inadequate, to modify our opinion. Our conclusions arebased on the audit evidence obtained up to the date of our auditors’ report. However, futureevents or conditions may cause the Fund to cease to continue as a going concern.
Evaluate the overall presentation, structure and content of the financial statements of theFund, including the disclosures, and whether the financial statements of the Fund representthe underlying transactions and events in a manner that achieves fair presentation.
167

AmIslamic Growth
STATEMENT OF FINANCIAL POSITIONAS AT 30 SEPTEMBER 2017
2017 2016Note RM RM
ASSETSShariah-compliant investments 4 14,598,892 14,341,251 Deposit with financial institution 5 2,599,142 - Dividends receivable 24,515 23,849 Cash at banks 7,707 3,252,232
TOTAL ASSETS 17,230,256 17,617,332
LIABILITIESAmount due to Manager 6 24,259 35,610 Amount due to Trustee 7 853 905 Sundry payables and accrued expenses 17,120 13,955
TOTAL LIABILITIES 42,232 50,470
EQUITYUnitholders’ capital 10(a) (4,925,932) (3,238,340)Retained earnings 10(b)(c) 22,113,956 20,805,202
TOTAL EQUITY 10 17,188,024 17,566,862
TOTAL EQUITY AND LIABILITIES 17,230,256 17,617,332
UNITS IN CIRCULATION 10(a) 33,957,051 37,410,360
NET ASSET VALUE PER UNIT 50.62 sen 46.96 sen
The accompanying notes form an integral part of the financial statements.
168

AmIslamic Growth
STATEMENT OF COMPREHENSIVE INCOMEFOR THE FINANCIAL YEAR ENDED 30 SEPTEMBER 2017
2017 2016Note RM RM
SHARIAH-COMPLIANT INVESTMENT INCOMEGross dividend income 343,314 411,889 Profit income 78,544 85,642 Net gain from Shariah-compliant investments:− Financial assets at fair value through profit or loss (“FVTPL”) 8 1,200,886 339,449
Gross Income 1,622,744 836,980
EXPENDITUREManager’s fee 6 (260,157) (280,742)Trustee’s fee 7 (10,406) (11,230)Auditors’ remuneration - current financial year (6,000) (5,000)Auditors’ remuneration - over provision in prior
financial year (1,000) - Tax agent’s fee (5,000) (5,000)Custodian’s fee (533) (834)Other expenses 9 (30,759) (34,846)
Total Expenditure (313,855) (337,652)
NET INCOME BEFORE TAX 1,308,889 499,328 LESS: INCOME TAX 12 (135) (6,581)
NET INCOME AFTER TAX 1,308,754 492,747
OTHER COMPREHENSIVE INCOME - -
TOTAL COMPREHENSIVE INCOME FORTHE FINANCIAL YEAR 1,308,754 492,747
Total comprehensive income comprises the following: Realised income 401,550 1,390,746 Unrealised gain/(loss) 907,204 (897,999)
1,308,754 492,747
The accompanying notes form an integral part of the financial statements.
169

AmIslamic Growth
STATEMENT OF CHANGES IN EQUITYFOR THE FINANCIAL YEAR ENDED 30 SEPTEMBER 2017
Unitholders’ Retained Total capital earnings equity
Note RM RM RM
At 1 October 2015 66,541 20,312,455 20,378,996 Total comprehensive income for
the financial year - 492,747 492,747 Creation of units 10(a) 4,321,953 - 4,321,953 Cancellation of units 10(a) (7,626,834) - (7,626,834)
Balance at 30 September 2016 (3,238,340) 20,805,202 17,566,862
At 1 October 2016 (3,238,340) 20,805,202 17,566,862 Total comprehensive income for
the financial year - 1,308,754 1,308,754 Creation of units 10(a) 524,190 - 524,190 Cancellation of units 10(a) (2,211,782) - (2,211,782)
Balance at 30 September 2017 (4,925,932) 22,113,956 17,188,024
The accompanying notes form an integral part of the financial statements.
170

AmIslamic Growth
STATEMENT OF CASH FLOWSFOR THE FINANCIAL YEAR ENDED 30 SEPTEMBER 2017
2017 2016Note RM RM
CASH FLOWS FROM OPERATING ANDINVESTING ACTIVITIES
Proceeds from sale of Shariah-compliant investments 6,167,900 11,789,581
Dividends received 342,513 418,086 Profit received 78,544 85,642 Tax refund - 7,705 Manager’s fee paid (260,043) (285,489)Trustee’s fee paid (10,458) (11,420)Tax agent’s fee paid (5,000) (5,000)Custodian’s fee paid (533) (834)Payments for other expenses (34,594) (40,287)Purchase of Shariah-compliant investments (5,224,655) (7,899,254)
Net cash generated from operating and investing activities 1,053,674 4,058,730
CASH FLOWS FROM FINANCING ACTIVITIES Proceeds from creation of units 524,190 4,321,953 Payments for cancellation of units (2,223,247) (7,622,967)
Net cash used in financing activities (1,699,057) (3,301,014)
NET (DECREASE)/INCREASE IN CASH AND CASH EQUIVALENTS (645,383) 757,716
CASH AND CASH EQUIVALENTS AT BEGINNING OF FINANCIAL YEAR 3,252,232 2,494,516
CASH AND CASH EQUIVALENTS AT END OF FINANCIAL YEAR 2,606,849 3,252,232
Cash and cash equivalents comprise:Deposit with financial institution 5 2,599,142 - Cash at banks 7,707 3,252,232
2,606,849 3,252,232
The accompanying notes form an integral part of the financial statements.
171

AmIslamic Growth
NOTES TO THE FINANCIAL STATEMENTS
1. GENERAL INFORMATION
2. BASIS OF PREPARATION OF FINANCIAL STATEMENTS
Standards effective during the financial year
Standards issued but not yet effective
Effective for financial periods
beginning on or after
MFRS 9: Financial InstrumentsMFRS 15: Revenue From Contracts With Customers
AmIslamic Growth (“the Fund”) was established pursuant to a Deed dated 2 September 2004 asamended by Deed Supplemental thereto (“the Deed”), between AmFunds Management Berhad asthe Manager, AmanahRaya Trustees Berhad as the Trustee and all unitholders.
The financial statements of the Fund have been prepared in accordance with Malaysian FinancialReporting Standards (“MFRS”) as issued by the Malaysian Accounting Standards Board (“MASB”)and are in compliance with International Financial Reporting Standards.
The financial statements of the Fund have been prepared under the historical cost convention,unless otherwise stated in the accounting policies.
The adoption of MFRS which have been effective during the financial year did not have anymaterial financial impact to the financial statements.
As at the date of authorisation of these financial statements, the following Standards, which arerelevant to the Fund, have been issued by MASB but are not yet effective and have not beenadopted by the Fund.
1 January 2018
The Fund plans to adopt the above pronouncements when they become effective in the respectivefinancial periods. These pronouncements are expected to have no significant impact to the financialstatements of the Fund upon their initial application except as described below:
1 January 2018
The Fund was set up with the objective of providing investors with a means to pool and invest theirfunds in a professionally managed portfolio of Shariah-compliant equities and other non-interestbearing securities. The Fund aims to provide long-term capital growth mainly through investmentsin securities with superior growth potential, which conforms to Principles of Shariah. As providedin the Deed, the “accrual period” or the financial year shall end on 30 September and the units ofthe Fund were first offered for sale on 10 September 2004.
172

MFRS 9 Financial Instruments
3. SIGNIFICANT ACCOUNTING POLICIES
Income recognition
Income tax
Functional and presentation currency
Statement of cash flows
The Fund adopts the direct method in the preparation of the statement of cash flows.
Distribution
Income is recognised to the extent that it is probable that the economic benefits will flow to theFund and the income can be reliably measured. Income is measured at the fair value ofconsideration received or receivable.
Dividend income is recognised when the Fund’s right to receive payment is established. Profitincome on Islamic short-term deposits are recognised on an accrual basis using the effective profitmethod.
MFRS 9 reflects International Accounting Standards Board’s (“IASB”) work on the replacement ofMFRS 139 Financial Instruments: Recognition and Measurement (“MFRS 139”). MFRS 9 will beeffective for financial year beginning on or after 1 January 2018. The Fund is in the process ofquantifying the impact of the first adoption of MFRS 9.
Current taxes are recognised in profit or loss except to the extent that the tax relates to itemsrecognised outside profit or loss, either in other comprehensive income or directly in equity.
Current tax assets and liabilities are measured at the amount expected to be recovered from or paidto the tax authorities. The tax rates and tax laws used to compute the amount are those that areenacted or substantively enacted at the reporting date.
Cash equivalents are short-term, highly liquid Shariah-compliant investments that are readilyconvertible to cash with insignificant risk of changes in value.
Functional currency is the currency of the primary economic environment in which the Fundoperates that most faithfully represents the economic effects of the underlying transactions. Thefunctional currency of the Fund is Ringgit Malaysia which reflects the currency in which the Fundcompetes for funds, issues and redeems units. The Fund has also adopted Ringgit Malaysia as itspresentation currency.
Distributions are at the discretion of the Fund. A distribution to the Fund’s unitholders is accountedfor as a deduction from realised reserves. A proposed distribution is recognised as a liability in theperiod in which it is approved.
173

Unitholders’ capital
Financial assets
(i) Financial assets at FVTPL
(ii) Receivables
Financial assets are classified as financial assets at FVTPL if they are held for trading or aredesignated as such upon initial recognition. Financial assets held for trading by the Fund includeShariah-compliant equity securities acquired principally for the purpose of selling in the nearterm.
Financial assets with fixed or determinable payments that are not quoted in an active market areclassified as receivables.
When financial assets are recognised initially, they are measured at fair value, plus, in the case offinancial assets not at fair value through profit or loss, directly attributable transaction costs.
Subsequent to initial recognition, financial assets at FVTPL are measured at fair value. Changesin the fair value of those financial instruments are recorded in ‘Net gain or loss on financialassets at fair value through profit or loss’. Dividend revenue and profit earned elements of suchinstruments are recorded separately in ‘Gross dividend income’ and ‘Profit income’respectively.
Financial assets are recognised in the statement of financial position when, and only when, the Fundbecomes a party to the contractual provisions of the financial instrument.
The Fund determines the classification of its financial assets at initial recognition, and thecategories applicable to the Fund include financial assets at fair value through profit or loss(“FVTPL”) and receivables.
The unitholders’ capital of the Fund meets the definition of puttable instruments and is classified asequity instruments under MFRS 132 Financial Instruments: Presentation (“MFRS 132”).
On disposal of Shariah-compliant investments, the net realised gain or loss on disposal ismeasured as the difference between the net disposal proceeds and the carrying amount of theShariah-compliant investments. The net realised gain or loss is recognised in profit or loss.
Subsequent to initial recognition, receivables are measured at amortised cost using the effectiveprofit method. Gains and losses are recognised in profit or loss when the receivables arederecognised or impaired, and through the amortisation process.
For Shariah-compliant investments in quoted securities, market value is determined based onthe closing price quoted on Bursa Malaysia Securities Berhad. Unrealised gain or lossesrecognised in profit or loss are not distributable in nature.
174

Impairment of financial assets
(i) Receivables carried at amortised cost
Financial liabilities
Classification of realised and unrealised gains and losses
The Fund assesses at each reporting date whether there is any objective evidence that a financialasset is impaired.
Unrealised gains and losses comprise changes in the fair value of financial instruments for theperiod and from reversal of prior period’s unrealised gains and losses for financial instrumentswhich were realised (i.e. sold, redeemed or matured) during the reporting period.
If in a subsequent period, the amount of the impairment loss decreases and the decrease can berelated objectively to an event occurring after the impairment was recognised, the previouslyrecognised impairment loss is reversed to the extent that the carrying amount of the asset doesnot exceed its amortised cost at the reversal date. The amount of reversal is recognised in profitor loss.
To determine whether there is objective evidence that an impairment loss on financial assets hasbeen incurred, the Fund considers factors such as the probability of insolvency or significantfinancial difficulties of the debtor and default or significant delay in payments.
A financial liability is derecognised when the obligation under the liability is extinguished. Gainsand losses are recognised in profit or loss when the liabilities are derecognised, and through theamortisation process.
Financial liabilities, within the scope of MFRS 139, are recognised in the statement of financialposition when, and only when, the Fund becomes a party to the contractual provisions of thefinancial instrument.
If any such evidence exists, the amount of impairment loss is measured as the differencebetween the asset’s carrying amount and the present value of estimated future cash flowsdiscounted at the financial asset’s original effective profit rate. The impairment loss isrecognised in profit or loss.
The carrying amount of the financial asset is reduced through the use of an allowance account.When a receivable becomes uncollectible, it is written off against the allowance account.
The Fund’s financial liabilities are recognised initially at fair value plus directly attributabletransaction costs and subsequently measured at amortised cost using the effective profit method.
Financial liabilities are classified according to the substance of the contractual arrangements enteredinto and the definitions of a financial liability.
175

Significant accounting estimates and judgments
4. SHARIAH-COMPLIANT INVESTMENTS
2017 2016RM RM
Financial assets at FVTPL
Quoted Shariah-compliant equity securities in Malaysia 14,598,892 14,341,251
Details of Shariah-compliant investments as at 30 September 2017 are as follows:
Marketvalue as a
percentage ofNumber Market Purchase net asset
Name of company of shares value cost valueRM RM %
Quoted Shariah-compliant equity securities in Malaysia
ConstructionEconpile Holdings Berhad 213,900 652,395 255,989 3.80 Gamuda Berhad 145,800 769,824 592,711 4.48 IJM Corporation Berhad 180,380 595,254 491,755 3.46 Kerjaya Prospek Group Berhad 114,800 420,168 238,294 2.44 WCT Holdings Berhad 175,658 307,402 366,351 1.79
830,538 2,745,043 1,945,100 15.97
(Forward)
The preparation of the Fund’s financial statements requires the Manager to make judgments,estimates and assumptions that affect the reported amounts of revenues, expenses, assets andliabilities, and the disclosure of contingent liabilities at the reporting date. However, uncertaintyabout these assumptions and estimates could result in outcomes that could require a materialadjustment to the carrying amount of the asset or liability in the future.
The Fund classifies its Shariah-compliant investments as financial assets at FVTPL as the Fundmay sell its Shariah-compliant investments in the short-term for profit-taking or to meetunitholders’ cancellation of units.
No major judgments have been made by the Manager in applying the Fund’s accounting policies.There are no key assumptions concerning the future and other key sources of estimation uncertaintyat the reporting date, that have a significant risk of causing a material adjustment to the carryingamounts of assets and liabilities within the next financial year.
Realised gains and losses on disposals of financial instruments classified at fair value through profitor loss are calculated using the weighted average method. They represent the difference between aninstrument’s initial carrying amount and disposal amount.
176

Marketvalue as a
percentage ofNumber Market Purchase net asset
Name of company of shares value cost valueRM RM %
Quoted Shariah-compliant equity securities in Malaysia
FinanceBIMB Holdings Berhad 102,200 448,658 438,413 2.61
Industrial productsSKP Resources Bhd. 305,000 457,500 346,569 2.66Top Glove Corporation Bhd. 51,000 283,050 263,235 1.65V.S. Industry Berhad 131,600 350,056 181,207 2.04Wellcall Holdings Berhad 123,000 158,670 179,788 0.92
610,600 1,249,276 970,799 7.27
Infrastructure DiGi. Com Berhad 111,600 546,840 396,303 3.18TIME dotCom Berhad 50,500 448,440 304,900 2.61
162,100 995,280 701,203 5.79
PlantationGenting Plantations Berhad 37,200 383,160 168,838 2.23Kuala Lumpur Kepong Berhad 39,900 979,944 703,032 5.70
77,100 1,363,104 871,870 7.93
PropertiesEco World Development Group
Berhad 234,100 362,855 325,045 2.11
TechnologyGlobetronics Technology Berhad 71,000 436,650 419,016 2.54Inari Amertron Berhad 204,500 519,430 424,938 3.03
275,500 956,080 843,954 5.57
(Forward)
177

Marketvalue as a
percentage ofNumber Market Purchase net asset
Name of company of shares value cost valueRM RM %
Quoted Shariah-compliant equity securities in Malaysia
Trading/ServicesAxiata Group Berhad 154,100 807,484 872,015 4.70Bermaz Auto Berhad 171,700 362,287 377,030 2.11Dialog Group Berhad 172,520 345,040 173,891 2.01IHH Healthcare Berhad 96,100 552,575 483,604 3.21MISC Berhad 43,100 314,630 300,502 1.83Pos Malaysia Berhad 64,700 339,675 268,283 1.98Serba Dinamik Holdings Berhad 73,700 170,984 111,722 0.99Sime Darby Berhad 157,200 1,417,944 1,405,321 8.25Telekom Malaysia Berhad 104,470 679,055 530,637 3.95Tenaga Nasional Berhad 103,975 1,488,922 869,853 8.66
1,141,565 6,478,596 5,392,858 37.69
Total financial assets at FVTPL 3,433,703 14,598,892 11,489,242 84.94
Excess of market value over cost 3,109,650
5. DEPOSIT WITH FINANCIAL INSTITUTION
2017 2016RM RM
At nominal value:Short-term deposit with a licensed Islamic bank 2,598,900 -
At carrying value:Short-term deposit with a licensed Islamic bank 2,599,142 -
178

Details of deposit with financial institution as at 30 September 2017 are as follows:
Carryingvalue as a
Maturity Nominal Carrying Purchase percentage ofdate Bank value value cost net asset value
RM RM RM %
Short-term deposit with a licensed Islamic bank
02.10.2017 Maybank IslamicBerhad 2,598,900 2,599,142 2,598,900 15.12
2017 2016 2017 2016% % Days Day
Short-term deposit with alicensed Islamic bank 3.40 - 2 -
6. AMOUNT DUE TO MANAGER
2017 2016RM RM
Redemption of units* (1,506) (12,971)Manager’s fee payable (22,753) (22,639)
(24,259) (35,610)
* The amount represents amount payable to the Manager for units redeemed.
The normal credit period in the previous and current financial years for redemption of units is threebusiness days.
Manager’s fee is at a rate of 1.50% (2016: 1.50%) per annum on the net asset value of the Fund,calculated on a daily basis.
The weighted average effective profit rate and average remaining maturity of short-term depositsare as follows:
Weighted average Remainingeffective profit rate maturity
The normal credit period in the previous and current financial years for Manager’s fee payable isone month.
179

7. AMOUNT DUE TO TRUSTEE
8. NET GAIN FROM SHARIAH-COMPLIANT INVESTMENTS
2017 2016RM RM
Net gain on financial assets at FVTPL comprised:− Net realised gain on sale of Shariah-compliant
investments 293,682 1,237,448 − Net unrealised gain/(loss) on changes in fair values of
Shariah-compliant investments 907,204 (897,999)
1,200,886 339,449
9. OTHER EXPENSES
10. TOTAL EQUITY
Total equity is represented by:
2017 2016Note RM RM
Unitholders’ capital (a) (4,925,932) (3,238,340)Retained earnings− Realised income (b) 19,004,306 18,602,756 − Unrealised gain (c) 3,109,650 2,202,446
17,188,024 17,566,862
Included in other expenses is Goods and Services Tax incurred by the Fund during the financialyear amounting to RM17,764 (2016: RM19,898).
The normal credit period in the previous and current financial years for Trustee’s fee payable is onemonth.
Trustee’s fee is at a rate of 0.06% (2016: 0.06%) per annum on the net asset value of the Fund,calculated on a daily basis.
180

(a) UNITHOLDERS’ CAPITAL/UNITS IN CIRCULATION
Number of Number of units RM units RM
At beginning of the financial year 37,410,360 (3,238,340) 44,423,214 66,541
Creation during thefinancial year 1,058,416 524,190 9,013,065 4,321,953
Cancellation during the financial year (4,511,725) (2,211,782) (16,025,919) (7,626,834)
At end of the financial year 33,957,051 (4,925,932) 37,410,360 (3,238,340)
(b) REALISED – DISTRIBUTABLE
2017 2016RM RM
At beginning of the financial year 18,602,756 17,212,010
Total comprehensive income for the financial year 1,308,754 492,747 Net unrealised (gain)/loss attributable to Shariah-compliant
investments held transferred to unrealised reserve [Note 10(c)] (907,204) 897,999
Net increase in realised reserve for thefinancial year 401,550 1,390,746
At end of the financial year 19,004,306 18,602,756
(c) UNREALISED – NON-DISTRIBUTABLE
2017 2016RM RM
At beginning of the financial year 2,202,446 3,100,445 Net unrealised gain/(loss) attributable to Shariah-compliant
investments held transferred from realised reserve [Note 10(b)] 907,204 (897,999)
At end of the financial year 3,109,650 2,202,446
20162017
The negative balance of unitholders’ capital was due to the cancellation of units at a higher netasset value per unit following the price appreciation of the Fund as compared to the units beingcreated at a lower net asset value per unit in prior years.
181

11. UNITS HELD BY RELATED PARTIES
12. INCOME TAX
2017 2016RM RM
Current financial year − local tax 135 135 Under provision of tax in prior financial years - 6,446
135 6,581
2017 2016RM RM
Net income before tax 1,308,889 499,328
Taxation at Malaysian statutory rate of 24% 314,133 119,839 Tax effects of:
Income not subject to tax (389,135) (416,070)Effect of different tax rate (188) (190)Loss not deductible for tax purposes - 215,520 Restriction on tax deductible expenses for unit trust fund 60,191 63,592 Non-permitted expenses for tax purposes 8,446 10,378 Permitted expenses not used and not available for
future financial years 6,688 7,066 Under provision of tax in prior financial years - 6,446
Tax expense for the financial year 135 6,581
13. DISTRIBUTION
Income tax payable is calculated on Shariah-compliant investments income less deduction forpermitted expenses as provided for under Section 63B of the Income Tax Act, 1967.
Pursuant to Schedule 6 of the Income Tax Act, 1967, local profit income derived by the Fund isexempted from tax.
No distribution was declared by the Fund for the financial years ended 30 September 2017 and 30September 2016.
A reconciliation of income tax expense applicable to net income before tax at the statutory incometax rate to income tax expense at the effective income tax rate of the Fund is as follows:
The Manager and parties related to the Manager did not hold any units in the Fund as at 30September 2017 and 30 September 2016.
182

14. MANAGEMENT EXPENSE RATIO (“MER”)
The Fund’s MER is as follows:
2017 2016% p.a. % p.a.
Manager’s fee 1.50 1.50 Trustee’s fee 0.06 0.06 Fund’s other expenses 0.25 0.24
Total MER 1.81 1.80
15. PORTFOLIO TURNOVER RATIO (“PTR”)
16. SEGMENTAL REPORTING
‒ A portfolio of Shariah-compliant equity instruments; and‒
The MER of the Fund is the ratio of the sum of annualised fees and expenses incurred by the Fundto the average net asset value of the Fund calculated on a daily basis.
The PTR of the Fund, which is the ratio of average total acquisitions and disposals of Shariah-compliant investments to the average net asset value of the Fund calculated on a daily basis, is 0.33times (2016: 0.52 times).
A portfolio of Shariah-compliant fixed income instruments, including deposits with financialinstitutions.
The Manager and Investment Committee of the Fund are responsible for allocating resourcesavailable to the Fund in accordance with the overall investment strategies as set out in theInvestment Guidelines of the Fund. The Fund is managed by two segments:
The investment objective of each segment is to achieve consistent returns from the Shariah-compliant investments in each segment while safeguarding capital by investing in diversifiedportfolios. There have been no changes in reportable segments in the current financial year. Thesegment information provided is presented to the Manager and Investment Committee of the Fund.
183
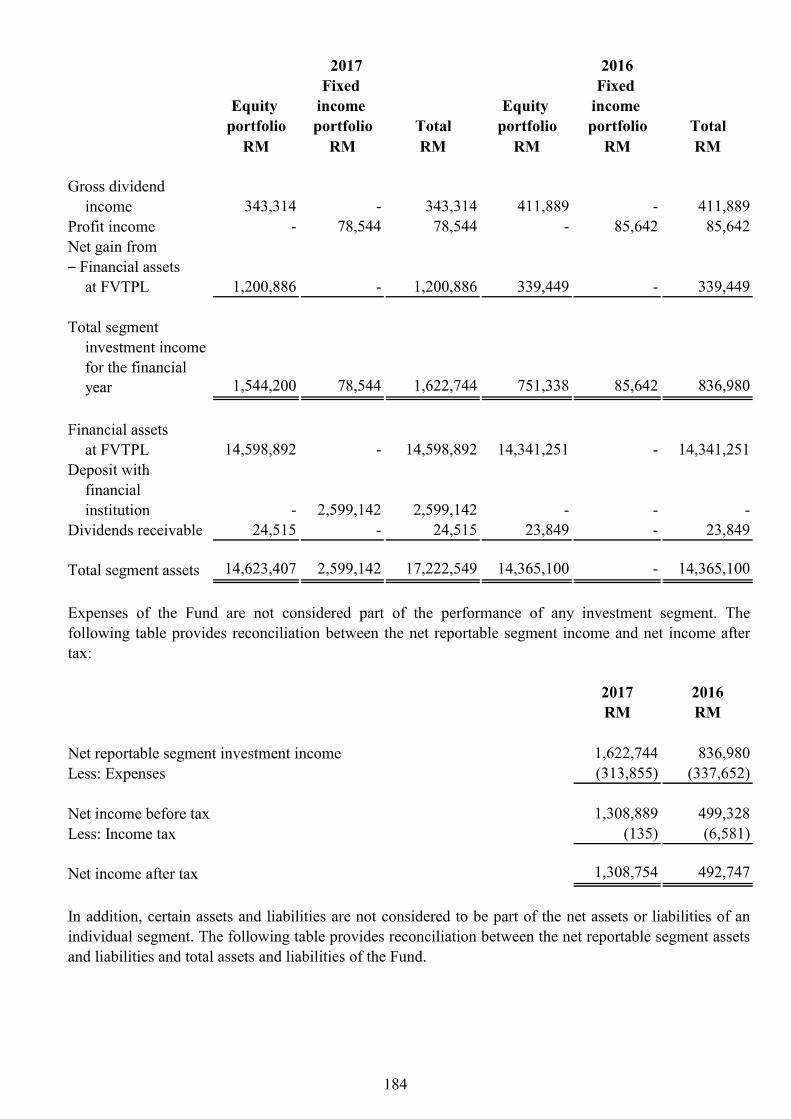
Fixed Fixed Equity income Equity income
portfolio portfolio Total portfolio portfolio TotalRM RM RM RM RM RM
Gross dividend income 343,314 - 343,314 411,889 - 411,889
Profit income - 78,544 78,544 - 85,642 85,642 Net gain from ‒ Financial assets
at FVTPL 1,200,886 - 1,200,886 339,449 - 339,449
Total segment investment incomefor the financialyear 1,544,200 78,544 1,622,744 751,338 85,642 836,980
Financial assets at FVTPL 14,598,892 - 14,598,892 14,341,251 - 14,341,251
Deposit withfinancialinstitution - 2,599,142 2,599,142 - - -
Dividends receivable 24,515 - 24,515 23,849 - 23,849
Total segment assets 14,623,407 2,599,142 17,222,549 14,365,100 - 14,365,100
2017 2016RM RM
Net reportable segment investment income 1,622,744 836,980 Less: Expenses (313,855) (337,652)
Net income before tax 1,308,889 499,328 Less: Income tax (135) (6,581)
Net income after tax 1,308,754 492,747
20162017
Expenses of the Fund are not considered part of the performance of any investment segment. Thefollowing table provides reconciliation between the net reportable segment income and net income aftertax:
In addition, certain assets and liabilities are not considered to be part of the net assets or liabilities of anindividual segment. The following table provides reconciliation between the net reportable segment assetsand liabilities and total assets and liabilities of the Fund.
184

2017 2016RM RM
Total segment assets 17,222,549 14,365,100 Cash at banks 7,707 3,252,232
Total assets of the Fund 17,230,256 17,617,332
Total segment liabilities - - Amount due to Manager 24,259 35,610 Amount due to Trustee 853 905 Sundry payables and accrued expenses 17,120 13,955
Total liabilities of the Fund 42,232 50,470
17. TRANSACTIONS WITH BROKERS AND FINANCIAL INSTITUTIONS
Brokers/Financial institutionsRM % RM %
AmInvestment Bank Berhad* 3,847,751 33.77 14,827 31.53 CLSA Securities Malaysia Sdn. Bhd. 1,295,811 11.37 4,884 10.39 Instinet Pacific Limited 761,130 6.68 2,801 5.96 Maybank Investment Bank Berhad 716,517 6.29 4,504 9.58 CIMB Investment Bank Berhad 648,618 5.69 2,707 5.75 JF Apex Securities 535,210 4.70 2,407 5.12 Alliance Investment Bank Berhad 484,311 4.25 2,176 4.62 Affin Hwang Investment Bank Berhad 454,634 3.99 2,576 5.48 Kenanga Investment Bank Berhad 403,965 3.55 1,403 2.98 KAF Seagroatt & Campbell Securities Sdn Bhd 391,485 3.44 1,555 3.31 Other brokers and financial institutions 1,853,123 16.27 7,185 15.28
Total 11,392,555 100.00 47,025 100.00
*
Transaction value duty and clearing feeBrokerage fee, stamp
Details of transactions with brokers and financial institutions for the financial year ended 30 September2017 are as follows:
A financial institution related to the Manager. The Manager and the Trustee are of the opinion thatthe above transactions have been entered in the normal course of business and have been establishedunder terms that are no less favourable than those arranged with independent third parties.
The above transaction values were in respect of Shariah-compliant listed securities.
185

18. FINANCIAL INSTRUMENTS
(a) Classification of financial instruments
Financial Financial Receivables liabilities at
assets at amortised amortisedat FVTPL cost cost Total
RM RM RM RM
2017AssetsShariah-compliant investments 14,598,892 - - 14,598,892 Deposits with financial institutions - 2,599,142 - 2,599,142 Dividends receivable - 24,515 - 24,515 Cash at banks - 7,707 - 7,707
Total financial assets 14,598,892 2,631,364 - 17,230,256
LiabilitiesAmount due to Manager - - 24,259 24,259 Amount due to Trustee - - 853 853 Sundry payables and accrued expenses - - 17,120 17,120
Total financial liabilities - - 42,232 42,232
2016AssetsShariah-compliant investments 14,341,251 - - 14,341,251 Dividends receivable - 23,849 - 23,849 Cash at banks - 3,252,232 - 3,252,232
Total financial assets 14,341,251 3,276,081 - 17,617,332
LiabilitiesAmount due to Manager - - 35,610 35,610 Amount due to Trustee - - 905 905 Sundry payables and accrued expenses - - 13,955 13,955
Total financial liabilities - - 50,470 50,470
The significant accounting policies in Note 3 describe how the classes of financial instruments aremeasured, and how income and expenses, including fair value gains and losses, are recognised. Thefollowing table analyses the financial assets and liabilities of the Fund in the statement of financialposition by the class of financial instrument to which they are assigned, and therefore by themeasurement basis.
186

and losses2017 2016RM RM
Net gain from financial assets at FVTPL 1,200,886 339,449 Income, of which derived from:– Gross dividend income from financial assets at FVTPL 343,314 411,889 – Profit income from receivables 78,544 85,642
(b) Financial instruments that are carried at fair value
Level 1: quoted (unadjusted) prices in active markets for identical assets or liabilities;
Level 2:
Level 3:
Level 1 Level 2 Level 3 TotalRM RM RM RM
Financial assets at FVTPL 14,598,892 - - 14,598,892
Financial assets at FVTPL 14,341,251 - - 14,341,251
(c)
Deposit with financial institution Dividends receivable Cash at banks Amount due to Manager Amount due to Trustee Sundry payables and accrued expenses
other techniques for which all inputs which have a significant effect on the recorded fairvalues are observable; either directly or indirectly; or
techniques which use inputs which have a significant effect on the recorded fair value thatare not based on observable market data.
The following are classes of financial instruments that are not carried at fair value and whose carryingamounts are reasonable approximation of fair value due to their short period to maturity or short creditperiod:
The following table shows an analysis of financial instruments recorded at fair value by the level ofthe fair value hierarchy:
Income, expense, gains
The Fund’s financial assets and liabilities at FVTPL are carried at fair value.
Financial instruments that are not carried at fair value and whose carrying amounts arereasonable approximation of fair value
The Fund uses the following hierarchy for determining and disclosing the fair value of financialinstruments by valuation technique:
2017
2016
187

19. RISK MANAGEMENT POLICIES
Market risk
(i) Price risk
Percentage movements in price by: 2017 2016
RM RM
-5.00% (729,945) (717,063)+5.00% 729,945 717,063
(ii) Profit rate risk
Market risk, in general, is the risk that the value of a portfolio would decrease due to changes in marketrisk factors such as equity prices, foreign exchange rates, profit rates and commodity prices.
Profit rate risk will affect the value of the Fund’s investments, given the interest rate movements,which are influenced by regional and local economic developments as well as political developments.
Domestic profit rates on deposits and placements with licensed financial institutions are determinedbased on prevailing market rates.
The result below summarised the profit rate sensitivity of the Fund’s NAV, or theoretical value(applicable to money market deposit) due to the parallel movement assumption of the yield curve by+100bps and -100bps respectively.
Sensitivity of the Fund’s NAV
There are no financial instruments which are not carried at fair values and whose carrying amounts arenot reasonable approximation of their respective fair values.
Risk management is carried out by closely monitoring, measuring and mitigating the above said risks,careful selection of Shariah-compliant investments coupled with stringent compliance to Shariah-complaint investment restrictions as stipulated by the Capital Market and Services Act 2007, SecuritiesCommission’s Guidelines on Unit Trust Funds and the Deed as the backbone of risk management of theFund.
The Fund is exposed to a variety of risks that include market risk, credit risk, liquidity risk, single issuerrisk, regulatory risk, management risk and non-compliance/Shariah non-compliance risk.
Price risk refers to the uncertainty of an investment’s future prices. In the event of adverse pricemovements, the Fund might endure potential loss on its Shariah-compliant quoted investments. Inmanaging price risk, the Manager actively monitors the performance and risk profile of the investmentportfolio.
The result below summarised the price risk sensitivity of the Fund’s NAV due to movements of priceby -5.00% and +5.00% respectively:
188

Parallel shift in yield curve by: 2017 2016
RM RM
+100bps (206) (136,558)-100bps 208 153,782
Credit risk
Liquidity risk
Single issuer risk
Regulatory risk
Credit risk is the risk that the counterparty to a financial instrument will cause a financial loss to the Fundby failing to discharge an obligation. Credit risk applies to Islamic short-term deposits and dividendsreceivable. The issuer of such instruments may not be able to fulfill the required profit payments or repaythe principal invested or amount owing. These risks may cause the Fund’s Shariah-compliant investmentsto fluctuate in value.
For deposits with financial institutions, the Fund makes placements with financial institutions with soundrating of P1/MARC-1 and above. Cash at banks are held for liquidity purposes and are not exposed tosignificant credit risk.
Sensitivity of the Fund’s NAV, or theoretical value
Liquidity risk is defined as the risk of being unable to raise funds or borrowings to meet paymentobligations as they fall due. This is also the risk of the Fund experiencing large redemptions, when theInvestment Manager could be forced to sell large volumes of its holdings at unfavourable prices to meetredemption requirements.
Internal policy restricts the Fund from investing in securities issued by any issuer of not more than acertain percentage of its net asset value. Under such restriction, the risk exposure to the securities of anysingle issuer is diversified and managed based on internal/external ratings.
Any changes in national policies and regulations may have effects on the capital market and the net assetvalue of the Fund.
The Fund maintains sufficient level of liquid assets, after consultation with the Trustee, to meetanticipated payments and cancellations of units by unitholders. Liquid assets comprise of deposits withlicensed financial institutions and other instruments, which are capable of being converted into cash within5 to 7 days. The Fund’s policy is to always maintain a prudent level of liquid assets so as to reduceliquidity risk.
189

Management risk
Non-compliance/Shariah non-compliance risk
20. CAPITAL MANAGEMENT
No changes were made in the objective, policies or processes during the financial years ended 30September 2017 and 30 September 2016.
The primary objective of the Fund’s capital management is to ensure that it maximises unitholders’ valueby expanding its fund size to benefit from economies of scale and achieving growth in net asset value fromthe performance of its Shariah-compliant investments.
Poor management of the Fund may cause considerable losses to the Fund that in turn may affect the netasset value of the Fund.
The Fund manages its capital structure and makes adjustments to it, in light of changes in economicconditions. To maintain or adjust the capital structure, the Fund may issue new or bonus units, makedistribution payment, or return capital to unitholders by way of redemption of units.
This is the risk of the Manager, the Trustee or the Fund not complying with internal policies, the Deed ofthe Fund, securities law or guidelines issued by the regulators. In the case of an Islamic Fund, this includesthe risk of the Fund not conforming to Shariah Investment Guidelines. Non-compliance risk may adverselyaffect the Shariah-compliant investments of the Fund when the Fund is forced to rectify the non-compliance.
190

AmIslamic Growth
STATEMENT BY THE MANAGER
Kuala Lumpur, Malaysia7 November 2017
I, GOH WEE PENG, for and on behalf of the Manager, AmFunds Management Berhad, for
AmIslamic Growth do hereby state that in the opinion of the Manager, the accompanying
statement of financial position, statement of comprehensive income, statement of changes in equity,
statement of cash flows and the accompanying notes are drawn up in accordance with Malaysian
Financial Reporting Standards and International Financial Reporting Standards so as to give a true
and fair view of the financial position of the Fund as at 30 September 2017 and the comprehensive
income, the changes in equity and cash flows of the Fund for the financial year then ended.
GOH WEE PENGFor and on behalf of the ManagerAmFunds Management Berhad
191

192
TRUSTEE’S REPORT

193
MANAGER’S REPORT Dear Unitholders, We are pleased to present you the Manager’s report and the audited accounts of AmOasis Global Islamic Equity (“Fund”) for the financial year ended 30 September 2017. Salient Information of the Fund Name AmOasis Global Islamic Equity (“Fund”)
Category/Type
Feeder Fund (Global Islamic equity) / Capital Growth
Name of Target Fund
Oasis Crescent Global Equity Fund
Objective The Fund seeks to achieve moderate capital and income* appreciation over a medium to long-term by investing in shares of global Shariah-compliant companies. Note: *The income could be in the form of units or cash.
Duration The Fund was established on 21 April 2006 and shall exist for as long as it appears to the Manager and the Trustee that it is in the interests of the unitholders for it to continue. In some circumstances, the unitholders can resolve at a meeting to terminate AmOasis Global Islamic Equity.
Performance Benchmark
Dow Jones Islamic Market Index, which follows the Target Fund’s benchmark. (obtainable: www.aminvest.com) Note: The risk profile of the performance benchmark is not the same as the risk profile.
Income Distribution Policy
Income distribution (if any) is paid at least once a year.
Breakdown of Unit Holdings by Size
For the financial year under review, the size of the Fund stood at 13,165,181 units. Size of holding As at 30 September 2017 As at 30 September 2016
No of units held
Number of unitholders
No of units held
Number of unitholders
5,000 and below 210,356 64 466,536 169 5,001-10,000 544,470 76 524,542 75 10,001-50,000 2,181,471 86 2,077,463 103 50,001-500,000 2,088,651 22 2,621,367 21 500,001 and above 8,140,233 4 5,206,402 4

194
Fund Performance Data Portfolio Composition
Details of portfolio composition of the Fund for the financial years as at 30 September are as follows: FY
2017 %
FY 2016 %
FY 2015 %
Foreign collective investment scheme 98.94 97.11 96.86 Cash and others 1.06 2.89 3.14 Total 100.00 100.00 100.00
Note: The abovementioned percentages are calculated based on total net asset value.
Performance Details
Performance details of the Fund for the financial years ended 30 September are as follows: FY
2017 FY
2016 FY
2015 Net asset value (RM) 12,762,042* 13,175,757 15,133,409 Units in circulation 13,165,181* 10,896,310 12,280,280 Net asset value per unit (RM) 0.9694* 1.2092 1.2323 Highest net asset value per unit
(RM)
1.2117* 1.2833
1.2755 Lowest net asset value per unit
(RM)
0.9095* 1.1139
1.0206 Benchmark performance (%) 18.01 5.85 24.30 Total return (%)(1) 6.58 -1.87 14.72 - Capital growth (%) -18.23 -1.87 14.72 - Income distribution (%) 24.81 - - Gross distribution (sen per unit) 30.00 - - Net distribution (sen per unit) 30.00 - - Management expense ratio (%)(2) 0.36 0.53 0.62 Portfolio turnover ratio (times)(3) 0.51 1.95 0.73
* Above prices and net asset value per unit are shown as ex- distribution. Note: (1) Total return is the actual return of the Fund for the respective financial years
computed based on the net asset value per unit and net of all fees. (2) Management expense ratio (“MER”) is calculated based on the total fees
and expenses incurred by the Fund divided by the average fund size calculated on a daily basis. The MER decreased by 0.17% as compared to 0.53% per annum for the financial year ended 30 September 2016 mainly due to decrease in expenses.
(3) Portfolio turnover ratio (“PTR”) is calculated based on the average of the total acquisitions and total disposals of investment securities of the Fund divided by the average fund size calculated on a daily basis. The PTR decreased by 1.44 times (73.8%) as compared to 1.95 times for the financial year ended 30 September 2016 mainly due to decrease in investing activities.

195
Average Total Return (as at 30 September 2017) AmOasis Global
Islamic Equity(a) %
DJIM(b)
% One year 6.58 18.01 Three years 6.26 15.78 Five years 9.16 15.56 Ten years 1.18 5.76
Annual Total Return Financial Years Ended (30 September)
AmOasis Global Islamic Equity(a)
%
DJIM(b)
% 2017 6.58 18.01 2016 -1.87 5.85 2015 14.72 24.30 2014 7.70 12.53 2013 19.92 18.02
(a) Source: Novagni Analytics and Advisory Sdn Bhd. (b) The Dow Jones Islamic Market Index (“DJIM”) (Obtainable via:
www.aminvest.com). The Fund performance is calculated based on the net asset value per unit of the Fund. Average total return of the Fund and its benchmark for a period is computed on the absolute return for that period annualised over one year. Note: Past performance is not necessarily indicative of future performance and that unit prices and investment returns may go down, as well as up.
Fund Performance
For the financial year under review, the Fund registered a return of 6.58% comprising of negative 18.23% capital and 24.81% income distribution. Thus, the Fund’s return of 6.58% has underperformed the benchmark’s return of 18.01% by 11.43%. As compared with the financial year ended 30 September 2016, the net asset value (“NAV”) per unit of the Fund decreased by 19.83% from RM1.2092 to RM0.9694, while units in circulation increased by 20.82% from 10,896,310 units to 13,165,181 units. The line chart below shows comparison between the annual performances of AmOasis Global Islamic Equity and its benchmark, DJIM, for the financial years ended 30 September. (Forward)

196
Note: Past performance is not necessarily indicative of future performance and that unit prices and investment returns may go down, as well as up.
Target Fund Performance
Fund Performance review of the Target Fund - Oasis Crescent Global Equity Fund (“the Target Fund”)
Returns in USD, Gross-of-Fees, Gross of Non Permissible Income Source: Oasis Research; Bloomberg: December 2000 – September 2017
Returns in USD, Gross-of-Fees, Gross of Non Permissible Income Source: Oasis Research; Bloomberg: December 2000 – September 2017
Has the Fund achieved its objective?
The Fund achieved its objectives by giving positive returns over a medium to long term period. The Fund’s Average Total Return for three years and five years period is at 6.26% and 9.16% respectively.
Strategies and Policies Employed
Strategies and Policies of the Target Fund
The objective of the Oasis Crescent Global Equity Fund is to achieve medium to
19.92
7.70
14.72
-1.87
6.58
18.02 12.53
24.30
5.85
18.01
-4.00
0.00
4.00
8.00
12.00
16.00
20.00
24.00
28.00
Tota
l Ret
urn
(%)
Financial Years Ended (30 September)
DJIM
AmOasis Global Islamic Equity

197
long-term growth of capital and income by investing in shares, including preference shares, of companies and shares or units in collective investment schemes and real estate investment trusts (“REITs”) listed and traded on the international stock exchanges and on markets, set out in the Prospectus and that are Shariah compliant according to the guidelines set by the Investment Manager’s Shariah Advisory Board. Oasis Crescent Global Equity Fund’s objective is to protect the real wealth and improving the standard of living of all investors. The Target Fund aims to provide superior returns at a low volatility which is driven by our instrument selection based on quality and value and ensuring that the portfolio is appropriately diversified. One of the key attributes of our philosophy is to provide significant downside protection relative to the market based on our quality and valuation selection criteria. This is one of the key drivers of outperformance and wealth creation over the long term. We have maintained our investment philosophy of investing in high quality companied which have strong competitive advantages and the ability to leverage off those competitive advantages to deliver a higher level of sustainable Return on Equity (“ROE”) through the economic cycle. We believe that companies which have the healthy balance sheets and strong cash flows have the ability to sustain themselves during challenging economic environments while delivering real earnings growth over the long-term. Our portfolio trades at a significant discount to the global equity market across various measures and provides sustainably higher ROE through the economic cycle. This should result in real wealth creation for our clients over the long term. Furthermore, given the current interest rate environment, we believe earnings for large-cap cash flush companies are understated due to almost negligible returns on their cash balances. As economic conditions and interest rates start to normalize, the companies stand to benefit while higher leveraged companies will struggle as their funding costs increase. Companies in our portfolio have a sustainable long term competitive advantage in a form of a lower weighted average cost of a capital due to their strong free cash flow generations.
Strategies and Policies of the Fund For the financial year under review, the Fund invested a minimum of 95% of the Fund’s NAV in the share class denominated in USD of the Oasis Crescent Global Equity Fund (Target Fund).
Portfolio Structure
This table below is the asset allocation of the Fund for the financial years under review.
As at 30-9-2017
%
As at 30-9-2016
%
Changes
% Foreign collective investment
scheme
98.94 97.11 1.83 Cash and others 1.06 2.89 -1.83 Total 100.00 100.00
For the financial under review, the Fund invested 98.84% in the foreign collective investment scheme and the balance of 1.06% in cash and other net current assets.

198
Distribution/ Unit splits
During the financial year under review, the Fund declared income distribution, detailed as follows: 30.00 sen per unit income distribution
Change in the unit price prior and
subsequent to the income distribution
Before income distribution on
10 November 2017 (RM)
After income distribution on
10 November 2017 (RM)
Net asset value per unit 1.2106 0.9106 There was no unit split declared for the financial year under review.
State of Affairs
There has been neither significant change to the state of affairs of the Fund nor any circumstances that materially affect any interests of the unitholders during the financial year under review.
Rebates and Soft Commission
It is our policy to pay all rebates to the Fund. Soft commission received from brokers/dealers are retained by the Manager only if the goods and services provided are of demonstrable benefit to unitholders of the Fund. During the financial year under review, the Manager had received on behalf of the Fund, soft commissions in the form of fundamental database, financial wire services, technical analysis software and stock quotation system incidental to investment management of the Fund. These soft commissions received by the Manager are deem to be beneficial to the unitholders of the Fund.
Market Review
Global economic growth is expected to rise to 3.4% in 2017 from 3.1% last year, firming further in 2018 to 3.6% on the back of a modest cyclical recovery in global trade volumes and commodity prices. According to the International Monetary Fund (“IMF”), growth in advanced economies is set to outperform its post-2011 average of 1.7%, expanding around 2.0% this year and next. In the US, an improving job market has supported growth in disposable income and helped underpin consumer spending. Much of the Eurozone is now in a synchronized upswing following a double-dip recession in 2012 caused by the sovereign debt crisis. A key underpin has been the significant 20% weakening in the Euro in the wake of the European Central Bank’s (“ECB”) decision to launch quantitative easing (“QE”) in early 2015 which has boosted export competitiveness, especially for Germany. In emerging markets, both Brazil and Russia, in particular, have emerged out of deep recessions. China has continued to defy bearish forecasts by maintaining a Gross Domestic Product (“GDP”) growth rate close to 7.0% this year even while it structurally transitions to a more sustainable consumption-led growth path. The global economy faces a number of key risks. Most importantly, the normalization of monetary conditions in developed markets, in particular the US, may cause a faster than expected tightening of global financial conditions, which could impact the rich market valuations and increase market volatility. This is a particular risk for emerging fixed income markets which have been the main beneficiaries from the ‘low for longer’ interest rate environment in recent years. China’s high level of corporate indebtedness and lack of transparency on local government balance sheets also poses a key risk to the domestic economy and, by extension, the global economy too. More inward looking economic policies could also undermine the benefits of globalization while geopolitical tensions, particularly around North Korea, present a risk to global stability. Global equity markets have maintained their strong run in 2017, on the back of

199
improved global macroeconomic conditions and expectations for fiscal reforms. The major equity indices are trading in line or at premium to their long term average valuations. The strong growth expectations for e-commerce related stocks have seen this sector rise substantially over the past year. However, as yields start to increase and normalize from the current low levels, any disappointment on earnings for these companies could result in significant downside. We believe some caution is warranted in these sectors and stock picking will be even more critical to generate long term value. During uncertain times, the market is likely to draw greater distinction between low and high quality companies which should play out favourably for our portfolio positioning. Our share selection criterion continues to focus on market leaders which have sustainable competitive advantages and the ability to deliver superior Return on Equity (“ROE”) through the economic cycle. The higher free cash flow yields and stronger balance sheets of the companies in our portfolio ensures that they are able to invest in their businesses through the cycle, while providing sustainable returns to shareholders through dividends and share repurchases. We believe these qualities will continue to provide long-term wealth creation for our investors while taking on relatively lower risk than the market.
Market Outlook
Global equity markets have maintained their strong run in 2017, on the back of improved global macroeconomic conditions and expectations for fiscal reforms. The major equity indices are trading in line or at a premium to their long term average valuations. The strong growth expectations for e-commerce related stocks have seen this sector rise substantially over the past year. However, as yields start to increase and normalize from the current low levels, any disappointment in earnings for these companies could result in significant downside. We believe some caution is warranted in these sectors and stock picking will be even more critical to generate long term value.
Source: Oasis Research; Bloomberg: September 2017 During uncertain times, the market is likely to draw greater distinction between low and high quality companies which should play out favourably for our portfolio positioning. Our ability to successfully identify these high quality investments has come through in our historic performance where our global equity portfolios have delivered much higher risk-adjusted returns than their respective benchmarks. At the same time, our focus on quality and value has provided very valuable downside protection during increased market volatility.
Additional Information
Following the renewal of the Master Prospectus effective from 10 September 2017, the “Counterparty Credit Risk” has been included on page 46 as the inclusion in the Fund explicitly describes the risk in counterparty dealing instead of issuer/obligor credit. The insertion of this risk is for clarity purposes.

200
Counterparty Credit Risk Counterparty credit risk is the risk arising from the possibility that the counterparty may default or not able to fulfill a trade settlement prior or on the settlement date of the trade. This could adversely affect the value of the Fund. For more details, kindly refer to the Master Prospectus dates 10 September 2017.
Kuala Lumpur, Malaysia AmFunds Management Berhad 7 November 2017

Independent auditors’ report to the unitholders of AmOasis Global Islamic Equity
Report on the audit of the financial statements
Opinion
Basis for opinion
Independence and other ethical responsibilities
Information other than the financial statements and auditors’ report thereon
We have audited the financial statements of AmOasis Global Islamic Equity (“the Fund”), whichcomprise the statement of financial position as at 30 September 2017, and the statement ofcomprehensive income, statement of changes in equity and statement of cash flows for the year thenended, and notes to the financial statements, including a summary of significant accounting policies,as set out on pages 204 to 226.
In our opinion, the accompanying financial statements give a true and fair view of the financialposition of the Fund as at 30 September 2017 and of its financial performance and its cash flows forthe year then ended in accordance with Malaysian Financial Reporting Standards and InternationalFinancial Reporting Standards.
We conducted our audit in accordance with approved standards on auditing in Malaysia andInternational Standards on Auditing. Our responsibilities under those standards are further describedin the Auditor’s Responsibilities for the Audit of the Financial Statements section of our report. Webelieve that the audit evidence we have obtained is sufficient and appropriate to provide a basis forour opinion.
We are independent of the Fund in accordance with the By-Laws (on Professional Ethics, Conductand Practice) of the Malaysian Institute of Accountants (“By-Laws”) and the International EthicsStandards Board for Accountants’ Code of Ethics for Professional Accountants (“IESBA Code”),and we have fulfilled our other ethical responsibilities in accordance with the By-Laws and theIESBA Code.
The Manager is responsible for the other information. The other information comprises informationin the Annual Report, but does not include the financial statements of the Fund and our auditors’report thereon.
Our opinion on the financial statements of the Fund does not cover the other information and we donot express any form of assurance conclusion thereon.
In connection with our audit of the financial statements of the Fund, our responsibility is to read theother information and, in doing so, consider whether the other information is materially inconsistentwith the financial statements of the Fund or our knowledge obtained in the audit or otherwiseappears to be materially misstated.
201

Independent auditors’ report to the unitholders of AmOasis Global Islamic Equity (cont’d.)
Responsibilities of the Manager and the Trustees for the financial statements
Auditor’s responsibilities for the audit of the financial statements
As part of an audit in accordance with the approved standards on auditing in Malaysia andInternational Standards on Auditing, we exercise professional judgment and maintain professionalskepticism throughout the planning and performance of the audit. We also:
Identify and assess the risks of material misstatement of the financial statements of the Fund,whether due to fraud or error, design and perform audit procedures responsive to those risks,and obtain audit evidence that is sufficient and appropriate to provide a basis for our opinion.The risk of not detecting a material misstatement resulting from fraud is higher than for oneresulting from error, as fraud may involve collusion, forgery, intentional omissions,misrepresentations, or the override of internal control.
Obtain an understanding of internal control relevant to the audit in order to design auditprocedures that are appropriate in the circumstances, but not for the purpose of expressing anopinion on the effectiveness of the Fund’s internal control.
Our objectives are to obtain reasonable assurance about whether the financial statements of the Fund,as a whole are free from material misstatement, whether due to fraud or error, and to issue anauditors’ report that includes our opinion. Reasonable assurance is a high level of assurance, but isnot a guarantee that an audit conducted in accordance approved standards on auditing in Malaysiaand International Standards on Auditing will always detect a material misstatement when it exists.Misstatements can arise from fraud or error and are considered material if, individually or in theaggregate, they could reasonably be expected to influence the economic decisions of users taken onthe basis of these financial statements.
If based on the work we have performed, we conclude that there is a material misstatement of thisother information, we are required to report that fact. We have nothing to report in this regard.
The Manager is responsible for the preparation of the financial statements of the Fund that give atrue and fair view in accordance with Malaysian Financial Reporting Standards and InternationalFinancial Reporting Standards. The Manager is also responsible for such internal control as theManager determines is necessary to enable the preparation of financial statements of the Fund thatare free from material misstatement, whether due to fraud or error.
In preparing the financial statements of the Fund, the Manager is responsible for assessing theFund’s ability to continue as a going concern, disclosing, as applicable, matters related to goingconcern and using the going concern basis of accounting unless the Manager either intends toliquidate the Fund or to cease operations, or has no realistic alternative to do so.
The Trustee is responsible for ensuring that the Manager maintains proper accounting and otherrecords as are necessary to enable true and fair presentation of these financial statements.
202

Independent auditors’ report to the unitholders of AmOasis Global Islamic Equity (cont’d.)
Other matters
Ernst & Young Wan Daneena Liza Bt Wan Abdul RahmanAF: 0039 No. 2978/03/18(J)Chartered Accountants Chartered Accountant
Kuala Lumpur, Malaysia7 November 2017
We communicate with the Manager regarding, among other matters, the planned scope and timing ofthe audit and significant audit findings, including any significant deficiencies in internal control thatwe identify during our audit.
This report is made solely to the unitholders of the Fund, as a body, and for no other purpose. We donot assume responsibility to any other person for the content of this report.
Evaluate the appropriateness of accounting policies used and the reasonableness ofaccounting estimates and related disclosures made by the Manager.
Conclude on the appropriateness of the Manager’s use of the going concern basis ofaccounting and, based on the audit evidence obtained, whether a material uncertainty existsrelated to events or conditions that may cast significant doubt on the Fund’s ability tocontinue as a going concern. If we conclude that a material uncertainty exists, we arerequired to draw attention in our auditors’ report to the related disclosures in the financialstatements or, if such disclosures are inadequate, to modify our opinion. Our conclusions arebased on the audit evidence obtained up to the date of our auditors’ report. However, futureevents or conditions may cause the Fund to cease to continue as a going concern.
Evaluate the overall presentation, structure and content of the financial statements of theFund, including the disclosures, and whether the financial statements of the Fund representthe underlying transactions and events in a manner that achieves fair presentation.
203

AmOasis Global Islamic Equity
STATEMENT OF FINANCIAL POSITIONAS AT 30 SEPTEMBER 2017
2017 2016Note RM RM
ASSETSShariah-compliant investment 4 12,626,466 12,795,331 Deposits with financial institutions 5 332,431 437,036 Cash at banks 4,063 3,961
TOTAL ASSETS 12,962,960 13,236,328
LIABILITIESAmount due to Manager 6 165,147 24,361 Amount due to Trustee 7 741 789 Sundry payables and accrued expenses 35,030 35,421
TOTAL LIABILITIES 200,918 60,571
EQUITYUnitholders’ capital 10(a) 8,120,385 5,563,092 Retained earnings 10(b)(c) 4,641,657 7,612,665
TOTAL EQUITY 10 12,762,042 13,175,757
TOTAL EQUITY AND LIABILITIES 12,962,960 13,236,328
UNITS IN CIRCULATION 10(a) 13,165,181 10,896,310
NET ASSET VALUE PER UNIT 96.94 sen 120.92 sen
The accompanying notes form an integral part of the financial statements.
204

AmOasis Global Islamic Equity
STATEMENT OF COMPREHENSIVE INCOMEFOR THE FINANCIAL YEAR ENDED 30 SEPTEMBER 2017
2017 2016Note RM RM
SHARIAH-COMPLIANT INVESTMENT INCOME
Distribution income 20,054 17,270 Rebate fee income from Target Fund Manager 26,719 26,238 Profit income 12,629 36,077 Net gain from Shariah-compliant investment:− Financial assets at fair value through profit or
loss (“FVTPL”) 8 1,003,261 223,455
Gross Income 1,062,663 303,040
EXPENDITUREManager’s fee 6 (7,935) (23,735)Trustee’s fee 7 (10,042) (10,196)Auditors’ remuneration - current financial year (7,600) (6,600)Auditors’ remuneration - under provision in prior
financial year (1,000) - Tax agent’s fee (3,800) (3,500)Custodian’s fee (9,460) (10,584)Other expenses 9 (11,744) (23,099)
Total Expenditure (51,581) (77,714)
NET INCOME BEFORE TAX 1,011,082 225,326 LESS: INCOME TAX 12 - -
NET INCOME AFTER TAX 1,011,082 225,326
OTHER COMPREHENSIVE INCOME - -
TOTAL COMPREHENSIVE INCOME FOR THEFINANCIAL YEAR 1,011,082 225,326
Total comprehensive income comprises the following:Realised income 690,992 1,998,561 Unrealised gain/(loss) 320,090 (1,773,235)
1,011,082 225,326
(Forward)
205

AmOasis Global Islamic Equity
STATEMENT OF COMPREHENSIVE INCOMEFOR THE FINANCIAL YEAR ENDED 30 SEPTEMBER 2017 (CONT’D.)
2017 2016Note RM RM
Distribution for the financial year:Net distribution 13 3,982,090 -
Gross/net distribution per unit (sen) 13 30.00 -
The accompanying notes form an integral part of the financial statements.
206

AmOasis Global Islamic Equity
STATEMENT OF CHANGES IN EQUITYFOR THE FINANCIAL YEAR ENDED 30 SEPTEMBER 2017
Unitholders’ Retained Total capital earnings equity
Note RM RM RM
At 1 October 2015 7,746,070 7,387,339 15,133,409 Total comprehensive income for
the financial year - 225,326 225,326 Creation of units 10(a) 181,089,837 - 181,089,837 Cancellation of units 10(a) (183,272,815) - (183,272,815)
Balance at 30 September 2016 5,563,092 7,612,665 13,175,757
At 1 October 2016 5,563,092 7,612,665 13,175,757 Total comprehensive income for
the financial year - 1,011,082 1,011,082 Creation of units 10(a) 9,170,178 - 9,170,178 Reinvestment of distribution 10(a),13 3,870,568 - 3,870,568 Cancellation of units 10(a) (10,483,453) - (10,483,453)Distribution 13 - (3,982,090) (3,982,090)
Balance at 30 September 2017 8,120,385 4,641,657 12,762,042
The accompanying notes form an integral part of the financial statements.
207

AmOasis Global Islamic Equity
STATEMENT OF CASH FLOWSFOR THE FINANCIAL YEAR ENDED 30 SEPTEMBER 2017
2017 2016Note RM RM
CASH FLOWS FROM OPERATING ANDINVESTING ACTIVITIES
Proceeds from sale of Shariah-compliant investment 7,896,994 29,367,119 Distribution received 20,054 17,270 Rebate fee income received 26,719 26,238 Profit received 12,629 36,077 Manager’s fee paid (8,554) (28,172)Trustee’s fee paid (10,090) (10,490)Tax agent’s fee paid (3,500) (3,500)Custodian’s fee paid (9,460) (10,584)Payments for other expenses (21,035) (29,239)Purchase of Shariah-compliant investments (6,724,868) (27,281,135)
Net cash generated from operating and investing activities 1,178,889 2,083,584
CASH FLOWS FROM FINANCING ACTIVITIESProceeds from creation of units 9,170,178 189,922,192 Payments for cancellation of units (10,342,048) (192,106,970)Distribution paid (111,522) -
Net cash used in financing activities (1,283,392) (2,184,778)
NET DECREASE IN CASH AND CASHEQUIVALENTS (104,503) (101,194)
CASH AND CASH EQUIVALENTS AT BEGINNING OF FINANCIAL YEAR 440,997 542,191
CASH AND CASH EQUIVALENTS AT END OF FINANCIAL YEAR 336,494 440,997
Cash and cash equivalents comprise:Deposits with financial institutions 5 332,431 437,036 Cash at banks 4,063 3,961
336,494 440,997
The accompanying notes form an integral part of the financial statements.
208
AmOasis Global Islamic Equity
NOTES TO THE FINANCIAL STATEMENTS
1. GENERAL INFORMATION
2. BASIS OF PREPARATION OF FINANCIAL STATEMENTS
Standards effective during the financial year
Standards issued but not yet effective
Effective for financial periods
beginning on or after
MFRS 9: Financial InstrumentsMFRS 15: Revenue From Contracts With Customers
The financial statements of the Fund have been prepared under the historical cost convention,unless otherwise stated in the accounting policies.
The adoption of MFRS which have been effective during the financial year did not have anymaterial financial impact to the financial statements.
AmOasis Global Islamic Equity (“the Fund”) was established pursuant to a Deed dated 30 March2006 as amended by Deeds Supplemental thereto (“the Deed”), between AmFunds ManagementBerhad as the Manager, AmanahRaya Trustees Berhad as the Trustee and all unitholders.
As at the date of authorisation of these financial statements, the following Standards, which arerelevant to the Fund, have been issued by MASB but are not yet effective and have not beenadopted by the Fund.
The Fund plans to adopt the above pronouncements when they become effective in the respectivefinancial periods. These pronouncements are expected to have no significant impact to thefinancial statements of the Fund upon their initial application except as described below:
The Fund was set up with the objective of providing investors with moderate capital and incomeappreciation over a medium to long-term period by investing in shares of Shariah-compliantcompanies globally. Being a feeder fund, a minimum of 95% of the Fund’s net asset will beinvested in the Oasis Crescent Global Equity Fund (“Target Fund”), which is a separate Shariah-compliant unit trust fund managed by Oasis Global Management Company (Ireland) Limited(“Target Fund Manager”). As provided in the Deed, the “accrual period” or financial year shallend on 30 September and the units in the Fund were first offered for sale on 21 April 2006.
1 January 20181 January 2018
The financial statements of the Fund have been prepared in accordance with Malaysian FinancialReporting Standards (“MFRS”) as issued by the Malaysian Accounting Standards Board(“MASB”) and are in compliance with International Financial Reporting Standards.
209

MFRS 9 Financial Instruments
3. SIGNIFICANT ACCOUNTING POLICIES
Income recognition
Income tax
Functional and presentation currency
Foreign currency transactions
Statement of cash flows
The Fund adopts the direct method in the preparation of the statement of cash flows.
Current taxes are recognised in profit or loss except to the extent that the tax relates to itemsrecognised outside profit or loss, either in other comprehensive income or directly in equity.
Distribution income is recognised when the Fund’s right to receive payment is established. Profitincome on Islamic short-term deposits is recognised on an accrual basis using the effective profitmethod.
MFRS 9 reflects International Accounting Standards Board’s (“IASB”) work on the replacementof MFRS 139 Financial Instruments: Recognition and Measurement (“MFRS 139”). MFRS 9 willbe effective for financial year beginning on or after 1 January 2018. The Fund is in the process ofquantifying the impact of the first adoption of MFRS 9.
Income is recognised to the extent that it is probable that the economic benefits will flow to theFund and the income can be reliably measured. Income is measured at the fair value ofconsideration received or receivable.
Current tax assets and liabilities are measured at the amount expected to be recovered from orpaid to the tax authorities. The tax rates and tax laws used to compute the amount are those thatare enacted or substantively enacted at the reporting date.
Functional currency is the currency of the primary economic environment in which the Fundoperates that most faithfully represents the economic effects of the underlying transactions. Thefunctional currency of the Fund is Ringgit Malaysia which reflects the currency in which the Fundcompetes for funds, issues and redeems units. The Fund has also adopted Ringgit Malaysia as itspresentation currency.
Transactions in currencies other than the Fund’s functional currency (foreign currencies) arerecorded in the functional currency using exchange rates prevailing at the transaction dates. Ateach reporting date, foreign currency monetary items are translated into Ringgit Malaysia atexchange rates ruling at the reporting date. All exchange gains or losses are recognised in profit orloss.
210
Distribution
Unitholders’ capital
Financial assets
(i) Financial assets at FVTPL
On disposal of Shariah-compliant investment, the net realised gain or loss on disposal ismeasured as the difference between the net disposal proceeds and the carrying amount of theShariah-compliant investment. The net realised gain or loss is recognised in profit or loss.
For Shariah-compliant investment in foreign collective investment scheme, fair value isdetermined based on the closing net asset value per unit of the foreign collective investmentscheme. The difference between the cost and fair value is treated as unrealised gain or lossand is recognised in profit or loss. Unrealised gains or losses recognised in profit or loss arenot distributable in nature.
The unitholders’ capital of the Fund meets the definition of puttable instruments and is classifiedas equity instruments under MFRS 132 Financial Instruments: Presentation (“MFRS 132”).
The Fund determines the classification of its financial assets at initial recognition, and thecategories applicable to the Fund include financial assets at fair value through profit or loss(“FVTPL”) and receivables.
Financial assets are classified as financial assets at FVTPL if they are held for trading or aredesignated as such upon initial recognition. Financial assets held for trading by the Fundinclude foreign Shariah-compliant collective investment scheme acquired principally for thepurpose of selling in the near term.
Subsequent to initial recognition, financial assets at FVTPL are measured at fair value.Changes in the fair value of those financial instruments are recorded in ‘Net gain or loss onfinancial assets at fair value through profit or loss’. Distribution revenue and profit earnedelements of such instruments are recorded separately in ‘Distribution income’ and ‘Profitincome’ respectively. Exchange differences, if any, on financial assets at FVTPL are notrecognised separately in profit or loss but are included in net gains or net losses on changes infair value of financial assets at FVTPL.
Financial assets are recognised in the statement of financial position when, and only when, theFund becomes a party to the contractual provisions of the financial instrument.
When financial assets are recognised initially, they are measured at fair value, plus, in the case offinancial assets not at fair value through profit or loss, directly attributable transaction costs.
Cash equivalents are short-term, highly liquid Shariah-compliant investment that is readilyconvertible to cash with insignificant risk of changes in value.
Distributions are at the discretion of the Fund. A distribution to the Fund’s unitholders isaccounted for as a deduction from realised reserves. A proposed distribution is recognised as aliability in the period in which it is approved.
211

(ii) Receivables
Impairment of financial assets
(i) Receivables carried at amortised cost
Financial liabilities
Financial assets with fixed or determinable payments that are not quoted in an active marketare classified as receivables.
The Fund’s financial liabilities are recognised initially at fair value plus directly attributabletransaction costs and subsequently measured at amortised cost using the effective profit method.
Financial liabilities are classified according to the substance of the contractual arrangementsentered into and the definitions of a financial liability.
A financial liability is derecognised when the obligation under the liability is extinguished. Gainsand losses are recognised in profit or loss when the liabilities are derecognised, and through theamortisation process.
Subsequent to initial recognition, receivables are measured at amortised cost using theeffective profit method. Gains and losses are recognised in profit or loss when the receivablesare derecognised or impaired, and through the amortisation process.
Financial liabilities, within the scope of MFRS 139, are recognised in the statement of financialposition when, and only when, the Fund becomes a party to the contractual provisions of thefinancial instrument.
The Fund assesses at each reporting date whether there is any objective evidence that a financialasset is impaired.
To determine whether there is objective evidence that an impairment loss on financial assetshas been incurred, the Fund considers factors such as the probability of insolvency orsignificant financial difficulties of the debtor and default or significant delay in payments.
The carrying amount of the financial asset is reduced through the use of an allowance account.When a receivable becomes uncollectible, it is written off against the allowance account.
If any such evidence exists, the amount of impairment loss is measured as the differencebetween the asset’s carrying amount and the present value of estimated future cash flowsdiscounted at the financial asset’s original effective profit rate. The impairment loss isrecognised in profit or loss.
If in a subsequent period, the amount of the impairment loss decreases and the decrease can berelated objectively to an event occurring after the impairment was recognised, the previouslyrecognised impairment loss is reversed to the extent that the carrying amount of the asset doesnot exceed its amortised cost at the reversal date. The amount of reversal is recognised inprofit or loss.
212

Classification of realised and unrealised gains and losses
Significant accounting estimates and judgments
4. SHARIAH-COMPLIANT INVESTMENT
2017 2016RM RM
Financial assets at FVTPL
At cost:Foreign collective investment scheme 11,517,912 12,006,867
At fair value:Foreign collective investment scheme 12,626,466 12,795,331
No major judgments have been made by the Manager in applying the Fund’s accounting policies.There are no key assumptions concerning the future and other key sources of estimationuncertainty at the reporting date, that have a significant risk of causing a material adjustment tothe carrying amounts of assets and liabilities within the next financial year.
Realised gains and losses on disposals of financial instruments classified at fair value throughprofit or loss are calculated using the weighted average method. They represent the differencebetween an instrument’s initial carrying amount and disposal amount.
Unrealised gains and losses comprise changes in the fair value of financial instruments for theperiod and from reversal of prior period’s unrealised gains and losses for financial instrumentswhich were realised (i.e. sold, redeemed or matured) during the reporting period.
The preparation of the Fund’s financial statements requires the Manager to make judgments,estimates and assumptions that affect the reported amounts of revenues, expenses, assets andliabilities, and the disclosure of contingent liabilities at the reporting date. However, uncertaintyabout these assumptions and estimates could result in outcomes that could require a materialadjustment to the carrying amount of the asset or liability in the future.
The Fund classifies its Shariah-compliant investment as financial assets at FVTPL as the Fundmay sell its Shariah-compliant investment in the short-term for profit-taking or to meetunitholders’ cancellation of units.
213

Details of Shariah-compliant investment as at 30 September 2017 are as follows:
Fairvalue as a
percentage ofForeign collective Number Fair Purchase net asset
investment scheme of units value cost valueRM RM %
Oasis Crescent Global Equity Fund (“Target Fund”) 99,144 12,626,466 11,517,912 98.94
Excess of fair value over cost 1,108,554
2017 2016% of % of
By country portfolio portfolio
United States of America 57 55 Europe 27 25 Japan 3 4 Others 13 16
100 100
By sector
Technology 23 25 Communications 22 20 Healthcare 18 18 Consumer cyclical 15 13 Energy 7 8 Industrial products 6 3 Basic material 5 7 Consumer non-cyclical 3 6 Property 1 -
100 100
A minimum of 95% of its net asset value will be invested in the Target Fund. However, the assetallocation may be reduced due to creation of units at the point of reporting date. The ratio will beadjusted back to the minimum level after the reporting period, if need be.
The Target Fund’s Shariah-compliant investment objective and policy seek to generate medium tolong term capital and income growth. It is listed on the Irish Stock Exchange and is regulated bythe Irish Financial Services Regulatory Authority. As at the reporting date, the Shariah-compliantinvestment portfolio of the Target Fund is made up of the following:
214

5. DEPOSITS WITH FINANCIAL INSTITUTIONS
2017 2016RM RM
At nominal value:Short-term deposits with licensed Islamic banks 332,400 437,000
At carrying value:Short-term deposits with licensed Islamic banks 332,431 437,036
Details of deposit with financial institution as at 30 September 2017 are as follows:
Carrying value as a percentage
Maturity Nominal Carrying Purchase of net asset date value value cost value
RM RM RM %
Short-term deposit with a licensed Islamic bank
02.10.2017 Maybank IslamicBerhad 332,400 332,431 332,400 2.60
2017 2016 2017 2016% % Days Days
Short-term deposits with licensed Islamic banks 3.40 3.00 2 4
6. AMOUNT DUE TO MANAGER
2017 2016RM RM
Redemption of units* (164,592) (23,187)Manager’s fee payable (555) (1,174)
(165,147) (24,361)
* The amount represents amount payable to the Manager for units redeemed.
Bank
The weighted average effective profit rate and average remaining maturity of short-term depositsare as follows:
Weighted average effective profit rate
Remaining maturity
215

2017 2016% p.a. % p.a.
Manager’s fee charged by the Target Fund Manager, on the net asset value of the Target Fund (Note a) 2.00 2.00
Rebate fee from the Target Fund Manager, on the net asset value of the Target Fund (Note b) 0.20 0.20
Manager’s fee charged by the Manager, on the remaining netasset value of the Fund (Note c) 1.80 1.80
Note a)
Note b)
Note c)
7. AMOUNT DUE TO TRUSTEE
8. NET GAIN FROM SHARIAH-COMPLIANT INVESTMENT
2017 2016RM RM
Net gain on financial assets at FVTPL comprised:− Net realised gain on sale of Shariah-compliant
investment 179,253 1,046,543 − Net realised gain on foreign currency exchange 503,918 950,147
(Forward)
The normal credit period in the previous and current financial years for creation and redemptionof units is three business days.
The normal credit period in the previous and current financial years for Manager’s fee payable isone month.
Trustee’s fee is at a rate of 0.07% (2016: 0.07%) per annum on the net asset value of the Fund,calculated on a daily basis.
The normal credit period in the previous and current financial years for Trustee’s fee payable isone month.
As the Fund is investing in a Target Fund, the Manager’s fee was charged as follows:
Target Fund Manager has agreed to grant the Fund a fee rebate in the form of additionalunits.
The Fund’s share of manager’s fee to the Target Fund Manager has been accounted for aspart of net unrealised changes in fair value of Shariah-compliant investment in foreigncollective investment scheme.
Manager’s fee of the Fund chargeable in the Statement of Comprehensive Income relatesto the Fund’s net asset value other than its investment in the Target Fund.
216

2017 2016RM RM
− Net unrealised gain on changes in fair value ofShariah-compliant investment 514,801 344,415
− Net unrealised loss on foreign currency fluctuation ofShariah-compliant investment denominated in foreign currency (194,711) (2,117,650)
1,003,261 223,455
9. OTHER EXPENSES
10. TOTAL EQUITY
Total equity is represented by:
2017 2016Note RM RM
Unitholders’ capital (a) 8,120,385 5,563,092 Retained earnings− Realised income (b) 3,533,103 6,824,201 − Unrealised gain (c) 1,108,554 788,464
12,762,042 13,175,757
(a) UNITHOLDERS’ CAPITAL/UNITS IN CIRCULATION
2016Number of Number of
units RM units RM
At beginning of the financial year 10,896,310 5,563,092 12,280,280 7,746,070
Creation during thefinancial year 8,821,432 9,170,178 152,487,459 181,089,837
Distribution reinvested(Note 13) 4,250,568 3,870,568 - -
Cancellation during the financial year (10,803,129) (10,483,453) (153,871,429) (183,272,815)
At end of the financialyear 13,165,181 8,120,385 10,896,310 5,563,092
Included in other expenses is Goods and Services Tax incurred by the Fund during the financialyear amounting to RM2,037 (2016: RM3,727).
2017
217

(b) REALISED – DISTRIBUTABLE
2017 2016RM RM
At beginning of the financial year 6,824,201 4,825,640
Total comprehensive income for the financial year 1,011,082 225,326 Net unrealised (gain)/loss attributable to Shariah-
compliant investment held transferred tounrealised reserve [Note 10(c)] (320,090) 1,773,235
Distributions out of realised reserve (Note 13) (3,982,090) - Net (decrease)/increase in realised reserve for the
financial year (3,291,098) 1,998,561
At end of the financial year 3,533,103 6,824,201
(c) UNREALISED – NON-DISTRIBUTABLE
2017 2016RM RM
At beginning of the financial year 788,464 2,561,699 Net unrealised gain/(loss) attributable to Shariah-
compliant investment held transferred from realised reserve [Note 10(b)] 320,090 (1,773,235)
At end of the financial year 1,108,554 788,464
11. UNITS HELD BY RELATED PARTIES
12. INCOME TAX
A reconciliation of income tax expense applicable to net income before tax at the statutoryincome tax rate to income tax expense at the effective income tax rate of the Fund is as follows:
The Manager and parties related to the Manager did not hold any units in the Fund as at 30September 2017 and 30 September 2016.
Income tax payable is calculated on Shariah-compliant investment income less deduction forpermitted expenses as provided for under Section 63B of the Income Tax Act, 1967.
Pursuant to Schedule 6 of the Income Tax Act, 1967, local profit income derived by the Fund isexempted from tax.
218

2017 2016RM RM
Net income before tax 1,011,082 225,326
Taxation at Malaysian statutory rate of 24% 242,660 54,078 Tax effects of:
Income not subject to tax (301,770) (580,966)Loss not deductible for tax purposes 46,731 508,236 Restriction on tax deductible expenses for unit trust fund 4,055 7,612 Non-permitted expenses for tax purposes 7,873 10,194 Permitted expenses not used and not available for future
financial years 451 846
Tax expense for the financial year - -
13. DISTRIBUTION
2017 2016RM RM
Undistributed net income brought forward 3,317,817 - Distribution income 20,054 - Profit income 12,629 - Net realised gain on sale of Shariah-compliant investment 179,253 - Net realised gain on foreign currency exchange 503,918 -
4,033,671 - Less: Expenses (51,581) -
Total amount of distribution 3,982,090 -
Gross/net distribution per unit (sen) 30.00 -
Distribution made out of:− Realised reserve [Note 10 (b)] 3,982,090 -
Comprising:Distributions reinvested [Note 10 (a)] 3,870,568 - Cash distribution 111,522 -
3,982,090 -
Distribution to unitholders declared on 10 November 2016 are from the following sources:
Included in the distribution for the financial year ended 30 September 2017 was RM3,317,817distributed from previous financial years’ realised income.
219

14. MANAGEMENT EXPENSE RATIO (“MER”)
The Fund’s MER is as follows:
2017 2016% p.a. % p.a.
Manager’s fee 0.06 0.16 Trustee’s fee 0.07 0.07 Fund’s other expenses 0.23 0.30
Total MER 0.36 0.53
15. PORTFOLIO TURNOVER RATIO (“PTR”)
16.
17.
Target Fund ManagerRM %
Oasis Global Management Company (Ireland) Ltd 14,632,885 100.00
The MER of the Fund is the ratio of the sum of annualised fees and expenses incurred by theFund to the average net asset value of the Fund calculated on a daily basis.
The PTR of the Fund, which is the ratio of average total acquisitions and disposals of Shariah-compliant investment to the average net asset value of the Fund calculated on a daily basis, is0.51 times (2016: 1.95 times).
There was no transaction with financial institutions related to the Manager, during the financialyear.
SEGMENTAL REPORTING
As stated in Note 1, the Fund is a feeder fund whereby a minimum of 95% of the Fund’s net assetvalue will be invested in the Target Fund.
As the Fund operates substantially as a feeder fund which invests primarily in the Target Fund, itis not possible or meaningful to classify its Shariah-compliant investment by separate business orgeographical segments. A summary of the Shariah-compliant investment portfolio of the TargetFund is disclosed in Note 4.
Transaction value
Details of transactions with the Target Fund Manager for the financial year ended 30 September2017 are as follows:
TRANSACTIONS WITH THE TARGET FUND MANAGER
220

18. FINANCIAL INSTRUMENTS
(a) Classification of financial instruments
Financial Financial Receivables liabilities at
assets at amortised amortisedat FVTPL cost cost Total
RM RM RM RM
AssetsShariah-compliant
investment 12,626,466 - - 12,626,466 Deposit with financial
institution - 332,431 - 332,431 Cash at banks - 4,063 - 4,063
Total financial assets 12,626,466 336,494 - 12,962,960
LiabilitiesAmount due to
Manager - - 165,147 165,147 Amount due to Trustee - - 741 741 Sundry payables and
accrued expenses - - 35,030 35,030
Total financial liabilities - - 200,918 200,918
AssetsShariah-compliant
investment 12,795,331 - - 12,795,331 Deposit with financial
institution - 437,036 - 437,036 Cash at banks - 3,961 - 3,961
Total financial assets 12,795,331 440,997 - 13,236,328
(Forward)
2017
The above transactions were in respect of Shariah-compliant collective investment scheme.Transactions in these Shariah-compliant investments do not involve any commission orbrokerage.
The significant accounting policies in Note 3 describe how the classes of financialinstruments are measured, and how income and expenses, including fair value gains andlosses, are recognised. The following table analyses the financial assets and liabilities of theFund in the statement of financial position by the class of financial instrument to which theyare assigned, and therefore by the measurement basis.
2016
221
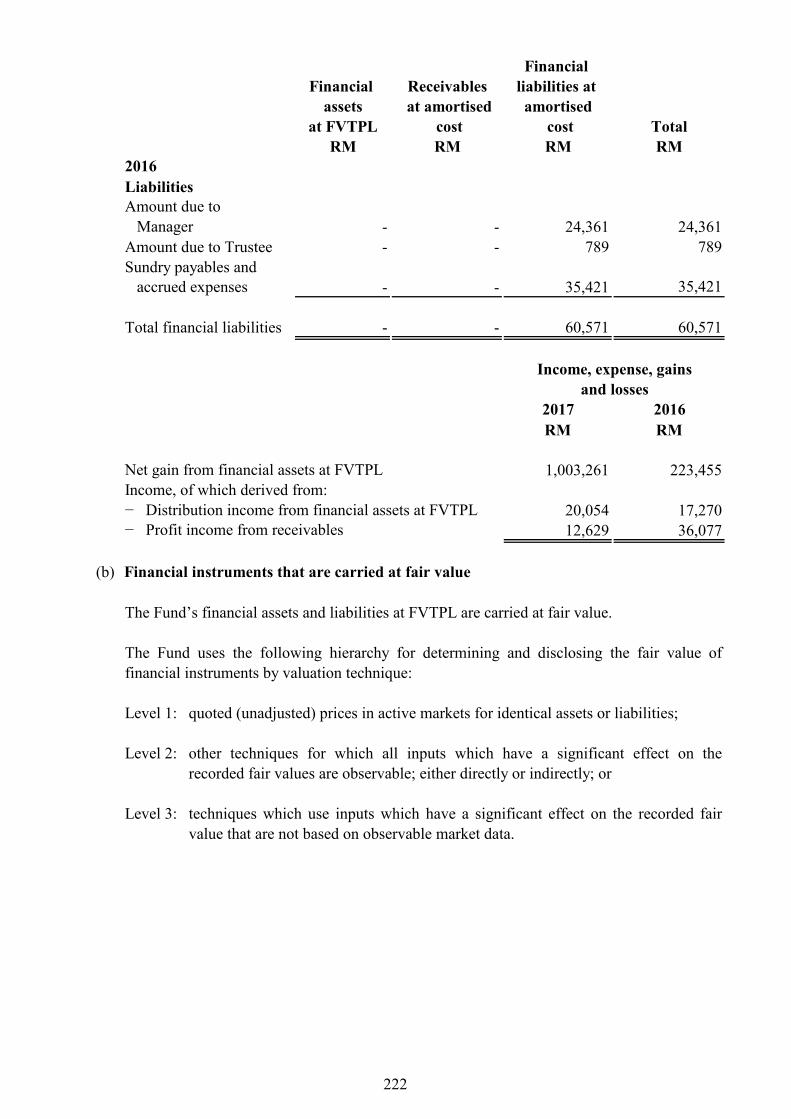
Financial Financial Receivables liabilities at
assets at amortised amortisedat FVTPL cost cost Total
RM RM RM RM
LiabilitiesAmount due to
Manager - - 24,361 24,361 Amount due to Trustee - - 789 789 Sundry payables and
accrued expenses - - 35,421 35,421
Total financial liabilities - - 60,571 60,571
Income, expense, gainsand losses
2017 2016RM RM
Net gain from financial assets at FVTPL 1,003,261 223,455 Income, of which derived from:− Distribution income from financial assets at FVTPL 20,054 17,270 − Profit income from receivables 12,629 36,077
(b) Financial instruments that are carried at fair value
Level 1: quoted (unadjusted) prices in active markets for identical assets or liabilities;
Level 2:
Level 3:
The Fund’s financial assets and liabilities at FVTPL are carried at fair value.
other techniques for which all inputs which have a significant effect on therecorded fair values are observable; either directly or indirectly; or
The Fund uses the following hierarchy for determining and disclosing the fair value offinancial instruments by valuation technique:
techniques which use inputs which have a significant effect on the recorded fairvalue that are not based on observable market data.
2016
222

Level 1 Level 2 Level 3 TotalRM RM RM RM
Financial assets at FVTPL - 12,626,466 - 12,626,466
- 12,795,331 - 12,795,331
(c)
Deposits with financial institutions Cash at banks Amount due to Manager Amount due to Trustee Sundry payables and accrued expenses
19. RISK MANAGEMENT POLICIES
Market risk
The following are classes of financial instruments that are not carried at fair value and whosecarrying amounts are reasonable approximation of fair value due to their short period tomaturity or short credit period:
Market risk, in general, is the risk that the value of a portfolio would decrease due to changes inmarket risk factors such as equity prices, profit rates, foreign exchange rates and commodityprices.
2017
2016Financial assets at FVTPL
Risk management is carried out by closely monitoring, measuring and mitigating the above saidrisks, careful selection of Shariah-compliant investment coupled with stringent compliance toShariah-compliant investment restrictions as stipulated by the Capital Market and Services Act2007, Securities Commission’s Guidelines on Unit Trust Funds and the Deed as the backbone ofrisk management of the Fund.
Financial instruments that are not carried at fair value and whose carrying amountsare reasonable approximation of fair value
There are no financial instruments which are not carried at fair values and whose carryingamounts are not reasonable approximation of their respective fair values.
The Fund is exposed to a variety of risks that include market risk, credit risk, liquidity risk, singleissuer risk, regulatory risk, country risk, management risk and non-compliance/Shariah non-compliance risk.
The following table shows an analysis of financial instruments recorded at fair value by thelevel of the fair value hierarchy:
223

(i) Price risk
Percentage movements in price by: 2017 2016
RM RM
-5.00% (631,323) (639,767)+5.00% 631,323 639,767
(ii) Profit rate risk
Parallel shift in yieldcurve by: 2017 2016
RM RM
+100bps (26) (46)-100bps 27 47
(iii) Currency risk
Price risk refers to the uncertainty of an investment’s future prices. In the event of adverseprice movements, the Fund might endure potential loss on its Shariah-compliant investmentsin the Target Fund. In managing price risk, the Manager actively monitors the performanceand risk profile of the investment portfolio.
The result below summarised the profit rate sensitivity of the Fund’s NAV, or theoreticalvalue (applicable to Islamic money market deposit) due to the parallel movement assumptionof the yield curve by +100bps and -100bps respectively:
The result below summarised the price risk sensitivity of the Fund’s NAV due to movementsof price by -5.00% and +5.00% respectively:
Profit rate risk will affect the value of the Fund’s Shariah-compliant investments, given theprofit rate movements, which are influenced by regional and local economic developments aswell as political developments.
Domestic profit rate on deposits and placements with licensed financial institutions aredetermined based on prevailing market rates.
Sensitivity of the Fund’s NAV
Sensitivity of the Fund’s NAV, or theoretical value
The result below summarised the currency risk sensitivity of the Fund’s NAV due toappreciation/depreciation of the Fund’s functional currency against currencies other than theFund’s functional currency.
Currency risk is associated with the Fund’s assets and liabilities that are denominated incurrencies other than the Fund’s functional currency. Currency risk refers to the potential lossthe Fund might face due to unfavorable fluctuations of currencies other than the Fund’sfunctional currency against the Fund’s functional currency.
224

Percentage movements in currencies other than the 2017 2016 Fund’s functional currency: RM RM
-5.00% (631,366) (639,801)+5.00% 631,366 639,801
2017 2016Assets denominated in RM % of net RM % of net
United States Dollar equivalent asset value equivalent asset value
Shariah-compliant investment 12,626,466 98.94 12,795,331 97.11
Cash at bank 844 0.01 682 0.01
12,627,310 98.95 12,796,013 97.12
Credit risk
Liquidity risk
Liquidity risk is defined as the risk of being unable to raise funds or borrowings to meet paymentobligations as they fall due. This is also the risk of the Fund experiencing large redemptions,when the Investment Manager could be forced to sell large volumes of its holdings atunfavourable prices to meet redemption requirements.
The Fund maintains sufficient level of liquid assets, after consultation with the Trustee, to meetanticipated payments and cancellations of units by unitholders. Liquid assets comprise of depositswith licensed financial institutions and other instruments, which are capable of being convertedinto cash within 5 to 7 days. The Fund’s policy is to always maintain a prudent level of liquidassets so as to reduce liquidity risk.
The Fund, as a feeder fund, invests significantly all its assets in the Target Fund. The Target Fundmanages the risk by setting internal counterparty limits and undertaking internal credit evaluationto minimise such risk.
The net unhedged financial assets of the Fund that are not denominated in Fund’s functionalcurrency are as follows:
For deposits with financial institutions, the Fund makes placements with financial institutionswith sound rating of P1/MARC-1 and above. Cash at banks are held for liquidity purposes and are not exposed to significant credit risk.
Credit risk is the risk that the counterparty to a financial instrument will cause a financial loss tothe Fund by failing to discharge an obligation. Credit risk applies to short-term deposits anddistributions receivable. The issuer of such instruments may not be able to fulfill the requiredprofit payments or repay the principal invested or amount owing. These risks may cause theFund’s Shariah-compliant investment to fluctuate in value.
Sensitivity of the Fund’s NAV
225

Single issuer risk
Regulatory risk
Country risk
Management risk
Non-compliance/Shariah non-compliance risk
20. CAPITAL MANAGEMENT
No changes were made in the objective, policies or processes during the financial years ended 30September 2017 and 30 September 2016.
The Fund, as a feeder fund, invests significantly all its assets in the Target Fund. The Target Fundis restricted from investing in securities issued by any issuer in excess of a certain percentage ofits net asset value. Under such restriction, the risk exposure to the securities of any single issuer isdiversified and managed by the Target Fund Manager based on internal/external ratings.
The risk of price fluctuation in foreign securities may arise due to political, financial andeconomic events in foreign countries. If this occurs, there is a possibility that the net asset valueof the Fund may be adversely affected.
Poor management of the Fund may cause considerable losses to the Fund that in turn may affectthe net asset value of the Fund.
The primary objective of the Fund’s capital management is to ensure that it maximisesunitholders’ value by expanding its fund size to benefit from economies of scale and achievinggrowth in net asset value from the performance of its Shariah-compliant investment.
Any changes in national policies and regulations may have effects on the capital market and thenet asset value of the Fund.
The specific risks associated to the Target Fund include market risk, securities risk, emergingmarket risk, settlement and credit risks, regulatory and accounting standards risks, political risk,custody risk and liquidity risk.
This is the risk of the Manager, the Trustee or the Fund not complying with internal policies, theDeed of the Fund, securities law or guidelines issued by the regulators. In the case of an IslamicFund, this includes the risk of the Fund not conforming to Shariah Investment Guidelines. Non-compliance risk may adversely affect the Shariah-compliant investment of the Fund when theFund is forced to rectify the non-compliance.
The Fund manages its capital structure and makes adjustments to it, in light of changes ineconomic conditions. To maintain or adjust the capital structure, the Fund may issue new orbonus units, make distribution payment, or return capital to unitholders by way of redemption ofunits.
226

AmOasis Global Islamic Equity
STATEMENT BY THE MANAGER
Kuala Lumpur, Malaysia7 November 2017
GOH WEE PENGFor and on behalf of the ManagerAmFunds Management Berhad
I, GOH WEE PENG, for and on behalf of the Manager, AmFunds Management Berhad, for
AmOasis Global Islamic Equity do hereby state that in the opinion of the Manager, the
accompanying statement of financial position, statement of comprehensive income, statement of
changes in equity, statement of cash flows and the accompanying notes are drawn up in accordance
with Malaysian Financial Reporting Standards and International Financial Reporting Standards so
as to give a true and fair view of the financial position of the Fund as at 30 September 2017 and the
comprehensive income, the changes in equity and cash flows of the Fund for the financial year then
ended.
227

228
TRUSTEE’S REPORT

229
REPORT OF THE SHARIAH ADVISER TO THE UNITHOLDERS
AmIttikal, AmBon Islam, AmAl-Amin, AmIslamic Balanced, AmIslamic Growth and AmOasis Global
Islamic Equity
For The Financial Year Ended 30 September 2017
We have acted as the Shariah Adviser of AmIttikal, AmBon Islam, AmAl-Amin, AmIslamic
Balanced, AmIslamic Growth and AmOasis Global Islamic Equity. Our responsibility is to ensure
that the procedures and processes employed by AmIslamic Funds Management Sdn Bhd and that the
provisions of the AmMaster Deed dated 30 October 2001 (incorporating Third Supplemental Deed dated
2 September 2004, Fourth Supplemental Deed dated 30 March 2006 and other related supplemental deeds
attached thereto) and AmIttikal Third Supplemental Deed dated 13 January 1996 (incorporating all
related supplemental deeds attached thereto) are in accordance with Shariah principles.
In our opinion, AmIslamic Funds Management Sdn Bhd has managed and administered AmIttikal,
AmBon Islam, AmAl-Amin, AmIslamic Balanced, AmIslamic Growth and AmOasis Global Islamic
Equity in accordance with Shariah principles and complied with applicable guidelines, ruling or decision
issued by the Securities Commission (SC) pertaining to Shariah matters. We can confirm that the
investment portfolio of the abovementioned Fund comprises of securities which have been classified as
Shariah compliant by the Shariah Advisory Council (SAC) of the Securities Commission of Malaysia
(SC) or the SAC of Bank Negara Malaysia (BNM). For securities not classified as Shariah-compliant by
the SAC of the SC or SAC of BNM, we have determined that such securities are in accordance with
Shariah principle and have complied with the applicable Shariah guidelines.
For Amanie Advisors Sdn Bhd ………………………………………….. Datuk Dr Mohd Daud Bakar Executive Chairman 7 November 2017

230
DIRECTORY Head Office 9th Floor, Bangunan AmBank Group 55, Jalan Raja Chulan, 50200 Kuala Lumpur Tel: (03) 2032 2888 Facsimile: (03) 2031 5210
Email: [email protected] Postal Address AmFunds Management Berhad P.O Box 13611, 50816 Kuala Lumpur Related Institutional Unit Trust Agent AmBank (M) Berhad Head Office Company No. 8515-D 31st Floor, Menara AmBank No. 8 Jalan Yap Kwan Seng, 50450 Kuala Lumpur AmInvestment Bank Berhad Head Office Company No. 23742-V 22nd Floor, Bangunan AmBank Group 55 Jalan Raja Chulan, 50200 Kuala Lumpur For more details on the list of IUTAs, please contact the Manager.
For enquiries about this or any of the other Funds offered by AmFunds Management Berhad please call 2032 2888 between 8.45 a.m. to 5.45 p.m. (Monday - Thursday),
Friday (8.45 a.m. to 5.00 p.m.)

Semi-Annual Report28 February 2015
03 2132 2888 | aminvest.com | [email protected]
AmFunds Management Berhad (155432-A)