Embed Size (px)
DESCRIPTION
add maths
Citation preview
WAJA 2009
ADDITIONAL MATHEMATICS
FORM FIVE
( Teacher’s Copy )
Name: ___________________________
Class : ___________________________
WAJA 2009 – ADDITIONAL MATHEMATICS (FORM 5) Chapter 2: Linear Law
Learning Objective:2.Understand and use the concept of lines of best fit
Learning Outcome:2.1.1 Draw lines of best fit by inspection of given data
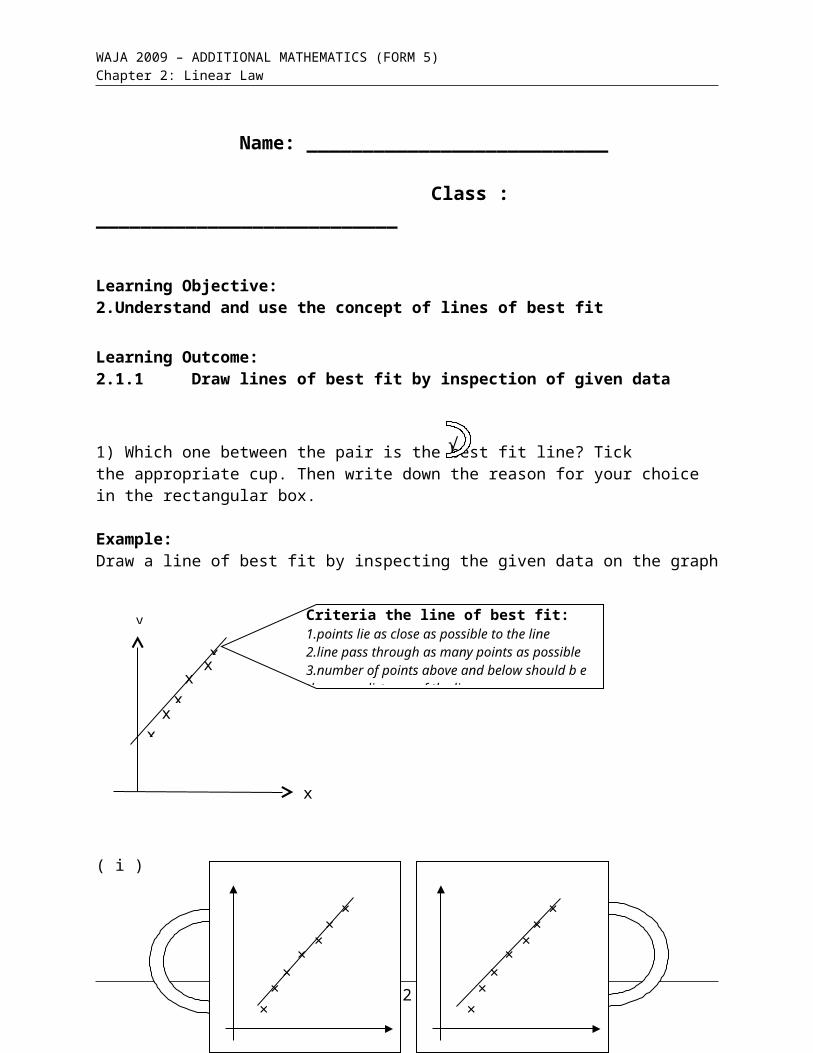
1) Which one between the pair is the best fit line? Tick the appropriate cup. Then write down the reason for your choice in the rectangular box.
Example:Draw a line of best fit by inspecting the given data on the graph
( i )
2
×
×
×
××
×
×
×
×
×
××
×
×
√
xx
xx
xxx
y
x
Criteria the line of best fit:1.points lie as close as possible to the line2.line pass through as many points as possible 3.number of points above and below should b e the same distance of the line
x
√
Line pass through as many points as possible and number of points above and below should be the same distance of the line
WAJA 2009 – ADDITIONAL MATHEMATICS (FORM 5) Chapter 2: Linear Law
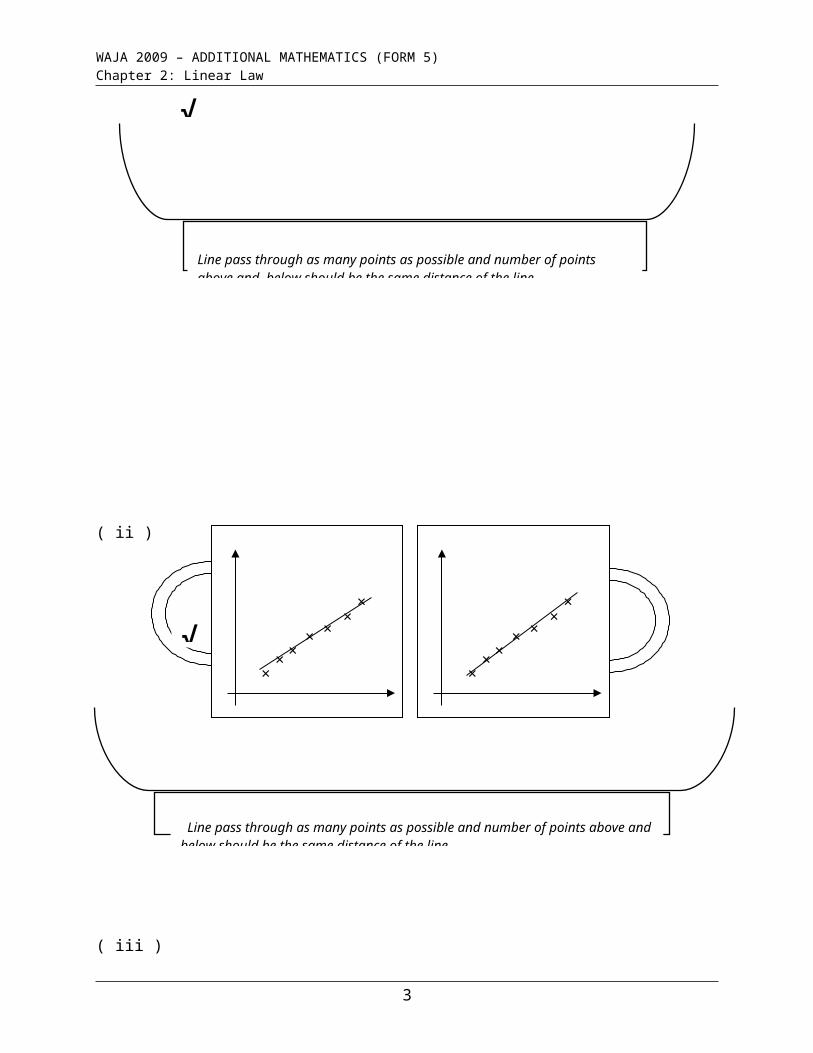
( ii )
( iii )
3
×
×
××
×
×
×
×
×
××
×
×
×
×
×
×
××
×
×
×
×
×
××
×
×
√
√
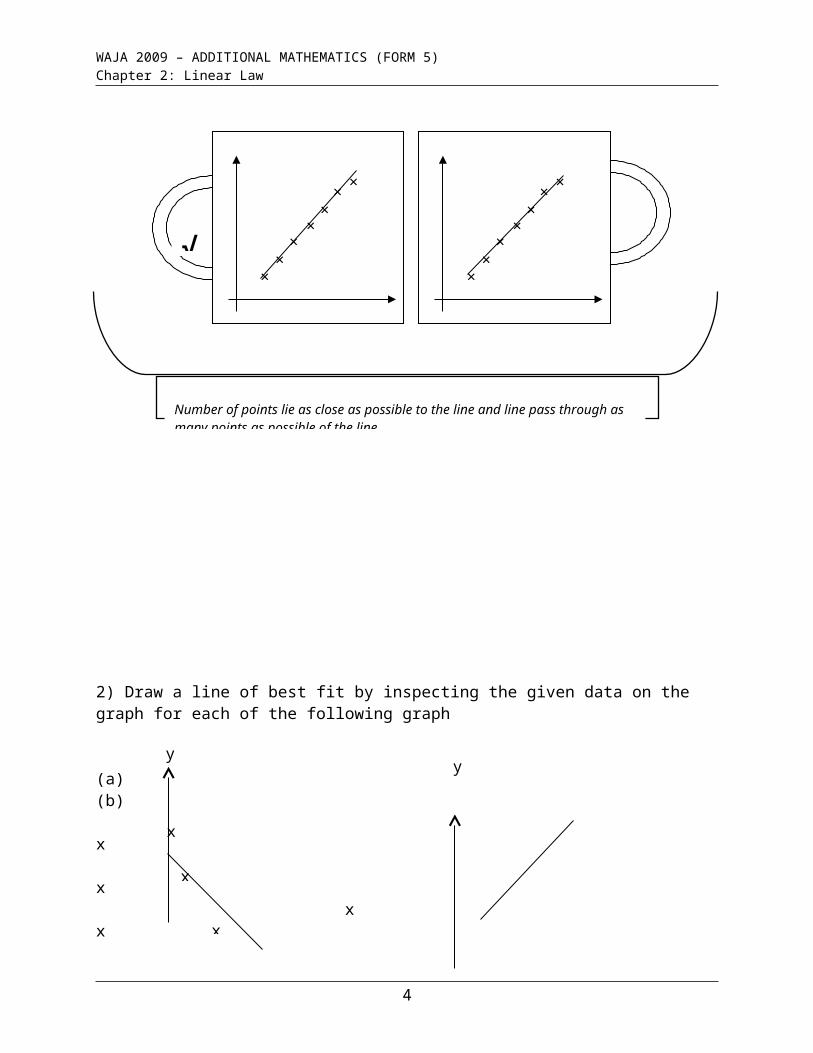
Number of points lie as close as possible to the line and line pass through as many points as possible of the line
Line pass through as many points as possible and number of points above and below should be the same distance of the line
WAJA 2009 – ADDITIONAL MATHEMATICS (FORM 5) Chapter 2: Linear Law
2) Draw a line of best fit by inspecting the given data on the graph for each of the following graph
(a) (b) x x x x x x x x
0 0
c)
Learning Outcome:
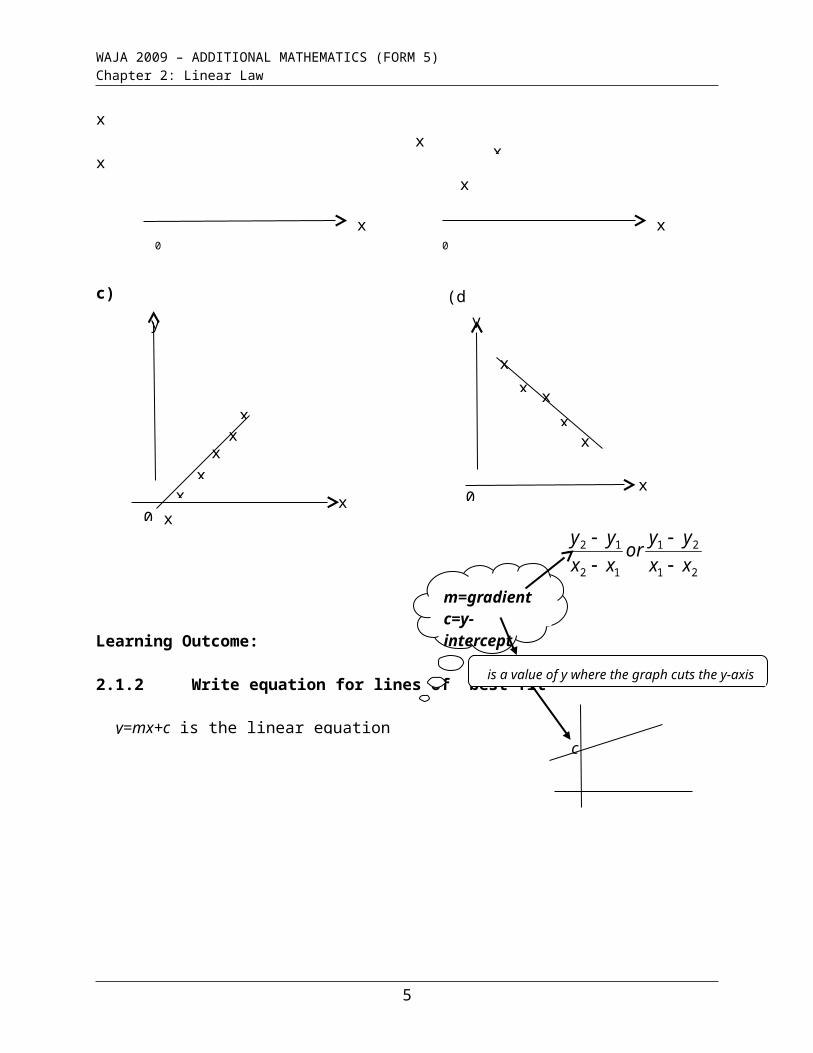
2.1.2 Write equation for lines of best fit
4
0x
y2
xx
xx
0x
y
xx
xx
xx
xx
y
x
y
x
x
x
x
(d)
y=mx+c is the linear equation of a straight line
21
21
12
12
xx
yyor
xx
yy
c
x
m=gradientc=y-intercept
is a value of y where the graph cuts the y-axis
WAJA 2009 – ADDITIONAL MATHEMATICS (FORM 5) Chapter 2: Linear Law
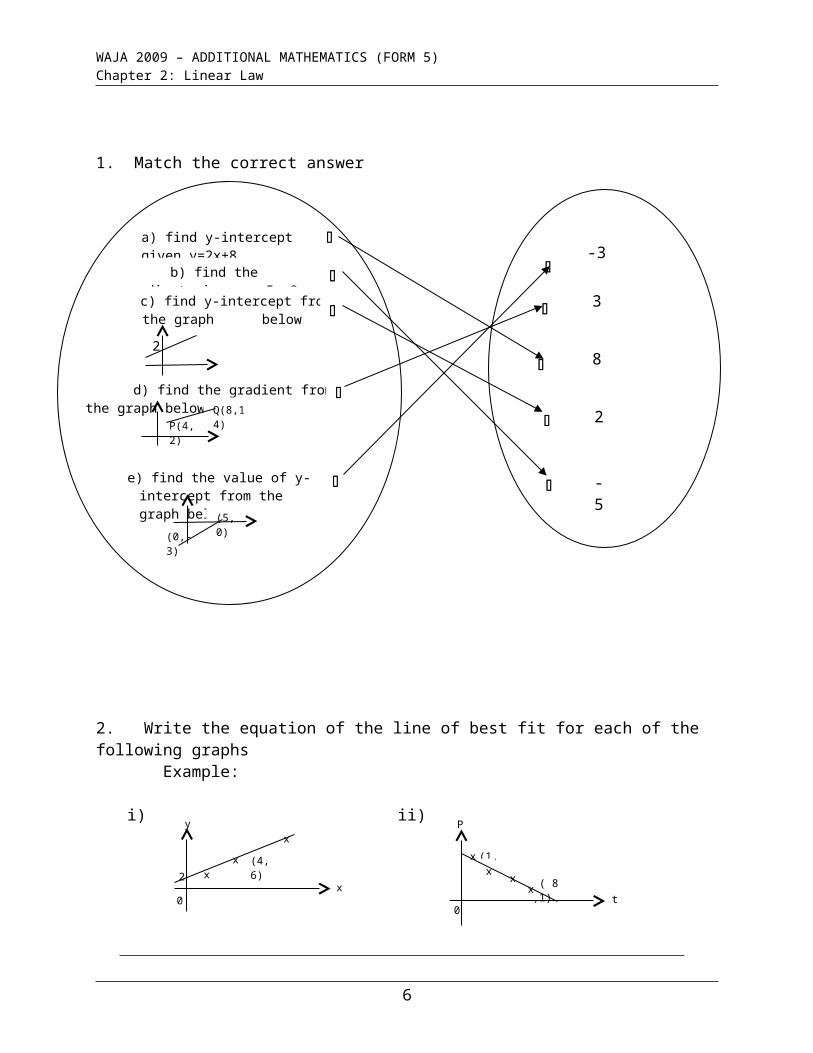
1. Match the correct answer
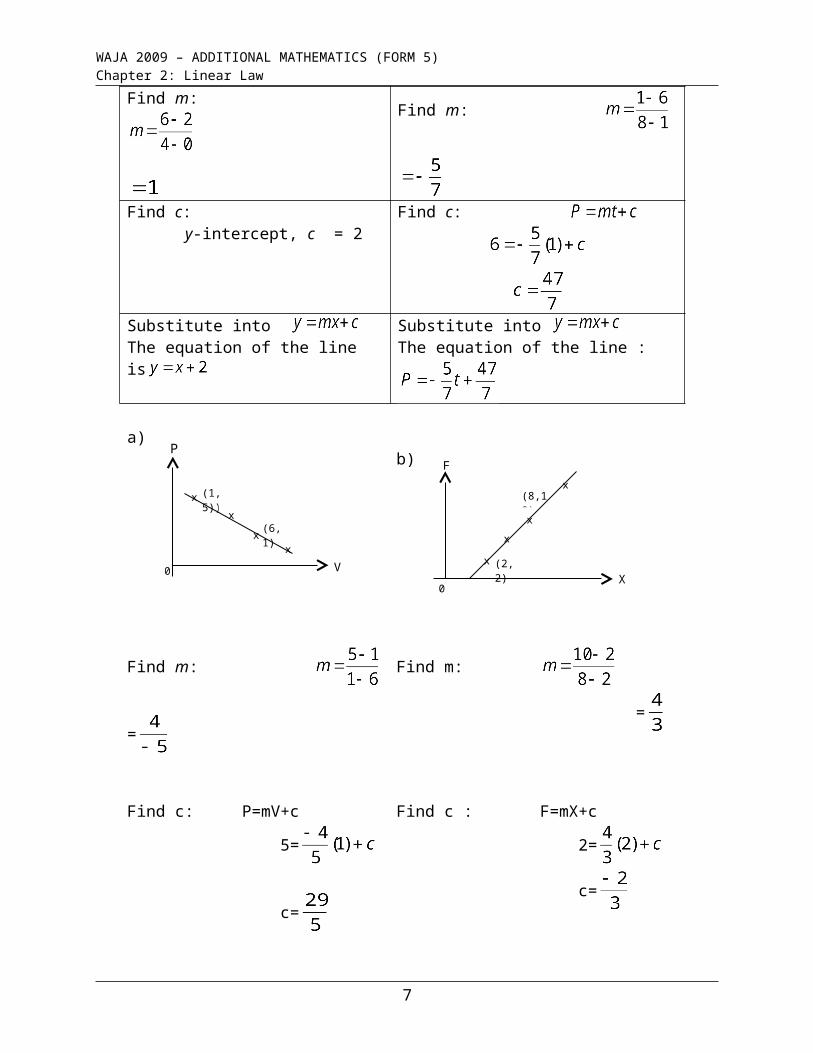
2. Write the equation of the line of best fit for each of the following graphs Example:
i) ii)
Find m:
Find m:
Find c: y-intercept, c = 2
Find c:
Substitute into The equation of the line is
Substitute into
The equation of the line :
5
2
0x
y
(4, 6)
x
x
x
0
(1,6)
(( 8,1)xx
x
x
t
P
a) find y-intercept given y=2x+8
b) find the gradient given y=-5x-8
c) find y-intercept from the graph below
2
d) find the gradient from the graph below
P(4,2)
Q(8,14)
e) find the value of y-intercept from the graph below
(5,0)
(0,-3)
-3
3
8
2
-5
WAJA 2009 – ADDITIONAL MATHEMATICS (FORM 5) Chapter 2: Linear Law
a)b)
Find m:
=
Find m:
=
Find c: P=mV+c
5=
c=
Find c : F=mX+c
2=
c=
P= F=
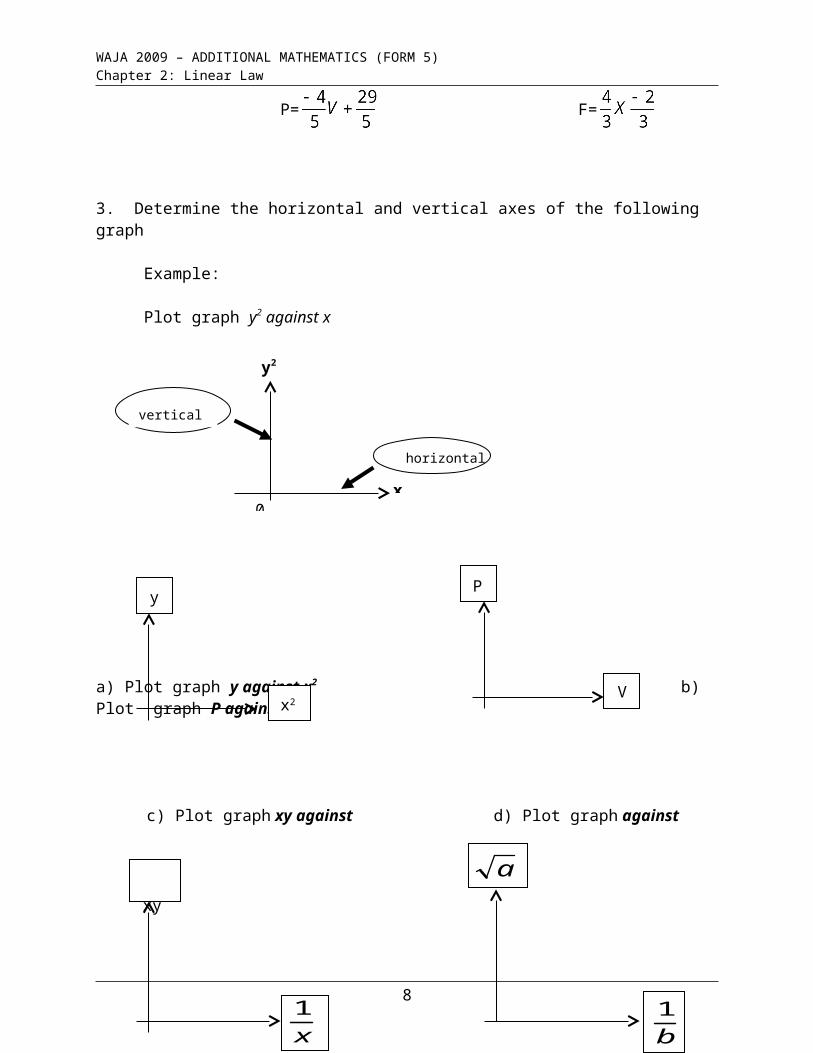
3. Determine the horizontal and vertical axes of the following graph
Example:
Plot graph y2 against x
6
x
y2
horizontal axes
vertical axes
0
F
X0
(2,2)
(8,10)x
x
x
x0 V
(1,5))
x
(6,1)x
x
x
P
WAJA 2009 – ADDITIONAL MATHEMATICS (FORM 5) Chapter 2: Linear Law
a) Plot graph y against x2 b) Plot graph P against V
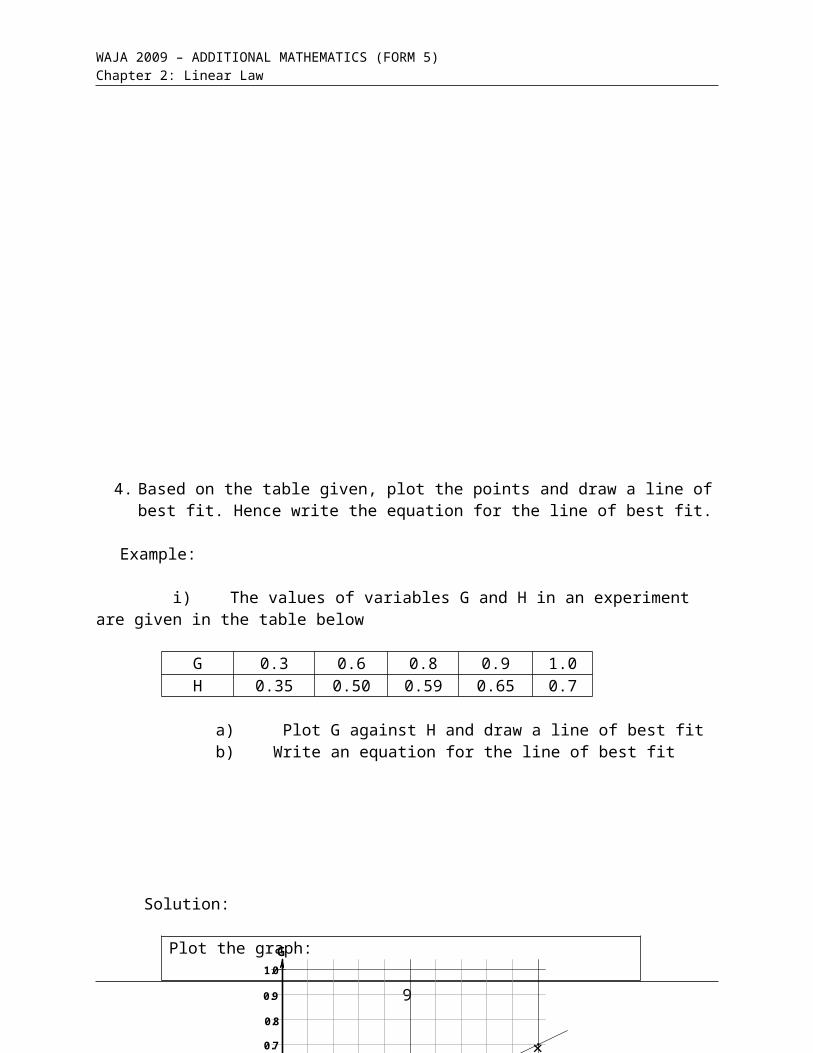
4. Based on the table given, plot the points and draw a line of best fit. Hence write the equation for the line of best fit.
Example:
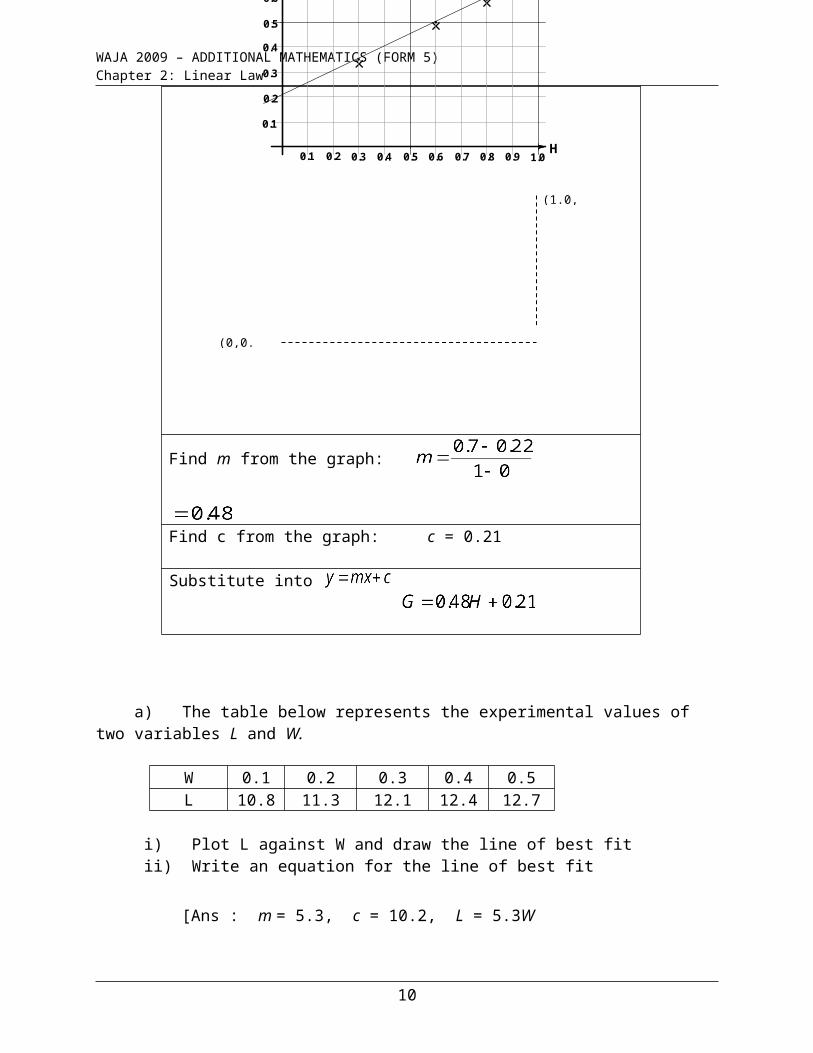
i) The values of variables G and H in an experiment are given in the table below
G 0.3 0.6 0.8 0.9 1.0H 0.35 0.50 0.59 0.65 0.7
a) Plot G against H and draw a line of best fit b) Write an equation for the line of best fit
7
c) Plot graph xy against d) Plot graph against
y
x2
P
V
xy
x
1
a
b
1
WAJA 2009 – ADDITIONAL MATHEMATICS (FORM 5) Chapter 2: Linear Law
Solution:
Plot the graph:
Find m from the graph:
Find c from the graph: c = 0.21
Substitute into
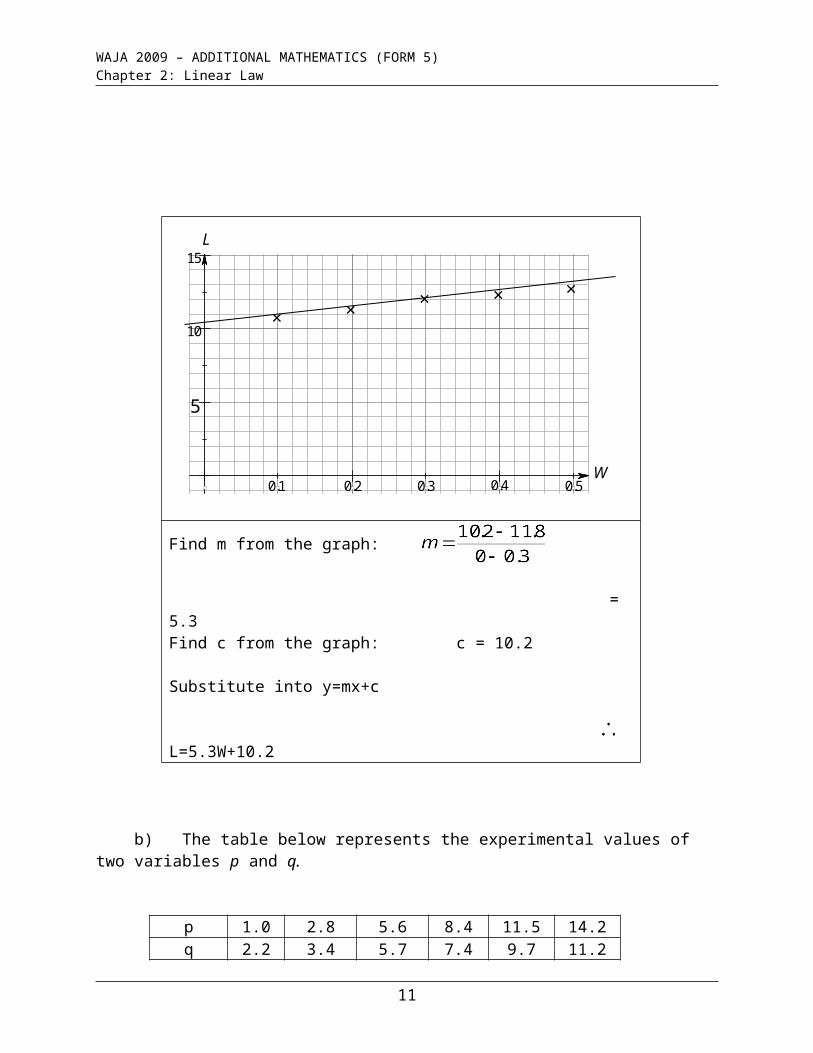
a) The table below represents the experimental values of two variables L and W.
W 0.1 0.2 0.3 0.4 0.5L 10.8 11.3 12.1 12.4 12.7
i) Plot L against W and draw the line of best fitii) Write an equation for the line of best fit
8
[Ans : m = 5.3, c = 10.2, L = 5.3W +10.2]
×
×
×
××
0.1
0.2
0.3
0.4
0.5
0.6
0.7
0.8
0.9
1.0
1.00.90.80.70.60.50.40.30.20.1
G
H
(0,0.22)
(1.0,0.7))
WAJA 2009 – ADDITIONAL MATHEMATICS (FORM 5) Chapter 2: Linear Law
5
10
15
0.1 0.2 0.3 0.4 0.5
Find m from the graph:
= 5.3Find c from the graph: c = 10.2
Substitute into y=mx+c
L=5.3W+10.2
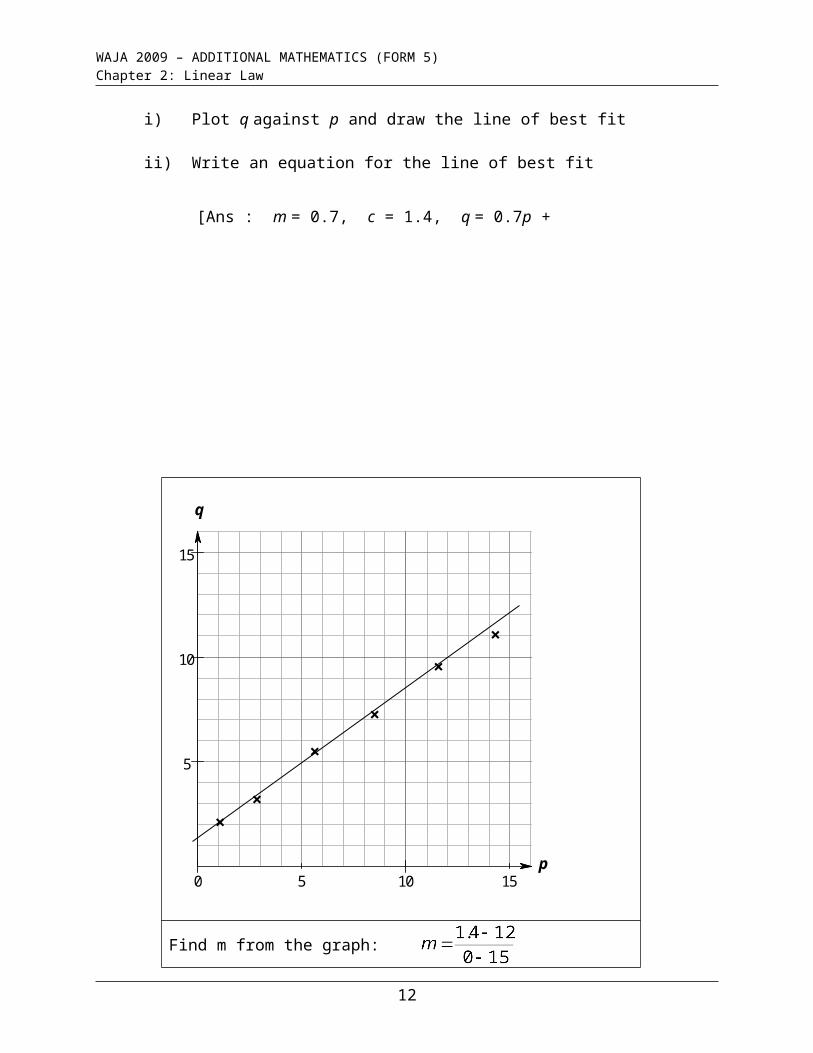
b) The table below represents the experimental values of two variables p and q.
p 1.0 2.8 5.6 8.4 11.5 14.2q 2.2 3.4 5.7 7.4 9.7 11.2
i) Plot q against p and draw the line of best fit
ii) Write an equation for the line of best fit
9
[Ans : m = 0.7, c = 1.4, q = 0.7p + 1.4]
L
W
××
× ×
×
WAJA 2009 – ADDITIONAL MATHEMATICS (FORM 5) Chapter 2: Linear Law
5
5
10
15
0 10 15
Find m from the graph:
= 0.7
Find c from the graph: c = 1.4
Substitute into y=mx+c
q=0.7p+1.4
10
q
p
×
×
×
××
×
WAJA 2009 – ADDITIONAL MATHEMATICS (FORM 5) Chapter 2: Linear Law
Learning Outcomes:
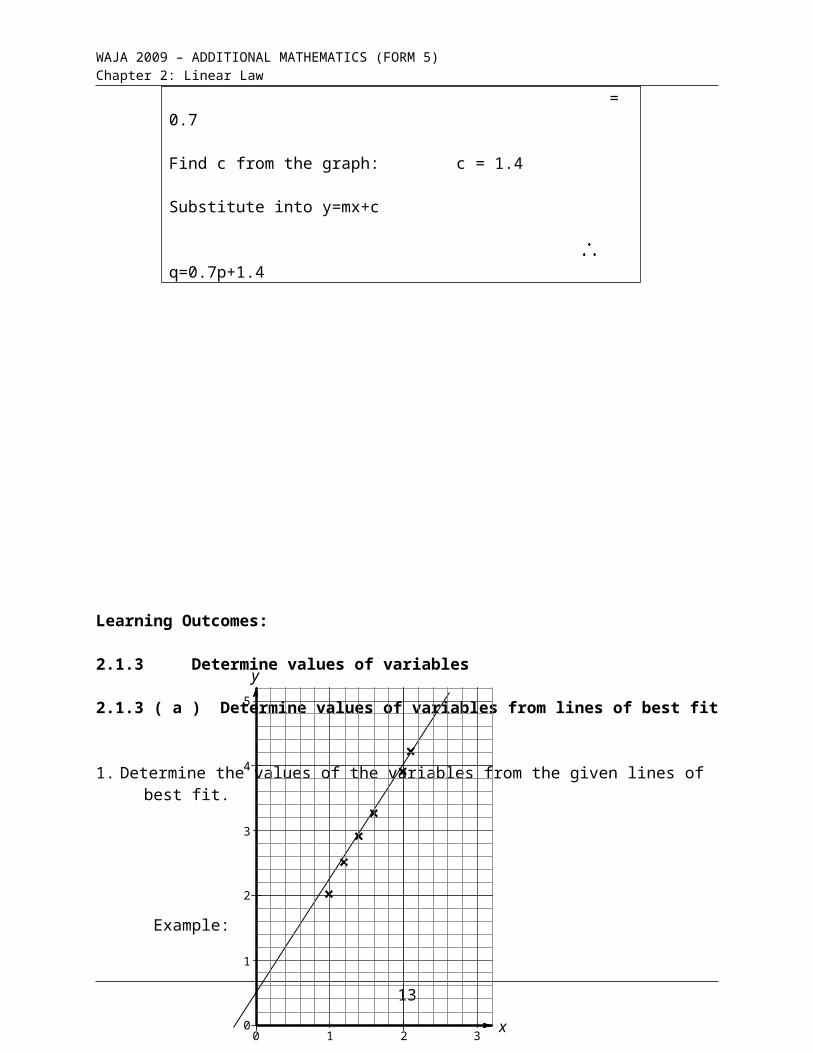
2.1.3 Determine values of variables
2.1.3 ( a ) Determine values of variables from lines of best fit
1. Determine the values of the variables from the given lines of best fit.
Example:
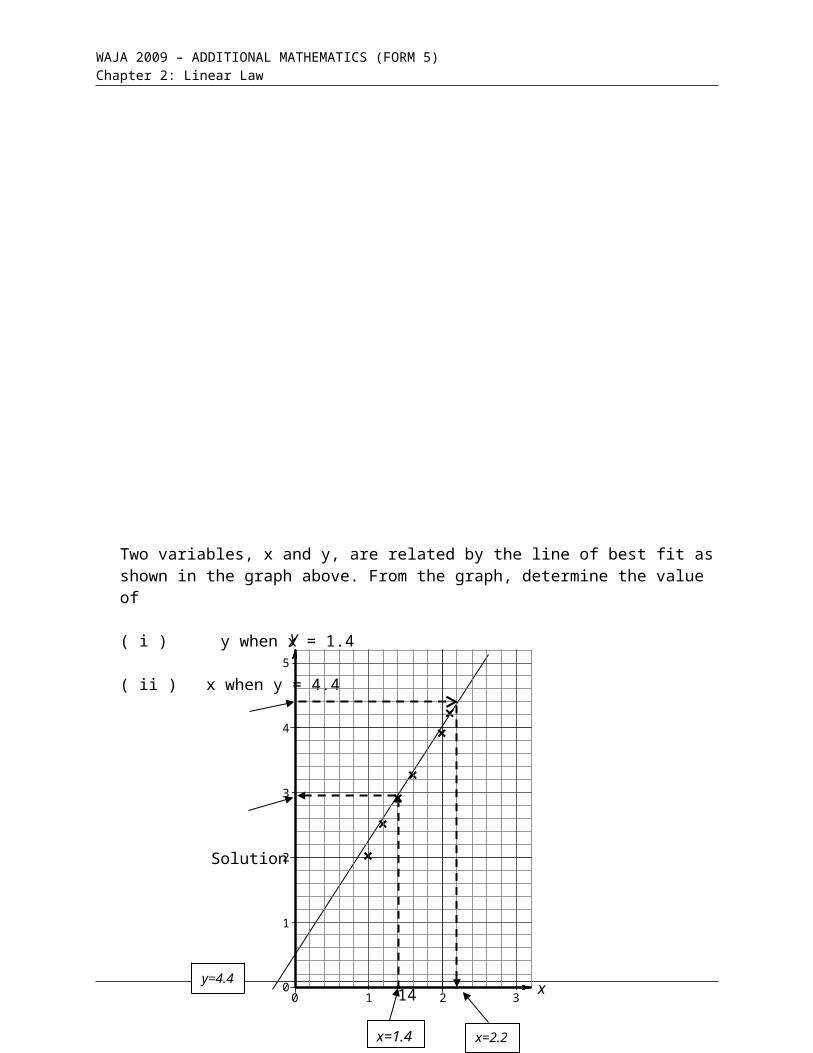
Two variables, x and y, are related by the line of best fit as shown in the graph above. From the graph, determine the value of
( i ) y when x = 1.4
( ii ) x when y = 4.4
11
×
×
××
××
y
x
0 0
5
4
3
1
2
3 1 2
WAJA 2009 – ADDITIONAL MATHEMATICS (FORM 5) Chapter 2: Linear Law
Solution
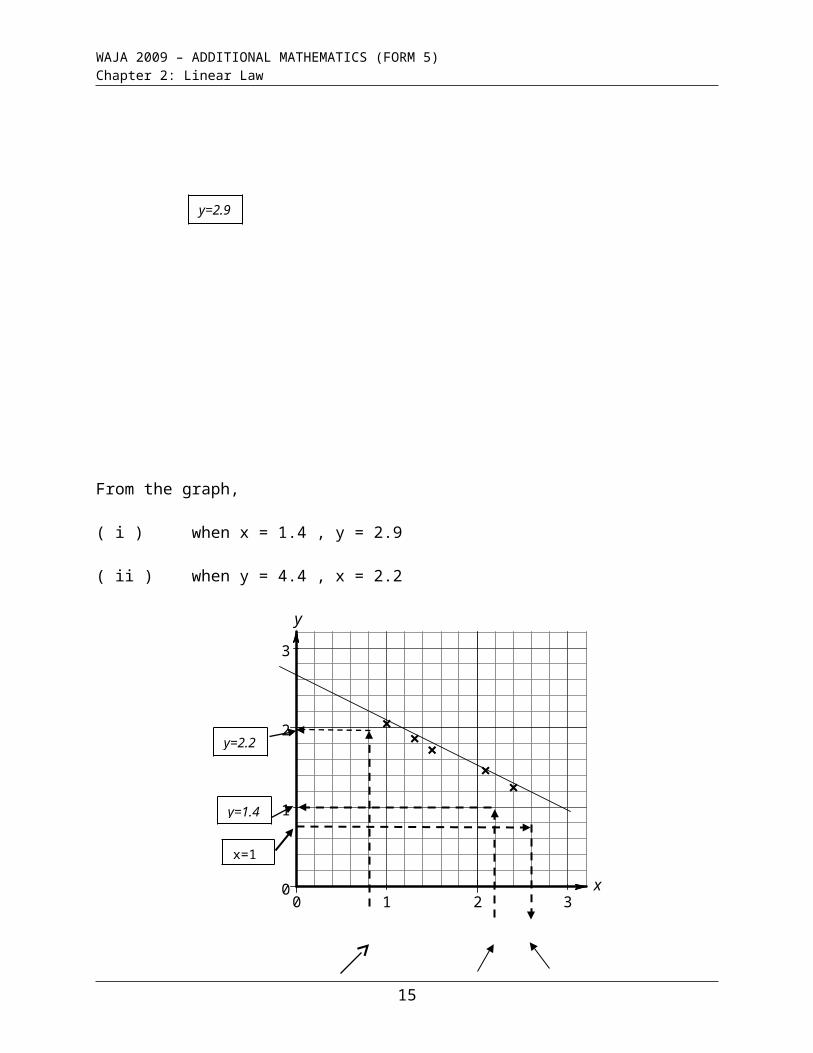
From the graph,
( i ) when x = 1.4 , y = 2.9
( ii ) when y = 4.4 , x = 2.2
12
00
3
1
2
31 2
×
××
××
y
x
y=2.2
y=1.4
x=2.6x=0.8 x=2.2
x=1.2
y=2.99
y=4.4
×
×
××
××
y
x
0 0
5
4
3
1
2
3 1 2
x=1.4 x=2.2
WAJA 2009 – ADDITIONAL MATHEMATICS (FORM 5) Chapter 2: Linear Law
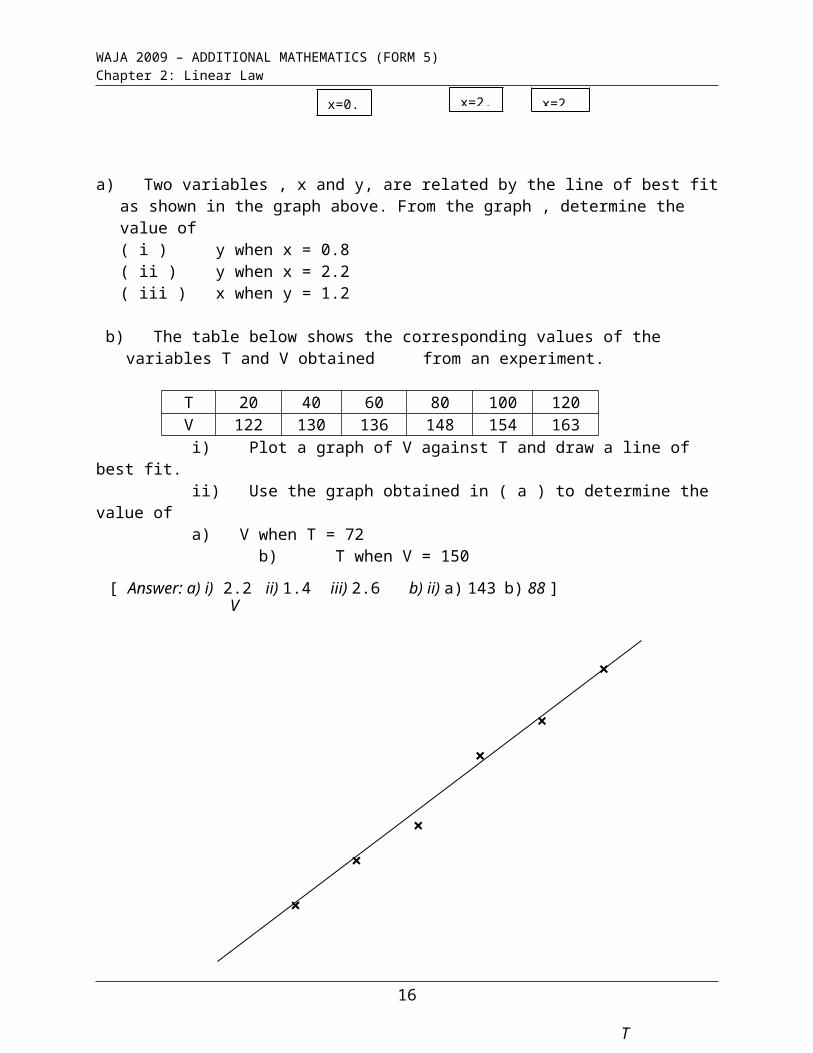
a) Two variables , x and y, are related by the line of best fit as shown in the graph above. From the graph , determine the value of( i ) y when x = 0.8 ( ii ) y when x = 2.2( iii ) x when y = 1.2
b) The table below shows the corresponding values of the variables T and V obtained from an experiment.
T 20 40 60 80 100 120V 122 130 136 148 154 163
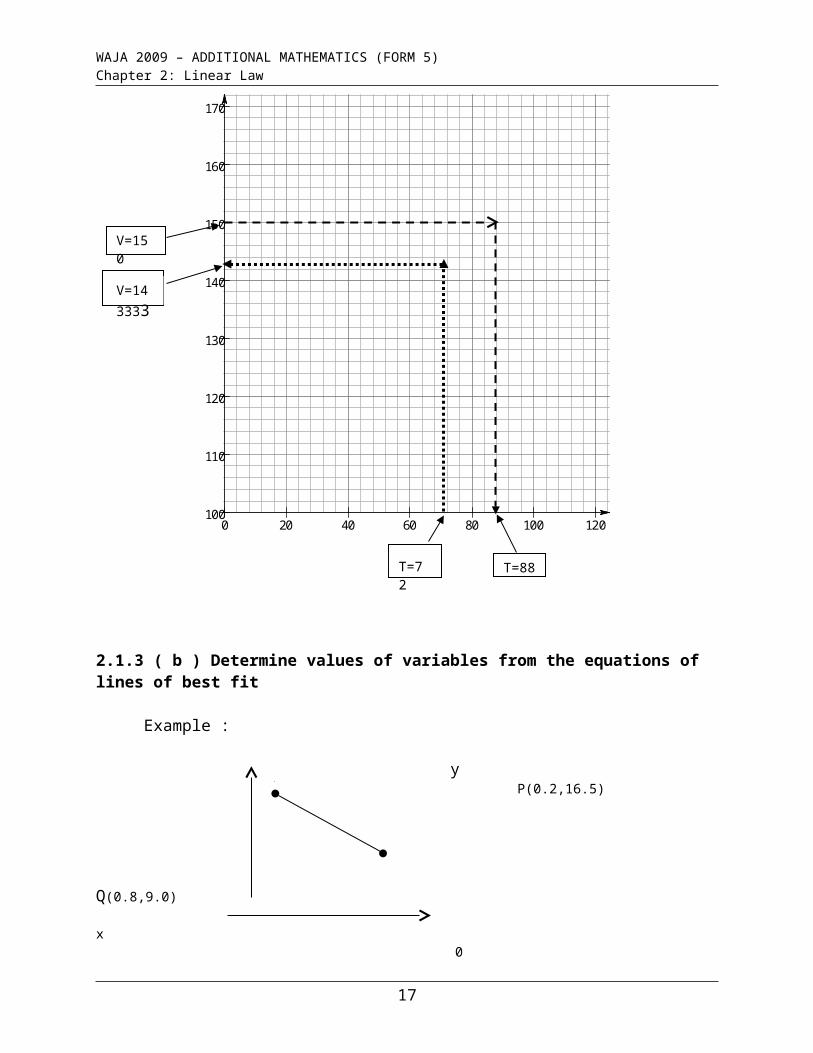
i) Plot a graph of V against T and draw a line of best fit. ii) Use the graph obtained in ( a ) to determine the value of
a) V when T = 72 b) T when V = 150
100
110
120
130
140
150
160
170
0 20 40 60 80 100 120
13
[ Answer: a) i) 2.2 ii) 1.4 iii) 2.6 b) ii) a) 143 b) 88 ]
V
T
×
×
×
×
×
×
V=143333
T=72
V=150
T=88
WAJA 2009 – ADDITIONAL MATHEMATICS (FORM 5) Chapter 2: Linear Law
2.1.3 ( b ) Determine values of variables from the equations of lines of best fit
Example :
y P(0.2,16.5)
Q(0.8,9.0) x 0
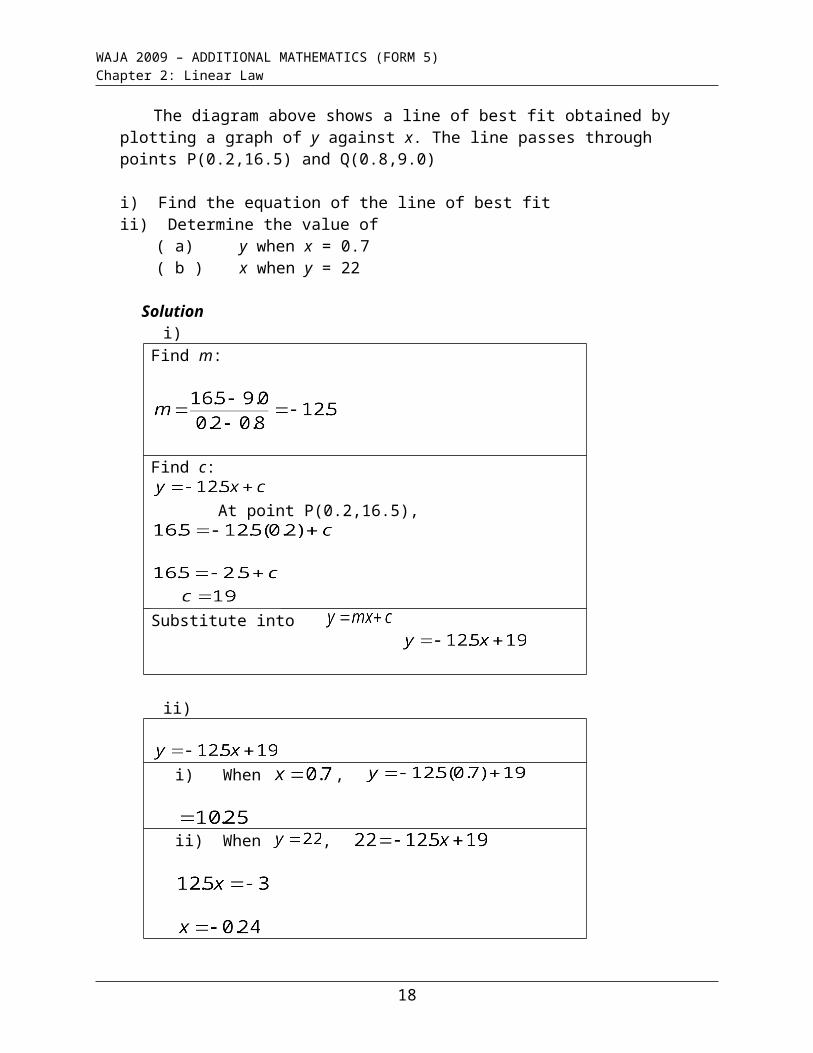
The diagram above shows a line of best fit obtained by plotting a graph of y against x. The line passes through points P(0.2,16.5) and Q(0.8,9.0)
i) Find the equation of the line of best fitii) Determine the value of
( a) y when x = 0.7( b ) x when y = 22
Solution i)
Find m:
Find c: At point P(0.2,16.5),
Substitute into
ii)
i) When , ii) When ,
14
(5,3)
(2,0.5)q
p
X
x
WAJA 2009 – ADDITIONAL MATHEMATICS (FORM 5) Chapter 2: Linear Law
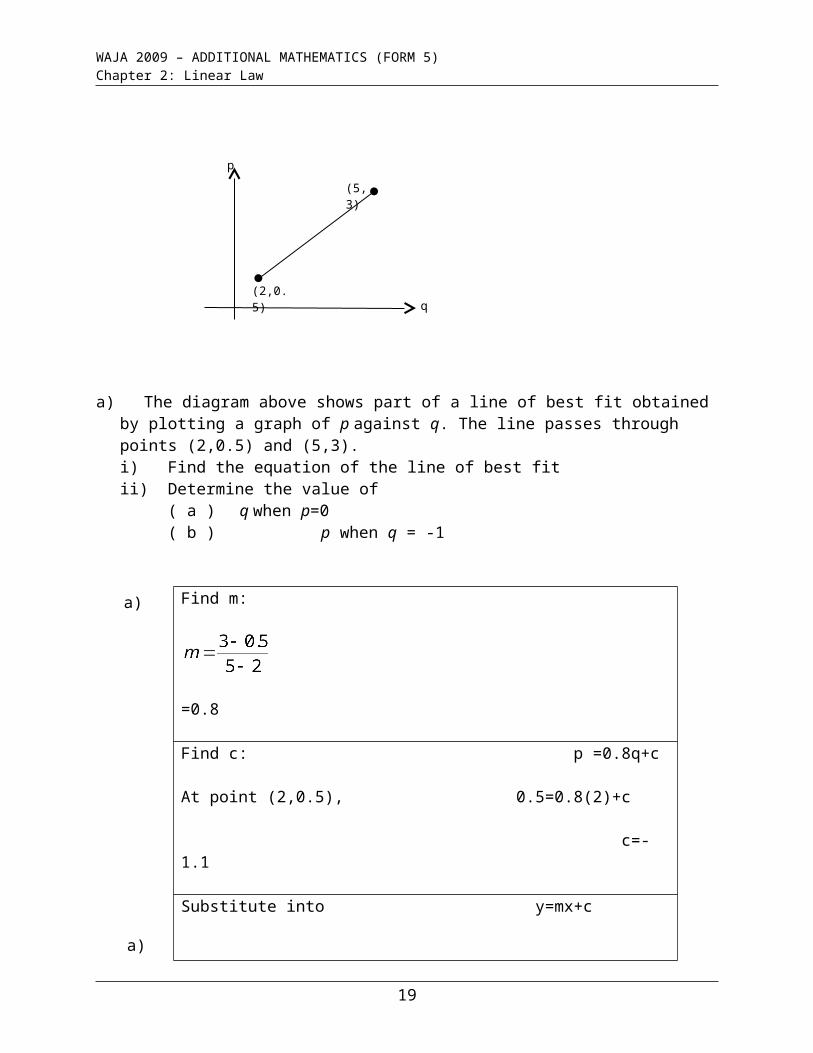
a) The diagram above shows part of a line of best fit obtained by plotting a graph of p against q.
The line passes through points (2,0.5) and (5,3).i) Find the equation of the line of best fit ii) Determine the value of
( a ) q when p=0 ( b ) p when q = -1
Find m:
=0.8
Find c: p =0.8q+c
At point (2,0.5), 0.5=0.8(2)+c
c=-1.1
Substitute into y=mx+c
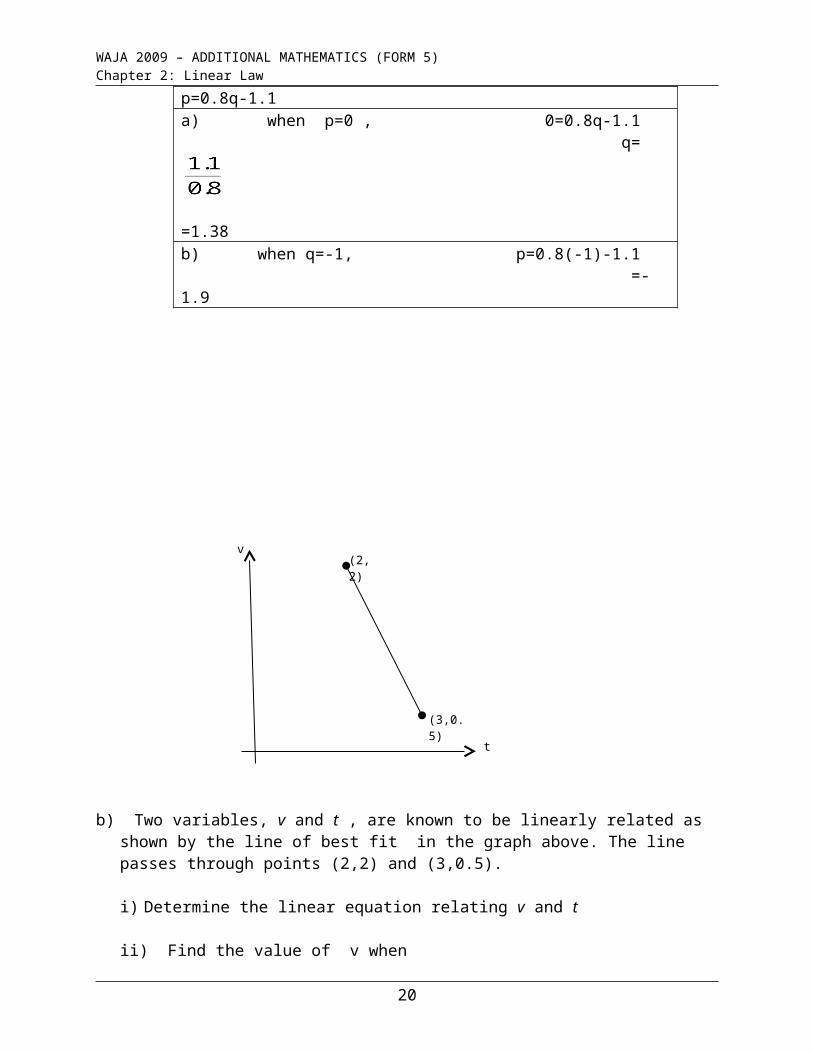
p=0.8q-1.1a) when p=0 , 0=0.8q-1.1
q=
=1.38b) when q=-1, p=0.8(-1)-1.1 =-1.9
15(3,0.5)
(2,2)
t
v
a) i)
a) ii)
WAJA 2009 – ADDITIONAL MATHEMATICS (FORM 5) Chapter 2: Linear Law
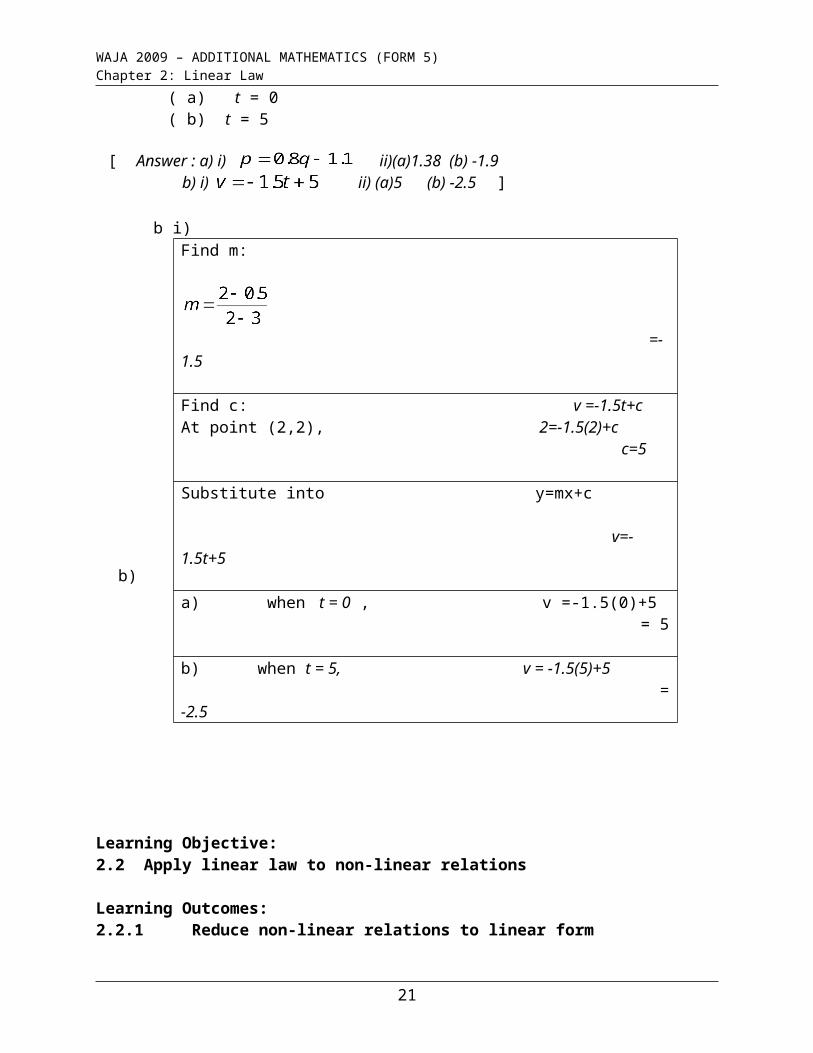
b) Two variables, v and t , are known to be linearly related as shown by the line of best fit in the
graph above. The line passes through points (2,2) and (3,0.5).
i) Determine the linear equation relating v and t
ii) Find the value of v when( a) t = 0 ( b) t = 5
b i) Find m:
=-1.5
Find c: v =-1.5t+cAt point (2,2), 2=-1.5(2)+c c=5
Substitute into y=mx+c
v=-1.5t+5
a) when t = 0 , v =-1.5(0)+5 = 5 b) when t = 5, v = -1.5(5)+5 = -2.5
Learning Objective:2.2 Apply linear law to non-linear relations
16
[ Answer : a) i) ii)(a)1.38 (b) -1.9 b) i) ii) (a)5 (b) -2.5 ]
b) ii)
WAJA 2009 – ADDITIONAL MATHEMATICS (FORM 5) Chapter 2: Linear Law
Learning Outcomes:2.2.1 Reduce non-linear relations to linear form
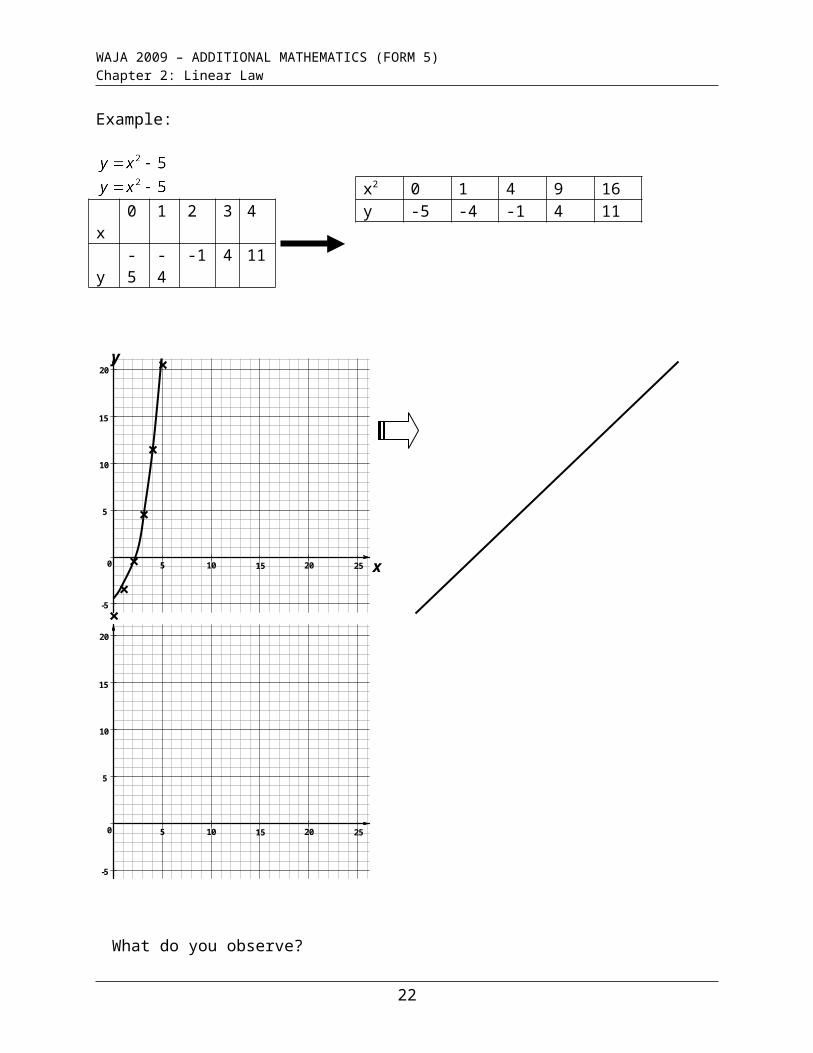
Example:
x 0 1 2 3 4 y -5 -4 -1 4 11
0 252015105
15
10
5
-5
20
0 252015105
15
10
5
-5
20
What do you observe?
Quadratic graphs can be drawn as linear graphs if we change the representation of x- axis, that is x x2 .
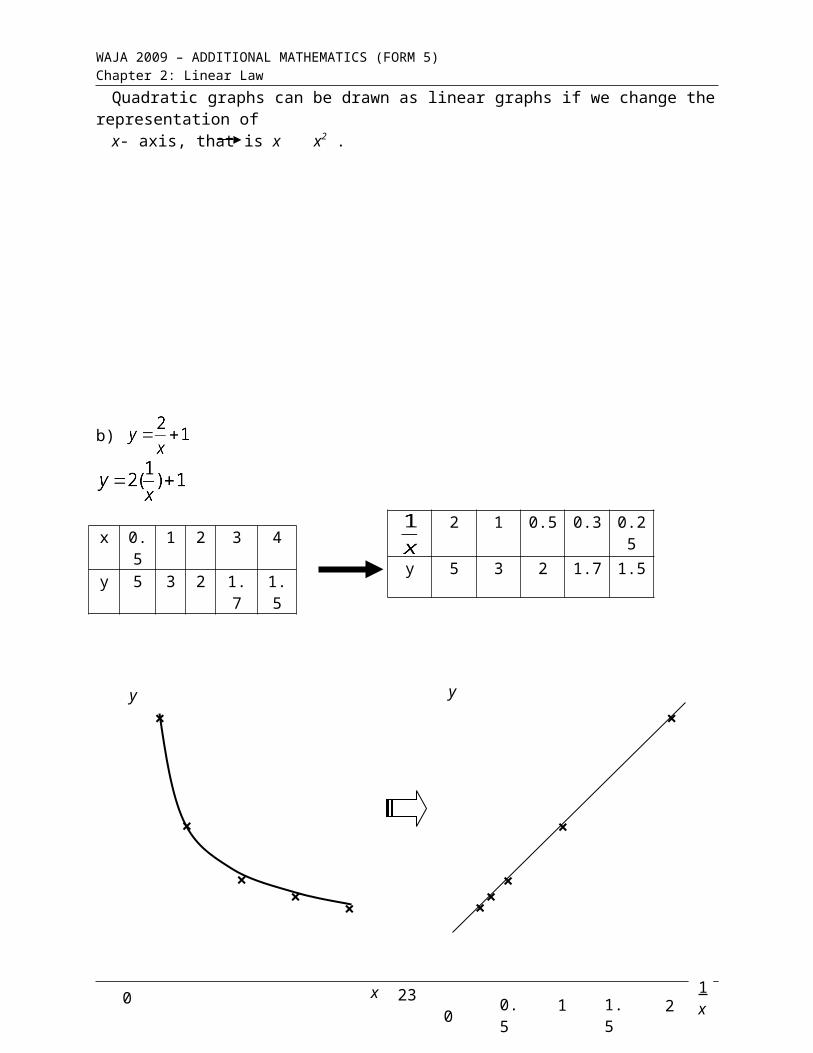
b)
x 0.5 1 2 3 4
17
x2 0 1 4 9 16y -5 -4 -1 4 11
2 1 0.5 0.3 0.25
y 5 3 2 1.7 1.5
y
x
×
×
×
×
×
×
WAJA 2009 – ADDITIONAL MATHEMATICS (FORM 5) Chapter 2: Linear Law
y 5 3 2 1.7 1.5
5
4
3
2
1
1 2 3 4
5
4
3
2
1
1 2 3 4
Again, what do you observe?
Reciprocal graphs can be drawn as linear graphs if we change the representation of x-axis, that is x .
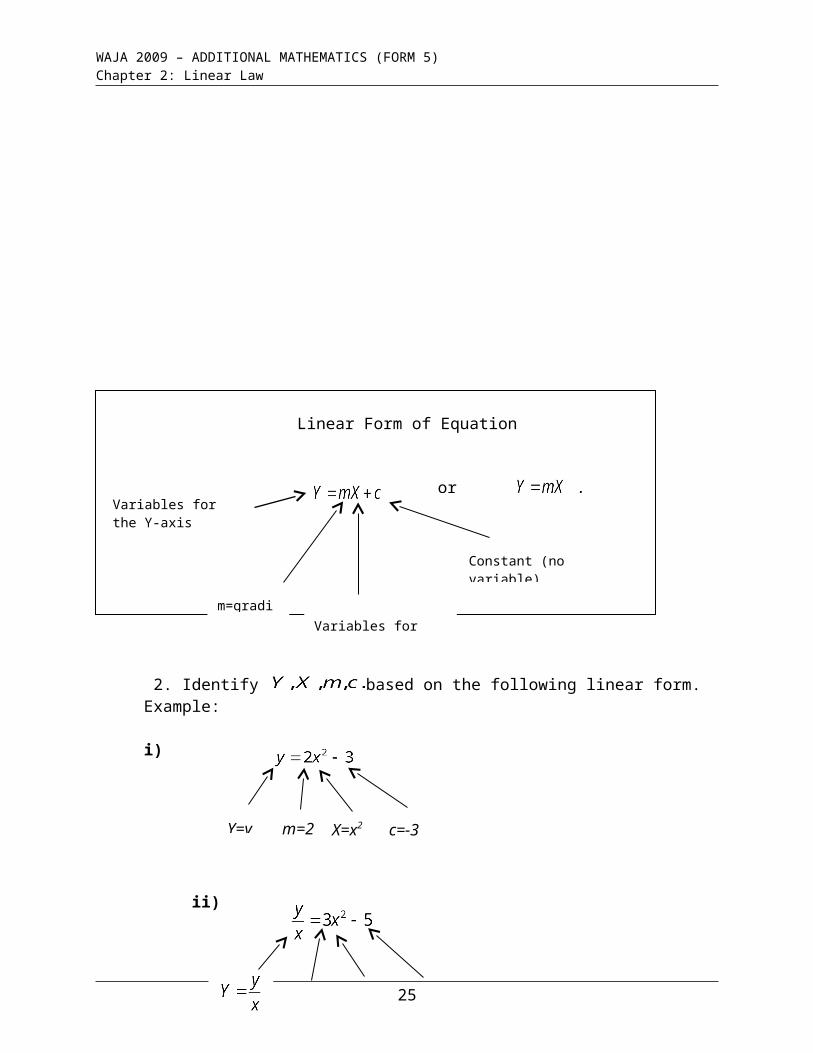
Conclusion: A non-linear equation can be reduced to a linear form Y = mX + c.
Linear Form of Equation
18 or , c=0
x
y
0
y
0
×
×
××
×
×
××
×
×
0.5 1 1.5 21x
WAJA 2009 – ADDITIONAL MATHEMATICS (FORM 5) Chapter 2: Linear Law
2. Identify based on the following linear form.Example:
i)
ii)
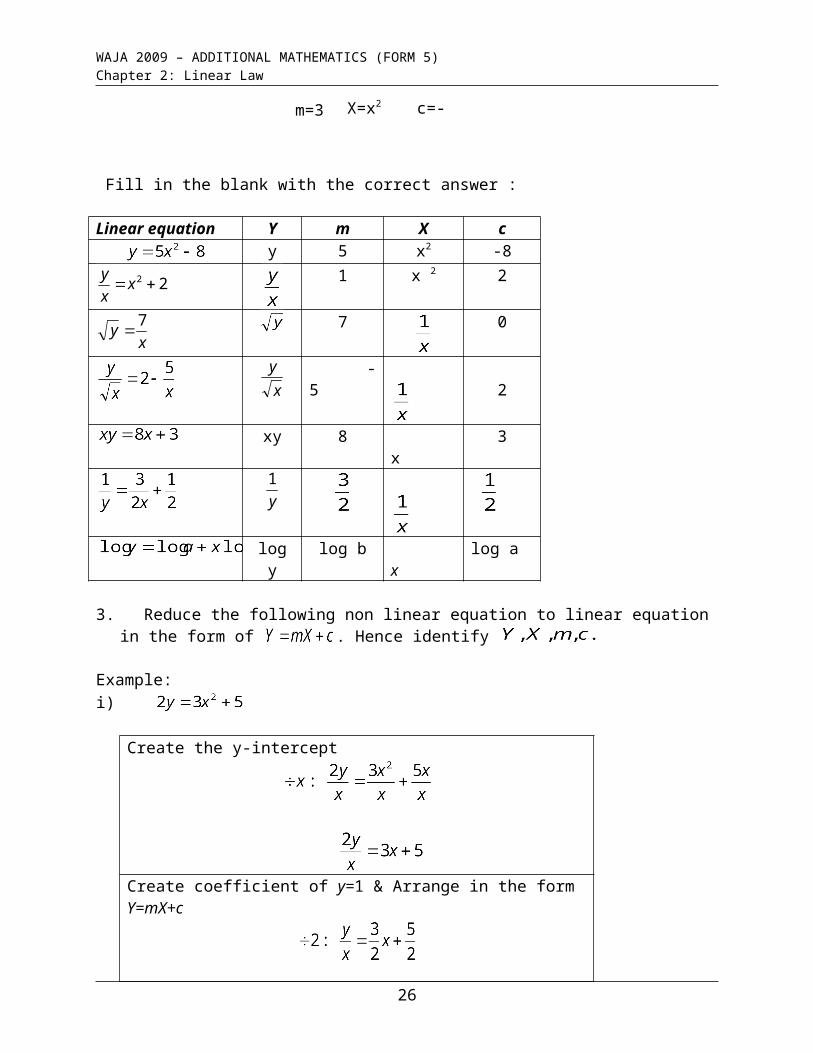
Fill in the blank with the correct answer :
Linear equation Y m X cy 5 x2 -8
22 xx
y 1 x 2 2
xy
7
7 0
x
y -5 2
xy 8 x 3
y
1
log y log b x log a
3. Reduce the following non linear equation to linear equation in the form of . Hence identify
Example:
19
Variables for the x-axis
Variables for the Y-axiscoefficient=1
m=gradient
Constant (no variable)y-intercept
Y=y m=2 X=x2 c=-3
m=3 X=x2 c=-5
WAJA 2009 – ADDITIONAL MATHEMATICS (FORM 5) Chapter 2: Linear Law
i)
Create the y-intercept
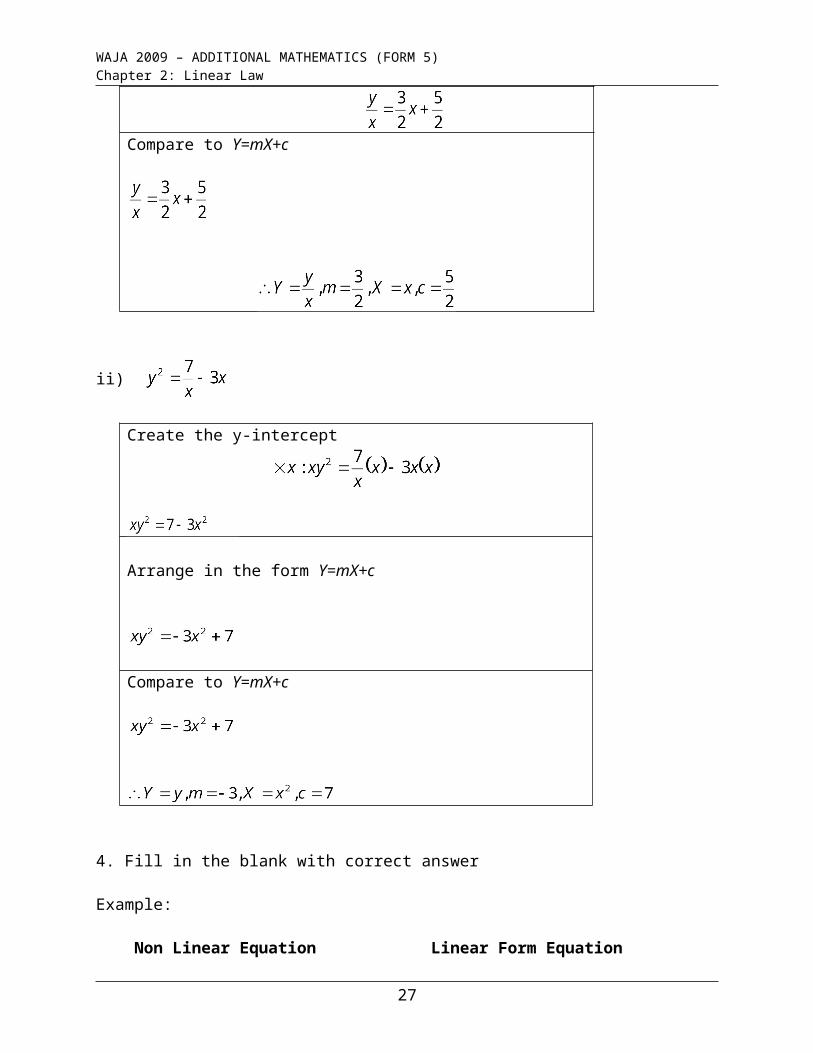
Create coefficient of y=1 & Arrange in the form Y=mX+c
Compare to Y=mX+c
ii)
Create the y-intercept
Arrange in the form Y=mX+c
Compare to Y=mX+c
4. Fill in the blank with correct answer
Example:
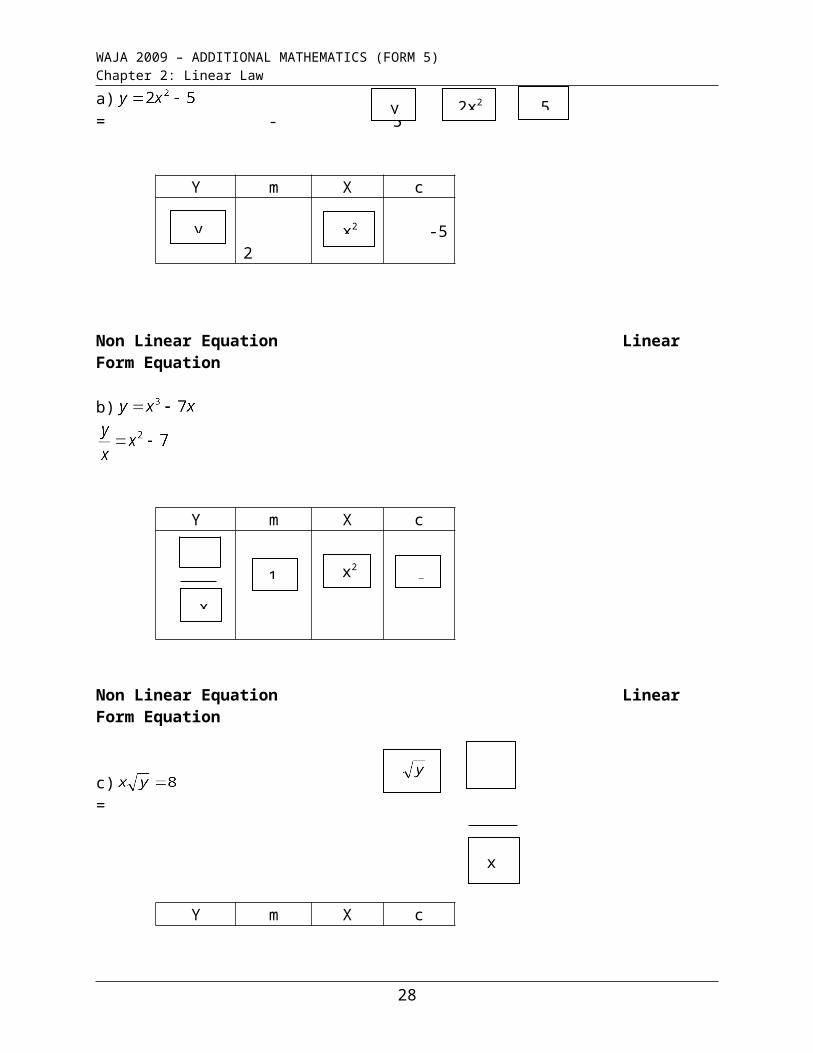
Non Linear Equation Linear Form Equation
a) = - 5
20y 2x2 5
WAJA 2009 – ADDITIONAL MATHEMATICS (FORM 5) Chapter 2: Linear Law
Y m X c
2 -5
Non Linear Equation Linear Form Equation
b)
Y m X c
Non Linear Equation Linear Form Equation
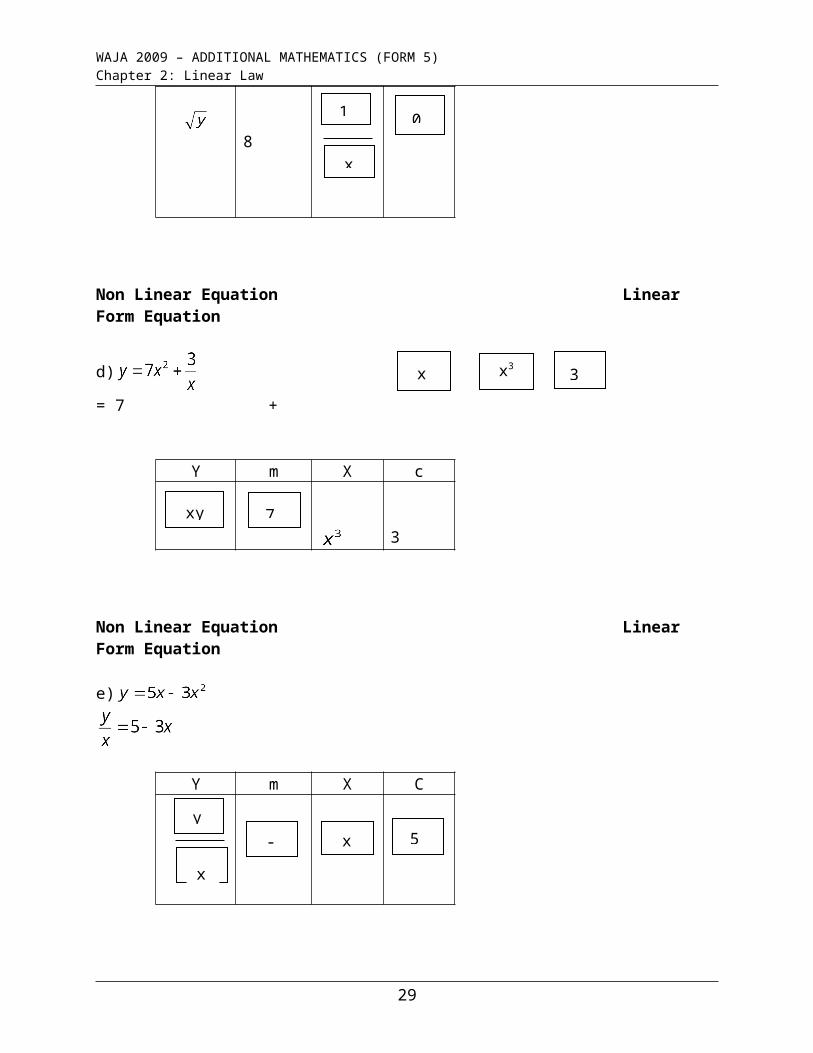
c) =
Y m X c
8
Non Linear Equation Linear Form Equation
d) = 7 +
Y m X c
21
y x2
y
x
1 x2 -7
1
x
0
xy x33
8
x
WAJA 2009 – ADDITIONAL MATHEMATICS (FORM 5) Chapter 2: Linear Law
3
Non Linear Equation Linear Form Equation
e)
Y m X C
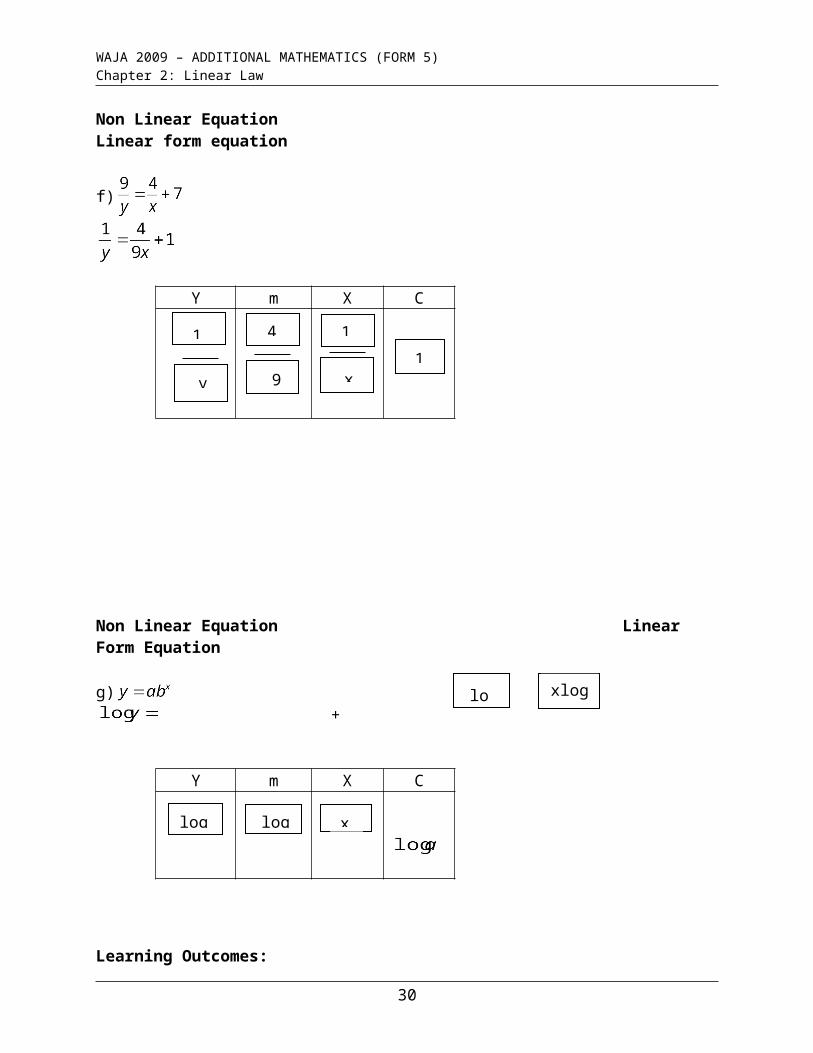
Non Linear Equation Linear form equation
f)
Y m X C
Non Linear Equation Linear Form Equation
g) +
Y m X C
22
xy 7
y
x
-3 x 5
1
y
4
9
1
x
1
loga xlogb
WAJA 2009 – ADDITIONAL MATHEMATICS (FORM 5) Chapter 2: Linear Law
Learning Outcomes:2.2.2 Determine values of constants on non-linear relations given:2.2.2a)Determine values of constants from lines of best fit
1. Find the value of the following situation.
Example:
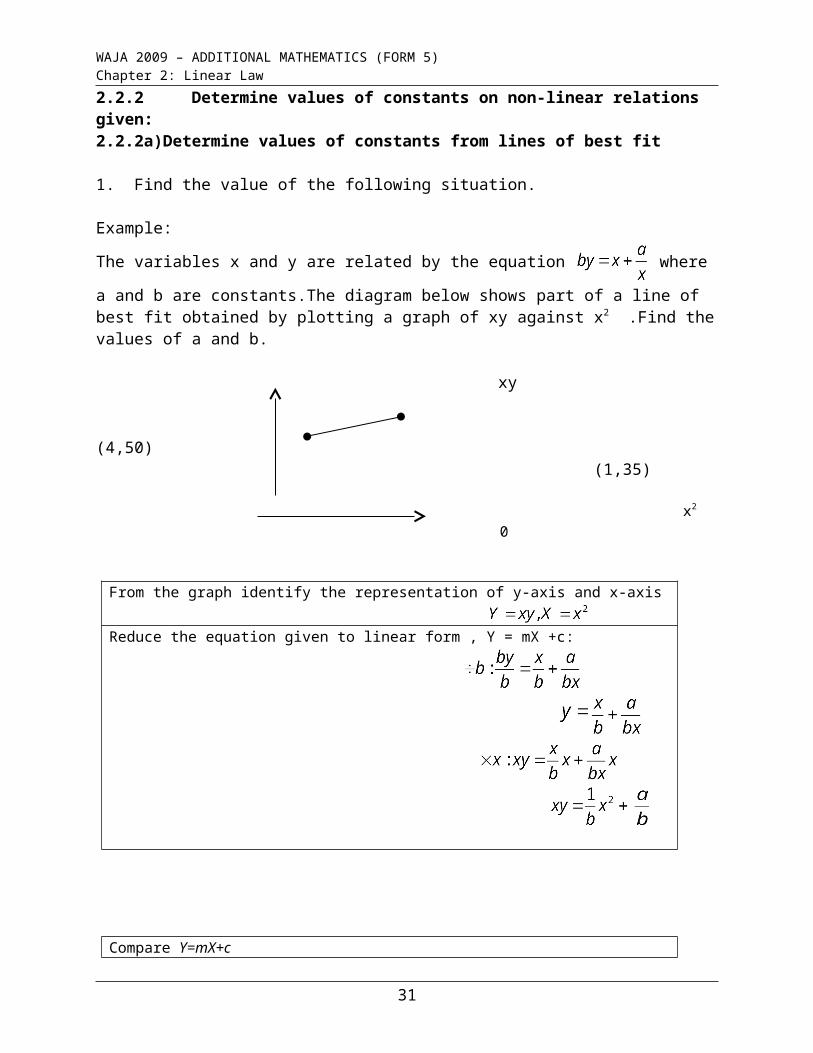
The variables x and y are related by the equation where a and b are constants.The
diagram below shows part of a line of best fit obtained by plotting a graph of xy against x2 .Find the values of a and b.
xy (4,50) (1,35)
x2
0
From the graph identify the representation of y-axis and x-axis Reduce the equation given to linear form , Y = mX +c:
Compare Y=mX+c
Find m from the graph:
23
logy logb x
WAJA 2009 – ADDITIONAL MATHEMATICS (FORM 5) Chapter 2: Linear Law
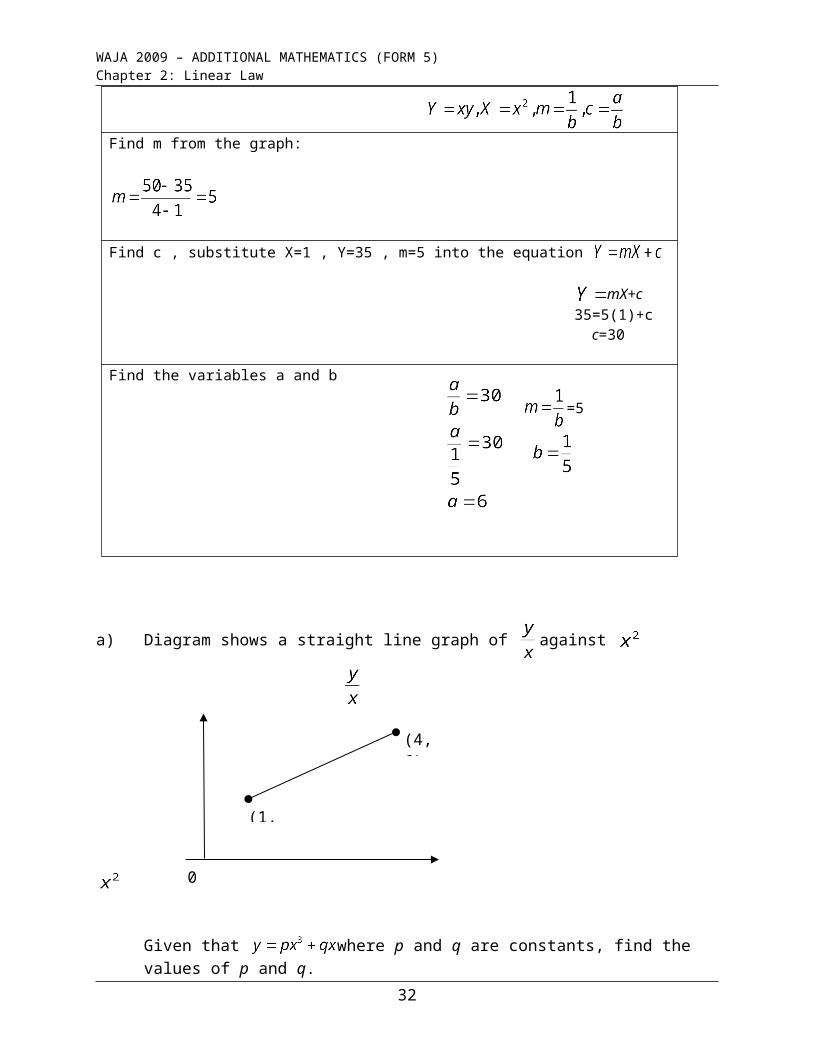
Find c , substitute X=1 , Y=35 , m=5 into the equation
mX+c 35=5(1)+c c=30 Find the variables a and b
=5
a) Diagram shows a straight line graph of against
Given that where p and q are constants, find the values of p and q. [p=1, q=2]
From the question identify the representation of y-axis and x-axis
Reduce the equation given to linear form , Y = mX +c:
Compare Y=mX+c
24
0
(4,6)
(1,3)
WAJA 2009 – ADDITIONAL MATHEMATICS (FORM 5) Chapter 2: Linear Law
Find m from the graph:
= 1 Find c , substitute X=1 , Y=3 , m=5 into the equation
mX+c 3 = 1(1)+c c = 2 Find the variables p and q
b) Diagram shows a straight line graph of against .The variables x and y are related by
the equation where a and b are constants. Find the values a and b.
(3,7)
(1,3)
[ a = 1 , b = 2]
From the question identify the representation of y-axis and x-axis
Reduce the equation given to linear form , Y = mX +c:
Compare Y=mX+c
25
WAJA 2009 – ADDITIONAL MATHEMATICS (FORM 5) Chapter 2: Linear Law
Find m from the graph:
Find c , substitute X=1 , Y=3 , m=5 into the equation
mX+c 3 = 2(1)+c c=1
Find the variables a and b
2.2.2b)Determine values of constants from data
1. Find the values of the constants based on the table of values.
Example:
x 1 2 3 4 5y 1.00 2.83 3.81 5.00 5.90
The table above shows experimental values of two variables, x and y. The variables x and y are
known to be related by the equation where h and k are constants.
( i )Plot a graph of against x and draw a line of best fit.
( ii )From the graph obtained in ( b ) , find the values of h and k.
Solution:
From the graph identify the representation of y-axis and x-axisY= , X=x
Construct a new table
X=x 1 2 3 4 51.00 4.00 6.60 10.00 13.19
26
WAJA 2009 – ADDITIONAL MATHEMATICS (FORM 5) Chapter 2: Linear Law
Plot the points and draw the graph
Reduce the equation given to linear form ,
:
Compare
Find m and y-intercept from the graph :
27
y-intercept=c=-2c=k=-2
-2
Graph of y x against x
x
y x
14
12
10
8
6
4
2
1 2 3 4 50
×
×
×
×
×
10 – 2 = 8
4 – 1.4 = 2.6
WAJA 2009 – ADDITIONAL MATHEMATICS (FORM 5) Chapter 2: Linear Law
a) Table shows the values of two variables , x and y,obtained from an experiment.The
variables x and y are related by the equation where p and r are constants.
x 1.0 2.0 3.0 4.0 5.0 5.5y 5.5 4.7 5.0 6.5 7.7 8.4
( i )Plot xy against x2 , by using a scale of 2 cm to 5 units on both axes.Hence , draw the line of best fit.
( ii )Use the graph from ( a ) to find the value of
( a ) p,
( b ) r. [ p = 1.3778 , r = 5.5111 ]
From the graph identify the representation of y-axis and x-axis Y = , X = x2
Construct a new table
X=x2 1 4 9 16 25 30.255.5 9.4 15 26 38.5 46.2
Plot the points and draw the graph
28
WAJA 2009 – ADDITIONAL MATHEMATICS (FORM 5) Chapter 2: Linear Law
0
5
10
15
20
25
30
35
40
45
50
55
0 5 10 15 20 25 30 35
Reduce the equation given to linear form ,
:
Compare
Find m and y-intercept from the graph :
29
35-4=31
y-intercept=c=4
c= =4
r = 5.5111
xy
x222.5 – 4=18.5
WAJA 2009 – ADDITIONAL MATHEMATICS (FORM 5) Chapter 2: Linear Law
b) Table shows the values of two variables , x and y,obtained from an experiment.The variables
x and y are related by the equation where p and k are constants.
x 2 3 4 5 6 7y 8 13.2 20 27.5 36.6 45.5
( i )Plot against x , using a scale of 2 cm to 1 unit on both axes.Hence , draw the line of best
fit.
( ii )Use the graph from ( a ) to find the value of
( a ) p,
( b ) k. ( c )y when x = 1.2 [ p = 0.754 , k = 0.26 ,y = 4.2 ]
From the graph identify the representation of y-axis and x-axis
Y = , X = x
Construct a new table
X=x 2 3 4 5 6 7
4 4.4 5 5.5 6.1 6.5
Plot the points and draw the graph
30
y
x
WAJA 2009 – ADDITIONAL MATHEMATICS (FORM 5) Chapter 2: Linear Law
0
1
2
3
4
5
6
7
0 1 2 3 4 5 6 7
Reduce the equation given to linear form ,
:
Compare
Find m and y-intercept from the graph :
31
y-intercept=c=
2.7=
p = 0.7763
x=1.2
WAJA 2009 – ADDITIONAL MATHEMATICS (FORM 5) Chapter 2: Linear Law
From the graph :
When x = 1.2 ,
y = 4.08
32