Embed Size (px)
Citation preview

Americans Do IT Better: US Multinationals and the Productivity Miracle
CitationBloom, Nicholas, Raffaella Sadun, and John Van Reenen. "Americans Do IT Better: US Multinationals and the Productivity Miracle." American Economic Review 102, no. 1 (February 2012): 167–201.
Published Versionhttp://www.aeaweb.org/articles.php?doi=10.1257/aer.102.1.167
Permanent linkhttp://nrs.harvard.edu/urn-3:HUL.InstRepos:23017126
Terms of UseThis article was downloaded from Harvard University’s DASH repository, and is made available under the terms and conditions applicable to Other Posted Material, as set forth at http://nrs.harvard.edu/urn-3:HUL.InstRepos:dash.current.terms-of-use#LAA
Share Your StoryThe Harvard community has made this article openly available.Please share how this access benefits you. Submit a story .
Accessibility
AEA Journals Copyright and Reprint
Permissions
Copyright © 1998, 1999, 2000, 2001, 2002, 2003, 2004, 2005, 2006, 2007, 2008, 2009, 2010,
2011, 2012 by the American Economic Association.
Permission to make digital or hard copies of part or all of American Economic Association
publications for personal or classroom use is granted without fee provided that copies are not
distributed for profit or direct commercial advantage and that copies show this notice on the first
page or initial screen of a display along with the full citation, including the name of the author.
Copyrights for components of this work owned by others than AEA must be honored.
Abstracting with credit is permitted.
The author has the right to republish, post on servers, redistribute to lists and use any component
of this work in other works. For others to do so requires prior specific permission and/or a fee.
Permissions may be requested from the American Economic Association Business Office.
Permissions may be requested from the American Economic Association Business Office.
Copyright © 2012 AEA
Bloom, Nicholas, Raffaella Sadun, and John Van Reenen. 2012.
“Americans Do IT Better: US Multinationals and the Productivity
Miracle.” American Economic Review no. 102 (1):167–201. doi:
10.1257/aer.102.1.167.
Available online at:
http://www.aeaweb.org/articles.php?doi=10.1257/aer.102.1.167.

American Economic Review 2012, 102(1): 167–201http://dx.doi.org/10.1257/aer.102.1.167
167
One of the most startling economic facts of recent years has been the reversal in the long-standing catch-up of Europe’s productivity level with the United States. American labor productivity growth slowed after the early 1970s Oil Shocks but accelerated sharply after 1995. Although European productivity growth experienced the same slowdown, it has not enjoyed the same rebound (see Figure 1).1 For example, Inklaar, Timmer, and van Ark (2008) show that US GDP per hour growth accelerated from 1.3 percent 1980–1995 to 2.2 percent 1995–2006, whereas in Europe productivity growth slowed from 2.3 percent to 1.4 percent. Although some part of the observed European slowdown may be due to labor market reforms getting less skilled workers into jobs,
1 Examples of early studies include Jorgenson (2001) and Oliner and Sichel (2000). Looking at more recent data, Jorgenson, Ho, and Stiroh (2008) document that average annual US labor productivity growth was similar in the 2000–2006 period to the 1995–2000 period (and well above the 1.5 percent of 1973–1995). Only after 2005 is there any sign of a return to more “normal” levels of productivity growth as IT prices declines have slowed.
Americans Do IT Better: US Multinationals and the Productivity Miracle†
By Nicholas Bloom, Raffaella Sadun, and John Van Reenen*
US productivity growth accelerated after 1995 (unlike Europe’s), particularly in sectors that intensively use information technologies (IT). Using two new micro panel datasets we show that US multina-tionals operating in Europe also experienced a “productivity mira-cle.” US multinationals obtained higher productivity from IT than non-US multinationals, particularly in the same sectors responsible for the US productivity acceleration. Furthermore, establishments taken over by US multinationals (but not by non-US multination-als) increased the productivity of their IT. Combining pan-European firm-level IT data with our management practices survey, we find that the US IT related productivity advantage is primarily due to its tougher “people management” practices. (JEL D24, E23, F23, M10, M16, O30)
* Bloom: Department of Economics, Stanford University, 579 Serra Mall, Stanford, CA 94305-6072, Centre for Economic Performance, CEPR, and NBER (e-mail: [email protected]); Sadun: Harvard Business School, Soldiers Field, Boston, MA 02163, Centre for Economic Performance and NBER (e-mail: [email protected]); Van Reenen: London School of Economics, Centre for Economic Performance, Houghton Street, London WC2A 2AE, UK, CEPR, and NBER (e-mail: [email protected]). This is a revised version of NBER Working Paper 13085 “Americans Do I.T. Better: US Multinationals and the Productivity Miracle” and the mimeo “It Ain’t What You Do but the Way that You Do I.T.” We would like to thank our formal discussants (Susanto Basu, Erik Brynjolfsson, Johannes von Biesebroeck, John Fernald, Bart Hobijn, and Stephen Yeaple), Tony Clayton, Chiara Criscuolo, Mary O’Mahony, and Ralf Martin. We would also like to thank the Department of Trade and Industry, and the Economic and Social Research Council for financial support. This work contains statistical data from the Office of National Statistics (ONS) which is Crown copyright and reproduced with the permission of the controller of HMSO and Queens Printer for Scotland. The use of the ONS statistical data in this work does not imply the endorsement of the ONS in relation to the interpretation or analysis of the statistical data.
† To view additional materials, visit the article page at http://dx.doi.org/10.1257/aer.102.1.167.
ContentsAmericans Do IT Better: US Multinationals and the Productivity Miracle† 167
I. Empirical Modeling Strategy 171A. Basic Empirical Model 171B. Testing the Model when O is Unobserved 173C. Testing the Model Using Direct Measurement of Firm Management Practices 176D. Models of Adjusting Management Practices 177II. Establishment-Level Panel Data from the UK Census 178III. Results from the UK Establishment Panel 180A. Main Results 180B. Robustness Tests of the Production Function Results 183C. Estimation of the IT Intensity Equation 187D. US Multinational Takeovers of UK Establishments 188IV. Firm-level Panel Data from Seven European Countries 191V. Results from a Cross-European Firm-Level Panel 193A. People Management in US Firms Compared to Other Countries’ 193B. Results 194VI. Conclusions 197REFERENCES 199

168 THE AMERICAN ECONOMIC REVIEW FEBRUARy 2012
most analysts agree there was still a substantial gap in productivity growth between the United States and European Union that has persisted. Nor has the recent recession changed this picture: US productivity growth appears to have continued to outstrip that in Europe (Gordon 2010).
Decompositions of US productivity growth show that a large fraction of this recent growth occurred in those sectors that either produce IT (information tech-nologies) or intensively use IT. Closer analysis has shown that European countries had a similar productivity acceleration as the United States in IT-producing sectors (such as semiconductors and computers) but failed to achieve the spectacular levels of productivity growth in the sectors that used IT intensively—predominantly mar-ket service sectors, including wholesale, retail, and financial services (e.g., van Ark, O’Mahony, and Timmer 2008). In light of the credit crunch, the measured produc-tivity gains in finance may prove illusory—which is why we focus on nonfinancial firms in the article—but the productivity gains in other sectors like retail and whole-sale are likely to be real and persistent. Consistent with these trends, Figure 2 shows that IT intensity appears to be substantially higher in the United States than in Europe, and this gap has not narrowed over time. Given the common availability of IT throughout the world at broadly similar prices, it is a major puzzle why these IT related productivity effects have not been more widespread in Europe.
There are at least two broad classes of explanation for this puzzle. First, there may be some “natural advantage” to being located in the United States, enabling firms to make better use of the opportunity that comes from rapidly falling IT prices. These natu-ral advantages could be tougher product market competition, lower regulation, better access to risk capital, more educated2 or younger workers, larger market size, greater
2 For example, if IT is complementary with human capital, then the larger stock of college educated workers in the United States than Europe may mean that productivity grows faster in the United States when IT prices are falling rapidly.
25
30
35
40
45
50
Out
put p
er h
ours
wor
ked,
200
5 U
S$
1980 1985 1990 1995 2000 2005
Year
US
Europe
Figure 1. Output per Hour in Europe and the United States, 1980–2005
Notes: Productivity measured by GDP per hour in 2005 US$ PPPs. The countries included in the “EU15” group are: Austria, Belgium, Denmark, Finland, France, Germany, United Kingdom, Greece, Italy, Ireland, Luxembourg, Portugal, Spain, Sweden, and Netherlands. Labor productivity measured as GDP per hour worked in 2005 US$.
Source: The Conference Board and Groningen Growth and Development Centre, Total Economy Database.

169BLOOM ET AL.: AMERICANS dO IT BETTERVOL. 102 NO. 1
geographical space, or a host of other factors. A second class of explanations stresses that it is not the US environment per se that matters but rather the way that US firms are managed that enables better exploitation of IT (“the US management hypothesis”).3
These explanations are not mutually exclusive. In this article we sketch a model that has elements of both (see online Appendix B and Bloom, Sadun, and Van Reenen 2007). Nevertheless, one straightforward way to test whether the US management hypothe-sis has any validity is to examine the IT performance of US owned organizations in a European environment. If US multinationals partially transfer their business models to their overseas affiliates—and a walk into McDonald’s or Starbucks anywhere in Europe suggests that this is not an unreasonable assumption—then analyzing the IT perfor-mance of US multinational establishments in Europe should be informative. Finding a systematically better use of IT by American firms outside the United States suggests that we should take the US management hypothesis seriously. Such a test could not be easily performed with data only on plants located in the United States, because any findings of higher efficiency of plants owned by US multinationals might arise because of the advantage of operating on the multinational’s home turf (“home bias”).4
In this article, we examine the differences in IT related productivity between establishments owned by US multinationals, establishments owned by non-US multinationals, and purely domestic establishments. We exploit two distinct rich
3 Another possibility is international differences in productivity measurement (Blanchard 2004). This is pos-sible, but the careful work of O’Mahony and Van Ark (2003) focusing on the same sectors in the United States and European Union, using common adjustments for hedonic prices, software capitalization, and demand conditions, still finds a difference in US-EU relative productivity growth rates.
4 Doms and Jensen (1998) find that plants owned by US multinationals have higher productivity than those of non-US multinationals. But since this study was based only on those located in the United States, it could just be a reflection of home bias.
0
2
4
6
8
IT c
apita
l sto
ck p
er
hour
s w
orke
d, 2
000
US
$
1980 1985 1990 1995 2000 2005
Year
US
Europe
Figure 2. IT Capital per Hour in Europe and the United States, 1980–2005
Notes: IT capital stock (in unit dollars) per hour worked. IT capital stock measured using perpetual inventory method and common assumptions on hedonics and depreciation. 2005 US$ PPPs. The countries included in the “EU15” group are: Austria, Belgium, Denmark, Finland, France, Germany, UK, Greece, Italy, Ireland, Luxembourg, Portugal, Spain, Sweden, and the Netherlands. Labor productivity per hour worked in 2005 US$ using PPPs.
Source: Timmer, Ypma, and Ark, “IT in the European Union: Driving Productivity Convergence?” Research Memorandum GD-67, Groningen Growth and Development Centre, October 2003, Appendix Tables, updated June 2005.
170 THE AMERICAN ECONOMIC REVIEW FEBRUARy 2012
and original panel datasets. The first is from the UK Census Bureau (the Office of National Statistics (ONS)) and contains over 11,000 establishments. The UK is a useful testing ground because (a) it has extensive foreign ownership with fre-quent ownership changes and (b) the UK Census Bureau has collected panel data on IT expenditure and productivity in both manufacturing and services since the mid-1990s. The second dataset is a firm-level panel covering seven European coun-tries and combines our own international survey of management practices, a private-sector IT survey, and company accounting data. Although this European dataset is smaller, the use of observable measures of management practices allows a more direct test of the theory.
We report that foreign affiliates of US multinationals appear to obtain higher pro-ductivity than non-US multinationals (and domestic firms) from their IT capital and are also more IT intensive. This is true in both the UK establishment-level dataset and the European firm-level dataset. These findings are robust to a number of tests, including an examination of establishments before and after they are taken over by a US multinational compared to those taken over by a non-US multinational. Using our new international management practices dataset, we then show that American firms have higher scores on “people management” practices defined in terms of promotions, rewards, hiring, and firing.5 This holds true for both domestically based US firms as well as US multinationals operating in Europe. Using our European firm-level panel, we find these management practices account for most of the higher output elasticity of IT of US firms. This appears to be because people management practices enable US firms to better exploit IT.
Our article is related to several other literatures. First, there is a large body of work on the impact of IT on productivity at the aggregate or industry level.6 Second, there is growing evidence that the returns to IT are linked to the internal organization of firms. On the econometric side, Caroli and Van Reenen (2001); Bresnahan, Brynjolfsson, and Hitt (2002); and Crespi, Criscuolo, and Haskel (2007) find that internal organization and other complementary factors, such as human capital, are important in generating significant returns to IT. On the case study side, there is also a large range of evidence.7 Third, in a reversal of the Solow Paradox, the firm-level productivity literature describes returns to IT that are larger than one would expect under the standard growth accounting assump-tions. Brynjolfsson and Hitt (2003) argue that this is due to complementary investments in “organizational capital” that are reflected in the coefficients on IT capital. Fourth, there is a literature on the superior establishment-level productiv-ity of US multinationals versus non-US multinationals, both in the United States and in other countries.8 We suggest that the main reason for this difference is the way in which US multinationals use new technologies more effectively than other multinationals. Finally, our article is linked to the literature on multinationals
5 It is plausible that higher scores reflect “better” management, but we do not assume this. All we claim is that American firms have different people management practices than European firms, and these are complementary with IT.
6 See, for example, Basu et al. (2003) and Stiroh (2002, 2004).7 Blanchard et al. (2002) discuss a number of industry-specific examples. Baker and Hubbard (2004) is an excel-
lent example of applying econometric techniques to a case study of on-board computers in the US trucking industry.8 See, for example, Doms and Jensen (1998) on US plants; Haltiwanger, Jarmin, and Schank (2003) on German
plants; Criscuolo and Martin (2009) on British plants; and Benfratello and Sembenelli (2006) on Italian plants.

171BLOOM ET AL.: AMERICANS dO IT BETTERVOL. 102 NO. 1
and comparative advantage. A recent body of theoretical work emphasizes the importance of firm-level comparative advantage in multinationals.9 In these mod-els firms have some productivity advantage, which their multinationals transplant to their overseas affiliates. Our evidence on the systematically different people management practices of US overseas affiliates provides empirical support for this assumption. Interestingly, these results are also consistent with the litera-ture reporting that US multinationals appear to be earning extremely high rates of return abroad from intangible capital (“dark matter”), particularly since the mid-1990s (e.g., McGrattan and Prescott 2008). Our results suggest one factor could be that the management practices of US multinationals enable them to more effectively use IT.
The structure of this article is as follows. Section I describes the empirical framework, the UK establishment-level data is described in Section II, and the results from this panel are presented in Section III. The European firm-level data is described in Section IV, and the results from this panel are presented in Section V. Section VI offers some concluding remarks. Appendices are all available on the AER website.
I. Empirical Modeling Strategy
We sketch our basic modeling strategy with more formal details in online Appendix B. Here, Section A describes the basic approach, and Section B describes the equa-tions we can estimate when we do not directly observe management practices, as is standard in most economic datasets (this is the case for our UK establishment-level panel). By contrast, Section C describes the equations we are able to estimate when we do directly observe management practices (this can be implemented on our pan-European firm-level panel).
A. Basic Empirical Model
Consider the following production function:
(1) Q it = A it O it α O C it
α C +σ O it L it
α L −σ O it K it
α K M it
α M ,
where Q denotes gross output of establishment (or firm) i in year t. A is a Hicks-neutral efficiency term, M denotes materials/intermediate inputs, L denotes labor, K denotes non-IT capital, C denotes computer/IT capital, and O is a measure of the firms’ management/organizational capital that is complementary with IT capital. This specification of the production function in equation (1) is a simple way of capturing the notion that IT (C) and management (O) are complementary if σ > 0 (Bresnahan et al. 2002). Equation (1) should be regarded as an approximation of a more flexible production function: we examine these more general production functions (such as the translog) in the empirical section and show that equation (1) is consistent with the
9 For example, Helpman, Melitz, and Yeaple (2004); Antras, Garicano, and Rossi-Hansberg (2008); and Burstein and Monge-Naranjo (2009).

172 THE AMERICAN ECONOMIC REVIEW FEBRUARy 2012
empirical results.10 We assume that all the exponents on the factor inputs are bounded by zero and unity to make sure the firm’s optimization problem is well behaved (i.e., 0 ≤ { α L − σO, α C + σO, α K , α M , α O } ≤ 1). This means the value of σ, α L , and α C are dependent on the scaling of O, so that, for example, doubling the units on O would halve the units on σ. Note that α O could be equal to zero, so that increasing O would have no direct effect on firm output. Finally, we will generally consider O to be fixed in the short run (Section D relaxes this assumption).
We use lower case letters to indicate that a variable is transformed into natural log-arithms, so q it ≡ ln Q it , etc., and consider parameterizing the establishment-specific efficiency in equation (1) as a it = a i + γ′ z it + ξ kt + u it , where z are other observable factors influencing productivity—e.g., establishment age, region, and whether the establishment is part of a multiplant group. The ξ kt are industry-time specific shocks that we will control for with a full set of three-digit industry (k) dummies interacted with a full set of time dummies.11 Under these assumptions, equation (1) can be written
(2) (q − l ) it = α C (c − l ) it + α K (k − l ) it + α M (m − l ) it
+ ( α C + α L + α M + α K − 1) l it
+ σ [(c − l ) it × O it )] + α O ln O it + a i + γ′ z it + ξ kt + u it .
Note that we choose to normalize on labor, as this makes it straightforward to test for constant returns by examining whether the coefficient on labor in equation (2) is significantly different from zero. In online Appendix C and Bloom, Sadun, and Van Reenen (2007) we consider the nonnormalized version (as in footnote 10) showing similar results.
Another implication of the idea that IT capital is complementary with specific types of management practices is that, ceteris paribus, firms with higher levels of O will have a greater demand for IT capital. We consider the IT intensity equation:12
(3) (c − l ) it = β O O it + φ′ w it + ς kt + e it ,
where w it are controls, ς kt are the industry-time shocks, e it is an error term, and we expect β O to be positive under complementarity of IT and O. It is worth not-ing that the estimates of equations (2) and (3) embody alternative identification
10 A more flexible translog production relationship would be
ln Q = ∑ J={O, M, L, K, C}
α J ln X J + ∑ J={O, M, L, K, C}
( ∑ Z={O, M, L, K, C}
α J Z ln X J ln X Z ),
where a superscript denotes a factor input so X L = L = labor, etc. The second term on the right-hand side of this equation contains the term ln( X O ) × ln( X C ), the interaction between management and IT, which we find to be crucial in the empirical work.
11 We also experimented with year-specific four-digit dummies and explicit measures of output prices (up to the five-digit level) which generated very similar results to our baseline model with year-specific three-digit industry dummies.
12 This is a first-order approximation to the nonlinear factor demand equation (B7) for IT in online Appendix B where the factor prices are common across firms in an industry for a given year. If σ > 0 then β O > 0.

173BLOOM ET AL.: AMERICANS dO IT BETTERVOL. 102 NO. 1
assumptions. For example, assume that there is exogenous variation in O i across firms, but no exogenous variation in IT capital. Complementarity will imply that the factor demand equation for IT is a positive, but deterministic, function of O i . Thus, equations of the form of (3) are useful to identify complementarity. By contrast, it will not be possible to identify the coefficient on IT capital (nor σ, the coefficient on its interaction with O i ) in the production function because IT capital has no firm-level variation conditional on O i . In practice, however, the production function coef-ficients can be identified from adjustment costs or shocks to IT capital arising from falling prices and optimization errors (see online Appendix C). But examining the IT demand equation is a useful cross check on these results.
A key idea in this article is that _
O USA > _ O MNE >
_ O dOM , where
_ O USA is the mean level
of management in US firms, _ O MNE the mean level in non-US multinationals and
_ O dOM ,
the mean level in domestic firms. We describe below two different empirical strategies to test this hypothesis, which vary according to the availability of data on O.
B. Testing the Model when O is Unobserved
Basic Production Function.—When O is unobserved, given its complementar-ity with IT, we expect to see systematic differences in the elasticity of output with respect to IT capital in equation (2) between US and other firms. In order to test this hypothesis we estimate the following production function for different sectors (e.g., IT intensive and non–IT intensive):13
(4) (q − l ) it = α C, dOM (c − l ) it + α K (k − l ) it + α M (m − l ) it
+ ( α C, dOM + α L + α M + α K − 1) l it
+ α C, USA [(c − l) × d USA ] it
+ α C, MNE [(c − l) × d MNE ] it + a i + δ USA d it USA
+ δ MNE d it
MNE + γ′ z it + ξ kt + u it ,
where d it USA denotes that the establishment is owned by a US firm in year t and
d it MNE denotes that the establishment is owned by a non-US multinational enterprise
(the omitted base is that the establishment belongs to a nonmultinational domestic firm denoted “dOM”).14 If our model is correct, then empirically when we estimate equation (4) we should find α C, USA > α C, MNE > α C, dOM , i.e., a greater productiv-ity effect of IT in US multinationals than in non-US multinationals or domestic
13 In the robustness section we estimate equation (4) separately across different two- and three-digit industries.14 We could not reject the hypothesis that UK multinationals had the same productivity and output elasticity of
IT capital as other non-US multinationals.

174 THE AMERICAN ECONOMIC REVIEW FEBRUARy 2012
establishments.15 Note that the final inequality ( α C, MNE > α C, dOM ) is less of a clean test as domestic firms may be quite different from multinationals on a number of dimensions, whereas non-US multinationals are a more credible “control group” for US multinationals. A related hypothesis is that US multinationals are more produc-tive than non-US multinationals and domestic firms, i.e. δ C, USA
+ α C, USA (c − l ) it > δ C, MNE
+ α C, MNE (c − l ) it > δ C, dOM + α C, dOM (c − l ) it . This has to be evaluated at
a particular level of IT intensity, but since the overall mean of ln(C/L) is close to zero, a test of the equality of the multinational dummies is presented at the base of every table.
Another implication of the idea that US firms have an advantage in the use of IT is that, ceteris paribus, they will have a greater demand for IT capital. Consequently, we estimate the IT intensity equation equivalent to equation (3):
(5) (c − l ) it = β USA d it USA + β MNE d it
MNE + φ′ w it + ς kt + e it ,
where w it are controls, ς kt the industry-time shocks, and e it is an error term. The hypothesis of interest is, of course, whether β USA
> β MNE > 0 with a focus on the
first inequality, β USA > β MNE
.Since the significance of the US × ln(C/L) interaction (the α C, USA coefficient in
equation (4)) may capture unobservable factors beyond managerial differences, we perform an extensive range of tests to check the robustness of our results. These are detailed below.
Subsample of Establishments that are Taken Over.—One concern with our empiri-cal strategy is that US firms may “cherry pick” the establishments with the highest IT productivity. This would generate a higher IT coefficient for American firms, but this would only be due to positive selection. To tackle this issue we focus on a subsample of UK establishments that have been taken over at some point in the sample period. Prior to the takeover we find no evidence of differential coefficients on IT in establish-ments subsequently targeted by US firms versus non-US firms. But after the takeover we find that establishments acquired by US firms have significantly higher IT produc-tivity than those taken over by other firms.
Unobserved Heterogeneity.—In all specifications, we choose a general structure of the error term that allows for arbitrary heteroskedasticity and autocorrelation over
15 A more general form of the production function is one where we allow all the factor inputs ( x it J ) to differ by
ownership status:
q it = ∑ J={M, L, K, C}
α J, dOM x it J + ∑
J={M, L, K, C}
α J, USA d it USA x it
J + ∑
J={M, L, K, C}
α J, MNE d it MNE x it
J + a i
+ δ USA d it USA + δ MNE d it
MNE + γ′ z it + ξ kt + u it .
Note that although we will estimate this equation in some specifications, empirically the interactions between the non-IT factor inputs and ownership status are not significantly different from zero. The one interaction that does stand out is between the US ownership dummy and IT capital: the coefficient on IT capital is significantly higher for US establishments than for other multinationals or domestic establishments. We also cannot reject the hypothesis that all ownership types have the same return to scale parameter so we generally impose this.

175BLOOM ET AL.: AMERICANS dO IT BETTERVOL. 102 NO. 1
time. But there could still be establishment-specific unobserved heterogeneity. So, we also generally include a full set of establishment-level fixed effects (the “within-groups” estimator). The fixed-effects estimators are more demanding, as they con-trol for unobservable omitted variables correlated with IT that generate an upward bias for the coefficient on IT capital.
One aspect of unobserved heterogeneity is establishment-specific prices that will not be fully controlled for by the fixed effects and the industry dummies interacted with time dummies (see Foster, Haltiwanger, and Syverson 2008). Empirically, the dependent variable in equation (4) is revenue, not physical units, so we are estimat-ing “revenue productivity” equations rather than physical productivity equations, and we should interpret the coefficients on the factor inputs as reflecting both the technological parameters and a mark-up term.
To investigate this, we will estimate the “revenue productivity function,” allow-ing for monopolistic competition following Klette and Griliches (1996) and De Loecker (2011). Essentially this implies including additional terms for four-digit output interacted by ownership type to the empirical analog of equation (4). Note, however, differential mark-ups for American firms cannot easily explain one of our findings that the coefficient on IT is significantly larger for US firms, but the other factor coefficients appear to be the same across multinationals types. If US firms are able to command a higher output price for IT capital, this is consistent with the idea that IT improves quality (rather than simply increasing output) by more for American multinationals than other multinationals. This higher IT-related quality would be reflected in a firm-specific higher mark-up for IT-intensive US firms. This is consistent with our theoretical story.
Endogeneity of the Factor Inputs.—We take several approaches to check the robustness of our results to the endogeneity issue, accepting that there is no “magic bullet” to this problem, which is still an active area of econometric research (see Ackerberg et al. 2008, for a survey). In particular, we present results using a version of the Olley-Pakes estimator (1996) allowing for multiple capital inputs, and the “System GMM” estimator of Blundell and Bond (1998, 2000). In both cases we find a much higher IT coefficient for US firms in the production function. We also pres-ent IT intensity equations derived from the first-order conditions of the model and find that US firms have significantly higher IT capital intensities than other firms, especially in the IT-intensive sectors.
Heterogeneity in the Coefficients by Industry.—We allow for considerable hetero-geneity by including fixed effects and industry effects interacted with time dummies. But the fact that the gap in US-EU productivity growth is so concentrated in the so-called “IT-intensive sectors” suggests breaking down the regression estimates along these lines. We follow exactly the same classification as Stiroh (2002) to divide our sample into those which intensively use IT versus the rest of the sample (he based these on the flow of IT services in total capital services). These are predominantly service sectors such as wholesale, retail, and business services but also include sev-eral manufacturing sectors such as printing and publishing (see online Table A1). We interpret this sectoral breakdown as indicating which sectors in Europe have the greatest potential (i.e., highest σ) to benefit from IT enabled innovations if firms are

176 THE AMERICAN ECONOMIC REVIEW FEBRUARy 2012
able to adopt the appropriate complementary organizational practices.16 Blanchard (2004) and Blanchard et al. (2002) give many examples of these from various in-depth case studies. One could argue, for example, whether or not Stiroh was correct in classifying retail in the IT-intensive sector, but this is beside the point—retail is a sector that had fast productivity growth in the United States post-1995, and not in Europe. Our hypothesis is that part of this difference was due to different management practices which enabled US retailers to efficiently exploit IT enabled innovations in retail.17 If that was the case, then estimating equation (4) by differ-ent industry sectors should reveal a much stronger US × ln(C/L) interaction in the “IT-intensive sectors” than in the other industries. We also go further, estimating the production functions separately by each two-digit sector, in particular breaking down the IT-intensive sector into subindustries such as retail and wholesale.
C. Testing the Model Using direct Measurement of Firm Management Practices
A more direct way to test whether US firms have higher levels of O (i.e., _ O USA
> _ O MNE ) is to use explicit measures of management. For this purpose, we collected
our own data on management practices based on the methodology in Bloom and Van Reenen (2007). We empirically measure O by an index of the “people management” in the firm which combines indicators of best practice in hiring, promotions, pay, retention, and removing underperformers (see below and online Appendix A). We focus on these people management aspects of firm organization because the econo-metric and case-study evidence suggest that these features are particularly important for IT. The successful deployment of IT requires substantial changes in the way that employees work, including the ability to decentralize decision making so employees can experiment. High outcomes on our people management scores will reflect this.18
We show that this index of people management is higher in US multinationals than in non-US multinationals (and domestic firms). In particular, US firms tend to be more aggressive in promoting and rewarding high performing workers and remov-ing underperforming workers.19 We combine the measures of people management with firm-level panel data from accounting information and an alternative source
16 We think this division is most appropriate as it does not rely on our subjective judgement. We consider other sectoral breakdowns such as using the industry level IT services share in Europe rather than the US and the IT to value added ratio. We obtain similar results from this. We also looked at a finer level of disaggregation by industry (such as splitting out retail and wholesale—see Section III).
17 Retailing has shifted from a low-tech industry focused on shifting boxes from producer to consumer to an industry whose main activity is trading information by matching goods to consumer demand on a near continuous basis, where IT is an integral part of this process.
18 For example, the organizational measure in Bresnahan, Brynjolfsson, and Hitt (2002) covers six measures which relate to the way that employees are managed (three questions on teamwork, two on decentralization over pace and methods of work, and one on employee involvement).
19 The econometric and case-study evidence suggest that these features of people management are particularly important for IT. The successful deployment of IT requires substantial changes in the way that employees work, which is highly intensive in people management. For example, Hunter et al. (2001) describe how IT radically changed the organization of US banks in the 1980s. The introduction of ATMs substantially reduced the need for tellers. At the same time PCs allowed staff to locate on the bank floor and directly sell customers mortgages, loans, and insurance, replacing bank managers as the primary sales channel for these products. IT also enabled regional managers to remotely monitor branches. This led to a huge reduction in branch-level management, an extensive realignment of job responsibilities, and major human-resources reorganization for senior bank managers. We dis-cuss in more detail the empirical measures in the online Data Section.

177BLOOM ET AL.: AMERICANS dO IT BETTERVOL. 102 NO. 1
of IT data described below. Using this new European firm-level panel database we estimate an augmented form of equation (4):
(6) (q − l ) it = α C, dOM (c − l ) it + α K (k − l ) it + α M (m − l ) it
+ σ [(c − l ) it × O i )] + α O ln O i
+ ( α C, dOM + α L + α K + α M − 1) l it
+ α C, USA [(c − l) × d USA ) ] it + α C, MNE [(c − l) × d MNE ] it
+ a i + δ USA d it USA + δ MNE d it
MNE + γ′ z it + ξ kt + u it .
If our hypothesis is correct that the higher coefficient on IT in the production function for US multinationals is due to their management practices, then we would predict that σ > 0 and that α C, USA , the coefficient on the interaction between IT intensity and the US multinational dummy, [(c − l) × d USA ) ] it , would be insignificant once we condi-tion on [(c − l ) it × O i )]. We will show that this is indeed the case in our European panel dataset. Note that this does not imply that management is unimportant without IT, nor that management matters only in certain sectors. Rather we are arguing these practices may be particularly important when combined with IT enabled innovations in the high productivity growth sectors of the “productivity miracle” period.
D. Models of Adjusting Management Practices
To what extent does O change over time at the firm level? There is limited empiri-cal evidence here, but many case studies suggest that management practices are difficult to change for incumbents. Microeconometric studies of responses to exter-nal shocks such as deregulation (e.g., Olley and Pakes 1996) or trade liberalization (e.g., Pavcnik 2002) suggest that much aggregate change in productivity is driven by reallocation, entry, and exit rather than simply incumbent plants increasing their productivity. Some theoretical models are built on the assumption that the efficiency of establishments is fixed at birth (e.g., Jovanovic 1982; Melitz 2003). So, in the short run, the assumption of quasi-fixed management practices seems plausible, and we exploit this in our estimation.
In the longer run, however, management practices are variable to some degree. Online Appendix B discusses some formal models where we allow management practices to be endogenously chosen by the firm. The first extension is to allow practices to be transferred when one firm takes over another firm. As with recent trade theory (e.g., Antras, Garicano, and Rossi-Hansberg 2008), we assume that a multinational can transfer its management practices overseas (subject to some cost). This generates predictions of a distinctive dynamic pattern for the productivity-IT relationship for establishments taken over by US multinationals, which we find in the takeover subsample (see Section IB).

178 THE AMERICAN ECONOMIC REVIEW FEBRUARy 2012
Online Appendix B also discusses allowing management practices to be adjust-able even for establishments that are not taken over (with and without adjustment costs) and shows that the key predictions are robust to this extension. We also dis-cuss how our modeling structure relates to Basu et al. (2003), who also consider a formal model of productivity dynamics when there is complementarity between IT and organization.20
II. Establishment-Level Panel Data from the UK Census
We use two main datasets in the article which are drawn from several sources. A full description of the datasets appears in online Appendix A. The first is an origi-nal UK establishment-level panel constructed from combining multiple datasets within the UK Census Bureau. We present results from this data in Section III. The second is a firm-level panel dataset across seven European countries. This com-bines our own survey of management practices, an establishment-level IT panel, and European firm-level accounting data. We describe the data in detail in Section IV and present the results in Section V. Both datasets are unbalanced panels—i.e., we do not condition on the subsample of firms that are alive throughout the time period.
The basis of the UK data is a panel of establishments covering all sectors of the UK private sector called the Annual Business Inquiry (ABI). It does not include financial services, which is a virtue given the difficulty of measuring productivity in these sectors, as the financial crisis has amply demonstrated. The ABI is similar in structure and content to the US Annual Survey of Manufacturing (ASM), and it contains detailed information on revenues, investment, employment, and material/intermediate inputs. However, unlike the US ASM, it also covers the nonmanufac-turing sector from the mid-1990s onward. This is important, because the majority of the sectors responsible for the US productivity acceleration are outside manu-facturing, such as retailing and wholesaling.21 We were also able to obtain access to several surveys of establishment-level IT expenditure conducted annually by the UK Census Bureau, which we then matched into the ABI using the establishment’s reference number. The dataset is unique in containing such a large sample of estab-lishment-level longitudinal information on IT and productivity.
We build IT capital stocks from IT expenditure flows using the perpetual inven-tory method and following Jorgenson (2001), keeping to US assumptions about depreciation rates and hedonic prices. We considered several experiments by changing our assumptions concerning the construction of the IT capital stock using alternative assumptions over depreciation rates and initial conditions.22
20 In Appendix B of Bloom, Sadun, and Van Reenen (2007) we show how IT adjustment costs could help ratio-nalize these TFP dynamics. See also Basu et al. (2003).
21 The new US Longitudinal Business Database includes services but does not have information on IT or non-IT investment (see Davis et al. 2006).
22 First, because there is uncertainty over the exact depreciation rate for IT capital, we experimented with a number of alternative values. Second, we do not know the initial IT capital stock for ongoing establishments the first time they enter the sample. Our baseline method is to impute the initial year’s IT stock using as a weight the establishment’s observed IT investment relative to the industry IT investment. An alternative is to assume that the plant’s share of the industry IT stock is the same as its share of employment in the industry. All methods gave similar results.

179BLOOM ET AL.: AMERICANS dO IT BETTERVOL. 102 NO. 1
Furthermore, we present results using an entirely different measure of IT usage based on the number of workers in the establishment who use computers (taken from a different survey, the E-Commerce Survey). Qualitatively similar results were obtained from all methods.
Our final dataset runs from 1995 through 2003, but there are many more observa-tions after 1999. After cleaning, we are left with 21,746 observations with positive values for all the factor inputs. The results are robust to conditioning on three con-tinuous time series observations per firm but are weaker if we start conditioning on many more observations as we induce increasing amounts of selection bias.
There are many small and medium-sized establishments in our sample23—the median establishment employs 238 workers. The establishments are larger than average for the UK economy because the sampling frames for the ABI and, in par-ticular, the IT surveys, deliberately oversample larger units. We did not find evidence that this causes any sample selection bias for a comparison of US multinationals to non-US multinationals.24 Average IT capital is about 1 percent of gross output at the unweighted mean (1.5 percent if weighted by size) or 3 percent of value added. These estimates are similar to the UK economywide means in Basu et al. (2003).
We have large numbers of multinational establishments in the sample. We can identify ownership using the Annual Foreign Direct Investment registry, which we also use to identify takeovers (from changes in ownership). About 8 percent of the establishments are US owned, 31 percent are owned by non-US multinationals, and 61 percent are purely domestic. Multinationals’ share of employment is even higher, and their share of output higher still. Table 1 presents some descriptive statistics
23 Online Table A2 sets out the basic summary statistics of the sample.24 See Section A8 in online Appendix A. There was some evidence that response rates were lower for small
domestic firms, however, suggesting we have a disproportionate number of the larger domestic firms. Since these larger establishments are likely to be more productive, it will be harder to reject our hypothesis that domestic establishments have lower productivity than multinationals. Nevertheless, we are more confident in the comparison within the multinational set (i.e., US versus non-US) than between multinationals and domestic establishments.
Table 1—UK Descriptive Statistics Broken Down by Multinational Status (normalized to 100 for the 3-digit SIC and year average)
EmploymentValue added per employee
Gross output per employee
Non-IT capital per employee
Materials per employee
IT capital per employee
US multinationals Mean 162.26 127.96 123.63 129.61 123.81 152.13 Standard deviation 297.58 163.17 104.81 133.91 123.35 234.41
Observations 569 569 569 569 569 569
Other multinationals Mean 148.58 113.71 115.22 120.65 116.02 119.58 Standard deviation 246.35 107.87 86.50 126.83 107.63 180.34
Observations 2,119 2,119 2,119 2,119 2,119 2,119
UK domestic Mean 68.78 89.86 89.69 86.33 89.29 83.95 Standard deviation 137.72 104.50 102.09 127.16 129.37 188.30
Observations 4,433 4,433 4,433 4,433 4,433 4,433
Note: These are 2001 values from our sample of 7,121 establishments in the UK data (ABI matched with IT data from QICE, BSCI, and FAR).

180 THE AMERICAN ECONOMIC REVIEW FEBRUARy 2012
for the different types of ownership, all relative to the three-digit industry aver-age. Labor productivity, as measured by output per employee, is 24 percent higher than average for US multinational establishments and 15 percent higher than aver-age for non-US multinational establishments. This suggests a 9 percentage point productivity premium for US establishments as compared to other multinationals. But US establishments also look systematically larger and more intensive in their non-labor input usage than other multinationals. US establishments have 14 percent-age points more employees, use about 8 percentage points more intermediate inputs per employee, and 9 percentage points more non-IT capital per employee than other multinationals. Most interesting for our purposes, though, the largest gap in factor intensity is for IT: US establishments are 32 percentage points more IT intensive than other multinationals. Hence, establishments owned by US multinationals are notably more IT intensive than other multinationals in the same industry.
III. Results from the UK Establishment Panel
A. Main Results
In Table 2 we examine the output elasticity of IT in the standard production function framework described in Section II (these are all different implementations of equation (4)). Column 1 estimates the basic production function, including dummy variables for whether or not the plant is owned by a US multinational (“USA”) or a non-US multi-national (“MNE”) with domestic establishments being the omitted base. US establish-ments are 7.1 percent more productive than UK domestic establishments, and non-US multinationals are 3.9 percent more productive. This 3.2 percent (= 0.0712 − 0.0392) difference between the US and non-US multinationals coefficients is also significant at the 5 percent level (p-value = 0.021) as reported at the base of the column.25
The second column of Table 2 includes the IT capital measure. This enters positively and significantly and reduces the coefficients on the ownership dum-mies. US establishments are more IT intensive than other establishments, but this accounts for only about 0.2 percentage points of the initial 3.2 percent pro-ductivity gap between US and non-US multinational establishments. Column 3 includes two interaction terms: one between IT capital and the US multinational dummy, and the other between IT capital and the non-US multinational dummy. These turn out to be very revealing. The interaction between the US dummy and IT capital is positive and significant at conventional levels. According to col-umn 3, doubling the IT stock is associated with an increase in productivity of 6.3 percent (= 0.0428 + 0.0202) for a US multinational but only 4.6 percent (= 0.0428 + 0.0036) for a non-US multinational. Note that non-US multination-als are not significantly different from domestic UK establishments in this respect: we cannot reject the possibility that the coefficients on IT are equal for domestic UK establishments and non-US multinationals. It is the US establishments that are distinctly different. The reported US × ln(C/L) interaction tests for significant
25 This implies that about two-thirds (6 percentage points of the 9 percentage point gap) of the observed labor productivity gap between US and other multinationals shown in Table 1 can be accounted for by our observables, such as greater non-IT capital intensity in the US establishments, but a significant gap remains.

181BLOOM ET AL.: AMERICANS dO IT BETTERVOL. 102 NO. 1
differences in the output-IT elasticity between US multinationals and UK domes-tic establishments. The key test, however, is whether the IT coefficient for US multinationals is significantly different from the IT coefficient for other multi-nationals. The row at the bottom of Table 3 reports the p-value of tests on the equality between the US × ln(C/L) and the MNE × ln(C/L) coefficient (i.e., H0: α C, USA = α C, MNE ), showing that the coefficients are significantly different at the 5 percent level.
To investigate the industries that appear to account for the major-ity of the productivity acceleration in the United States we split the sam-ple into “IT using intensive sectors” in column 4 and “Other sectors” in column 5. Sectors that use IT intensively account for most of the US pro-ductivity growth between 1995 and 2003. These include retail, wholesale, business services, and high-tech manufacturing like printing/publishing. The US interaction with IT capital is much stronger in the IT-using sectors, and it is not significantly different from zero in the other sectors (even though we
Table 2—Estimates of the UK Production Function Allowing the IT Coefficient to Differ by Ownership Status
ln (Q/L) ln (Q/L) ln (Q/L) ln (Q/L) ln (Q/L) ln(Q/L) ln (Q/L) ln (Q/L)Dependent variable: (1) (2) (3) (4) (5) (6) (7) (8)
SectorsAll
sectorsAll
sectorsAll
sectors
IT using intensive sectors
Other sectors
All sectors
IT using intensive sectors
Other sectors
Fixed effects NO NO NO NO NO YES YES YES USA × ln (C/L) 0.0202*** 0.0380*** 0.0120 0.0093 0.0368*** −0.0060USA ownership × IT capital per employee
(0.0072) (0.0128) (0.0084) (0.0085) (0.0144) (0.0098)
MNE × ln (C/L) 0.0036 −0.0011 0.0062 0.0010 −0.0003 0.0008Non-US multinational × IT capital per employee
(0.0045) (0.0062) (0.0060) (0.0042) (0.0064) (0.0053)
ln (C/L) 0.0457*** 0.0428*** 0.0373*** 0.0457*** 0.0152*** 0.0123** 0.0157***IT capital per employee (0.0024) (0.0029) (0.0038) (0.0039) (0.0030) (0.0051) (0.0036)ln (M/L) 0.5575*** 0.5474*** 0.5477*** 0.6216*** 0.5067*** 0.4031*** 0.5018*** 0.3606***Materials per employee (0.0084) (0.0083) (0.0083) (0.0142) (0.0104) (0.0178) (0.0279) (0.0210)ln (K/L) 0.1388*** 0.1268*** 0.1268*** 0.1106*** 0.1459*** 0.0900*** 0.1056*** 0.0666***Non-IT capital per employee (0.0071) (0.0068) (0.0068) (0.0093) (0.0092) (0.0159) (0.0228) (0.0209)ln (L) −0.0052* −0.0112*** −0.0111*** −0.0094** −0.0121*** −0.1986*** −0.1279*** −0.2466***Labor (0.0027) (0.0027) (0.0027) (0.0037) (0.0036) (0.0217) (0.0319) (0.0279)USA 0.0711*** 0.0641*** 0.0733*** 0.0440** 0.0892*** 0.0214 0.0451 −0.0070USA ownership (0.0140) (0.0135) (0.0144) (0.0213) (0.0189) (0.0224) (0.0366) (0.0242)MNE 0.0392*** 0.0339*** 0.0372*** 0.0149 0.0441*** 0.0081 0.0173 −0.0008Non-US multinational (0.0079) (0.0078) (0.0093) (0.0134) (0.0124) (0.0103) (0.0172) (0.0126)Observations 21,746 21,746 21,746 7,784 13,962 21,746 7,784 13,962
Test USA × ln (C/L) = MNE × ln (C/L), p-value
0.0320 0.0035 0.5272 0.3622 0.0094 0.5210
Test USA = MNE, p-value 0.0206 0.0232 0.0113 0.1755 0.0151 0.5545 0.4301 0.8145
Notes: The dependent variable in all columns is the log of gross output per employee. The time period is 1995–2003. The estimation method in all columns is OLS. Columns 6 to 8 include establishment-level fixed effects. Standard errors in brackets under coefficients in all columns are clustered by establishment (i.e., robust to heteroskedasticity and autocorrelation of unknown form). All columns include a full set of three-digit industry dummies interacted with a full set of time dummies and as additional controls: dummies for establishment age (interacted with a manu-facturing dummy), region, multiestablishment group (interacted with ownership type), and a dummy for IT survey. See online Table A1 for definition of IT using intensive sectors. “Test USA × ln(C/L) = MNE × ln(C/L)” is a test of whether the coefficient on USA × ln(C/L) is significantly different from the coefficient on MNE × ln(C/L), etc.
*** Significant at the 1 percent level. ** Significant at the 5 percent level. * Significant at the 10 percent level.
182 THE AMERICAN ECONOMIC REVIEW FEBRUARy 2012
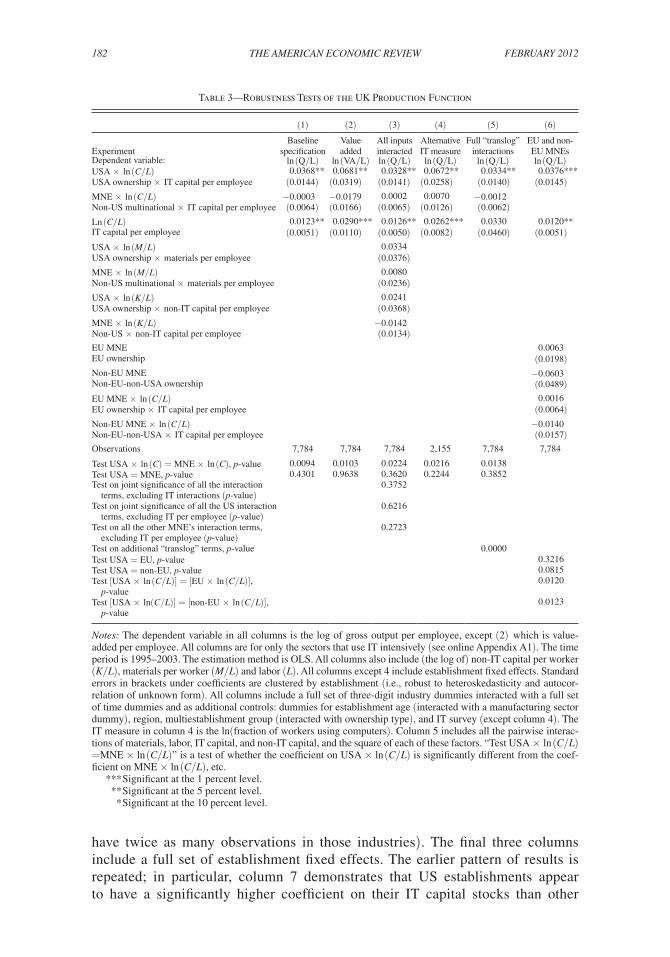
have twice as many observations in those industries). The final three columns include a full set of establishment fixed effects. The earlier pattern of results is repeated; in particular, column 7 demonstrates that US establishments appear to have a significantly higher coefficient on their IT capital stocks than other
Table 3—Robustness Tests of the UK Production Function
(1) (2) (3) (4) (5) (6)
ExperimentBaseline
specificationValue added
All inputs interacted
Alternative IT measure
Full “translog” interactions
EU and non-EU MNEs
Dependent variable: ln (Q/L) ln (VA/L) ln (Q/L) ln (Q/L) ln (Q/L) ln (Q/L)USA × ln (C/L) 0.0368** 0.0681** 0.0328** 0.0672** 0.0334** 0.0376***USA ownership × IT capital per employee (0.0144) (0.0319) (0.0141) (0.0258) (0.0140) (0.0145)MNE × ln (C/L) −0.0003 −0.0179 0.0002 0.0070 −0.0012Non-US multinational × IT capital per employee (0.0064) (0.0166) (0.0065) (0.0126) (0.0062)Ln (C/L) 0.0123** 0.0290*** 0.0126** 0.0262*** 0.0330 0.0120**IT capital per employee (0.0051) (0.0110) (0.0050) (0.0082) (0.0460) (0.0051)USA × ln (M/L) 0.0334USA ownership × materials per employee (0.0376)MNE × ln (M/L) 0.0080Non-US multinational × materials per employee (0.0236)USA × ln (K/L) 0.0241USA ownership × non-IT capital per employee (0.0368)MNE × ln (K/L) −0.0142Non-US × non-IT capital per employee (0.0134)EU MNE 0.0063EU ownership (0.0198)Non-EU MNE −0.0603Non-EU-non-USA ownership (0.0489)EU MNE × ln (C/L) 0.0016EU ownership × IT capital per employee (0.0064)Non-EU MNE × ln (C/L) −0.0140Non-EU-non-USA × IT capital per employee (0.0157)Observations 7,784 7,784 7,784 2,155 7,784 7,784
Test USA × ln (C) = MNE × ln (C), p-value 0.0094 0.0103 0.0224 0.0216 0.0138Test USA = MNE, p-value 0.4301 0.9638 0.3620 0.2244 0.3852Test on joint significance of all the interaction terms, excluding IT interactions (p-value)
0.3752
Test on joint significance of all the US interaction terms, excluding IT per employee (p-value)
0.6216
Test on all the other MNE’s interaction terms, excluding IT per employee (p-value)
0.2723
Test on additional “translog” terms, p-value 0.0000Test USA = EU, p-value 0.3216Test USA = non-EU, p-value 0.0815Test [USA × ln (C/L)] = [EU × ln (C/L)], p-value
0.0120
Test [USA × ln(C/L)] = [non-EU × ln (C/L)], p-value
0.0123
Notes: The dependent variable in all columns is the log of gross output per employee, except (2) which is value-added per employee. All columns are for only the sectors that use IT intensively (see online Appendix A1). The time period is 1995–2003. The estimation method is OLS. All columns also include (the log of) non-IT capital per worker (K/L), materials per worker (M/L) and labor (L). All columns except 4 include establishment fixed effects. Standard errors in brackets under coefficients are clustered by establishment (i.e., robust to heteroskedasticity and autocor-relation of unknown form). All columns include a full set of three-digit industry dummies interacted with a full set of time dummies and as additional controls: dummies for establishment age (interacted with a manufacturing sector dummy), region, multiestablishment group (interacted with ownership type), and IT survey (except column 4). The IT measure in column 4 is the ln(fraction of workers using computers). Column 5 includes all the pairwise interac-tions of materials, labor, IT capital, and non-IT capital, and the square of each of these factors. “Test USA × ln (C/L) =MNE × ln (C/L)” is a test of whether the coefficient on USA × ln (C/L) is significantly different from the coef-ficient on MNE × ln (C/L), etc.
*** Significant at the 1 percent level. ** Significant at the 5 percent level. * Significant at the 10 percent level.
183BLOOM ET AL.: AMERICANS dO IT BETTERVOL. 102 NO. 1
multinationals (and domestic firms).26 A doubling of the IT capital stock is associ-ated with 1.2 percent higher productivity for a domestic or non-US multinational, but 4.9 percent higher productivity for an establishment owned by a US multinational.27
Quantification.—The results in column 7 of Table 2 report a US coefficient on IT capital stock that is about 3.7 percent higher than for domestic firms or non-US multinationals. Given that IT intensity over the period of 1995 to 2004 was rising at about 22 percent per year in both the US and EU (Timmer and van Ark 2005), this implies a faster growth rate of labor productivity of US establishments in the IT-intensive sector of about 0.81 percentage points per year (= 0.22 × 3.7 percent). IT-intensive industries account for about half of aggregate employment so that this higher coefficient—if applied to the US economy—would imply that aggregate US labor productivity would rise at about 0.4 percent a year faster than in Europe (= 0.5 × 0.81) between 1995 and 2004. Since actual US labor productivity growth over this period was at least 0.8 percent higher than in Europe, this coefficient would suggest that about half of the US productivity miracle was related to the stronger relationship between productivity and IT in the US than in Europe.
B. Robustness Tests of the Production Function Results
Table 3 presents a series of tests showing the robustness of the main results—we focus on the fixed effects specification, which is the most demanding, and on the IT intensive sectors, which we have shown to be crucial in driving our result. The first column represents our baseline production function results from column 7 in Table 2. The results are similar if we use value-added-based specifications (see col-umn 2), so we stay with the more general specification using gross output as the dependent variable.
Transfer Pricing and Mark-Ups.—Since we are using multinational data, could transfer pricing be a reason for the results we obtain? If US firms shifted more of their accounting profits to the United Kingdom than other multinationals this could cause us to overestimate their productivity. But this would suggest that the factor coefficients on other inputs, particularly on materials, would also be systematically different for US establishments (see the discussion on establishment-specific prices above). To test this, column 3 estimates the production function with a full set of interactions between the US multinational dummy and all the factor inputs (and the non-US multinational dummy and all the factor inputs). None of the additional non-IT factor input interac-tions are individually significant, and the joint test at the bottom of the column of the additional interactions shows that they are jointly insignificant.28 We cannot reject the
26 We were also concerned that the IT interaction could be driven by the presence of labor in the denominator of both the dependent variable and the interaction, so we reestimated without normalizing any of the variables by labor. The US interaction with IT was still significantly different from the non-US multinational interaction with IT (p-value = 0.040). See also the results in Bloom, Sadun, and Van Reenen (2007).
27 At the overall sample mean of IT intensity, the implied productivity premium of US multinationals over non-US multinationals is 2.6 percent, but this rises to 5.0 percent when evaluated at the IT intensity of the average US multinational establishment.
28 For example, the joint test of the all the US interactions except the IT interaction has a p-value of 0.62.

184 THE AMERICAN ECONOMIC REVIEW FEBRUARy 2012
specification of equation (4) in column 1 of Table 3 as a good representation of the data versus the more general interactive models of column 3.29 This experiment also rejects the general idea that the productivity advantage of the United States is attribut-able to differential mark-ups, because then we would expect to see significantly differ-ent coefficients on all the factor inputs, not just on the IT variable.
As a second test of differential mark-ups we follow Klette and Griliches (1996) and De Loecker (2007) by controlling for four-digit industry output (disaggregated by ownership type). The estimated mark-ups (inverse elasticities of demand) were significantly higher for multinationals than domestic firms, but the US multination-als did not have significantly higher mark-ups than nonmultinationals (p-value of difference = 0.404). More importantly, the US IT coefficient remained significantly greater than the non-US multinational coefficient (p-value of difference = 0.010).30
Mismeasurement of IT Capital Stock?—One concern is that we may be underes-timating the true IT stock of US multinationals and this could generate a positive coefficient on the interaction term, because of greater measurement error for the US establishments. For example, US multinationals may pay lower prices for IT than non-US multinationals. To tackle this issue we turn to an alternative IT survey (the E-commerce Survey, see online Appendix A) that has data on the proportion of work-ers in the establishment who are using computers. This is a pure “stock” measure so it is unaffected by the initial conditions concern.31 In column 4 we replace our IT capital stock measure with a measure of the proportion of workers using a computer. Reassuringly, we still find a positive and significant coefficient on the US interaction with computer usage.
Functional Forms.—We tried including a much broader set of interactions and higher order terms (a “translog” specification), but these were generally individually insignificant. Column 5 shows the results of including all the pairwise interactions of materials, labor, IT capital, and non-IT capital and the square of each of these factors. The additional terms are jointly significant, but the key US interaction with the IT term remains basically unchanged (it falls slightly from 0.0368 in the baseline specification to 0.0334) and remains significant.
Stronger Selection Effects for US Multinationals because of Greater distance from the UK?—A further issue is that US firms may be more productive in the United Kingdom because the United States is geographically further away than the average non-US multinational (in our data most foreign multinationals are European if they are not American). This would generate a strong US selection bias if only
29 The p-value = 0.38 on this test. We also investigated whether the coefficients in the production function regressions differ by ownership type and sector (IT intensive or not). Running the six separate regressions (three ownership types by two sectors) we found that the F-test rejected at the 1 percent level the pooling of the US mul-tinationals with the other firms in the IT-intensive sectors. In the non–IT-intensive sectors, by contrast, the pooling restrictions were not rejected. Details are available from the authors on request.
30 See online Appendix Table A7.31 The initial conditions concern is that our estimate of the initial IT capital stock could be systematically incor-
rect for US multinationals relative to other multinationals. Our IT capital stock measure is theoretically more appropriate as it is built analogously to the non-IT stock and is comparable to best practice existing work. The E-Commerce Survey is available for three years (2001 to 2003), but the vast majority of the sample is observed only for one period, so we do not control for fixed effects.

185BLOOM ET AL.: AMERICANS dO IT BETTERVOL. 102 NO. 1
the most productive firms are able to overcome the greater fixed costs of distance. To test this we divide the non-US multinational dummy into European versus non-European firms. Under the distance argument, the non-European firms (e.g., Japanese multinationals) would have to be more productive to be able to set up greenfield establishments in the UK. According to column 6, however, the IT coef-ficient for the US multinationals is significantly higher than the IT coefficient for the non-European multinationals ( p-value = 0.012), as well as higher than the IT coefficient on the European multinationals. Again, it is the US multinationals that appear to be different.
Industry Heterogeneity.—We allow for industry heterogeneity by including fixed effects, industry dummies interacted with time dummies, and estimating separately for IT-using sectors. We also considered further heterogeneity of the IT coefficients by estimating the production functions separately by each two-digit and three-digit industry but did not find much further systematic heterogeneity.32 For example, in the two-digit estimations, 70 percent of the IT-using sectors had positive US × ln(C/L) interactions compared to only 42 percent of the “non-IT sectors.”33
One experiment was to estimate separately for the retail and wholesale sector, which have been large contributors to faster US productivity growth since 1995. For these 3,846 observations, the coefficient on the US × ln(C/L) interaction is 0.0413 with a standard error of 0.0208.34 In the remaining IT-intensive sectors out-side retail/wholesale the coefficient on the US × ln(C/L) interaction is 0.0347 with a standard error of 0.0181. Consequently, our results are not simply driven by the retail and wholesale sector.35
Controlling for Endogenous Inputs.—We are also concerned about the endoge-neity of the factor inputs attributable to unobserved transitory shocks. It is worth noting, however, that for endogeneity to rationalize our empirical results this would need to arise: (i) only for IT capital and not the other factor inputs; (ii) only for US multinationals; and (iii) only in the sectors responsible for the US productiv-ity miracle. Such a bias is possible, of course, but it is not obvious what alternative hypothesis would induce exactly these types of correlations.
Nevertheless, we reestimated the production functions using a version of the Olley-Pakes estimator (1996) that allows for two observable capital stocks, IT and non-IT (a straightforward extension of the basic model as discussed in Ackerberg et al. 2008).
32 We also estimated production functions separately for the IT-producing sectors (see Appendix Table A1). We could not reject that these could be pooled with the non–IT-intensive sectors when estimating the baseline specifica-tion ( p-value = 0.619).
33 Furthermore, the only significantly negative interactions between IT and the US multinational dummy were for some non-IT–using sectors. See online Appendix Table A8.
34 This is reassuring, as manipulating the transfer prices of intermediate inputs is more difficult in retail/whole-sale than in manufacturing, as intermediate inputs generally are purchased from independent suppliers.
35 See columns 1 and 2 of online Appendix Table A9. Another possible explanation for the apparently higher productivity of IT is that US multinationals may be disproportionately represented in specific industries in which the output elasticity of IT is particularly high. The interaction of IT capital with the US dummy then would capture omitted industry characteristics rather than a “true” effect linked to US ownership. To test for this, we include in our regression as an additional control the percentage of US multinationals in the specific four-digit industry and its interaction with IT. The interaction was positive but statistically insignificant, and the coefficient on the US × ln(C/L) interaction remains significant and largely unchanged with a coefficient (standard error) of 0.035 (0.015).

186 THE AMERICAN ECONOMIC REVIEW FEBRUARy 2012
We also used the “System GMM” estimator of Blundell and Bond (1998, 2000), which relies on a different set of identification assumptions to address the endogeneity of the factor inputs. These estimators are discussed in online Appendix C with the results presented in online Appendix Table C1. In both cases the main finding—that the out-put-elasticity of IT for US multinationals is much larger than the output-elasticity of IT for non-US multinationals—is robust, even though the coefficients are estimated less precisely than under our baseline within-groups estimates.36
Multiple Establishments Belonging to the Same Parent.—Some establishments may belong to the same multinational (or domestic) corporation, even at a point of time. As a robustness test we allowed the standard errors to be clustered at this higher level, with little difference to the results (e.g., the p-value on the test of the difference in the US × ln (C/L) interaction effects was 0.004). We also collapsed the data to this higher level of aggregation and reestimated, which again gave similar results.37 This is unsurprising, as 84 percent of the observations were single-firm establishments.
Unmeasured Software Inputs for US Establishments.—Could the US × ln (C/L) interaction reflect greater unmeasured software inputs for US establishments? Although this is certainly possible when we compare US multinationals with domestic establishments, it is less likely when we compare US multinationals with non-US multinationals because a priori there is no reason to believe that they have higher levels of software. It could, however, be a problem if US firms were glob-ally larger than other multinationals (software has a large fixed cost component so will be cheaper per unit for larger firms than smaller firms). To address this issue, we included a measure of the “global size” of the multinational parent of our estab-lishments. In our UK ABI data, US and non-US multinationals are similar in their median global employment size. As a more direct test, we introduce an explicit interaction term between the global size of the parent firm (defined as the log of the total number of worldwide employees) and IT capital in a specification identical to baseline specification in column 1 of Table 3. The interaction between global size and IT is insignificant, and the US interaction with IT remained significant (at the 1 percent level) and significantly different from the non-US multinational interac-tion with IT at the 10 percent level.38 So this does not appear to support a large role for software inputs driving the superior US productivity of IT.39 Nevertheless, to
36 The coefficient on the US × ln(C/L) interaction in the GMM system estimator is 0.0524 with a standard error of 0.0192, and this is significantly different from the non-US multinational interaction at the 10 percent level. The underlying theoretical model of Olley-Pakes does not easily allow us to simply include interactions, so we estimated the production function separately for the three ownership types (US multinationals, non-US multinationals and domestic UK establishments). The output-IT elasticity for US multinationals is twice as large as that of non-US multinationals.
37 For example, the coefficient (standard error) on the key US and IT interaction in column 1 of Table 3 was 0.0456 (0.183).
38 The global size variable was available only for a subsample of 2,205 observations (from the baseline sample of 7,784). When we reran the baseline specification on this smaller subsample, the US interaction with IT was 0.042 (instead of 0.037 in the baseline) and significant at the 1 percent level. When we included the global size term the point estimate rose to 0.043 (the point estimate on the global size × IT interaction was −0.0015, insignificant at conventional levels). See online Appendix Table A9, column 5.
39 We also used a measure of software capital constructed analogously to our main IT capital variable (see online Appendix A). In our data, software expenditure includes a charge for software acquired from the multinational’s

187BLOOM ET AL.: AMERICANS dO IT BETTERVOL. 102 NO. 1
address this issue more directly we will use explicit measures of management prac-tices in Section IV.
C. Estimation of the IT Intensity Equation
Table 4 examines the regressions where the dependent variable is IT intensity (the log of the IT capital stock per worker). Column 1 shows that IT intensity is signifi-cantly higher in US firms than in both domestic firms and non-US multinationals, as was already suggested by Table 1. Column 2 presents the same regression for the sectors that intensively use IT, and column 3 for the other sectors. The difference between US and non-US multinationals is significant at the 10 percent level for the IT-using industries, but insignificant for the other sectors. The last three col-umns repeat the specifications but include a longer list of controls. The same pattern emerges: US firms are more IT intensive, especially in the IT-using sectors.
Our estimates of the production function and IT demand equation generates the same finding—US firms appear to have some advantage in their use of IT as revealed both by the higher coefficient on IT in the production function and their greater usage of IT capital.
parent. The IT capital interaction is robust to the inclusion of this measure of software capital (and its interaction with ownership status). For example, when we added software capital to a specification identical to column 1 of Table 4 the standard IT interaction with the United States remained positive and significant. In the pan-European database in the next section we have explicit measures of software applications such as ERP and Databases and also find our results robust to using these measures of software.
Table 4—UK IT Intensity Equations
(1) (2) (3) (4) (5) (6)Dependent variable: ln (C/L) ln (C/L) ln (C/L) ln (C/L) ln (C/L) ln (C/L)Sectors
All sectors
IT-using intensive sectors
Other sectors
All sectors
IT-using intensive sectors
Other sectors
USA 0.2629*** 0.3393*** 0.2085*** 0.2406*** 0.3129*** 0.1927***USA ownership (0.0461) (0.0717) (0.0600) (0.0463) (0.0717) (0.0604)MNE 0.1632*** 0.2117*** 0.1332*** 0.1506*** 0.1939*** 0.1228***Non-US multinational (0.0287) (0.0440) (0.0375) (0.0291) (0.0452) (0.0380)Additional controls NO NO NO YES YES YES
Observations 21,746 7,784 13,962 21,746 7,784 13,962
Test USA = MNE, p-value 0.0310 0.0758 0.2108 0.0528 0.0970 0.2508
Notes: The dependent variable in all columns is the log of IT capital per employee. The time period is 1995–2003. The estimation method in all columns is OLS. Standard errors in brackets under coefficients in all columns are clustered by establishment (i.e., robust to heteroskedasticity and autocorrelation of unknown form). All columns include a full set of three-digit industry dummies interacted with a full set of time dummies and the log of gross out-put. Additional controls include dummies for establishment age (interacted with a manufacturing dummy), region, multi-establishment group (interacted with ownership type) and IT survey. See online Table A1 for definition of IT using intensive sectors. “Test USA = MNE” is test of whether the coefficient on USA is significantly different from the coefficient on MNE.
*** Significant at the 1 percent level. ** Significant at the 5 percent level. * Significant at the 10 percent level.

188 THE AMERICAN ECONOMIC REVIEW FEBRUARy 2012
D. US Multinational Takeovers of UK Establishments
One concern with our empirical strategy is that US firms may “cherry pick” the best UK establishments. In other words, it is not the US multinational’s management that generates a higher IT coefficient but rather that American firms systematically take over UK establishments with higher output-IT elasticities. To look at this issue, we examined the subsample of establishments that were, at some point in our sam-ple period, taken over by another firm in the IT-intensive sectors. We considered both US and non-US acquirers.40
Note that the identification assumption here is not that establishments that are taken over are the same as establishments that are not taken over. We condition on a sample of establishments that are all taken over at some point in the sample period. Thus, we assume that US multinationals are not systematically taking over establishments that are more productive in their use of IT than non-US multi-nationals. We can empirically test this assumption by examining the character-istics—such as the IT level, IT growth, and IT productivity—of establishments that will be taken over by US multinationals in the pretakeover period relative to non-US multinationals. We will show that there is no evidence of such positive selection.41
In column 1 of Table 5, we start by estimating our standard production functions for all establishments that are eventually taken over in their pretakeover years (this is labeled “before takeover”). The coefficients on the observable factor inputs are similar to those for the whole sample in column 2 of Table 3. Unlike the full sample, though, the US and non-US ownership dummies are insignificant, suggesting that the establishments taken over by multinationals are not ex ante more productive than those acquired by domestic UK firms.
In column 2 of Table 5 we interact the IT capital stock with a US and a non-US multinational ownership dummy, again estimated on the pretakeover data. We see that neither interaction is significant—that is, before establishments are taken over by US firms they do not have unusually high IT coefficients. So, US firms also do not appear to be selecting establishments that already provide higher IT productivity. In column 3 we estimate production function specifications identical to column 1 but on the posttakeover sample. The US multinational ownership coefficient has now moved from being negative in the pretakeover period to being positive, implying a change in productivity of 10.1 percent. By contrast the non-US multinational coef-ficient hardly changes (it actually falls by 2 percent).
40 We have a larger number of observations “posttakeover” than “pretakeover” as there was a takeover wave at the beginning of our sample in the late 1990s associated with the stock market bubble and high-tech boom. For these establishments, we necessarily have a lot more posttakeover information than pretakeover information. We drop takeovers which resulted in no change of ownership status (e.g., a US multinational taking over another US multinational subsidiary—see online Appendix A).
41 If US multinationals have higher IT productivity, why do we not observe some systematic selection of US firms taking over particular UK establishments? We show there is some weak evidence of negative selection which is consistent with a simple model (discussed below and in online Appendix B) of international transfer of manage-ment practices with fixed costs. It is likely this incentive is small in magnitude compared to the many other causes of international mergers and acquisitions. Statistically, the only variable which was significant in a takeover model was size: US multinationals were more likely to take over larger plants than non-US multinationals. IT and other factors were insignificant.

189BLOOM ET AL.: AMERICANS dO IT BETTERVOL. 102 NO. 1
Column 4 is the posttakeover version of column 2 where we allow the coef-ficient on IT to differ by ownership status. As in the earlier results of Table 2, the interaction between IT and US ownership is positive and significant at the 5 percent level (and is significantly different from the IT coefficient of non-US mul-tinationals at the 10 percent level). The test of the difference of the US × ln(C/L) interaction before and after the takeover is significant at the 10 percent level ( p-value = 0.097).42
The fifth column of Table 5 breaks down the post takeover period into the first year after the takeover and the subsequent years.43 The greater productivity of IT capital
42 We examined whether the US productivity advantage was because American firms were more aggressive at closing down less efficient establishments. Foster, Haltiwanger, and Krizan (2006) show that almost all aggregate US retail labor productivity growth in their sample is through this type of restructuring. In our data, although multi-nationals did close down more establishments post takeover than domestic takeovers, American firms did not seem to do this significantly more than other multinationals.
43 Note that throughout the table we drop the takeover year itself as we cannot determine the exact timing within the year when the takeover occurred.
Table 5—UK Production Functions before and after Takeovers
(1) (2) (3) (4) (5) (6)
SampleBefore
takeoverBefore
takeoverAfter
takeoverAfter
takeoverAfter
takeoverAfter
takeover(drop UK domestic acquirers)
Dependent variable: ln (output per employee)
ln (Q/L) ln (Q/L) ln (Q/L) ln (Q/L) ln (Q/L) ln (Q/L)
USA × ln (C/L) −0.0672 0.0541**USA takeover × IT capital per employee (0.0749) (0.0273)MNE × ln (C/L) −0.0432 0.0073Non-US multinational takeover × IT capital per employee
(0.0463) (0.0150)
USA −0.0661 −0.1055 0.0353 0.0619USA takeover (0.0663) (0.0863) (0.0402) (0.0461)MNE 0.0321 −0.0009 0.0117 0.0205Non-US multinational takeover (0.0565) (0.0710) (0.0298) (0.0342)USA × ln (C/L) one year after takeover 0.0192 0.0191
(0.0378) (0.0562)USA × ln (C/L) two and three years 0.0661** 0.1303** after takeover (0.0294) (0.0573)MNE × ln (C/L) one year after takeover −0.0091
(0.0197)MNE × ln (C/L) two and three years 0.0115 after takeover (0.0162)USA one year after takeover 0.0019 0.0014
(0.0542) (0.0716)USA two and three years after takeover 0.0934* 0.0942
(0.0485) (0.0856)MNE one year after takeover −0.0178
(0.0411)MNE two and three years 0.0327 after takeover (0.0361)
(Continued)

190 THE AMERICAN ECONOMIC REVIEW FEBRUARy 2012
in establishments taken over by US multinationals is revealed only two and three years after takeover (this interaction is significant at the 5 percent level, whereas the interaction in the first year is insignificant). This is consistent with the idea that US firms take some time to reorganize before obtaining higher productivity gains from IT. Domestic and other multinationals again reveal no pattern, with all the dummies and interactions remaining insignificant.
The sample in Table 5 includes some multinational firms that are taken over by domestic UK firms, so a stronger test is to drop these observations and consider only takeovers by multinational firms. In column 6 we replicate the specification of column 5 for this smaller sample and again find that establishments taken over by US multinationals have a significantly higher coefficient on IT capital after two or more years than nonmultinational takeovers.
Although there is no evidence that US firms are “cherry picking” the better UK establishments, it is noticeable that the point estimates in columns 1 and 2 are
Table 5—UK Production Functions before and after Takeovers (Continued)
(1) (2) (3) (4) (5) (6)
ln (C/L) 0.0744** 0.0935** 0.0395*** 0.0287*** 0.0288*** 0.0282IT capital per employee (0.0299) (0.0432) (0.0079) (0.0088) (0.0088) (0.0224)ln (M/L) 0.5486*** 0.5487*** 0.6871*** 0.6892*** 0.6886*** 0.7323***Materials per employee (0.0489) (0.0481) (0.0173) (0.0173) (0.0172) (0.0292)ln (K/L) 0.1759*** 0.1718*** 0.0350** 0.0350** 0.0353** −0.0108Non-IT capital per employee (0.0343) (0.0335) (0.0160) (0.0159) (0.0159) (0.0431)ln (L) −0.0185 −0.0215 −0.0117 −0.0111 −0.0112 −0.0358*Labor (0.0292) (0.0276) (0.0108) (0.0108) (0.0107) (0.0213)Observations 261 261 1,006 1,006 1,006 241
Test USA × ln (C/L) = MNE × ln (C/L), p-value
0.7037 0.0965
Test USA = MNE, p-value 0.1637 0.1773 0.5979 0.4056Test (USA one year) × ln (C/L) = 0.4948(MNE one year) × ln (C/L), p-valueTest (USA two plus years) × ln (C/L) = 0.0734(MNE two plus years) × ln (C/L), p-valueTest USA one year = MNE one year, p-value
0.7463
Test USA two plus years = MNE two plus years, p-value
0.2481
Notes: The sample is all establishments in the IT-intensive sectors (online Table A1) who were taken over at some point (omitted base is “domestic takeovers”—UK firms taking over another firm). We drop takeovers that do not result in a change of ownership category (e.g., US takeovers of US firms, non-US MNE takeovers of non-US MNEs and domestic takeovers of domestic firms). The dependent variable is the log of gross output per employee. The time period is 1995–2003. The estimation method is OLS. Standard errors in brackets under coefficients are clus-tered by establishment. A takeover is defined as a change in the establishment foreign ownership marker or—for UK domestic establishment—as a change in the enterprise group marker. The “before” period is defined as the interval between one and three years before the takeover takes place. The “after” period is defined as the interval between one and three years after the takeover takes place. The year in which the takeover takes place is excluded from the sample. All columns include a full set of two-digit industry dummies interacted with time dummies and as addi-tional controls: age, region dummies, a multiestablishment group dummy, an IT survey dummy, and controls for total takeover activity over the sample period. “Test USA × ln(C/L) =MNE × ln(C/L)” is a test of whether the coefficient on USA × ln(C/L) is significantly different from the coefficient on MNE × ln(C/L), etc.
*** Significant at the 1 percent level. ** Significant at the 5 percent level. * Significant at the 10 percent level.

191BLOOM ET AL.: AMERICANS dO IT BETTERVOL. 102 NO. 1
consistent with the idea that US firms may select the UK establishments that have lower IT coefficients in the production function, a form of negative selection. Although these point estimates are statistically insignificant, negative selection is consistent with a model where US firms are able to transfer their management prac-tices to the plants they acquire. If this transfer has an element of fixed disruption cost, US firms will have a greater incentive to reorganize firms after takeover and so will be more willing to purchase badly managed firms that they can “turn around.” Online Appendix B discusses an extension to our basic model that has this feature.
IV. Firm-level Panel Data from Seven European Countries
A disadvantage of the UK establishment-level panel is that it does not contain direct information on management practices. To remedy this we constructed a sec-ond panel dataset across seven European countries that combined three main sources: the Center for Economic Performance (CEP) management survey, the Harte-Hanks IT panel, and the Amadeus database of firm accounts.
The CEP Management Survey.—In the summer of 2006 a team of 51 interviewers ran a management practices survey from the CEP in London on 4,003 firms across Europe, the United States, and Asia. In this paper we use data on the 1,633 firms from seven European countries (France, Germany, Italy, Poland, Portugal, Sweden, and the United Kingdom). Online Appendix A provides a detailed data description for the full sample, but we summarize relevant details here.
The management data were collected using the survey tool developed in Bloom and Van Reenen (2007). This survey collects information on 18 questions grouped into four broad areas of management practices. In this paper we focus on the four people management questions covering promotions, rewards, hiring, and fixing/firing bad performers. The reason for this focus is because of the case study and econometric evidence that effective use of IT requires changing several elements of the way that people are managed. First, there is an abundance of empirical evi-dence that IT is on average skill-biased and requires shedding less skilled workers, hiring more skilled workers and retraining incumbent workers. In addition to this skill upgrading, IT-enabled improvements usually require more worker flexibility inside the firm, with workers taking on new roles. Second, some theoretical work emphasizes that when there is uncertainty over how best to use a new technology, giving more discretion to employees with higher-powered rewards may be a way to efficiently exploit their private knowledge. Prendergast (2002) emphasized that higher-powered incentives (such as output-based remuneration rather than flat-rate salary) may be more common when the principal has uncertainty over what tasks an agent should be performing. Daron Acemoglu et al. (2007) argue that delegation becomes more attractive when there is uncertainty about the best way to use a new technology.
To operationalize these ideas we focus on four questions designed to pick up man-agerial attention to fixing/firing underperformers, aggressively promoting higher effort/ability employees (rather than just using tenure), offering higher-powered incentives to employees, and management effort in hiring talent. The questions emphasize the management of human capital similarly to the questions used by
192 THE AMERICAN ECONOMIC REVIEW FEBRUARy 2012
Bresnahan, Brynjolfsson, and Hitt (2002). We also present robustness tests looking at other forms of management and organization (such as lean techniques, target-setting, and monitoring) and show that it is really people management that seems to matter for IT.
Firms are scored from a 1-to-5 scale on each question, with the scores then normal-ized into z-scores using the complete sample44 so the questions can be aggregated together. Although it is plausible that higher scores reflect “better” management, we do not assume this. All we claim is that American firms have, on average, dif-ferent people-management practices than European firms, and these types of prac-tices are complementary with IT. The survey uses a double-blind technique to try to obtain unbiased accurate responses to the management survey questions. One part of this double-blind methodology is that managers were not told they were being scored during the telephone survey. This enabled scoring to be based on the inter-viewer’s evaluation of the firm’s actual practices, rather than their aspirations, the manager’s perceptions, or the interviewer’s impressions. To run this “blind” scor-ing we introduced the exercise as an interview about management practices, using open questions (e.g., “can you tell me how you promote your employees?”), rather than closed questions (e.g., “do you promote your employees on tenure [yes/no]?”). Furthermore, these questions target actual practices and examples, with the discus-sion continuing until the interviewer can make an accurate assessment of the firm’s typical practices based on these examples. Bloom and Van Reenen (2007) present extensive tests of the reliability of these management measures and their robustness to many different forms of psychological bias.45
The Harte-Hanks Establishment-Level IT Panel.—We use an establishment-level IT data panel that comes from the European Ci Technology Database (CiDB) produced by the marketing and information company Harte-Hanks (H-H).46 The H-H data has been collected annually for over 160,000 establishments across 14 European countries since the mid-1990s. They target all firms with 100 or more employees, obtaining about a 45 percent response rate. We use the data only for the firms we matched to those in the management survey (i.e., in France, Germany, Italy, Poland, Portugal, Sweden, and the United Kingdom). Bresnahan, Brynjolfsson, and Hitt (2002); Brynjolfsson and Hitt (2003); and Forman, Goldfarb, and Greenstein (2009), among others, have also previously used the US H-H data, typically match-ing the US data to a subsample of large publicly quoted firms in Compustat.
The H-H survey contains detailed hardware, equipment, and software informa-tion at the establishment level. We focus on using computers (PCs plus laptops) per worker as our key measure of IT intensity because this is available for all the establishments and is measured in a comparable way across time and countries.
44 The scores are normalized to have a mean of zero and a standard deviation of one across the sample of 4,050 firms.
45 An alternative and complementary way to measure management is the “organizational capital” approach of Corrado, Hulten, and Sichel (2005). This follows the approach of cumulating inputs (such as managerial time) analogously to the way we construct the IT capital stock for the UK establishment data.
46 H-H is a multinational that collects IT data primarily for the purpose of selling on to large producers and sup-pliers of IT. The fact that H-H sells this data on to major firms like IBM and Cisco exerts a strong market discipline on the data quality. Major discrepancies in the data are likely to be rapidly picked up when H-H customers’ sales force place calls using the survey data.

193BLOOM ET AL.: AMERICANS dO IT BETTERVOL. 102 NO. 1
This computer-per-worker measure of IT has also been used by other papers in the microliterature on technological change (e.g., Beaudry, Doms, and Lewis 2006) and is highly correlated with other measures of IT use like the firm’s total IT capital stock per worker.47 We aggregate across establishments to form an estimate of the firm-level number of computers per worker.
The AMAdEUS Firm-Level Accounts Panel.—The AMADEUS accounts database provides company accounts on essentially the population of public and private firms in Europe. It has information for most companies on sales, employment, and fixed assets and has been used in previous papers to estimate production functions (e.g., Bloom and Van Reenen 2007, and de Loecker 2011). AMADEUS is constructed primarily from the mandatory national registries of companies.
The Combined European Firm-Level Panel dataset.—We match 720 of the firms in our management survey to the H-H data and accounting data. There appeared to be no sample selection bias in comparing US versus non-US multinationals (see online Appendix A). In particular, better managed firms and more productive firms were no more likely to be in the IT subsample compared to the rest of the CEP survey. We estimate our regressions over the years 1999 to 2006. Panel C of online Table A2 presents some descriptive statistics. As with the UK establishment data-base, compared to other multinationals, US multinationals are larger, more produc-tive, and have higher IT intensity. They also tend to have better people management scores (see next Section). We also have information on the proportion of college educated workers, which is also higher in the US than elsewhere. Consequently, as a robustness check for technology-skill complementarity, we control for human capital and its interaction with IT in some regressions.
V. Results from a Cross-European Firm-Level Panel
The results so far suggest that US-owned establishments have a higher elasticity of output with respect to IT, even after taking over existing establishments. This implies there may be an unobserved factor that is more abundant in American firms and that is complementary with IT. In this section we explore the idea that peo-ple-management practices constitute this previously unobserved factor and use our survey instrument to measure it. In the first subsection we discuss some descriptive statistics, and in the second subsection we offer some econometric results consistent with our key hypothesis.
A. People Management in US Firms Compared to Other Countries’
Before we present the results it is worth considering some supporting evidence on the different internal management of American firms compared to those in Europe and Asia. Remember that we choose these people-management aspects because the econometric and case-study evidence suggest that these features of the firm are
47 For example, in our establishment-level data a regression of ln(IT capital stock per employee) on the ln(proportion of employees using computers) gives a coefficient of 0.63.

194 THE AMERICAN ECONOMIC REVIEW FEBRUARy 2012
particularly important for effectively using IT, which frequently requires substantial changes in the way that employees work.
In Figure 3, panels A and B provide new evidence on the people-management scores of 4,050 firms in the United States, Asia, and Europe. In Figure 3 panel A, we see that firms based in the United States have much higher scores than firms in other countries—over half a standard deviation on average. In Figure 3 panel B we examine a subsample of the data, plotting the average people-management scores of subsidiaries located in our seven European countries by multinational origin.48 Interestingly, the affiliates of US multinationals in Europe tend to have much higher people-management scores than those of other countries. This is consistent with the idea that US firms are able to transfer some of their practices overseas to their sub-sidiary operations.49 Local labor market regulations influence people-management practices but do not completely determine them (Bloom et al. forthcoming). If they did, there would be no systematic difference in the management practices of US subsidiaries in Europe compared to other firms.
B. Results
Basic Results.—Table 6 contains the results from the European panel. In col-umns 1 to 6 we estimate the production function, and in the final two columns the
48 A multinational source country had to have at least 25 subsidiaries in the sample to be included in the graph.49 The high people-management ratings for some countries such as Germany may appear surprising given their
high degree of labor market regulation. This arises because the average scores for management practices as a whole in Germany are high (although they are relatively higher in operations). Bloom and Van Reenen (2007) relate this to a combination of relatively high skill levels and few primogeniture family firms.
−0.4 −0.2 0 0.2 0.4 0.6
USGermany
JapanPoland
UKFrance
SwedenChina
ItalyPortugal
IndiaGreece
Panel A. People-management z-scores,all firms by country of location
Panel B. People-management z-scores,multinationals by country of origin
−0.2 0 0.2 0.4 0.6
USGermany
France
SwitzerlandUK
DenmarkSwedenHollandFinland
Japan
Figure 3
Notes: In Figure 3, panels A and B, the “People-management z-score” is the average z-score score for the 4 man-agement practices on people management, covering “Managing human capital,” “Rewarding high performance,” “Removing poor performers,” and “Promoting high performers.” This is normalized to have a firm-level mean of zero standard deviation of 1. The sample in panel A is all 4,050 firms sorted according to country of location. The sample in panel B is the subset of 618 multinational subsidiaries located in France, Germany, Italy, Poland, Portugal, Sweden, and the United Kingdom, sorted accorded to country of origin and plotted only for origin coun-tries with at least 25 firms in the sample.

195BLOOM ET AL.: AMERICANS dO IT BETTERVOL. 102 NO. 1
IT intensity equation. Column 1 estimates a basic productivity equation controlling only for capital, labor, ownership status, and some basic controls (country dummies interacted with time dummies, three-digit industry dummies, and listing status). As with the UK establishment data, US multinational subsidiaries have higher mea-sured total factor productivity than other multinationals (and domestic firms). The data is consistent with constant returns to scale (i.e., the coefficient on labor is insig-nificant). The point estimates are much larger than for the establishment-level data because materials are not included as an explanatory variable, as this information
Table 6—European Firm-Level Panel Data with Direct Measures of Management
(1) (2) (3) (4) (5) (6) (7) (8)
Dependent variable ln (Q/L) ln (Q/L) ln (Q/L) ln (Q/L) ln (Q/L) ln (Q/L) ln (C/L) ln (C/L)Fixed effects NO NO NO NO YES YES NO NO
USA × ln (C/L) 0.1790** 0.0784 0.0518 0.0192USA ownership × computers per employee
(0.0733) (0.0720) (0.0713) (0.0785)
MNE × ln (C/L) −0.0263 −0.0235 0.0218 0.0235Non-US multinational × computers per employee
(0.0586) (0.0553) (0.0547) (0.0550)
People management 0.0271 0.0271 0.1268***(0.0219) (0.0219) (0.0353)
People management × ln (C/L) 0.1451*** 0.1404*** 0.1284* 0.0994*People management × computers per employee
(0.0331) (0.0344) (0.0773) (0.0581)
ln (K/L) 0.2401*** 0.1838*** 0.1782*** 0.1791*** 0.2347** 0.2316***Non IT capital per employee (0.0163) (0.0284) (0.0276) (0.0276) (0.0926) (0.0882)ln (L) −0.0182 0.0421 0.0421 0.0409 −0.2182 −0.2347Labor (0.0162) (0.0360) (0.0344) (0.0349) (0.2600) (0.2497)ln (C/L) 0.1256*** 0.1430*** 0.1463***−0.0493 −0.2282Computers per employee (0.031) (0.0284) (0.0303) (0.0596) (0.1738)USA 0.2548*** 0.0779 0.1111** 0.0837* 0.2601*** 0.2150***USA ownership (0.0438) (0.0481) (0.0446) (0.046) (0.0742) (0.0732)MNE 0.1909*** 0.1597*** 0.1604*** 0.1618*** 0.0492 0.0367Non-US multinational (0.0304) (0.0363) (0.0355) (0.0357) (0.0596) (0.0591)ln (degree) 0.0433** 0.0375** 0.0370** 0.0585** 0.0359Percentage employees with a college degree
(0.0183) (0.0184) (0.0184) (0.0293) (0.0296)
ln (degree) × ln (C/L) 0.0700Percentage employees with a college degree × computers per employee
(0.0484)
Observations 9,463 2,555 2,555 2,555 2,555 2,555 2,555 2,555
Test USA × ln (C/L) =MNE × ln (C/L), p-value 0.0189 0.2419 0.6360 0.9565Test USA = MNE, p-value 0.1789 0.1206 0.3094 0.1264 0.0095 0.0253
Notes: The dependent variable in columns 1 to 6 is the log of sales per employee, and in columns 7 and 8 is the log of computers per employee. The time period is 1999–2006, containing data from France, Germany, Italy, Poland, Portugal, Sweden, and the UK. The estimation method in all columns is OLS. Columns 5 and 6 include firm-level fixed effects. Standard errors in brackets under coefficients in all columns are clustered by firm (i.e., robust to het-eroskedasticity and autocorrelation of unknown form). All columns include a full set of three-digit industry dum-mies, country dummies interacted with a full set of time dummies, and a public listing indicator. Columns 2 to 8 are weighted by the survey coverage rate in the Harte-Hanks data, plus include a fifth-order Taylor expansion for the coverage ratio to control for any potential survey bias. “Test USA × ln(C/L) = MNE × ln(C/L)” is a test of whether the coefficient on USA × ln(C/L) is significantly different from the coefficient on MNE × ln(C/L), etc. 720 firms in all columns except column 1 where there are 1,828 firms.
*** Significant at the 1 percent level. ** Significant at the 5 percent level. * Significant at the 10 percent level.

196 THE AMERICAN ECONOMIC REVIEW FEBRUARy 2012
is not available in most company accounts. If materials are included, the point esti-mates on the subsample look similar to those for the establishment-level data.50
The second column of Table 6 uses the subsample of the data where we observe IT (i.e., the sample that overlaps with the H-H dataset). First we follow Table 2 and simply interact the ownership dummies with the IT measure. Exactly as we saw in the UK establishment panel, the coefficient on IT is significantly higher for US multinationals compared to non-US multinationals (and also to domestic firms). Column 3 replaces the multinational interactions with IT with our measures of peo-ple-management practices and their interaction with IT intensity. As the model pre-dicts, there is a positive and significant interaction between people management and IT intensity. Column 4 is the key column that includes both sets of interactions. We find that conditional on the management interactions, the coefficient on the interac-tion of IT and US ownership has dropped by more than half in magnitude and is now insignificantly different from zero. This is a key result: it suggests that the rea-son that we observed a higher coefficient on IT for US multinationals in column 2 was because: (i) they have higher levels of people management and (ii) there is a complementarity between IT and people management.51
Column 5 of Table 6 repeats the specification from column 4 but now includes a full set of firm fixed effects. The pattern is broadly the same, although the precision of the estimates has fallen, as would be expected when we rely solely on within-firm variation.52 The interaction between IT and people management remains significant at the 10 percent level, whereas the coefficient on the interaction between IT and US ownership is now only 0.052 and completely insignificant.
The final two columns of Table 6 present the regressions where IT intensity is the dependent variable. Column 7 shows that US firms are much more IT intensive than other multinationals and domestic firms. The people-management variable also has a strong and positive correlation with IT intensity as shown in the column 8. In this final column the US coefficient falls from 0.260 to 0.215, indicating that part of the higher IT intensity in US multinationals is due to the higher levels of people management.
Technology-Skill Complementarity.—There is a large literature showing that new technologies are complementary with skills (e.g., Autor, Katz, and Krueger 1998). If US firms have higher levels of skills, could this simply explain our results? Fortunately, the CEP management survey contained a measure of the proportion of employees with college degrees. We include this variable throughout Table 6 and find it to be consistently positive in the production function, as we would expect from basic human capital theory. In column 6 we also include the interaction of this human capital measure with IT. The IT × skills interaction enters with a positive but
50 For example, including materials in column 1 specification reduces the sample size to 4,577 observations. The coefficient (standard errors) on capital, US and non-US multinational ownership, and materials were 0.1106 (0.0135), 0.1128 (0.0421), 0.0574 (0.0220), and 0.5269 (0.0229), respectively. If computers are included in the regression, the coefficient (standard error) on this variable is 0.0254 (0.0185).
51 If we drop the interactions and ownership variable, the people management score in levels is positively and significantly related to productivity at the 10 percent level: a coefficient of 0.039 with a standard error of 0.023.
52 Note that the management and ownership status variables are cross-sectional, so the linear terms are absorbed by the fixed effects, even though their interaction with IT is still identified.

197BLOOM ET AL.: AMERICANS dO IT BETTERVOL. 102 NO. 1
insignificant coefficient, but the management interaction with IT remains robust to this extra interaction.
In the UK establishment panel the main control for labor quality is the inclusion of establishment-specific fixed effects, as we have no direct measure of skill. As an alternative, we assume that wages reflect marginal products of workers, so that con-ditioning on the average wage in the establishment is sufficient to control for human capital.53 When entered into a specification identical to that of column 1 of Table 3, the average wage is highly significant, and the interaction between the average wage and IT capital is positive and significant at the 10 percent level, consistent with tech-nology-skill complementarity. The interaction between the US dummy and average wages in the establishment is significant at the 10 percent level (a coefficient of 0.0119 and a standard error of 0.0063). Nevertheless, even in the presence of these skills controls, the coefficient on the US ownership and IT interaction remains sig-nificantly positive (0.0279 with a standard error of 0.0133). Consequently, we do not believe that our results reflect only technology-skill complementarity.
Other dimensions of Management Practice.—We argued on ex ante grounds that people management was likely to be an organizational feature complementary to IT. In Table C2 in the online Appendix we examine the interactions of IT with other aspects of management such as shopfloor operations, targets, monitoring, and com-binations across all 18 questions. Although these interactions are positive, none is significant or as strong as the people-management interaction.
Other Confounding Factors.—We checked for a large number of other con-founding factors that could be correlated with management practices and be driv-ing the results on the interaction with IT. These included average hours worked, union strength, and different types of software (e.g., Enterprise Resource Planning). Although these were systematically different in European and US firms, they did not change the IT and management results.
So in summary, the evidence from the European panel has the same basic pattern of results we saw in the UK establishment panel. US firms appear to have some advantage in IT. The new piece of information is that this advantage appears to be linked with their superior people-management practices that are complementary with IT, and this explains the higher coefficient on IT for US firms observed in the earlier tables.
VI. Conclusions
Why did Europe not follow the American IT-led productivity acceleration after 1995? We provide econometric evidence in line with the hypothesis that US people-management practices were a reason for this difference, as has been suggested by Blanchard (2004) and others. Using two rich micropanels, we show robust evidence
53 The problem is that wages may control for “too much,” as some proportion of wages may be related to non-human capital variables. For example, in many bargaining models, firms with high productivity will reward even homogenous workers with higher wages (for example, see Van Reenen 1996, on sharing the quasi-rents from new technologies).

198 THE AMERICAN ECONOMIC REVIEW FEBRUARy 2012
that US multinationals obtain higher productivity from IT than non-US multination-als (or domestic firms) in Europe. In the first dataset (of UK establishments), we found that the stronger association of IT with productivity for US firms is focused in the same “IT-using intensive” industries, such as retail and wholesale, that largely accounted for the US productivity acceleration since the mid-1990s. These results were robust to examining establishments that were taken over by other firms: US firms that took over establishments have significantly greater IT productivity rela-tive to non-US multinationals that took over statistically similar establishments. In the second dataset of firms across seven European countries, we showed that US firms had higher levels of people management (which was complementary with IT) and this accounted for the American advantage in IT use.
Taken together, this suggests that part of the IT-related productivity gains underly-ing the post-1995 period is related to the management practices of US firms rather than simple natural advantage (geographical, institutional, or otherwise) of being located in the US environment. US firms appear to have transplanted these manage-ment practices abroad, so that their overseas subsidiaries also enjoyed a productivity miracle. Back of the envelope calculations suggest that we can account for about half of the US-EU difference in productivity growth in the decade after 1995 using our estimates.
There remain many outstanding issues and research questions. First, understand-ing what are the determinants of the heterogeneous management practices between firms, industries, and nations is a vitally important question. Theory has outrun econometric work here, but this is currently an area of our active research.
A second and related question is why do US firms have different people-man-agement practices from European ones? One result from Bloom and Van Reenen (2007) is that US firms are “better managed” in general, because of the higher lev-els of competition in their domestic markets and the more limited involvement of primogeniture family firms (family-owned firms where, in the second generation or beyond, the CEO is the eldest son). But US firms also appear to be particularly strong on people management. One reason seems to be the greater supply of human capital in the United States. Across firms and industries the intensity of graduate-level employees is strongly associated with better people-management practices. Another reason seems to be lower levels of labor market regulation in the US: labor flexibility is significantly and positively correlated with better people-management across countries in our data.54
This management gap also appears to be a long standing phenomenon. For exam-ple, the Marshall Plan productivity mission of 1947 wrote: “Efficient management is the single most significant factor in the American productivity advantage.” This implies the US productivity surge was the effect of a rapid increase in IT intensity, driven by the accelerating fall in IT prices since 1995, which better suited US firms with their strong people-management skills. The rate of decline of IT prices appears to have slowed since 2005, and this may have brought an end to the US productiv-ity miracle. If this period is historically specific, then the wave of US takeovers
54 See Botero et al. (2004), Gust and Marquez (2004), and Bloom et al. (forthcoming) on cross-country labor regulations. In our data we find a cross-country correlation of 0.71 between the World Bank index of employment flexibility and people-management practices.

199BLOOM ET AL.: AMERICANS dO IT BETTERVOL. 102 NO. 1
in Europe may slow down or be reversed. Alternatively, if another wave of rapid technological change occurs, then our results suggest that US firms may once again enjoy a period of accelerated productivity growth as their people-management prac-tices allow them to better exploit new technologies.
A final remark is that our framework has implications for firms outside Europe. For example, we would expect to see the same US productivity advantage in IT for American multinationals in the US (or indeed Asia) compared to non-US multinationals.
Despite this need for further research we believe our article has made some inroads into one of the most puzzling episodes in the last two decades: the explanation of the US “productivity miracle.”
REFERENCES
Acemoglu, Daron, Philippe Aghion, Claire Lelarge, John Van Reenen, and Fabrizio Zilibotti. 2007. “Technology, Information, and the Decentralization of the Firm.” Quarterly Journal of Economics 122(4): 1759–99.
Ackerberg, Daniel, C. Lanier Benkard, Steven Berry and Ariel Pakes. 2008. “Econometric Tools for Analyzing Market Outcomes.” In Handbook of Econometrics vol. 6, edited by James Heckman and Edward Leamer, 4171–276. Amsterdam: Elsevier Science, North-Holland.
Antras, Pol, Luis Garicano, and Esteban Rossi-Hansberg. 2008. “Organizing Offshoring: Middle Managers and Communication Costs.” In The Organization of Firms in a Global Economy, edited by E. Helpman, D. Marin and T. Verdier, 311–39. Cambridge, MA: Harvard University Press.
Autor, David H., Lawrence F. Katz, and Alan B. Krueger. 1998. “Computing Inequality: Have Comput-ers Changed the Labor Market?” Quarterly Journal of Economics 113(4): 1169–1213.
Baker, George P., and Thomas N. Hubbard. 2004. “Contractibility and Asset Ownership: On-Board Computers and Governance in U.S. Trucking.” Quarterly Journal of Economics 119(4): 1443–79.
Basu, Susanto, John G. Fernald, Nicholas Oulton, and Sylaja Srinivasan. 2003. “The Case of the Miss-ing Productivty Growth: Or, Does Information Technology Explain why Productivity Accelerated in the US but not the UK?” National Bureau of Economic Research Working Paper 10010.
Beaudry, Paul, Mark Doms, and Ethan Lewis. 2006. “Endogenous Skill Bias in Technology Adop-tion: City-Level Evidence from the IT Revolution.” National Bureau of Economic Research Work-ing Paper 12521.
Benfratello, Luigi, and Alessandro Sembenelli. 2006. “Foreign Ownership and Productivity: Is the Direction of Causality So Obvious?” International Journal of Industrial Organization 24(4): 733–51.
Blanchard, Olivier. 2004. “The Economic Future of Europe.” Journal of Economic Perspectives 18(4): 3–26.
Blanchard, Olivier, Martin Baily, Hans Gersbach, Monika Schnitzer, and Jean Tirole. 2002. “Reach-ing Higher Productivity Growth in France and Germany, Sector case: Automotive.” Paris: McKin-sey Global Institute.
Bloom, Nicholas, Raffaella Sadun, and John Van Reenen. 2007. “Americans Do I.T. Better: US Mul-tinationals and the Productivity Miracle.” National Bureau of Economic Research Working Paper 13085.
Bloom, Nicholas, Raffaella Sadun, and John Van Reenen. 2012. Americans Do IT Better: US Mul-tinationals and the Productivity Miracle: Dataset. American Economic Review. http://dx.doi.org/10.1257/aer.102.1.167.
Bloom, Nicholas, Christos Genakas, Raffaella Sadun, and John Van Reenen. Forthcoming. “Manage-ment Practices across Firms and Countries.” Academy of Management Perspectives.
Bloom, Nicholas, and John Van Reenen. 2007. “Measuring and Explaining Management Practices across Firms and Countries.” Quarterly Journal of Economics 122(4): 1351–1408.
Blundell, Richard, and Stephen Bond. 1998. “Initial Conditions and Moment Restrictions in Dynamic Panel Data Models.” Journal of Econometrics 87(1): 115–43.
Blundell, Richard, and Stephen Bond. 2000. “GMM Estimation with Persistent Panel Data: An Appli-cation to Production Functions.” Econometric Reviews 19(3): 321–40.
Botero, Juan C., Simeon Djankov, Rafael La Porta, Florencio Lopez-de-Silanes, and Andrei Shleifer. 2004. “The Regulation of Labor.” Quarterly Journal of Economics 119(4): 1339–82.

200 THE AMERICAN ECONOMIC REVIEW FEBRUARy 2012
Bresnahan, Timothy F., Erik Brynjolfsson, and Lorin M. Hitt. 2002. “Information Technology, Work-place Organization, and the Demand for Skilled Labor: Firm-Level Evidence.” Quarterly Journal of Economics 117(1): 339–76.
Brynjolfsson, Erik, and Lorin M. Hitt. 2003. “Computing Productivity: Firm-Level Evidence.” Review of Economics and Statistics 85(4): 793–808.
Burstein, Ariel T., and Alexander Monge-Naranjo. 2009. “Foreign Know-How, Firm Control, and the Income of Developing Countries.” Quarterly Journal of Economics 124(1): 149–95.
Caroli, Eve, and John Van Reenen. 2001. “Skill-Biased Organizational Change? Evidence from a Panel of British and French Establishments.” Quarterly Journal of Economics 116(4): 1449–92.
Conference Board. 2007. “Total Economy Database (tm).” http://www.conferenceboard.org/data/economydatabase/ (accessed March, 2007).
Corrado, Carol, Charles Hulten, and Daniel Sichel. 2005.” Measuring Capital and Technology: An Expanded Framework.” In Measuring Capital in the New Economy, edited by C. Corrado, J. Haltiwanger and D. Sichel, 11–41. National Bureau of Economic Research Studies in Income and Wealth, vol. 65. Chicago: University of Chicago Press.
Crespi, Gustavo, Chiara Criscuolo, and Jonathan Haskel. 2007. “Information Technology, Organ-isational Change and Productivity.” Centre for Economic Policy Research Discussion Paper 6105.
Criscuolo, Chiara, and Ralf Martin. 2009. “Multinationals and U.S. Productivity Leadership: Evi-dence from Great Britain.” Review of Economics and Statistics 91(2): 263–81.
Davis, Steven J., John Haltiwanger, Ron Jarmin, and Javier Miranda. 2006. “Volatility and Disper-sion in Business Growth Rates: Publicly Traded versus Privately Held Firms.” In NBER Macroeco-nomics Annual 2006, edited by D. Acemoglu, K. Rogoff and M. Woodford, 107–56. Cambridge, MA: MIT Press.
Doms, Mark E., and J. Bradford Jensen. 1998. “Comparing Wages, Skills, and Productivity between Domestically and Foreign-Owned Manufacturing Establishments in the United States.” In Geogra-phy and Ownership as Bases for Economic Accounting, edited by R. E. Baldwin, R. E. Lipsey and J. D. Richardson, 235–55. National Bureau of Economic Research Studies in Income and Wealth, vol. 59. Chicago: University of Chicago Press.
Forman, Chris, Avi Goldfarb, and Shane Greenstein. 2009. “The Internet and Local Wages: Conver-gence or Divergence?” National Bureau of Economic Research Working Paper 14750.
Foster, Lucia, John Haltiwanger, and C. J. Krizan. 2006. “Market Selection, Reallocation, and Restruc-turing in the U.S. Retail Trade Sector in the 1990s.” Review of Economics and Statistics 88(4): 748–58.
Foster, Lucia, John Haltiwanger, and Chad Syverson. 2008. “Reallocation, Firm Turnover, and Effi-ciency: Selection on Productivity or Profitability?” American Economic Review 98(1): 394–425.
Gordon, Robert J. “Revisiting U. S. Productivity Growth over the Past Century with a View of the Future.” National Bureau of Economic Research Working Paper 15834.
Gust, Christopher, and Jaime Marquez. 2004. “International Comparisons of Productivity Growth: The Role of Information Technology and Regulatory Practices.” Labour Economics 11(1): 33–58.
Haltiwanger, John, Ron Jarmin, and Thorsten Schank. 2003. “Productivity, Investment in ICT and Market Experimentation: Micro Evidence from Germany and the U.S.” US Census, Economic Stud-ies, 2003.
Helpman, Elhanan, Marc J. Melitz, and Stephen R. Yeaple. 2004. “Export versus FDI with Heteroge-neous Firms.” American Economic Review 94(1): 300–316.
Hunter, Larry W., Annette Bernhardt, Katherine L. Hughes, and Eva Skuratowicz. 2001. “It’s Not Just the ATMs: Technology, Firm Strategies, Jobs, and Earnings in Retail Banking.” Industrial and Labor Relations Review 54(2): 402–24.
Inklaar, Robert, Marcel P. Timmer, and Bart van Ark. 2008. “Market Services Productivity across Europe and the US.” Economic Policy (53): 139–71: 139–94.
Jorgenson, Dale W. 2001. “Information Technology and the U.S. Economy.” American Economic Review 91(1): 1–32.
Jorgenson, Dale W., Mun S. Ho, and Kevin J. Stiroh. 2008. “A Retrospective Look at the U.S. Produc-tivity Growth Resurgence.” Journal of Economic Perspectives 22(1): 3–24.
Jovanovic, Boyan. 1982. “Selection and the Evolution of Industry.” Econometrica 50(3): 649–70.Klette, Tor Jakob, and Zvi Griliches. 1996. “The Inconsistency of Common Scale Estimators When
Output Prices Are Unobserved and Endogenous.” Journal of Applied Econometrics 11(4): 343–61.Loecker, Jan De. 2011. “Product Differentiation, Multi-product Firms and Estimating the Effect of
Trade Liberalization on Productivity.” Econometrica 79(5): 1407–51.McGrattan, Ellen R., and Edward C. Prescott. 2008. “Technology Capital and the U.S. Current
Account.” Federal Reserve Bank of Minneapolis Working Paper 406.

201BLOOM ET AL.: AMERICANS dO IT BETTERVOL. 102 NO. 1
Melitz, Marc J. 2003. “The Impact of Trade on Intra-industry Reallocations and Aggregate Industry Productivity.” Econometrica 71(6): 1695–1725.
Oliner, Stephen D., and Daniel E. Sichel. 2000. “The Resurgence of Growth in the Late 1990s: Is Infor-mation Technology the Story?” Journal of Economic Perspectives 14(4): 3–22.
Olley, G. Steven, and Ariel Pakes. 1996. “The Dynamics of Productivity in the Telecommunications Equipment Industry.” Econometrica 64(6): 1263–97.
O’Mahony, Mary and Bart van Ark. 2003. “European Union Productivity and Competitiveness: An Industry Perspective. Can Europe Resume the Catching-up Process?” Luxembourg: Office for Offi-cial Publications of the European Communities.
Pavcnik, Nina. 2002. “Trade Liberalization, Exit, and Productivity Improvement: Evidence from Chil-ean Plants.” Review of Economic Studies 69(1): 245–76.
Prendergast, Canice. 2002. “The Tenuous Trade-Off between Risk and Incentives.” Journal of Politi-cal Economy 110(5): 1071–1102.
Stiroh, Kevin. 2002. “Information Technology and the U.S. Productivity Revival: What Do the Indus-try Data Say?” American Economic Review 92(5): 1559–76.
Stiroh, Kevin. 2004. “Reassessing the Role of IT in the Production Function: A Meta Analysis.” Unpublished.
Timmer, Marcel P., and Bart van Ark. 2005. “Does Information and Communication Technology Drive EU-US Productivity Growth Differentials?” Oxford Economic Papers 57(4): 693–716.
Timmer, Marcel P., Gerard Ypma, and Bart van Ark. 2003. “IT in the European Union: Driving Pro-ductivity Divergence?” Gronigen Growth and Development Centre Research Memorandum GD–67, Appendix Tables. http://www.ggdc.net/databases/ted_growth.htm (accessed March 2007).
van Ark, Bart, Mary O’Mahony, and Marcel P. Timmer. 2008. “The Productivity Gap between Europe and the United States: Trends and Causes.” Journal of Economic Perspectives 22(1): 25–44.
Van Reenen, John. 1996. “The Creation and Capture of Rents: Wages and Innovation in a Panel of U.K. Companies.” Quarterly Journal of Economics 111(1): 195–226.