Embed Size (px)
Citation preview

American Water Works Association2005 Membrane Technology Conference
Developing an Experimental Protocol for Evaluating Low-
pressure Desalting Membranes for Seawater Desalination
Tai J. Tseng, Robert C. Cheng, Diem X. Vuong, and Kevin L. WattierLong Beach Water Department
March 7, 2005
2MemTech.ppt Long Beach Water Department
Presentation Outline
Long Beach Overview
Research Background
Research Goals/Approach
Results
Conclusion

3MemTech.ppt Long Beach Water Department
Presentation Outline
Long Beach Overview
Research Background
Research Goals/Approach
Results
Conclusion
4MemTech.ppt Long Beach Water Department
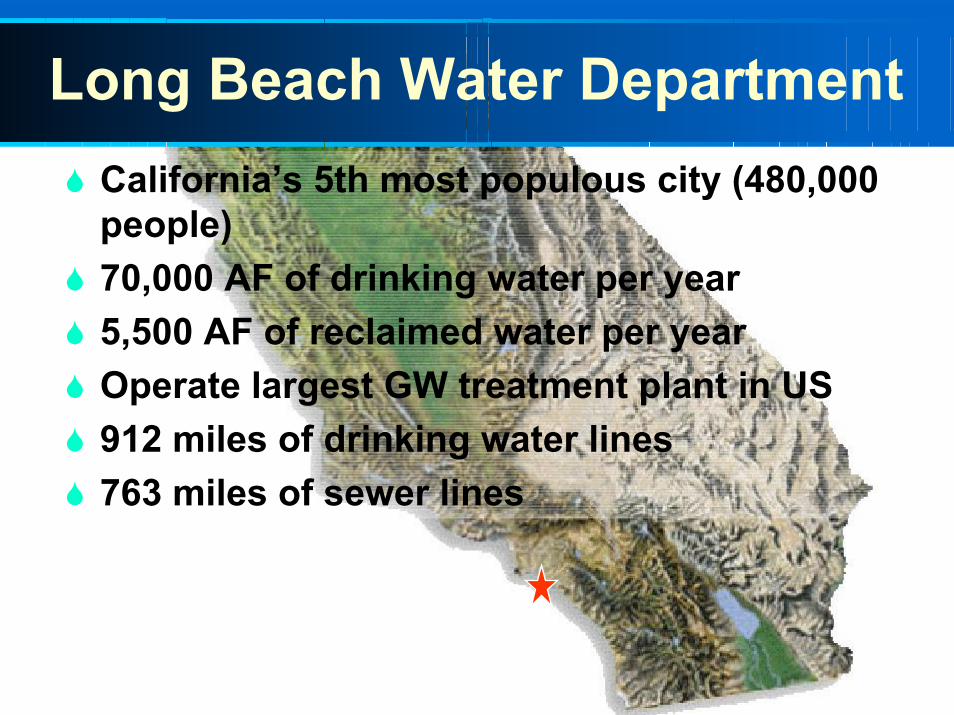
Long Beach Water DepartmentCalifornia’s 5th most populous city (480,000 people)70,000 AF of drinking water per year5,500 AF of reclaimed water per yearOperate largest GW treatment plant in US912 miles of drinking water lines763 miles of sewer lines

5MemTech.ppt Long Beach Water Department
Long Beach Water Department
80%: Drinking Water-46% LB Groundwater-54% Imported
14%: Conservation
6%: Recycled Water

6MemTech.ppt Long Beach Water Department
Los Angeles Aqueduct:~37% reduction
CaliforniaAqueduct:
~No Increase
Colorado River Aqueduct: ~50% reduction
…communities must produce
more water locallyto manage new
limits on imports and growth in
southern California’s population
and economy.
Imported Water Supply
7MemTech.ppt Long Beach Water Department
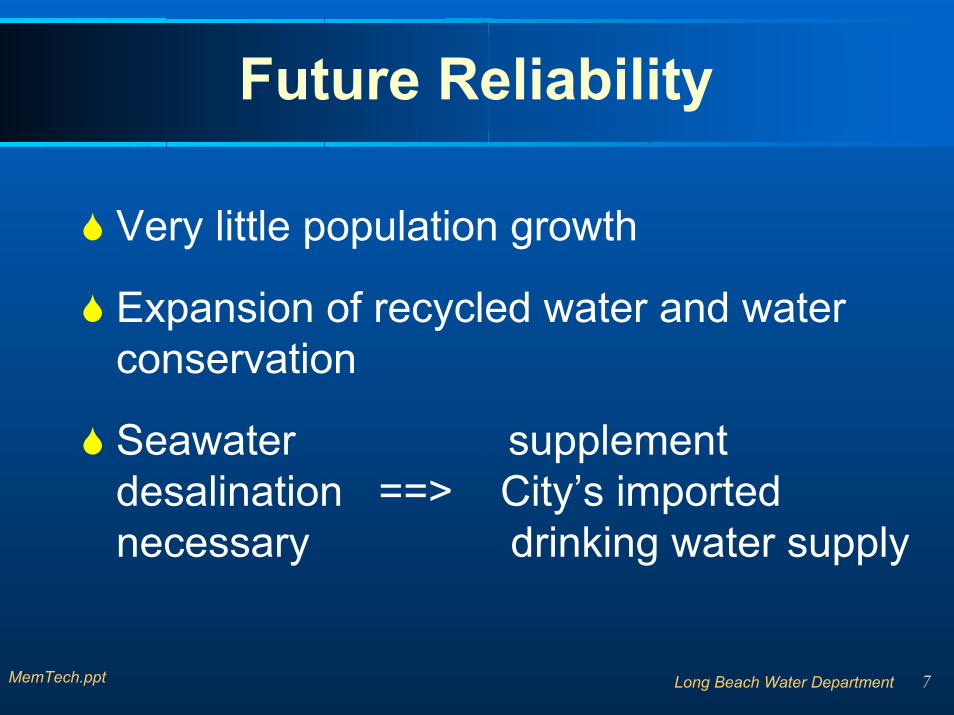
Future Reliability
Very little population growth
Expansion of recycled water and water conservation
Seawater supplement desalination ==> City’s imported necessary drinking water supply

8MemTech.ppt Long Beach Water Department
Presentation Outline
Long Beach Overview
Research Background
Research Goals/Approach
Results
Conclusion

9MemTech.ppt Long Beach Water Department
“Traditional” RO Process
Uses pressures in excess of 800 psiEnergy intensiveHigh-pressure materials required ⇒high capital costs“Traditional” seawater desalination method cost prohibitive
10MemTech.ppt Long Beach Water Department
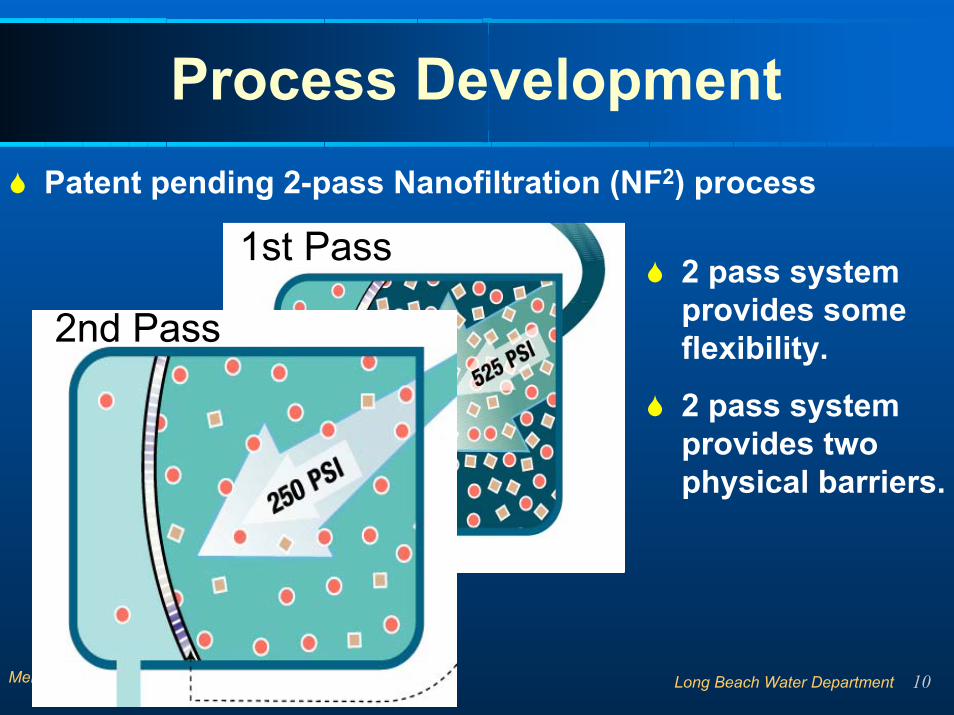
Process DevelopmentPatent pending 2-pass Nanofiltration (NF2) process
1st Pass
2nd Pass2 pass system provides some flexibility.
2 pass system provides two physical barriers.

11MemTech.ppt Long Beach Water Department
Preliminary Results
Theo
retic
al P
ower
(KW
/100
0 ga
llons
)
0
100
200
300
400
500
600
700
800
Arr
ay 1
Arr
ay 2
Arr
ay 3
Arr
ay 4
Arr
ay 5
Arr
ay 6
Arr
ay 7
Arr
ay 8
Arr
ay 9
TDS
(mg/
L)
5.0
7.0
9.0
11.0
13.0
15.0
17.0
19.0
21.050%ile TDS 50%ile PowerNot a lot of
literature. 15kW/kgal is the baseline.
Early results showed calculated power vary from 17 to 13 kW/kgals
12MemTech.ppt Long Beach Water Department
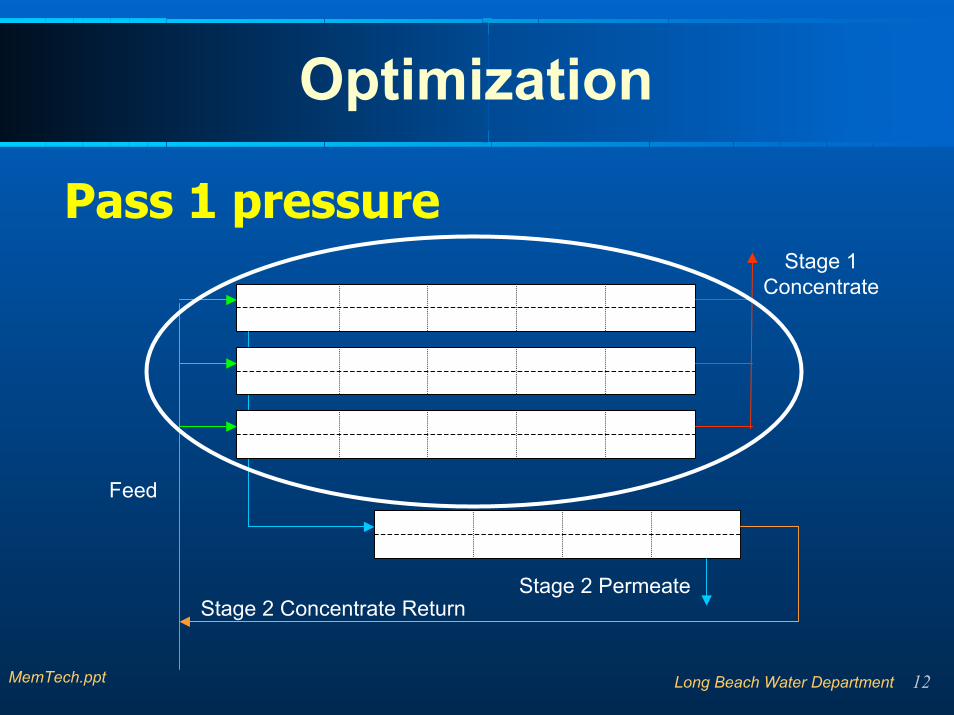
Optimization
Pass 1 pressureStage 1
Concentrate
Feed
Stage 2 PermeateStage 2 Concentrate Return

13MemTech.ppt Long Beach Water Department
Presentation Outline
Long Beach Overview
Research Background
Research Goals/Approach
Results
Conclusion

14MemTech.ppt Long Beach Water Department
Research Goals/Approach
Develop improved understanding of factors to optimize
NF membrane performance as a function of:Temperature
Pressure
Loading rate
Develop a roadmap to membrane optimization and selection
15MemTech.ppt Long Beach Water Department
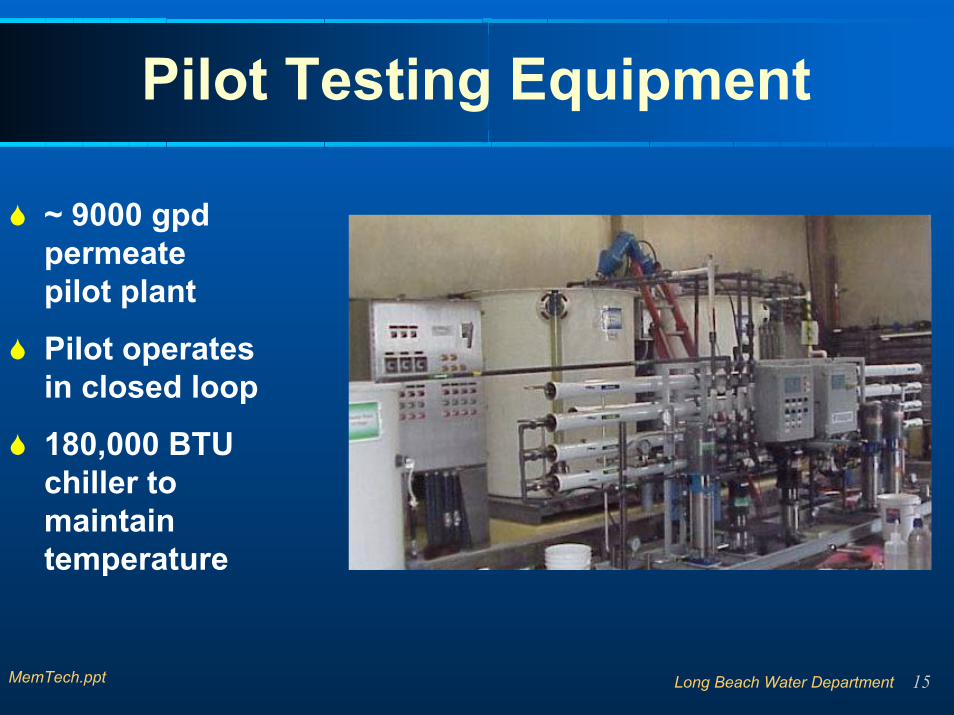
Pilot Testing Equipment
~ 9000 gpd permeate pilot plant
Pilot operates in closed loop
180,000 BTU chiller to maintain temperature

16MemTech.ppt Long Beach Water Department
Membranes Tested
m g/L M in. Rej. m g/L M in. Rej.F ilm Tec NF90 P A 80 1,850 2,000 95.0% 70Trisep TS 80 P A 81 2,000 2,000 97.0% 100Trisep1 X20 P A 81 2,000 2,000 99.0% 100S aehan NE 90 P A 85 1,900 2000 98.5% 75S aehan2 NE 90 V .2 P A 85
M anufac turer Tes t ConditionGeneral Inform ationP roduc t
F low (gpd)Tes t P
(ps i)M gS O 4 NaClM anufac turer M odel M at'l
A rea (ft2)
The membrane tested had relatively similar rejection characteristics

17MemTech.ppt Long Beach Water Department
Membrane Performance
0
5
10
15
20
25
30
300 350 400 450 500 550 600
Feed Pressure (psi)
Perm
eate
Con
duct
ivity
(mS)
Membrane 1 Membrane 2Although manufacture specification were relatively similar, the water quality results can be significantly different

18MemTech.ppt Long Beach Water Department
Presentation Outline
Long Beach Overview
Research Background
Research Goals/Approach
Results
Conclusion
19MemTech.ppt Long Beach Water Department
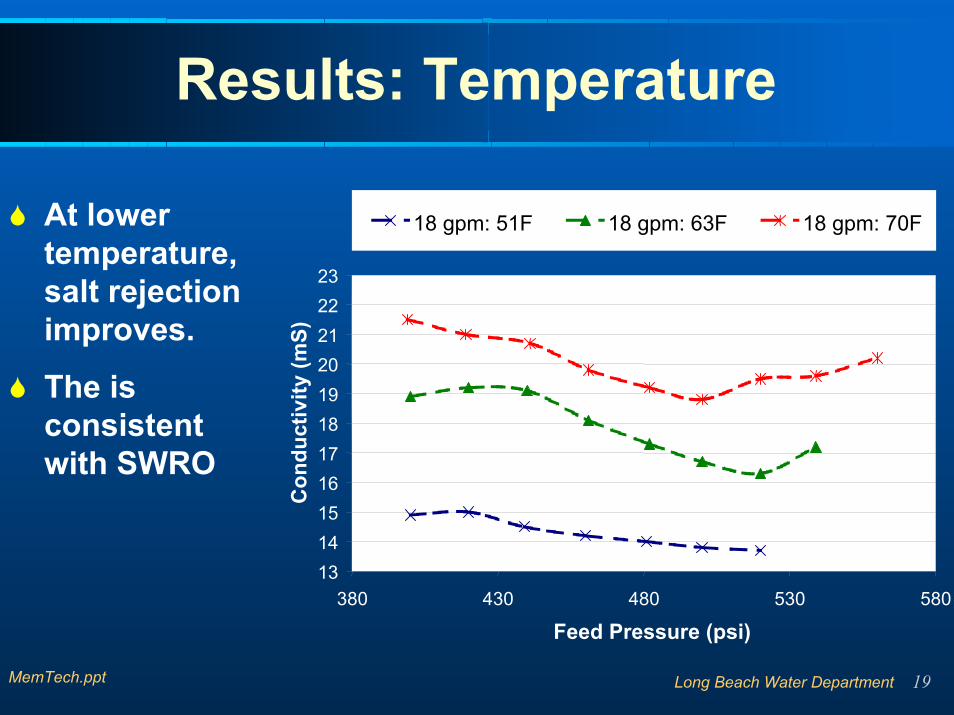
Results: Temperature
1314151617181920212223
380 430 480 530 580
Feed Pressure (psi)
Con
duct
ivity
(mS)
18 gpm: 51F 18 gpm: 63F 18 gpm: 70FAt lower temperature, salt rejection improves.
The is consistent with SWRO

20MemTech.ppt Long Beach Water Department
Results: Pressure
1314151617181920212223
380 430 480 530 580
Feed Pressure (psi)
Con
duct
ivity
(mS)
16 gpm: 51F 16 gpm: 63F 16 gpm: 70F
Convection Dominate
Diffusion Dominate
Convection Dominate
Critical Pt.
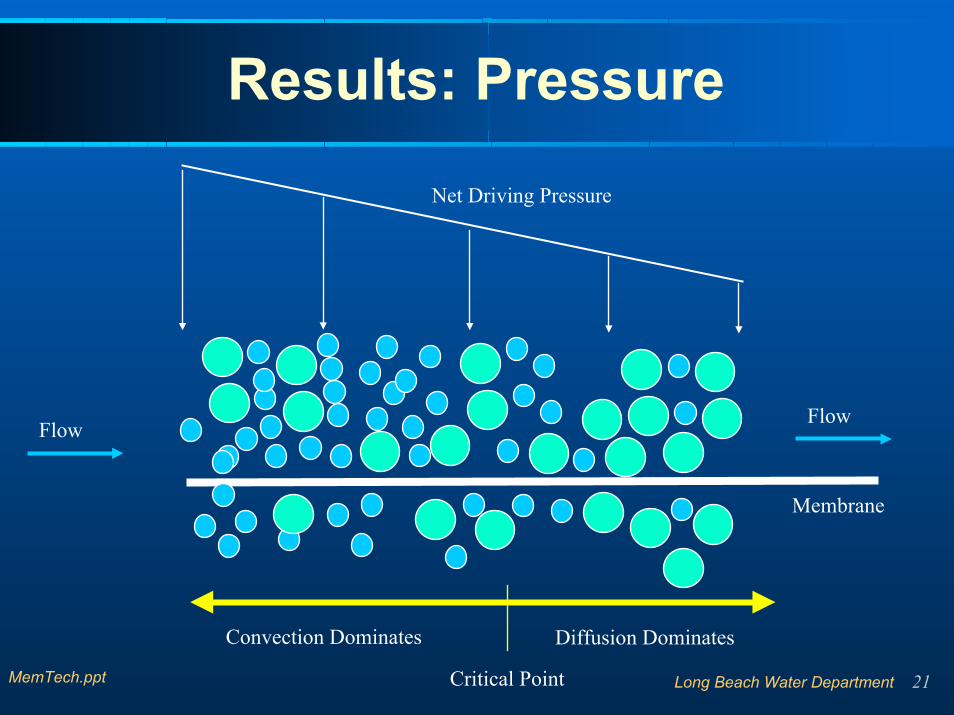
At low temperature, membrane exhibit typical salt rejection behavior.
However, a critical point develops at higher temperatures.
21MemTech.ppt Long Beach Water Department
Results: Pressure
Net Driving Pressure
FlowFlow
Membrane
Convection Dominates Diffusion Dominates
Critical Point
22MemTech.ppt Long Beach Water Department
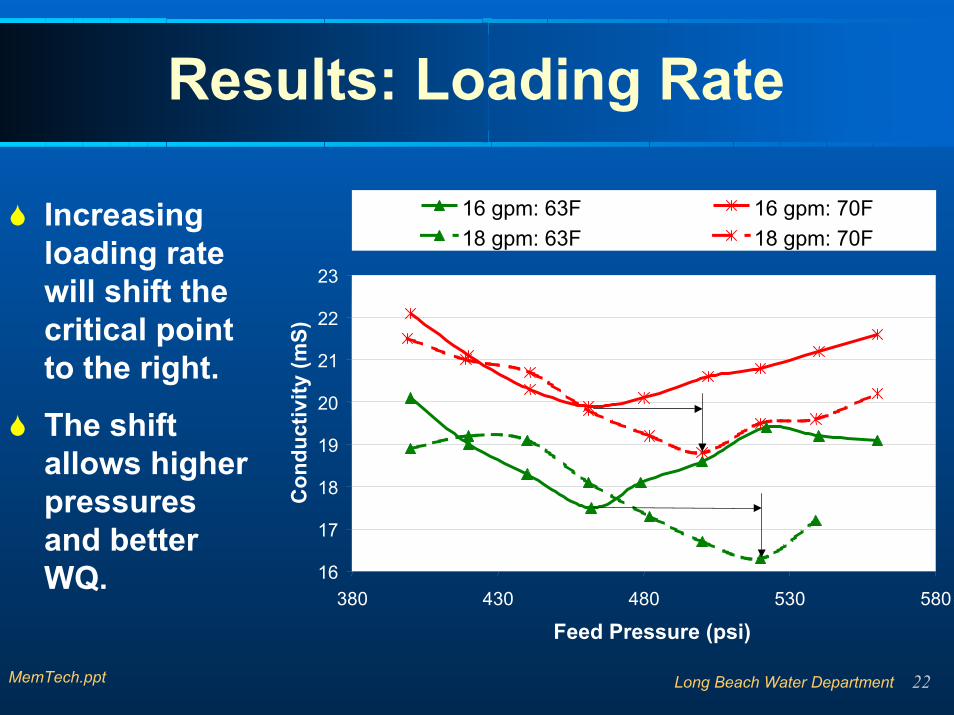
Results: Loading Rate
16
17
18
19
20
21
22
23
380 430 480 530 580
Feed Pressure (psi)
Con
duct
ivity
(mS)
16 gpm: 63F 16 gpm: 70F18 gpm: 63F 18 gpm: 70F
Increasing loading rate will shift the critical point to the right.
The shift allows higher pressures and better WQ.
23MemTech.ppt Long Beach Water Department
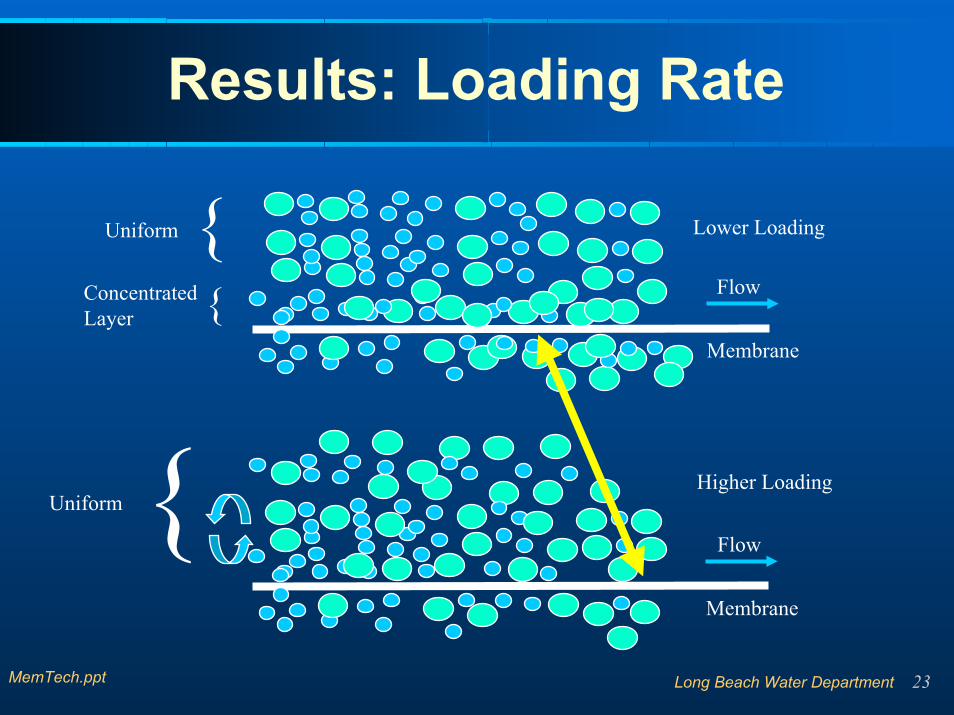
Results: Loading Rate
{ Lower LoadingUniform
Flow{ConcentratedLayer
Membrane
{ Higher LoadingUniform
Flow
Membrane

24MemTech.ppt Long Beach Water Department
Results: Roadmap
The following will be the roadmap for our NF optimization:– Identify the critical point for each membrane.– Determine the optimal loading rate for the
membrane.– Optimize pass 1 based on critical pt. and
loading.– Optimize Pass 2 to achieve the desired WQ.– Determine the net operating energy under
overall optimized conditions.– Determine optimal membrane operations for
each membrane type and condition.

25MemTech.ppt Long Beach Water Department
Presentation Outline
Long Beach Overview
Research Background
Research Goals/Approach
Results
Conclusion
26MemTech.ppt Long Beach Water Department
Conclusions
Lower pressure membranes can be used.
Temperature behavior similar to SWRO.
Each membrane will have a critical point.
Higher loading rate is better.
Optimization of critical point and loading rate.
27MemTech.ppt Long Beach Water Department
Questions


![Lecture 17 Membrane separations - CHERIC · Lecture 17. Membrane Separations [Ch. 14] •Membrane Separation •Membrane Materials •Membrane Modules •Transport in Membranes-Bulk](https://img.pdfslide.us/doc/110x75/5e688f368fbb145949438f76/lecture-17-membrane-separations-cheric-lecture-17-membrane-separations-ch-14.jpg)


![MAINE STATE LEGISLATURElldc.mainelegislature.org/Open/Rpts/hc79_d4l6_2005.pdf2005 ANNUAL REPORT LO!R]g.{(j f})t£o/£LOP](https://img.pdfslide.us/doc/110x75/5b45a2c17f8b9ad1138bda51/maine-state-annual-report-lorgj-ftolop.jpg)