Embed Size (px)
Citation preview
American Tower Corporation:An OverviewNovember 2014
Solid Business Model Fundamentals
2
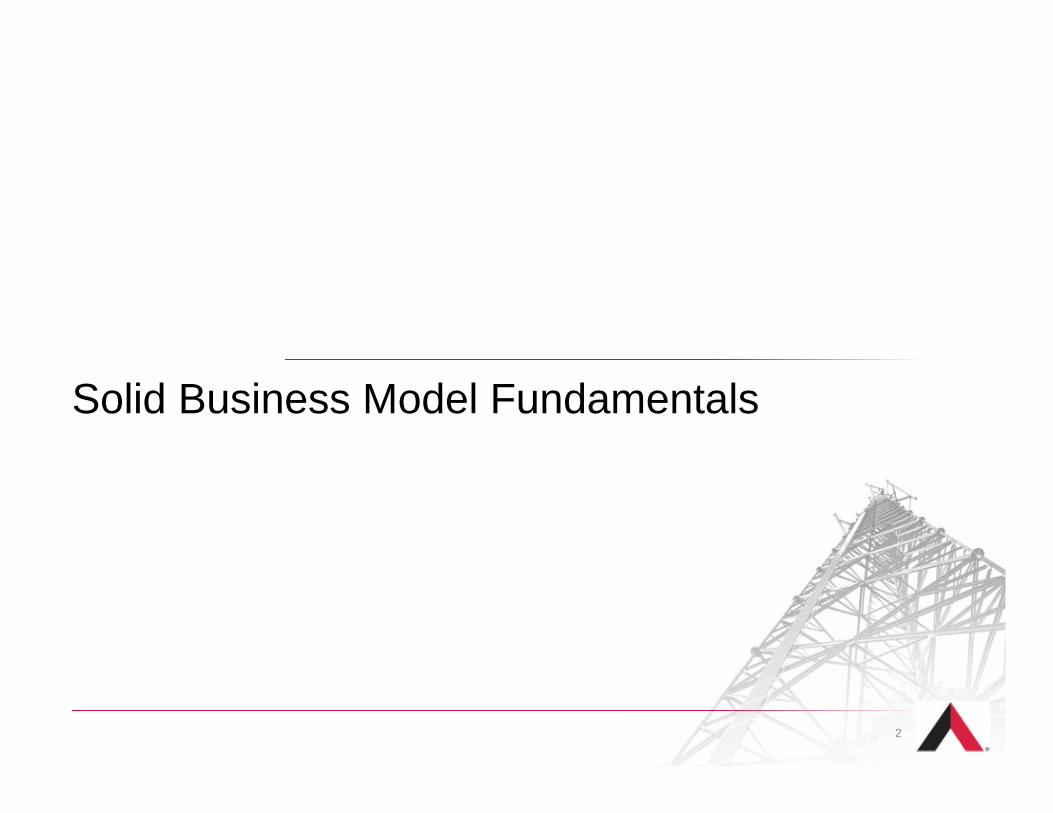
• American Tower is a leading independent owner and operator of telecommunications real estate and over 97% of its revenue is generated from leasing its properties.
• We provide the real estate necessary for today’s wireless communications networks.
Operated by American Tower
• Tower structure – constructed of galvanized steel with the capacity for multiple tenants
• Land parcel – owned or operated pursuant to long-term leases
Operated by Tenant
• Antenna equipment, including microwave equipment• Tenant shelters containing base-station equipment and
HVAC, which tenants own, operate and maintain• Coaxial cable
Company Overview
TENTEN
TENTENTENTEN
AMTAMT
AMTAMT
AMT
TEN
TENTEN
3
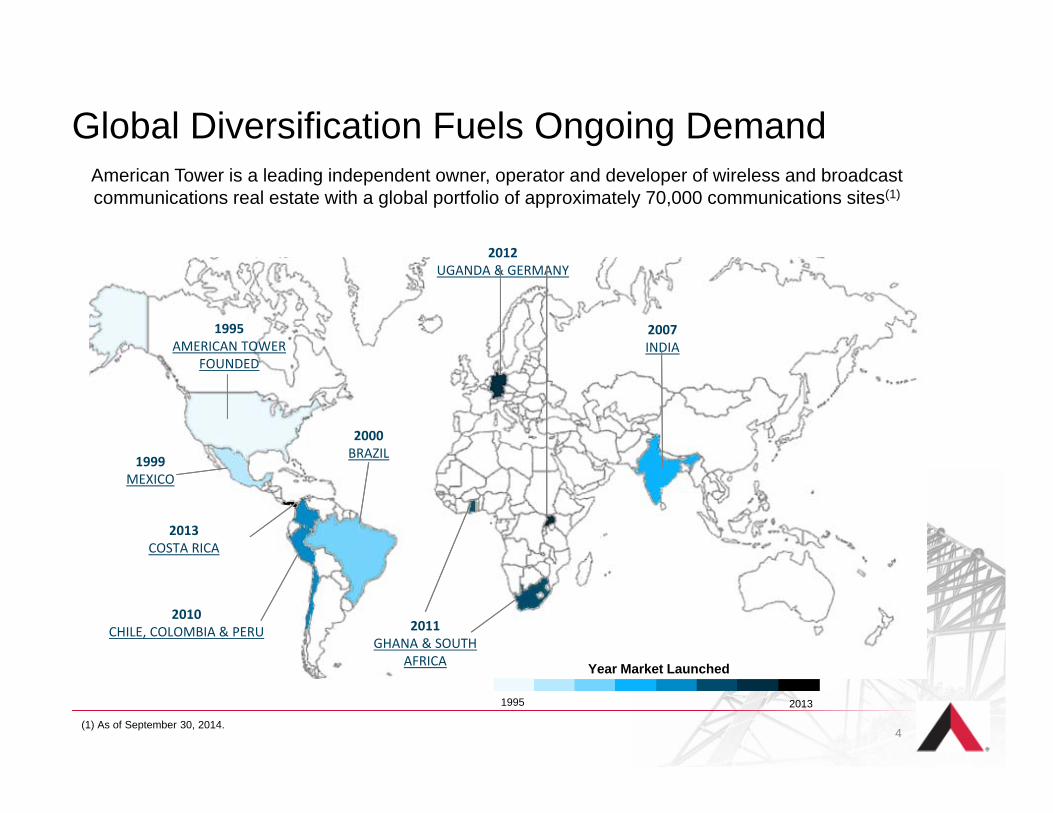
Global Diversification Fuels Ongoing Demand
4
1995 2013Year Market Launched
1995AMERICAN TOWER
FOUNDED
1999MEXICO
2000BRAZIL
2010CHILE, COLOMBIA & PERU
2013COSTA RICA
2007INDIA
2011GHANA & SOUTH
AFRICA
2012UGANDA & GERMANY
American Tower is a leading independent owner, operator and developer of wireless and broadcast communications real estate with a global portfolio of approximately 70,000 communications sites(1)
1995 2013
(1) As of September 30, 2014.
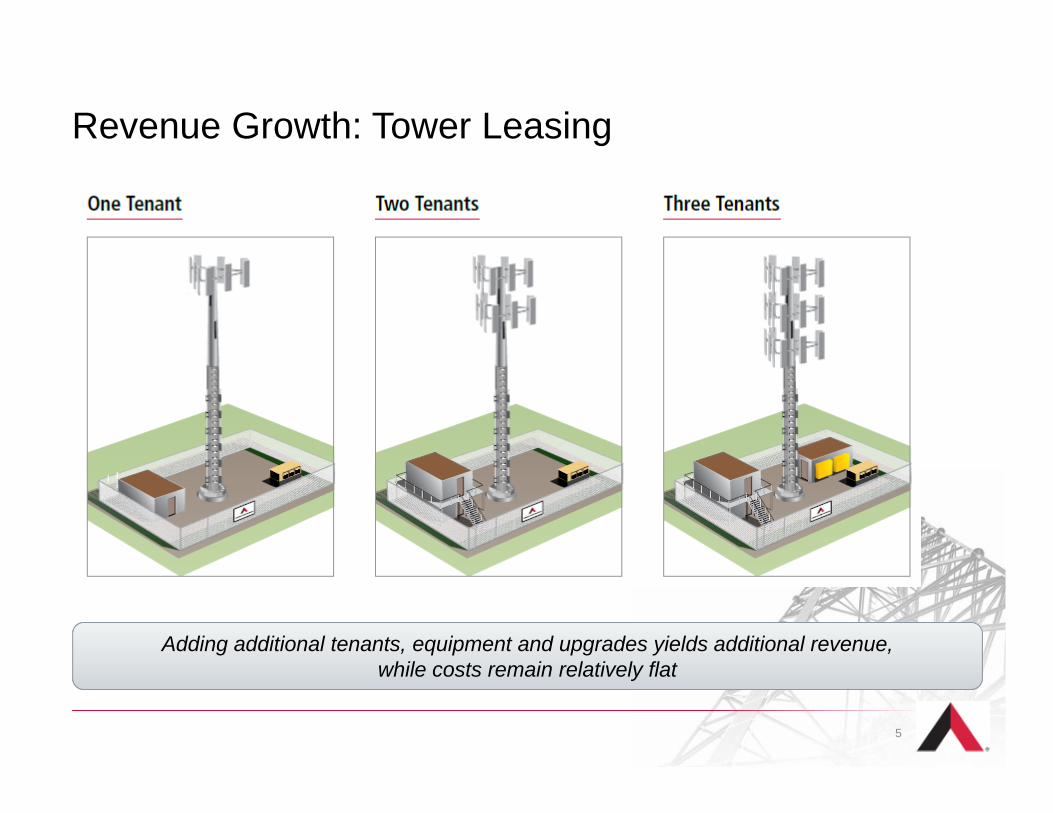
Revenue Growth: Tower Leasing
Adding additional tenants, equipment and upgrades yields additional revenue, while costs remain relatively flat
5
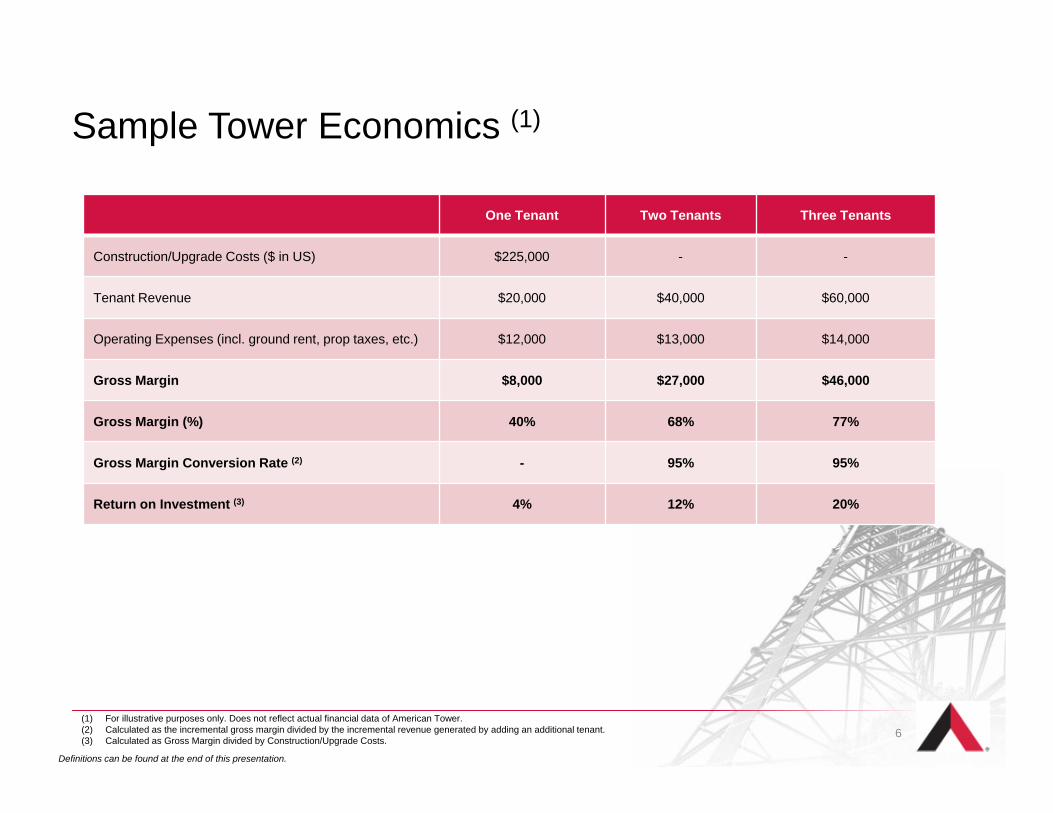
Sample Tower Economics (1)
One Tenant Two Tenants Three Tenants
Construction/Upgrade Costs ($ in US) $225,000 - -
Tenant Revenue $20,000 $40,000 $60,000
Operating Expenses (incl. ground rent, prop taxes, etc.) $12,000 $13,000 $14,000
Gross Margin $8,000 $27,000 $46,000
Gross Margin (%) 40% 68% 77%
Gross Margin Conversion Rate (2) - 95% 95%
Return on Investment (3) 4% 12% 20%
(1) For illustrative purposes only. Does not reflect actual financial data of American Tower. (2) Calculated as the incremental gross margin divided by the incremental revenue generated by adding an additional tenant.(3) Calculated as Gross Margin divided by Construction/Upgrade Costs.
Definitions can be found at the end of this presentation.
6
Fixed Cost ProfileDirect Costs of Operations Include:• Ground rent• Monitoring• Insurance• Real estate taxes• Utilities• Site maintenance
Pass-Through Expense:• Our international markets typically pass through a portion of their operating expenses to the tenant• In Latin America, we typically pass through ground rent, while in India and EMEA, we typically pass throughfuel costs
Fixed Cost Structure of Towers:• Accommodating additional tenants requires minimal additional operating costs
7
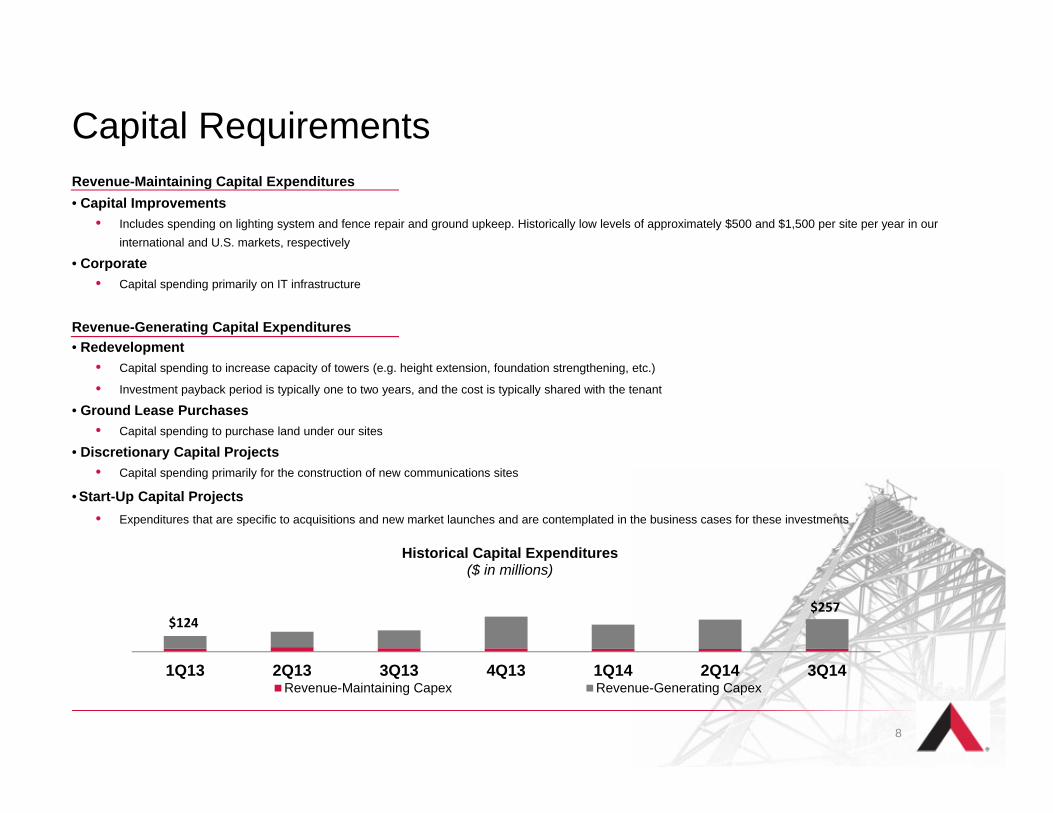
Capital RequirementsRevenue-Maintaining Capital Expenditures• Capital Improvements
• Includes spending on lighting system and fence repair and ground upkeep. Historically low levels of approximately $500 and $1,500 per site per year in our international and U.S. markets, respectively
• Corporate• Capital spending primarily on IT infrastructure
Revenue-Generating Capital Expenditures• Redevelopment
• Capital spending to increase capacity of towers (e.g. height extension, foundation strengthening, etc.)
• Investment payback period is typically one to two years, and the cost is typically shared with the tenant
• Ground Lease Purchases• Capital spending to purchase land under our sites
• Discretionary Capital Projects• Capital spending primarily for the construction of new communications sites
• Start-Up Capital Projects• Expenditures that are specific to acquisitions and new market launches and are contemplated in the business cases for these investments
1Q13 2Q13 3Q13 4Q13 1Q14 2Q14 3Q14
Historical Capital Expenditures($ in millions)
Revenue-Maintaining Capex Revenue-Generating Capex
$124$257
8
Long-Term Demand Drivers
9
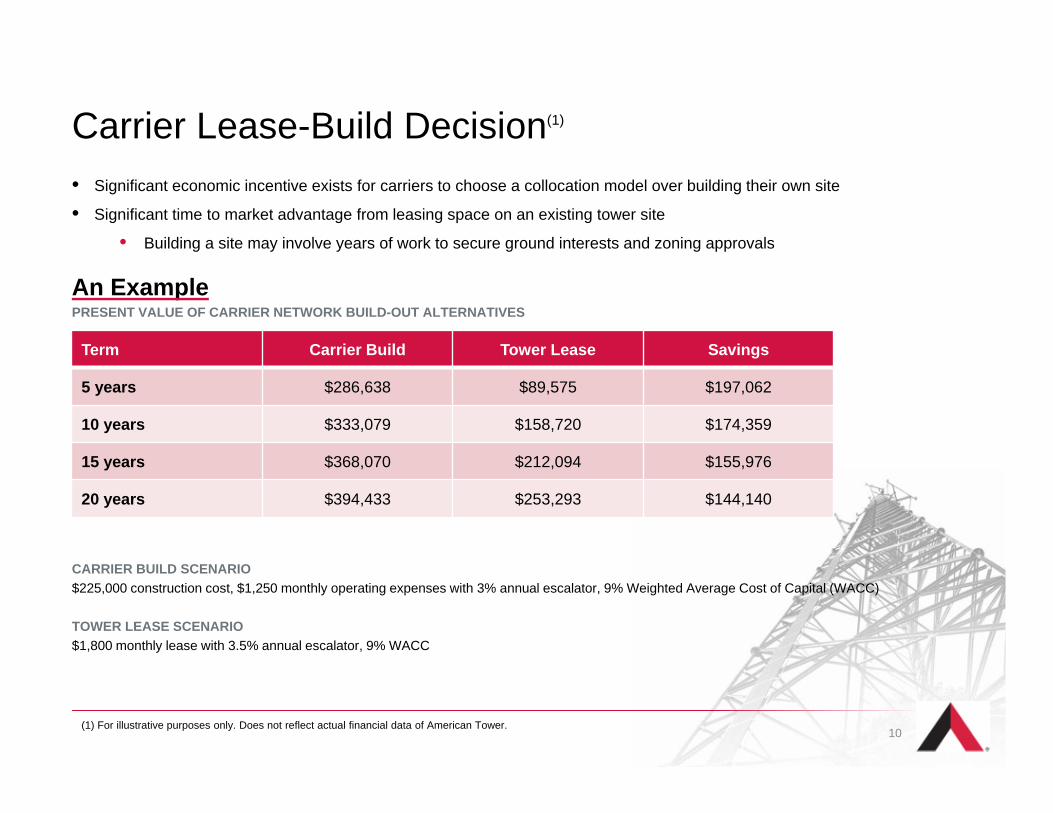
Carrier Lease-Build Decision(1)
• Significant economic incentive exists for carriers to choose a collocation model over building their own site
• Significant time to market advantage from leasing space on an existing tower site
• Building a site may involve years of work to secure ground interests and zoning approvals
An ExamplePRESENT VALUE OF CARRIER NETWORK BUILD-OUT ALTERNATIVES
CARRIER BUILD SCENARIO$225,000 construction cost, $1,250 monthly operating expenses with 3% annual escalator, 9% Weighted Average Cost of Capital (WACC)
TOWER LEASE SCENARIO$1,800 monthly lease with 3.5% annual escalator, 9% WACC
Term Carrier Build Tower Lease Savings
5 years $286,638 $89,575 $197,062
10 years $333,079 $158,720 $174,359
15 years $368,070 $212,094 $155,976
20 years $394,433 $253,293 $144,140
(1) For illustrative purposes only. Does not reflect actual financial data of American Tower.10
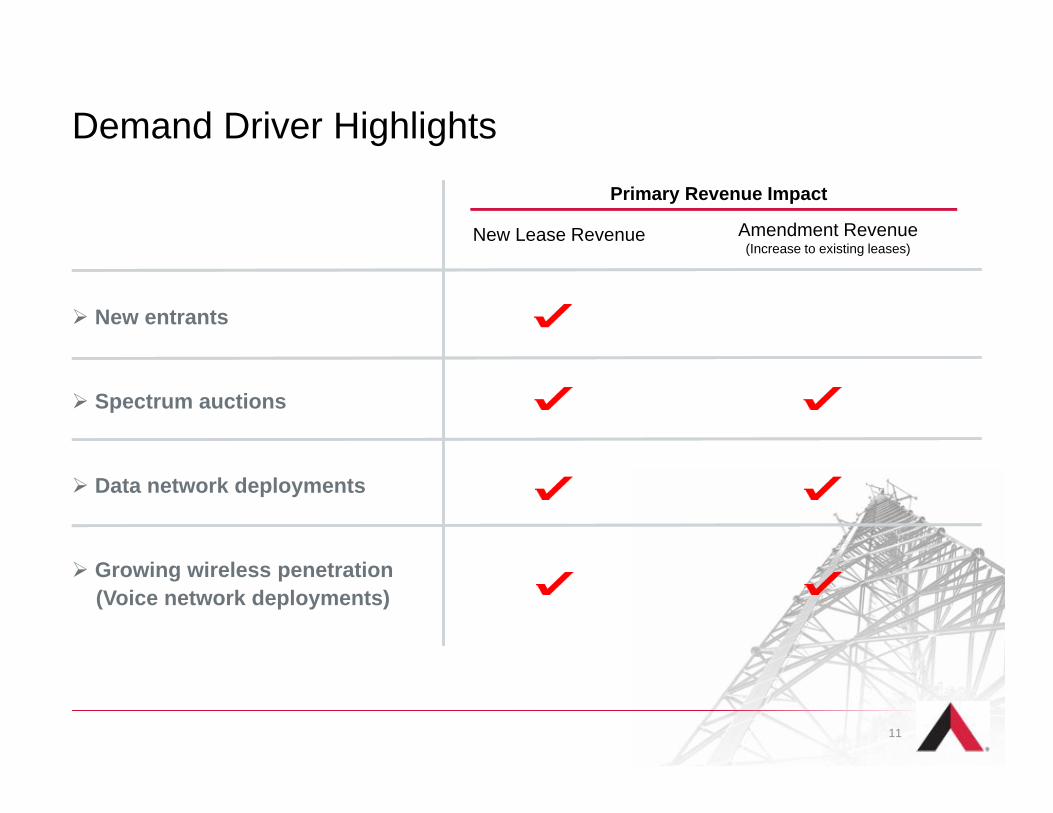
Demand Driver Highlights
New entrants
Spectrum auctions
Data network deployments
Growing wireless penetration (Voice network deployments)
Primary Revenue Impact
New Lease Revenue Amendment Revenue(Increase to existing leases)
11
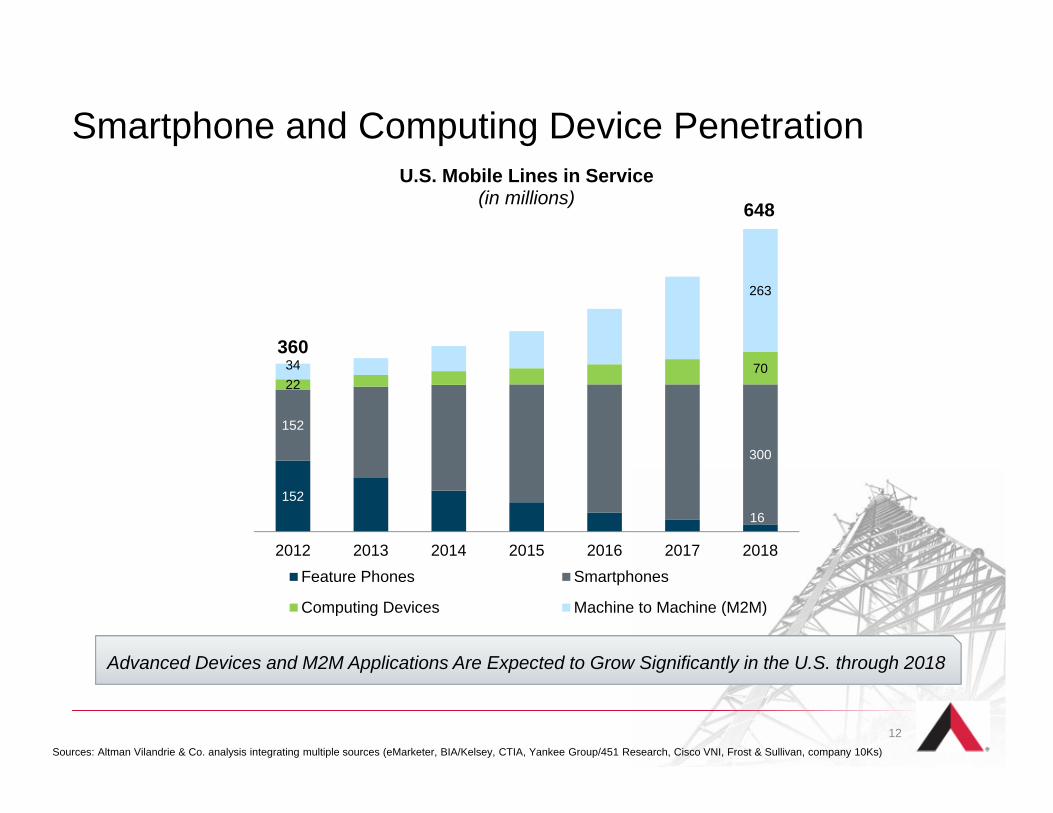
Smartphone and Computing Device Penetration
15216
152
300
227034
263
2012 2013 2014 2015 2016 2017 2018
U.S. Mobile Lines in Service(in millions)
Feature Phones Smartphones
Computing Devices Machine to Machine (M2M)
648
360
Sources: Altman Vilandrie & Co. analysis integrating multiple sources (eMarketer, BIA/Kelsey, CTIA, Yankee Group/451 Research, Cisco VNI, Frost & Sullivan, company 10Ks)
12
Advanced Devices and M2M Applications Are Expected to Grow Significantly in the U.S. through 2018
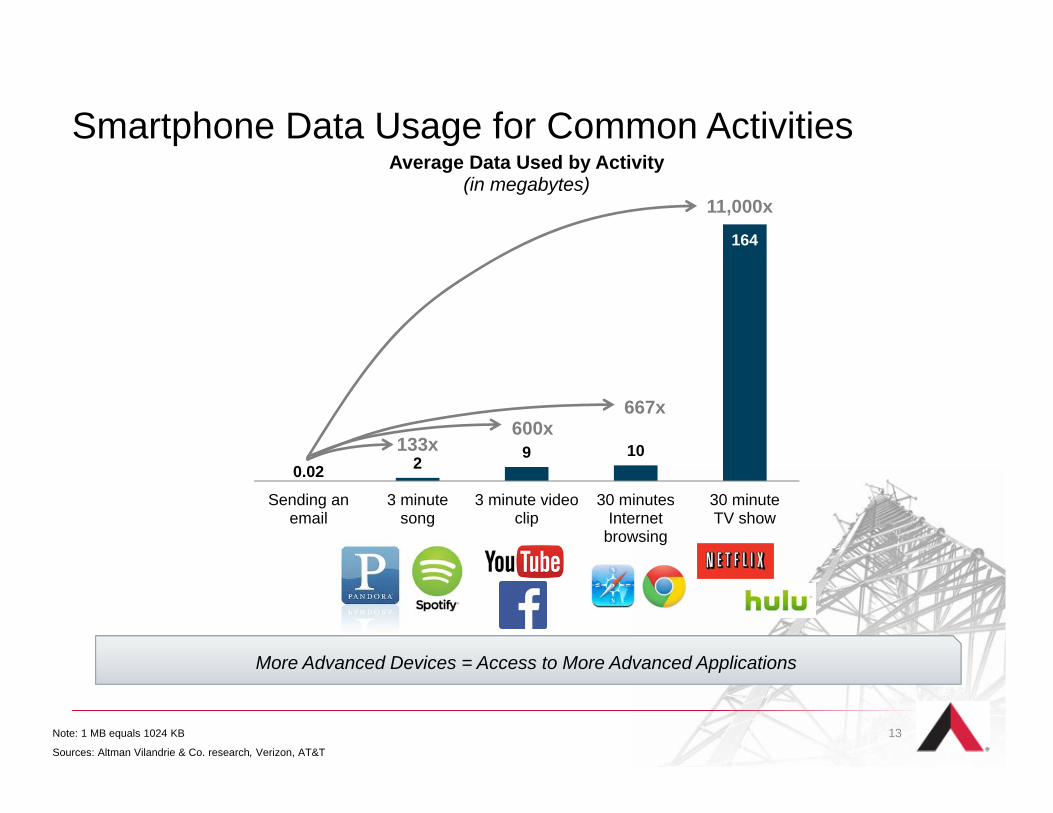
Smartphone Data Usage for Common Activities
0.02 2 9 10
164
Sending anemail
3 minutesong
3 minute videoclip
30 minutesInternet
browsing
30 minuteTV show
Average Data Used by Activity(in megabytes)
133x600x
667x
11,000x
Note: 1 MB equals 1024 KB
Sources: Altman Vilandrie & Co. research, Verizon, AT&T
13
More Advanced Devices = Access to More Advanced Applications
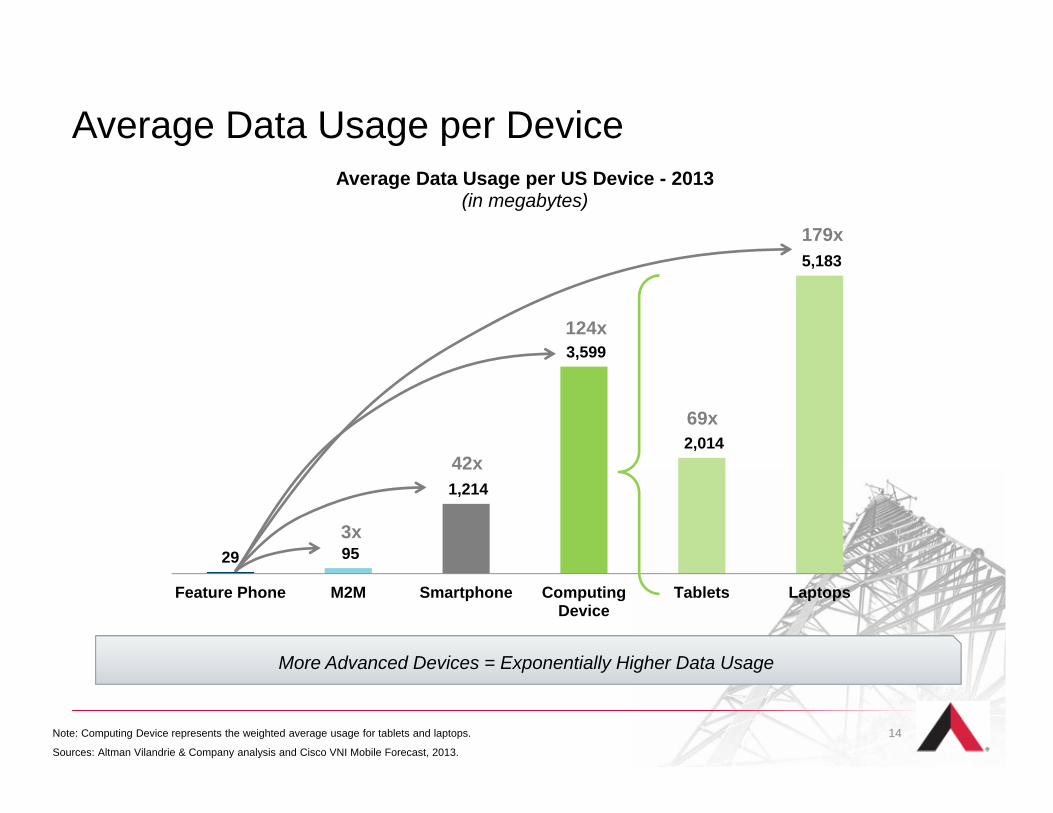
29 95
1,214
3,599
2,014
5,183
Feature Phone M2M Smartphone ComputingDevice
Tablets Laptops
Average Data Usage per US Device - 2013(in megabytes)
Average Data Usage per Device
3x
42x
69x
179x
Note: Computing Device represents the weighted average usage for tablets and laptops.
Sources: Altman Vilandrie & Company analysis and Cisco VNI Mobile Forecast, 2013.
124x
14
More Advanced Devices = Exponentially Higher Data Usage
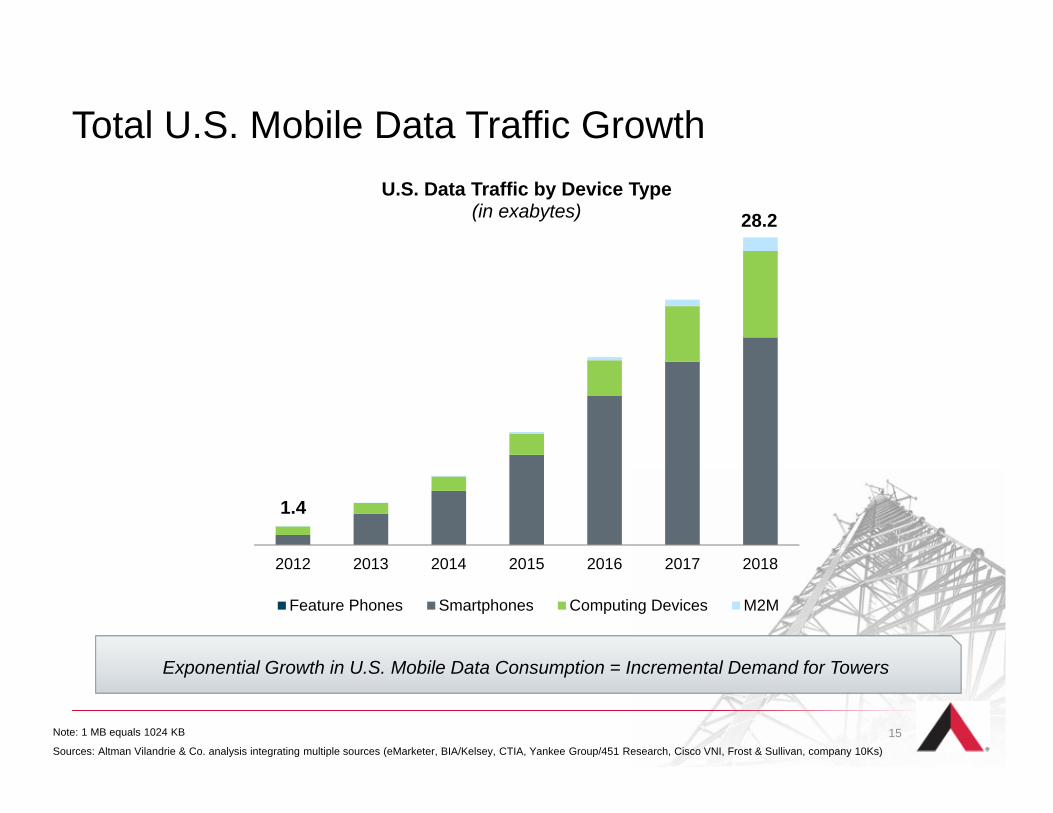
Total U.S. Mobile Data Traffic Growth
2012 2013 2014 2015 2016 2017 2018
U.S. Data Traffic by Device Type(in exabytes)
Feature Phones Smartphones Computing Devices M2M
28.2
1.4
Note: 1 MB equals 1024 KB
Sources: Altman Vilandrie & Co. analysis integrating multiple sources (eMarketer, BIA/Kelsey, CTIA, Yankee Group/451 Research, Cisco VNI, Frost & Sullivan, company 10Ks)
Exponential Growth in U.S. Mobile Data Consumption = Incremental Demand for Towers
15
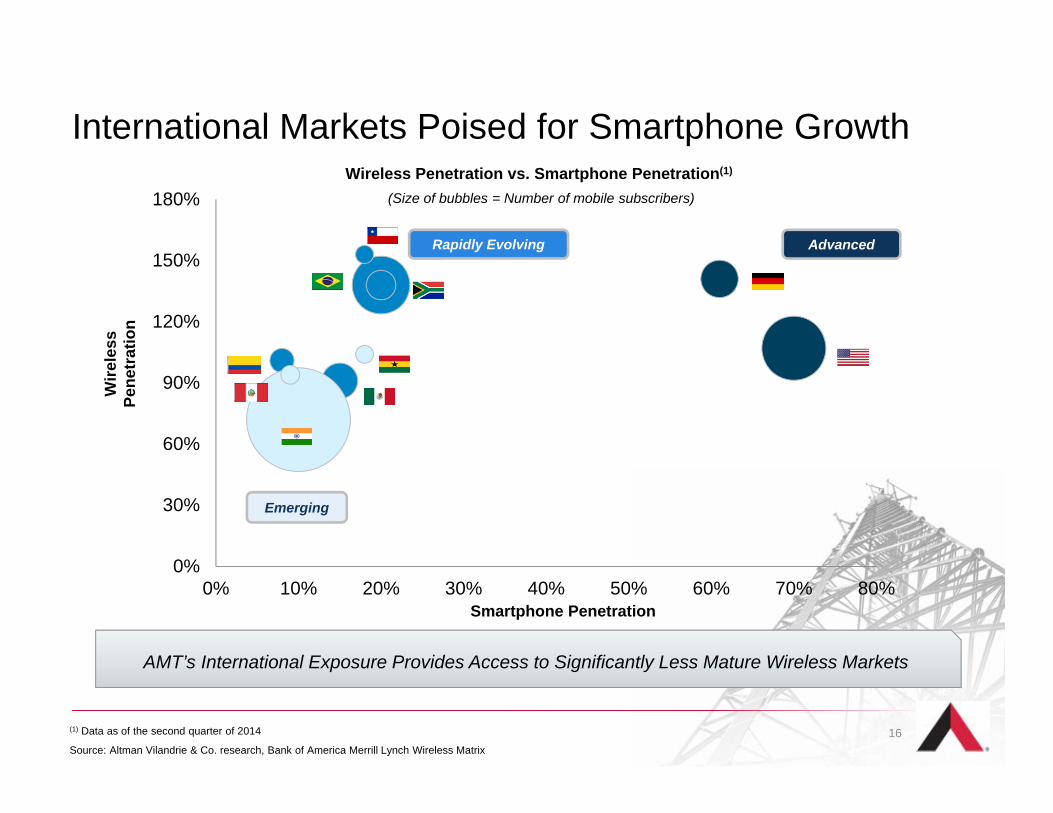
International Markets Poised for Smartphone Growth
0%
30%
60%
90%
120%
150%
180%
0% 10% 20% 30% 40% 50% 60% 70% 80%
Wireless Penetration vs. Smartphone Penetration(1)
(Size of bubbles = Number of mobile subscribers)
Wire
less
Pe
netr
atio
n
Smartphone Penetration
Emerging
Rapidly Evolving Advanced
(1) Data as of the second quarter of 2014
Source: Altman Vilandrie & Co. research, Bank of America Merrill Lynch Wireless Matrix
AMT’s International Exposure Provides Access to Significantly Less Mature Wireless Markets
16
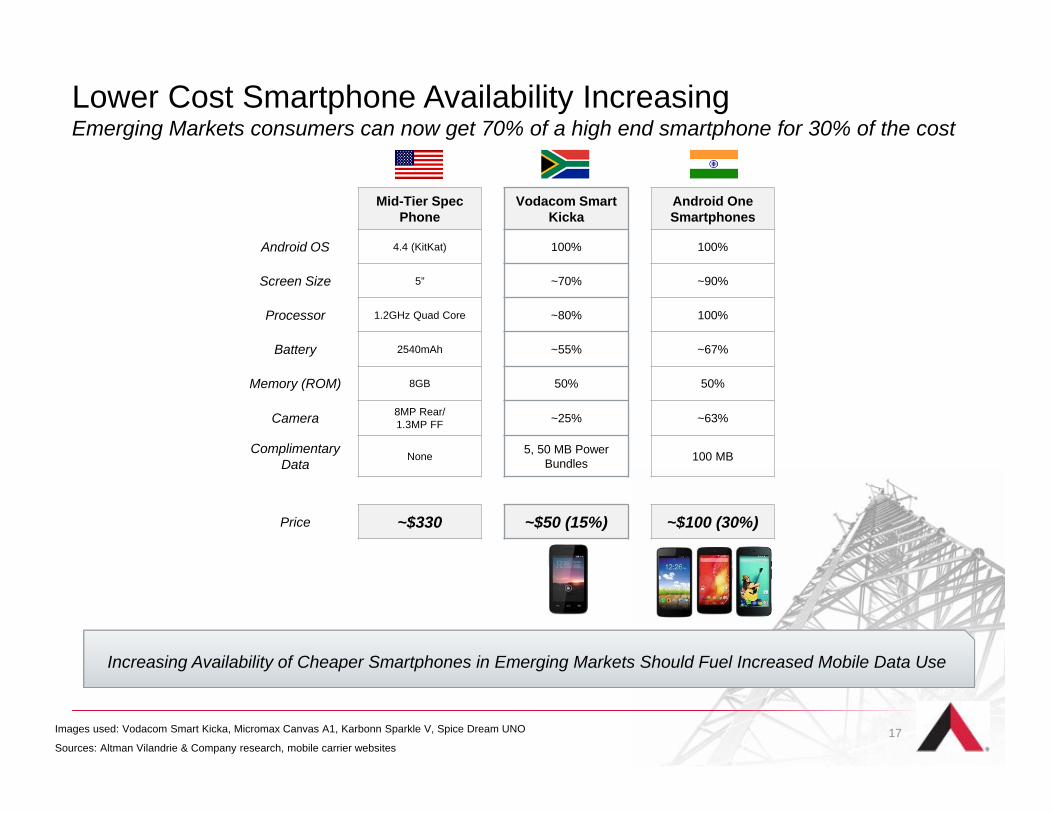
Lower Cost Smartphone Availability IncreasingEmerging Markets consumers can now get 70% of a high end smartphone for 30% of the cost
Mid-Tier Spec Phone
Vodacom SmartKicka
Android One Smartphones
Android OS 4.4 (KitKat) 100% 100%
Screen Size 5” ~70% ~90%
Processor 1.2GHz Quad Core ~80% 100%
Battery 2540mAh ~55% ~67%
Memory (ROM) 8GB 50% 50%
Camera 8MP Rear/1.3MP FF ~25% ~63%
ComplimentaryData
None 5, 50 MB Power Bundles 100 MB
Price ~$330 ~$50 (15%) ~$100 (30%)
Images used: Vodacom Smart Kicka, Micromax Canvas A1, Karbonn Sparkle V, Spice Dream UNO
Sources: Altman Vilandrie & Company research, mobile carrier websites
Increasing Availability of Cheaper Smartphones in Emerging Markets Should Fuel Increased Mobile Data Use
17
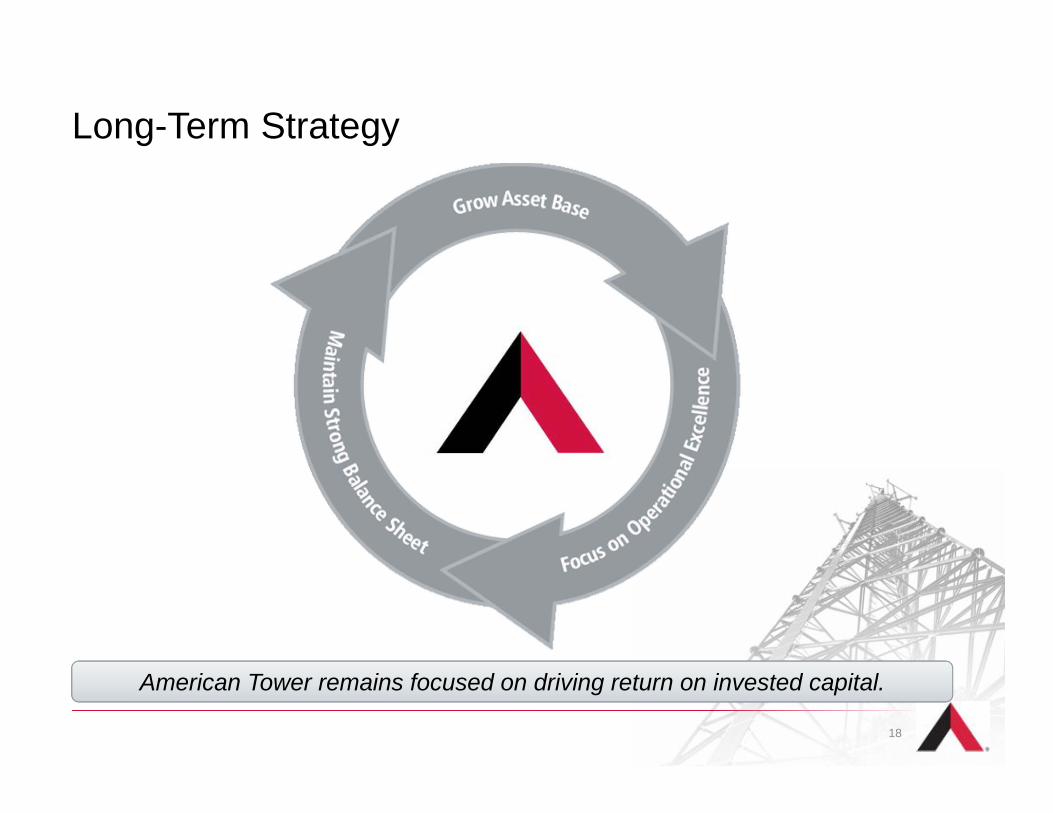
Long-Term Strategy
American Tower remains focused on driving return on invested capital.
18
DefinitionsAdjusted EBITDA: Net income before Income (loss) on discontinued operations, net; Income (loss) from equity method investments; Income tax benefit (provision) ; Other income (expense); Gain (loss) on retirement of long-term obligations; Interest expense; Interest income; Other operating income (expense); Depreciation, amortization and accretion; and Stock-based compensation expense.
Adjusted EBITDA Margin: the percentage that results from dividing Adjusted EBITDA by total revenue.
Adjusted Funds From Operations, or AFFO: NAREIT FFO before (i) straight-line revenue and expense, (ii) stock-based compensation expense, (iii) the non-cash portion of our tax provision, (iv) non-real estate related depreciation, amortization and accretion, (v) amortization of deferred financing costs, capitalized interest, debt discounts and premiums and long-term deferred interest charges, (vi) other income (expense), (vii) gain (loss) on retirement of long-term obligations, (viii) other operating income (expense), and adjustments for (ix) unconsolidated affiliates; and (x) noncontrolling interest, less cash payments related to capital improvements and cash payments related to corporate capital expenditures.
AFFO per Share: Adjusted Funds From Operations divided by the diluted weighted average common shares outstanding.
Churn: Revenue lost when a tenant cancels or does not renew its lease, and in limited circumstances, such as a tenant bankruptcy, reductions in lease rates on existing leases.
Core Growth: (Rental and management revenue, Adjusted EBITDA, Gross Margin and Operating Profit) the increase or decrease, expressed as a percentage, resulting from a comparison of financial results for a current period with corresponding financial results for the corresponding period in a prior year, in each case, excluding the impact of straight-line revenue and expense recognition, foreign currency exchange rate fluctuations and material one-time items.
NAREIT FFO: Net income before gains or losses from the sale or disposal of real estate, real estate related impairment charges, real estate related depreciation, amortization and accretion and dividends declared on preferred stock, and including adjustments for (i) unconsolidated affiliates and (ii) noncontrolling interest.
Net Leverage Ratio: Net debt (total debt, less cash and cash equivalents) divided by last quarter annualized Adjusted EBITDA.
New Property Core Growth: (Rental and management revenue) the increase or decrease, expressed as a percentage, on the properties the Company has added to its portfolio since the beginning of the prior period, in each case, excluding the impact of straight-line revenue and expense recognition, foreign currency exchange rate fluctuations and significant one-time items.
Operating Profit: Gross margin less selling, general, administrative and development expense attributable to the segment, excluding stock-based compensation expense and corporate expenses. International rental and management segment includes interest income, TV Azteca, net.
19
DefinitionsOperating Profit Margin: Operating profit divided by total revenue.
Organic Core Growth: (Rental and management revenue) the increase or decrease, expressed as a percentage, resulting from a comparison of financialresults for a current period with corresponding financial results for the corresponding period in a prior year, in each case, excluding the impact of straight-line revenue and expense recognition, foreign currency exchange rate fluctuations, significant one-time items and revenue associated with new properties that the Company has added to the portfolio since the beginning of the prior period.
Pass-through Revenues: In several of our international markets we pass through certain operating expenses to our tenants, including in Latin Americawhere we primarily pass through ground rent expenses, and in India and South Africa, where we primarily pass through fuel costs. We record pass through as revenue and a corresponding offsetting expense for these events.
Recurring Free Cash Flow: Adjusted EBITDA before straight-line revenue and expense plus interest income less interest expense, cash paid for income taxes and non-discretionary capital expenditures (redevelopment, capital improvement and corporate capital expenditures).
Recurring Free Cash Flow per Share: Recurring Free Cash Flow divided by the diluted weighted average common shares outstanding.
Segment Gross Margin: segment revenue less segment operating expenses, excluding stock-based compensation expense recorded in costs of operations; depreciation, amortization and accretion; selling, general, administrative and development expense; and other operating expenses. International rental and management segment includes interest income, TV Azteca, net.
Segment Gross Margin Conversion Rate: the percentage that results from dividing the change in gross margin by the change in revenue.
Segment Operating Profit: Segment gross margin less segment selling, general, administrative and development expense attributable to the segment, excluding stock-based compensation expense and corporate expenses. International rental and management segment includes interest income, TV Azteca, net.
Straight-line expenses: We calculate straight-line ground rent expense for our ground leases based on the fixed non-cancellable term of the underlying ground lease plus all periods, if any, for which failure to renew the lease imposes an economic penalty to us such that renewal appears, at the inception of the lease, to be reasonably assured. Certain of our tenant leases require us to exercise available renewal options pursuant to the underlying ground lease, if the tenant exercises its renewal option. For towers with these types of tenant leases at the inception of the ground lease, we calculate our straight-line ground rent over the term of the ground lease, including all renewal options required to fulfill the tenant lease obligation.
Straight-line revenues: We calculate straight-line rental revenues from our tenants based on the fixed escalation clauses present in non-cancellable lease agreements, excluding those tied to the Consumer Price Index or other inflation-based indices, and other incentives present in lease agreements with our tenants. We recognized revenues on a straight-line basis over the fixed, non-cancellable terms of the applicable leases.
20
Forward-Looking StatementsThis presentation contains "forward-looking statements" concerning our goals, beliefs, expectations, strategies, objectives, plans, future operating results and underlying assumptions, and other statements that are not necessarily based on historical facts. Examples of these statements include, but are not limited to statements regarding our full year 2014 outlook, foreign currency exchange rates and our expectations regarding leverage and the leasing demand for communications real estate. Actual results may differ materially from those indicated in our forward-looking statements as a result of various important factors, including: (1) decrease in demand for our communications sites would materially and adversely affect our operating results, and we cannot control that demand; (2) if our tenants share site infrastructure to a significant degree or consolidate or merge, ourgrowth, revenue and ability to generate positive cash flows could be materially and adversely affected; (3) our business is subject to government regulations and changes in current or future laws or regulations could restrict our ability to operate our business as we currently do; (4) our leverage and debt service obligations may materially and adversely affect us; (5) if we fail to pay scheduled dividends on our preferred stock, in cash or common stock, we will be prohibited from paying dividends on our common stock, which may jeopardize our status as a REIT; (6) increasing competition in the tower industry may materially and adversely affect us; (7) our expansion initiatives involve a number of risks and uncertainties that could adversely affect our operating results, disrupt our operations or expose us to additional risk if we are not able to successfully integrate operations, assets and personnel; (8) our foreign operations are subject to economic, political and other risks that could materially andadversely affect our revenues or financial position, including risks associated with fluctuations in foreign currency exchange rates; (9) a substantial portion of our revenue is derived from a small number of tenants, and we are sensitive to changes in the creditworthiness and financial strength of our tenants; (10) new technologies or changes in a tenant’s business model could make our tower leasing business less desirable and result in decreasing revenues; (11) if we fail to remain qualified as a REIT, we will be subject to tax at corporate income tax rates, which may substantially reduce funds otherwise available; (12) we may be limited in our ability to fund required distributions using cash generated through our TRSs; (13) complying with REIT requirements may limit our flexibility or cause us to forego otherwise attractive opportunities;
21
Forward-Looking Statements(continued)
(14) certain of our business activities may be subject to corporate level income tax and foreign taxes, which reduce our cash flows and may create deferred and contingent tax liabilities; (15) we may need additional financing to fund capital expenditures, future growth and expansion initiatives and to satisfy our REIT distribution requirements; (16) if we are unable to protect our rights to the land under our towers, it could adversely affect our business and operating results; (17) if we are unable or choose not to exercise our rights to purchase towers that are subject to lease and sublease agreements at the end of the applicable period, our cash flows derived from such towers will be eliminated; (18) restrictive covenants in the agreements related to our securitization transactions, our credit facilities and our debt securities could materially and adversely affect our business bylimiting flexibility; (19) we may incur goodwill and other intangible asset impairment charges, which could result in a significant reduction to our earnings; (20) our costs could increase and our revenues could decrease due to perceived health risks from radio emissions, especially if these perceived risks are substantiated; (21) we could have liability under environmental and occupational safety and health laws; and (22) our towers or data centers may be affected by natural disasters and other unforeseen events for which our insurance may not provide adequate coverage. For additional information regarding factors that may cause actual results to differ materially from those indicated in our forward-looking statements, we refer you to the information contained in Item 1A of our Form 10-Q for the quarter ended September 30, 2014. We undertake no obligation to update the information contained in this presentation to reflect subsequently occurring events or circumstances.
22
Additional Information AvailableFor more information on the tower industry and American Tower, please refer to our “Introduction to the Tower Industry and American Tower” presentation, which can be found in the Investor Relations section of our website under Company and Industry Resources. This presentation provides an overview of the tower business model and information on American Tower’s operating performance and financial strategy.
23