Embed Size (px)
Citation preview
American Society of Civil Engineers
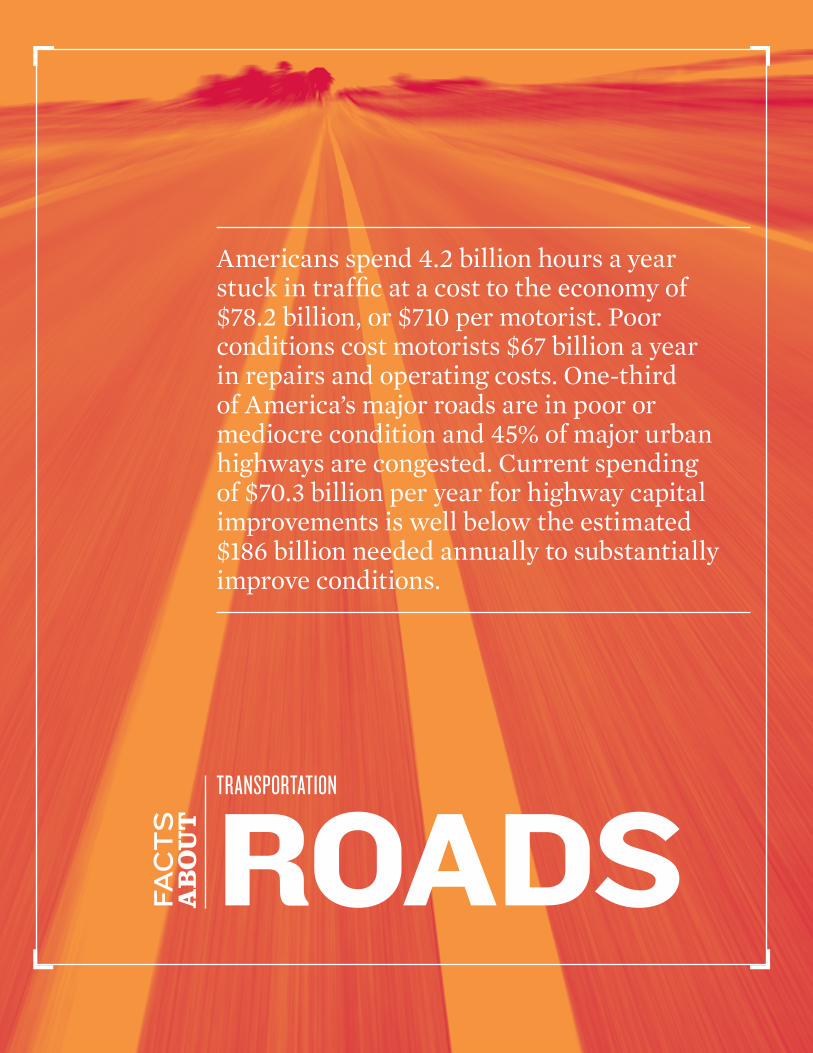
roaDs
Americans spend 4.2 billion hours a year stuck in traffic at a cost to the economy of $78.2 billion, or $710 per motorist. Poor conditions cost motorists $67 billion a year in repairs and operating costs. One-third of America’s major roads are in poor or mediocre condition and 45% of major urban highways are congested. Current spending of $70.3 billion per year for highway capital improvements is well below the estimated $186 billion needed annually to substantially improve conditions.
tranSPortation
A = ExceptionalB = GoodC = MediocreD = PoorF = Failing
AMERICA’SINFRASTRUCTURE G.P.A.
www.asce.org/reportcard
tranSPortation
99www.asce.org/reportcard
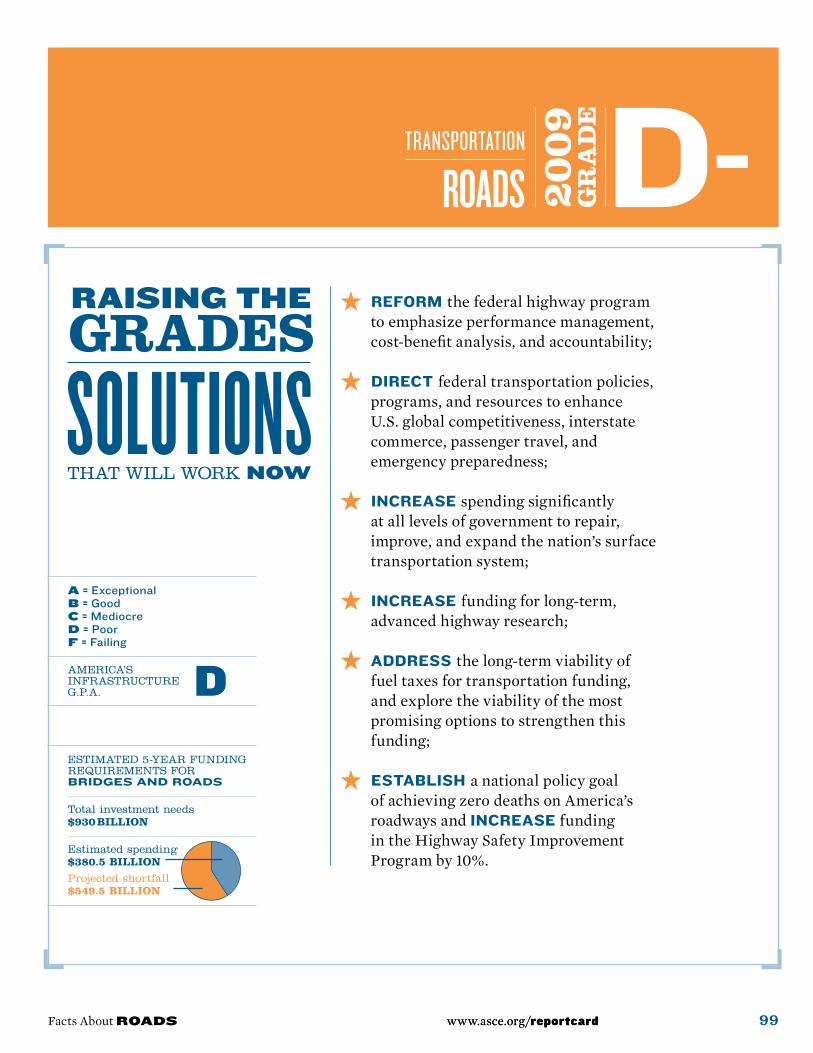
rEform the federal highway program to emphasize performance management, cost-benefit analysis, and accountability;
DirEct federal transportation policies, programs, and resources to enhance U.S. global competitiveness, interstate commerce, passenger travel, and emergency preparedness;
incrEasE spending significantly at all levels of government to repair, improve, and expand the nation’s surface transportation system;
incrEasE funding for long-term, advanced highway research;
aDDrEss the long-term viability of fuel taxes for transportation funding, and explore the viability of the most promising options to strengthen this funding;
Establish a national policy goal of achieving zero deaths on America’s roadways and incrEasE funding in the Highway Safety Improvement Program by 10%.
Facts About RoADS
D-RoADS
ESTIMATED 5-YEAR FUNDING REQUIREMENTS FOR briDges anD roaDs
Total investment needs $930 billion
Estimated spending$380.5 billion
Projected shortfall$549.5 billion
100 2009 Report Card for America’s Infrastructure www.asce.org/reportcard
ConDition
Our nation’s economy and our quality of life require a highway and roadway sys-tem that provides a safe, reliable, efficient, and comfortable driving environment. Although highway fatalities and traffic- related injuries declined in 2007, the drop is most likely attributable to people driving less. Still, in 2007, 41,059 people were killed in motor vehicle crashes and 2,491,000 were injured.4 Motor vehicle crashes cost the U.S. $230 billion per year—$819 for each resident in medi-cal costs, lost productivity, travel delays, workplace costs, insurance costs, and legal costs.1
Next to safety, congestion has become the most critical challenge facing our highway system. Congestion continues to worsen to the point at which Ameri-cans spend 4.2 billion hours a year stuck in traffic at a cost of $78.2 billion a year in wasted time and fuel costs—$710 per motorist.1 The average daily percentage of vehicle miles traveled (VMT) under congested conditions rose from 25.9% in 1995 to 31.6% in 2004, congestion in large urban areas exceeding 40%.2 And as a result of increased congestion, total fuel wasted climbed from 1.7 billion gallons in 1995 to 2.9 billion gallons in 2005.5
Poor road conditions lead to excessive wear and tear on motor vehicles and can also lead to increased numbers of crashes and delays. According to the Federal High-way Administration, while the percent-age of VMT occurring on roads classified as having “good” ride quality has steadily improved, the percentage of “acceptable”
ride quality steadily declined from 86.6% in 1995 to 84.9% in 2004, with the low-est acceptable ride quality found among urbanized roads at 72.4%.2 These figures represent a failure to achieve significant increases in good and acceptable ride quality, particularly in heavily trafficked urbanized areas.
Compounding the problem are steadily increasing demands on the system. From 1980–2005, while automobile VMT increased 94% and truck VMT increased 105%, highway lane-miles grew by only 3.5%. From 1994–2004, ton miles of freight moved by truck grew 33%.6 The increase in freight traffic is of particular concern because of the increased depen-dency of commerce upon the efficiency of the roadways and the added wear and tear caused by trucks. Without adequate investment and attention, the negative trends will continue, as will the adverse consequences.
It is clear that significant improvements and system maintenance will require sig-nificant investments.
The National Surface Transportation Policy and Revenue Commission studied the impact of varying investment levels (medium and high) and produced the fol-lowing ranges of average annual capital investment needs (in 2006 dollars):
$130 billion–$240 billion for the 15-year period 2005–2020;$133 billion–$250 billion for the 30-year period 2005–2035;$146 billion–$276 billion for the 50-year period 2005–2055.
★
★
★
Facts About RoADS 101www.asce.org/reportcard
The lower end of the ranges reflect the estimated costs of maintaining key condi-tions and performance measures at cur-rent levels, while the higher end ranges would allow for an aggressive expan-sion of the highway system, which would provide improved conditions and per-formance in light of increasing travel demand.3 Even at the lower range of esti-mates, an enormous gap exists between the current level of capital investment and the investment needed to improve the nation’s highways and roads.
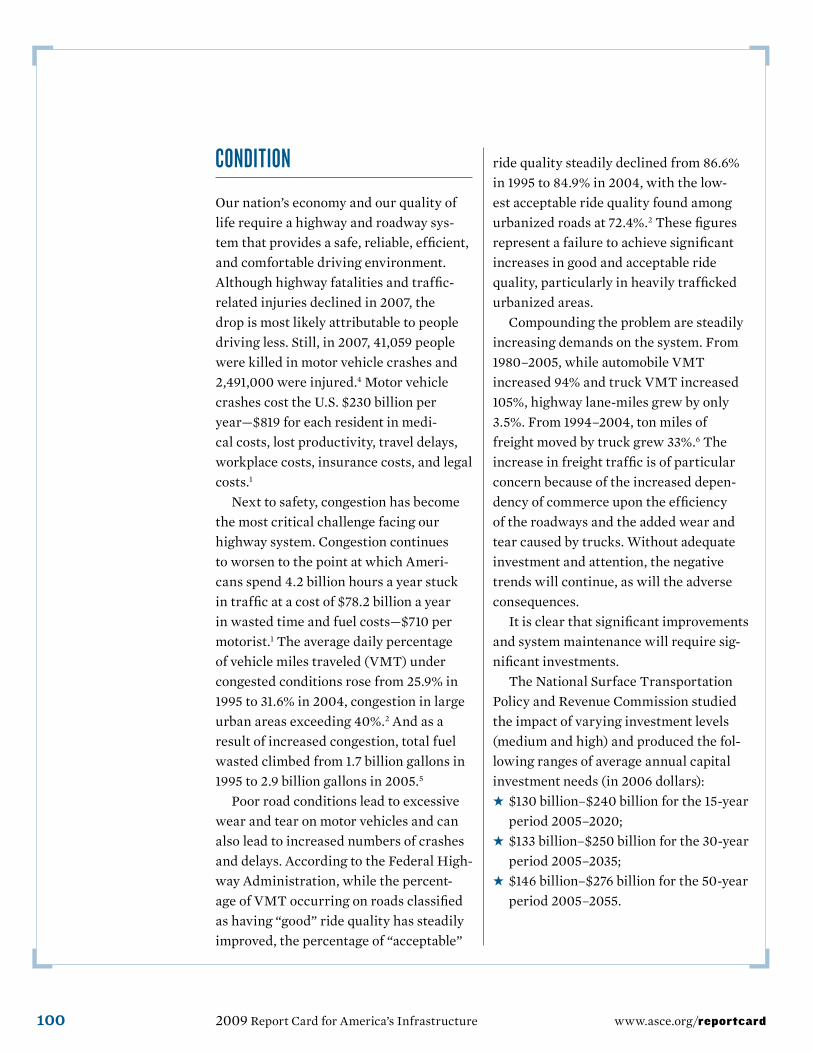
TABLE 11.1 ★� Top 10 Most congested cities in the U.S.
rank city Hoursofdelaypertraveler
1 Los Angeles/Long Beach-Santa Ana, cA 72
2 San Francisco-oakland, cA 60
2 Washington, Dc-vA-MD 60
2 Atlanta, GA 60
5 Dallas-Fort Worth-Arlington, Tx 58
6 Houston, Tx 56
7 Detroit, MI 54
8 Miami, FL 50
9 Phoenix, AZ 48
10 chicago, IL-IN 46
SoURCE Urban Mobility Report, Texas Transportation Institute, 2007
The average daily percentage of vehicle miles traveled (VMT) under congested conditions rose from 25.9% in 1995 to 31.6% in 2004, congestion in large urban areas exceeding 40%.
102 2009 Report Card for America’s Infrastructure www.asce.org/reportcard
RESiliEnCy
The Interstate Highway System was con-structed as part of the nation’s strategic homeland defense, illustrating the impor-tant role of transportation in mitigation, defense and recovery.
The ability of our transportation sys-tem to withstand threats from hazards of all types, both natural and human-caused, and to restore service promptly following such events, is known as resilience.
Building disaster-resistant roads and highways reduces hazard mitigation costs, limits exposure, and maintains opera-tional continuity. A multihazard approach utilizing next-generation codes, standards, and practices is necessary to minimize the extent of a disaster.
ConClUSion
The challenges imposed by our highway infrastructure require a large increase in capital investment on the part of all levels of government and other sources as well. The failure to adequately invest in the nation’s highways and roads will lead to increased congestion and delays for motorists and the further deterio-ration of pavement conditions and will pose increased safety concerns. An over-stressed infrastructure will also slow freight delivery, create unpredictability in supply chains, diminish the competi-tiveness of U.S. businesses, and increase the cost of consumer goods. There must also be a significant change in the way we manage the system, which should include
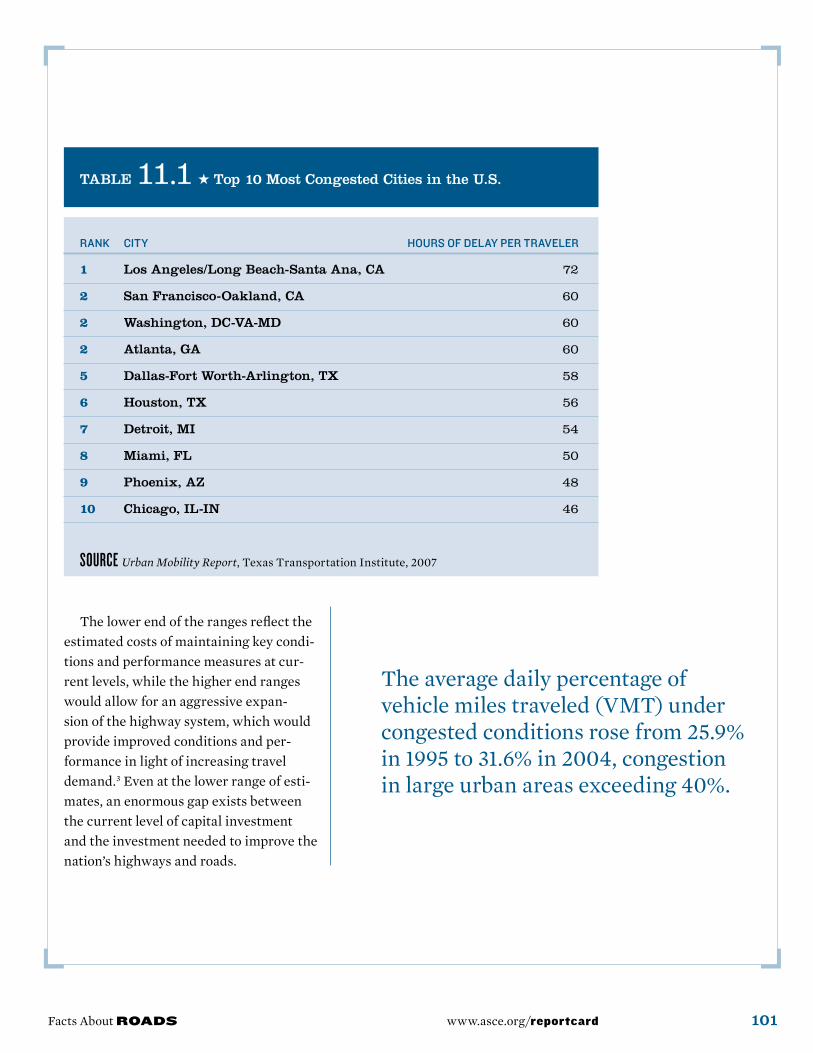
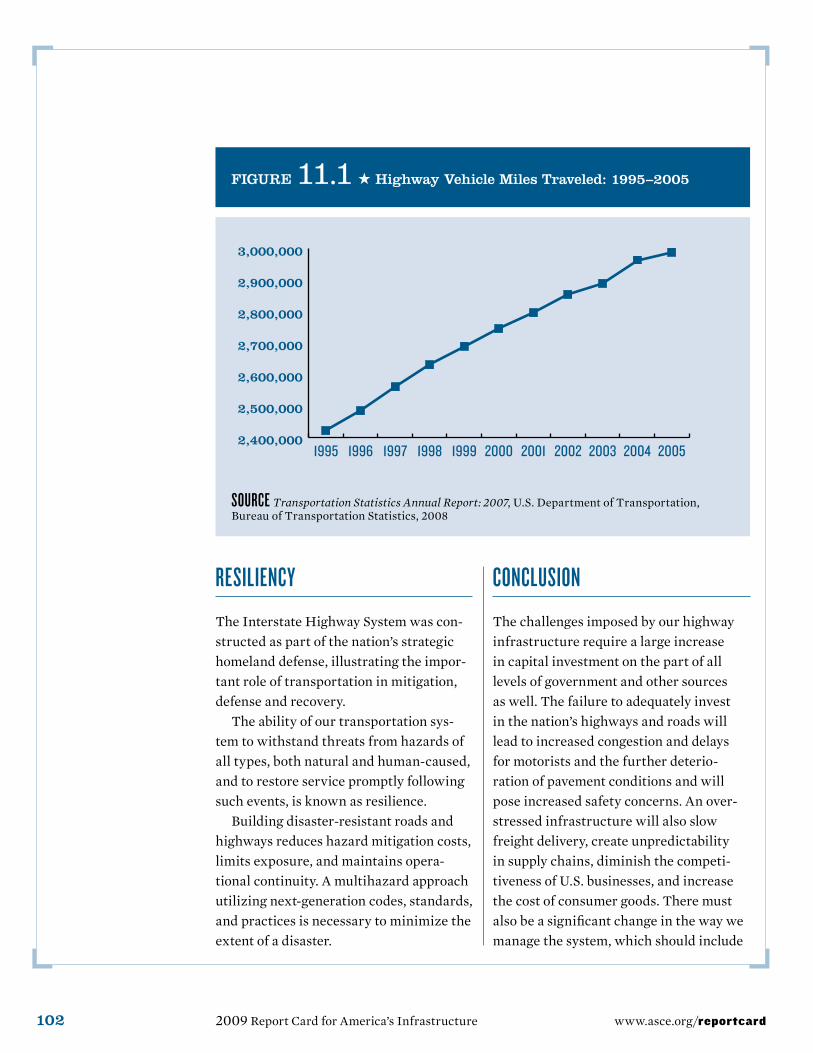
FIGURE 11.1 ★ Highway vehicle Miles Traveled: 1995–2005
2,400,000
2,500,000
2,600,000
2,700,000
2,800,000
2,900,000
3,000,000
SoURCE Transportation Statistics Annual Report: 2007, U.S. Department of Transportation, Bureau of Transportation Statistics, 2008
Facts About RoADS 103www.asce.org/reportcard
FAIRFAx coUNTy, vA ★ I-495 virginia HoT Lanes Project
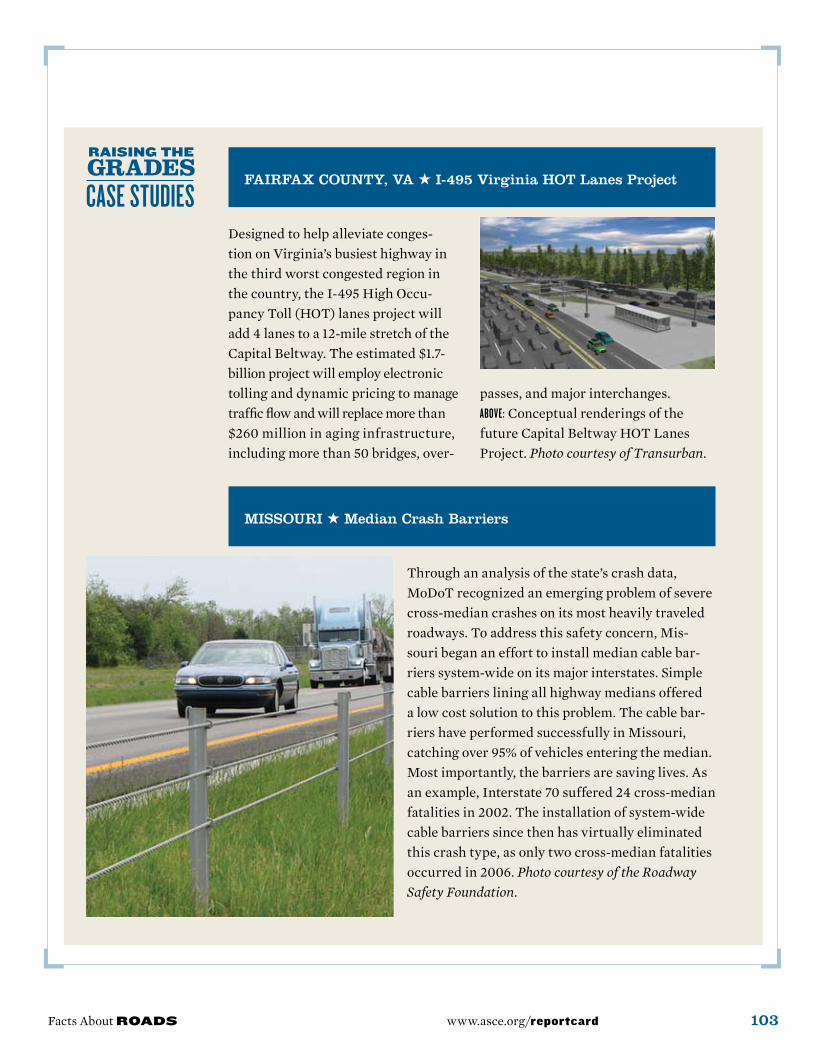
Designed to help alleviate conges-tion on Virginia’s busiest highway in the third worst congested region in the country, the I-495 High Occu-pancy Toll (HOT) lanes project will add 4 lanes to a 12-mile stretch of the Capital Beltway. The estimated $1.7-billion project will employ electronic tolling and dynamic pricing to manage traffic flow and will replace more than $260 million in aging infrastructure, including more than 50 bridges, over-
passes, and major interchanges. ABoVE: Conceptual renderings of the future Capital Beltway HOT Lanes Project. Photo courtesy of Transurban.
MISSoURI ★� Median crash Barriers
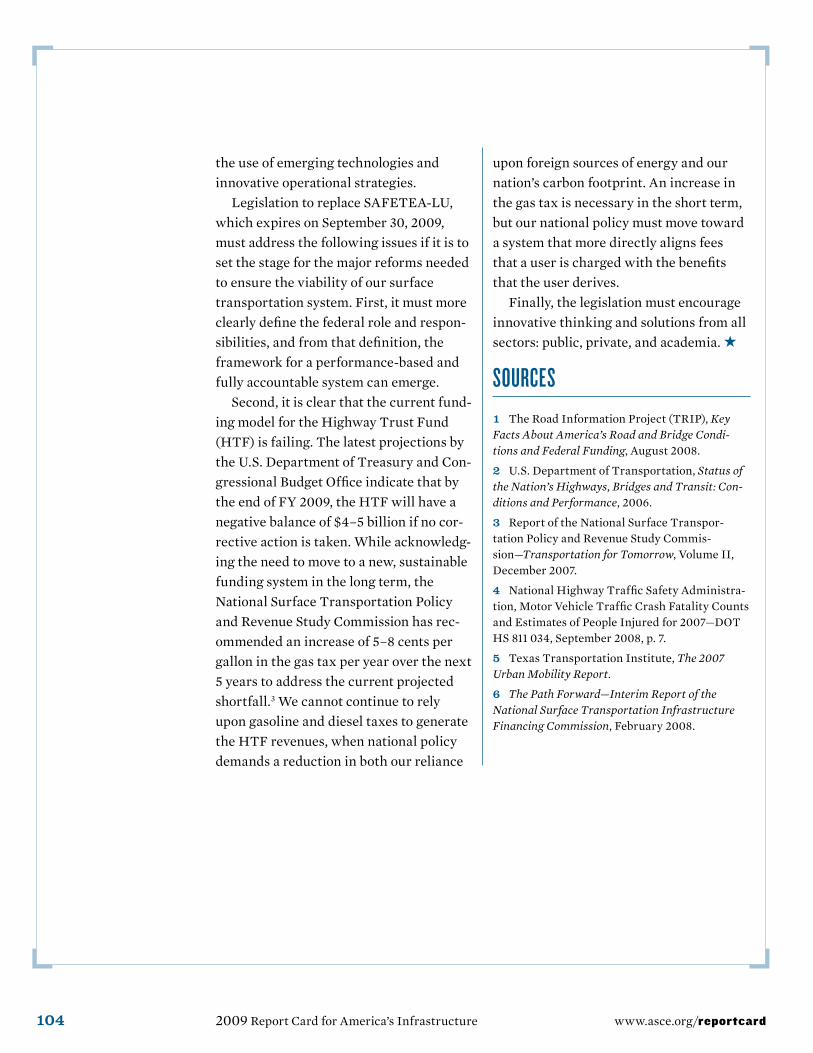
Through an analysis of the state’s crash data, MoDoT recognized an emerging problem of severe cross-median crashes on its most heavily traveled roadways. To address this safety concern, Mis-souri began an effort to install median cable bar-riers system-wide on its major interstates. Simple cable barriers lining all highway medians offered a low cost solution to this problem. The cable bar-riers have performed successfully in Missouri, catching over 95% of vehicles entering the median. Most importantly, the barriers are saving lives. As an example, Interstate 70 suffered 24 cross-median fatalities in 2002. The installation of system-wide cable barriers since then has virtually eliminated this crash type, as only two cross-median fatalities occurred in 2006. Photo courtesy of the Roadway Safety Foundation.
104 2009 Report Card for America’s Infrastructure www.asce.org/reportcard
the use of emerging technologies and innovative operational strategies.
Legislation to replace SAFETEA-LU, which expires on September 30, 2009, must address the following issues if it is to set the stage for the major reforms needed to ensure the viability of our surface transportation system. First, it must more clearly define the federal role and respon-sibilities, and from that definition, the framework for a performance-based and fully accountable system can emerge.
Second, it is clear that the current fund-ing model for the Highway Trust Fund (HTF) is failing. The latest projections by the U.S. Department of Treasury and Con-gressional Budget Office indicate that by the end of FY 2009, the HTF will have a negative balance of $4–5 billion if no cor-rective action is taken. While acknowledg-ing the need to move to a new, sustainable funding system in the long term, the National Surface Transportation Policy and Revenue Study Commission has rec-ommended an increase of 5–8 cents per gallon in the gas tax per year over the next 5 years to address the current projected shortfall.3 We cannot continue to rely upon gasoline and diesel taxes to generate the HTF revenues, when national policy demands a reduction in both our reliance
upon foreign sources of energy and our nation’s carbon footprint. An increase in the gas tax is necessary in the short term, but our national policy must move toward a system that more directly aligns fees that a user is charged with the benefits that the user derives.
Finally, the legislation must encourage innovative thinking and solutions from all sectors: public, private, and academia. ★
SoURCES1 The Road Information Project (TRIP), Key Facts About America’s Road and Bridge Condi-tions and Federal Funding, August 2008.
2 U.S. Department of Transportation, Status of the Nation’s Highways, Bridges and Transit: Con-ditions and Performance, 2006.
3 Report of the National Surface Transpor-tation Policy and Revenue Study Commis-sion—Transportation for Tomorrow, Volume II, December 2007.
4 National Highway Traffic Safety Administra-tion, Motor Vehicle Traffic Crash Fatality Counts and Estimates of People Injured for 2007—DOT HS 811 034, September 2008, p. 7.
5 Texas Transportation Institute, The 2007 Urban Mobility Report.
6 The Path Forward—Interim Report of the National Surface Transportation Infrastructure Financing Commission, February 2008.
Facts About RoADS 105www.asce.org/reportcard
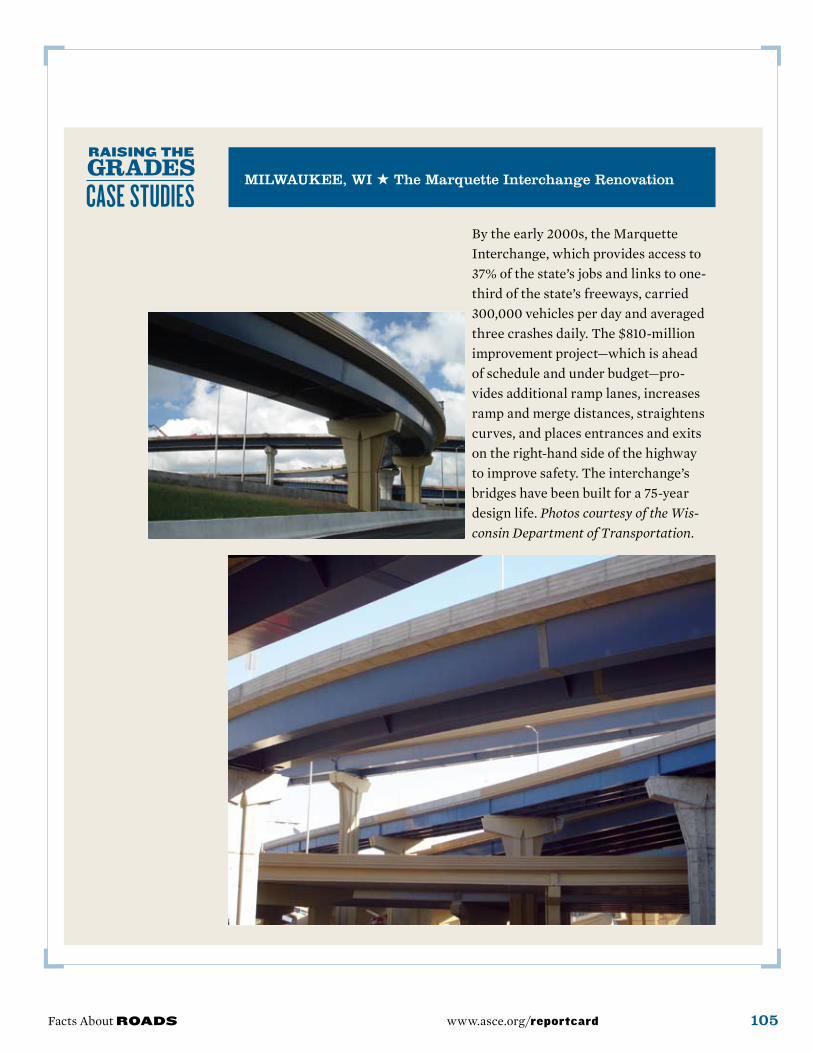
MILWAUKEE, WI ★ The Marquette Interchange Renovation
By the early 2000s, the Marquette Interchange, which provides access to 37% of the state’s jobs and links to one-third of the state’s freeways, carried 300,000 vehicles per day and averaged three crashes daily. The $810-million improvement project—which is ahead of schedule and under budget—pro-vides additional ramp lanes, increases ramp and merge distances, straightens curves, and places entrances and exits on the right-hand side of the highway to improve safety. The interchange’s bridges have been built for a 75-year design life. Photos courtesy of the Wis-consin Department of Transportation.