Embed Size (px)
Citation preview
AMERICAN MIDSTREAM PARTNERS, LP
FORM 10-Q(Quarterly Report)
Filed 11/10/14 for the Period Ending 09/30/14
Address 1400 16TH STREETSUITE 310DENVER, CO 80202
Telephone (720) 457-6060CIK 0001513965
Symbol AMIDSIC Code 4922 - Natural Gas Transmission
Industry Oil & Gas - IntegratedSector Energy
Fiscal Year 12/31
http://www.edgar-online.com© Copyright 2014, EDGAR Online, Inc. All Rights Reserved.
Distribution and use of this document restricted under EDGAR Online, Inc. Terms of Use.
UNITED STATES SECURITIES AND EXCHANGE COMMISSION
Washington, D.C. 20549
FORM 10-Q
For the quarterly period ended September 30, 2014
or
For the transition period from to
Commission File Number: 001-35257
AMERICAN MIDSTREAM PARTNERS, LP (Exact name of registrant as specified in its charter)
(720) 457-6060 (Registrant’s telephone number, including area code)
Indicate by check mark whether the registrant (1) has filed all reports required to be filed by Section 13 or 15(d) of the Securities Exchange Act of 1934 during the preceding 12 months (or for such shorter period that the registrant was required to file such reports), and (2) has been subject to such filing requirements for the past 90 days. � Yes � No
Indicate by check mark whether the registrant has submitted electronically and posted on its corporate Web site, if any, every Interactive Data File required to be submitted and posted pursuant to Rule 405 of Regulation S-T (§232.405 of this chapter) during the preceding 12 months (or for such shorter period that the registrant was required to submit and post such files). � Yes � No
Indicate by check mark whether the registrant is a large accelerated filer, an accelerated filer, a non-accelerated filer, or a smaller reporting company. See the definitions of “large accelerated filer,” “accelerated filer” and “smaller reporting company” in Rule 12b-2 of the Exchange Act.
Indicate by check mark whether the registrant is a shell company (as defined in Rule 12b-2 of the Exchange Act). � Yes � No
There were 15,775,018 common units, 5,585,611 Series A Units and 1,232,017 Series B Units of American Midstream Partners, LP outstanding as of November 6, 2014 . Our common units trade on the New York Stock Exchange under the ticker symbol “AMID.”
QUARTERLY REPORT PURSUANT TO SECTION 13 OR 15(d) OF THE SECURITIES EXCHANGE ACT OF 1934
� TRANSITION REPORT PURSUANT TO SECTION 13 OR 15(d) OF THE SECURITIES EXCHANGE ACT OF 1934
Delaware 27-0855785 (State or other jurisdiction of incorporation or organization)
(I.R.S. Employer Identification No.)
1400 16th Street, Suite 310
Denver, CO 80202 (Address of principal executive offices) (Zip code)
Large accelerated filer � Accelerated filer �
Non-accelerated filer � (Do not check if a smaller reporting company) Smaller reporting company �

TABLE OF CONTENTS
2
Page
PART I. FINANCIAL INFORMATION 4
Item 1. Financial Statements 4
Condensed Consolidated Balance Sheets as of September 30, 2014 and December 31, 2013 (unaudited) 4
Condensed Consolidated Statements of Operations for the three and nine months ended September 30, 2014 and 2013 (unaudited) 6
Condensed Consolidated Statements of Comprehensive Income for the three and nine months ended September 30, 2014 and 2013 (unaudited) 7
Condensed Consolidated Statements of Changes in Partners’ Capital and Noncontrolling Interest as of and for the nine months ended September 30, 2014 and 2013 (unaudited) 8
Condensed Consolidated Statements of Cash Flows for the nine months ended September 30, 2014 and 2013 (unaudited) 9
Notes to Unaudited Condensed Consolidated Financial Statements 11
Item 2. Management’s Discussion and Analysis of Financial Condition and Results of Operations 39
Cautionary Statement About Forward-Looking Statements 39
Overview 40
Recent Developments 40
Subsequent Event 41
Our Operations 42
How We Evaluate Our Operations 43
General Trends and Outlook 46
Liquidity and Capital Resources 54
Critical Accounting Policies 57
Recent Accounting Pronouncements 57
Item 3. Quantitative and Qualitative Disclosures About Market Risk 59
Item 4. Controls and Procedures 60
PART II. OTHER INFORMATION 60
Item 1. Legal Proceedings 61
Item 1A. Risk Factors 61
Item 6. Exhibits 62
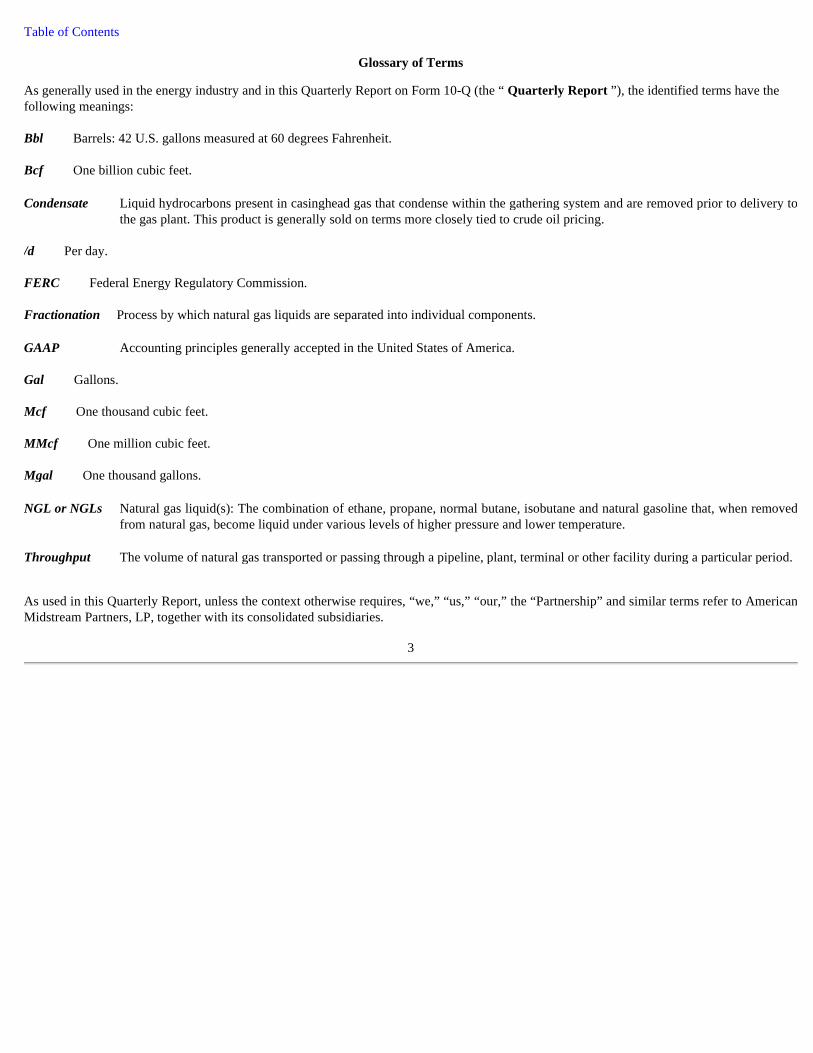
Table of Contents
Glossary of Terms
As generally used in the energy industry and in this Quarterly Report on Form 10-Q (the “ Quarterly Report ”), the identified terms have the following meanings: Bbl Barrels: 42 U.S. gallons measured at 60 degrees Fahrenheit. Bcf One billion cubic feet.
/d Per day. FERC Federal Energy Regulatory Commission. Fractionation Process by which natural gas liquids are separated into individual components.
Gal Gallons. Mcf One thousand cubic feet. MMcf One million cubic feet. Mgal One thousand gallons.
As used in this Quarterly Report, unless the context otherwise requires, “we,” “us,” “our,” the “Partnership” and similar terms refer to American Midstream Partners, LP, together with its consolidated subsidiaries.
3
Condensate Liquid hydrocarbons present in casinghead gas that condense within the gathering system and are removed prior to delivery to the gas plant. This product is generally sold on terms more closely tied to crude oil pricing.
GAAP Accounting principles generally accepted in the United States of America.
NGL or NGLs Natural gas liquid(s): The combination of ethane, propane, normal butane, isobutane and natural gasoline that, when removed from natural gas, become liquid under various levels of higher pressure and lower temperature.
Throughput The volume of natural gas transported or passing through a pipeline, plant, terminal or other facility during a particular period.
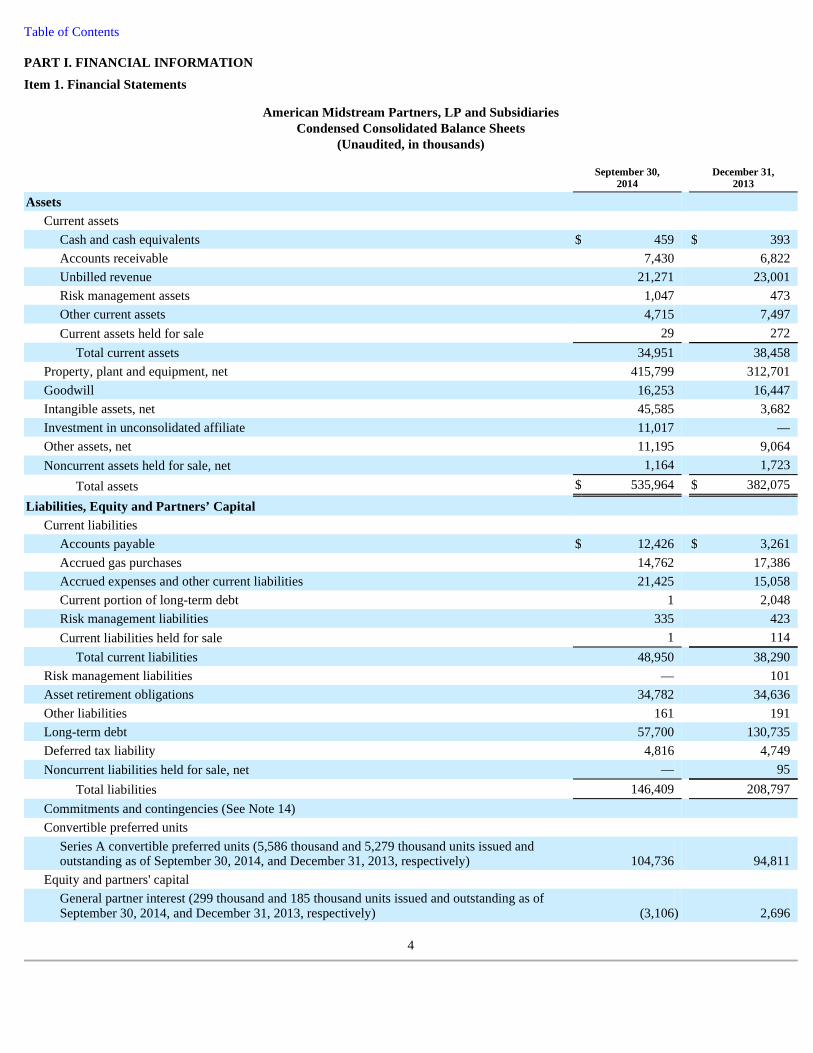
Table of Contents PART I. FINANCIAL INFORMATION
Item 1. Financial Statements
American Midstream Partners, LP and Subsidiaries Condensed Consolidated Balance Sheets
(Unaudited, in thousands)
4
September 30,
2014 December 31,
2013
Assets
Current assets
Cash and cash equivalents $ 459 $ 393 Accounts receivable 7,430 6,822 Unbilled revenue 21,271 23,001 Risk management assets 1,047 473 Other current assets 4,715 7,497 Current assets held for sale 29 272
Total current assets 34,951 38,458 Property, plant and equipment, net 415,799 312,701 Goodwill 16,253 16,447 Intangible assets, net 45,585 3,682 Investment in unconsolidated affiliate 11,017 — Other assets, net 11,195 9,064 Noncurrent assets held for sale, net 1,164 1,723
Total assets $ 535,964 $ 382,075
Liabilities, Equity and Partners’ Capital
Current liabilities
Accounts payable $ 12,426 $ 3,261 Accrued gas purchases 14,762 17,386 Accrued expenses and other current liabilities 21,425 15,058 Current portion of long-term debt 1 2,048 Risk management liabilities 335 423 Current liabilities held for sale 1 114
Total current liabilities 48,950 38,290 Risk management liabilities — 101 Asset retirement obligations 34,782 34,636 Other liabilities 161 191 Long-term debt 57,700 130,735 Deferred tax liability 4,816 4,749 Noncurrent liabilities held for sale, net — 95
Total liabilities 146,409 208,797 Commitments and contingencies (See Note 14)
Convertible preferred units
Series A convertible preferred units (5,586 thousand and 5,279 thousand units issued and outstanding as of September 30, 2014, and December 31, 2013, respectively) 104,736 94,811
Equity and partners' capital
General partner interest (299 thousand and 185 thousand units issued and outstanding as of September 30, 2014, and December 31, 2013, respectively) (3,106 ) 2,696
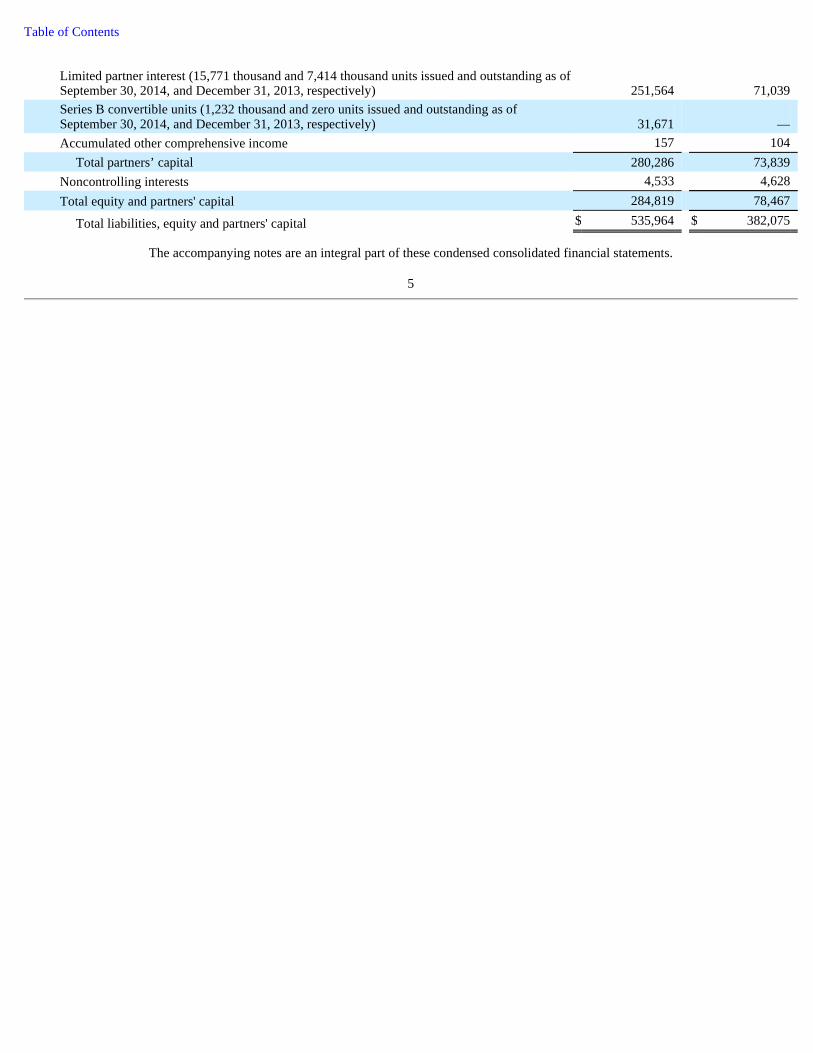
Table of Contents
The accompanying notes are an integral part of these condensed consolidated financial statements.
5
Limited partner interest (15,771 thousand and 7,414 thousand units issued and outstanding as of September 30, 2014, and December 31, 2013, respectively) 251,564 71,039 Series B convertible units (1,232 thousand and zero units issued and outstanding as of September 30, 2014, and December 31, 2013, respectively) 31,671 — Accumulated other comprehensive income 157 104
Total partners’ capital 280,286 73,839 Noncontrolling interests 4,533 4,628 Total equity and partners' capital 284,819 78,467
Total liabilities, equity and partners' capital $ 535,964 $ 382,075
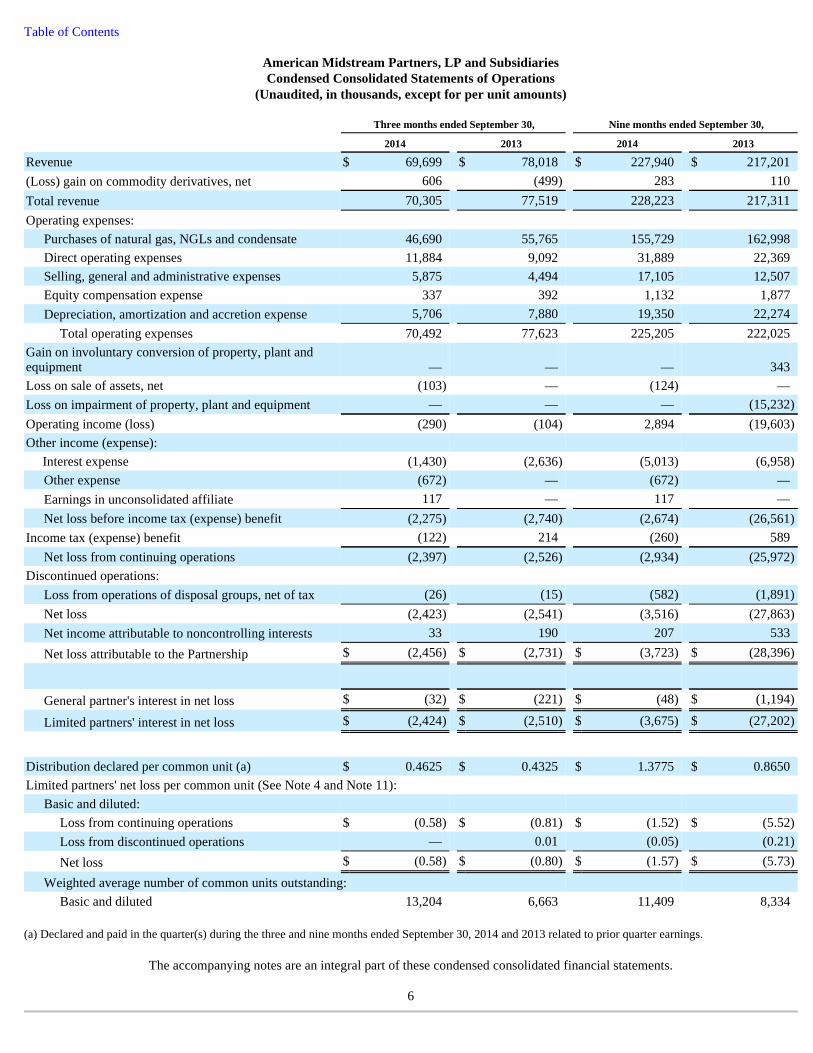
Table of Contents
American Midstream Partners, LP and Subsidiaries Condensed Consolidated Statements of Operations
(Unaudited, in thousands, except for per unit amounts)
(a) Declared and paid in the quarter(s) during the three and nine months ended September 30, 2014 and 2013 related to prior quarter earnings.
The accompanying notes are an integral part of these condensed consolidated financial statements.
6
Three months ended September 30, Nine months ended September 30,
2014 2013 2014 2013
Revenue $ 69,699 $ 78,018 $ 227,940 $ 217,201 (Loss) gain on commodity derivatives, net 606 (499 ) 283 110 Total revenue 70,305 77,519 228,223 217,311 Operating expenses:
Purchases of natural gas, NGLs and condensate 46,690 55,765 155,729 162,998 Direct operating expenses 11,884 9,092 31,889 22,369 Selling, general and administrative expenses 5,875 4,494 17,105 12,507 Equity compensation expense 337 392 1,132 1,877 Depreciation, amortization and accretion expense 5,706 7,880 19,350 22,274
Total operating expenses 70,492 77,623 225,205 222,025 Gain on involuntary conversion of property, plant and equipment — — — 343 Loss on sale of assets, net (103 ) — (124 ) — Loss on impairment of property, plant and equipment — — — (15,232 )
Operating income (loss) (290 ) (104 ) 2,894 (19,603 )
Other income (expense):
Interest expense (1,430 ) (2,636 ) (5,013 ) (6,958 )
Other expense (672 ) — (672 ) — Earnings in unconsolidated affiliate 117 — 117 — Net loss before income tax (expense) benefit (2,275 ) (2,740 ) (2,674 ) (26,561 )
Income tax (expense) benefit (122 ) 214 (260 ) 589 Net loss from continuing operations (2,397 ) (2,526 ) (2,934 ) (25,972 )
Discontinued operations:
Loss from operations of disposal groups, net of tax (26 ) (15 ) (582 ) (1,891 )
Net loss (2,423 ) (2,541 ) (3,516 ) (27,863 )
Net income attributable to noncontrolling interests 33 190 207 533
Net loss attributable to the Partnership $ (2,456 ) $ (2,731 ) $ (3,723 ) $ (28,396 )
General partner's interest in net loss $ (32 ) $ (221 ) $ (48 ) $ (1,194 )
Limited partners' interest in net loss $ (2,424 ) $ (2,510 ) $ (3,675 ) $ (27,202 )
Distribution declared per common unit (a) $ 0.4625 $ 0.4325 $ 1.3775 $ 0.8650 Limited partners' net loss per common unit (See Note 4 and Note 11):
Basic and diluted:
Loss from continuing operations $ (0.58 ) $ (0.81 ) $ (1.52 ) $ (5.52 )
Loss from discontinued operations — 0.01 (0.05 ) (0.21 )
Net loss $ (0.58 ) $ (0.80 ) $ (1.57 ) $ (5.73 )
Weighted average number of common units outstanding:
Basic and diluted 13,204 6,663 11,409 8,334

Table of Contents
American Midstream Partners, LP and Subsidiaries Condensed Consolidated Statements of Comprehensive Income
(Unaudited, in thousands)
The accompanying notes are an integral part of these condensed consolidated financial statements.
7
Three months ended September 30, Nine months ended September 30,
2014 2013 2014 2013
Net loss $ (2,423 ) $ (2,541 ) $ (3,516 ) $ (27,863 )
Unrealized gain (loss) on post retirement benefit plan assets and liabilities 7 (34 ) 53 (90 )
Comprehensive loss (2,416 ) (2,575 ) (3,463 ) (27,953 )
Less: Comprehensive income attributable to noncontrolling interests 33 190 207 533 Comprehensive loss attributable to Partnership $ (2,449 ) $ (2,765 ) $ (3,670 ) $ (28,486 )

Table of Contents
American Midstream Partners, LP and Subsidiaries Condensed Consolidated Statements of Changes in Partners’ Capital
and Noncontrolling Interest (Unaudited, in thousands)
The accompanying notes are an integral part of these condensed consolidated financial statements.
8
General Partner Interest
Limited Partner Interest
Series B Convertible
Units
Accumulated Other
Comprehensive Income
Total Partners' Capital
Noncontrolling Interest
Balances at December 31, 2012 $ 548 $ 79,266 $ — $ 351 $ 80,165 $ 7,438 Net (loss) income (1,194 ) (27,202 ) — — (28,396 ) 533 Unitholder contributions 35,196 — — — 35,196 — Unitholder distributions (340 ) (16,332 ) — — (16,672 ) — Fair value of Series A Units in excess of net asset received (312 ) (15,300 ) — — (15,612 ) — Net distributions to noncontrolling interest holders — — — — — (571 )
LTIP vesting (1,570 ) 1,570 — — — — LTIP tax netting unit repurchase — (400 ) — — (400 ) — Unit based compensation 1,824 — — — 1,824 — Other comprehensive loss — — — (90 ) (90 ) —
Balances at September 30, 2013 $ 34,152 $ 21,602 $ — $ 261 $ 56,015 $ 7,400
Balances at December 31, 2013 $ 2,696 $ 71,039 $ — $ 104 $ 73,839 $ 4,628 Net (loss) income (48 ) (3,675 ) — — (3,723 ) 207 Issuance of common units, net of offering costs — 204,335 — — 204,335 — Issuance of Series B convertible units — — 31,671 — 31,671 — Unitholder contributions 2,964 — — — 2,964 — Unitholder distributions (1,857 ) (27,968 ) — — (29,825 ) — Issuance and exercise of warrant (7,164 ) 7,164 — — — — Net distributions to noncontrolling interest owners — — — — — (273 )
Acquisition of noncontrolling interest — 21 — — 21 (29 )
LTIP vesting (696 ) 901 — — 205 — LTIP tax netting unit repurchase — (253 ) — — (253 ) — Unit based compensation 999 — — — 999 — Other comprehensive income — — — 53 53 —
Balances at September 30, 2014 $ (3,106 ) $ 251,564 $ 31,671 $ 157 $ 280,286 $ 4,533

Table of Contents
American Midstream Partners, LP and Subsidiaries Condensed Consolidated Statements of Cash Flows
(Unaudited, in thousands)
9
Nine months ended September 30,
2014 2013
Cash flows from operating activities
Net loss $ (3,516 ) $ (27,863 )
Adjustments to reconcile net loss to net cash provided by operating activities:
Depreciation, amortization and accretion expense 19,350 22,355 Amortization of deferred financing costs 1,894 975 Amortization of weather derivative premium 794 378 Unrealized (gain) loss on commodity derivatives, net (592 ) 1,159 Non-cash compensation expense 1,200 1,824 OPEB plan net periodic benefit (35 ) (55 )
Gain on involuntary conversion of property, plant and equipment — (343 )
Loss on sale of assets 209 — Loss on impairment of property, plant and equipment — 15,232 Loss on impairment of noncurrent assets held for sale 673 1,807 Deferred tax benefit (58 ) (662 )
Changes in operating assets and liabilities, net:
Accounts receivable (599 ) 397 Unbilled revenue 1,913 (1,970 )
Risk management assets and liabilities (965 ) (1,147 )
Other current assets 2,858 602 Other assets, net (608 ) (67 )
Accounts payable 624 121 Accrued gas purchases (2,734 ) 273 Accrued expenses and other current liabilities (1,446 ) 2,685 Asset retirement obligations (690 ) — Other liabilities (32 ) (114 )
Net cash provided by operating activities 18,240 15,587 Cash flows from investing activities
Cost of acquisitions (110,909 ) — Additions to property, plant and equipment (41,257 ) (22,842 )
Proceeds from disposals of property, plant and equipment 6,323 — Insurance proceeds from involuntary conversion of property, plant and equipment — 482 Equity method investment (12,000 ) — Proceeds from equity method investment, return of capital 983 —
Net cash used in investing activities (156,860 ) (22,360 )
Cash flows from financing activities
Proceeds from issuance of common units, net of offering costs 204,335 — Unitholder contributions 2,896 13,075 Unitholder distributions (19,549 ) (12,458 )
Issuance of Series A convertible preferred units, net — 14,393 Issuance of Series B Units 30,000 — Acquisition of noncontrolling interest (8 ) — Net distributions to noncontrolling interest owners (273 ) (571 )

Table of Contents
The accompanying notes are an integral part of these condensed consolidated financial statements.
10
LTIP tax netting unit repurchase (253 ) (400 )
Payments of deferred debt issuance costs (3,380 ) (1,509 )
Payments on other debt (2,217 ) (2,231 )
Borrowings on other debt 170 1,495 Payments on loan to affiliate — (1,072 )
Payments on bank loans — 6,200 Payments on long-term debt (212,670 ) (99,821 )
Borrowings on long-term debt 139,635 92,571 Net cash provided by financing activities 138,686 9,672 Net increase in cash and cash equivalents 66 2,899
Cash and cash equivalents
Beginning of period 393 576
End of period $ 459 $ 3,475
Supplemental cash flow information
Interest payments, net $ 4,064 $ 5,051 Supplemental non-cash information
Increase (decrease) in accrued property, plant and equipment $ 17,746 $ (6,080 )
Net assets contributed in the Blackwater Acquisition (see Note 3) — 22,129 Net assets contributed in exchange for the issuance of Series A convertible preferred units — 59,994 Fair value of Series A Units in excess of net assets received — 15,612 Accrued and in-kind unitholder distribution for Series A Units 9,925 2,912 In-kind unitholder distribution for Series B Units 1,671 —
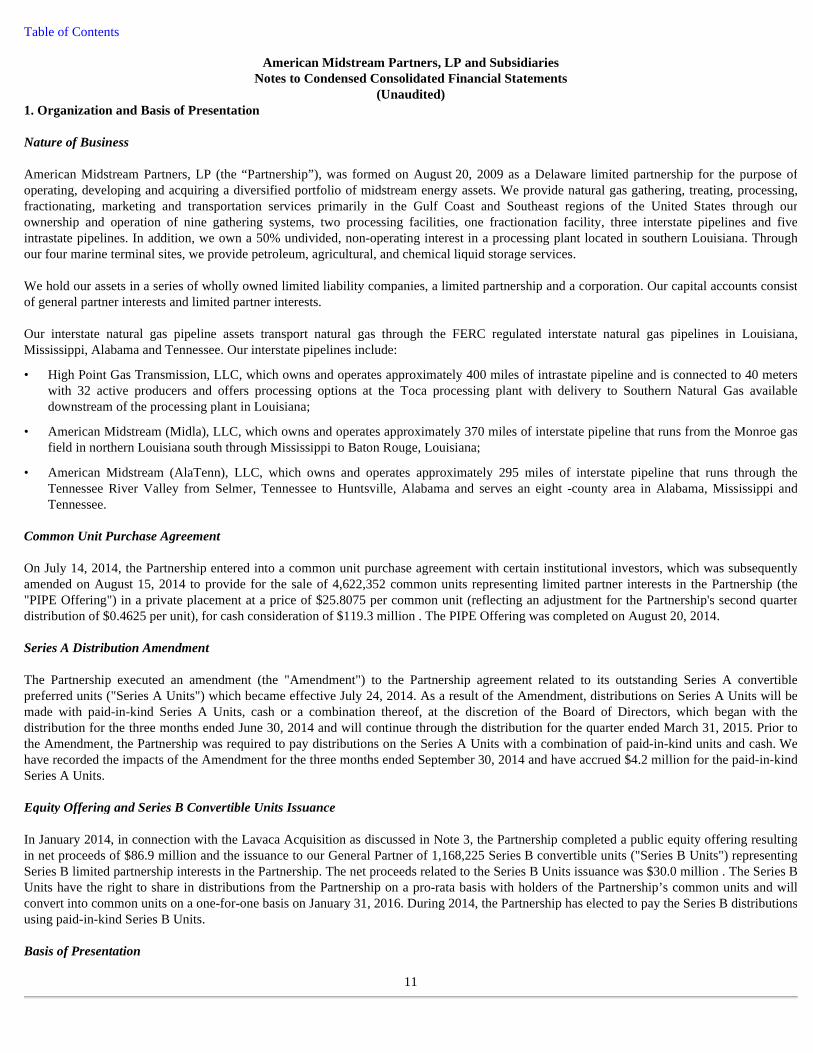
Table of Contents
American Midstream Partners, LP and Subsidiaries Notes to Condensed Consolidated Financial Statements
(Unaudited) 1. Organization and Basis of Presentation Nature of Business American Midstream Partners, LP (the “Partnership”), was formed on August 20, 2009 as a Delaware limited partnership for the purpose of operating, developing and acquiring a diversified portfolio of midstream energy assets. We provide natural gas gathering, treating, processing, fractionating, marketing and transportation services primarily in the Gulf Coast and Southeast regions of the United States through our ownership and operation of nine gathering systems, two processing facilities, one fractionation facility, three interstate pipelines and five intrastate pipelines. In addition, we own a 50% undivided, non-operating interest in a processing plant located in southern Louisiana. Through our four marine terminal sites, we provide petroleum, agricultural, and chemical liquid storage services. We hold our assets in a series of wholly owned limited liability companies, a limited partnership and a corporation. Our capital accounts consist of general partner interests and limited partner interests. Our interstate natural gas pipeline assets transport natural gas through the FERC regulated interstate natural gas pipelines in Louisiana, Mississippi, Alabama and Tennessee. Our interstate pipelines include:
Common Unit Purchase Agreement On July 14, 2014, the Partnership entered into a common unit purchase agreement with certain institutional investors, which was subsequently amended on August 15, 2014 to provide for the sale of 4,622,352 common units representing limited partner interests in the Partnership (the "PIPE Offering") in a private placement at a price of $25.8075 per common unit (reflecting an adjustment for the Partnership's second quarter distribution of $0.4625 per unit), for cash consideration of $119.3 million . The PIPE Offering was completed on August 20, 2014. Series A Distribution Amendment The Partnership executed an amendment (the "Amendment") to the Partnership agreement related to its outstanding Series A convertible preferred units ("Series A Units") which became effective July 24, 2014. As a result of the Amendment, distributions on Series A Units will be made with paid-in-kind Series A Units, cash or a combination thereof, at the discretion of the Board of Directors, which began with the distribution for the three months ended June 30, 2014 and will continue through the distribution for the quarter ended March 31, 2015. Prior to the Amendment, the Partnership was required to pay distributions on the Series A Units with a combination of paid-in-kind units and cash. We have recorded the impacts of the Amendment for the three months ended September 30, 2014 and have accrued $4.2 million for the paid-in-kind Series A Units. Equity Offering and Series B Convertible Units Issuance In January 2014, in connection with the Lavaca Acquisition as discussed in Note 3, the Partnership completed a public equity offering resulting in net proceeds of $86.9 million and the issuance to our General Partner of 1,168,225 Series B convertible units ("Series B Units") representing Series B limited partnership interests in the Partnership. The net proceeds related to the Series B Units issuance was $30.0 million . The Series B Units have the right to share in distributions from the Partnership on a pro-rata basis with holders of the Partnership’s common units and will convert into common units on a one-for-one basis on January 31, 2016. During 2014, the Partnership has elected to pay the Series B distributions using paid-in-kind Series B Units. Basis of Presentation
11
• High Point Gas Transmission, LLC, which owns and operates approximately 400 miles of intrastate pipeline and is connected to 40 meters with 32 active producers and offers processing options at the Toca processing plant with delivery to Southern Natural Gas available downstream of the processing plant in Louisiana;
• American Midstream (Midla), LLC, which owns and operates approximately 370 miles of interstate pipeline that runs from the Monroe gas field in northern Louisiana south through Mississippi to Baton Rouge, Louisiana;
• American Midstream (AlaTenn), LLC, which owns and operates approximately 295 miles of interstate pipeline that runs through the Tennessee River Valley from Selmer, Tennessee to Huntsville, Alabama and serves an eight -county area in Alabama, Mississippi and Tennessee.
Table of Contents These unaudited condensed consolidated financial statements have been prepared in accordance with GAAP for interim financial information. Accordingly, they do not include all of the information and footnotes required by GAAP for complete financial statements. The year-end balance sheet data was derived from consolidated audited financial statements but does not include disclosures required by GAAP for annual periods. We have made reclassifications to amounts reported in prior period condensed consolidated financial statements to conform to our current year presentation. These reclassifications did not have an impact on net income for the period previously reported. The information furnished herein reflects all normal recurring adjustments which are, in the opinion of management, necessary for a fair statement of financial position and results of operations for the respective interim periods. The financial results for the three and nine months ended September 30, 2013 have been reclassified to present an asset group previously presented as held for sale as held and used. Our financial results for the three and nine months ended September 30, 2014 are not necessarily indicative of the results that may be expected for the full year ended December 31, 2014 . These unaudited condensed consolidated financial statements should be read in conjunction with our consolidated financial statements and notes thereto included in i) our Annual Report on Form 10-K for the year ended December 31, 2013 (“Annual Report”) filed on March 11, 2014 and ii) our Annual Report on Form 10-K/A that was filed with the Securities and Exchange Commission ("SEC") on May 12, 2014, which updated portions of our annual report. Consolidation Policy Our condensed consolidated financial statements include our accounts and those of our subsidiaries in which we have a controlling interest. We hold a 50% undivided interest in the Burns Point gas processing facility in which we are responsible for our proportionate share of the costs and expenses of the facility. Our condensed consolidated financial statements reflect our proportionate share of the revenues, expenses, assets and liabilities of this undivided interest. As of September 30, 2014 , we also hold a 92.2% undivided interest in the Chatom Processing and Fractionation facility (the "Chatom System"). Our condensed consolidated financial statements reflect the accounts of the Chatom System and the interests in the Chatom System held by non-affiliated working interest owners are reflected as noncontrolling interests in the Partnership's condensed consolidated financial statements. The Partnership accounts for its 66.7% non-operated interest in Main Pass Oil Gathering Company ("MPOG") as an equity method investments under ASC 323, as the Partnership exercises significant influence but does not control nor is the primary beneficiary of MPOG. Use of Estimates When preparing condensed consolidated financial statements in conformity with GAAP, management must make estimates and assumptions based on information available at the time. These estimates and assumptions affect the reported amounts of assets, liabilities, revenues and expenses, as well as the disclosures of contingent assets and liabilities as of the date of the financial statements. Estimates and judgments are based on information available at the time such estimates and judgments are made. Adjustments made with respect to the use of these estimates and judgments often relate to information not previously available. Uncertainties with respect to such estimates and judgments are inherent in the preparation of financial statements. Estimates and judgments are used in, among other things i) estimating unbilled revenues, accrued gas purchases and operating and general and administrative costs, ii) developing fair value assumptions, including estimates of future cash flows and discount rates, iii) analyzing long-lived assets, goodwill and intangible assets for possible impairment, iv) estimating the useful lives of assets and v) determining amounts to accrue for contingencies, guarantees and indemnifications. Actual results, therefore, could differ materially from estimated amounts. 2. Recent Accounting Pronouncements In July 2013, the FASB issued Accounting Standards Update ("ASU ") No. 2013-11, Income Taxes (Topic 740): Presentation of an Unrecognized Tax Benefit When a Net Operating Loss Carryforward, a Similar Tax Loss, or a Tax Credit Carryforward Exists (a consensus of the FASB Emerging Issues Task Force). This guidance was issued related to the presentation of an unrecognized tax benefit when a net operating loss carryforward, a similar tax loss or a tax credit carryforward exists. The updated guidance requires an entity to net its unrecognized tax benefits against the deferred tax assets for all same jurisdiction net operating loss carryforward, a similar tax loss, or tax credit carryforwards. A gross presentation will be required only if such carryforwards are not available or would not be used by the entity to settle any additional income taxes resulting from disallowance of the uncertain tax position. The update was effective for the Partnership on January 1, 2014 and did not have a material impact on its condensed consolidated financial statements.
12
Table of Contents In April 2014, the FASB issued ASU No. 2014-08, Reporting Discontinued Operations and Disclosures of Disposals of Components of an Entity. This guidance amends the requirements for reporting discontinued operations and requires expanded disclosures for individually significant components of an entity that either have been disposed of or are classified as held for sale, but do not qualify for discontinued operations reporting. Only those disposals of components of an entity that represent a strategic shift that has (or will have) a major effect on an entity’s operations and financial results will be reported as discontinued operations in the financial statements. ASU 2014-08 is effective for annual periods, and interim periods within those years, beginning on or after December 15, 2014 and is applied prospectively. Early adoption is permitted, but only for disposals or classifications as held for sale that have not been reported in financial statements previously issued or available for issuance. The update was early adopted by the Partnership as of April 1, 2014 and did not have a material impact on its condensed consolidated financial statements. In May 2014, the FASB issued ASU No. 2014-09, Revenue from Contracts with Customers (Topic 606), which amends the existing accounting standards for revenue recognition. The standard requires an entity to recognize revenue in a manner that depicts the transfer of goods or services to customers at an amount that reflects the consideration to which the entity expects to be entitled in exchange for those goods or services. The guidance in ASU 2014-09 is effective for annual reporting periods beginning after December 15, 2016, including interim periods therein. Early adoption is not permitted. The Partnership is currently evaluating the method of adoption and impact this standard will have on its financial statements and related disclosures. In August 2014, the FASB issued ASU No. 2014-15, Presentation of Financial Statements-Going Concern (Topic 205-40): Disclosure of Uncertainties about an Entity’s Ability to Continue as a Going Concern. This guidance provides additional information to guide management's evaluation of whether there are conditions or events, considered in the aggregate, that raise substantial doubt about the entity’s ability to continue as a going concern within one year after the date that the financial statements are issued. The update is effective for annual periods beginning on or after December 15, 2016. The Partnership is currently evaluating the impact of this standard on its financial statements and does not believe there will be a material impact. 3. Acquisitions and Divestitures Lavaca Acquisition On January 31, 2014, the Partnership acquired approximately 120 miles of high- and low-pressure pipelines ranging from four to eight inches in diameter with over 9,000 horsepower of leased compression, and associated facilities located in the Eagle Ford shale in Gonzales and Lavaca Counties, Texas (the “Lavaca Acquisition”). The Lavaca Acquisition was financed with a portion of the net proceeds from the Partnership’s January 2014 equity offering of $86.9 million and proceeds of $30.0 million from the issuance to our General Partner of 1,168,225 Series B Units. The Lavaca Acquisition qualified as a business combination in accordance with ASC 805, Business Combinations , and, as such, the Partnership engaged a third party to estimate the fair value of the assets as of the effective date of the acquisition. A combination of the income and cost approaches were utilized to estimate the fair value of the assets. These fair value measurements are based on significant inputs not observable in the market and thus represent a Level 3 measurement as defined by ASC 820, Fair Value Measurement . Primarily using the cost approach to value the physical assets, the fair value estimates are based on i) replacement cost estimates using third party data based on installations of similar assets and ii) estimated depreciation on the assets based on third party sources and analysis of the life and use of the assets. It was determined as part of the fair value analysis of the acquisition, that the Partnership acquired separately identifiable intangible assets. The Lavaca Acquisition includes a 25 -year gas gathering agreement which states that Penn Virginia Corporation (NYSE: PVA) ("PVA") will dedicate certain acreage and all related future production to the gathering infrastructure included in the acquisition. In accordance with ASC 805, contract based intangible assets include the value of rights derived from contractual agreements. The Partnership will receive incremental value from PVA’s development of the reserves within the dedicated acreage and, therefore, it was determined that the dedicated acreage represents intangible assets acquired with the Lavaca Acquisition. The Partnership will amortize the Lavaca Acquisition intangibles using the straight-line method over the life of the related reserves within the dedicated acreage and recognize $1.5 million of amortization expense annually. Primarily using the income approach to value the intangible assets, the fair value estimates are based on i) an assumed discount rate of 10.5% ; ii) present value of estimated future cash flows; iii) estimated timing and amounts of future operating and development costs; iv) forward market prices as of December 2013 for natural gas and crude oil; and v) an increase in throughput volumes through 2019, declining thereafter.
13
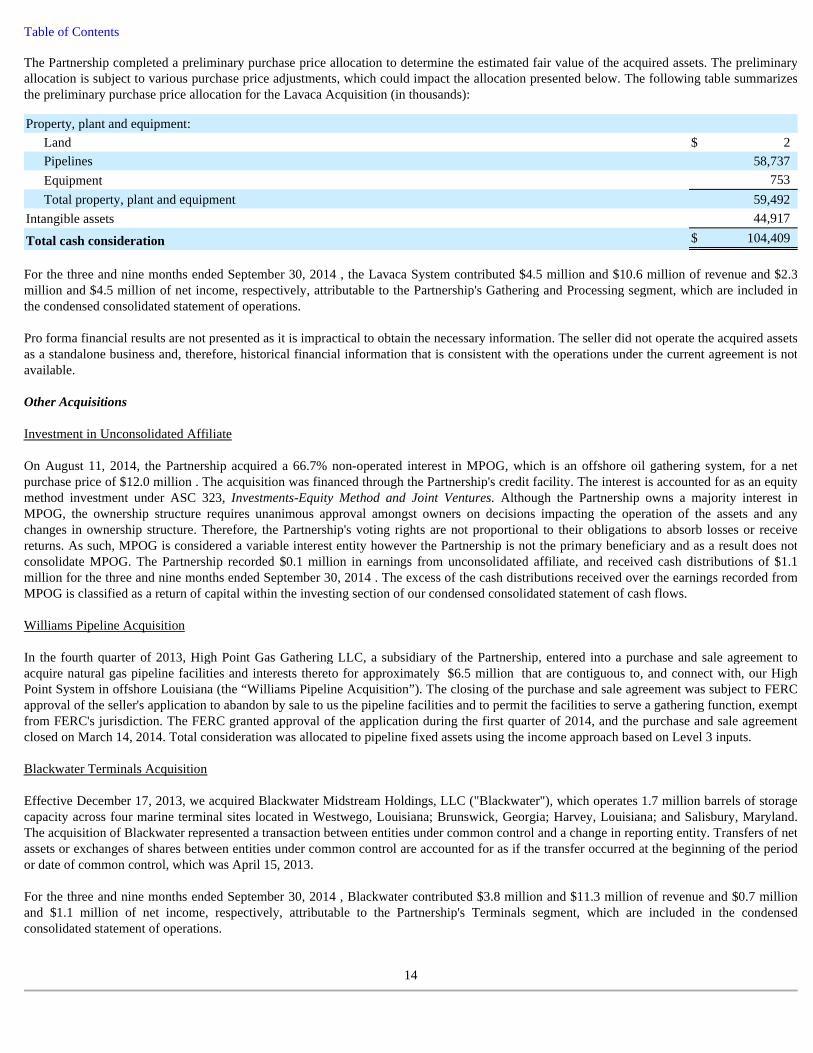
Table of Contents The Partnership completed a preliminary purchase price allocation to determine the estimated fair value of the acquired assets. The preliminary allocation is subject to various purchase price adjustments, which could impact the allocation presented below. The following table summarizes the preliminary purchase price allocation for the Lavaca Acquisition (in thousands):
For the three and nine months ended September 30, 2014 , the Lavaca System contributed $4.5 million and $10.6 million of revenue and $2.3 million and $4.5 million of net income, respectively, attributable to the Partnership's Gathering and Processing segment, which are included in the condensed consolidated statement of operations. Pro forma financial results are not presented as it is impractical to obtain the necessary information. The seller did not operate the acquired assets as a standalone business and, therefore, historical financial information that is consistent with the operations under the current agreement is not available. Other Acquisitions Investment in Unconsolidated Affiliate On August 11, 2014, the Partnership acquired a 66.7% non-operated interest in MPOG, which is an offshore oil gathering system, for a net purchase price of $12.0 million . The acquisition was financed through the Partnership's credit facility. The interest is accounted for as an equity method investment under ASC 323, Investments-Equity Method and Joint Ventures. Although the Partnership owns a majority interest in MPOG, the ownership structure requires unanimous approval amongst owners on decisions impacting the operation of the assets and any changes in ownership structure. Therefore, the Partnership's voting rights are not proportional to their obligations to absorb losses or receive returns. As such, MPOG is considered a variable interest entity however the Partnership is not the primary beneficiary and as a result does not consolidate MPOG. The Partnership recorded $0.1 million in earnings from unconsolidated affiliate, and received cash distributions of $1.1 million for the three and nine months ended September 30, 2014 . The excess of the cash distributions received over the earnings recorded from MPOG is classified as a return of capital within the investing section of our condensed consolidated statement of cash flows. Williams Pipeline Acquisition In the fourth quarter of 2013, High Point Gas Gathering LLC, a subsidiary of the Partnership, entered into a purchase and sale agreement to acquire natural gas pipeline facilities and interests thereto for approximately $6.5 million that are contiguous to, and connect with, our High Point System in offshore Louisiana (the “Williams Pipeline Acquisition”). The closing of the purchase and sale agreement was subject to FERC approval of the seller's application to abandon by sale to us the pipeline facilities and to permit the facilities to serve a gathering function, exempt from FERC's jurisdiction. The FERC granted approval of the application during the first quarter of 2014, and the purchase and sale agreement closed on March 14, 2014. Total consideration was allocated to pipeline fixed assets using the income approach based on Level 3 inputs. Blackwater Terminals Acquisition Effective December 17, 2013, we acquired Blackwater Midstream Holdings, LLC ("Blackwater"), which operates 1.7 million barrels of storage capacity across four marine terminal sites located in Westwego, Louisiana; Brunswick, Georgia; Harvey, Louisiana; and Salisbury, Maryland. The acquisition of Blackwater represented a transaction between entities under common control and a change in reporting entity. Transfers of net assets or exchanges of shares between entities under common control are accounted for as if the transfer occurred at the beginning of the period or date of common control, which was April 15, 2013. For the three and nine months ended September 30, 2014 , Blackwater contributed $3.8 million and $11.3 million of revenue and $0.7 million and $1.1 million of net income, respectively, attributable to the Partnership's Terminals segment, which are included in the condensed consolidated statement of operations.
14
Property, plant and equipment:
Land $ 2 Pipelines 58,737 Equipment 753 Total property, plant and equipment 59,492
Intangible assets 44,917
Total cash consideration $ 104,409
Table of Contents Subsequent to the acquisition of Blackwater, for the three and nine months ended September 30, 2013 , Blackwater contributed $3.5 million and $6.3 million of revenue and $0.1 million and $0.7 million of net loss, respectively, attributable to the Partnership's Terminals segment, which are included in the condensed consolidated statement of operations. High Point System Acquisition Effective April 15, 2013, our General Partner contributed to us the High Point System, consisting of 100% of the limited liability company interests in High Point Gas Transmission, LLC and High Point Gas Gathering, LLC. The High Point System entities own midstream assets consisting of approximately 700 miles of natural gas and liquids pipeline assets located in southeast Louisiana, in the Plaquemines and St. Bernard's Parishes, and the shallow water and deep shelf Gulf of Mexico, including the Mississippi Canyon, Viosca Knoll, West Delta, Main Pass, South Pass and Breton Sound zones. Natural gas is collected at more than 75 receipt points that connect hundreds of wells with an emphasis on oil and liquids-rich reservoirs. For the three and nine months ended September 30, 2014 , the High Point System contributed $6.4 million and $22.4 million of revenue and $2.6 million and $10.4 million of net income, respectively, attributable to the Partnership's Transmission segment, which are included in the condensed consolidated statement of operations. Subsequent to the contribution from our General Partner, for the three and nine months ended September 30, 2013 , the High Point System contributed $10.7 million and $19.7 million , respectively, of revenue and $1.2 million and $2.7 million , respectively, of net income, attributable to the Partnership's Transmission segment, which are included in the condensed consolidated statement of operations. Madison Divestiture On March 31, 2014, the Partnership completed the sale of certain gathering and processing assets in Madison County, Texas. We received $6.1 million in cash proceeds related to the sale. The Partnership recognized a $3.0 million impairment charge related to these assets for the year ended December 31, 2013, which wrote down the assets to a carrying value of $6.1 million as of December 31, 2013. 4. Discontinued Operations We classify long-lived assets to be disposed of through sales that meet specific criteria as held for sale. We cease depreciating those assets effective on the date the asset is classified as held for sale. We record those assets at the lower of their carrying value or the estimated fair value less the cost to sell. Until the assets are disposed of, an estimate of the fair value is re-determined when related events or circumstances change. During the second quarter of 2013, the board of directors of our General Partner approved a plan to sell certain non-strategic gathering and processing assets which meet specific criteria, qualifying them as held for sale. Subsequently, as part of the Blackwater Acquisition described in Note 3, we acquired long-lived terminal assets classified as held for sale. As a result of the planned divestiture of these non-strategic midstream assets, we have accounted for these disposal groups as discontinued operations within our Gathering and Processing and Terminal segments. Accordingly, we reclassified and excluded the disposal groups' results of operations from our results of continuing operations and reported the disposal groups' results of operations as Loss from operations of disposal groups, net of tax in our accompanying condensed consolidated statement of operations for all periods presented. We did not, however, elect to present separately the operating, investing and financing cash flows related to the disposal groups in our accompanying condensed consolidated statement of cash flows as this activity was immaterial for all periods presented. The following table presents the revenue and expenses and Loss from operations of disposal groups, net of tax associated with the assets classified as held for sale for the three and nine months ended September 30, 2014 and 2013 (in thousands, except per unit amounts):
15
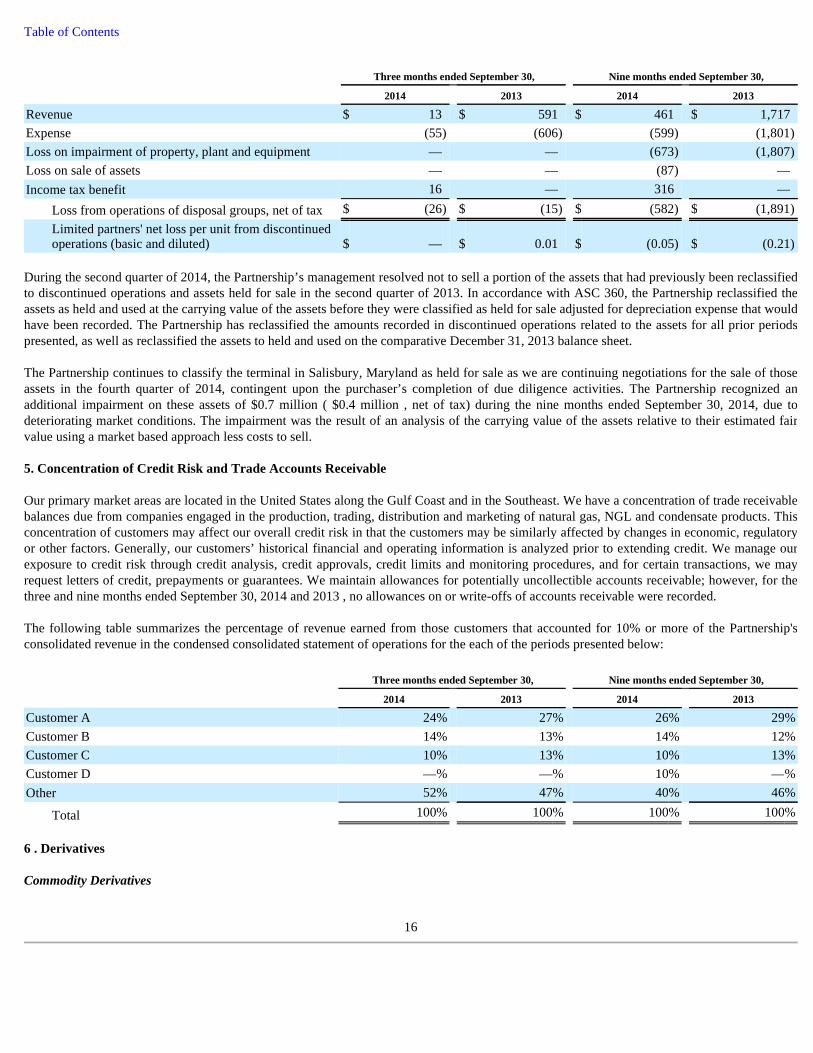
Table of Contents
During the second quarter of 2014, the Partnership’s management resolved not to sell a portion of the assets that had previously been reclassified to discontinued operations and assets held for sale in the second quarter of 2013. In accordance with ASC 360, the Partnership reclassified the assets as held and used at the carrying value of the assets before they were classified as held for sale adjusted for depreciation expense that would have been recorded. The Partnership has reclassified the amounts recorded in discontinued operations related to the assets for all prior periods presented, as well as reclassified the assets to held and used on the comparative December 31, 2013 balance sheet. The Partnership continues to classify the terminal in Salisbury, Maryland as held for sale as we are continuing negotiations for the sale of those assets in the fourth quarter of 2014, contingent upon the purchaser’s completion of due diligence activities. The Partnership recognized an additional impairment on these assets of $0.7 million ( $0.4 million , net of tax) during the nine months ended September 30, 2014, due to deteriorating market conditions. The impairment was the result of an analysis of the carrying value of the assets relative to their estimated fair value using a market based approach less costs to sell. 5. Concentration of Credit Risk and Trade Accounts Receivable Our primary market areas are located in the United States along the Gulf Coast and in the Southeast. We have a concentration of trade receivable balances due from companies engaged in the production, trading, distribution and marketing of natural gas, NGL and condensate products. This concentration of customers may affect our overall credit risk in that the customers may be similarly affected by changes in economic, regulatory or other factors. Generally, our customers’ historical financial and operating information is analyzed prior to extending credit. We manage our exposure to credit risk through credit analysis, credit approvals, credit limits and monitoring procedures, and for certain transactions, we may request letters of credit, prepayments or guarantees. We maintain allowances for potentially uncollectible accounts receivable; however, for the three and nine months ended September 30, 2014 and 2013 , no allowances on or write-offs of accounts receivable were recorded. The following table summarizes the percentage of revenue earned from those customers that accounted for 10% or more of the Partnership's consolidated revenue in the condensed consolidated statement of operations for the each of the periods presented below:
6 . Derivatives Commodity Derivatives
16
Three months ended September 30, Nine months ended September 30,
2014 2013 2014 2013
Revenue $ 13 $ 591 $ 461 $ 1,717 Expense (55 ) (606 ) (599 ) (1,801 )
Loss on impairment of property, plant and equipment — — (673 ) (1,807 )
Loss on sale of assets — — (87 ) — Income tax benefit 16 — 316 —
Loss from operations of disposal groups, net of tax $ (26 ) $ (15 ) $ (582 ) $ (1,891 )
Limited partners' net loss per unit from discontinued operations (basic and diluted) $ — $ 0.01 $ (0.05 ) $ (0.21 )
Three months ended September 30, Nine months ended September 30,
2014 2013 2014 2013
Customer A 24 % 27 % 26 % 29 %
Customer B 14 % 13 % 14 % 12 %
Customer C 10 % 13 % 10 % 13 %
Customer D —% —% 10 % —%
Other 52 % 47 % 40 % 46 %
Total 100 % 100 % 100 % 100 %
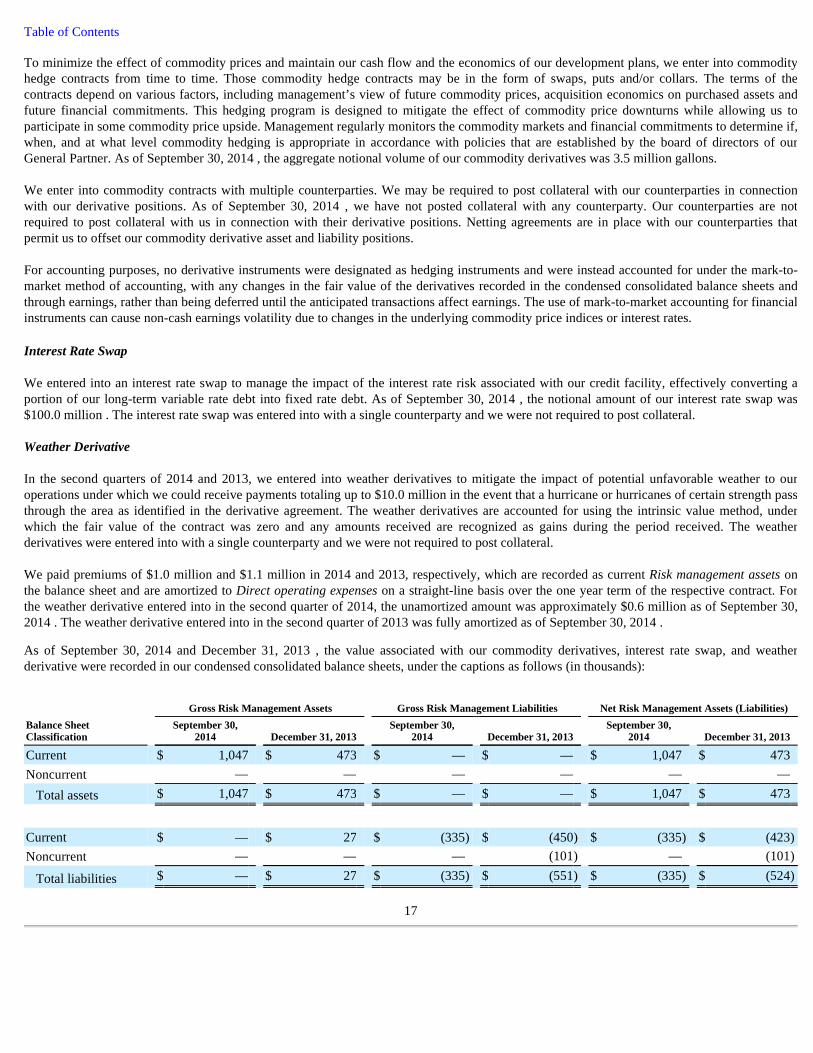
Table of Contents To minimize the effect of commodity prices and maintain our cash flow and the economics of our development plans, we enter into commodity hedge contracts from time to time. Those commodity hedge contracts may be in the form of swaps, puts and/or collars. The terms of the contracts depend on various factors, including management’s view of future commodity prices, acquisition economics on purchased assets and future financial commitments. This hedging program is designed to mitigate the effect of commodity price downturns while allowing us to participate in some commodity price upside. Management regularly monitors the commodity markets and financial commitments to determine if, when, and at what level commodity hedging is appropriate in accordance with policies that are established by the board of directors of our General Partner. As of September 30, 2014 , the aggregate notional volume of our commodity derivatives was 3.5 million gallons. We enter into commodity contracts with multiple counterparties. We may be required to post collateral with our counterparties in connection with our derivative positions. As of September 30, 2014 , we have not posted collateral with any counterparty. Our counterparties are not required to post collateral with us in connection with their derivative positions. Netting agreements are in place with our counterparties that permit us to offset our commodity derivative asset and liability positions. For accounting purposes, no derivative instruments were designated as hedging instruments and were instead accounted for under the mark-to-market method of accounting, with any changes in the fair value of the derivatives recorded in the condensed consolidated balance sheets and through earnings, rather than being deferred until the anticipated transactions affect earnings. The use of mark-to-market accounting for financial instruments can cause non-cash earnings volatility due to changes in the underlying commodity price indices or interest rates. Interest Rate Swap We entered into an interest rate swap to manage the impact of the interest rate risk associated with our credit facility, effectively converting a portion of our long-term variable rate debt into fixed rate debt. As of September 30, 2014 , the notional amount of our interest rate swap was $100.0 million . The interest rate swap was entered into with a single counterparty and we were not required to post collateral. Weather Derivative In the second quarters of 2014 and 2013, we entered into weather derivatives to mitigate the impact of potential unfavorable weather to our operations under which we could receive payments totaling up to $10.0 million in the event that a hurricane or hurricanes of certain strength pass through the area as identified in the derivative agreement. The weather derivatives are accounted for using the intrinsic value method, under which the fair value of the contract was zero and any amounts received are recognized as gains during the period received. The weather derivatives were entered into with a single counterparty and we were not required to post collateral. We paid premiums of $1.0 million and $1.1 million in 2014 and 2013, respectively, which are recorded as current Risk management assets on the balance sheet and are amortized to Direct operating expenses on a straight-line basis over the one year term of the respective contract. For the weather derivative entered into in the second quarter of 2014, the unamortized amount was approximately $0.6 million as of September 30, 2014 . The weather derivative entered into in the second quarter of 2013 was fully amortized as of September 30, 2014 .
As of September 30, 2014 and December 31, 2013 , the value associated with our commodity derivatives, interest rate swap, and weather derivative were recorded in our condensed consolidated balance sheets, under the captions as follows (in thousands):
17
Gross Risk Management Assets Gross Risk Management Liabilities Net Risk Management Assets (Liabilities)
Balance Sheet Classification
September 30, 2014 December 31, 2013
September 30, 2014 December 31, 2013
September 30, 2014 December 31, 2013
Current $ 1,047 $ 473 $ — $ — $ 1,047 $ 473 Noncurrent — — — — — —
Total assets $ 1,047 $ 473 $ — $ — $ 1,047 $ 473
Current $ — $ 27 $ (335 ) $ (450 ) $ (335 ) $ (423 )
Noncurrent — — — (101 ) — (101 )
Total liabilities $ — $ 27 $ (335 ) $ (551 ) $ (335 ) $ (524 )
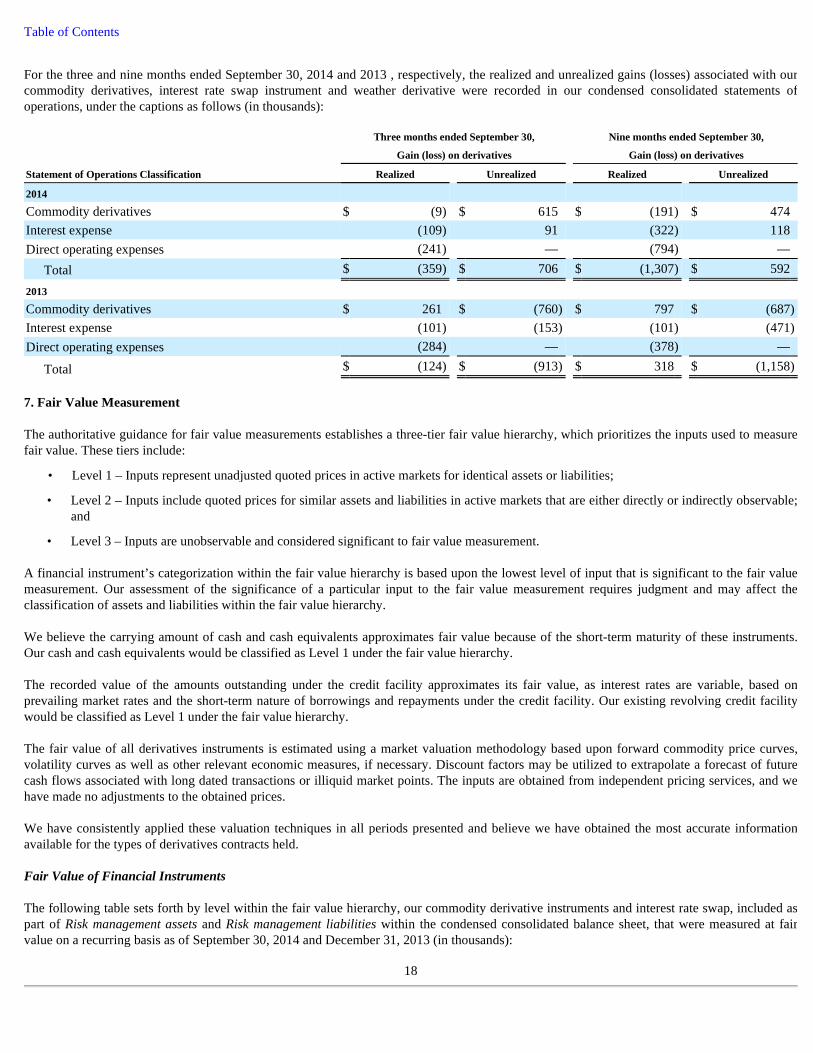
Table of Contents
For the three and nine months ended September 30, 2014 and 2013 , respectively, the realized and unrealized gains (losses) associated with our commodity derivatives, interest rate swap instrument and weather derivative were recorded in our condensed consolidated statements of operations, under the captions as follows (in thousands):
7. Fair Value Measurement The authoritative guidance for fair value measurements establishes a three-tier fair value hierarchy, which prioritizes the inputs used to measure fair value. These tiers include:
A financial instrument’s categorization within the fair value hierarchy is based upon the lowest level of input that is significant to the fair value measurement. Our assessment of the significance of a particular input to the fair value measurement requires judgment and may affect the classification of assets and liabilities within the fair value hierarchy. We believe the carrying amount of cash and cash equivalents approximates fair value because of the short-term maturity of these instruments. Our cash and cash equivalents would be classified as Level 1 under the fair value hierarchy. The recorded value of the amounts outstanding under the credit facility approximates its fair value, as interest rates are variable, based on prevailing market rates and the short-term nature of borrowings and repayments under the credit facility. Our existing revolving credit facility would be classified as Level 1 under the fair value hierarchy. The fair value of all derivatives instruments is estimated using a market valuation methodology based upon forward commodity price curves, volatility curves as well as other relevant economic measures, if necessary. Discount factors may be utilized to extrapolate a forecast of future cash flows associated with long dated transactions or illiquid market points. The inputs are obtained from independent pricing services, and we have made no adjustments to the obtained prices. We have consistently applied these valuation techniques in all periods presented and believe we have obtained the most accurate information available for the types of derivatives contracts held. Fair Value of Financial Instruments The following table sets forth by level within the fair value hierarchy, our commodity derivative instruments and interest rate swap, included as part of Risk management assets and Risk management liabilities within the condensed consolidated balance sheet, that were measured at fair value on a recurring basis as of September 30, 2014 and December 31, 2013 (in thousands):
18
Three months ended September 30, Nine months ended September 30,
Gain (loss) on derivatives Gain (loss) on derivatives
Statement of Operations Classification Realized Unrealized Realized Unrealized
2014
Commodity derivatives $ (9 ) $ 615 $ (191 ) $ 474 Interest expense (109 ) 91 (322 ) 118 Direct operating expenses (241 ) — (794 ) —
Total $ (359 ) $ 706 $ (1,307 ) $ 592
2013
Commodity derivatives $ 261 $ (760 ) $ 797 $ (687 )
Interest expense (101 ) (153 ) (101 ) (471 )
Direct operating expenses (284 ) — (378 ) —
Total $ (124 ) $ (913 ) $ 318 $ (1,158 )
• Level 1 – Inputs represent unadjusted quoted prices in active markets for identical assets or liabilities;
• Level 2 – Inputs include quoted prices for similar assets and liabilities in active markets that are either directly or indirectly observable; and
• Level 3 – Inputs are unobservable and considered significant to fair value measurement.
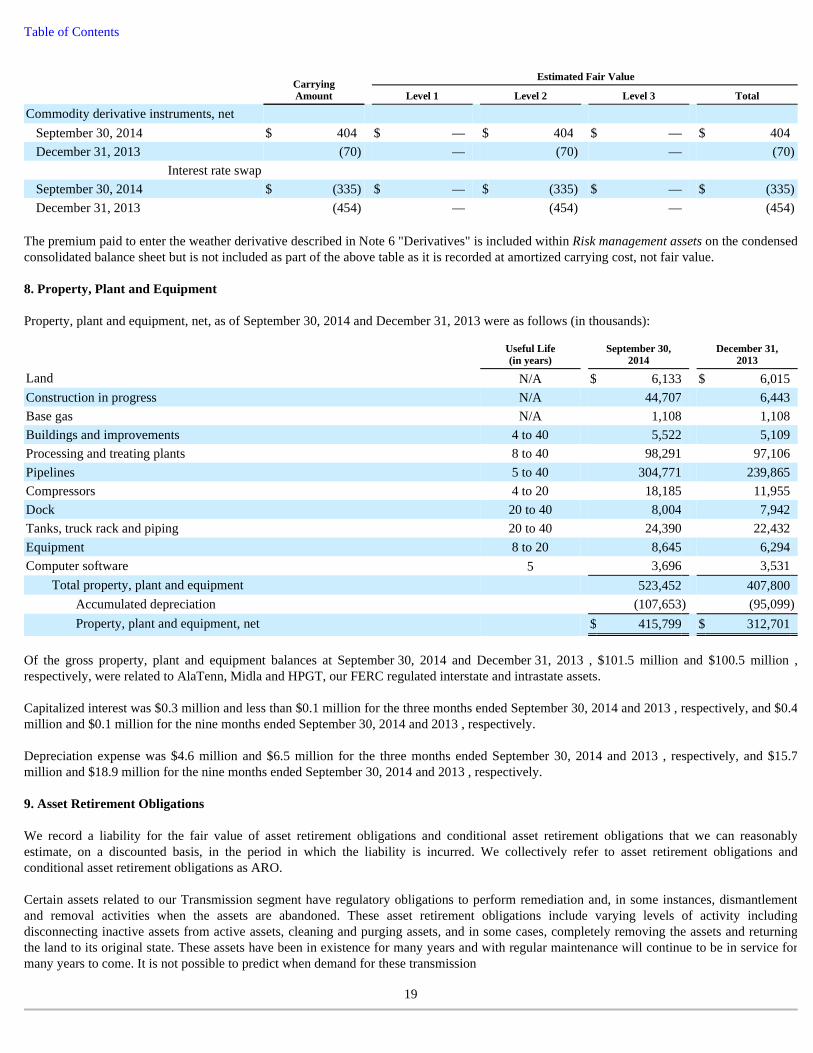
Table of Contents
The premium paid to enter the weather derivative described in Note 6 "Derivatives" is included within Risk management assets on the condensed consolidated balance sheet but is not included as part of the above table as it is recorded at amortized carrying cost, not fair value. 8. Property, Plant and Equipment Property, plant and equipment, net, as of September 30, 2014 and December 31, 2013 were as follows (in thousands):
Of the gross property, plant and equipment balances at September 30, 2014 and December 31, 2013 , $101.5 million and $100.5 million , respectively, were related to AlaTenn, Midla and HPGT, our FERC regulated interstate and intrastate assets. Capitalized interest was $0.3 million and less than $0.1 million for the three months ended September 30, 2014 and 2013 , respectively, and $0.4 million and $0.1 million for the nine months ended September 30, 2014 and 2013 , respectively. Depreciation expense was $4.6 million and $6.5 million for the three months ended September 30, 2014 and 2013 , respectively, and $15.7 million and $18.9 million for the nine months ended September 30, 2014 and 2013 , respectively. 9. Asset Retirement Obligations We record a liability for the fair value of asset retirement obligations and conditional asset retirement obligations that we can reasonably estimate, on a discounted basis, in the period in which the liability is incurred. We collectively refer to asset retirement obligations and conditional asset retirement obligations as ARO. Certain assets related to our Transmission segment have regulatory obligations to perform remediation and, in some instances, dismantlement and removal activities when the assets are abandoned. These asset retirement obligations include varying levels of activity including disconnecting inactive assets from active assets, cleaning and purging assets, and in some cases, completely removing the assets and returning the land to its original state. These assets have been in existence for many years and with regular maintenance will continue to be in service for many years to come. It is not possible to predict when demand for these transmission
19
Carrying Amount
Estimated Fair Value
Level 1 Level 2 Level 3 Total
Commodity derivative instruments, net
September 30, 2014 $ 404 $ — $ 404 $ — $ 404 December 31, 2013 (70 ) — (70 ) — (70 )
Interest rate swap
September 30, 2014 $ (335 ) $ — $ (335 ) $ — $ (335 )
December 31, 2013 (454 ) — (454 ) — (454 )
Useful Life (in years)
September 30, 2014
December 31, 2013
Land N/A $ 6,133 $ 6,015 Construction in progress N/A 44,707 6,443 Base gas N/A 1,108 1,108 Buildings and improvements 4 to 40 5,522 5,109 Processing and treating plants 8 to 40 98,291 97,106 Pipelines 5 to 40 304,771 239,865 Compressors 4 to 20 18,185 11,955 Dock 20 to 40 8,004 7,942 Tanks, truck rack and piping 20 to 40 24,390 22,432 Equipment 8 to 20 8,645 6,294 Computer software 5 3,696 3,531
Total property, plant and equipment 523,452 407,800 Accumulated depreciation (107,653 ) (95,099 )
Property, plant and equipment, net $ 415,799 $ 312,701
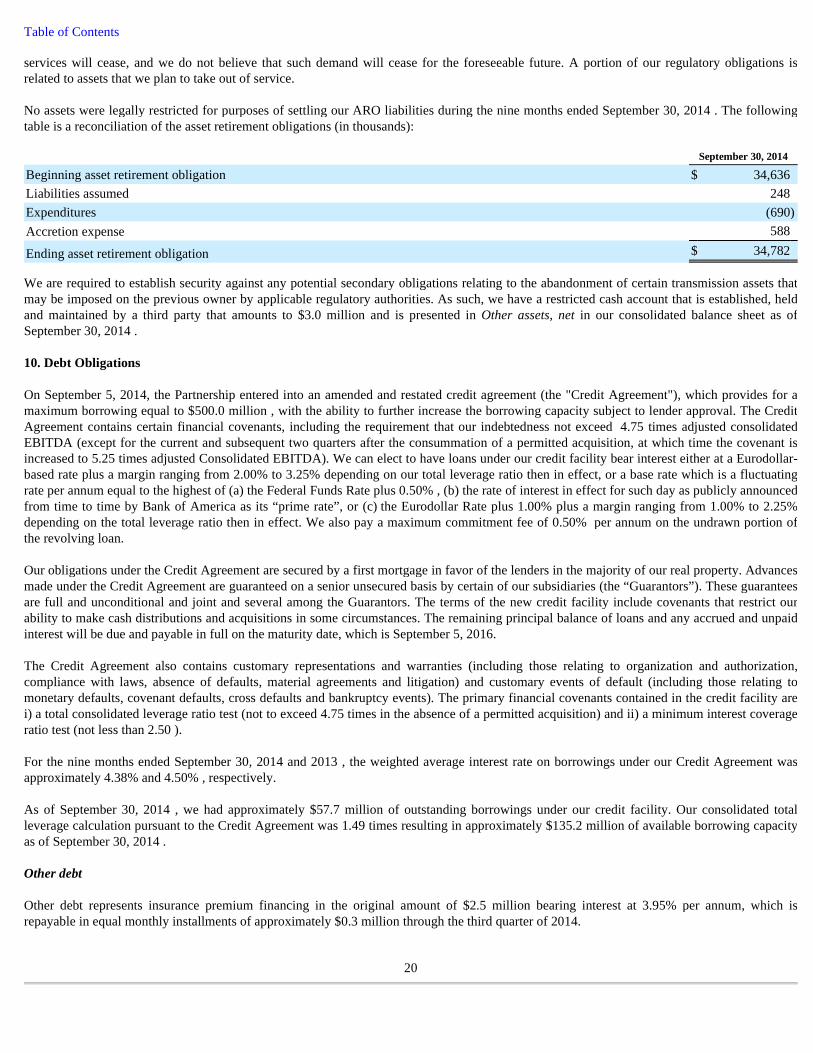
Table of Contents services will cease, and we do not believe that such demand will cease for the foreseeable future. A portion of our regulatory obligations is related to assets that we plan to take out of service. No assets were legally restricted for purposes of settling our ARO liabilities during the nine months ended September 30, 2014 . The following table is a reconciliation of the asset retirement obligations (in thousands):
We are required to establish security against any potential secondary obligations relating to the abandonment of certain transmission assets that may be imposed on the previous owner by applicable regulatory authorities. As such, we have a restricted cash account that is established, held and maintained by a third party that amounts to $3.0 million and is presented in Other assets, net in our consolidated balance sheet as of September 30, 2014 . 10. Debt Obligations On September 5, 2014, the Partnership entered into an amended and restated credit agreement (the "Credit Agreement"), which provides for a maximum borrowing equal to $500.0 million , with the ability to further increase the borrowing capacity subject to lender approval. The Credit Agreement contains certain financial covenants, including the requirement that our indebtedness not exceed 4.75 times adjusted consolidated EBITDA (except for the current and subsequent two quarters after the consummation of a permitted acquisition, at which time the covenant is increased to 5.25 times adjusted Consolidated EBITDA). We can elect to have loans under our credit facility bear interest either at a Eurodollar-based rate plus a margin ranging from 2.00% to 3.25% depending on our total leverage ratio then in effect, or a base rate which is a fluctuating rate per annum equal to the highest of (a) the Federal Funds Rate plus 0.50% , (b) the rate of interest in effect for such day as publicly announced from time to time by Bank of America as its “prime rate”, or (c) the Eurodollar Rate plus 1.00% plus a margin ranging from 1.00% to 2.25% depending on the total leverage ratio then in effect. We also pay a maximum commitment fee of 0.50% per annum on the undrawn portion of the revolving loan. Our obligations under the Credit Agreement are secured by a first mortgage in favor of the lenders in the majority of our real property. Advances made under the Credit Agreement are guaranteed on a senior unsecured basis by certain of our subsidiaries (the “Guarantors”). These guarantees are full and unconditional and joint and several among the Guarantors. The terms of the new credit facility include covenants that restrict our ability to make cash distributions and acquisitions in some circumstances. The remaining principal balance of loans and any accrued and unpaid interest will be due and payable in full on the maturity date, which is September 5, 2016. The Credit Agreement also contains customary representations and warranties (including those relating to organization and authorization, compliance with laws, absence of defaults, material agreements and litigation) and customary events of default (including those relating to monetary defaults, covenant defaults, cross defaults and bankruptcy events). The primary financial covenants contained in the credit facility are i) a total consolidated leverage ratio test (not to exceed 4.75 times in the absence of a permitted acquisition) and ii) a minimum interest coverage ratio test (not less than 2.50 ). For the nine months ended September 30, 2014 and 2013 , the weighted average interest rate on borrowings under our Credit Agreement was approximately 4.38% and 4.50% , respectively. As of September 30, 2014 , we had approximately $57.7 million of outstanding borrowings under our credit facility. Our consolidated total leverage calculation pursuant to the Credit Agreement was 1.49 times resulting in approximately $135.2 million of available borrowing capacity as of September 30, 2014 . Other debt Other debt represents insurance premium financing in the original amount of $2.5 million bearing interest at 3.95% per annum, which is repayable in equal monthly installments of approximately $0.3 million through the third quarter of 2014.
20
September 30, 2014
Beginning asset retirement obligation $ 34,636 Liabilities assumed 248 Expenditures (690 )
Accretion expense 588
Ending asset retirement obligation $ 34,782
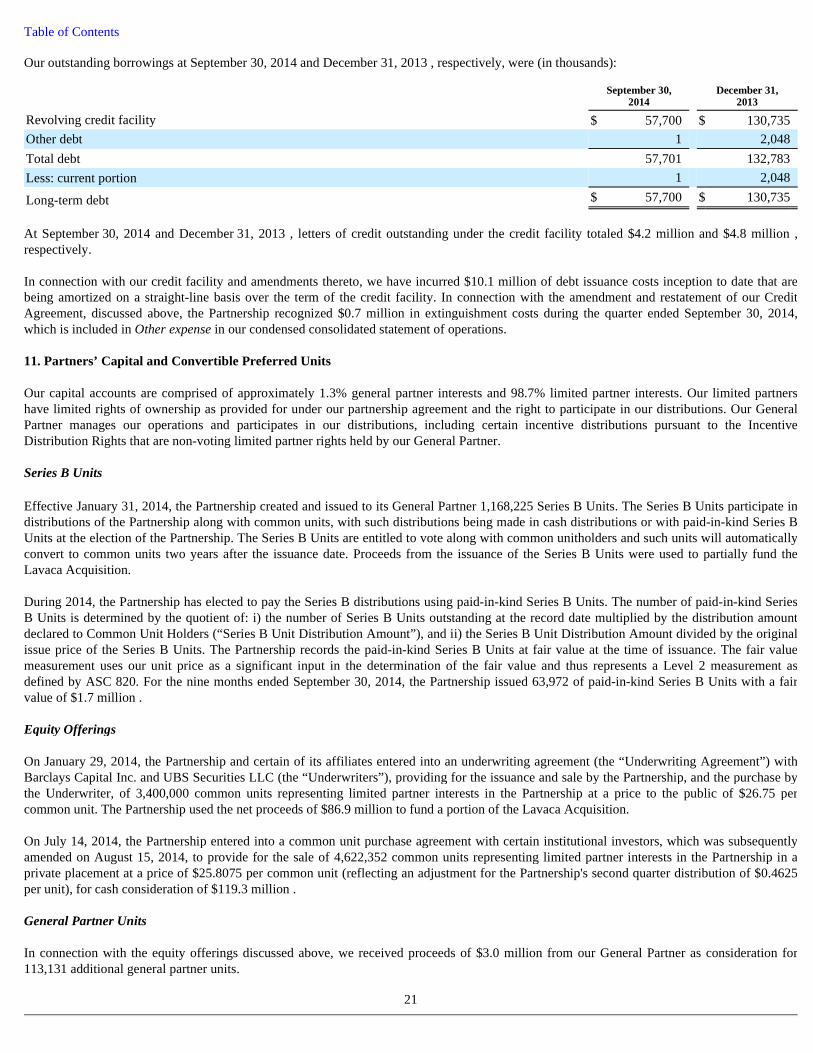
Table of Contents Our outstanding borrowings at September 30, 2014 and December 31, 2013 , respectively, were (in thousands):
At September 30, 2014 and December 31, 2013 , letters of credit outstanding under the credit facility totaled $4.2 million and $4.8 million , respectively. In connection with our credit facility and amendments thereto, we have incurred $10.1 million of debt issuance costs inception to date that are being amortized on a straight-line basis over the term of the credit facility. In connection with the amendment and restatement of our Credit Agreement, discussed above, the Partnership recognized $0.7 million in extinguishment costs during the quarter ended September 30, 2014, which is included in Other expense in our condensed consolidated statement of operations. 11. Partners’ Capital and Convertible Preferred Units Our capital accounts are comprised of approximately 1.3% general partner interests and 98.7% limited partner interests. Our limited partners have limited rights of ownership as provided for under our partnership agreement and the right to participate in our distributions. Our General Partner manages our operations and participates in our distributions, including certain incentive distributions pursuant to the Incentive Distribution Rights that are non-voting limited partner rights held by our General Partner. Series B Units Effective January 31, 2014, the Partnership created and issued to its General Partner 1,168,225 Series B Units. The Series B Units participate in distributions of the Partnership along with common units, with such distributions being made in cash distributions or with paid-in-kind Series B Units at the election of the Partnership. The Series B Units are entitled to vote along with common unitholders and such units will automatically convert to common units two years after the issuance date. Proceeds from the issuance of the Series B Units were used to partially fund the Lavaca Acquisition. During 2014, the Partnership has elected to pay the Series B distributions using paid-in-kind Series B Units. The number of paid-in-kind Series B Units is determined by the quotient of: i) the number of Series B Units outstanding at the record date multiplied by the distribution amount declared to Common Unit Holders (“Series B Unit Distribution Amount”), and ii) the Series B Unit Distribution Amount divided by the original issue price of the Series B Units. The Partnership records the paid-in-kind Series B Units at fair value at the time of issuance. The fair value measurement uses our unit price as a significant input in the determination of the fair value and thus represents a Level 2 measurement as defined by ASC 820. For the nine months ended September 30, 2014, the Partnership issued 63,972 of paid-in-kind Series B Units with a fair value of $1.7 million . Equity Offerings On January 29, 2014, the Partnership and certain of its affiliates entered into an underwriting agreement (the “Underwriting Agreement”) with Barclays Capital Inc. and UBS Securities LLC (the “Underwriters”), providing for the issuance and sale by the Partnership, and the purchase by the Underwriter, of 3,400,000 common units representing limited partner interests in the Partnership at a price to the public of $26.75 per common unit. The Partnership used the net proceeds of $86.9 million to fund a portion of the Lavaca Acquisition. On July 14, 2014, the Partnership entered into a common unit purchase agreement with certain institutional investors, which was subsequently amended on August 15, 2014, to provide for the sale of 4,622,352 common units representing limited partner interests in the Partnership in a private placement at a price of $25.8075 per common unit (reflecting an adjustment for the Partnership's second quarter distribution of $0.4625 per unit), for cash consideration of $119.3 million . General Partner Units In connection with the equity offerings discussed above, we received proceeds of $3.0 million from our General Partner as consideration for 113,131 additional general partner units.
21
September 30,
2014 December 31,
2013
Revolving credit facility $ 57,700 $ 130,735 Other debt 1 2,048 Total debt 57,701 132,783 Less: current portion 1 2,048
Long-term debt $ 57,700 $ 130,735
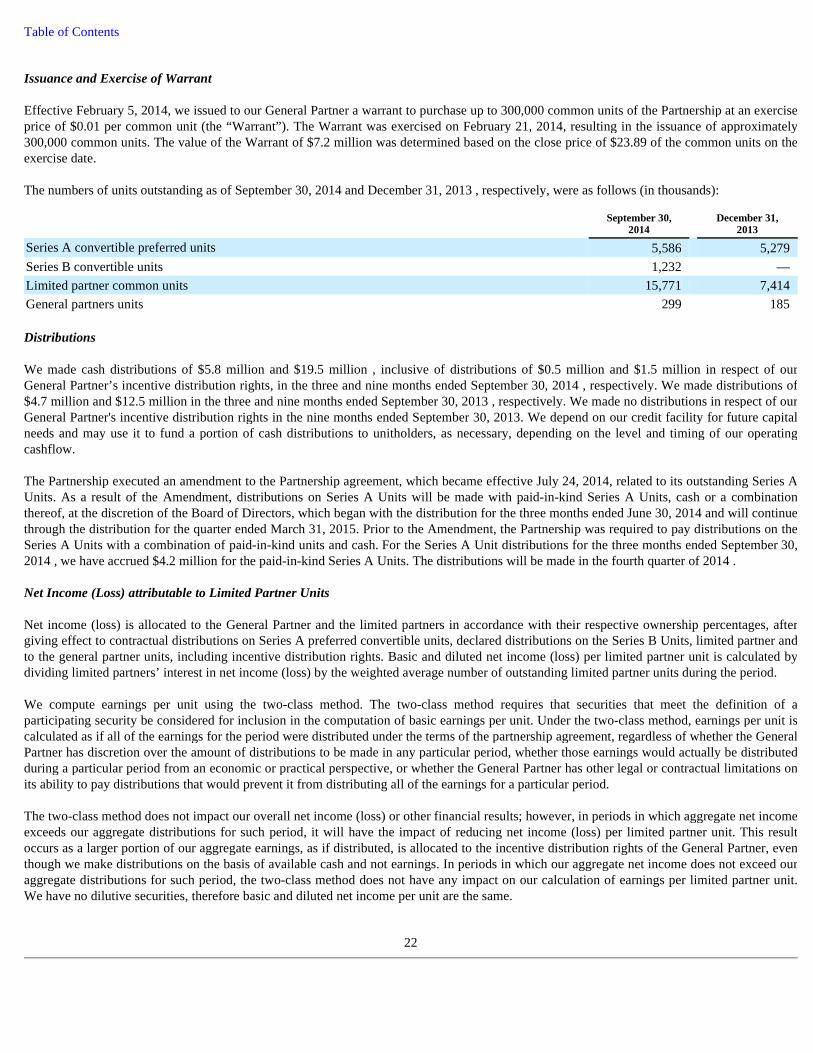
Table of Contents Issuance and Exercise of Warrant Effective February 5, 2014, we issued to our General Partner a warrant to purchase up to 300,000 common units of the Partnership at an exercise price of $0.01 per common unit (the “Warrant”). The Warrant was exercised on February 21, 2014, resulting in the issuance of approximately 300,000 common units. The value of the Warrant of $7.2 million was determined based on the close price of $23.89 of the common units on the exercise date. The numbers of units outstanding as of September 30, 2014 and December 31, 2013 , respectively, were as follows (in thousands):
Distributions We made cash distributions of $5.8 million and $19.5 million , inclusive of distributions of $0.5 million and $1.5 million in respect of our General Partner’s incentive distribution rights, in the three and nine months ended September 30, 2014 , respectively. We made distributions of $4.7 million and $12.5 million in the three and nine months ended September 30, 2013 , respectively. We made no distributions in respect of our General Partner's incentive distribution rights in the nine months ended September 30, 2013. We depend on our credit facility for future capital needs and may use it to fund a portion of cash distributions to unitholders, as necessary, depending on the level and timing of our operating cashflow. The Partnership executed an amendment to the Partnership agreement, which became effective July 24, 2014, related to its outstanding Series A Units. As a result of the Amendment, distributions on Series A Units will be made with paid-in-kind Series A Units, cash or a combination thereof, at the discretion of the Board of Directors, which began with the distribution for the three months ended June 30, 2014 and will continue through the distribution for the quarter ended March 31, 2015. Prior to the Amendment, the Partnership was required to pay distributions on the Series A Units with a combination of paid-in-kind units and cash. For the Series A Unit distributions for the three months ended September 30, 2014 , we have accrued $4.2 million for the paid-in-kind Series A Units. The distributions will be made in the fourth quarter of 2014 . Net Income (Loss) attributable to Limited Partner Units Net income (loss) is allocated to the General Partner and the limited partners in accordance with their respective ownership percentages, after giving effect to contractual distributions on Series A preferred convertible units, declared distributions on the Series B Units, limited partner and to the general partner units, including incentive distribution rights. Basic and diluted net income (loss) per limited partner unit is calculated by dividing limited partners’ interest in net income (loss) by the weighted average number of outstanding limited partner units during the period. We compute earnings per unit using the two-class method. The two-class method requires that securities that meet the definition of a participating security be considered for inclusion in the computation of basic earnings per unit. Under the two-class method, earnings per unit is calculated as if all of the earnings for the period were distributed under the terms of the partnership agreement, regardless of whether the General Partner has discretion over the amount of distributions to be made in any particular period, whether those earnings would actually be distributed during a particular period from an economic or practical perspective, or whether the General Partner has other legal or contractual limitations on its ability to pay distributions that would prevent it from distributing all of the earnings for a particular period. The two-class method does not impact our overall net income (loss) or other financial results; however, in periods in which aggregate net income exceeds our aggregate distributions for such period, it will have the impact of reducing net income (loss) per limited partner unit. This result occurs as a larger portion of our aggregate earnings, as if distributed, is allocated to the incentive distribution rights of the General Partner, even though we make distributions on the basis of available cash and not earnings. In periods in which our aggregate net income does not exceed our aggregate distributions for such period, the two-class method does not have any impact on our calculation of earnings per limited partner unit. We have no dilutive securities, therefore basic and diluted net income per unit are the same.
22
September 30,
2014 December 31,
2013
Series A convertible preferred units 5,586 5,279 Series B convertible units 1,232 — Limited partner common units 15,771 7,414 General partners units 299 185
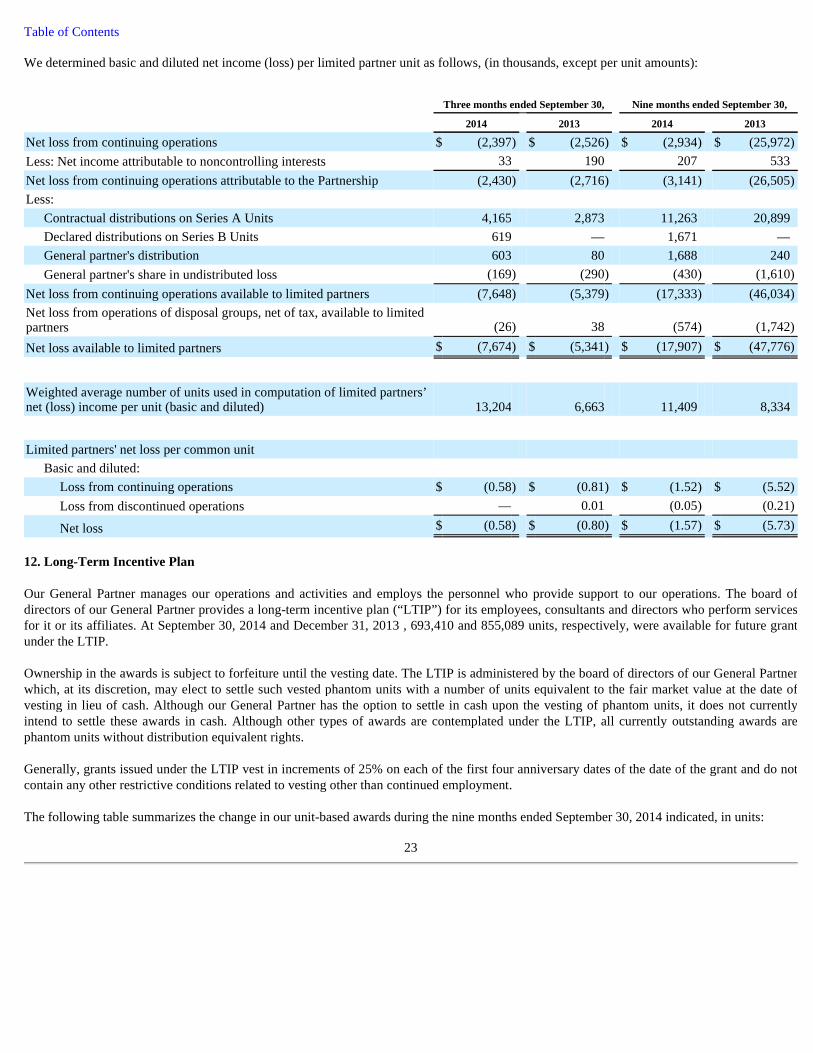
Table of Contents We determined basic and diluted net income (loss) per limited partner unit as follows, (in thousands, except per unit amounts):
12. Long-Term Incentive Plan Our General Partner manages our operations and activities and employs the personnel who provide support to our operations. The board of directors of our General Partner provides a long-term incentive plan (“LTIP”) for its employees, consultants and directors who perform services for it or its affiliates. At September 30, 2014 and December 31, 2013 , 693,410 and 855,089 units, respectively, were available for future grant under the LTIP. Ownership in the awards is subject to forfeiture until the vesting date. The LTIP is administered by the board of directors of our General Partner which, at its discretion, may elect to settle such vested phantom units with a number of units equivalent to the fair market value at the date of vesting in lieu of cash. Although our General Partner has the option to settle in cash upon the vesting of phantom units, it does not currently intend to settle these awards in cash. Although other types of awards are contemplated under the LTIP, all currently outstanding awards are phantom units without distribution equivalent rights. Generally, grants issued under the LTIP vest in increments of 25% on each of the first four anniversary dates of the date of the grant and do not contain any other restrictive conditions related to vesting other than continued employment. The following table summarizes the change in our unit-based awards during the nine months ended September 30, 2014 indicated, in units:
23
Three months ended September 30, Nine months ended September 30,
2014 2013 2014 2013
Net loss from continuing operations $ (2,397 ) $ (2,526 ) $ (2,934 ) $ (25,972 )
Less: Net income attributable to noncontrolling interests 33 190 207 533 Net loss from continuing operations attributable to the Partnership (2,430 ) (2,716 ) (3,141 ) (26,505 )
Less:
Contractual distributions on Series A Units 4,165 2,873 11,263 20,899 Declared distributions on Series B Units 619 — 1,671 — General partner's distribution 603 80 1,688 240 General partner's share in undistributed loss (169 ) (290 ) (430 ) (1,610 )
Net loss from continuing operations available to limited partners (7,648 ) (5,379 ) (17,333 ) (46,034 )
Net loss from operations of disposal groups, net of tax, available to limited partners (26 ) 38 (574 ) (1,742 )
Net loss available to limited partners $ (7,674 ) $ (5,341 ) $ (17,907 ) $ (47,776 )
Weighted average number of units used in computation of limited partners’ net (loss) income per unit (basic and diluted) 13,204 6,663 11,409 8,334
Limited partners' net loss per common unit
Basic and diluted:
Loss from continuing operations $ (0.58 ) $ (0.81 ) $ (1.52 ) $ (5.52 )
Loss from discontinued operations — 0.01 (0.05 ) (0.21 )
Net loss $ (0.58 ) $ (0.80 ) $ (1.57 ) $ (5.73 )
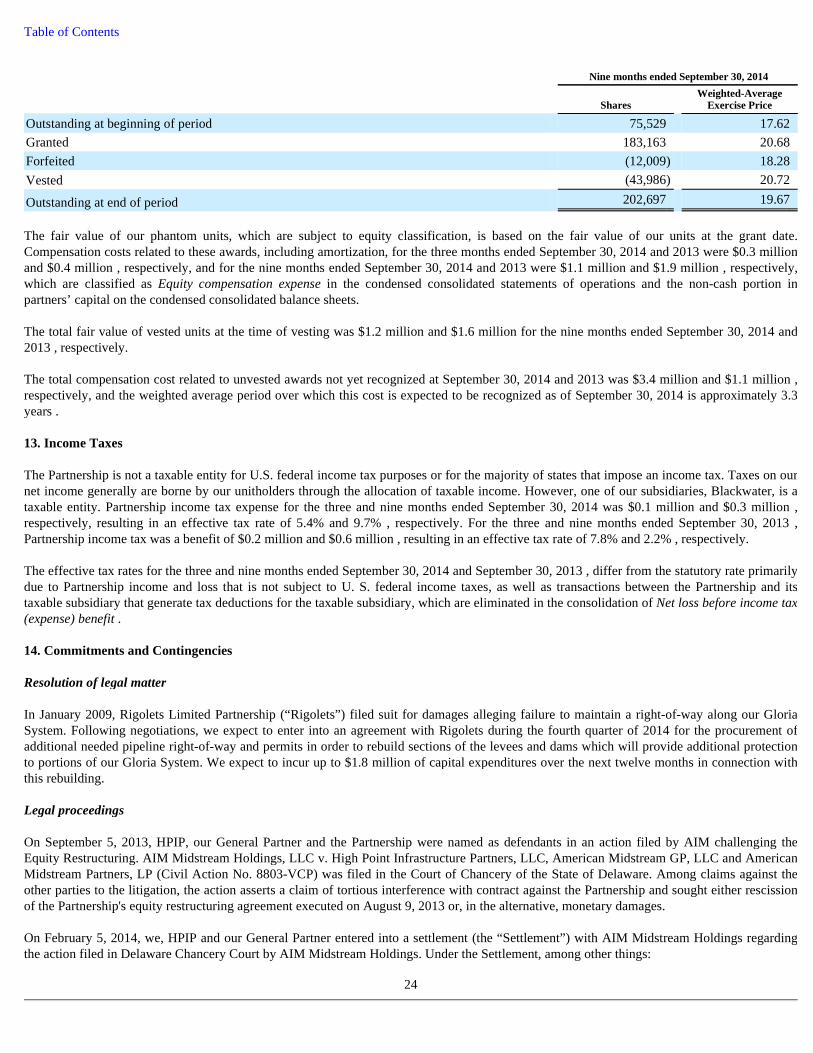
Table of Contents
The fair value of our phantom units, which are subject to equity classification, is based on the fair value of our units at the grant date. Compensation costs related to these awards, including amortization, for the three months ended September 30, 2014 and 2013 were $0.3 million and $0.4 million , respectively, and for the nine months ended September 30, 2014 and 2013 were $1.1 million and $1.9 million , respectively, which are classified as Equity compensation expense in the condensed consolidated statements of operations and the non-cash portion in partners’ capital on the condensed consolidated balance sheets. The total fair value of vested units at the time of vesting was $1.2 million and $1.6 million for the nine months ended September 30, 2014 and 2013 , respectively. The total compensation cost related to unvested awards not yet recognized at September 30, 2014 and 2013 was $3.4 million and $1.1 million , respectively, and the weighted average period over which this cost is expected to be recognized as of September 30, 2014 is approximately 3.3 years . 13. Income Taxes The Partnership is not a taxable entity for U.S. federal income tax purposes or for the majority of states that impose an income tax. Taxes on our net income generally are borne by our unitholders through the allocation of taxable income. However, one of our subsidiaries, Blackwater, is a taxable entity. Partnership income tax expense for the three and nine months ended September 30, 2014 was $0.1 million and $0.3 million , respectively, resulting in an effective tax rate of 5.4% and 9.7% , respectively. For the three and nine months ended September 30, 2013 , Partnership income tax was a benefit of $0.2 million and $0.6 million , resulting in an effective tax rate of 7.8% and 2.2% , respectively. The effective tax rates for the three and nine months ended September 30, 2014 and September 30, 2013 , differ from the statutory rate primarily due to Partnership income and loss that is not subject to U. S. federal income taxes, as well as transactions between the Partnership and its taxable subsidiary that generate tax deductions for the taxable subsidiary, which are eliminated in the consolidation of Net loss before income tax (expense) benefit . 14. Commitments and Contingencies Resolution of legal matter In January 2009, Rigolets Limited Partnership (“Rigolets”) filed suit for damages alleging failure to maintain a right-of-way along our Gloria System. Following negotiations, we expect to enter into an agreement with Rigolets during the fourth quarter of 2014 for the procurement of additional needed pipeline right-of-way and permits in order to rebuild sections of the levees and dams which will provide additional protection to portions of our Gloria System. We expect to incur up to $1.8 million of capital expenditures over the next twelve months in connection with this rebuilding. Legal proceedings On September 5, 2013, HPIP, our General Partner and the Partnership were named as defendants in an action filed by AIM challenging the Equity Restructuring. AIM Midstream Holdings, LLC v. High Point Infrastructure Partners, LLC, American Midstream GP, LLC and American Midstream Partners, LP (Civil Action No. 8803-VCP) was filed in the Court of Chancery of the State of Delaware. Among claims against the other parties to the litigation, the action asserts a claim of tortious interference with contract against the Partnership and sought either rescission of the Partnership's equity restructuring agreement executed on August 9, 2013 or, in the alternative, monetary damages. On February 5, 2014, we, HPIP and our General Partner entered into a settlement (the “Settlement”) with AIM Midstream Holdings regarding the action filed in Delaware Chancery Court by AIM Midstream Holdings. Under the Settlement, among other things:
24
Nine months ended September 30, 2014
Shares Weighted-Average
Exercise Price
Outstanding at beginning of period 75,529 17.62 Granted 183,163 20.68 Forfeited (12,009 ) 18.28 Vested (43,986 ) 20.72
Outstanding at end of period 202,697 19.67
Table of Contents
Environmental matters We are subject to federal and state laws and regulations relating to the protection of the environment. Environmental risk is inherent to natural gas pipeline and processing operations, and we could, at times, be subject to environmental cleanup and enforcement actions. We attempt to manage this environmental risk through appropriate environmental policies and practices to minimize any impact our operations may have on the environment.
Regulatory matters On October 8, 2014, the Partnership reached an agreement in principle regarding its Midla interstate pipeline that traverses Louisiana and Mississippi. The parties involved reached the agreement in principle in order to provide continued service to Midla’s customers while addressing safety concerns with the existing pipeline. Midla and the parties agreed that Midla may retire the existing 1920s vintage pipeline and replace the existing natural gas service with a new pipeline from Winnsboro, Louisiana to Natchez, Mississippi (the “Natchez Line”) to serve existing residential, commercial, and industrial customers. Customers not served by the new Natchez Line will be connected to other interstate or intrastate pipelines, other gas distribution systems, or offered conversion to propane service. The agreement is subject to final agreements and ongoing proceedings at the Federal Energy Regulatory Commission (“FERC”). Under the agreement in principle and subject to FERC approval, Midla will execute long-term agreements to recover its investment in the Natchez Line. 15. Related-Party Transactions Employees of our General Partner are assigned to work for us. Where directly attributable, the costs of all compensation, benefits expenses and employer expenses for these employees are charged directly by our General Partner to American Midstream, LLC, which, in turn, charges the appropriate subsidiary. Our General Partner does not record any profit or margin for the administrative and operational services charged to us. During the three and nine months ended September 30, 2014 , administrative and operational services expenses of $5.7 million and $15.9 million , respectively, were charged to us by our General Partner. During the three and nine months ended September 30, 2013 , administrative and operational services expenses of $3.3 million and $10.3 million , respectively, were charged to us by our General Partner. For the three and nine months ended September 30, 2014 , we incurred approximately $0.2 million and $1.0 million , respectively, of costs primarily associated with certain business development activities led by an affiliate of our General Partner. For the three and nine months ended September 30, 2013 , we incurred approximately $0.2 million and $0.6 million , respectively, of costs primarily associated with certain business development activities led by an affiliate of our General Partner. We expect to be reimbursed by this affiliate of our General Partner for the business development costs related to those projects. During the second quarter, the Partnership and an affiliate of its General Partner entered into a Management Service Fee arrangement under which the affiliate pays a monthly fee to reimburse the Partnership for administrative expenses incurred on the affiliate's behalf. During the three and nine months ended September 30, 2014 , the Partnership recognized $0.2 million and $0.3 million , respectively, in management fee income that has been recorded as a reduction to Selling, general and administrative expenses . 16. Reporting Segments Our operations are located in the United States and are organized into three reporting segments: (1) Gathering and Processing, (2) Transmission and (3) Terminals. Gathering and Processing
25
• HPIP and AIM Midstream Holdings amended the LLC Amendment to, among other things, amend the Sharing Percentages (as defined therein) such that HPIP’s sharing percentage thereafter is 95% and AIM Midstream Holdings’s Sharing Percentage is 5% ;
• HPIP transferred all of the 85.02% of our outstanding new IDRs held by HPIP to our General Partner such that our General Partner owns 100% of the outstanding new IDRs; and
• We issued to AIM Midstream Holdings a warrant to purchase up to 300,000 common units of the Partnership at an exercise price of $0.01 per common unit, which Warrant, among other terms, i) was exercisable at any time on or after February 8, 2014 until the tenth anniversary of February 5, 2014, ii) contained cashless exercise provisions and iii) contains customary anti-dilution and other protections. The Warrant was exercised on February 21, 2014.
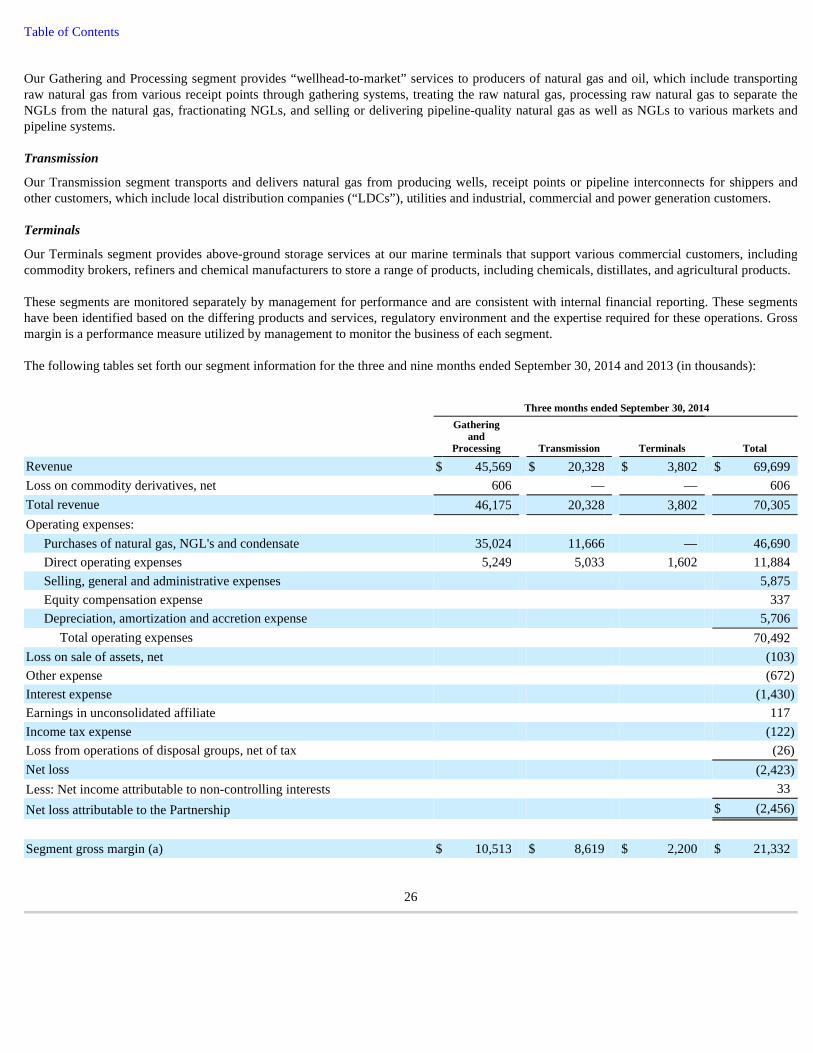
Table of Contents Our Gathering and Processing segment provides “wellhead-to-market” services to producers of natural gas and oil, which include transporting raw natural gas from various receipt points through gathering systems, treating the raw natural gas, processing raw natural gas to separate the NGLs from the natural gas, fractionating NGLs, and selling or delivering pipeline-quality natural gas as well as NGLs to various markets and pipeline systems. Transmission
Our Transmission segment transports and delivers natural gas from producing wells, receipt points or pipeline interconnects for shippers and other customers, which include local distribution companies (“LDCs”), utilities and industrial, commercial and power generation customers. Terminals
Our Terminals segment provides above-ground storage services at our marine terminals that support various commercial customers, including commodity brokers, refiners and chemical manufacturers to store a range of products, including chemicals, distillates, and agricultural products. These segments are monitored separately by management for performance and are consistent with internal financial reporting. These segments have been identified based on the differing products and services, regulatory environment and the expertise required for these operations. Gross margin is a performance measure utilized by management to monitor the business of each segment. The following tables set forth our segment information for the three and nine months ended September 30, 2014 and 2013 (in thousands):
26
Three months ended September 30, 2014
Gathering and
Processing Transmission Terminals Total
Revenue $ 45,569 $ 20,328 $ 3,802 $ 69,699 Loss on commodity derivatives, net 606 — — 606 Total revenue 46,175 20,328 3,802 70,305 Operating expenses:
Purchases of natural gas, NGL's and condensate 35,024 11,666 — 46,690 Direct operating expenses 5,249 5,033 1,602 11,884 Selling, general and administrative expenses 5,875 Equity compensation expense 337 Depreciation, amortization and accretion expense 5,706
Total operating expenses 70,492 Loss on sale of assets, net (103 )
Other expense (672 )
Interest expense (1,430 )
Earnings in unconsolidated affiliate 117 Income tax expense (122 )
Loss from operations of disposal groups, net of tax (26 )
Net loss (2,423 )
Less: Net income attributable to non-controlling interests 33
Net loss attributable to the Partnership $ (2,456 )
Segment gross margin (a) $ 10,513 $ 8,619 $ 2,200 $ 21,332
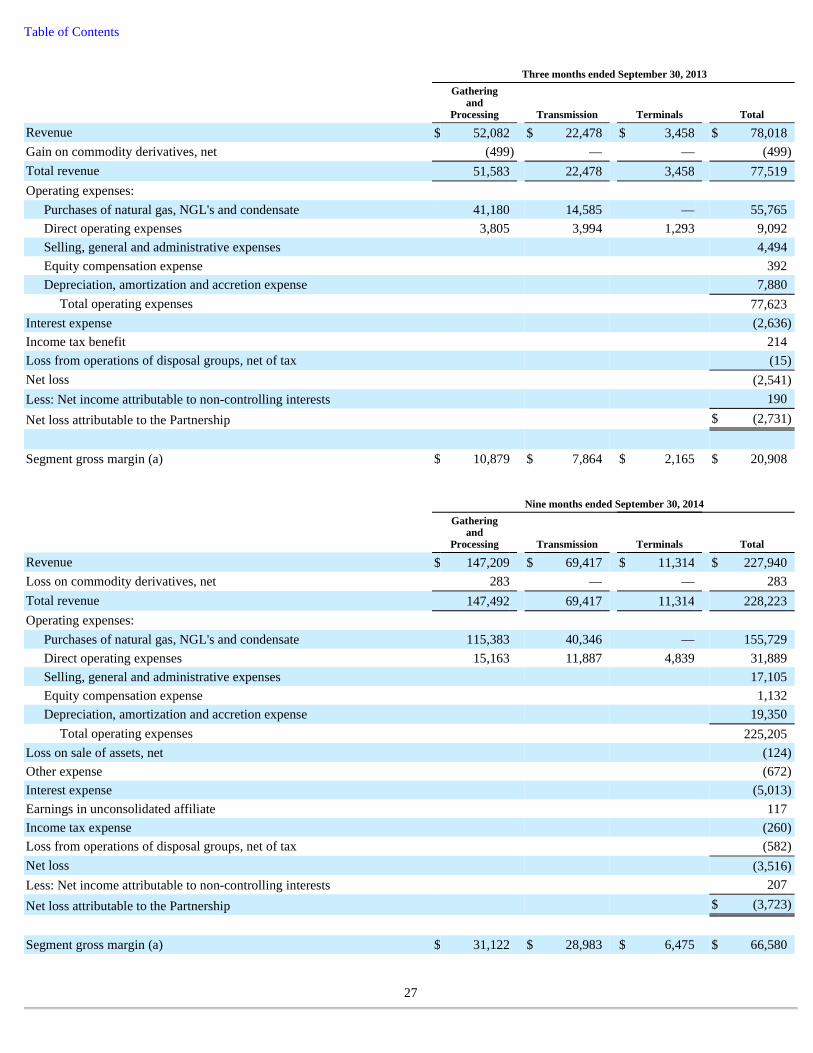
Table of Contents
27
Three months ended September 30, 2013
Gathering and
Processing Transmission Terminals Total
Revenue $ 52,082 $ 22,478 $ 3,458 $ 78,018 Gain on commodity derivatives, net (499 ) — — (499 )
Total revenue 51,583 22,478 3,458 77,519 Operating expenses:
Purchases of natural gas, NGL's and condensate 41,180 14,585 — 55,765 Direct operating expenses 3,805 3,994 1,293 9,092 Selling, general and administrative expenses 4,494 Equity compensation expense 392 Depreciation, amortization and accretion expense 7,880
Total operating expenses 77,623 Interest expense (2,636 )
Income tax benefit 214 Loss from operations of disposal groups, net of tax (15 )
Net loss (2,541 )
Less: Net income attributable to non-controlling interests 190
Net loss attributable to the Partnership $ (2,731 )
Segment gross margin (a) $ 10,879 $ 7,864 $ 2,165 $ 20,908
Nine months ended September 30, 2014
Gathering and
Processing Transmission Terminals Total
Revenue $ 147,209 $ 69,417 $ 11,314 $ 227,940 Loss on commodity derivatives, net 283 — — 283 Total revenue 147,492 69,417 11,314 228,223 Operating expenses:
Purchases of natural gas, NGL's and condensate 115,383 40,346 — 155,729 Direct operating expenses 15,163 11,887 4,839 31,889 Selling, general and administrative expenses 17,105 Equity compensation expense 1,132 Depreciation, amortization and accretion expense 19,350
Total operating expenses 225,205 Loss on sale of assets, net (124 )
Other expense (672 )
Interest expense (5,013 )
Earnings in unconsolidated affiliate 117 Income tax expense (260 )
Loss from operations of disposal groups, net of tax (582 )
Net loss (3,516 )
Less: Net income attributable to non-controlling interests 207
Net loss attributable to the Partnership $ (3,723 )
Segment gross margin (a) $ 31,122 $ 28,983 $ 6,475 $ 66,580

Table of Contents
Asset information, including capital expenditures, by segment is not included in reports used by our management in their monitoring of performance and therefore is not disclosed. 17. Subsidiary Guarantors Certain of the subsidiaries of the Partnership (the "Subsidiaries") are co-registrants with the Partnership on registration statement No. 333-183818, and the registration statement registers guarantees of debt securities by one or more of the Subsidiaries (other than American Midstream Finance Corporation, a 100% owned subsidiary of the Partnership whose sole purpose is to act as co-issuer of such debt securities). The financial position and operations of the co-issuer are minor and therefore have been included with the Parent's financial information. As of June 30, 2012, the Subsidiaries were 100% owned by the Partnership and any guarantees by the Subsidiaries will be full and unconditional. As of September 30, 2014 , the Subsidiaries have an investment in the non-guarantor subsidiaries equal to a 92.2% undivided interest in its Chatom System. The Partnership has no assets or operations independent of the Subsidiaries, and there are no significant restrictions upon the ability of the Subsidiaries to distribute funds to the Partnership. In the event that more than one of the Subsidiaries provide guarantees of any debt securities issued by the Partnership, such guarantees will constitute joint and several obligations. None of the assets of the Partnership or the Subsidiaries represent restricted net assets pursuant to Rule 4-08(e)(3) of Regulation S-X under the Securities Act of 1933, as amended. For purposes of the following condensed consolidating financial information, the Partnership's investments in its Subsidiaries and the guarantor subsidiaries' investment in its 92.2% undivided interest in the Chatom System are presented in accordance with the equity method of accounting. The financial information may not necessarily be indicative of the financial position, results of operations, or cash flows had the subsidiary guarantors operated as independent entities. Condensed consolidating financial
28
Nine months ended September 30, 2013
Gathering and
Processing Transmission Terminals Total
Revenue $ 154,336 $ 56,539 $ 6,326 $ 217,201 Loss on commodity derivatives, net 110 — — 110 Total revenue 154,446 56,539 6,326 217,311 Operating expenses:
Purchases of natural gas, NGL's and condensate 125,888 37,110 — 162,998 Direct operating expenses 10,924 8,943 2,502 22,369 Selling, general and administrative expenses 12,507 Equity compensation expense 1,877 Depreciation, amortization and accretion expense 22,274
Total operating expenses 222,025 Gain on involuntary conversion of property, plant and equipment 343 Loss on impairment of property, plant and equipment (15,232 )
Interest expense (6,958 )
Income tax benefit 589 Loss from operations of disposal groups, net of tax (1,891 )
Net loss (27,863 )
Less: Net income attributable to non-controlling interests 533
Net loss attributable to the Partnership $ (28,396 )
Segment gross margin (a) $ 28,812 $ 19,296 $ 3,824 $ 51,932
(a) Segment gross margin for our Gathering and Processing segment consists of revenue less purchases of natural gas, NGLs and condensate and revenue from construction, operating and maintenance agreements (“COMA”). Segment gross margin for our Transmission segment consists of revenue, less purchases of natural gas and COMA. Segment gross margin for our Terminals segment consists of revenue, less direct operating expenses. Gross margin consists of the sum of the segment gross margin amounts for each of these segments. As an indicator of our operating performance, gross margin should not be considered an alternative to, or more meaningful than, net income or cash flow from operations as determined in accordance with GAAP. Our gross margin may not be comparable to a similarly titled measure of another company because other entities may not calculate gross margin in the same manner.

Table of Contents information for the Partnership, its combined guarantor subsidiaries and non-guarantor subsidiary as of September 30, 2014 and December31, 2013 , and for the three and nine months ended September 30, 2014 and 2013 is as follows (in thousands):
29
Condensed Consolidating Balance Sheet
September 30, 2014
Parent Guarantor Subsidiaries
Non-Guarantor Subsidiary
Consolidating Adjustments Consolidated
Assets
Current assets
Cash and cash equivalents $ 1 $ 458 $ — $ — $ 459 Accounts receivable — 5,243 2,187 — 7,430 Unbilled revenue — 17,747 3,524 — 21,271 Risk management assets — 1,047 — — 1,047 Other current assets — 4,323 392 — 4,715 Current assets held for sale — 29 — — 29
Total current assets 1 28,847 6,103 — 34,951 Property, plant and equipment, net — 358,413 57,386 — 415,799 Note receivable 27,315 — — (27,315 ) — Goodwill — 16,253 — — 16,253 Intangible assets, net — 45,585 — — 45,585 Investment in unconsolidated affiliate — 11,017 — — 11,017 Other assets, net — 10,212 983 — 11,195 Noncurrent assets held for sale, net — 1,164 — — 1,164 Investment in subsidiaries 357,765 56,969 — (414,734 ) —
Total assets $ 385,081 $ 528,460 $ 64,472 $ (442,049 ) $ 535,964
Liabilities, Equity and Partners’ Capital
Current liabilities
Accounts payable $ 59 $ 12,242 $ 125 $ — $ 12,426 Accrued gas purchases — 12,798 1,964 — 14,762 Accrued expenses and other current liabilities — 21,026 399 — 21,425 Current portion of long-term debt — 1 — — 1 Risk management liabilities — 335 — — 335 Current liabilities held for sale — 1 — — 1
Total current liabilities 59 46,403 2,488 — 48,950 Risk management liabilities - long-term — — — — — Asset retirement obligations — 34,300 482 — 34,782 Other liabilities — 161 — — 161 Long-term debt — 85,015 — (27,315 ) 57,700 Deferred tax liability — 4,816 — — 4,816 Noncurrent liabilities held for sale, net — — — — —
Total liabilities 59 170,695 2,970 (27,315 ) 146,409 Convertible preferred units
Series A convertible preferred units 104,736 — — — 104,736 Total partners’ capital 280,286 357,765 56,969 (414,734 ) 280,286
Noncontrolling interests — — 4,533 — 4,533 Total equity and partners' capital 280,286 357,765 61,502 (414,734 ) 284,819
Total liabilities, equity and partners' capital $ 385,081 $ 528,460 $ 64,472 $ (442,049 ) $ 535,964
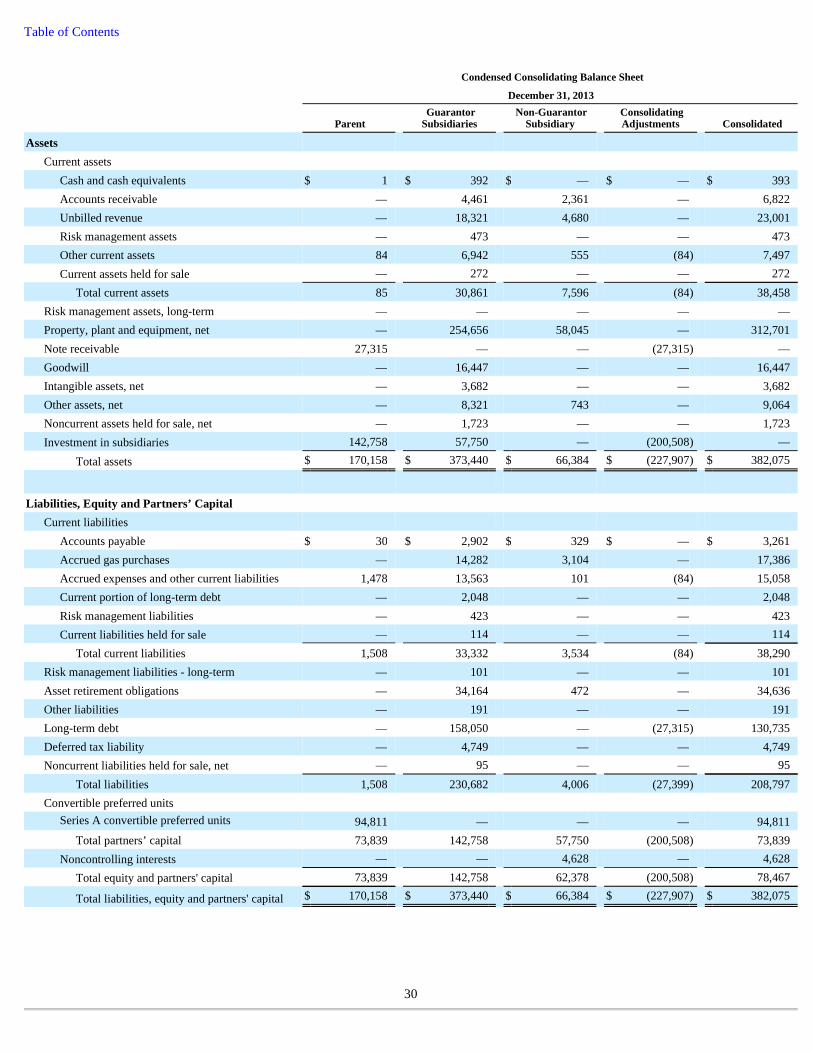
Table of Contents
30
Condensed Consolidating Balance Sheet
December 31, 2013
Parent Guarantor Subsidiaries
Non-Guarantor Subsidiary
Consolidating Adjustments Consolidated
Assets
Current assets
Cash and cash equivalents $ 1 $ 392 $ — $ — $ 393 Accounts receivable — 4,461 2,361 — 6,822 Unbilled revenue — 18,321 4,680 — 23,001 Risk management assets — 473 — — 473 Other current assets 84 6,942 555 (84 ) 7,497 Current assets held for sale — 272 — — 272
Total current assets 85 30,861 7,596 (84 ) 38,458 Risk management assets, long-term — — — — — Property, plant and equipment, net — 254,656 58,045 — 312,701 Note receivable 27,315 — — (27,315 ) — Goodwill — 16,447 — — 16,447 Intangible assets, net — 3,682 — — 3,682 Other assets, net — 8,321 743 — 9,064 Noncurrent assets held for sale, net — 1,723 — — 1,723 Investment in subsidiaries 142,758 57,750 — (200,508 ) —
Total assets $ 170,158 $ 373,440 $ 66,384 $ (227,907 ) $ 382,075
Liabilities, Equity and Partners’ Capital
Current liabilities
Accounts payable $ 30 $ 2,902 $ 329 $ — $ 3,261 Accrued gas purchases — 14,282 3,104 — 17,386 Accrued expenses and other current liabilities 1,478 13,563 101 (84 ) 15,058 Current portion of long-term debt — 2,048 — — 2,048 Risk management liabilities — 423 — — 423 Current liabilities held for sale — 114 — — 114
Total current liabilities 1,508 33,332 3,534 (84 ) 38,290 Risk management liabilities - long-term — 101 — — 101 Asset retirement obligations — 34,164 472 — 34,636 Other liabilities — 191 — — 191 Long-term debt — 158,050 — (27,315 ) 130,735 Deferred tax liability — 4,749 — — 4,749 Noncurrent liabilities held for sale, net — 95 — — 95
Total liabilities 1,508 230,682 4,006 (27,399 ) 208,797 Convertible preferred units
Series A convertible preferred units 94,811 — — — 94,811 Total partners’ capital 73,839 142,758 57,750 (200,508 ) 73,839
Noncontrolling interests — — 4,628 — 4,628 Total equity and partners' capital 73,839 142,758 62,378 (200,508 ) 78,467
Total liabilities, equity and partners' capital $ 170,158 $ 373,440 $ 66,384 $ (227,907 ) $ 382,075
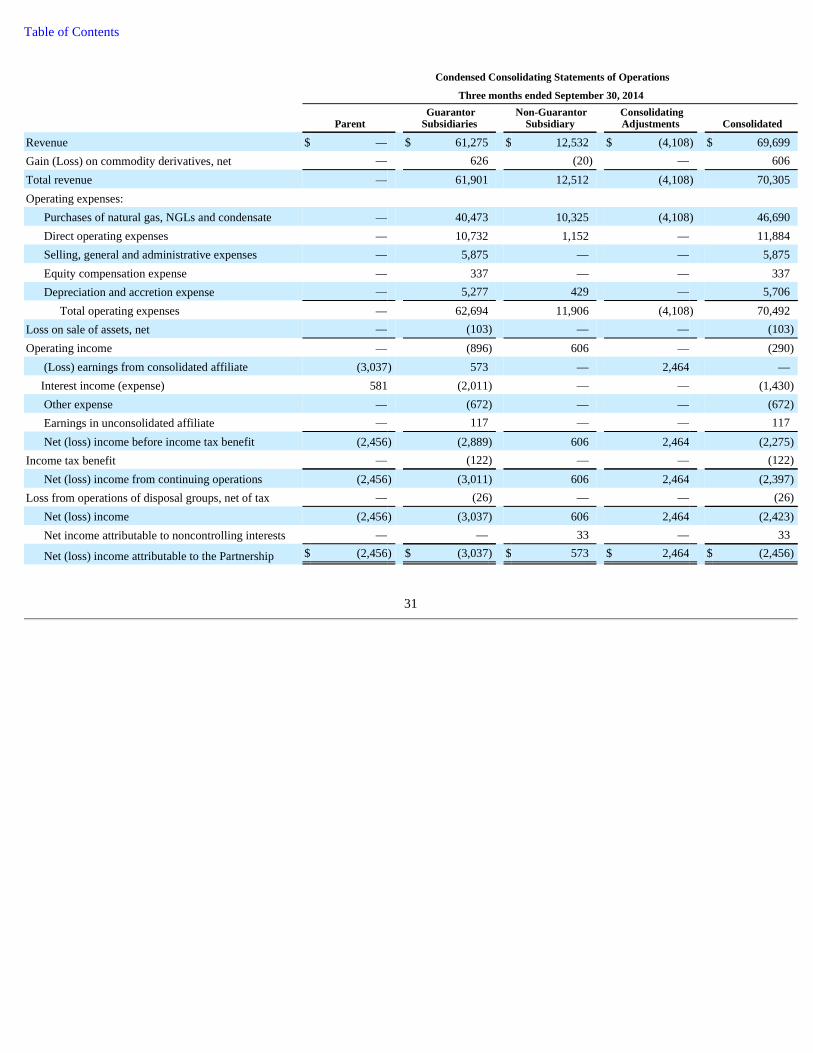
Table of Contents
31
Condensed Consolidating Statements of Operations
Three months ended September 30, 2014
Parent Guarantor Subsidiaries
Non-Guarantor Subsidiary
Consolidating Adjustments Consolidated
Revenue $ — $ 61,275 $ 12,532 $ (4,108 ) $ 69,699 Gain (Loss) on commodity derivatives, net — 626 (20 ) — 606 Total revenue — 61,901 12,512 (4,108 ) 70,305 Operating expenses:
Purchases of natural gas, NGLs and condensate — 40,473 10,325 (4,108 ) 46,690 Direct operating expenses — 10,732 1,152 — 11,884 Selling, general and administrative expenses — 5,875 — — 5,875 Equity compensation expense — 337 — — 337 Depreciation and accretion expense — 5,277 429 — 5,706
Total operating expenses — 62,694 11,906 (4,108 ) 70,492 Loss on sale of assets, net — (103 ) — — (103 )
Operating income — (896 ) 606 — (290 )
(Loss) earnings from consolidated affiliate (3,037 ) 573 — 2,464 — Interest income (expense) 581 (2,011 ) — — (1,430 )
Other expense — (672 ) — — (672 )
Earnings in unconsolidated affiliate — 117 — — 117 Net (loss) income before income tax benefit (2,456 ) (2,889 ) 606 2,464 (2,275 )
Income tax benefit — (122 ) — — (122 )
Net (loss) income from continuing operations (2,456 ) (3,011 ) 606 2,464 (2,397 )
Loss from operations of disposal groups, net of tax — (26 ) — — (26 )
Net (loss) income (2,456 ) (3,037 ) 606 2,464 (2,423 )
Net income attributable to noncontrolling interests — — 33 — 33
Net (loss) income attributable to the Partnership $ (2,456 ) $ (3,037 ) $ 573 $ 2,464 $ (2,456 )

Table of Contents
32
Condensed Consolidating Statements of Operations
Three months ended September 30, 2013
Parent Guarantor Subsidiaries
Non-Guarantor Subsidiary
Consolidating Adjustments Consolidated
Revenue $ — $ 64,346 $ 14,562 $ (890 ) $ 78,018 Loss on commodity derivatives, net — (499 ) — — (499 )
Total revenue — 63,847 14,562 (890 ) 77,519 Operating expenses:
Purchases of natural gas, NGLs and condensate — 45,153 11,502 (890 ) 55,765 Direct operating expenses — 7,886 1,206 — 9,092 Selling, general and administrative expenses — 4,494 — — 4,494 Equity compensation expense — 392 — — 392 Depreciation and accretion expense — 7,465 415 — 7,880
Total operating expenses — 65,390 13,123 (890 ) 77,623 Operating (loss) income — (1,543 ) 1,439 — (104 )
(Loss) earnings from consolidated affiliate (2,731 ) 1,249 — 1,482 — Interest expense — (2,636 ) — — (2,636 )
Net (loss) income before income tax benefit (2,731 ) (2,930 ) 1,439 1,482 (2,740 )
Income tax benefit — 214 — — 214 Net (loss) income from continuing operations (2,731 ) (2,716 ) 1,439 1,482 (2,526 )
Loss from operations of disposal groups, net of tax — (15 ) — — (15 )
Net (loss) income (2,731 ) (2,731 ) 1,439 1,482 (2,541 )
Net income attributable to noncontrolling interests — — 190 — 190
Net (loss) income attributable to the Partnership $ (2,731 ) $ (2,731 ) $ 1,249 $ 1,482 $ (2,731 )
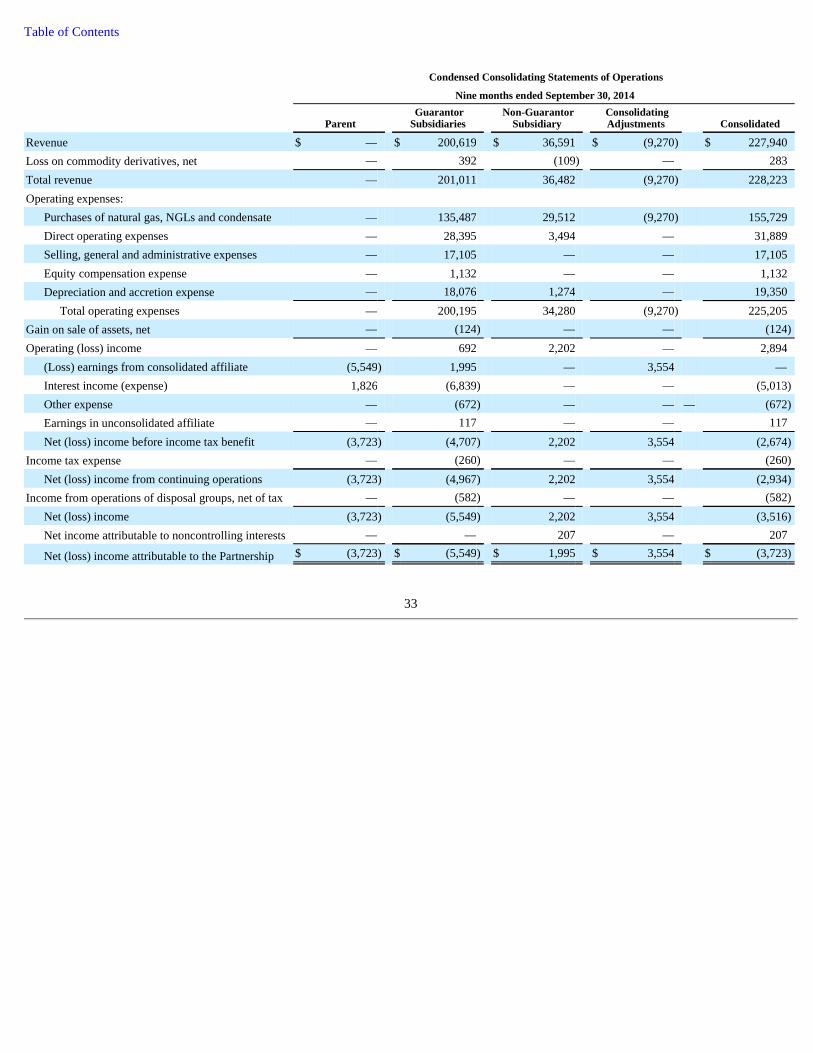
Table of Contents
33
Condensed Consolidating Statements of Operations
Nine months ended September 30, 2014
Parent Guarantor Subsidiaries
Non-Guarantor Subsidiary
Consolidating Adjustments Consolidated
Revenue $ — $ 200,619 $ 36,591 $ (9,270 ) $ 227,940 Loss on commodity derivatives, net — 392 (109 ) — 283 Total revenue — 201,011 36,482 (9,270 ) 228,223 Operating expenses:
Purchases of natural gas, NGLs and condensate — 135,487 29,512 (9,270 ) 155,729 Direct operating expenses — 28,395 3,494 — 31,889 Selling, general and administrative expenses — 17,105 — — 17,105 Equity compensation expense — 1,132 — — 1,132 Depreciation and accretion expense — 18,076 1,274 — 19,350
Total operating expenses — 200,195 34,280 (9,270 ) 225,205 Gain on sale of assets, net — (124 ) — — (124 )
Operating (loss) income — 692 2,202 — 2,894 (Loss) earnings from consolidated affiliate (5,549 ) 1,995 — 3,554 —
Interest income (expense) 1,826 (6,839 ) — — (5,013 )
Other expense — (672 ) — — — (672 )
Earnings in unconsolidated affiliate — 117 — — 117 Net (loss) income before income tax benefit (3,723 ) (4,707 ) 2,202 3,554 (2,674 )
Income tax expense — (260 ) — — (260 )
Net (loss) income from continuing operations (3,723 ) (4,967 ) 2,202 3,554 (2,934 )
Income from operations of disposal groups, net of tax — (582 ) — — (582 )
Net (loss) income (3,723 ) (5,549 ) 2,202 3,554 (3,516 )
Net income attributable to noncontrolling interests — — 207 — 207
Net (loss) income attributable to the Partnership $ (3,723 ) $ (5,549 ) $ 1,995 $ 3,554 $ (3,723 )
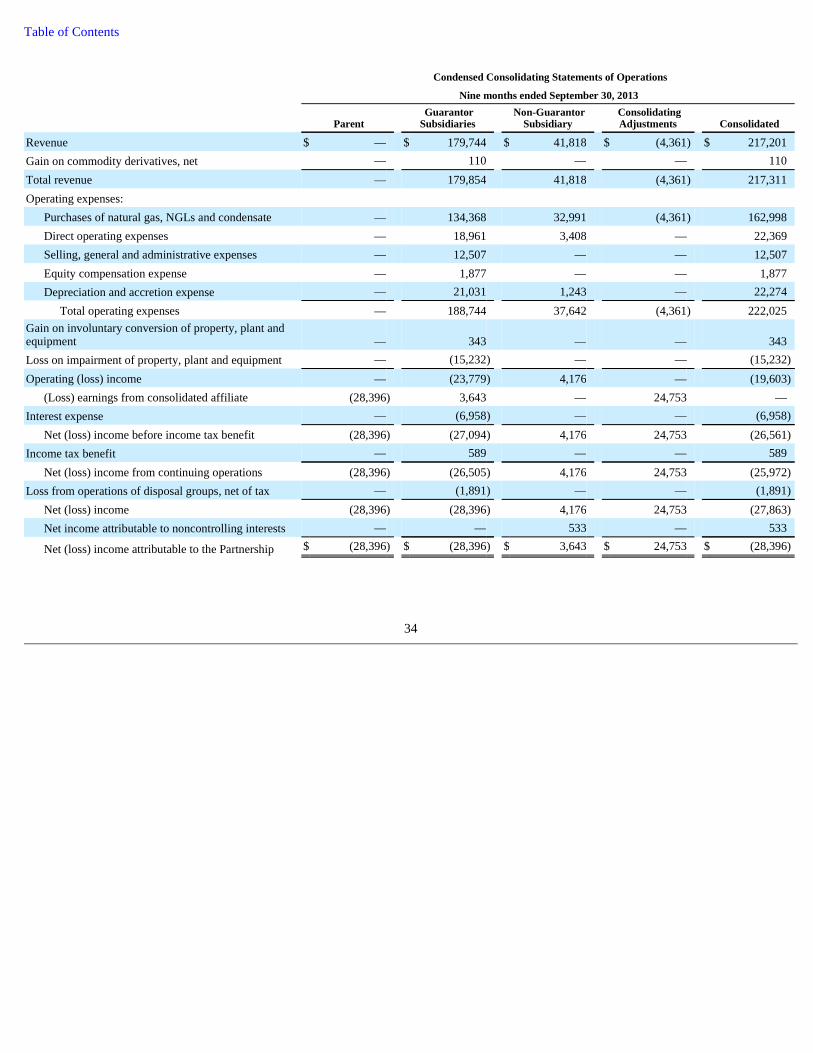
Table of Contents
34
Condensed Consolidating Statements of Operations
Nine months ended September 30, 2013
Parent Guarantor Subsidiaries
Non-Guarantor Subsidiary
Consolidating Adjustments Consolidated
Revenue $ — $ 179,744 $ 41,818 $ (4,361 ) $ 217,201 Gain on commodity derivatives, net — 110 — — 110 Total revenue — 179,854 41,818 (4,361 ) 217,311 Operating expenses:
Purchases of natural gas, NGLs and condensate — 134,368 32,991 (4,361 ) 162,998 Direct operating expenses — 18,961 3,408 — 22,369 Selling, general and administrative expenses — 12,507 — — 12,507 Equity compensation expense — 1,877 — — 1,877 Depreciation and accretion expense — 21,031 1,243 — 22,274
Total operating expenses — 188,744 37,642 (4,361 ) 222,025 Gain on involuntary conversion of property, plant and equipment — 343 — — 343 Loss on impairment of property, plant and equipment — (15,232 ) — — (15,232 )
Operating (loss) income — (23,779 ) 4,176 — (19,603 )
(Loss) earnings from consolidated affiliate (28,396 ) 3,643 — 24,753 — Interest expense — (6,958 ) — — (6,958 )
Net (loss) income before income tax benefit (28,396 ) (27,094 ) 4,176 24,753 (26,561 )
Income tax benefit — 589 — — 589 Net (loss) income from continuing operations (28,396 ) (26,505 ) 4,176 24,753 (25,972 )
Loss from operations of disposal groups, net of tax — (1,891 ) — — (1,891 )
Net (loss) income (28,396 ) (28,396 ) 4,176 24,753 (27,863 )
Net income attributable to noncontrolling interests — — 533 — 533
Net (loss) income attributable to the Partnership $ (28,396 ) $ (28,396 ) $ 3,643 $ 24,753 $ (28,396 )
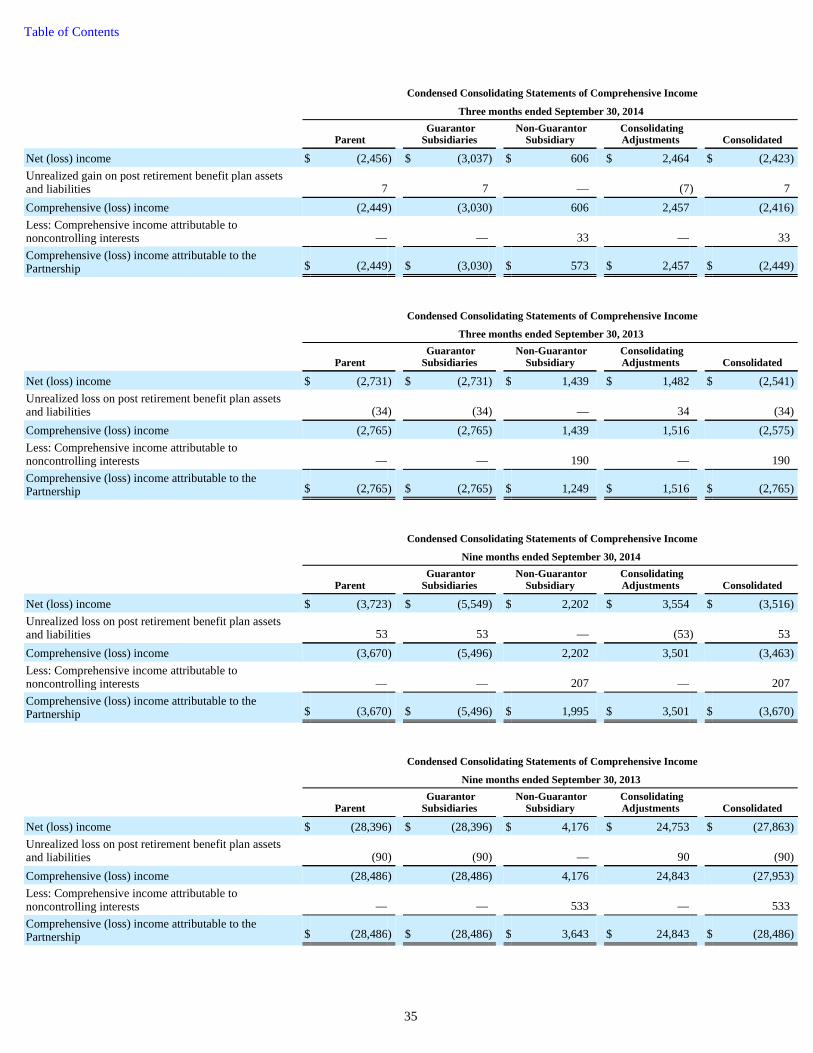
Table of Contents
35
Condensed Consolidating Statements of Comprehensive Income
Three months ended September 30, 2014
Parent Guarantor Subsidiaries
Non-Guarantor Subsidiary
Consolidating Adjustments Consolidated
Net (loss) income $ (2,456 ) $ (3,037 ) $ 606 $ 2,464 $ (2,423 )
Unrealized gain on post retirement benefit plan assets and liabilities 7 7 — (7 ) 7 Comprehensive (loss) income (2,449 ) (3,030 ) 606 2,457 (2,416 )
Less: Comprehensive income attributable to noncontrolling interests — — 33 — 33 Comprehensive (loss) income attributable to the Partnership $ (2,449 ) $ (3,030 ) $ 573 $ 2,457 $ (2,449 )
Condensed Consolidating Statements of Comprehensive Income
Three months ended September 30, 2013
Parent Guarantor Subsidiaries
Non-Guarantor Subsidiary
Consolidating Adjustments Consolidated
Net (loss) income $ (2,731 ) $ (2,731 ) $ 1,439 $ 1,482 $ (2,541 )
Unrealized loss on post retirement benefit plan assets and liabilities (34 ) (34 ) — 34 (34 )
Comprehensive (loss) income (2,765 ) (2,765 ) 1,439 1,516 (2,575 )
Less: Comprehensive income attributable to noncontrolling interests — — 190 — 190 Comprehensive (loss) income attributable to the Partnership $ (2,765 ) $ (2,765 ) $ 1,249 $ 1,516 $ (2,765 )
Condensed Consolidating Statements of Comprehensive Income
Nine months ended September 30, 2014
Parent Guarantor Subsidiaries
Non-Guarantor Subsidiary
Consolidating Adjustments Consolidated
Net (loss) income $ (3,723 ) $ (5,549 ) $ 2,202 $ 3,554 $ (3,516 )
Unrealized loss on post retirement benefit plan assets and liabilities 53 53 — (53 ) 53 Comprehensive (loss) income (3,670 ) (5,496 ) 2,202 3,501 (3,463 )
Less: Comprehensive income attributable to noncontrolling interests — — 207 — 207 Comprehensive (loss) income attributable to the Partnership $ (3,670 ) $ (5,496 ) $ 1,995 $ 3,501 $ (3,670 )
Condensed Consolidating Statements of Comprehensive Income
Nine months ended September 30, 2013
Parent Guarantor Subsidiaries
Non-Guarantor Subsidiary
Consolidating Adjustments Consolidated
Net (loss) income $ (28,396 ) $ (28,396 ) $ 4,176 $ 24,753 $ (27,863 )
Unrealized loss on post retirement benefit plan assets and liabilities (90 ) (90 ) — 90 (90 )
Comprehensive (loss) income (28,486 ) (28,486 ) 4,176 24,843 (27,953 )
Less: Comprehensive income attributable to noncontrolling interests — — 533 — 533 Comprehensive (loss) income attributable to the Partnership $ (28,486 ) $ (28,486 ) $ 3,643 $ 24,843 $ (28,486 )

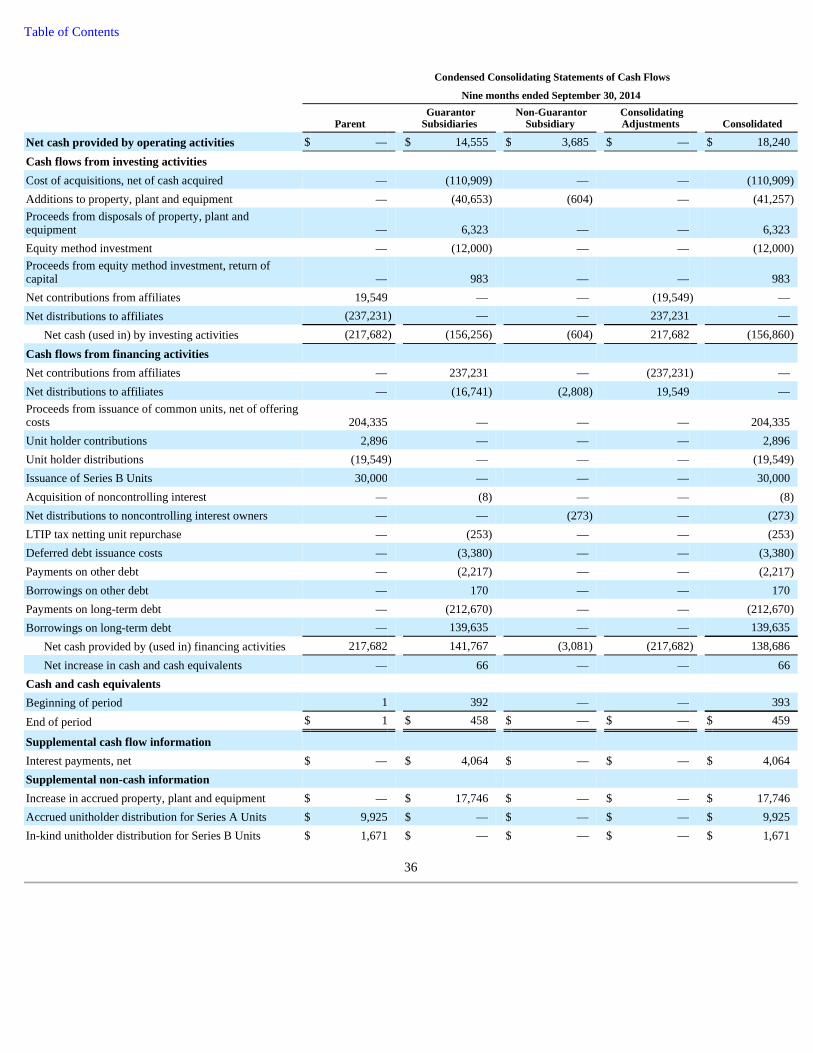
Table of Contents
36
Condensed Consolidating Statements of Cash Flows
Nine months ended September 30, 2014
Parent Guarantor Subsidiaries
Non-Guarantor Subsidiary
Consolidating Adjustments Consolidated
Net cash provided by operating activities $ — $ 14,555 $ 3,685 $ — $ 18,240 Cash flows from investing activities
Cost of acquisitions, net of cash acquired — (110,909 ) — — (110,909 )
Additions to property, plant and equipment — (40,653 ) (604 ) — (41,257 )
Proceeds from disposals of property, plant and equipment — 6,323 — — 6,323 Equity method investment — (12,000 ) — — (12,000 )
Proceeds from equity method investment, return of capital — 983 — — 983 Net contributions from affiliates 19,549 — — (19,549 ) — Net distributions to affiliates (237,231 ) — — 237,231 —
Net cash (used in) by investing activities (217,682 ) (156,256 ) (604 ) 217,682 (156,860 )
Cash flows from financing activities
Net contributions from affiliates — 237,231 — (237,231 ) — Net distributions to affiliates — (16,741 ) (2,808 ) 19,549 — Proceeds from issuance of common units, net of offering costs 204,335 — — — 204,335 Unit holder contributions 2,896 — — — 2,896 Unit holder distributions (19,549 ) — — — (19,549 )
Issuance of Series B Units 30,000 — — — 30,000 Acquisition of noncontrolling interest — (8 ) — — (8 )
Net distributions to noncontrolling interest owners — — (273 ) — (273 )
LTIP tax netting unit repurchase — (253 ) — — (253 )
Deferred debt issuance costs — (3,380 ) — — (3,380 )
Payments on other debt — (2,217 ) — — (2,217 )
Borrowings on other debt — 170 — — 170 Payments on long-term debt — (212,670 ) — — (212,670 )
Borrowings on long-term debt — 139,635 — — 139,635 Net cash provided by (used in) financing activities 217,682 141,767 (3,081 ) (217,682 ) 138,686 Net increase in cash and cash equivalents — 66 — — 66
Cash and cash equivalents
Beginning of period 1 392 — — 393 End of period $ 1 $ 458 $ — $ — $ 459
Supplemental cash flow information
Interest payments, net $ — $ 4,064 $ — $ — $ 4,064 Supplemental non-cash information
Increase in accrued property, plant and equipment $ — $ 17,746 $ — $ — $ 17,746 Accrued unitholder distribution for Series A Units $ 9,925 $ — $ — $ — $ 9,925 In-kind unitholder distribution for Series B Units $ 1,671 $ — $ — $ — $ 1,671
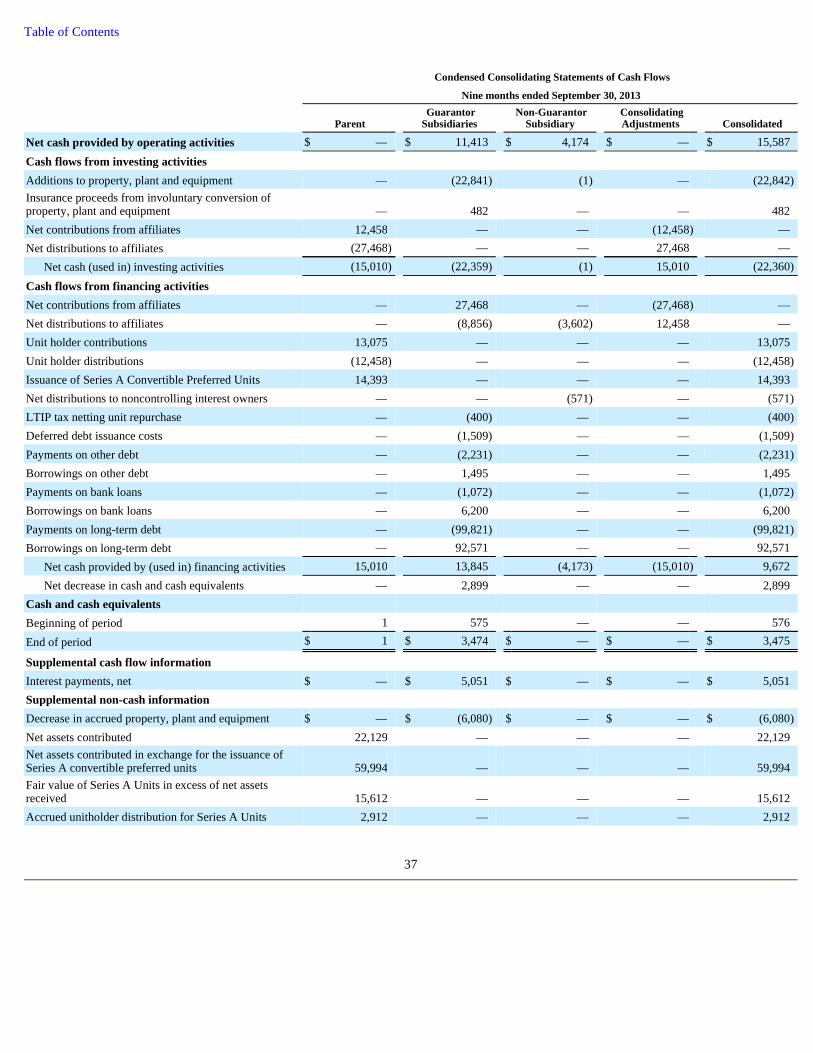
Table of Contents
37
Condensed Consolidating Statements of Cash Flows
Nine months ended September 30, 2013
Parent Guarantor Subsidiaries
Non-Guarantor Subsidiary
Consolidating Adjustments Consolidated
Net cash provided by operating activities $ — $ 11,413 $ 4,174 $ — $ 15,587 Cash flows from investing activities
Additions to property, plant and equipment — (22,841 ) (1 ) — (22,842 )
Insurance proceeds from involuntary conversion of property, plant and equipment — 482 — — 482 Net contributions from affiliates 12,458 — — (12,458 ) — Net distributions to affiliates (27,468 ) — — 27,468 —
Net cash (used in) investing activities (15,010 ) (22,359 ) (1 ) 15,010 (22,360 )
Cash flows from financing activities
Net contributions from affiliates — 27,468 — (27,468 ) — Net distributions to affiliates — (8,856 ) (3,602 ) 12,458 — Unit holder contributions 13,075 — — — 13,075 Unit holder distributions (12,458 ) — — — (12,458 )
Issuance of Series A Convertible Preferred Units 14,393 — — — 14,393 Net distributions to noncontrolling interest owners — — (571 ) — (571 )
LTIP tax netting unit repurchase — (400 ) — — (400 )
Deferred debt issuance costs — (1,509 ) — — (1,509 )
Payments on other debt — (2,231 ) — — (2,231 )
Borrowings on other debt — 1,495 — — 1,495 Payments on bank loans — (1,072 ) — — (1,072 )
Borrowings on bank loans — 6,200 — — 6,200 Payments on long-term debt — (99,821 ) — — (99,821 )
Borrowings on long-term debt — 92,571 — — 92,571 Net cash provided by (used in) financing activities 15,010 13,845 (4,173 ) (15,010 ) 9,672 Net decrease in cash and cash equivalents — 2,899 — — 2,899
Cash and cash equivalents
Beginning of period 1 575 — — 576 End of period $ 1 $ 3,474 $ — $ — $ 3,475
Supplemental cash flow information
Interest payments, net $ — $ 5,051 $ — $ — $ 5,051 Supplemental non-cash information
Decrease in accrued property, plant and equipment $ — $ (6,080 ) $ — $ — $ (6,080 )
Net assets contributed 22,129 — — — 22,129 Net assets contributed in exchange for the issuance of Series A convertible preferred units 59,994 — — — 59,994 Fair value of Series A Units in excess of net assets received 15,612 — — — 15,612 Accrued unitholder distribution for Series A Units 2,912 — — — 2,912

Table of Contents
18. Subsequent Events Distribution On October 23, 2014, we announced a distribution of $0.4725 per unit for the quarter ended September 30, 2014 , or $1.89 per unit on an annualized basis, payable on November 14, 2014 to unitholders of record on November 7, 2014. Holders of our Series B Units will participate in this distribution and will receive this distribution in Series B Units rather than cash. Acquisition On October 13, 2014, the Partnership acquired Costar Midstream , LLC ("Costar") from Energy Spectrum Partners VI LP and Costar Midstream Energy, LLC for a purchase price of $471.5 million . Costar is an onshore gathering and processing company with its primary gathering, processing, fractionation, and off-spec condensate treating and stabilization assets in East Texas and the Permian basin, with a significant crude oil gathering system project underway in the Bakken oil play. The acquisition was funded with 6,892,931 common units of the Partnership issued directly to Energy Spectrum Partners VI LP and Costar Midstream Energy, LLC, which units are subject to customary lock-up provisions, and $271.6 million of cash from borrowings under the Partnership’s Credit Agreement and proceeds from the Pipe Offering.
38
Table of Contents Item 2. Management’s Discussion and Analysis of Financial Condition and Results of Operations
The following discussion and analysis of our financial condition and results of operations should be read in conjunction with the unaudited condensed consolidated financial statements and the related notes thereto included elsewhere in this Quarterly Report and the audited consolidated financial statements and notes thereto and management’s discussion and analysis of financial condition and results of operations as of and for the year ended December 31, 2013 included in i) our Annual Report on Form 10-K (“Annual Report”) that was filed with the SEC on March 11, 2014 and ii) our Annual Report on Form 10-K/A that was filed with the Securities and Exchange Commission ("SEC") on May 12, 2014, which updated portions of our annual report. This discussion contains forward-looking statements that reflect management’s current views with respect to future events and financial performance. Our actual results may differ materially from those anticipated in these forward-looking statements or as a result of certain factors such as those set forth below under the caption “Cautionary Statement Regarding Forward-Looking Statements.” Cautionary Statement About Forward-Looking Statements Our reports, filings and other public announcements may from time to time contain statements that do not directly or exclusively relate to historical facts. Such statements are “forward-looking statements”. You can typically identify forward-looking statements by the use of forward-looking words, such as “may,” “could,” “project,” “believe,” “anticipate,” “expect,” “estimate,” “potential,” “plan,” “forecast” and other similar words.
All statements that are not statements of historical facts, including statements regarding our future financial position, business strategy, budgets, projected costs and plans and objectives of management for future operations, are forward-looking statements.
These forward-looking statements reflect our intentions, plans, expectations, assumptions and beliefs about future events and are subject to risks, uncertainties and other factors, many of which are outside our control. Important factors that could cause actual results to differ materially from the expectations expressed or implied in the forward-looking statements include known and unknown risks. These risks and uncertainties, many of which are beyond our control, include, but are not limited to, the risks set forth in “Item 1A. Risk Factors” and elsewhere in this Quarterly Report, the Annual Report and the following:
Although we believe that the assumptions underlying our forward-looking statements are reasonable, any of the assumptions could be inaccurate, and, therefore, we cannot assure you that the forward-looking statements included in this Quarterly Report will prove to be accurate. Some of these and other risks and uncertainties that could cause actual results to differ materially from such
39
• our ability to access capital to fund growth, including access to the debt and equity markets, which will depend on general market conditions and the credit ratings for our debt obligations;
• the amount of collateral required to be posted from time to time in our transactions; • our success in risk management activities, including the use of derivative financial instruments to hedge commodity and interest rate
risks; • the level of creditworthiness of counterparties to transactions; • changes in laws and regulations, particularly with regard to taxes, safety, regulation of over-the-counter derivatives market and entities,
and protection of the environment; • the timing and extent of changes in natural gas, natural gas liquids and other commodity prices, interest rates and demand for our
services, including storage services in our Terminals segment; • weather and other natural phenomena, including their potential impact on demand for the commodities we sell and the operation of
company-owned and third party-owned infrastructure; • industry changes, including the impact of consolidations and changes in competition; • our ability to obtain necessary licenses, permits and other approvals; • the level and success of crude oil and natural gas drilling around our assets and our success in connecting natural gas supplies to our
gathering and processing systems; • the demand for NGL products by the petrochemical, refining or other industries; • our ability to obtain insurance on commercially reasonable terms, if at all, as well as the adequacy of insurance to cover our losses; • our ability to grow through contributions from affiliates, acquisitions or internal growth projects and the successful integration and future
performance of such assets; • our ability to hire as well as retain qualified personnel to execute our business strategy; • volatility in the price of our common units; • security threats such as military campaigns, terrorist attacks, and cybersecurity breaches, against, or otherwise impacting, our facilities
and systems; • our ability to timely and successfully integrate our current and future acquisitions, including the realization of all anticipated benefits of
any such transaction, which otherwise could negatively impact our future financial performance; and • general economic, market and business conditions.

Table of Contents
forward-looking statements are more fully described in “Item 1A. Risk Factors” and elsewhere in this Quarterly Report and our Annual Report. The forward-looking statements in this report speak as of the filing date of this report. Except as may be required by applicable law, we undertake no obligation to publicly update or advise of any change in any forward-looking statement, whether as a result of new information, future events or otherwise. Overview We are a growth-oriented Delaware limited partnership that was formed in August 2009 to own, operate, develop and acquire a diversified portfolio of midstream energy assets. We are engaged in the business of gathering, treating, processing, fractionating and transporting natural gas through our ownership and operation of nine gathering systems, two processing facilities, one fractionation facility, three interstate pipelines and five intrastate pipelines. We also own a 50% undivided, non-operating interest in a processing plant located in southern Louisiana. We are also an owner, developer and operator of petroleum, agricultural, and chemical liquid terminal storage facilities through our ownership of four terminal sites. Our assets, which are strategically located in Alabama, Georgia, Louisiana, Maryland, Mississippi, Tennessee and Texas, provide critical infrastructure that links producers and suppliers of natural gas to diverse natural gas and NGL markets, including various interstate and intrastate pipelines, as well as utility, industrial and other commercial customers. We currently operate approximately 2,300 miles of pipelines that gather and transport approximately 1 Bcf/d of natural gas and operate approximately 1.7 million barrels of above-ground storage capacity across four marine terminal sites. Significant financial highlights during the three months ended September 30, 2014 , include the following:
Significant operational highlights during the three months ended September 30, 2014 , include the following:
Recent Developments Main Pass Oil Gathering System On August 11, 2014, the Partnership acquired a 66.7% non-operated interest in Main Pass Oil Gathering Company (“MPOG”), which is an offshore oil gathering system, for a purchase price of $12.0 million . The acquisition was financed through the Partnership's credit facility. We received distributions of $1.1 million during the three months ended September 30, 2014. Harvey Terminal
40
• For the three months ended September 30, 2014 , gross margin increased to $21.3 million , or an increase of 1.9% , compared to the same period in 2013 ;
• Adjusted EBITDA increased for the three months ended September 30, 2014 to $9.0 million , or an increase of 2.6% , compared to the same period in 2013 ;
• We distributed $5.2 million to our common unitholders, or $0.4625 per unit, during the three months ended September 30, 2014 ;
• On September 5, 2014, we entered into an amended and restated credit agreement, which provides for a maximum borrowing equal to $500.0 million , with the ability to further increase the borrowing capacity subject to lender approval; and
• On August 20, 2014, we completed the PIPE Offering with certain institutional investors for the sale of 4,622,352 common units and received $119.3 million in cash proceeds.
• During the three months ended September 30, 2014 , our Lavaca System in the Eagle Ford is continuing to operate above expectations and contributed incremental throughput of 72.0 MMcf/d;
• For the three months ended September 30, 2014 , Terminal utilization decreased to 81.8% compared to 100% for the same period in 2013 , as a result of an increase in total terminal capacity at our Harvey facility that is not currently under contract;
• Throughput attributable to the Partnership totaled 913.6 MMcf/d for the third quarter of 2014 representing an 8.9% decrease compared to the same period in 2013 ;
• Average gross NGL production totaled 39.1 Mgal/d for the third quarter of 2014 representing a 28.0% decrease compared to the same period in 2013 ; and
• Average condensate production totaled 38.7 Mgal/d for the third quarter of 2014 , a 19.5% decrease compared to the third quarter of 2013 .
Table of Contents Terminal storage operations at Harvey commenced during the three months ending September 30, 2014, adding 238,000 barrels in incremental storage capacity and increasing the Partnership’s total storage capacity to approximately 1.7 million barrels. Construction of a deep-water ship dock is currently underway with completion expected in the first quarter of 2015. Upon completion, Harvey is expected to be a full-service storage site, providing rail, truck, barge, and deep-water service. Harvey has the potential for more than two million barrels of capacity when fully developed, which would increase the Partnership's total storage capacity by more than 100 percent. Midla Natchez Line On October 8, 2014, American Midstream Midla, LLC (“Midla”), a subsidiary of the Partnership, announced an agreement in principle to retire the existing 1920s vintage Midla pipeline that traverses Louisiana and Mississippi and replace the existing natural gas service with a new 12-inch pipeline from Winnsboro, Louisiana to Natchez Mississippi (the “Natchez Line”) to serve existing residential, commercial, and industrial customers. The agreement is subject to final agreements and ongoing proceedings at the Federal Energy Regulatory Commission. Series A Unit Distributions Amendment The Partnership executed an amendment to the Partnership agreement related to its Series A Units, which became effective July 24, 2014. As a result of the Amendment, distributions on Series A Units will be made with paid-in-kind Series A Units, cash or a combination thereof, at the discretion of the Board of Directors of the Partnership’s general partner, which began with the distribution for the three months ended June 30, 2014 and will continue for the subsequent three fiscal quarters. Prior to the Amendment, the Partnership was required to pay distributions on the Series A Units with a combination of paid-in-kind units and cash. The Board of Directors approved a distribution of paid-in-kind Series A Units for the three months ended June 30, 2014, which was made on August 14, 2014. Republic Midstream Crude Oil System On August 5, 2014, the Partnership executed an option agreement providing the Partnership with the right to acquire a 50 percent interest in Republic Midstream, LLC (“Republic Midstream”) from an affiliate of ArcLight Capital Partners, LLC ("ArcLight"), an affiliate which controls 95% of the General Partner of the Partnership. Republic Midstream, a newly formed ArcLight portfolio company, executed an agreement with Penn Virginia in July 2014 to construct and operate a crude oil gathering system, central delivery terminal complex, and an intermediate takeaway pipeline to serve Penn Virginia’s acreage position in the Eagle Ford Shale. In accordance with the terms of the option agreement, the Partnership will have the right to acquire 50 percent of Republic Midstream for approximately $200 million upon commencement of operations, which is expected in mid-2015. Pursuant to the terms of its agreement with Penn Virginia, Republic Midstream will provide midstream services to Penn Virginia under a long-term, fee-based transportation agreement, supported by minimum volume commitments and dedicated acreage in the area served by the gathering system. The gathering system is expected to include 170 miles of gathering and trunk lines located in north central Gonzales and Lavaca counties that will deliver gathered volumes to a 144-acre storage and blending crude oil terminal in western Lavaca County. The intermediate system is expected to consist of a 12-inch, 25-mile takeaway pipeline with initial capacity of 80,000 barrels per day. Prior to and after the acquisition of the 50 percent interest described above, the Partnership is currently providing construction, operations, and general management services for Republic Midstream. Gonzales County Full-Well-Stream Gathering System On August 4, 2014, the Board of Directors of the General Partner of the Partnership approved the Partnership’s right-of-first-offer to acquire the Gonzales County full-well-stream gathering and treating and saltwater disposal system in the Eagle Ford Shale. Following acquisition of the system, the Partnership will provide the midstream services under a long-term, fee-based agreement. Construction of the system is under way, and the producer customer recently notified the Partnership of a change to their drilling program that will require modifications to the system and will delay commencement of operations until mid-2015. As such, the Partnership anticipates the drop-down of the system to be completed in mid-2015. Subsequent Events Distribution On October 23, 2014, we announced an increase to our distribution of 4.4% to $0.4725 per unit for the quarter ended September 30, 2014 compared to the distribution for the third quarter of 2013, or $1.89 per unit on an annualized basis, payable on November
41
Table of Contents 14, 2014 to unitholders of record on November 7, 2014. Holders of our Series B Units will participate in this distribution and will receive this distribution in Series B Units rather than cash. Acquisition On October 13, 2014, the Partnership acquired Costar Midstream LLC ("Costar" and the "Costar Acquisition") from Energy Spectrum Partners VI LP and Costar Midstream Energy, LLC for approximately $471.5 million . Costar is an onshore gathering and processing company with its primary gathering, processing, fractionation, and off-spec condensate treating and stabilization assets in East Texas and the Permian basin, with a significant crude oil gathering system project underway in the Bakken oil play. As a result, we increased our 2014 capital expenditure forecast range to $75 million to $80 million to accommodate this crude oil project in the Bakken. The acquisition was funded with 6,892,931 American Midstream common units issued directly to Energy Spectrum Partners VI LP and Costar Midstream Energy, LLC, which are subject to customary lock-up provisions, and $271.6 million of cash from borrowings under the Partnership’s Credit Agreement and proceeds from the Pipe Offering. Our Operations We manage our business and analyze and report our results of operations through three business segments:
Gathering and Processing Segment Results of operations from our Gathering and Processing segment are determined primarily by the volumes of natural gas we gather, process and fractionate, the commercial terms in our current contract portfolio and natural gas, NGL and condensate prices. We gather and process gas primarily pursuant to the following arrangements:
42
• Gathering and Processing . Our Gathering and Processing segment provides “wellhead-to-market” services to producers of natural gas and oil, which include transporting raw natural gas from various receipt points through gathering systems, treating the raw natural gas, processing raw natural gas to separate the NGLs from the natural gas, fractionating NGLs, and selling or delivering pipeline-quality natural gas as well as NGLs to various markets and pipeline systems.
• Transmission . Our Transmission segment transports and delivers natural gas from producing wells, receipt points or pipeline interconnects for shippers and other customers, which include local distribution companies (“LDCs”), utilities and industrial, commercial and power generation customers.
• Terminals. Our Terminals segment provides above-ground storage services at our marine terminals that support various commercial customers, including commodity brokers, refiners and chemical manufacturers to store a range of products, including crude oil, bunker fuel, distillates, chemicals and agricultural products.
• Fee-Based Arrangements. Under these arrangements, we generally are paid a fixed cash fee for gathering and processing and transporting natural gas.
• Fixed-Margin Arrangements. Under these arrangements, we purchase natural gas from producers or suppliers at receipt points on our systems at an index price less a fixed transportation fee and simultaneously sell an identical volume of natural gas at delivery points on our systems at the same, undiscounted index price. By entering into back-to-back purchases and sales of natural gas, we are able to lock in a fixed margin on these transactions. We view the segment gross margin earned under our fixed-margin arrangements to be economically equivalent to the fee earned in our fee-based arrangements.
• Percent-of-Proceeds Arrangements (“POP”). Under these arrangements, we generally gather raw natural gas from producers at the wellhead or other supply points, transport it through our gathering system, process it and sell the residue natural gas, NGLs and condensate at market prices. Where we provide processing services at the processing plants that we own, or obtain processing services for our own account in connection with our elective processing arrangements, such as under our Toca contract, we generally retain and sell a percentage of the residue natural gas and resulting NGLs. However, we also have contracts under which we retain a percentage of the resulting NGLs and do not retain a percentage of residue natural gas, such as for our interest in the Burns Point Plant. Our POP arrangements also often contain a fee-based component.
• Interest in the Burns Point Plant. We account for our 50% interest in the Burns Point Plant using the proportionate consolidation method. Under this method, we include in our condensed consolidated statement of operations, our value of plant revenues taken in-kind and plant expenses reimbursed to the operator.
Table of Contents
Gross margin earned under fee-based and fixed-margin arrangements is directly related to the volume of natural gas that flows through our systems and is not directly dependent on commodity prices. However, a sustained decline in commodity prices could result in a decline in volumes and, thus, a decrease in our fee-based and fixed-margin gross margin. These arrangements provide stable cash flows but minimal, if any, upside in higher commodity-price environments. Under our typical POP arrangement, our gross margin is directly impacted by the commodity prices we realize on our share of natural gas and NGLs received as compensation for processing raw natural gas. However, our POP arrangements also often contain a fee-based component, which helps to mitigate the degree of commodity-price volatility we could experience under these arrangements. We further seek to mitigate our exposure to commodity price risk through our hedging program. Please read “ —Quantitative and Qualitative Disclosures about Market Risk — Commodity Price Risk.” Transmission Segment Results of operations from our Transmission segment are determined by capacity reservation fees from firm transportation contracts and the volumes of natural gas transported on the interstate and intrastate pipelines we own pursuant to interruptible transportation or fixed-margin contracts. Our transportation arrangements are further described below:
Terminals Segment In our Terminals segment, we generally receive fee-based compensation on guaranteed firm storage contracts and throughput fees charged to our customers when their products are either received or disbursed, along with other operational charges associated with ancillary services provided to our customers, such as excess throughput, truck weighing, etc. The terms of our firm storage contracts are multiple years, with renewal options. How We Evaluate Our Operations Our management uses a variety of financial and operational metrics to analyze our performance. We view these metrics as important factors in evaluating our profitability and review these measurements on at least a monthly basis for consistency and trend analysis. These metrics include throughput volumes, gross margin and direct operating expenses on a segment basis, and adjusted EBITDA on a company-wide basis. Throughput Volumes In our Gathering and Processing segment, we must continually obtain new supplies of natural gas to maintain or increase throughput volumes on our systems. Our ability to maintain or increase existing volumes of natural gas and obtain new supplies is impacted by i) the level of work-overs or recompletions of existing connected wells and successful drilling activity in areas currently dedicated to or near our gathering systems, ii) our ability to compete for volumes from successful new wells in the areas in which we operate, iii) our ability to obtain natural gas that has been released from other commitments and iv) the volume of natural gas
43
• Interest in the Chatom System. We account for our 92.2% undivided interest in the Chatom System pursuant to Accounting Standards Codification (“ASC”) No. 810-10-65-1, Noncontrolling Interests. Under this method, revenues, expenses, gains, losses, net income or loss, and other comprehensive income are reported in the condensed consolidated financial statements at the consolidated amounts, which include the amounts attributable to the partners' and the noncontrolling interests. The condensed consolidated income statement shall separately present net income attributable to the partners' and the noncontrolling interests.
• Firm Transportation Arrangements. Our obligation to provide firm transportation service means that we are obligated to transport natural gas nominated by the shipper up to the maximum daily quantity specified in the contract. In exchange for that obligation on our part, the shipper pays a specified reservation charge, whether or not the shipper utilizes the capacity. In most cases, the shipper also pays a variable-use charge with respect to quantities actually transported by us.
• Interruptible Transportation Arrangements. Our obligation to provide interruptible transportation service means that we are only obligated to transport natural gas nominated by the shipper to the extent that we have available capacity. For this service the shipper pays no reservation charge but pays a variable-use charge for quantities actually shipped.
• Fixed-Margin Arrangements. Under these arrangements, we purchase natural gas from producers or suppliers at receipt points on our systems at an index price less a fixed transportation fee and simultaneously sell an identical volume of natural gas at delivery points on our systems at the same undiscounted index price. We view fixed-margin arrangements to be economically equivalent to our interruptible transportation arrangements.

Table of Contents that we purchase from connected systems. We actively monitor producer activity in the areas served by our gathering and processing systems to pursue new supply opportunities. In our Transmission segment, the majority of our segment gross margin is generated by firm capacity reservation and interruptible fees from throughput volumes on our interstate and intrastate pipelines. Substantially all Transmission segment gross margin is generated under contracts with shippers, including producers, industrial companies, LDCs and marketers, for firm and interruptible natural gas transportation on our pipelines. We routinely monitor natural gas market activities in the areas served by our transmission systems to pursue new shipper opportunities. In our Terminals segment, throughput fees are charged to our customers when their products are either received or disbursed, along with other operational charges associated with ancillary services; such as excess throughput, truck weighing, etc. Gross Margin and Segment Gross Margin Gross margin and segment gross margin are metrics that we use to evaluate our performance. We define segment gross margin in our Gathering and Processing segment as revenue generated from gathering and processing operations less the cost of natural gas, NGLs and condensate purchased and revenue from construction, operating and maintenance agreements (“COMA”). Revenue includes revenue generated from fixed fees associated with the gathering and treating of natural gas and from the sale of natural gas, NGLs and condensate resulting from gathering and processing activities under fixed-margin and percent-of-proceeds arrangements. The cost of natural gas, NGLs and condensate includes volumes of natural gas, NGLs and condensate remitted back to producers pursuant to percent-of-proceeds arrangements and the cost of natural gas purchased for our own account, including pursuant to fixed-margin arrangements.
We define segment gross margin in our Transmission segment as revenue generated from firm and interruptible transportation agreements and fixed-margin arrangements, plus other related fees, less the cost of natural gas purchased in connection with fixed-margin arrangements. Substantially all of our gross margin in this segment is fee-based or fixed-margin, with little to no direct commodity price risk.
We define segment gross margin in our Terminals segment as revenue generated from fee-based compensation on guaranteed firm storage contracts and throughput fees charged to our customers less direct operating expense which includes direct labor, general materials and supplies and direct overhead. We define gross margin as the sum of our segment gross margin for our Gathering and Processing, Transmission and Terminals segments. The GAAP measure most comparable to gross margin is net income. Direct Operating Expenses Our management seeks to maximize the profitability of our operations in part by minimizing direct operating expenses without sacrificing safety or the environment. Direct labor costs, insurance costs, ad valorem and property taxes, repair and non-capitalized maintenance costs, integrity management costs, utilities, lost and unaccounted for gas, and contract services comprise the most significant portion of our operating expenses. These expenses are relatively stable and largely independent of throughput volumes through our systems but may fluctuate depending on the activities performed during a specific period. Adjusted EBITDA Adjusted EBITDA is a measure used by our management and by external users of our financial statements, such as investors, commercial banks, research analysts and others, to assess:
We define adjusted EBITDA as net income, plus interest expense, income tax expense, depreciation expense, certain non-cash charges such as non-cash compensation, unrealized losses on commodity derivative contracts, cash distributions in excess of
44
• the financial performance of our assets without regard to financing methods, capital structure or historical cost basis;
• the ability of our assets to generate cash sufficient to support our indebtedness and make cash distributions to our unit holders and General Partner;
• our operating performance and return on capital as compared to those of other companies in the midstream energy sector, without regard to financing or capital structure; and
• the attractiveness of capital projects and acquisitions and the overall rates of return on alternative investment opportunities.
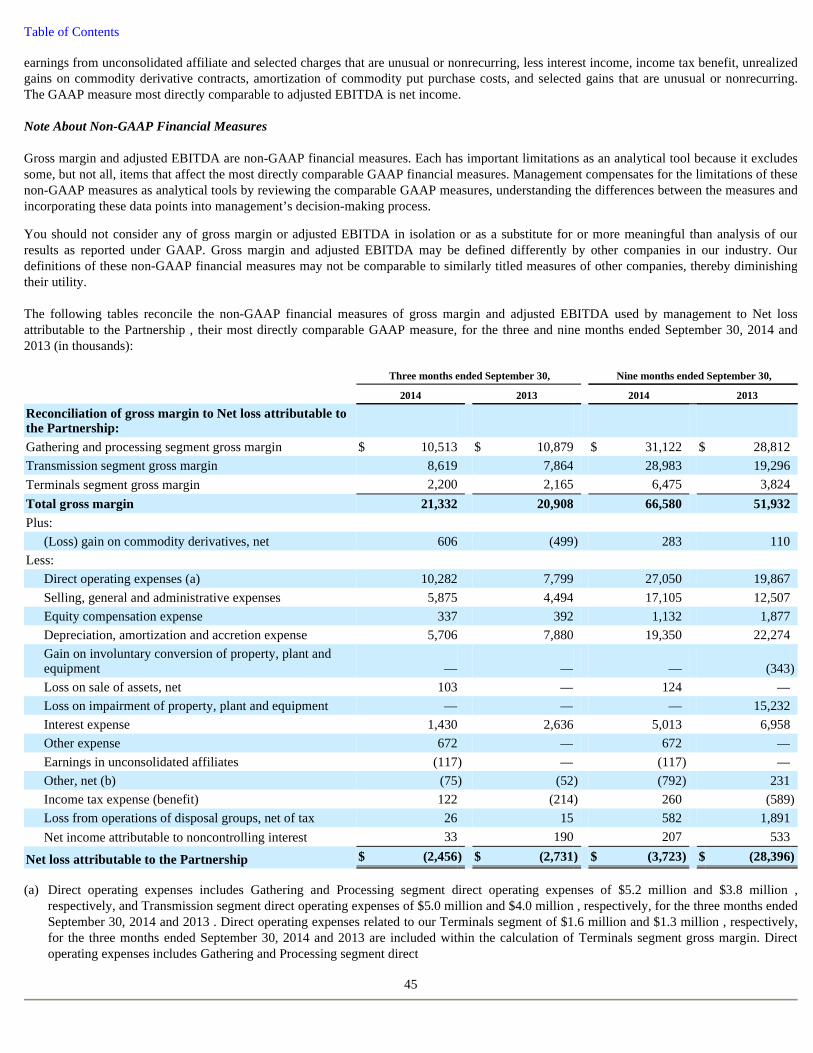
Table of Contents earnings from unconsolidated affiliate and selected charges that are unusual or nonrecurring, less interest income, income tax benefit, unrealized gains on commodity derivative contracts, amortization of commodity put purchase costs, and selected gains that are unusual or nonrecurring. The GAAP measure most directly comparable to adjusted EBITDA is net income. Note About Non-GAAP Financial Measures Gross margin and adjusted EBITDA are non-GAAP financial measures. Each has important limitations as an analytical tool because it excludes some, but not all, items that affect the most directly comparable GAAP financial measures. Management compensates for the limitations of these non-GAAP measures as analytical tools by reviewing the comparable GAAP measures, understanding the differences between the measures and incorporating these data points into management’s decision-making process.
You should not consider any of gross margin or adjusted EBITDA in isolation or as a substitute for or more meaningful than analysis of our results as reported under GAAP. Gross margin and adjusted EBITDA may be defined differently by other companies in our industry. Our definitions of these non-GAAP financial measures may not be comparable to similarly titled measures of other companies, thereby diminishing their utility. The following tables reconcile the non-GAAP financial measures of gross margin and adjusted EBITDA used by management to Net loss attributable to the Partnership , their most directly comparable GAAP measure, for the three and nine months ended September 30, 2014 and 2013 (in thousands):
45
Three months ended September 30, Nine months ended September 30,
2014 2013 2014 2013
Reconciliation of gross margin to Net loss attributable to the Partnership: Gathering and processing segment gross margin $ 10,513 $ 10,879 $ 31,122 $ 28,812 Transmission segment gross margin 8,619 7,864 28,983 19,296 Terminals segment gross margin 2,200 2,165 6,475 3,824 Total gross margin 21,332 20,908 66,580 51,932 Plus:
(Loss) gain on commodity derivatives, net 606 (499 ) 283 110 Less:
Direct operating expenses (a) 10,282 7,799 27,050 19,867 Selling, general and administrative expenses 5,875 4,494 17,105 12,507 Equity compensation expense 337 392 1,132 1,877 Depreciation, amortization and accretion expense 5,706 7,880 19,350 22,274 Gain on involuntary conversion of property, plant and equipment — — — (343 )
Loss on sale of assets, net 103 — 124 — Loss on impairment of property, plant and equipment — — — 15,232 Interest expense 1,430 2,636 5,013 6,958 Other expense 672 — 672 — Earnings in unconsolidated affiliates (117 ) — (117 ) — Other, net (b) (75 ) (52 ) (792 ) 231 Income tax expense (benefit) 122 (214 ) 260 (589 )
Loss from operations of disposal groups, net of tax 26 15 582 1,891 Net income attributable to noncontrolling interest 33 190 207 533
Net loss attributable to the Partnership $ (2,456 ) $ (2,731 ) $ (3,723 ) $ (28,396 )
(a) Direct operating expenses includes Gathering and Processing segment direct operating expenses of $5.2 million and $3.8 million , respectively, and Transmission segment direct operating expenses of $5.0 million and $4.0 million , respectively, for the three months ended September 30, 2014 and 2013 . Direct operating expenses related to our Terminals segment of $1.6 million and $1.3 million , respectively, for the three months ended September 30, 2014 and 2013 are included within the calculation of Terminals segment gross margin. Direct operating expenses includes Gathering and Processing segment direct
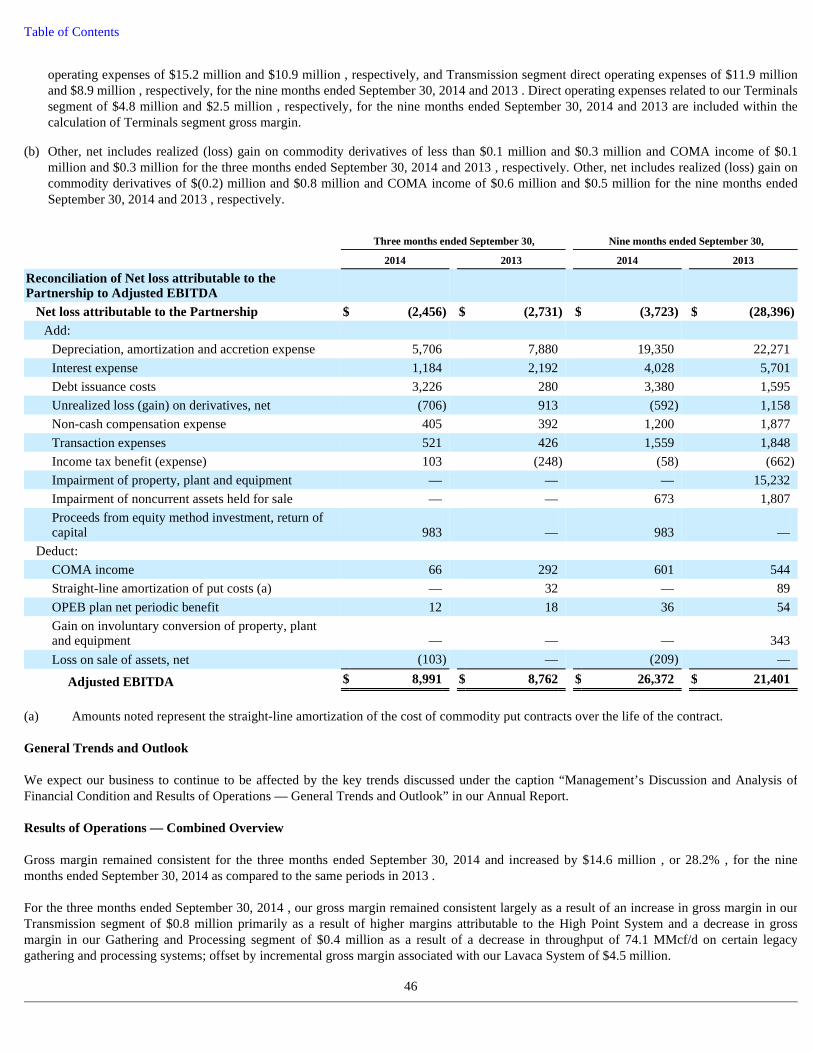
Table of Contents
operating expenses of $15.2 million and $10.9 million , respectively, and Transmission segment direct operating expenses of $11.9 million and $8.9 million , respectively, for the nine months ended September 30, 2014 and 2013 . Direct operating expenses related to our Terminals segment of $4.8 million and $2.5 million , respectively, for the nine months ended September 30, 2014 and 2013 are included within the calculation of Terminals segment gross margin.
General Trends and Outlook We expect our business to continue to be affected by the key trends discussed under the caption “Management’s Discussion and Analysis of Financial Condition and Results of Operations — General Trends and Outlook” in our Annual Report. Results of Operations — Combined Overview Gross margin remained consistent for the three months ended September 30, 2014 and increased by $14.6 million , or 28.2% , for the nine months ended September 30, 2014 as compared to the same periods in 2013 . For the three months ended September 30, 2014 , our gross margin remained consistent largely as a result of an increase in gross margin in our Transmission segment of $0.8 million primarily as a result of higher margins attributable to the High Point System and a decrease in gross margin in our Gathering and Processing segment of $0.4 million as a result of a decrease in throughput of 74.1 MMcf/d on certain legacy gathering and processing systems; offset by incremental gross margin associated with our Lavaca System of $4.5 million.
46
(b) Other, net includes realized (loss) gain on commodity derivatives of less than $0.1 million and $0.3 million and COMA income of $0.1 million and $0.3 million for the three months ended September 30, 2014 and 2013 , respectively. Other, net includes realized (loss) gain on commodity derivatives of $(0.2) million and $0.8 million and COMA income of $0.6 million and $0.5 million for the nine months ended September 30, 2014 and 2013 , respectively.
Three months ended September 30, Nine months ended September 30,
2014 2013 2014 2013
Reconciliation of Net loss attributable to the Partnership to Adjusted EBITDA
Net loss attributable to the Partnership $ (2,456 ) $ (2,731 ) $ (3,723 ) $ (28,396 ) Add:
Depreciation, amortization and accretion expense 5,706 7,880 19,350 22,271 Interest expense 1,184 2,192 4,028 5,701 Debt issuance costs 3,226 280 3,380 1,595 Unrealized loss (gain) on derivatives, net (706 ) 913 (592 ) 1,158 Non-cash compensation expense 405 392 1,200 1,877 Transaction expenses 521 426 1,559 1,848 Income tax benefit (expense) 103 (248 ) (58 ) (662 )
Impairment of property, plant and equipment — — — 15,232 Impairment of noncurrent assets held for sale — — 673 1,807 Proceeds from equity method investment, return of capital 983 — 983 —
Deduct:
COMA income 66 292 601 544 Straight-line amortization of put costs (a) — 32 — 89 OPEB plan net periodic benefit 12 18 36 54 Gain on involuntary conversion of property, plant and equipment — — — 343 Loss on sale of assets, net (103 ) — (209 ) —
Adjusted EBITDA $ 8,991 $ 8,762 $ 26,372 $ 21,401
(a) Amounts noted represent the straight-line amortization of the cost of commodity put contracts over the life of the contract.

Table of Contents For the nine months ended September 30, 2014 , the increase in gross margin was largely a result of: i) an increase in gross margin in our Transmission segment of $9.7 million primarily as a result of: i) increased throughput of 159.3 MMcf/d from the acquisition of the High Point System on April 15, 2013; ii) an increase in gross margin in our Gathering and Processing segment of $2.3 million primarily due to incremental gross margin associated with our Lavaca System of $10.6 million, offset by lower NGL and condensate volumes of 18.3 Mgal/d and lower natural gas throughput volumes of 10.2 MMcf/d on the certain legacy systems and iii) an increase in gross margin in our Terminals segment of $2.7 million due to incremental storage capacity and associated customers. For the three months ended September 30, 2014 , Adjusted EBITDA increased $0.2 million , or 2.6% , compared to the same period in 2013 . The increase is primarily related to i) an increase in the adjustment associated with the debt issuance costs paid of $2.9 million ; ii) a decline in net loss attributable to the Partnership of $0.3 million , and iii) distributions received in excess of earnings from an unconsolidated affiliate of $1.0 million ; offset by lower depreciation, amortization and accretion expense of $2.2 million and interest expense of $1.0 million . For the nine months ended September 30, 2014 , Adjusted EBITDA increased $5.0 million , or 23.2% , compared to the same period in 2013 . The increase is primarily related to a lower loss attributable to the Partnership of $9.4 million (excluding non-cash impairment charges) and cash received in excess of earning on unconsolidated affiliates of $1.0 million ; offset by i) lower depreciation, amortization and accretion expense of $2.9 million ; ii) lower interest expense of $1.7 million ; and iii) lower unrealized losses on commodity derivatives of $1.8 million .
We distributed $5.2 million to holders of our common units, or $0.4625 per unit, during the three months ended September 30, 2014 , representing the distribution with respect to the three months ended June 30, 2014. We distributed $15.2 million to holders of our common units, or $1.3775 per unit, during the nine months ended September 30, 2014 , including the distribution with respect to the three months ended December 31, 2013.
The following table and discussion presents certain of our historical condensed consolidated financial data for the periods indicated. The results of operations by segment are discussed in further detail following this combined overview (in thousands):
47
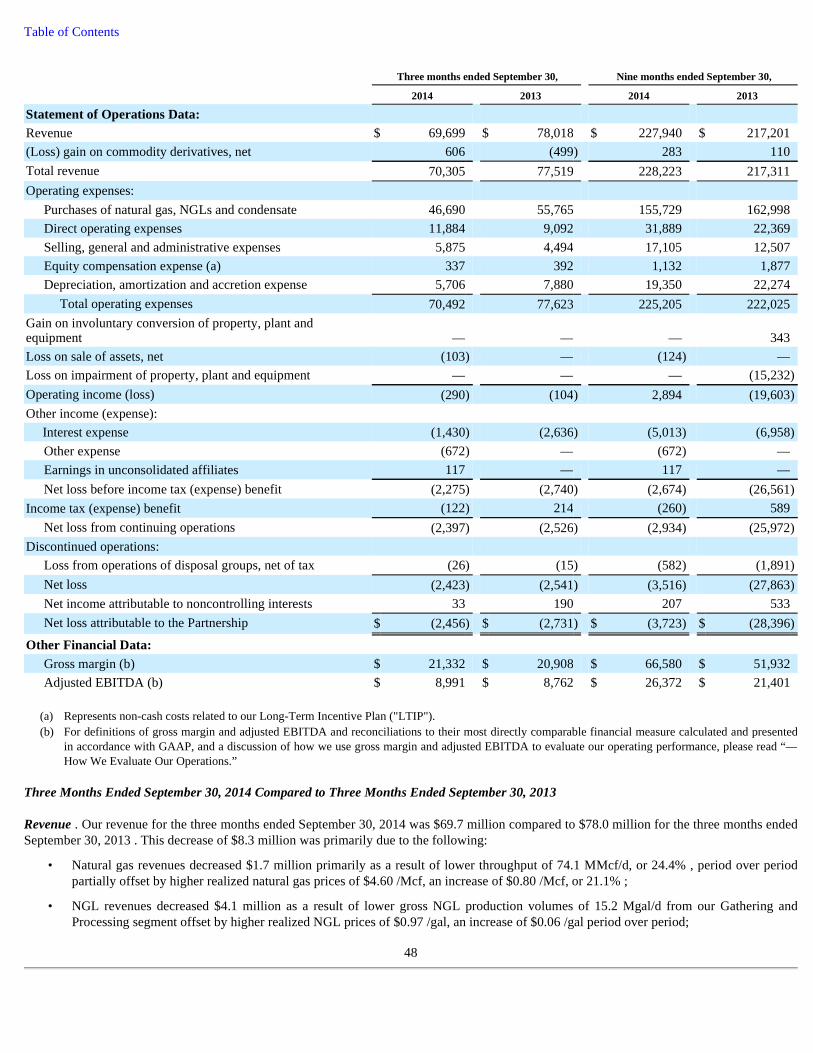
Table of Contents
Three Months Ended September 30, 2014 Compared to Three Months Ended September 30, 2013 Revenue . Our revenue for the three months ended September 30, 2014 was $69.7 million compared to $78.0 million for the three months ended September 30, 2013 . This decrease of $8.3 million was primarily due to the following:
48
Three months ended September 30, Nine months ended September 30,
2014 2013 2014 2013
Statement of Operations Data:
Revenue $ 69,699 $ 78,018 $ 227,940 $ 217,201 (Loss) gain on commodity derivatives, net 606 (499 ) 283 110 Total revenue 70,305 77,519 228,223 217,311 Operating expenses:
Purchases of natural gas, NGLs and condensate 46,690 55,765 155,729 162,998 Direct operating expenses 11,884 9,092 31,889 22,369 Selling, general and administrative expenses 5,875 4,494 17,105 12,507 Equity compensation expense (a) 337 392 1,132 1,877 Depreciation, amortization and accretion expense 5,706 7,880 19,350 22,274
Total operating expenses 70,492 77,623 225,205 222,025 Gain on involuntary conversion of property, plant and equipment — — — 343 Loss on sale of assets, net (103 ) — (124 ) — Loss on impairment of property, plant and equipment — — — (15,232 )
Operating income (loss) (290 ) (104 ) 2,894 (19,603 )
Other income (expense):
Interest expense (1,430 ) (2,636 ) (5,013 ) (6,958 )
Other expense (672 ) — (672 ) — Earnings in unconsolidated affiliates 117 — 117 — Net loss before income tax (expense) benefit (2,275 ) (2,740 ) (2,674 ) (26,561 )
Income tax (expense) benefit (122 ) 214 (260 ) 589 Net loss from continuing operations (2,397 ) (2,526 ) (2,934 ) (25,972 )
Discontinued operations:
Loss from operations of disposal groups, net of tax (26 ) (15 ) (582 ) (1,891 )
Net loss (2,423 ) (2,541 ) (3,516 ) (27,863 )
Net income attributable to noncontrolling interests 33 190 207 533 Net loss attributable to the Partnership $ (2,456 ) $ (2,731 ) $ (3,723 ) $ (28,396 )
Other Financial Data:
Gross margin (b) $ 21,332 $ 20,908 $ 66,580 $ 51,932 Adjusted EBITDA (b) $ 8,991 $ 8,762 $ 26,372 $ 21,401
(a) Represents non-cash costs related to our Long-Term Incentive Plan ("LTIP"). (b) For definitions of gross margin and adjusted EBITDA and reconciliations to their most directly comparable financial measure calculated and presented
in accordance with GAAP, and a discussion of how we use gross margin and adjusted EBITDA to evaluate our operating performance, please read “—How We Evaluate Our Operations.”
• Natural gas revenues decreased $1.7 million primarily as a result of lower throughput of 74.1 MMcf/d, or 24.4% , period over period partially offset by higher realized natural gas prices of $4.60 /Mcf, an increase of $0.80 /Mcf, or 21.1% ;
• NGL revenues decreased $4.1 million as a result of lower gross NGL production volumes of 15.2 Mgal/d from our Gathering and Processing segment offset by higher realized NGL prices of $0.97 /gal, an increase of $0.06 /gal period over period;
Table of Contents
Purchases of Natural Gas, NGLs and Condensate . Our purchases of natural gas, NGLs and condensate for the three months ended September 30, 2014 were $46.7 million compared to $55.8 million for the three months ended September 30, 2013 . This decrease of $9.1 million was primarily due to lower natural gas purchase volumes related to our elective processing arrangements and POP contracts associated with owned processing plants in our Gathering and Processing segment and lower realized condensate prices and volumes associated with our POP contracts, partially offset by higher purchase costs associated with natural gas and NGLs due to higher realized natural gas and NGL prices. Gross Margin . Gross margin for the three months ended September 30, 2014 was $21.3 million compared to $20.9 million for the three months ended September 30, 2013 . This increase of $0.4 million was primarily due to: i) an increase in gross margin in our Transmission segment of $0.8 million as a result of increased throughput and ii) a decrease in gross margin in our Gathering and Processing segment of $0.4 million due to lower natural gas throughput volumes of 74.1 MMcf/d, or 24.4% , primarily attributable to certain legacy gathering and processing systems; offset by incremental gross margin of $4.5 million related to the newly acquired Lavaca System. Direct Operating Expenses . Direct operating expenses for the three months ended September 30, 2014 were $11.9 million compared to $9.1 million in the three months ended September 30, 2013 . This increase of $2.8 million was primarily due to: i) $1.2 million of incremental costs associated with compression; ii) $0.8 million associated with integrity management programs; and iii) $0.7 million of additional labor and benefits associated with our gathering and processing terminal segments. Selling, General and Administrative Expenses ("SG&A"). SG&A expenses for the three months ended September 30, 2014 were $5.9 million compared to $4.5 million for the three months ended September 30, 2013 . This increase of $1.4 million was primarily due to cost incurred to manage and integrate our acquisitions and support continuing growth. Depreciation, Amortization and Accretion Expense . Depreciation, amortization and accretion expense for the three months ended September 30, 2014 was $5.7 million compared to $7.9 million for the three months ended September 30, 2013 . This decrease of $2.2 million was due to assets becoming fully depreciated in the current and prior quarters. Interest Expense . Interest expense for the three months ended September 30, 2014 was $1.4 million compared to $2.6 million for the three months ended September 30, 2013 . This decrease of $1.2 million was primarily due to a lower outstanding debt balance. Earnings in unconsolidated affiliates. Earnings in unconsolidated affiliates of $0.1 million represents our 66.7% share of earnings in the MPOG System for the three months ended September 30, 2014 . Nine Months Ended September 30, 2014 Compared to Nine Months Ended September 30, 2013 Revenue . Our revenue for the nine months ended September 30, 2014 was $227.9 million compared to $217.2 million for the nine months ended September 30, 2013 . This increase of $10.7 million was primarily due to the following:
49
• Condensate revenues decreased $3.0 million as a result of lower realized condensate prices of $2.17 /gal, a decrease of $0.23 /gal, or 9.6% , period over period and lower condensate production of 9.4 Mgal/d; partially offset by incremental volumes on our Lavaca System of 5.2 Mgal/d;
• Transmission revenues from the transportation of natural gas decreased $2.2 million , or 9.6% , primarily due to lower average throughput associated with our fixed-margin arrangements of 17.9%; and
• Terminals segment revenue increased $0.3 million as a result of incremental storage capacity, acquiring new customers and contractual storage rate escalations.
• Natural gas revenues increased $10.1 million primarily as a result of higher realized natural gas prices of $5.14 /Mcf, an increase of $1.18 /Mcf, or 29.8% , period over period;
• NGL revenues decreased $7.2 million as a result of lower gross NGL production volumes of 13.3 Mgal/d from our Gathering and Processing segment offset by higher realized NGL prices of $1.02 /gal, an increase of $0.16 /gal period over period;
• Condensate revenues decreased $5.3 million as a result of lower condensate production of 5.0 Mgal/d, partially offset by incremental volumes on our Lavaca System;
• Transmission revenues from the transportation of natural gas increased $12.9 million , or 22.8% , primarily due to an increase in throughput of 159.3 MMcf/d as a result of the benefit of nine months of revenue from the High Point System in 2014, compared to less than six months in 2013; and

Table of Contents
Purchases of Natural Gas, NGLs and Condensate . Our purchases of natural gas, NGLs and condensate for the nine months ended September 30, 2014 were $155.7 million compared to $163.0 million for the nine months ended September 30, 2013 . This decrease of $7.3 million was primarily due to lower natural gas purchase volumes related to POP contracts associated with owned processing plants in our Gathering and Processing segment and lower realized condensate prices and volumes associated with our our elective processing arrangements and POP contracts, partially offset by higher purchase costs associated with natural gas and NGLs due to higher realized natural gas and NGL prices. Gross Margin . Gross margin for the nine months ended September 30, 2014 was $66.6 million compared to $51.9 million for the nine months ended September 30, 2013 . This increase of $14.7 million was primarily due to: i) an increase in gross margin in our Transmission segment of $9.7 million as a result of increased throughput of 159.3 MMcf/d as a result of nine months of activity on our High Point Systems in 2014 compared to less than six months of activity in 2013; ii) an increase in our Terminals segment of $2.7 million due to nine months of activity in 2014 compared to less than six months of activity in 2013 and; iii) an increase in gross margin in our Gathering and Processing segment of $2.3 million due to $10.5 million attributable to the acquired Lavaca System; offset by lower NGL and condensate volumes of 18.3 Mgal/d and lower natural gas throughput volumes of 10.2 MMcf/d, or 3.8% . Direct Operating Expenses . Direct operating expenses for the nine months ended September 30, 2014 were $31.9 million compared to $22.4 million in the nine months ended September 30, 2013 . This increase of $9.5 million was primarily due to: i) $3.5 million of additional labor and benefits associated with our three segment due to acquisition activities; ii) $2.1 million of incremental costs associated with compression; iii) $1.0 million of costs associated with additional pipeline inspections; iv) $0.9 million associated with integrity management programs; and v) $0.7 million of additional material and supplies associated with our terminal segments. Selling, General and Administrative Expenses ("SG&A") . SG&A expenses for the nine months ended September 30, 2014 were $17.1 million compared to $12.5 million for the nine months ended September 30, 2013 . This increase of $4.6 million was primarily due to: i) higher salaries, wages and related costs of $3.0 million due to labor costs incurred to manage and integrate our acquisitions and support our continued growth and ii) an increase in legal fees of $0.9 million associated with certain transactions. Depreciation, Amortization and Accretion Expense . Depreciation, amortization and accretion expense for the nine months ended September 30, 2014 was $19.4 million compared to $22.3 million for the nine months ended September 30, 2013 . This decrease of $2.9 million was due to assets becoming fully depreciated in the current period. Interest Expense . Interest expense for the nine months ended September 30, 2014 was $5.0 million compared to $7.0 million for the nine months ended September 30, 2013 . This decrease of $2.0 million was primarily due to i) a lower outstanding debt balance and ii) a slight decrease to our weighted average interest rate of 0.12% as a result of lower leverage during the nine months ended September 30, 2014 . Earnings in unconsolidated affiliates. Earnings in unconsolidated affiliates of $0.1 million represents our 66.7% share of earnings in the MPOG System for the nine months ended September 30, 2014 . Results of Operations — Segment Results The table below contains key segment performance indicators related to our segment results of operations (in thousands except operating and pricing data):
50
• Terminals segment revenue increased $5.0 million due to nine months of activity in 2014 compared to less than six months of activity in 2013.
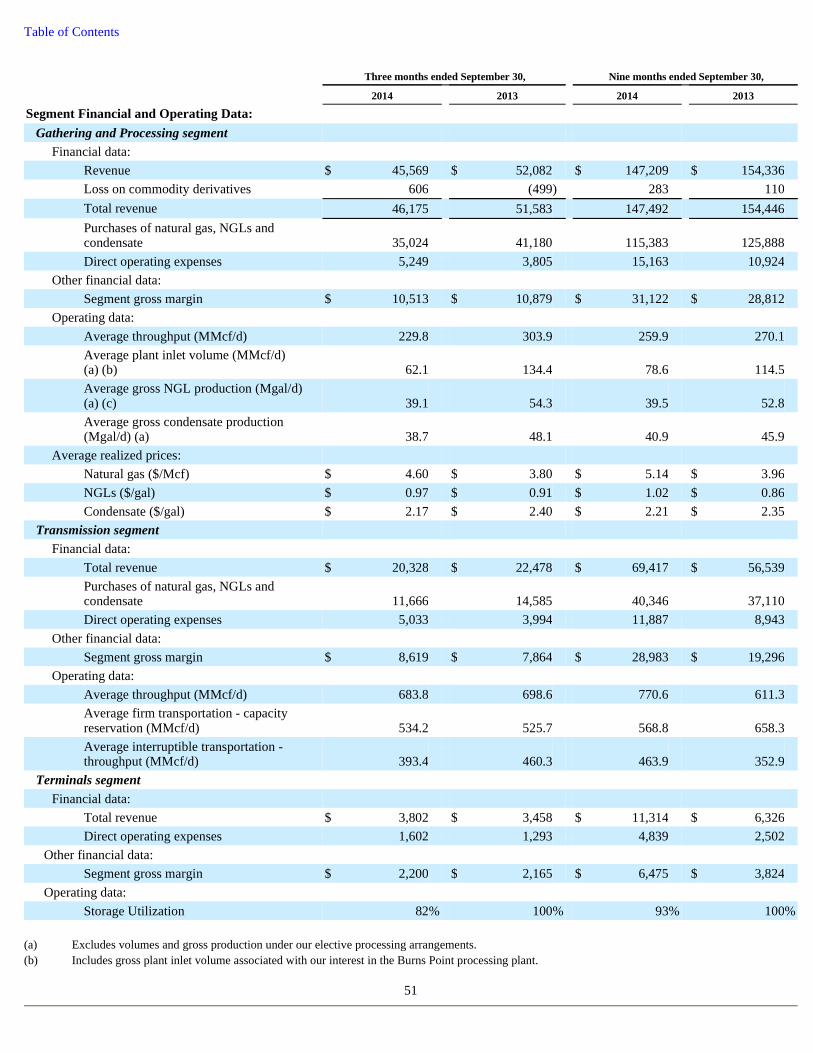
Table of Contents
51
Three months ended September 30, Nine months ended September 30,
2014 2013 2014 2013
Segment Financial and Operating Data:
Gathering and Processing segment
Financial data:
Revenue $ 45,569 $ 52,082 $ 147,209 $ 154,336 Loss on commodity derivatives 606 (499 ) 283 110 Total revenue 46,175 51,583 147,492 154,446 Purchases of natural gas, NGLs and condensate 35,024 41,180 115,383 125,888 Direct operating expenses 5,249 3,805 15,163 10,924
Other financial data:
Segment gross margin $ 10,513 $ 10,879 $ 31,122 $ 28,812 Operating data:
Average throughput (MMcf/d) 229.8 303.9 259.9 270.1 Average plant inlet volume (MMcf/d) (a) (b) 62.1 134.4 78.6 114.5 Average gross NGL production (Mgal/d) (a) (c) 39.1 54.3 39.5 52.8 Average gross condensate production (Mgal/d) (a) 38.7 48.1 40.9 45.9
Average realized prices:
Natural gas ($/Mcf) $ 4.60 $ 3.80 $ 5.14 $ 3.96 NGLs ($/gal) $ 0.97 $ 0.91 $ 1.02 $ 0.86 Condensate ($/gal) $ 2.17 $ 2.40 $ 2.21 $ 2.35
Transmission segment
Financial data:
Total revenue $ 20,328 $ 22,478 $ 69,417 $ 56,539 Purchases of natural gas, NGLs and condensate 11,666 14,585 40,346 37,110 Direct operating expenses 5,033 3,994 11,887 8,943
Other financial data:
Segment gross margin $ 8,619 $ 7,864 $ 28,983 $ 19,296 Operating data:
Average throughput (MMcf/d) 683.8 698.6 770.6 611.3 Average firm transportation - capacity reservation (MMcf/d) 534.2 525.7 568.8 658.3 Average interruptible transportation - throughput (MMcf/d) 393.4 460.3 463.9 352.9
Terminals segment Financial data:
Total revenue $ 3,802 $ 3,458 $ 11,314 $ 6,326 Direct operating expenses 1,602 1,293 4,839 2,502
Other financial data:
Segment gross margin $ 2,200 $ 2,165 $ 6,475 $ 3,824 Operating data:
Storage Utilization 82 % 100 % 93 % 100 %
(a) Excludes volumes and gross production under our elective processing arrangements. (b) Includes gross plant inlet volume associated with our interest in the Burns Point processing plant.

Table of Contents
Three Months Ended September 30, 2014 Compared to Three Months Ended September 30, 2013 Gathering and Processing Segment Revenue . Segment total revenue in the three months ended September 30, 2014 was $46.2 million compared to $51.6 million in the three months ended September 30, 2013 . This decrease of $5.4 million was primarily due to the following:
Purchases of Natural Gas, NGLs and Condensate . Our purchases of natural gas, NGLs and condensate for the three months ended September 30, 2014 were $35.0 million compared to $41.2 million for the three months ended September 30, 2013 . This decrease of $6.2 million was primarily due to lower natural gas purchase volumes related to our fixed-margin contracts and POP contracts associated with owned processing plants, partially offset by higher purchase costs associated with natural gas and NGLs due to higher realized natural gas and NGL prices. Segment Gross Margin . Segment gross margin for the three months ended September 30, 2014 was $10.5 million compared to $10.9 million for the three months ended September 30, 2013 . This decrease of $0.4 million was primarily due to the following:
Direct Operating Expenses . Direct operating expenses for the three months ended September 30, 2014 were $5.2 million compared to $3.8 million for the three months ended September 30, 2013 . This increase of $1.4 million was primarily due to the incremental operating costs associated with our newly acquired Lavaca System. Transmission Segment Revenue . Segment total revenue for the three months ended September 30, 2014 was $20.3 million compared to $22.5 million for the three months ended September 30, 2013 . This decrease of $2.2 million in segment revenue was primarily due to lower throughput related to our fixed-margin arrangements. Purchases of Natural Gas, NGLs and Condensate . Purchases of natural gas, NGLs and condensate for the three months ended September 30, 2014 were $11.7 million compared to $14.6 million for the three months ended September 30, 2013 . This decrease of $2.9 million was primarily due to lower costs on our High Point System and lower throughput volumes, which resulted in lower natural gas purchase costs associated with our fixed-margin arrangements. Segment Gross Margin . Segment gross margin for the three months ended September 30, 2014 was $8.6 million compared to $7.9 million for the three months ended September 30, 2013 . This increase of $0.7 million was primarily due to increased margin associated with our High Point System.
52
(c) Includes net NGL production associated with our interest in the Burns Point processing plant.
• Lower average gross NGL and condensate production amounting to 24.6 Mgal/d, or a net decrease of 24.0% period over period, primarily as a result of our reduced production at certain legacy gathering and processing systems; partially offset by condensate production associated with our Lavaca System;
• Lower average gross NGL production associated with our elective processing arrangements amounting to 23.0 Mgal/d, or a net decrease of 50.6%, primarily as a result of our reduced throughput on our Gloria and Lafitte Systems;
• Increases in realized natural gas prices of 21.1% and, realized NGL prices of 6.6% , partially offset by lower realized condensate prices of 9.6% period over period as a result of variable commodity prices; and
• Lower average natural gas throughput volumes of 74.1 MMcf/d, or 24.4% , period over period primarily as a result of decreases at certain legacy gathering and processing systems partially attributable to third-party downtime, offset by incremental natural gas throughput volumes of 72.0 MMcf/d at our Lavaca System.
• Incremental gross margin of $4.5 million at our Lavaca System;
• Lower gross margin of $3.0 million due to lower throughput volumes resulting in decreased NGL production associated with our elective processing arrangements on our Gloria System; as well as lower condensate production due to lower plant inlet volume at certain legacy gathering and processing systems; and
• A decrease in realized gains of $0.3 million period over period on our commodity derivatives, which was comprised of financial swaps, collars and option contracts used to mitigate commodity price risk.
Table of Contents Direct Operating Expenses . Direct operating expenses for the three months ended September 30, 2014 were $5.0 million compared to $4.0 million for the three months ended September 30, 2013 . This increase of $1.0 million was primarily due to costs associated with our integrity management program. Terminals Segment The Blackwater Acquisition represented a transaction between entities under common control and a change in reporting entity. Therefore we have accounted for Blackwater and our Terminals segment as if the transfer occurred as of April 15, 2013, which is the date that common control began. Revenue. Segment total revenue for the three months ended September 30, 2014 was $3.8 million compared to $3.5 million for the three months ended September 30, 2013 . The increase of $0.3 million was primarily attributable to increases in storage capacity, acquiring new customers and contractual storage rate escalations. Direct Operating Expenses . Direct operating expenses for the three months ended September 30, 2014 were $1.6 million compared to $1.3 million for the three months ended September 30, 2013 . The increase of $0.3 million is primarily attributable to additional direct labor hours associated with providing ancillary services and the Harvey terminal becoming operational in the current quarter. Segment Gross Margin . Segment gross margin for the three months ended September 30, 2014 of $2.2 million was relatively flat compared to the three months ended September 30, 2013 . Nine Months Ended September 30, 2014 Compared to Nine Months Ended September 30, 2013 Gathering and Processing Segment Revenue . Segment total revenue in the nine months ended September 30, 2014 was $147.5 million compared to $154.4 million in the nine months ended September 30, 2013 . This decrease of $6.9 million was primarily due to the following:
Purchases of Natural Gas, NGLs and Condensate . Our purchases of natural gas, NGLs and condensate for the nine months ended September 30, 2014 were $115.4 million compared to $125.9 million for the nine months ended September 30, 2013 . This decrease of $10.5 million was primarily due to lower natural gas purchase volumes associated with our fixed-margin contracts, and realized condensate prices and volumes, offset by higher purchase costs associated with natural gas and NGLs due to higher realized natural gas and NGL prices, and higher natural gas purchase volumes related to POP contracts associated with owned processing plants. Segment Gross Margin . Segment gross margin for the nine months ended September 30, 2014 was $31.1 million compared to $28.8 million for the nine months ended September 30, 2013 . This increase of $2.3 million was primarily due to the following:
53
• Lower average gross NGL and condensate production amounting to 18.3 Mgal/d, or a net decrease of 18.5%, primarily as a result of our reduced production at certain legacy gathering and processing systems, partially offset by condensate production at our Lavaca System;
• Lower average gross NGL production associated with our elective processing arrangements amounting to 18.9 Mgal/d, or a net decrease of 43.7%, primarily as a result of our reduced throughput on our Gloria and Lafitte Systems;
• Lower natural gas sales volume of 13.4 MMcf/d, or a decrease of 17.0%;
• A decrease in realized gains of $1.0 million period over period on our commodity derivatives, which was comprised of financial swaps, collars and option contracts that were used to mitigate commodity price risk;
• An increase in realized natural gas prices of 29.8% and an increase in realized NGL prices of 18.6% offset by lower realized condensate prices of 6.0% period over period as a result of variable commodity prices; and
• Increased average natural gas throughput volumes by 10.2 MMcf/d, or 3.8% , period over period primarily as a result of incremental natural gas throughput volumes of 55.8 MMcf/d at our Lavaca System.
• Incremental gross margin of $10.3 million at our Lavaca System;
• Lower gross margin of $6.2 million due to lower average gross NGL production associated with our elective processing arrangements on our Gloria and Lafitte Systems; as well as lower plant inlet volumes and corresponding NGL sales associated with certain legacy gathering and processing systems; and
• A decrease in realized gains of $1.0 million period over period on our commodity derivatives, which was comprised of financial swaps, collars and option contracts used to mitigate commodity price risk.
Table of Contents Direct Operating Expenses . Direct operating expenses for the nine months ended September 30, 2014 were $15.2 million compared to $10.9 million for the nine months ended September 30, 2013 . This increase of $4.3 million was primarily due to the incremental operating costs associated with our newly acquired Lavaca System. Transmission Segment Revenue . Segment total revenue for the nine months ended September 30, 2014 was $69.4 million compared to $56.5 million for the nine months ended September 30, 2013 . This increase of $12.9 million in segment revenue was primarily due to:
Purchases of Natural Gas, NGLs and Condensate . Purchases of natural gas, NGLs and condensate for the nine months ended September 30, 2014 were $40.3 million compared to $37.1 million for the nine months ended September 30, 2013 . This increase of $3.2 million was primarily due to higher realized natural gas prices, which resulted in higher natural gas purchase costs associated with our fixed-margin arrangements. Segment Gross Margin . Segment gross margin for the nine months ended September 30, 2014 was $29.0 million compared to $19.3 million for the nine months ended September 30, 2013 . This increase of $9.7 million was primarily due to increased gross margin associated with our High Point System of $9.5 million resulting from nine months of activity in 2014 compared to less than six months in 2013. Direct Operating Expenses . Direct operating expenses for the nine months ended September 30, 2014 were $11.9 million compared to $8.9 million for the nine months ended September 30, 2013 . This increase of $3.0 million is primarily due to increased costs associated with our High Point System having nine months of activity in 2014 compared to less than six months in 2013. Terminals Segment The Blackwater Acquisition represented a transaction between entities under common control and a change in reporting entity. Therefore we have accounted for Blackwater and our Terminals segment as if the transfer occurred as of April 15, 2013, which is the date common control began. Revenue. Segment total revenue for the nine months ended September 30, 2014 was $11.3 million compared to $6.3 million for the nine months ended September 30, 2013 . The increase of $5.0 million was primarily attributable to presenting nine months of activity in 2014 compared to less than six months in 2013, an increase in storage capacity, acquiring new customers and contractual storage rate escalations. Direct Operating Expenses . Direct operating expenses for the nine months ended September 30, 2014 were $4.8 million compared to $2.5 million for the nine months ended September 30, 2013 . The increase of $2.3 million is primarily attributable to additional direct labor hours associated with providing ancillary services, and by presenting nine months of activity in 2014 compared to less than six months in 2013. Segment Gross Margin . Segment gross margin for the nine months ended September 30, 2014 was $6.5 million compared to $3.8 million for the nine months ended September 30, 2013 as a result of the changes to revenue and direct operating expenses described above. Liquidity and Capital Resources Our business is capital intensive and requires significant investment for the maintenance of existing assets and the acquisition and development of new systems and facilities.
The principal indicators of our available liquidity at September 30, 2014 , were our cash on hand and availability under our credit facility. As of September 30, 2014 , our available liquidity was $135.7 million, comprised of cash on hand of $0.5 million and $135.2 million available under our credit facility. As of November 6, 2014 , our available liquidity was $79.0 million. We believe
54
• Total natural gas throughput volumes on our transmission systems were 770.6 MMcf/d for the nine months ended September 30, 2014 compared to 611.3 MMcf/d for the nine months ended September 30, 2013 representing a 26.1% increase period over period, primarily due to increased throughput at our High Point System of 177.5 MMcf/d resulting from nine months of activity in 2014 compared to less than six months in 2013; and
• Higher realized natural gas prices on our fixed-margin arrangements of $0.94/Mcf amounting to an increase of $2.5 million.
Table of Contents
that cash generated from operating cash flows and liquidity will be sufficient to meet our short-term working capital requirements, medium-term capital expenditure requirements, and quarterly cash distributions for the next twelve months. In the event these sources are not sufficient, we would pursue other sources of cash funding, including, but not limited to, issuing equity and additional debt financing; in addition, we would reduce spending in certain areas, such as capital expenditures, as necessary.
On July 14, 2014, the Partnership entered into a common unit purchase agreement with certain institutional investors, which agreement was subsequently amended on August 15, 2014 to provide for the sale of 4,622,352 common units representing limited partner interests in the Partnership (the "PIPE Offering") in a private placement at a price of $25.8075 per common unit (reflecting an adjustment for the Partnership's second quarter distribution of $0.4625 per unit), for cash consideration of $119.3 million .
Changes in natural gas, NGL and condensate prices and the terms of our contracts have a direct impact on our generation and use of cash from operations due to their impact on net income, along with the resulting changes in working capital. We have mitigated a portion of our anticipated commodity price risk associated with the volumes from our gathering and processing activities with fixed price commodity swaps. For additional information regarding our derivative activities, please read Item 7A in our annual report, “Quantitative and Qualitative Disclosures about Market Risk.” The counterparties to certain of our commodity swap contracts are investment-grade rated financial institutions. Under these contracts, we may be required to provide collateral to the counterparties in the event that our potential payment exposure exceeds a predetermined collateral threshold. Collateral thresholds are set by us and each counterparty, as applicable, in the master contract that governs our financial transactions based on our and the counterparty’s assessment of creditworthiness. The assessment of our position with respect to the collateral thresholds are determined on a counterparty by counterparty basis, and are impacted by the representative forward price curves and notional quantities under our swap contracts. Due to the interrelation between the representative crude oil and natural gas forward price curves, it is not practical to determine a single pricing point at which our swap contracts will meet the collateral thresholds as we may transact multiple commodities with the same counterparty. Depending on daily commodity prices, the amount of collateral posted can go up or down on a daily basis. Our Credit Facility On September 5, 2014, the Partnership entered into an amended and restated credit agreement (the "Credit Agreement"), which provides for a maximum borrowing equal to $500.0 million , with the ability to further increase the borrowing capacity subject to lender approval. The Credit Agreement contains certain financial covenants, including the requirement that our indebtedness not exceed 4.75 times adjusted consolidated EBITDA (except for the current and subsequent two quarters after the consummation of a permitted acquisition, at which time the covenant is increased to 5.25 times adjusted Consolidated EBITDA). We can elect to have loans under our credit facility bear interest either at a Eurodollar-based rate plus a margin ranging from 2.00% to 3.25% depending on our total leverage ratio then in effect, or a base rate which is a fluctuating rate per annum equal to the highest of (a) the Federal Funds Rate plus 0.50% , (b) the rate of interest in effect for such day as publicly announced from time to time by Bank of America as its “prime rate”, or (c) the Eurodollar Rate plus 1.00% plus a margin ranging from 1.00% to 2.25% depending on the total leverage ratio then in effect. We also pay a maximum commitment fee of 0.50% per annum on the undrawn portion of the revolving loan. Our obligations under the Credit Agreement are secured by a first mortgage in favor of the lenders in the majority of our real property. Advances made under the Credit Agreement are guaranteed on a senior unsecured basis by certain of our subsidiaries (the “Guarantors”). These guarantees are full and unconditional and joint and several among the Guarantors. The terms of the new credit facility include covenants that restrict our ability to make cash distributions and acquisitions in some circumstances. The remaining principal balance of loans and any accrued and unpaid interest will be due and payable in full on the maturity date, which is September 5, 2016. The Credit Agreement also contains customary representations and warranties (including those relating to organization and authorization, compliance with laws, absence of defaults, material agreements and litigation) and customary events of default (including those relating to monetary defaults, covenant defaults, cross defaults and bankruptcy events). As of September 30, 2014 , we had approximately $57.7 million of outstanding borrowings under our credit facility. Our consolidated total leverage calculation pursuant to the Credit Agreement was 1.49 times resulting in approximately $135.2 million of available borrowing capacity as of September 30, 2014 . Working Capital Working capital is the amount by which current assets exceed current liabilities and is a measure of our ability to pay our liabilities as they become due. Our working capital requirements are primarily driven by changes in accounts receivable and accounts payable.
55
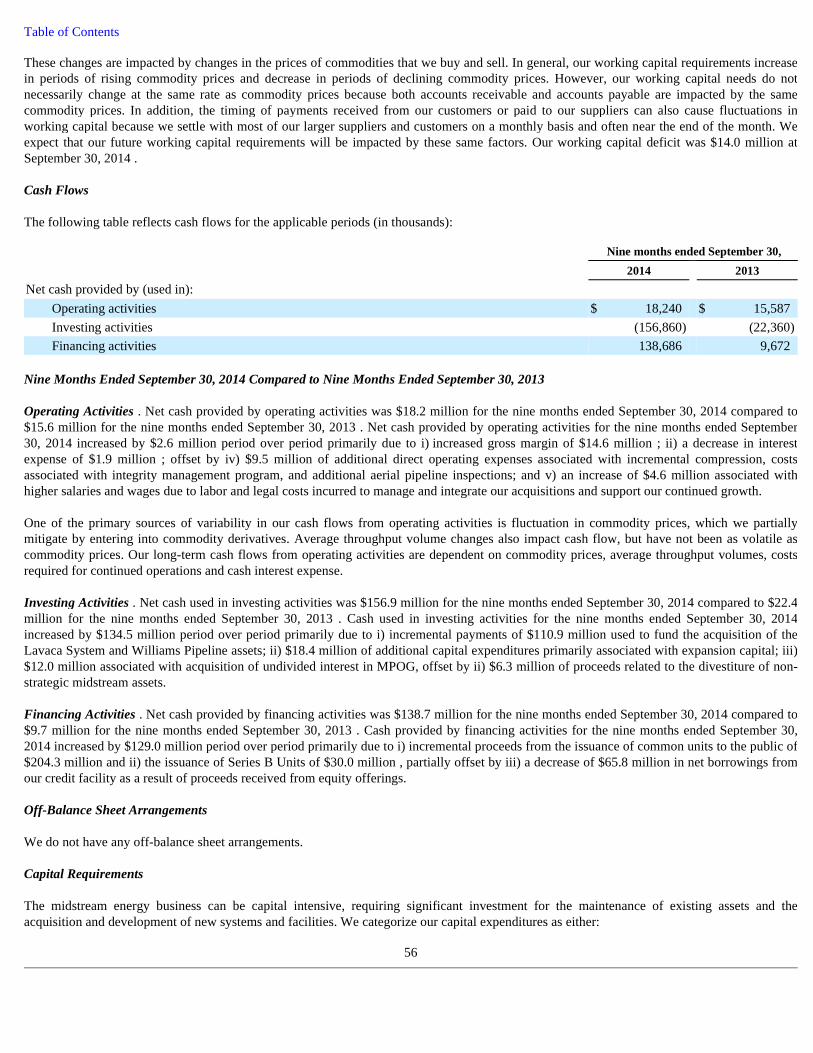
Table of Contents These changes are impacted by changes in the prices of commodities that we buy and sell. In general, our working capital requirements increase in periods of rising commodity prices and decrease in periods of declining commodity prices. However, our working capital needs do not necessarily change at the same rate as commodity prices because both accounts receivable and accounts payable are impacted by the same commodity prices. In addition, the timing of payments received from our customers or paid to our suppliers can also cause fluctuations in working capital because we settle with most of our larger suppliers and customers on a monthly basis and often near the end of the month. We expect that our future working capital requirements will be impacted by these same factors. Our working capital deficit was $14.0 million at September 30, 2014 . Cash Flows The following table reflects cash flows for the applicable periods (in thousands):
Nine Months Ended September 30, 2014 Compared to Nine Months Ended September 30, 2013 Operating Activities . Net cash provided by operating activities was $18.2 million for the nine months ended September 30, 2014 compared to $15.6 million for the nine months ended September 30, 2013 . Net cash provided by operating activities for the nine months ended September 30, 2014 increased by $2.6 million period over period primarily due to i) increased gross margin of $14.6 million ; ii) a decrease in interest expense of $1.9 million ; offset by iv) $9.5 million of additional direct operating expenses associated with incremental compression, costs associated with integrity management program, and additional aerial pipeline inspections; and v) an increase of $4.6 million associated with higher salaries and wages due to labor and legal costs incurred to manage and integrate our acquisitions and support our continued growth. One of the primary sources of variability in our cash flows from operating activities is fluctuation in commodity prices, which we partially mitigate by entering into commodity derivatives. Average throughput volume changes also impact cash flow, but have not been as volatile as commodity prices. Our long-term cash flows from operating activities are dependent on commodity prices, average throughput volumes, costs required for continued operations and cash interest expense. Investing Activities . Net cash used in investing activities was $156.9 million for the nine months ended September 30, 2014 compared to $22.4 million for the nine months ended September 30, 2013 . Cash used in investing activities for the nine months ended September 30, 2014 increased by $134.5 million period over period primarily due to i) incremental payments of $110.9 million used to fund the acquisition of the Lavaca System and Williams Pipeline assets; ii) $18.4 million of additional capital expenditures primarily associated with expansion capital; iii) $12.0 million associated with acquisition of undivided interest in MPOG, offset by ii) $6.3 million of proceeds related to the divestiture of non-strategic midstream assets. Financing Activities . Net cash provided by financing activities was $138.7 million for the nine months ended September 30, 2014 compared to $9.7 million for the nine months ended September 30, 2013 . Cash provided by financing activities for the nine months ended September 30, 2014 increased by $129.0 million period over period primarily due to i) incremental proceeds from the issuance of common units to the public of $204.3 million and ii) the issuance of Series B Units of $30.0 million , partially offset by iii) a decrease of $65.8 million in net borrowings from our credit facility as a result of proceeds received from equity offerings. Off-Balance Sheet Arrangements We do not have any off-balance sheet arrangements. Capital Requirements The midstream energy business can be capital intensive, requiring significant investment for the maintenance of existing assets and the acquisition and development of new systems and facilities. We categorize our capital expenditures as either:
56
Nine months ended September 30,
2014 2013
Net cash provided by (used in):
Operating activities $ 18,240 $ 15,587 Investing activities (156,860 ) (22,360 )
Financing activities 138,686 9,672
Table of Contents
Historically, our maintenance capital expenditures have not included all capital expenditures required to maintain volumes on our systems. It is customary in the regions in which we operate for producers to bear the cost of well connections, but we cannot be assured that this will be the case in the future. For the nine months ended September 30, 2014 , capital expenditures totaled $41.3 million including expansion capital expenditures of $36.9 million , maintenance capital expenditures of $4.1 million and reimbursable project expenditures (capital expenditures for which we expect to be reimbursed for all or part of the expenditures by a third party) of $0.3 million . Although we classified our capital expenditures as expansion and maintenance, we believe those classifications approximate, but do not necessarily correspond to, the definitions of estimated maintenance capital expenditures and expansion capital expenditures under our partnership agreement. Integrity Management Certain operating assets require an ongoing integrity management program under regulations of the U.S. Department of Transportation, or DOT. These regulations require transportation pipeline operators to implement continuous integrity management programs over a seven-year cycle. Our total program addresses approximately 91 high consequence areas that require on-going testing pursuant to DOT regulations. Over the course of the seven-year cycle, we expect to incur approximately $4.5 million in integrity management testing expenses. Distributions We intend to pay a quarterly distribution though we do not have a legal obligation to make distributions except as provided in our Partnership agreement. On October 23, 2014, we announced an increase to our distribution of 4.4% to $0.4725 per unit for the quarter ended September 30, 2014 compared to the distribution for the third quarter of 2013, or $1.89 per unit on an annualized basis, payable on November 14, 2014 to unitholders of record on November 7, 2014. Holders of our Series B Units will participate in this distribution and will receive this distribution in Series B Units rather than cash.
Critical Accounting Policies
There were no changes to our significant accounting policies from those disclosed in the Annual Report. Recent Accounting Pronouncements In July 2013, the FASB issued Accounting Standards Update ("ASU ") No. 2013-11, Income Taxes (Topic 740): Presentation of an Unrecognized Tax Benefit When a Net Operating Loss Carryforward, a Similar Tax Loss, or a Tax Credit Carryforward Exists (a consensus of the FASB Emerging Issues Task Force). This guidance was issued related to the presentation of an unrecognized tax benefit when a net operating loss carryforward, a similar tax loss or a tax credit carryforward exists. The updated guidance requires an entity to net its unrecognized tax benefits against the deferred tax assets for all same jurisdiction net operating loss carryforward, a similar tax loss, or tax credit carryforwards. A gross presentation will be required only if such carryforwards are not available or would not be used by the entity to settle any additional income taxes resulting from disallowance of the uncertain tax position. The update was effective for the Partnership on January 1, 2014 and did not have a material impact on its condensed consolidated financial statements. In April 2014, the FASB issued ASU No. 2014-08, Reporting Discontinued Operations and Disclosures of Disposals of Components of an Entity. This guidance amends the requirements for reporting discontinued operations and requires expanded disclosures for individually significant components of an entity that either have been disposed of or are classified as held for sale, but do not qualify for discontinued operations reporting. Only those disposals of components of an entity that represent a strategic shift that has (or will have) a major effect on an entity’s operations and financial results will be reported as discontinued operations in the financial statements. ASU 2014-08 is effective for annual periods, and interim periods within those years, beginning on or after December 15, 2014 and is applied prospectively. Early adoption is permitted, but only for disposals or classifications as held for sale that have not been reported in financial statements previously issued or available for issuance. The update was early adopted by the Partnership as of April 1, 2014 and did not have a material impact on its condensed consolidated financial statements.
57
• maintenance capital expenditures, which are cash expenditures made to maintain our long-term operating income or operating capacity (including expenditures for the addition or improvement to, or the replacement of, our capital assets or for the acquisition of existing, or the construction or development of new, capital assets); or
• expansion capital expenditures, which are cash expenditures incurred for acquisitions or capital improvements that we expect will increase our operating income or operating capacity over the long term.
Table of Contents In May 2014, the FASB issued ASU No. 2014-09, Revenue from Contracts with Customers (Topic 606), which amends the existing accounting standards for revenue recognition. The standard requires an entity to recognize revenue in a manner that depicts the transfer of goods or services to customers at an amount that reflects the consideration to which the entity expects to be entitled in exchange for those goods or services. The guidance in ASU 2014-09 is effective for annual reporting periods beginning after December 15, 2016, including interim periods therein. Early adoption is not permitted. The Partnership is currently evaluating the method of adoption and impact this standard will have on its financial statements and related disclosures. In August 2014, the FASB issued ASU No. 2014-15, Presentation of Financial Statements-Going Concern (Topic 205-40): Disclosure of Uncertainties about an Entity’s Ability to Continue as a Going Concern. This guidance provides additional information to guide management's evaluation of whether there are conditions or events, considered in the aggregate, that raise substantial doubt about the entity’s ability to continue as a going concern within one year after the date that the financial statements are issued. The update is effective for annual periods beginning on or after December 15, 2016. The Partnership is currently evaluating the impact of this standard on its financial statements and does not believe there will be a material impact.
58

Table of Contents Item 3. Quantitative and Qualitative Disclosures About Market Risk Commodity Price Risk The following should be read in conjunction with Quantitative and Qualitative Disclosures about Market Risk included in the Annual Report. We are exposed to market risk on our open derivative contracts of non-performance by our counterparties. We do not expect such non-performance because our contracts are with major financial institutions with investment grade credit ratings. We did not post collateral under any of these contracts, as they are secured under our credit agreement. We account for our derivative activities whereby each derivative instrument is recorded on the balance sheet as either an asset or liability measured at fair value. Refer to Note 6 "Derivatives" for further details.
During 2013 and 2014 , we entered into additional commodity contracts with existing counterparties to hedge our 2014 exposure to commodity prices. As of September 30, 2014 , we have hedged approximately 7% of our expected exposure to NGL prices and 80% of our expected exposure to oil prices through the end of 2014 and approximately 3% of our expected exposure to NGL prices and 80% of our expected exposure to oil prices for the first six months of 2015. The hedge percentages for 2014 and 2015 include commodity exposure associated with the Costar acquisition.
The table below sets forth certain information regarding the financial instruments used to hedge our commodity price risk as of September 30, 2014 :
Interest Rate Risk
During the nine months ended September 30, 2014 , we had exposure to changes in interest rates on our indebtedness associated with our credit facility. During the second quarter of 2013, we entered into an interest rate swap to manage the impact of the interest rate risk associated with our credit facility, effectively converting the cash flows related to $100.0 million of our long-term variable rate debt into fixed rate cash flows.
The credit markets have recently experienced historically low interest rates. As the overall economy strengthens, it is possible that monetary policy will begin to tighten, resulting in higher interest rates. Interest rates on floating rate credit facilities and future debt offerings could be higher than current levels, causing our financing costs to increase accordingly.
A hypothetical increase or decrease in interest rates by 1.0% would have changed our interest expense by $0.9 million for the nine months ended September 30, 2014 .
59
Commodity Instrument Volumes (a) Weighted Average
Price Period Fair value at September 30, 2014 (in thousands)
NGLs (gal) Swaps (540,000) $1.08 Oct 2014 - Dec 2014 $ 18 (480,000) $1.10 Jan 2015 - Jun 2015 33 Oil (Bbl) Collars (b) (24,000) $99.94 Oct 2014 - Dec 2014 106 (33,900) $100.61 Jan 2015 - Jun 2015 247
$ 404
(a) Contracted and notional volumes represented as a net short financial position by instrument. (b) Collars contain weighted average price for floors and caps of $97.00 and $102.88, respectively, for positions settling in 2014 and
weighted average price for floors and caps of $97.80 and $103.42, respectively, for positions settling in 2015.

Table of Contents Item 4. Controls and Procedures
Evaluation of Disclosure Controls and Procedures
We maintain a system of disclosure controls and procedures that are designed to ensure that information required to be disclosed by us in the reports that we file or submit to the SEC under the Securities Exchange Act of 1934, as amended (the “Exchange Act”), is recorded, processed, summarized and reported within the time periods specified by the SEC’s rules and forms, and that such information is accumulated and communicated to the management of our General Partner, including our General Partner’s principal executive and principal financial officers (whom we refer to as the Certifying Officers), as appropriate to allow timely decisions regarding required disclosure.
Our management, including our President and Chief Executive Officer and our Senior Vice President and Chief Financial Officer, does not expect that our disclosure controls and procedures (as defined in Rules 13a-15(e) and 15d-15(e) of the Exchange Act) (“Disclosure Controls”) will prevent all errors and all fraud. A control system, no matter how well conceived and operated, can provide only reasonable, not absolute, assurance that the objectives of the control system are met. Further, the design of a control system must reflect the fact that there are resource constraints, and the benefits of controls must be considered relative to their costs. Because of the inherent limitations in all control systems, no evaluation of controls can provide absolute assurance that all control issues and instances of fraud, if any, within the company have been detected. These inherent limitations include the realities that judgments in decision-making can be faulty, and that breakdowns can occur because of simple error or mistake. Additionally, controls can be circumvented by the individual acts of some persons, by collusion of two or more people, or by management override of the control. The design of any system of controls also is based in part upon certain assumptions about the likelihood of future events, and there can be no assurance that any design will succeed in achieving its stated goals under all potential future conditions. Because of the inherent limitations in a cost-effective control system, misstatements due to error or fraud may occur and not be detected. We monitor our Disclosure Controls and make modifications as necessary; our intent in this regard is that the Disclosure Controls will be modified as systems change and conditions warrant.
The management of our General Partner evaluated, with the participation of the Certifying Officers, the effectiveness of our Disclosure Controls and procedures as of the end of the period covered by this report, pursuant to Rule 13a-15(e) and 15d-15(e) under the Exchange Act. Based upon that evaluation, the Certifying Officers concluded that, as of September 30, 2014 , the end of the period covered by this report our Disclosure Controls and procedures were effective at a reasonable assurance level Changes in Internal Control Over Financial Reporting There were no changes in internal control over financial reporting (as defined in Rule 13a-15(f) under the Exchange Act) that occurred during the nine months ended September 30, 2014 that have materially affected, or are reasonably likely to materially affect, our internal control over financial reporting. The certifications of our General Partner’s President and Chief Executive Officer and Senior Vice President & Chief Financial Officer pursuant to Exchange Act Rules 13a-14(a) and 15d-14(a) are filed with this Quarterly Report on Form 10-Q as Exhibits 31.1 and 31.2. The certifications of our principal executive officer and principal financial officer pursuant to 18 U.S.C. 1350 are furnished with this Quarterly Report on Form 10-Q as Exhibits 32.1 and 32.2. On May 14, 2013, the Committee of Sponsoring Organizations of the Treadway Commission (COSO) issued an updated version of its Internal
Control - Integrated Framework (the 2013 Framework). Originally issued in 1992 (the 1992 Framework), the framework helps organizations
design, implement and evaluate the effectiveness of internal control concepts and simplify their use and application. The 1992 Framework
remains available during the transition period, which extends to December 15, 2014, after which time COSO will consider it as superseded by
the 2013 Framework. During the nine months September 30, 2014 , the Partnership has initiated the process to ensure we are in compliance with
the 2013 Framework, and we anticipate we will be in compliance by the required due date of December 15, 2014.
60
Table of Contents PART II. OTHER INFORMATION
Item 1. Legal Proceedings
We are a party to various administrative and regulatory proceedings that have arisen in the ordinary course of our business. Please read under the captions “— Regulation of Operations — Interstate Transportation Pipeline Regulation” and “— Environmental Matters” in our Annual Report for more information.
Item 1A. Risk Factors
Information about material risks related to our business, financial conditions and results of operations for the quarter ended September 30, 2014 , does not materially differ from those set out in Part I, Item 1A of our Annual Report on Form 10-K for the year ended December 31, 2013, except as set forth below. These risks are not the only risks facing the Partnership.
The Costar Acquisition, like any acquisitions we complete, is subject to substantial risks that could adversely affect our financial condition and results of operations and reduce our ability to make distributions to unitholders .
We may not achieve the expected results of the Costar acquisition, and any adverse conditions or developments related to the Costar Acquisition may have a negative impact on our operations and financial condition. Any acquisition, including the Costar Acquisition, involves potential risks, including:
If these risks materialize, the acquired assets may inhibit our growth, fail to deliver expected benefits and add further unexpected costs. Challenges may arise whenever businesses with different operations or management are combined, and we may experience unanticipated delays in realizing the benefits of an acquisition or growth project. The consummation of the Costar Acquisition, or any other future acquisition or growth project, may significantly change our capitalization and results of operations and you may not have the opportunity to evaluate the economic, financial and other relevant information that we will consider in evaluating future acquisitions or growth projects.
61
• we may suffer a decrease in our liquidity by using a portion of our available cash or borrowing capacity under our Credit Agreement to finance acquisitions;
• we may incur an increase in our interest expense or financial leverage if we incur additional debt to finance acquisitions;
• we may assume environmental and other liabilities, losses or costs for which we are not indemnified or insured or for which our indemnity or insurance is inadequate;
• that our management's attention may be diverted from other business concerns;
• we may suffer the incurrence of other significant charges, such as impairment of gathering and processing assets, goodwill or other intangible assets, asset devaluation or restructuring charges;
• there may be unforeseen difficulties encountered in operating in new geographic areas or lines of business, including possible difficulties in obtaining permits and other authorizations to conduct regulated activities;
• we may not be successful in extending current leases and contracts that are material to the businesses we acquire; and
• we may not be able to operate at expected levels of capacity.
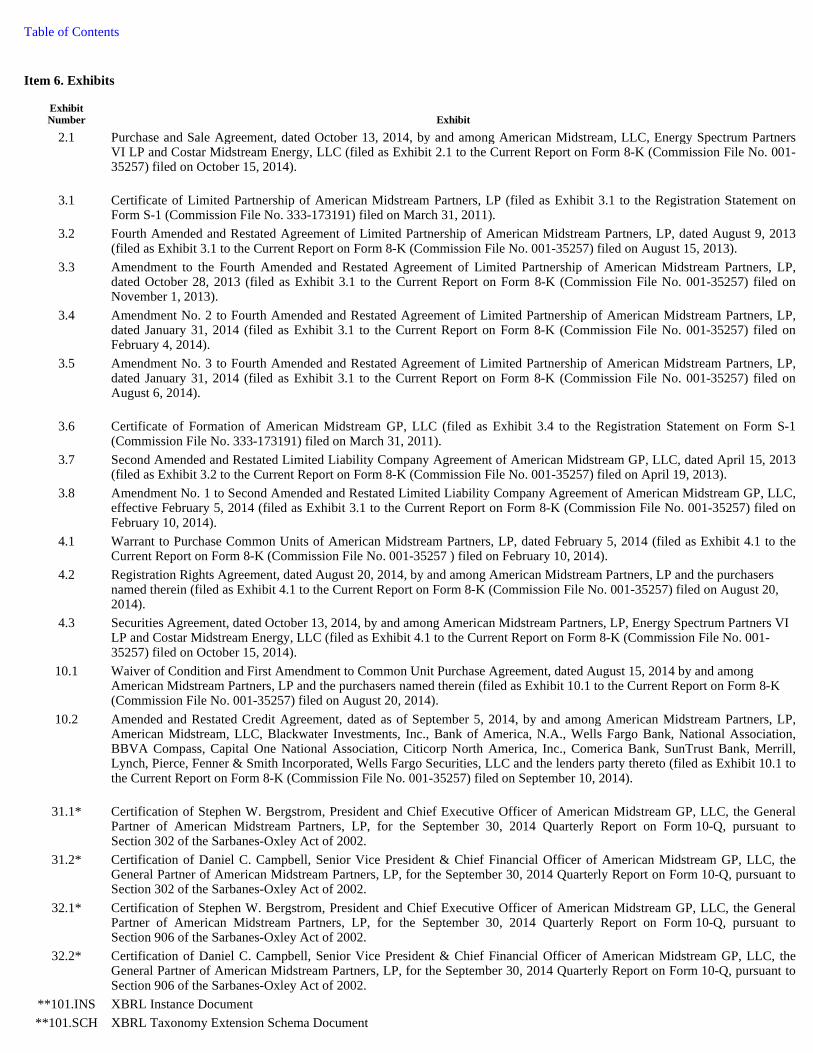
Table of Contents
Item 6. Exhibits
Exhibit Number Exhibit
2.1 Purchase and Sale Agreement, dated October 13, 2014, by and among American Midstream, LLC, Energy Spectrum Partners VI LP and Costar Midstream Energy, LLC (filed as Exhibit 2.1 to the Current Report on Form 8-K (Commission File No. 001-35257) filed on October 15, 2014).
3.1 Certificate of Limited Partnership of American Midstream Partners, LP (filed as Exhibit 3.1 to the Registration Statement on Form S-1 (Commission File No. 333-173191) filed on March 31, 2011).
3.2 Fourth Amended and Restated Agreement of Limited Partnership of American Midstream Partners, LP, dated August 9, 2013 (filed as Exhibit 3.1 to the Current Report on Form 8-K (Commission File No. 001-35257) filed on August 15, 2013).
3.3 Amendment to the Fourth Amended and Restated Agreement of Limited Partnership of American Midstream Partners, LP, dated October 28, 2013 (filed as Exhibit 3.1 to the Current Report on Form 8-K (Commission File No. 001-35257) filed on November 1, 2013).
3.4 Amendment No. 2 to Fourth Amended and Restated Agreement of Limited Partnership of American Midstream Partners, LP, dated January 31, 2014 (filed as Exhibit 3.1 to the Current Report on Form 8-K (Commission File No. 001-35257) filed on February 4, 2014).
3.5 Amendment No. 3 to Fourth Amended and Restated Agreement of Limited Partnership of American Midstream Partners, LP, dated January 31, 2014 (filed as Exhibit 3.1 to the Current Report on Form 8-K (Commission File No. 001-35257) filed on August 6, 2014).
3.6 Certificate of Formation of American Midstream GP, LLC (filed as Exhibit 3.4 to the Registration Statement on Form S-1 (Commission File No. 333-173191) filed on March 31, 2011).
3.7 Second Amended and Restated Limited Liability Company Agreement of American Midstream GP, LLC, dated April 15, 2013 (filed as Exhibit 3.2 to the Current Report on Form 8-K (Commission File No. 001-35257) filed on April 19, 2013).
3.8 Amendment No. 1 to Second Amended and Restated Limited Liability Company Agreement of American Midstream GP, LLC, effective February 5, 2014 (filed as Exhibit 3.1 to the Current Report on Form 8-K (Commission File No. 001-35257) filed on February 10, 2014).
4.1 Warrant to Purchase Common Units of American Midstream Partners, LP, dated February 5, 2014 (filed as Exhibit 4.1 to the Current Report on Form 8-K (Commission File No. 001-35257 ) filed on February 10, 2014).
4.2 Registration Rights Agreement, dated August 20, 2014, by and among American Midstream Partners, LP and the purchasers named therein (filed as Exhibit 4.1 to the Current Report on Form 8-K (Commission File No. 001-35257) filed on August 20, 2014).
4.3 Securities Agreement, dated October 13, 2014, by and among American Midstream Partners, LP, Energy Spectrum Partners VI LP and Costar Midstream Energy, LLC (filed as Exhibit 4.1 to the Current Report on Form 8-K (Commission File No. 001-35257) filed on October 15, 2014).
10.1 Waiver of Condition and First Amendment to Common Unit Purchase Agreement, dated August 15, 2014 by and among American Midstream Partners, LP and the purchasers named therein (filed as Exhibit 10.1 to the Current Report on Form 8-K (Commission File No. 001-35257) filed on August 20, 2014).
10.2 Amended and Restated Credit Agreement, dated as of September 5, 2014, by and among American Midstream Partners, LP, American Midstream, LLC, Blackwater Investments, Inc., Bank of America, N.A., Wells Fargo Bank, National Association, BBVA Compass, Capital One National Association, Citicorp North America, Inc., Comerica Bank, SunTrust Bank, Merrill, Lynch, Pierce, Fenner & Smith Incorporated, Wells Fargo Securities, LLC and the lenders party thereto (filed as Exhibit 10.1 to the Current Report on Form 8-K (Commission File No. 001-35257) filed on September 10, 2014).
31.1* Certification of Stephen W. Bergstrom, President and Chief Executive Officer of American Midstream GP, LLC, the General Partner of American Midstream Partners, LP, for the September 30, 2014 Quarterly Report on Form 10-Q, pursuant to Section 302 of the Sarbanes-Oxley Act of 2002.
31.2* Certification of Daniel C. Campbell, Senior Vice President & Chief Financial Officer of American Midstream GP, LLC, the General Partner of American Midstream Partners, LP, for the September 30, 2014 Quarterly Report on Form 10-Q, pursuant to Section 302 of the Sarbanes-Oxley Act of 2002.
32.1* Certification of Stephen W. Bergstrom, President and Chief Executive Officer of American Midstream GP, LLC, the General Partner of American Midstream Partners, LP, for the September 30, 2014 Quarterly Report on Form 10-Q, pursuant to Section 906 of the Sarbanes-Oxley Act of 2002.
32.2* Certification of Daniel C. Campbell, Senior Vice President & Chief Financial Officer of American Midstream GP, LLC, the General Partner of American Midstream Partners, LP, for the September 30, 2014 Quarterly Report on Form 10-Q, pursuant to Section 906 of the Sarbanes-Oxley Act of 2002.
**101.INS XBRL Instance Document
**101.SCH XBRL Taxonomy Extension Schema Document

62

Table of Contents
63
**101.CAL XBRL Taxonomy Extension Calculation Linkbase Document
**101.DEF XBRL Taxonomy Extension Definition Linkbase Document
**101.LAB XBRL Taxonomy Extension Label Linkbase Document
**101.PRE XBRL Taxonomy Extension Presentation Linkbase Document
* Filed herewith
** Submitted electronically herewith
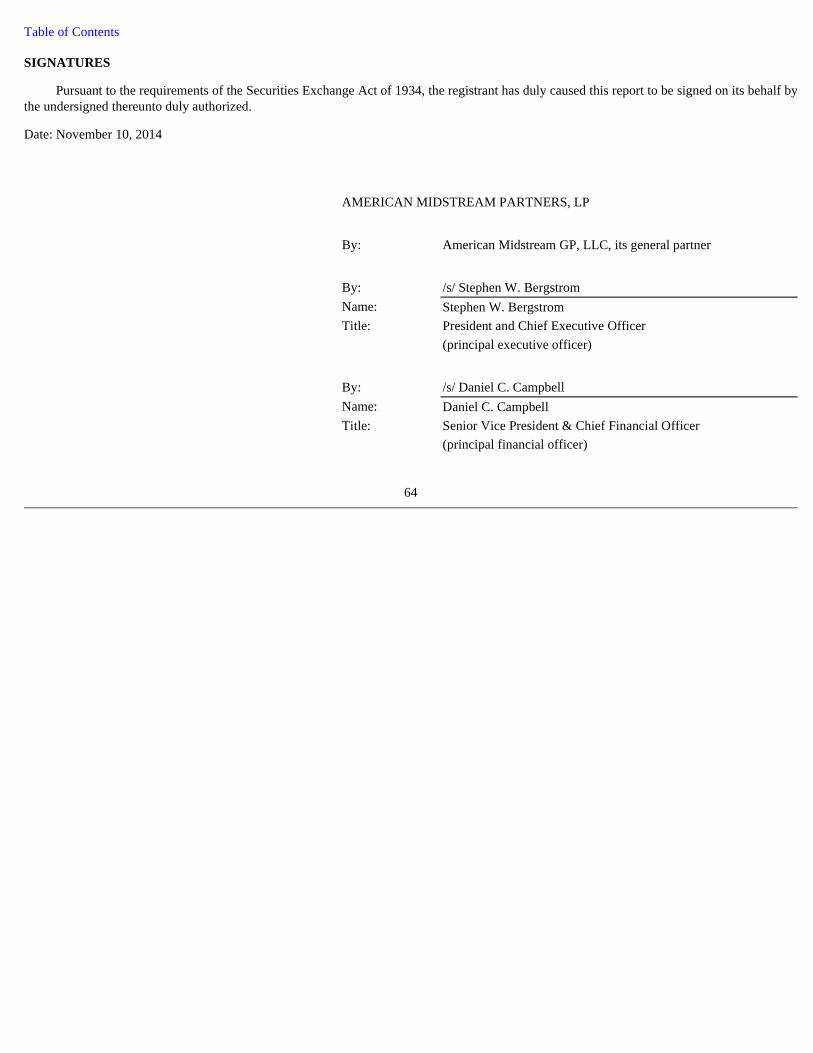
Table of Contents SIGNATURES
Pursuant to the requirements of the Securities Exchange Act of 1934, the registrant has duly caused this report to be signed on its behalf by the undersigned thereunto duly authorized.
Date: November 10, 2014
64
AMERICAN MIDSTREAM PARTNERS, LP
By: American Midstream GP, LLC, its general partner
By: /s/ Stephen W. Bergstrom
Name: Stephen W. Bergstrom
Title: President and Chief Executive Officer
(principal executive officer)
By: /s/ Daniel C. Campbell
Name: Daniel C. Campbell
Title: Senior Vice President & Chief Financial Officer
(principal financial officer)
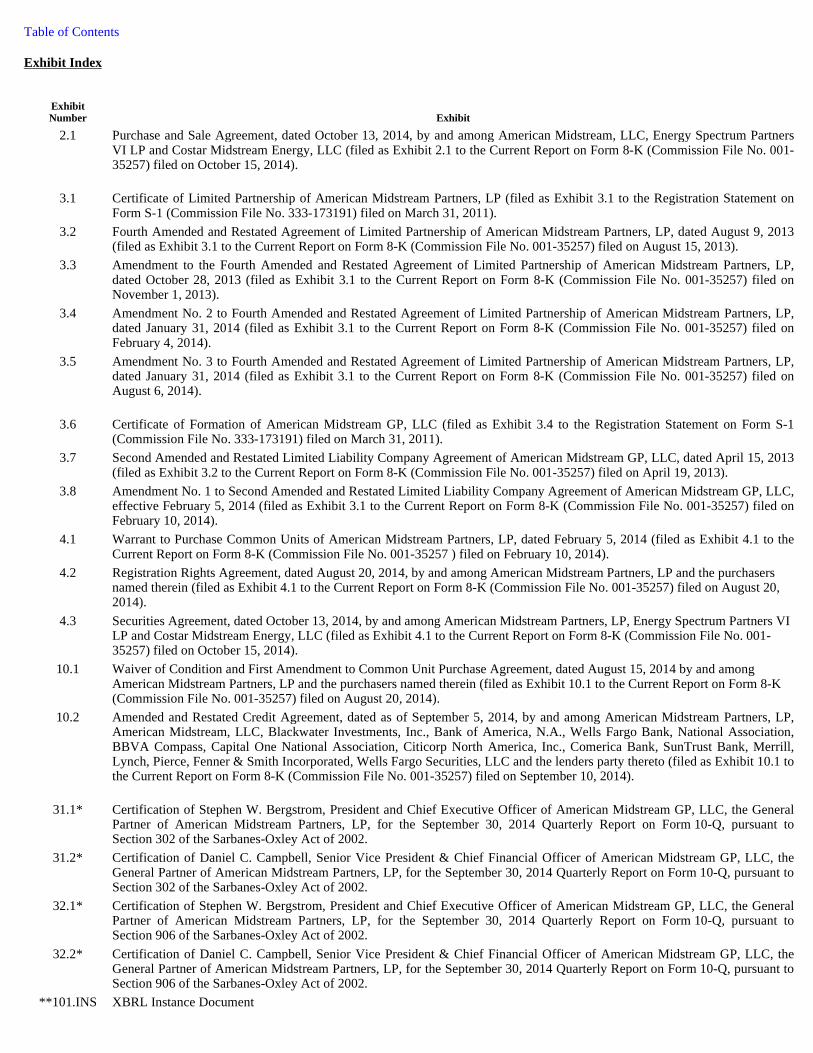
Table of Contents Exhibit Index
Exhibit Number Exhibit
2.1 Purchase and Sale Agreement, dated October 13, 2014, by and among American Midstream, LLC, Energy Spectrum Partners VI LP and Costar Midstream Energy, LLC (filed as Exhibit 2.1 to the Current Report on Form 8-K (Commission File No. 001-35257) filed on October 15, 2014).
3.1 Certificate of Limited Partnership of American Midstream Partners, LP (filed as Exhibit 3.1 to the Registration Statement on Form S-1 (Commission File No. 333-173191) filed on March 31, 2011).
3.2 Fourth Amended and Restated Agreement of Limited Partnership of American Midstream Partners, LP, dated August 9, 2013 (filed as Exhibit 3.1 to the Current Report on Form 8-K (Commission File No. 001-35257) filed on August 15, 2013).
3.3 Amendment to the Fourth Amended and Restated Agreement of Limited Partnership of American Midstream Partners, LP, dated October 28, 2013 (filed as Exhibit 3.1 to the Current Report on Form 8-K (Commission File No. 001-35257) filed on November 1, 2013).
3.4 Amendment No. 2 to Fourth Amended and Restated Agreement of Limited Partnership of American Midstream Partners, LP, dated January 31, 2014 (filed as Exhibit 3.1 to the Current Report on Form 8-K (Commission File No. 001-35257) filed on February 4, 2014).
3.5 Amendment No. 3 to Fourth Amended and Restated Agreement of Limited Partnership of American Midstream Partners, LP, dated January 31, 2014 (filed as Exhibit 3.1 to the Current Report on Form 8-K (Commission File No. 001-35257) filed on August 6, 2014).
3.6 Certificate of Formation of American Midstream GP, LLC (filed as Exhibit 3.4 to the Registration Statement on Form S-1 (Commission File No. 333-173191) filed on March 31, 2011).
3.7 Second Amended and Restated Limited Liability Company Agreement of American Midstream GP, LLC, dated April 15, 2013 (filed as Exhibit 3.2 to the Current Report on Form 8-K (Commission File No. 001-35257) filed on April 19, 2013).
3.8 Amendment No. 1 to Second Amended and Restated Limited Liability Company Agreement of American Midstream GP, LLC, effective February 5, 2014 (filed as Exhibit 3.1 to the Current Report on Form 8-K (Commission File No. 001-35257) filed on February 10, 2014).
4.1 Warrant to Purchase Common Units of American Midstream Partners, LP, dated February 5, 2014 (filed as Exhibit 4.1 to the Current Report on Form 8-K (Commission File No. 001-35257 ) filed on February 10, 2014).
4.2 Registration Rights Agreement, dated August 20, 2014, by and among American Midstream Partners, LP and the purchasers named therein (filed as Exhibit 4.1 to the Current Report on Form 8-K (Commission File No. 001-35257) filed on August 20, 2014).
4.3 Securities Agreement, dated October 13, 2014, by and among American Midstream Partners, LP, Energy Spectrum Partners VI LP and Costar Midstream Energy, LLC (filed as Exhibit 4.1 to the Current Report on Form 8-K (Commission File No. 001-35257) filed on October 15, 2014).
10.1 Waiver of Condition and First Amendment to Common Unit Purchase Agreement, dated August 15, 2014 by and among American Midstream Partners, LP and the purchasers named therein (filed as Exhibit 10.1 to the Current Report on Form 8-K (Commission File No. 001-35257) filed on August 20, 2014).
10.2 Amended and Restated Credit Agreement, dated as of September 5, 2014, by and among American Midstream Partners, LP, American Midstream, LLC, Blackwater Investments, Inc., Bank of America, N.A., Wells Fargo Bank, National Association, BBVA Compass, Capital One National Association, Citicorp North America, Inc., Comerica Bank, SunTrust Bank, Merrill, Lynch, Pierce, Fenner & Smith Incorporated, Wells Fargo Securities, LLC and the lenders party thereto (filed as Exhibit 10.1 to the Current Report on Form 8-K (Commission File No. 001-35257) filed on September 10, 2014).
31.1* Certification of Stephen W. Bergstrom, President and Chief Executive Officer of American Midstream GP, LLC, the General Partner of American Midstream Partners, LP, for the September 30, 2014 Quarterly Report on Form 10-Q, pursuant to Section 302 of the Sarbanes-Oxley Act of 2002.
31.2* Certification of Daniel C. Campbell, Senior Vice President & Chief Financial Officer of American Midstream GP, LLC, the General Partner of American Midstream Partners, LP, for the September 30, 2014 Quarterly Report on Form 10-Q, pursuant to Section 302 of the Sarbanes-Oxley Act of 2002.
32.1* Certification of Stephen W. Bergstrom, President and Chief Executive Officer of American Midstream GP, LLC, the General Partner of American Midstream Partners, LP, for the September 30, 2014 Quarterly Report on Form 10-Q, pursuant to Section 906 of the Sarbanes-Oxley Act of 2002.
32.2* Certification of Daniel C. Campbell, Senior Vice President & Chief Financial Officer of American Midstream GP, LLC, the General Partner of American Midstream Partners, LP, for the September 30, 2014 Quarterly Report on Form 10-Q, pursuant to Section 906 of the Sarbanes-Oxley Act of 2002.
**101.INS XBRL Instance Document

65

Table of Contents
66
**101.SCH XBRL Taxonomy Extension Schema Document
**101.CAL XBRL Taxonomy Extension Calculation Linkbase Document
**101.DEF XBRL Taxonomy Extension Definition Linkbase Document
**101.LAB XBRL Taxonomy Extension Label Linkbase Document
**101.PRE XBRL Taxonomy Extension Presentation Linkbase Document
* Filed herewith
** Submitted electronically herewith

EXHIBIT 31.1
CERTIFICATION PURSUANT TO SECTION 302 OF
THE SARBANES-OXLEY ACT OF 2002
I, Stephen W. Bergstrom, certify that:
1 I have reviewed this Quarterly Report on Form 10-Q of American Midstream Partners, LP;
2 Based on my knowledge, this Quarterly Report does not contain any untrue statement of a material fact or omit to state a material fact necessary to make the statements made, in light of the circumstances under which such statements were made, not misleading with respect to the period covered by this Quarterly Report;
3 Based on my knowledge, the financial statements, and other financial information included in this Quarterly Report, fairly present in all material respects the financial condition, results of operations and cash flows of the registrant as of, and for, the periods presented in this Quarterly Report;
4 The registrant’s other certifying officer and I are responsible for establishing and maintaining disclosure controls and procedures (as defined in Exchange Act Rules 13a-15(e) and 15d-15(e)) and internal control over financial reporting (as defined in Exchange Act Rules 13a-15(f) and 15d-15(f)) for the registrant and have:
(a) Designed such disclosure controls and procedures, or caused such disclosure controls and procedures to be designed under our supervision, to ensure that material information relating to the registrant, including its consolidated subsidiaries, is made known to us by others within those entities, particularly during the period in which this Quarterly Report is being prepared;
(b) Designed such internal control over financial reporting, or caused such internal control over financial reporting to be designed under our supervision, to provide reasonable assurance regarding the reliability of financial reporting and the preparation of financial statements for external purposes in accordance with generally accepted accounting principles;
(c) Evaluated the effectiveness of the registrant’s disclosure controls and procedures and presented in this Quarterly Report our conclusions about the effectiveness of the disclosure controls and procedures, as of the end of the period covered by this Quarterly Report based on such evaluation; and
(d) Disclosed in this Quarterly Report any change in the registrant’s internal control over financial reporting that occurred during the registrant’s most recent fiscal quarter (the registrant’s first fiscal quarter in the case of an quarterly report) that has materially affected, or is reasonably likely to materially affect, the registrant’s internal control over financial reporting; and
5 The registrant’s other certifying officer and I have disclosed, based on our most recent evaluation of internal control over financial reporting, to the registrant’s auditors and the audit committee of the registrant’s board of directors (or persons performing the equivalent functions):
(a) All significant deficiencies and material weaknesses in the design or operation of internal control over financial reporting which are reasonably likely to adversely affect the registrant’s ability to record, process, summarize and report financial information; and
(b) Any fraud, whether or not material, that involves management or other employees who have a significant role in the registrant’s internal control over financial reporting.
Date: November 10, 2014 /s/ Stephen W. Bergstrom
Stephen W. Bergstrom
President and Chief Executive Officer of
American Midstream GP, LLC
(the general partner of
American Midstream Partners, LP)

EXHIBIT 31.2
CERTIFICATION PURSUANT TO SECTION 302 OF
THE SARBANES-OXLEY ACT OF 2002
I, Daniel C. Campbell, certify that:
1 I have reviewed this Quarterly Report on Form 10-Q of American Midstream Partners, LP;
2 Based on my knowledge, this Quarterly Report does not contain any untrue statement of a material fact or omit to state a material fact necessary to make the statements made, in light of the circumstances under which such statements were made, not misleading with respect to the period covered by this Quarterly Report;
3 Based on my knowledge, the financial statements, and other financial information included in this Quarterly Report, fairly present in all material respects the financial condition, results of operations and cash flows of the registrant as of, and for, the periods presented in this Quarterly Report;
4 The registrant’s other certifying officer and I are responsible for establishing and maintaining disclosure controls and procedures (as defined in Exchange Act Rules 13a-15(e) and 15d-15(e)) and internal control over financial reporting (as defined in Exchange Act Rules 13a-15(f) and 15d-15(f)) for the registrant and have:
(a) Designed such disclosure controls and procedures, or caused such disclosure controls and procedures to be designed under our supervision, to ensure that material information relating to the registrant, including its consolidated subsidiaries, is made known to us by others within those entities, particularly during the period in which this Quarterly Report is being prepared;
(b) Designed such internal control over financial reporting, or caused such internal control over financial reporting to be designed under our supervision, to provide reasonable assurance regarding the reliability of financial reporting and the preparation of financial statements for external purposes in accordance with generally accepted accounting principles;
(c) Evaluated the effectiveness of the registrant’s disclosure controls and procedures and presented in this Quarterly Report our conclusions about the effectiveness of the disclosure controls and procedures, as of the end of the period covered by this Quarterly Report based on such evaluation; and
(d) Disclosed in this Quarterly Report any change in the registrant’s internal control over financial reporting that occurred during the registrant’s most recent fiscal quarter (the registrant’s first fiscal quarter in the case of an Quarterly report) that has materially affected, or is reasonably likely to materially affect, the registrant’s internal control over financial reporting; and
5 The registrant’s other certifying officer and I have disclosed, based on our most recent evaluation of internal control over financial reporting, to the registrant’s auditors and the audit committee of the registrant’s board of directors (or persons performing the equivalent functions):
(a) All significant deficiencies and material weaknesses in the design or operation of internal control over financial reporting which are reasonably likely to adversely affect the registrant’s ability to record, process, summarize and report financial information; and
(b) Any fraud, whether or not material, that involves management or other employees who have a significant role in the registrant’s internal control over financial reporting.
Date: November 10, 2014 /s/ Daniel C. Campbell
Daniel C. Campbell
Senior Vice President & Chief Financial Officer
American Midstream GP, LLC
(the general partner of
American Midstream Partners, LP)

EXHIBIT 32.1
CERTIFICATION PURSUANT TO 18 U.S.C. 1350,
AS ADOPTED PURSUANT TO SECTION 906 OF THE SARBANES-OXLEY ACT OF 2002
In connection with the Quarterly Report of American Midstream Partners, LP (the “Registrant”) on Form 10-Q for the period ended September 30, 2014 as filed with the Securities and Exchange Commission on the date hereof (the “Report”), I, Stephen W. Bergstrom, President and Chief Executive Officer of American Midstream GP, LLC, the general partner of the Registrant, certify, pursuant to 18 U.S.C. § 1350, as adopted pursuant to § 906 of the Sarbanes-Oxley Act of 2002, that:
Date: November 10, 2014
The foregoing certification is being furnished solely pursuant to 18 U.S.C. Section 1350 and is not being filed as part of the Report or as a separate document. A signed original of this written statement required by Section 906 of the Sarbanes-Oxley Act of 2002 has been provided to the Registrant and will be retained by the Registrant and furnished to the Securities and Exchange Commission or its staff upon request.
(1) The Report fully complies with the requirements of Section 13(a) or 15(d), as applicable, of the Securities Exchange Act of 1934; and
(2) The information contained in the Report fairly presents, in all material respects, the financial condition and results of operations of the Registrant.
/s/ Stephen W. Bergstrom
Stephen W. Bergstrom
President and Chief Executive Officer of
American Midstream GP, LLC, the general partner of American Midstream Partners, LP
EXHIBIT 32.2
CERTIFICATION PURSUANT TO 18 U.S.C. 1350,
AS ADOPTED PURSUANT TO SECTION 906 OF THE SARBANES-OXLEY ACT OF 2002
In connection with the Quarterly Report of American Midstream Partners, LP (the “Registrant”) on Form 10-Q for the period ended September 30, 2014 as filed with the Securities and Exchange Commission on the date hereof (the “Report”), I, Daniel C. Campbell, Senior Vice President & Chief Financial Officer of American Midstream GP, LLC, the general partner of the Registrant, certify, pursuant to 18 U.S.C. § 1350, as adopted pursuant to § 906 of the Sarbanes-Oxley Act of 2002, that:
Date: November 10, 2014
The foregoing certification is being furnished solely pursuant to 18 U.S.C. Section 1350 and is not being filed as part of the Report or as a separate document. A signed original of this written statement required by Section 906 of the Sarbanes-Oxley Act of 2002 has been provided to the Registrant and will be retained by the Registrant and furnished to the Securities and Exchange Commission or its staff upon request.
(1) The Report fully complies with the requirements of Section 13(a) or 15(d), as applicable, of the Securities Exchange Act of 1934; and
(2) The information contained in the Report fairly presents, in all material respects, the financial condition and results of operations of the Registrant.
/s/ Daniel C. Campbell
Daniel C. Campbell
Senior Vice President & Chief Financial Officer
American Midstream GP, LLC, the general partner of American Midstream Partners, LP