Embed Size (px)
Citation preview
American International Group IncAmerican International Group, Inc.Fourth Quarter 2011 Results
Conference Call PresentationConference Call Presentation
February 24, 2012
Cautionary Statement Regarding Projections and Cautionary Statement Regarding Projections and Other Information About Future EventsThis document and the remarks made within this presentation may include projections, goals, assumptions and statements that may constitute “forward-looking statements” within the meaning of the Private Securities Litigation Reform Act of 1995. These projections, goals, assumptions and statements are not historical facts but instead represent only AIG’s belief p j , g , p p yregarding future events, many of which, by their nature, are inherently uncertain and outside AIG’s control. These projections, goals, assumptions and statements include statements preceded by, followed by or including words such as “believe”, “anticipate”, “expect”, “intend”, “plan”, “view”, “target”, or “estimate”. It is possible that AIG’s actual results and financial condition will differ, possibly materially, from the results and financial condition indicated in these projections, goals, assumptions and statements. Factors that could cause AIG’s actual results to differ, possibly materially, from those in the specific projections, goals, assumptions and statements include actions by credit rating agencies; changes in market p p j g p y g g gconditions; the occurrence of catastrophic events; significant legal proceedings; concentrations in AIG’s investment portfolios, including its municipal bond portfolio; judgments concerning casualty insurance underwriting and reserves; judgments concerning deferred policy acquisition costs recoverability; judgments concerning the recognition of deferred tax assets; judgments concerning the recoverability of aircraft values in ILFC’s fleet; and such other factors as discussed throughout Part I, Item 1A. Risk Factors and in Part II, Item 7. Management's Discussion and Analysis of Financial Condition and Results of Operations in AIG’s Annual Report on Form 10-K for the year ended December 31, 2011.
AIG is not under any obligation (and expressly disclaims any obligation) to update or alter any projections, goals, assumptions or other statements, whether written or oral, that may be made from time to time, whether as a result of new information, future events or otherwise. This document and the remarks made orally may also contain certain non-GAAP financial measures. The reconciliation of such measures to the most comparable GAAP measures in accordance with Regulation G is included in the Fourth Quarter 2011 Financial Supplement available in the Investor Information section of AIG's corporate website www aig comAIG s corporate website, www.aig.com .
IRS Circular 230 Disclosure: To ensure compliance with requirements imposed by the IRS, we inform you that (i) any U.S. tax advice contained in this communication (including any attachments) is not intended or written to be used, and cannot be used, for the purpose of avoiding penalties under the Internal Revenue Code; (ii) any such tax advice is written in connection with the promotion or marketing of the matters addressed; and (iii) if you are not the original addressee of this communication, you should seek advice based on your particular circumstances from an independent advisor.
2
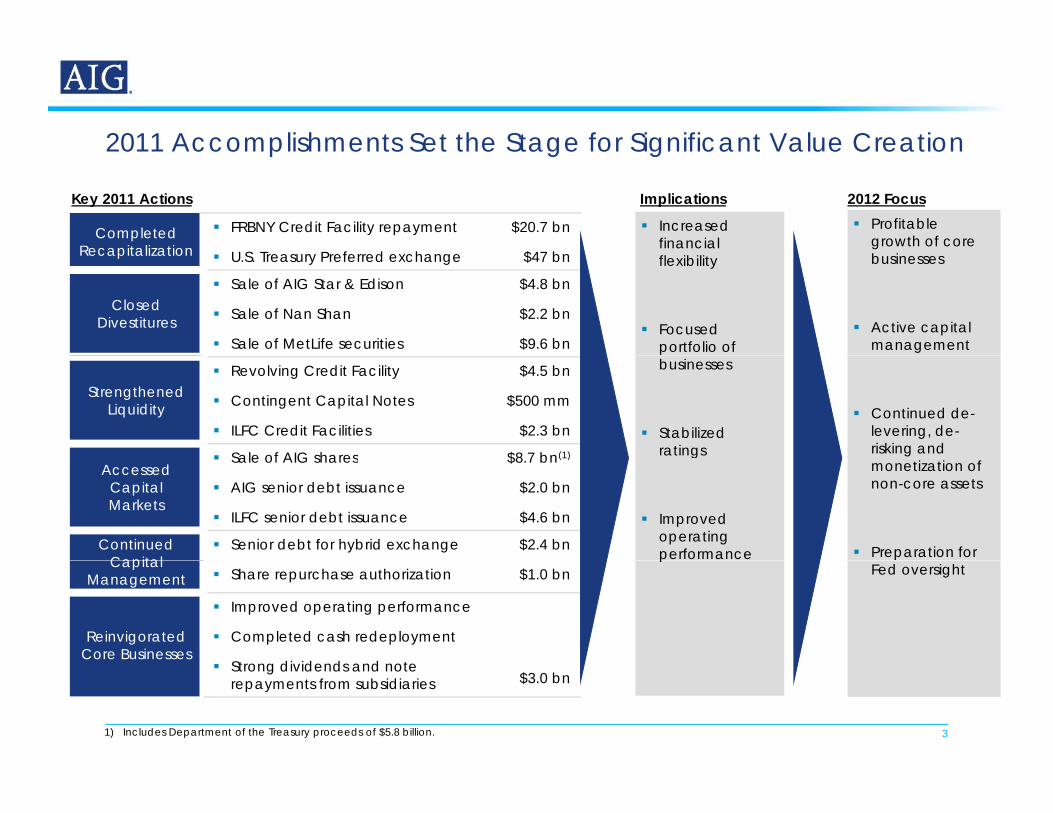
2011 Accomplishments Set the Stage for Significant Value Creation2011 Accomplishments Set the Stage for Significant Value Creation
Completed Recapitalization
FRBNY Credit Facility repayment
U S T P f d h
$20.7 bn
$47 b
Key 2011 Actions Profitable
growth of core i
2012 Focus
Increased financial
Implications
Recapitalization U.S. Treasury Preferred exchange $47 bn
Closed Divestitures
Sale of AIG Star & Edison
Sale of Nan Shan
Sale of MetLife securities
$4.8 bn
$2.2 bn
$9.6 bn
businesses
Active capital management
flexibility
Focused portfolio of
Strengthened Liquidity
Revolving Credit Facility
Contingent Capital Notes
ILFC Credit Facilities
$4.5 bn
$500 mm
$2.3 bn
Sale of AIG shares $8 7 bn(1)
Continued de-levering, de-risking and
businesses
Stabilized ratings
Accessed Capital Markets
Sale of AIG shares
AIG senior debt issuance
ILFC senior debt issuance
$8.7 bn(1)
$2.0 bn
$4.6 bn
Continued Capital
Senior debt for hybrid exchange $2.4 bn
monetization of non-core assets
Preparation for
g
Improved operating performanceCapital
Management Share repurchase authorization $1.0 bn
Reinvigorated Core Businesses
Improved operating performance
Completed cash redeployment
St di id d d t
Fed oversightp
3
Strong dividends and note repayments from subsidiaries $3.0 bn
1) Includes Department of the Treasury proceeds of $5.8 billion.
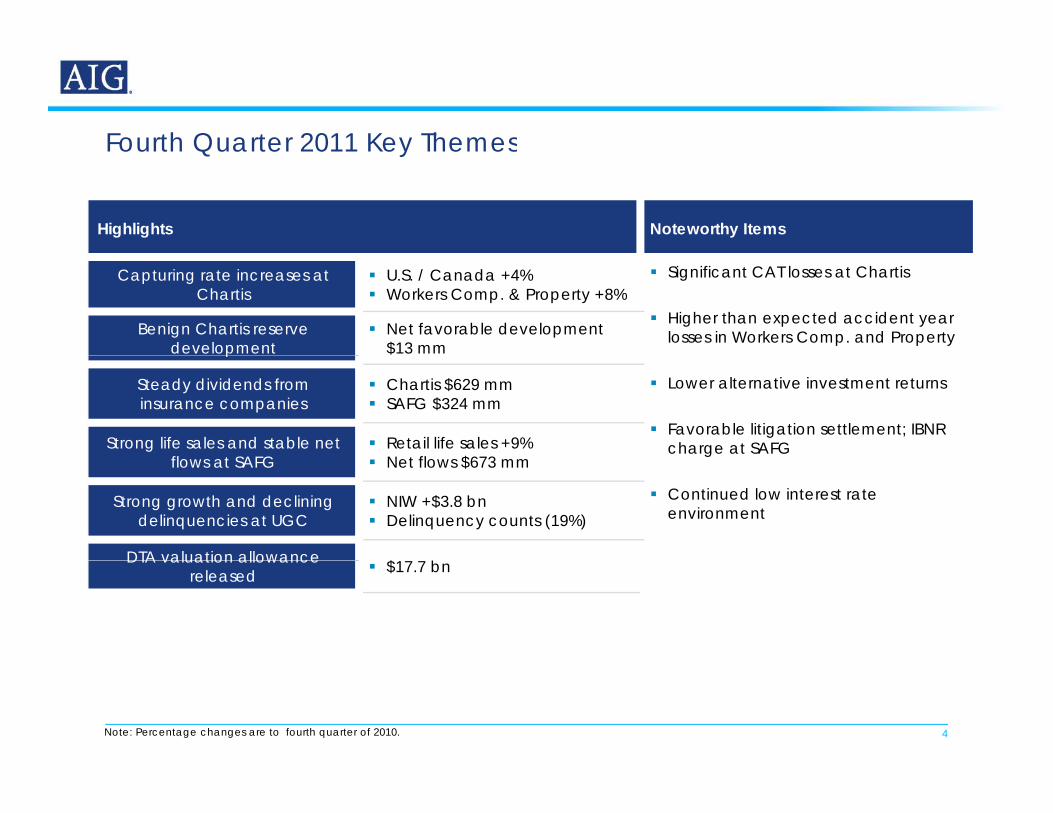
Fourth Quarter 2011 Key ThemesFourth Quarter 2011 Key Themes
Highlights Noteworthy Items
Capturing rate increases at Chartis
U.S. / Canada +4% Workers Comp. & Property +8%
Significant CAT losses at Chartis
Higher than expected accident year losses in Workers Comp. and PropertyBenign Chartis reserve
development Net favorable development
$13 mm
Lower alternative investment returns
Favorable litigation settlement; IBNR charge at SAFG
p $
Steady dividends from insurance companies
Chartis $629 mm SAFG $324 mm
Strong life sales and stable net fl t SAFG
Retail life sales +9%N t fl $673
Continued low interest rate environment
flows at SAFG Net flows $673 mm
Strong growth and declining delinquencies at UGC
NIW +$3.8 bn Delinquency counts (19%)
DTA valuation allowance $ bDTA valuation allowance released $17.7 bn
4Note: Percentage changes are to fourth quarter of 2010.
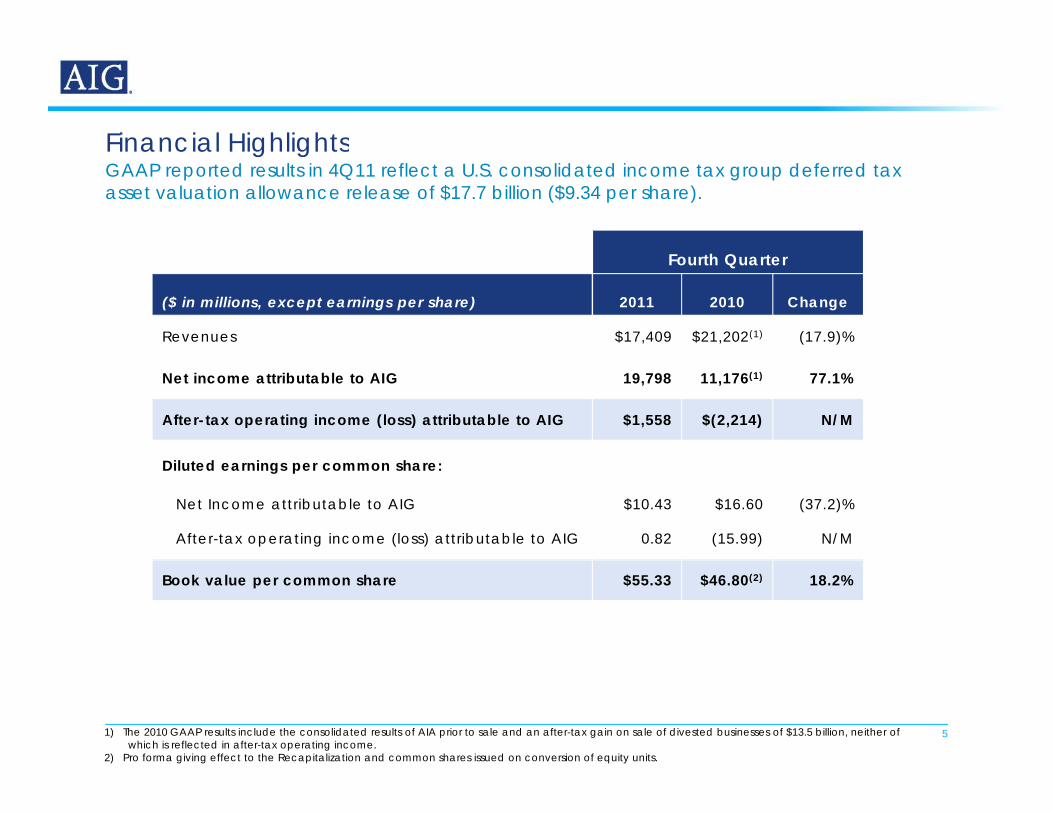
Financial HighlightsFinancial HighlightsGAAP reported results in 4Q11 reflect a U.S. consolidated income tax group deferred tax asset valuation allowance release of $17.7 billion ($9.34 per share).
Fourth Quarter
($ in millions, except earnings per share) 2011 2010 Change
Revenues $17,409 $21,202(1) (17.9)%
Net income attributable to AIG 19,798 11,176(1) 77.1%
After-tax operating income (loss) attributable to AIG $1,558 $(2,214) N/M
Diluted earnings per common share:
Net Income attributable to AIG $10.43 $16.60 (37.2)%
After-tax operating income (loss) attributable to AIG 0.82 (15.99) N/M
Book value per common share $55.33 $46.80(2) 18.2%
51) The 2010 GAAP results include the consolidated results of AIA prior to sale and an after-tax gain on sale of divested businesses of $13.5 billion, neither of which is reflected in after-tax operating income.
2) Pro forma giving effect to the Recapitalization and common shares issued on conversion of equity units.
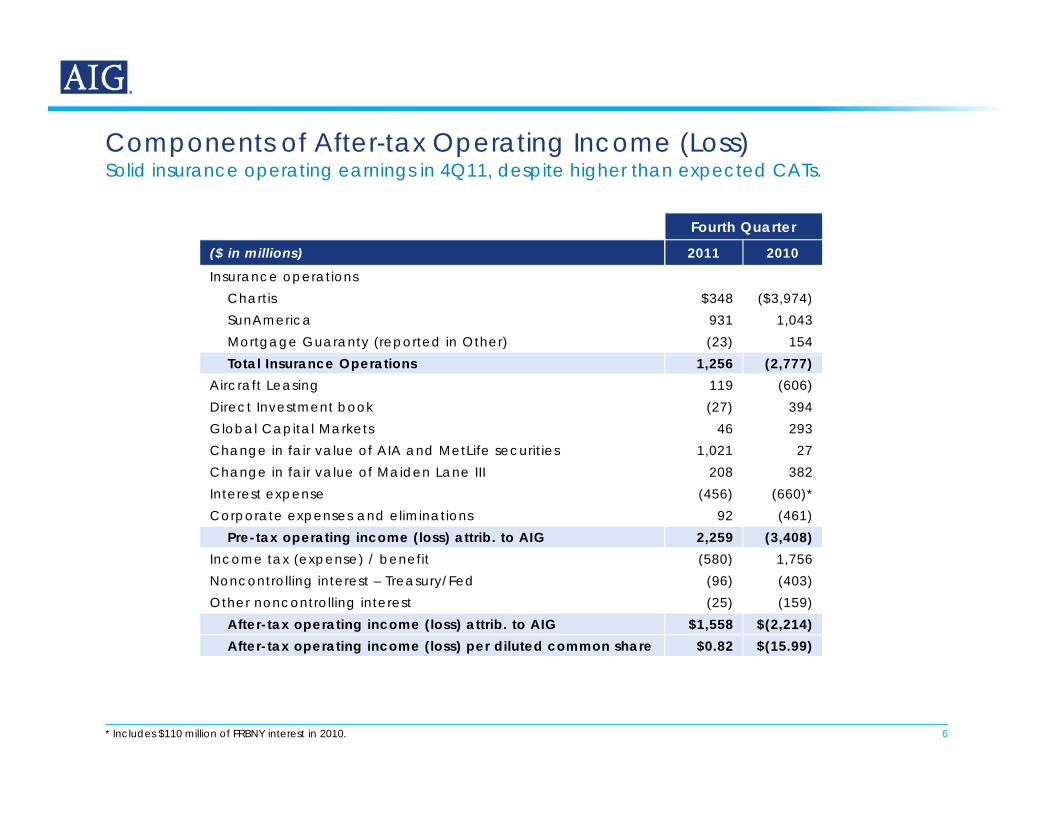
Components of After-tax Operating Income (Loss)Solid insurance operating earnings in 4Q11, despite higher than expected CATs.Components of After tax Operating Income (Loss)
Fourth Quarter
($ in millions) 2011 2010($ in millions) 2011 2010Insurance operations
Chartis $348 ($3,974)SunAmerica 931 1,043Mortgage Guaranty (reported in Other) (23) 154Total Insurance Operations 1,256 (2,777)
Aircraft Leasing 119 (606)Direct Investment book (27) 394Global Capital Markets 46 293Change in fair value of AIA and MetLife securities 1,021 27Change in fair value of Maiden Lane III 208 382Interest expense (456) (660)*Corporate expenses and eliminations 92 (461)
Pre-tax operating income (loss) attrib. to AIG 2,259 (3,408)Income tax (expense) / benefit (580) 1 756Income tax (expense) / benefit (580) 1,756Noncontrolling interest – Treasury/Fed (96) (403)Other noncontrolling interest (25) (159)
After-tax operating income (loss) attrib. to AIG $1,558 $(2,214)After-tax operating income (loss) per diluted common share $0.82 $(15.99)
6* Includes $110 million of FRBNY interest in 2010.
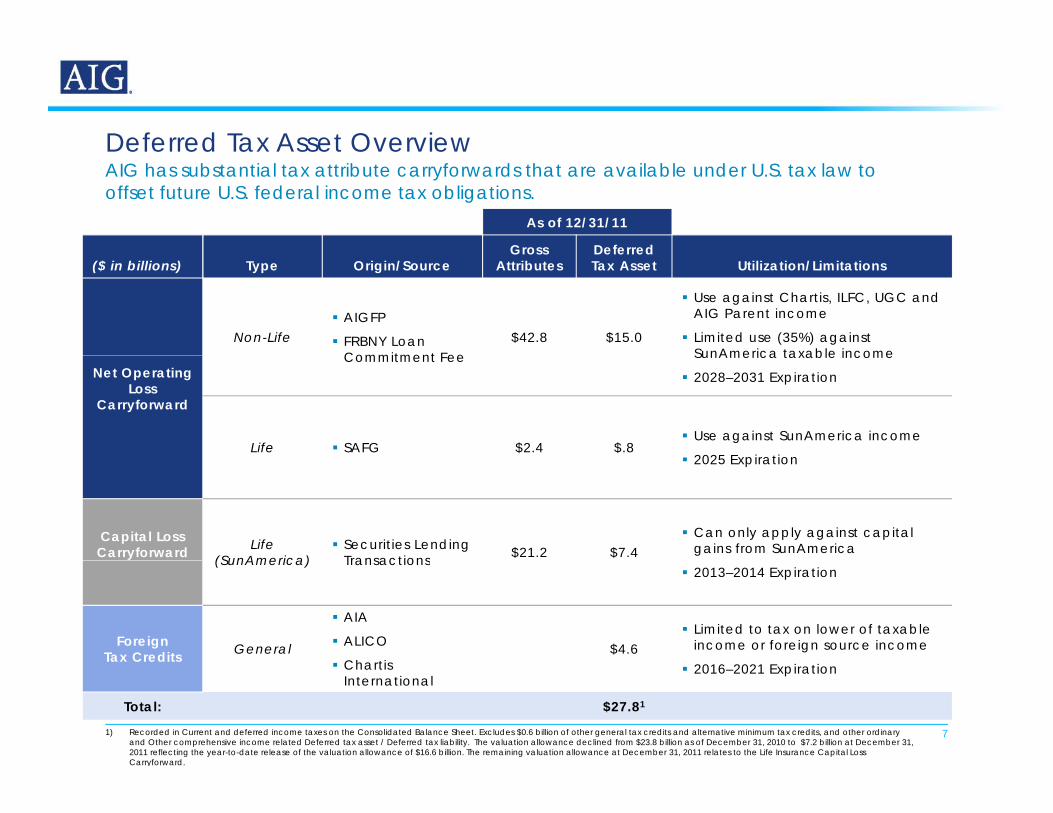
Deferred Tax Asset OverviewAIG has substantial tax attribute carryforwards that are available under U.S. tax law to offset future U.S. federal income tax obligations.
Deferred Tax Asset Overview
As of 12/31/11
Gross Deferred ($ in billions) Type Origin/Source
Gross Attributes
Deferred Tax Asset Utilization/Limitations
Non-Life AIGFP
FRBNY Loan Commitment Fee
$42.8 $15.0
Use against Chartis, ILFC, UGC and AIG Parent income
Limited use (35%) against SunAmerica taxable income
Net Operating Loss
Carryforward
Commitment Fee SunAmerica taxable income
2028–2031 Expiration
Life SAFG $2.4 $.8 Use against SunAmerica income
2025 Expiration 2025 Expiration
Capital LossCarryforward Life
(SunAmerica) Securities Lending
Transactions $21.2 $7.4 Can only apply against capital
gains from SunAmerica(SunAmerica) Transactions
2013–2014 Expiration
Foreign Tax Credits General
AIA
ALICO
Chartis $4.6
Limited to tax on lower of taxable income or foreign source income
71) Recorded in Current and deferred income taxes on the Consolidated Balance Sheet. Excludes $0.6 billion of other general tax credits and alternative minimum tax credits, and other ordinary and Other comprehensive income related Deferred tax asset / Deferred tax liability. The valuation allowance declined from $23.8 billion as of December 31, 2010 to $7.2 billion at December 31, 2011 reflecting the year-to-date release of the valuation allowance of $16.6 billion. The remaining valuation allowance at December 31, 2011 relates to the Life Insurance Capital Loss Carryforward.
Chartis International
2016–2021 Expiration
Total: $27.81
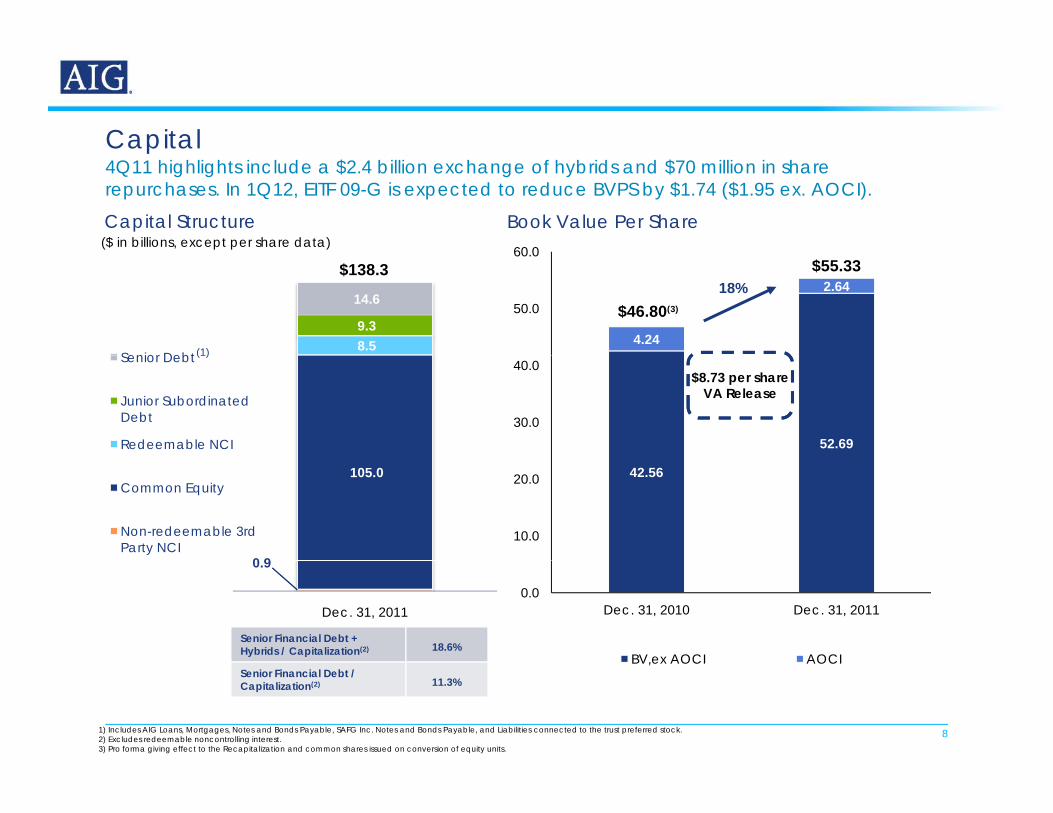
Capital
60 0
Book Value Per Share
p4Q11 highlights include a $2.4 billion exchange of hybrids and $70 million in share repurchases. In 1Q12, EITF 09-G is expected to reduce BVPS by $1.74 ($1.95 ex. AOCI).
Capital Structure($ in billions, except per share data)
4.24
2.6450.0
60.0$55.33
$46.80(3)
18%
8.5 9.3
14.6
Senior Debt
$138.3
(1)
52.6930.0
40.0Senior Debt
Junior Subordinated Debt
Redeemable NCI
(1)
$8.73 per shareVA Release
42.56
10.0
20.0
0 9
105.0 Common Equity
Non-redeemable 3rd Party NCI
0.0Dec. 31, 2010 Dec. 31, 2011
BV,ex AOCI AOCI
0.9
Dec. 31, 2011
Senior Financial Debt +Hybrids / Capitalization(2) 18.6%
8
BV,ex AOCI AOCI
1) Includes AIG Loans, Mortgages, Notes and Bonds Payable, SAFG Inc. Notes and Bonds Payable, and Liabilities connected to the trust preferred stock.2) Excludes redeemable noncontrolling interest. 3) Pro forma giving effect to the Recapitalization and common shares issued on conversion of equity units.
Senior Financial Debt / Capitalization(2) 11.3%
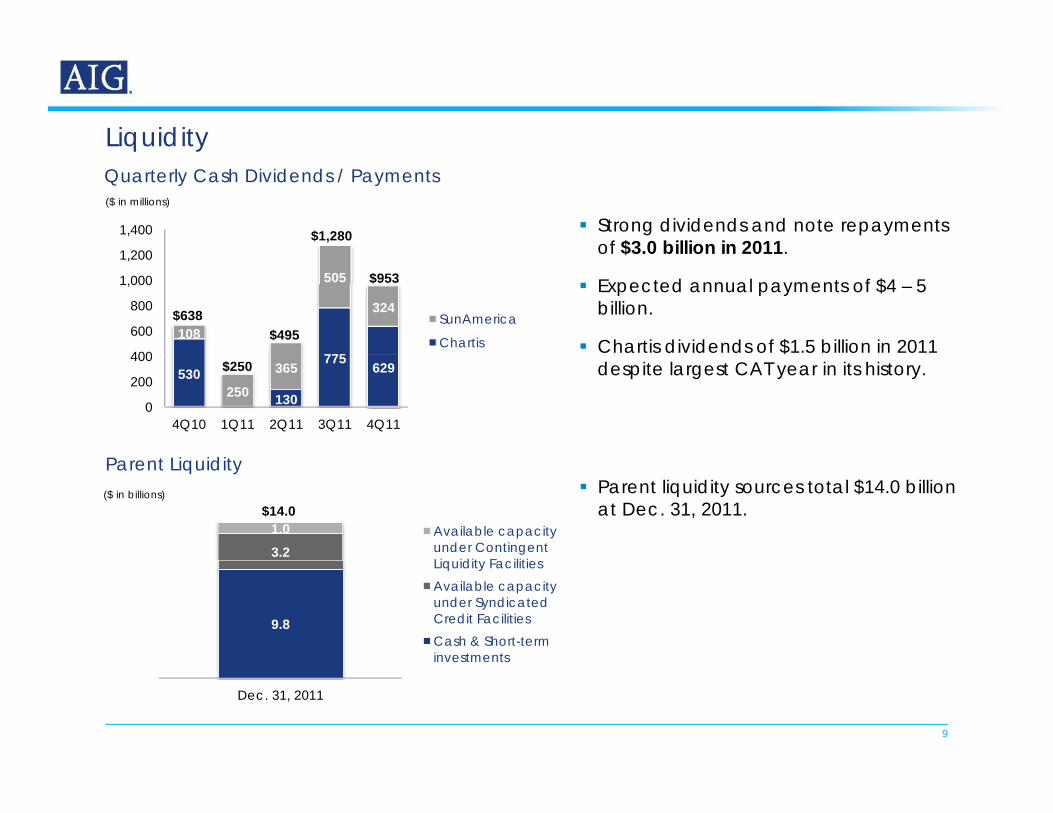
Liquidityq yQuarterly Cash Dividends / Payments
1 200
1,400
($ in millions)
$1,280 Strong dividends and note repayments of $3.0 billion in 2011.
775
108
505
324
400
600
800
1,000
1,200
SunAmerica
Chartis$495
$953
of $3.0 billion in 2011.
Expected annual payments of $4 – 5 billion.
Chartis dividends of $1.5 billion in 2011
$638
P t Li idit
530
130
775 629
250365
0
200
400
4Q10 1Q11 2Q11 3Q11 4Q11
$250$
despite largest CAT year in its history.
Parent liquidity sources total $14.0 billion at Dec. 31, 2011.
Parent Liquidity
3.21.0 Available capacity
under Contingent Li idit F iliti
($ in billions)$14.0
9.8
Liquidity FacilitiesAvailable capacity under Syndicated Credit FacilitiesCash & Short-term investments
9
Dec. 31, 2011
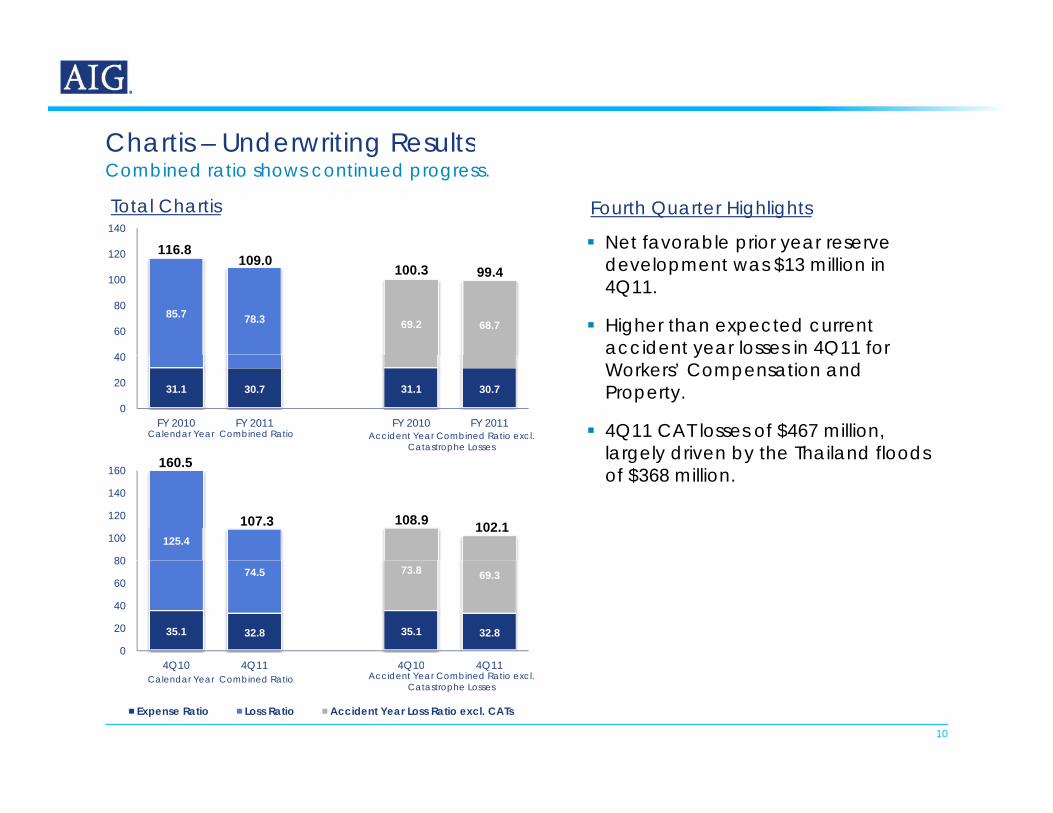
Chartis – Underwriting Results
120
140
Chartis Underwriting Results
Net favorable prior year reserve
Total Chartis
Combined ratio shows continued progress.
116.8
Fourth Quarter Highlights
85.7 78.3 69.2 68.7
40
60
80
100
120development was $13 million in 4Q11.
Higher than expected current accident year losses in 4Q11 for
116.8109.0
100.3 99.4
31.1 30.7 31.1 30.7
0
20
40
FY 2010 FY 2011 FY 2010 FY 2011
160 5
yWorkers’ Compensation and Property.
4Q11 CAT losses of $467 million, largely driven by the Thailand floods
Accident Year Combined Ratio excl.Catastrophe Losses
Calendar Year Combined Ratio
125.4
80
100
120
140
160 160.5
107.3 108.9 102.1
largely driven by the Thailand floods of $368 million.
35.1 32.8 35.1 32.8
74.5 73.8 69.3
0
20
40
60
80
4Q10 4Q11 4Q10 4Q11
10
4Q10 4Q11 4Q10 4Q11
Expense Ratio Loss Ratio Accident Year Loss Ratio excl. CATs
Calendar Year Combined Ratio Accident Year Combined Ratio excl.Catastrophe Losses
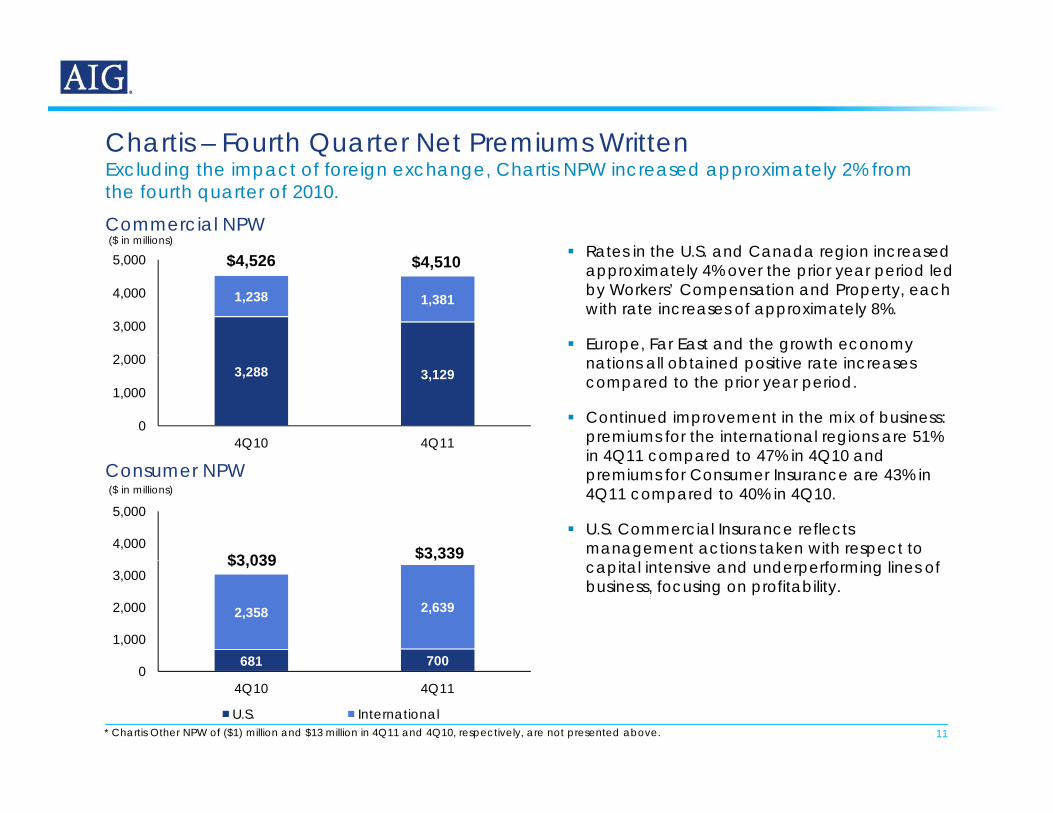
Chartis – Fourth Quarter Net Premiums Written
($ in millions)Commercial NPW
Rates in the U S and Canada region increased
Chartis Fourth Quarter Net Premiums WrittenExcluding the impact of foreign exchange, Chartis NPW increased approximately 2% from the fourth quarter of 2010.
1,238 1,381
2 000
3,000
4,000
5,000 $4,510$4,526 Rates in the U.S. and Canada region increased approximately 4% over the prior year period led by Workers’ Compensation and Property, each with rate increases of approximately 8%.
Europe, Far East and the growth economy 3,288 3,129
0
1,000
2,000
4Q10 4Q11
nations all obtained positive rate increases compared to the prior year period.
Continued improvement in the mix of business: premiums for the international regions are 51% in 4Q11 compared to 47% in 4Q10 and
4,000
5,000($ in millions)Consumer NPW
$3,339$3 039
in 4Q11 compared to 47% in 4Q10 and premiums for Consumer Insurance are 43% in 4Q11 compared to 40% in 4Q10.
U.S. Commercial Insurance reflects management actions taken with respect to
681 700
2,358 2,639
1,000
2,000
3,000$$3,039 capital intensive and underperforming lines of
business, focusing on profitability.
11
681 7000
4Q10 4Q11
U.S. International* Chartis Other NPW of ($1) million and $13 million in 4Q11 and 4Q10, respectively, are not presented above.
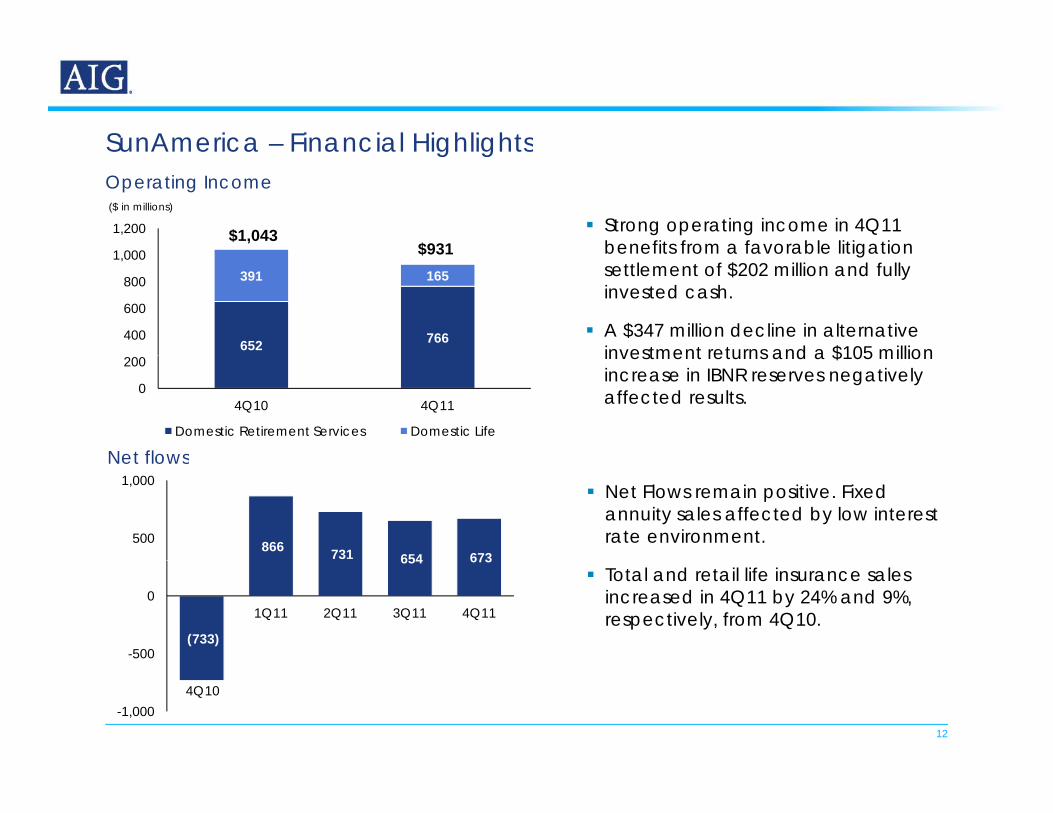
SunAmerica – Financial Highlights
1 000
1,200($ in millions)
Operating Income
$931$1,043 Strong operating income in 4Q11
benefits from a favorable litigation
SunAmerica Financial Highlights
652 766
391 165
400
600
800
1,000 $931 benefits from a favorable litigation settlement of $202 million and fully invested cash.
A $347 million decline in alternative investment returns and a $105 million
0
200
4Q10 4Q11
Domestic Retirement Services Domestic Life
investment returns and a $105 million increase in IBNR reserves negatively affected results.
Net flowsNet flows
866 731 654 673 500
1,000 Net Flows remain positive. Fixed
annuity sales affected by low interest rate environment.
(733)
654 673
-500
01Q11 2Q11 3Q11 4Q11
Total and retail life insurance sales increased in 4Q11 by 24% and 9%, respectively, from 4Q10.
12
-1,0004Q10
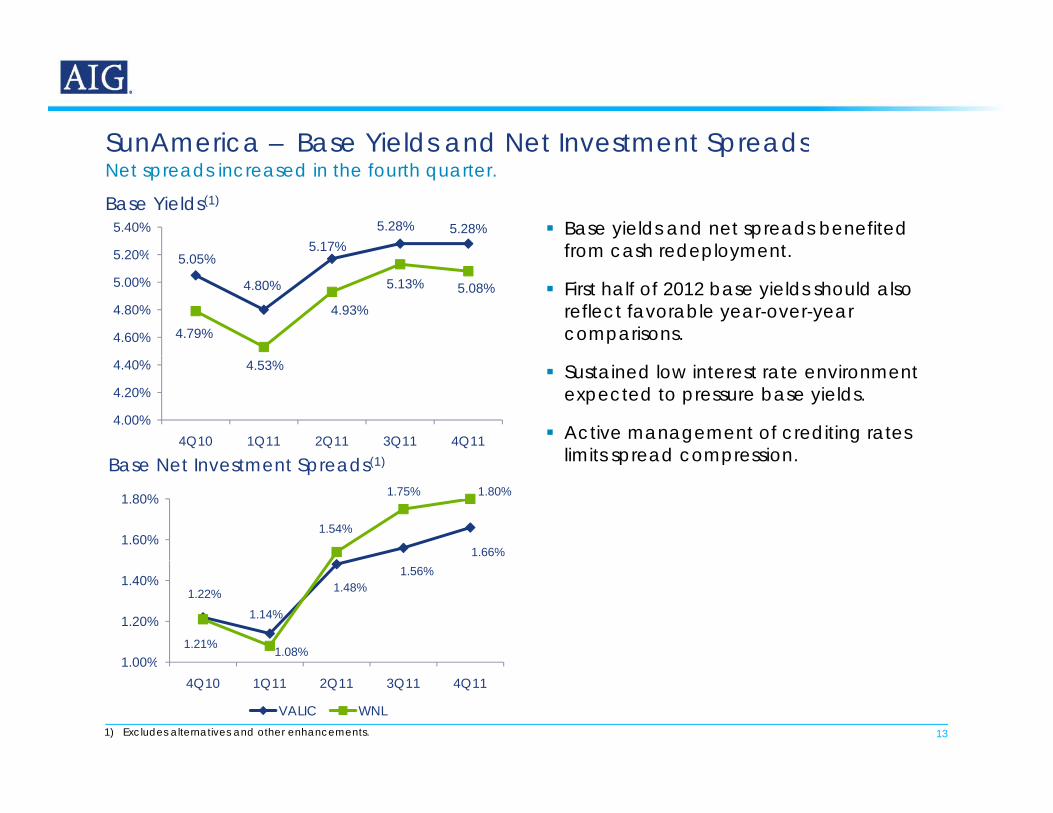
SunAmerica – Base Yields and Net Investment Spreads
Base yields and net spreads benefited from cash redeployment
Net spreads increased in the fourth quarter.SunAmerica Base Yields and Net Investment Spreads
5.17%5.28% 5.28%
5 20%
5.40%Base Yields(1)
from cash redeployment.
First half of 2012 base yields should also reflect favorable year-over-year comparisons.
5.05%
4.80%
4.79%
4.93%
5.13% 5.08%
4.60%
4.80%
5.00%
5.20%
Sustained low interest rate environment expected to pressure base yields.
Active management of crediting rates limits spread compression
4.53%
4.00%
4.20%
4.40%
4Q10 1Q11 2Q11 3Q11 4Q11
B N t I t t S d (1) limits spread compression.
1.66%
1.54%
1.75% 1.80%
1.60%
1.80%
Base Net Investment Spreads(1)
1.22%1.14%
1.48%1.56%
1.21% 1.08%1 00%
1.20%
1.40%
13
1.00%4Q10 1Q11 2Q11 3Q11 4Q11
VALIC WNL1) Excludes alternatives and other enhancements.
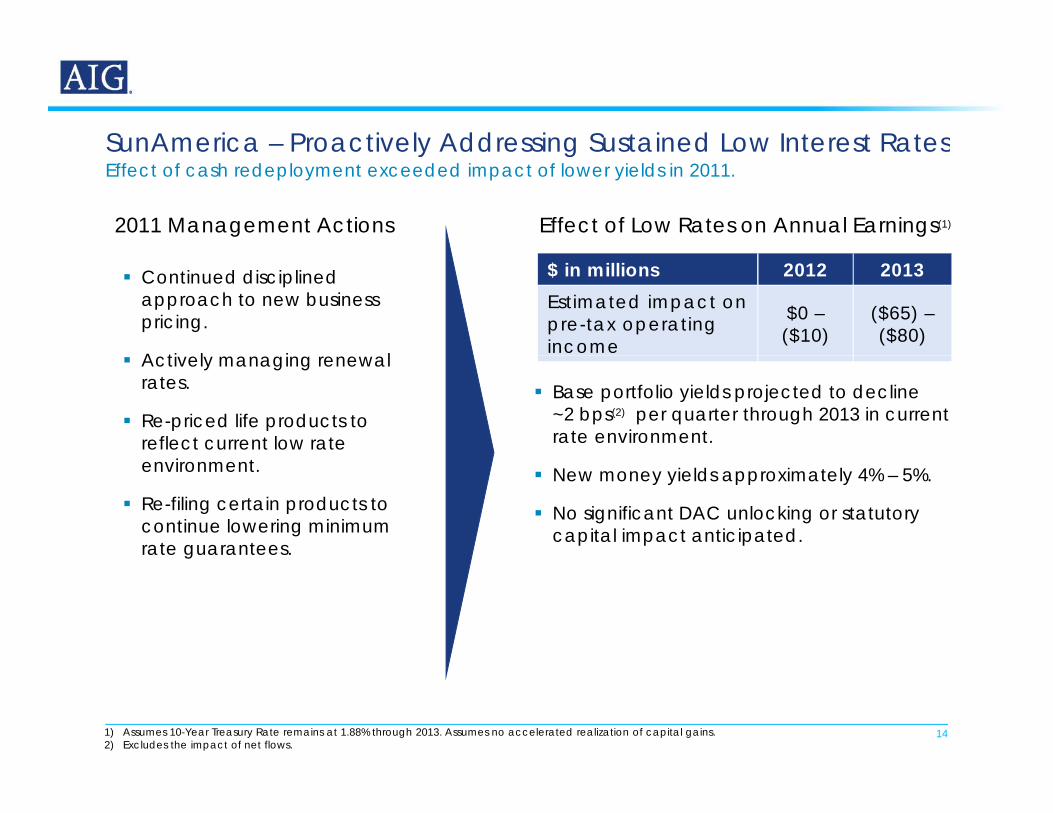
SunAmerica – Proactively Addressing Sustained Low Interest RatesEffect of cash redeployment exceeded impact of lower yields in 2011.SunAmerica Proactively Addressing Sustained Low Interest Rates
Effect of Low Rates on Annual Earnings(1)2011 Management Actions
$ in millions 2012 2013Estimated impact on pre-tax operating income
$0 –($10)
($65) –($80)
Continued disciplined approach to new business pricing.
A ti l i l Base portfolio yields projected to decline
~2 bps(2) per quarter through 2013 in current rate environment.
Actively managing renewal rates.
Re-priced life products to reflect current low rate
i New money yields approximately 4% – 5%.
No significant DAC unlocking or statutory capital impact anticipated.
environment.
Re-filing certain products to continue lowering minimum rate guarantees.
141) Assumes 10-Year Treasury Rate remains at 1.88% through 2013. Assumes no accelerated realization of capital gains.2) Excludes the impact of net flows.
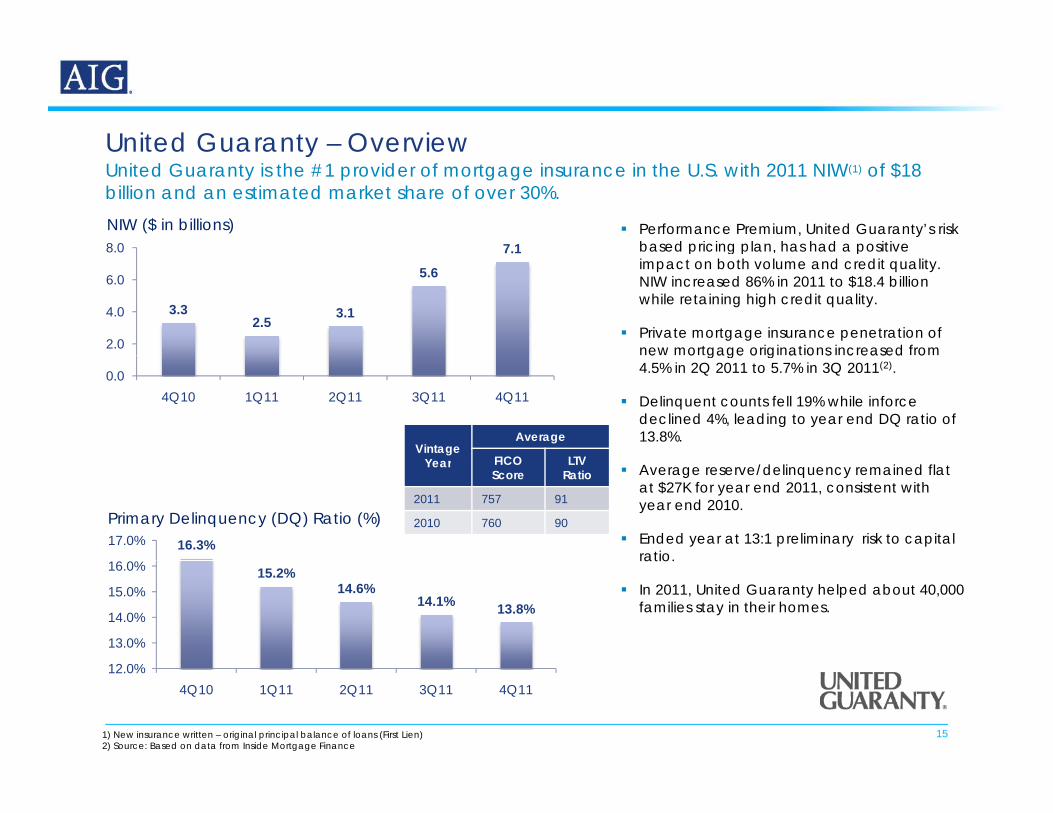
United Guaranty – OverviewUnited Guaranty OverviewUnited Guaranty is the #1 provider of mortgage insurance in the U.S. with 2011 NIW(1) of $18 billion and an estimated market share of over 30%.NIW ($ in billions)
7.18.0 Performance Premium, United Guaranty’s risk
based pricing plan, has had a positive
3.32.5
3.1
5.6
7.1
2.0
4.0
6.0
p g p pimpact on both volume and credit quality. NIW increased 86% in 2011 to $18.4 billion while retaining high credit quality.
Private mortgage insurance penetration of new mortgage originations increased from
VintageAverage
FICO LTV
0.04Q10 1Q11 2Q11 3Q11 4Q11
e o gage o g a o s c eased o 4.5% in 2Q 2011 to 5.7% in 3Q 2011(2).
Delinquent counts fell 19% while inforcedeclined 4%, leading to year end DQ ratio of 13.8%.
Year FICOScore
LTVRatio
2011 757 91
2010 760 90
16.3%17.0%Primary Delinquency (DQ) Ratio (%)
Average reserve/delinquency remained flat at $27K for year end 2011, consistent with year end 2010.
Ended year at 13:1 preliminary risk to capital ratio.
15.2%14.6%
14.1% 13.8%
13.0%
14.0%
15.0%
16.0%ratio.
In 2011, United Guaranty helped about 40,000 families stay in their homes.
151) New insurance written – original principal balance of loans (First Lien)2) Source: Based on data from Inside Mortgage Finance
12.0%4Q10 1Q11 2Q11 3Q11 4Q11
Appendix
16
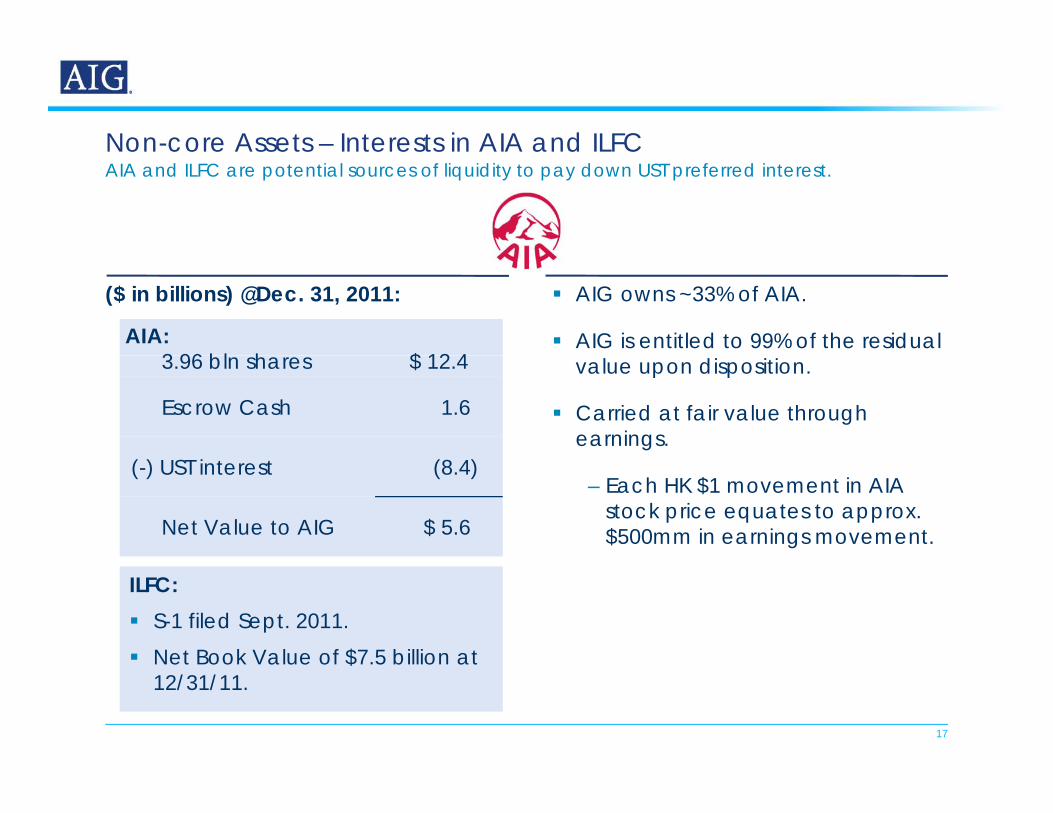
Non-core Assets – Interests in AIA and ILFCAIA and ILFC are potential sources of liquidity to pay down UST preferred interest.Non core Assets Interests in AIA and ILFC
AIG owns ~33% of AIA.
AIG is entitled to 99% of the residual
($ in billions) @Dec. 31, 2011:
AIA:3 96 bl h $ 12 4 value upon disposition.
Carried at fair value through earnings.
3.96 bln shares $ 12.4
Escrow Cash 1.6
– Each HK $1 movement in AIA stock price equates to approx. $500mm in earnings movement.
(-) UST interest (8.4)
Net Value to AIG $ 5.6
ILFC: S-1 filed Sept. 2011. Net Book Value of $7.5 billion at
17
Net Book Value of $7.5 billion at 12/31/11.
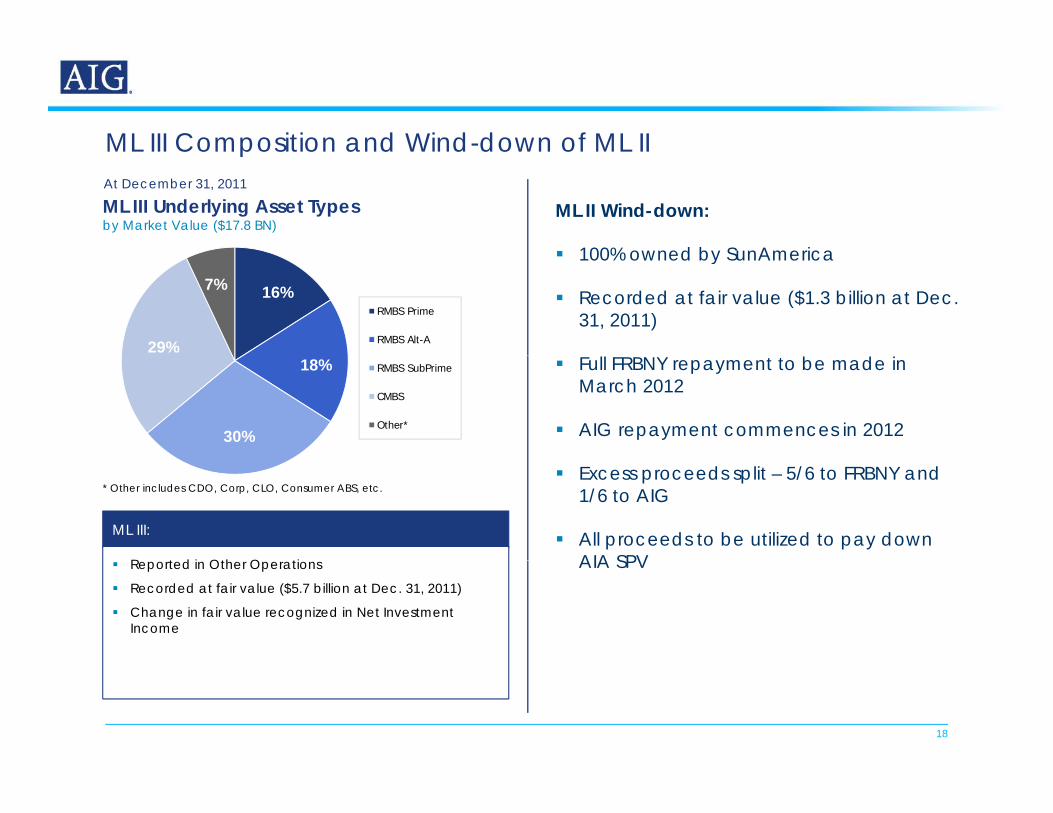
ML III Composition and Wind-down of ML IIML III Composition and Wind down of ML II
ML III Underlying Asset Types by Market Value ($17.8 BN)
At December 31, 2011
ML II Wind-down:
100% owned by SunAmerica
16%
29%
7%RMBS Prime
RMBS Alt-A
100% owned by SunAmerica
Recorded at fair value ($1.3 billion at Dec. 31, 2011)
18%
30%
RMBS SubPrime
CMBS
Other*
Full FRBNY repayment to be made in March 2012
AIG repayment commences in 2012
ML III:
R t d i Oth O ti
* Other includes CDO, Corp, CLO, Consumer ABS, etc. Excess proceeds split – 5/6 to FRBNY and
1/6 to AIG
All proceeds to be utilized to pay down AIA SPV Reported in Other Operations
Recorded at fair value ($5.7 billion at Dec. 31, 2011)
Change in fair value recognized in Net Investment Income
AIA SPV
18
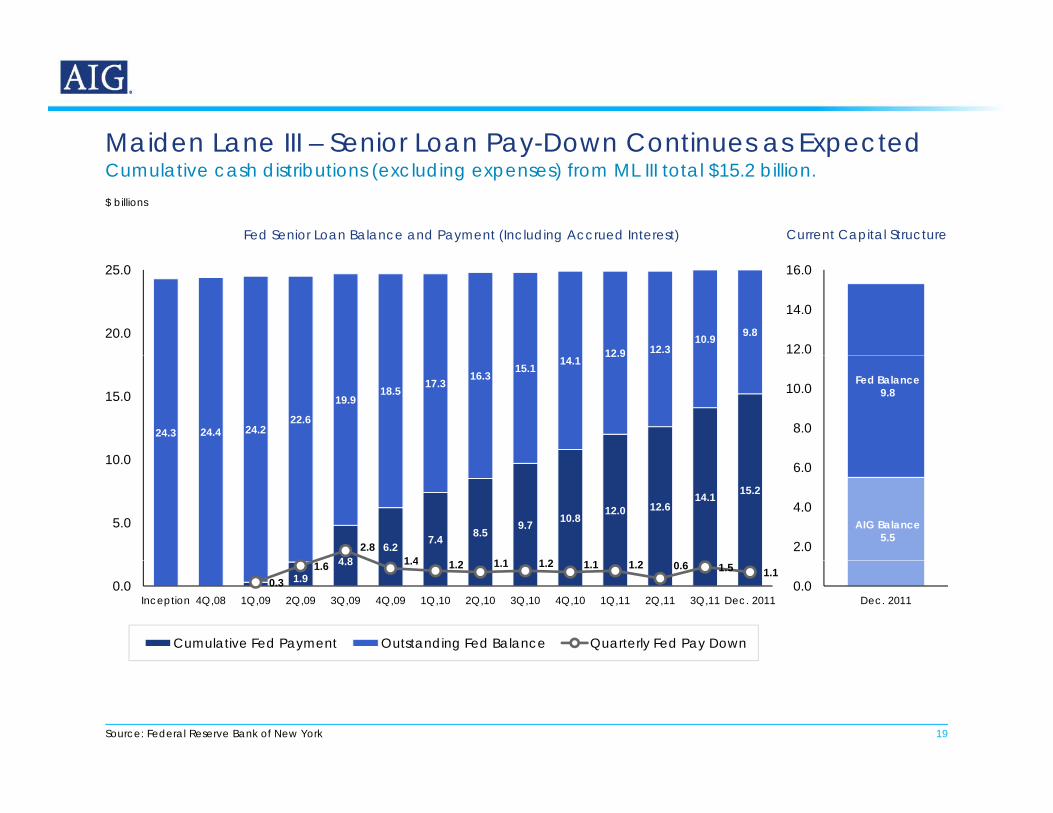
Maiden Lane III – Senior Loan Pay-Down Continues as ExpectedCumulative cash distributions (excluding expenses) from ML III total $15.2 billion.Maiden Lane III Senior Loan Pay Down Continues as Expected
$ billions
Current Capital StructureFed Senior Loan Balance and Payment (Including Accrued Interest)
12.9 12.310.9 9.820.0
25.0
12.0
14.0
16.0
24.3 24.4 24.222.6
19.918.5 17.3 16.3 15.1 14.1 12.9
10 0
15.0
8.0
10.0Fed Balance
9.8
4 86.2 7.4 8.5 9.7 10.8 12.0 12.6
14.1 15.2
2.81 4 2 1 1 1 2 2
5.0
10.0
2.0
4.0
6.0
AIG Balance5.5
1.94.8
0.31.6 1.4 1.2 1.1 1.2 1.1 1.2 0.6 1.5 1.1
0.0Inception 4Q,08 1Q,09 2Q,09 3Q,09 4Q,09 1Q,10 2Q,10 3Q,10 4Q,10 1Q,11 2Q,11 3Q,11 Dec. 2011
Cumulative Fed Payment Outstanding Fed Balance Quarterly Fed Pay Down
0.0Dec. 2011
19Source: Federal Reserve Bank of New York
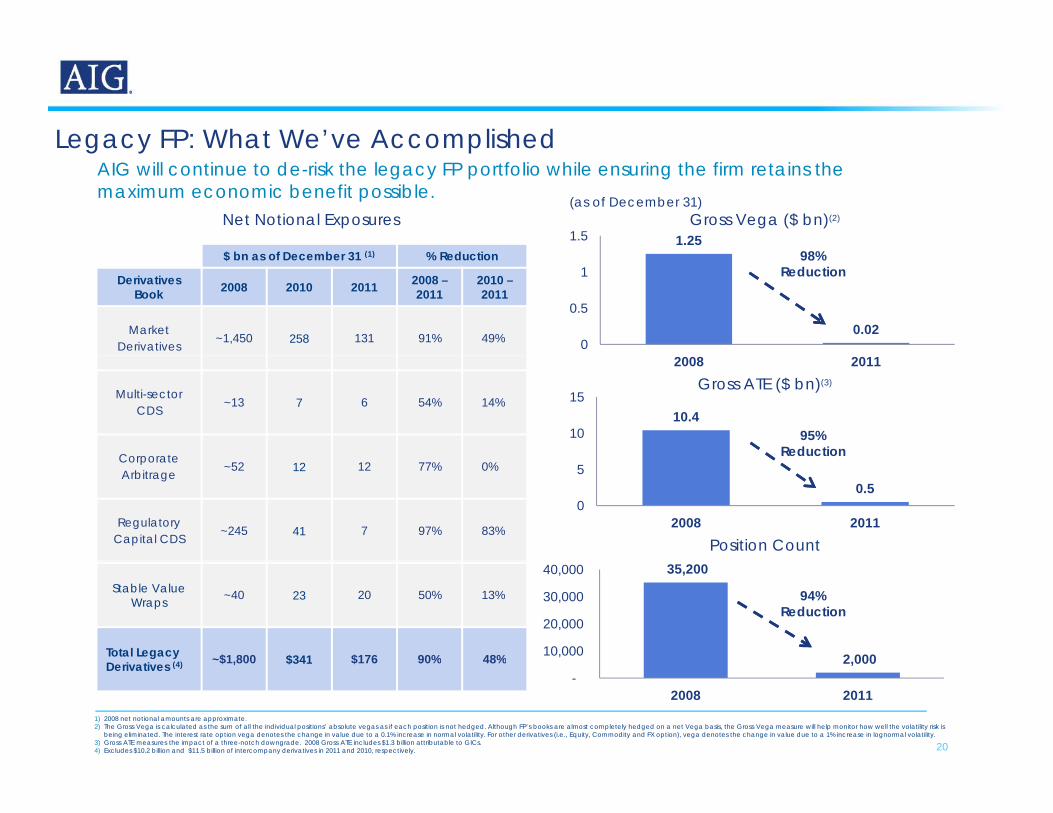
Legacy FP: What We’ve Accomplishedg y p
(1)
$ b f D b 31 (1) % R d ti
AIG will continue to de-risk the legacy FP portfolio while ensuring the firm retains the maximum economic benefit possible.
Net Notional Exposures1.251.5
98%
Gross Vega ($ bn)(2)(as of December 31)
$ bn as of December 31 (1) % Reduction
Derivatives Book 2008 2010 2011 2008 –
20112010 –2011
Market Derivatives
~1,450 258 131 91% 49%0.02
0
0.5
198%
Reduction
Multi-sector CDS
~13 7 6 54% 14%
Corporate
2008 2011
10.410
15
95% Reduction
Gross ATE ($ bn)(3)
Corporate Arbitrage
~52 12 12 77% 0%
Regulatory Capital CDS
~245 41 7 97% 83%
0.50
5
2008 2011Position Count
Stable Value Wraps ~40 23 20 50% 13%
Total Legacy D i ti (4) ~$1,800 $341 $176 90% 48%
35,200
2,000 10,000
20,000
30,000
40,000
94% Reduction
20
Derivatives (4) $1,800 $341 $176 90% 48%
1) 2008 net notional amounts are approximate. 2) The Gross Vega is calculated as the sum of all the individual positions’ absolute vegas as if each position is not hedged. Although FP’s books are almost completely hedged on a net Vega basis, the Gross Vega measure will help monitor how well the volatility risk is
being eliminated. The interest rate option vega denotes the change in value due to a 0.1% increase in normal volatility. For other derivatives (i.e., Equity, Commodity and FX option), vega denotes the change in value due to a 1% increase in lognormal volatility. 3) Gross ATE measures the impact of a three-notch downgrade. 2008 Gross ATE includes $1.3 billion attributable to GICs. 4) Excludes $10.2 billion and $11.5 billion of intercompany derivatives in 2011 and 2010, respectively.
2,000 -
2008 2011
20
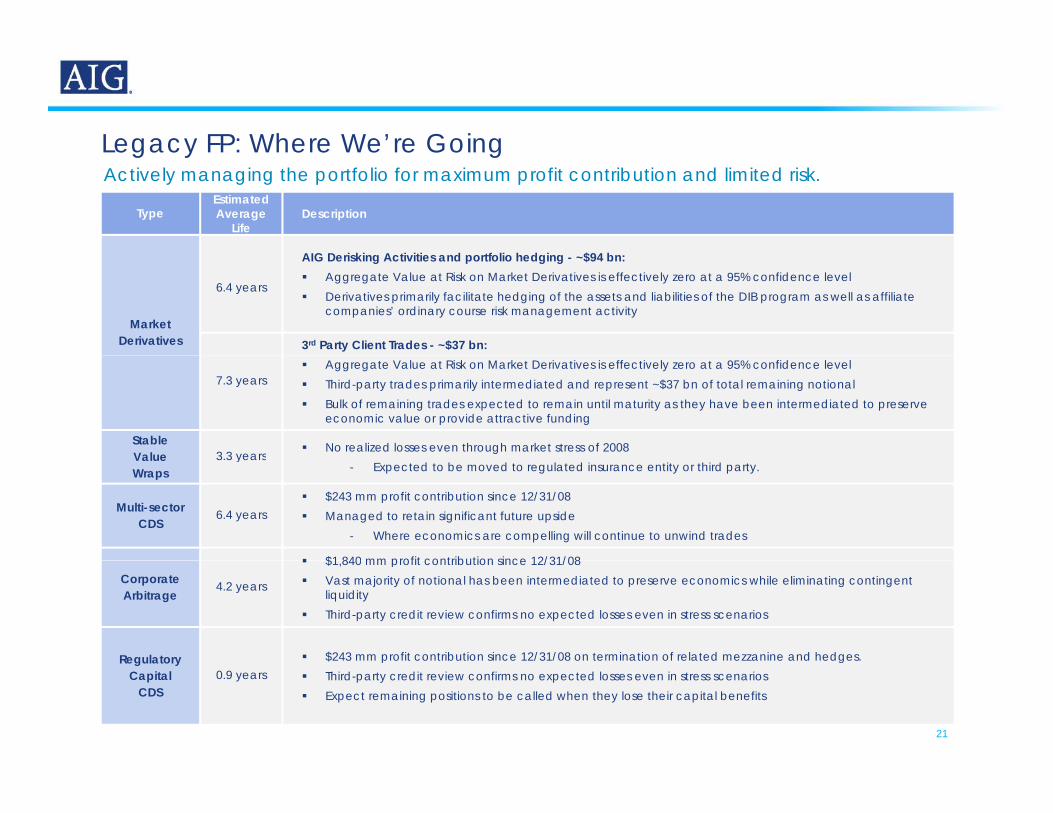
Legacy FP: Where We’re Going
(1)TypeEstimatedAverage
LifeDescription
AIG D i ki A ti iti d tf li h d i $94 b
Legacy FP: Where We re GoingActively managing the portfolio for maximum profit contribution and limited risk.
Market Derivatives
6.4 years
AIG Derisking Activities and portfolio hedging - ~$94 bn: Aggregate Value at Risk on Market Derivatives is effectively zero at a 95% confidence level Derivatives primarily facilitate hedging of the assets and liabilities of the DIB program as well as affiliate
companies’ ordinary course risk management activity
3rd Party Client Trades - ~$37 bn:
7.3 years Aggregate Value at Risk on Market Derivatives is effectively zero at a 95% confidence level Third-party trades primarily intermediated and represent ~$37 bn of total remaining notional Bulk of remaining trades expected to remain until maturity as they have been intermediated to preserve
economic value or provide attractive funding
StableValue 3 3 years
No realized losses even through market stress of 2008ValueWraps
3.3 years- Expected to be moved to regulated insurance entity or third party.
Multi-sector CDS
6.4 years $243 mm profit contribution since 12/31/08 Managed to retain significant future upside
- Where economics are compelling will continue to unwind trades
$1 840 mm profit contribution since 12/31/08Corporate Arbitrage
4.2 years
$1,840 mm profit contribution since 12/31/08 Vast majority of notional has been intermediated to preserve economics while eliminating contingent
liquidity Third-party credit review confirms no expected losses even in stress scenarios
Regulatory $243 mm profit contribution since 12/31/08 on termination of related mezzanine and hedges.
21
Regulatory Capital
CDS0.9 years Third-party credit review confirms no expected losses even in stress scenarios
Expect remaining positions to be called when they lose their capital benefits