Embed Size (px)
Citation preview

A M E R I C A N E Q U I T Y I N V E S T M E N T L I F E H O L D I N G C O M P A N Y
2 0 0 4 A N N U A L R E P O R T & F O R M 1 0 - K A
5 0 0 0 W E S T O W N P A R K W AY, S U I T E 4 4 0
W E S T D E S M O I N E S , I O W A 5 0 2 6 6
5 1 5 . 2 2 1 . 0 0 0 2 � 8 8 8 . 2 2 1 . 1 2 3 4
w w w . a m e r i c a n - e q u i t y . c o m

AMERICAN EQUITY succeeds by adhering to the guiding
principles that distinguish us in our industry. Summed up in
three words—People, Service and Future—these principles
serve as constant reminders of why we’re here and how
we work together in fulfilling our common goals.

P E O P L EPeople remain the most important asset we have. It’s our people who support the production
force and serve the client. We could not grow and succeed without their belief in the
vision, their commitment to service and their tireless efforts to achieve our business goals.
S E R V I C EGood service is a tough attribute to define. You know it when you see it and even
more when you receive it. At American Equity, we believe good service results from
understanding that our customers and our agents have many options when choosing
an annuity company. We want them to choose us, so we go the extra mile to respond
to their questions and needs. We provide them with well-designed products that
accomplish their goals. And, above all, we treat them the way we want to be treated.
It’s our culture.
F U T U R EOur business is about the future—specifically helping our customers
protect and preserve their assets for tomorrow. In focusing on the future,
we prepare for a long journey that will undoubtedly bring
challenges, test us with difficult decisions and reward our skill,
commitment and determination.
2004 2003 2002 2001 2000(dollars in thousands, except for per share data and percentages)
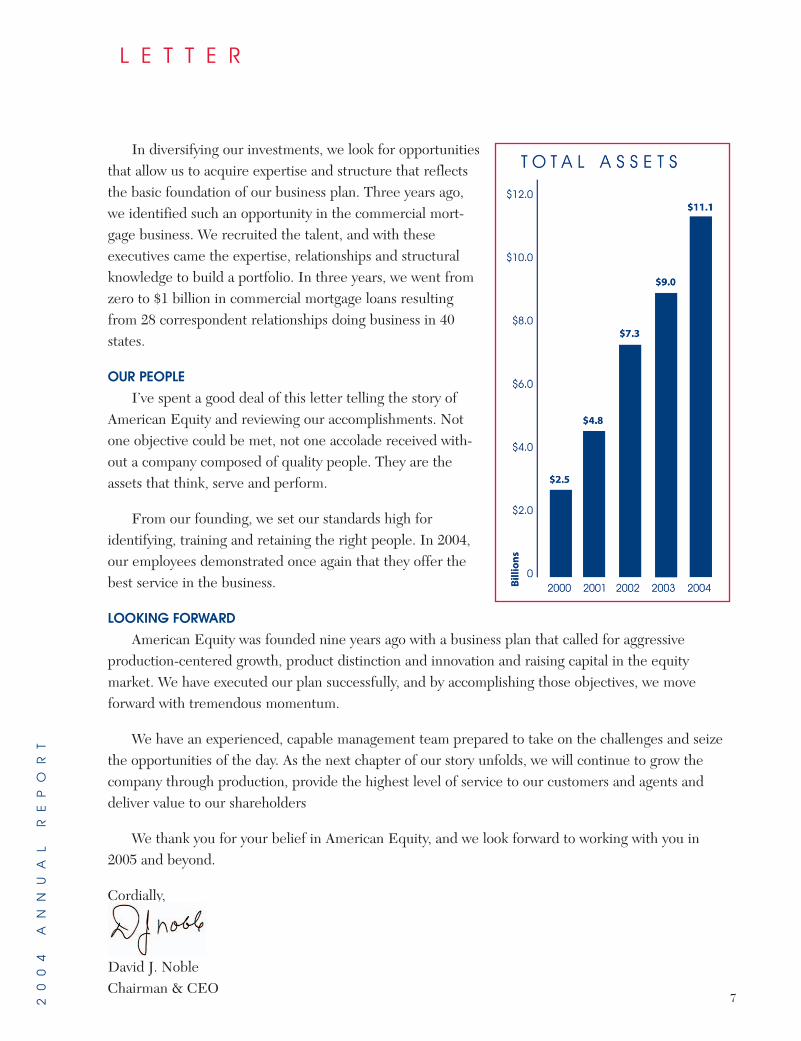
Total assets $11,114,066 $8,989,177 $7,327,789 $4,819,220 $2,528,126
Total revenues 497,142 452,138 279,713 180,376 114,615
Net income 45,284 25,440 14,207 872 4,784
Total stockholders’ equity 321,504 263,716 77,478 42,567 58,652
Book value per share1 $8.38 $7.19 $4.67 $2.24 $3.35
Return on equity2 15.5% 28.3% 23.7% 1.7% 10.3%
Number of agents 45,940 42,239 41,396 33,894 21,908
AM
ER
IC
AN
E
QU
IT
Y
2
2 0 0 4 H I G H L I G H T S
✦ T O T A L A S S E T S C L I M B E D T O $ 1 1 . 1 B I L L I O N
✦ A N N U I T Y D E P O S I T S T O T A L E D $ 2 B I L L I O N
✦ N E T I N C O M E R E A C H E D A N E W R E C O R D O F $ 4 5 . 3 M I L L I O N
✦ R A I S E D A N A D D I T I O N A L $ 4 0 0 M I L L I O N I N N E W
R E S O U R C E S F O R C O N T I N U E D G R O W T H
✦ I N C R E A S E D A G E N T R E L A T I O N S H I P S B Y 9 P E R C E N T
✦ S E L E C T E D F O R T H E R U S S E L L 3 0 0 0® I N D E X
(1) Book value per share is calculated as total stockholders’ equity less the liquidation preference of our series preferred stock dividend by the total number of shares of common stock outstanding.
(2) We define return on equity as net income divided by average total stockholders’ equity. Average total stockholders’ equity is detemined based upon the total stockholders’ equity at the beginning and the end of the year. The computation of average stockholders’ equity for 2003 has been modified to recognize the significant increase in stockholders’ equity that resulted from the receipt of the net proceeds from our initial public offering in December 2003.

I AM PLEASED TO SAY that American Equity continued to successfully execute its business plan in 2004, meeting and exceeding key benchmarks of performance including profitability, net production and agent force expansion. This performance was directly tied to ourmission to raise capital and position the company for the return to the aggressive growth called forin our business plan.
In a 13-month period that began with an initial public offering in December 2003 and concluded with a convertible debentureoffering in December 2004, American Equity raised $593 million
in capital resources and realized a 64 percent increase in net production. We attribute our accomplishments and success to
a series of 10 significant financial corporate events that validated our vision, while responsively serving the interestof our shareholders, producers, customers and employees.
Our initial public offering in late 2003 significantlyeliminated our capital constraints. However, we believed,then as now, that we owed it to our shareholders to takeadditional measures to ensure that we could grow asopportunities from the market and our production forcedictated. This led to a series of capital-raising events thatculminated in December 2004 with a $260 million offer-ing of convertible debentures.
In completing this offering, we expanded the visibilityand awareness of American Equity among institutional
investors. The offering was over-subscribed by six times at theconclusion of a one-day roadshow. More than 160 institutional
investors placed orders for the debenture. Deutsche Bank, thelead underwriter of the transaction, said this success was directlyattributable to the timing of the offering, the marketing plan andthe strength of the American Equity story.
OUR STORY AND VISION IS THEFOCAL POINT OF THIS ANNUAL REPORT
American Equity differs greatly from our peers in the industry. Many of our competitors are century-old companiesthat more than likely began their existence as mutuals.American Equity is less than 10 years old and was charteredas a stock company from day one. Our growth and business2
00
4
AN
NU
AL
R
EP
OR
T
T O O U R S H A R E H O L D E R S
D.J. Noble | CEO and Chairman
3
AM
ER
IC
AN
E
QU
IT
Y
4
plan center on building American Equity through production rather than acquisitions. While we canappreciate what others might see in acquisitions, we believe firmly in our production facilities to gen-erate new business at high levels.
Our viewpoint is straightforward: Every dollar invested in an acquisition carries a cost for the purchase price, not to mention the hidden costs of protecting asset quality, ensuring product designintegrity and accounting for deferred acquisition costs. Investing in our systems, our people and ourproducts is money ahead, and we believe it’s a more sound philosophy for generating a competitivereturn for our shareholders.
Operationally, American Equity is a more efficient company than our competitors. We’re able to respond morequickly to changes, get to the market faster with new products and provide a higher level of service to meet theneeds of our producers and our customers.
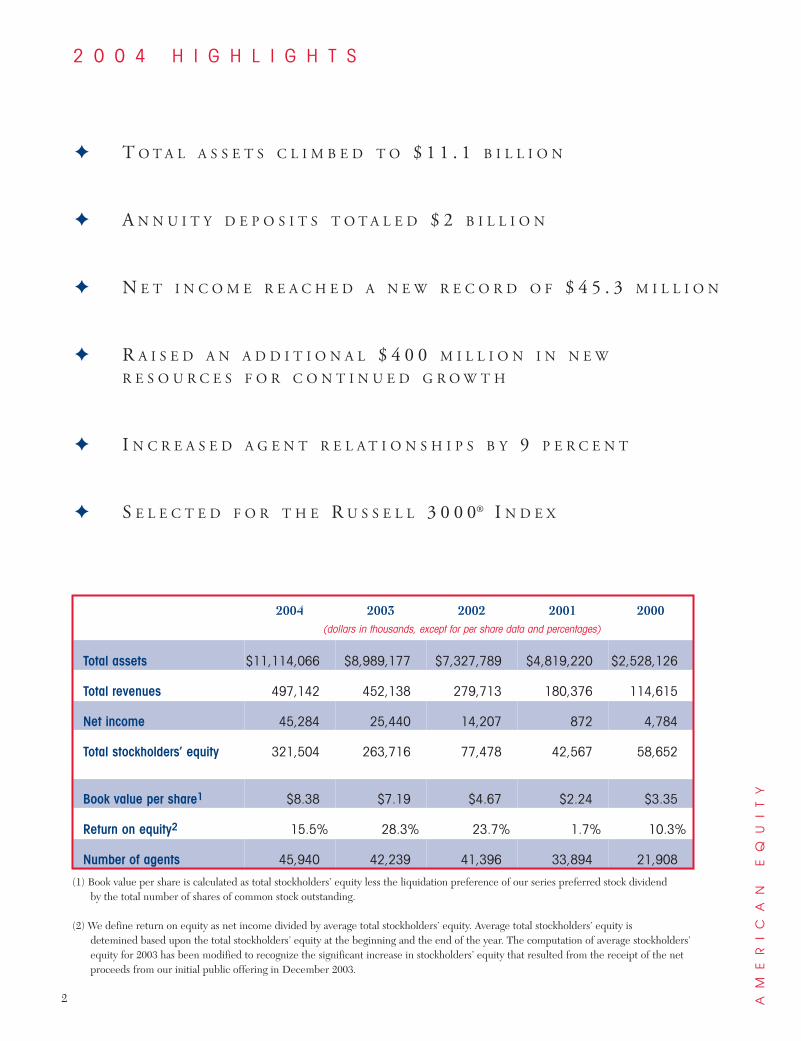
RECORD YEAR FOR INCOME AND REVENUES
Our production goal for 2004 was nothing less thanaggressive. With the completion of our IPO, we expected to receive a rating increase. The rating agencies took theposition, however, that we should execute our business planfor a period of time under the same rating. Though disap-pointed, we moved forward. In doing so, we set a newrecord for net production. Total annuity deposits for the yearwere $2 billion, slightly ahead of our final business plan. Netproduction provides a better indication of our progress, andit reached a record high of $1.8 billion, an increase of 64 per-cent from 2003 and 11 percent more than the previousrecord set in 2002.
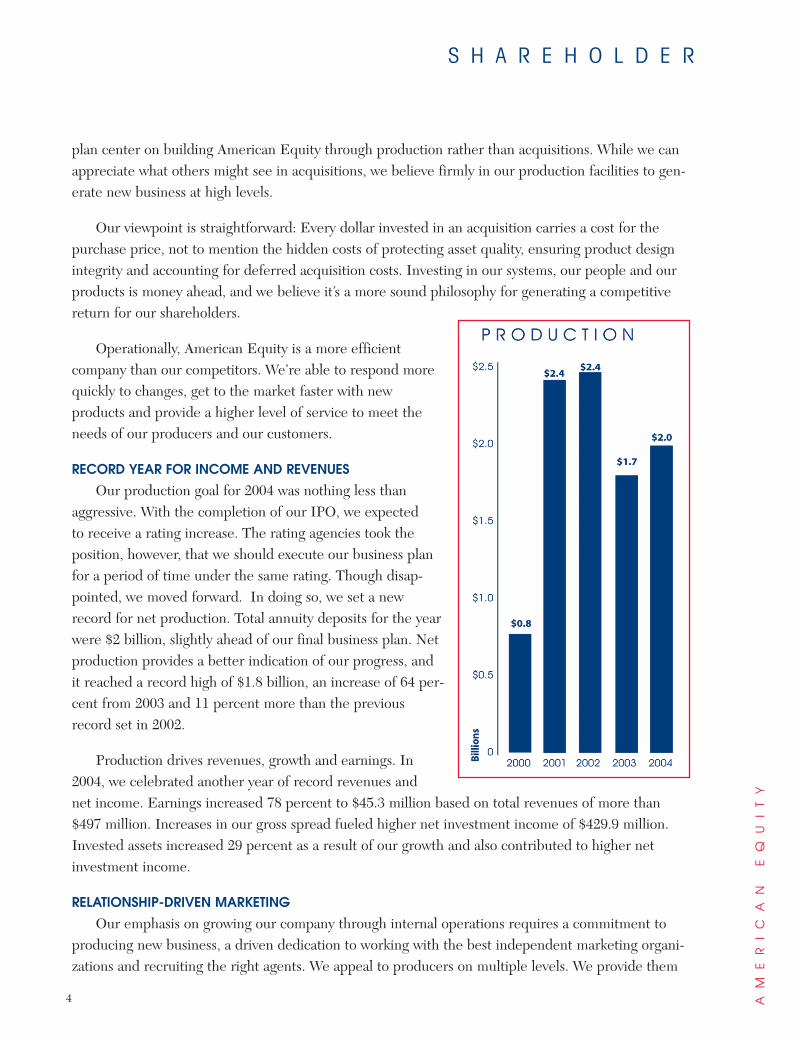
Production drives revenues, growth and earnings. In2004, we celebrated another year of record revenues and net income. Earnings increased 78 percent to $45.3 million based on total revenues of more than $497 million. Increases in our gross spread fueled higher net investment income of $429.9 million.Invested assets increased 29 percent as a result of our growth and also contributed to higher netinvestment income.
RELATIONSHIP-DRIVEN MARKETING
Our emphasis on growing our company through internal operations requires a commitment toproducing new business, a driven dedication to working with the best independent marketing organi-zations and recruiting the right agents. We appeal to producers on multiple levels. We provide them
S H A R E H O L D E R
20
04
A
NN
UA
L
RE
PO
RT
with service, attention and appreciation that earns us top grades in third-party evaluations of ourservice. We process applications in a timely fashion and always keep the agent involved in the communication process. We pay commissions within a week or less after underwriting. And, we provide producers with effective product training and a product line that truly assists their clients inprotecting assets and generating a predictable income stream.
We understand that agents have a choice of what products they sell and with whom they dobusiness. We believe that we must earn their business again and again with consistent and personal-ized service that provides them with value that they can in turn pass on to their clients.
At the same time, we continually review our produc-tion force to ensure that our agents are motivated, engagedand performing. During 2004, our production force grewto 45,940 agents, a 9 percent net increase from 2003. Inreality, this growth reflects an even higher level of agentrecruitment as a certain percentage of agent relationshipsterminate. The result is an agency force that is more quali-fied, prepared and committed to achieving the same goalsas American Equity.
We believe in the power of relationship-driven market-ing. Of course, the key word is “relationship.” That meansseeing our agents on a regular basis for education, producttraining and networking.
While personalized service and our responsive process-ing turnaround continues to be a staple of our agentrecruitment and marketing, our product line remains thekey ingredient in our formula for success. At AmericanEquity, we’ve been a significant player in the indexedannuity market since our beginning. We have rankedconsistently among the Top 4 for production for the past
five years and, in fact, our management team is one of the most experienced in the industry in thedesign and development of indexed annuities. We developed and launched the very first indexedannuity tied to the Dow Jones. In recent years, we have developed top-of-the-line multi-strategyproducts. These products allow customers to allocate their annuity deposits among different incomecrediting strategies. Crediting strategies offered include fixed-rate income streams as well as returnsbased on the performance of equity and bond indexes.
Because we’re committed to this business for the long haul, we never take a “me too” approachto product development. Instead, we carefully analyze trends and features for how they will impact
5
L E T T E R
AM
ER
IC
AN
E
QU
IT
Y
6
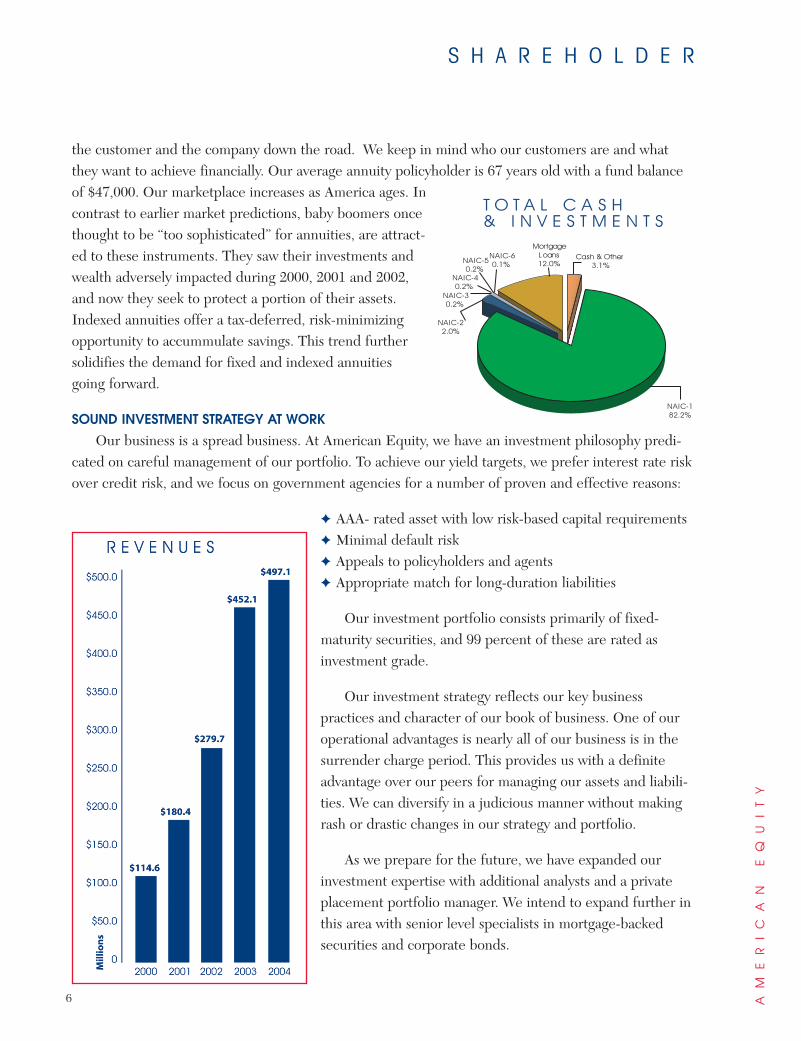
the customer and the company down the road. We keep in mind who our customers are and whatthey want to achieve financially. Our average annuity policyholder is 67 years old with a fund balanceof $47,000. Our marketplace increases as America ages. Incontrast to earlier market predictions, baby boomers oncethought to be “too sophisticated” for annuities, are attract-ed to these instruments. They saw their investments andwealth adversely impacted during 2000, 2001 and 2002,and now they seek to protect a portion of their assets.Indexed annuities offer a tax-deferred, risk-minimizingopportunity to accummulate savings. This trend furthersolidifies the demand for fixed and indexed annuitiesgoing forward.
SOUND INVESTMENT STRATEGY AT WORK
Our business is a spread business. At American Equity, we have an investment philosophy predi-cated on careful management of our portfolio. To achieve our yield targets, we prefer interest rate riskover credit risk, and we focus on government agencies for a number of proven and effective reasons:
✦ AAA- rated asset with low risk-based capital requirements✦ Minimal default risk✦ Appeals to policyholders and agents✦ Appropriate match for long-duration liabilities
Our investment portfolio consists primarily of fixed-maturity securities, and 99 percent of these are rated asinvestment grade.
Our investment strategy reflects our key business practices and character of our book of business. One of ouroperational advantages is nearly all of our business is in thesurrender charge period. This provides us with a definiteadvantage over our peers for managing our assets and liabili-ties. We can diversify in a judicious manner without makingrash or drastic changes in our strategy and portfolio.
As we prepare for the future, we have expanded ourinvestment expertise with additional analysts and a privateplacement portfolio manager. We intend to expand further inthis area with senior level specialists in mortgage-backedsecurities and corporate bonds.
S H A R E H O L D E R
In diversifying our investments, we look for opportunitiesthat allow us to acquire expertise and structure that reflectsthe basic foundation of our business plan. Three years ago,we identified such an opportunity in the commercial mort-gage business. We recruited the talent, and with these executives came the expertise, relationships and structuralknowledge to build a portfolio. In three years, we went fromzero to $1 billion in commercial mortgage loans resultingfrom 28 correspondent relationships doing business in 40states.
OUR PEOPLE
I’ve spent a good deal of this letter telling the story ofAmerican Equity and reviewing our accomplishments. Notone objective could be met, not one accolade received with-out a company composed of quality people. They are theassets that think, serve and perform.
From our founding, we set our standards high for identifying, training and retaining the right people. In 2004,our employees demonstrated once again that they offer thebest service in the business.
LOOKING FORWARD
American Equity was founded nine years ago with a business plan that called for aggressive production-centered growth, product distinction and innovation and raising capital in the equity market. We have executed our plan successfully, and by accomplishing those objectives, we move forward with tremendous momentum.
We have an experienced, capable management team prepared to take on the challenges and seizethe opportunities of the day. As the next chapter of our story unfolds, we will continue to grow thecompany through production, provide the highest level of service to our customers and agents anddeliver value to our shareholders
We thank you for your belief in American Equity, and we look forward to working with you in2005 and beyond.
Cordially,
David J. NobleChairman & CEO
20
04
A
NN
UA
L
RE
PO
RT
7
L E T T E R

8
John M. MatovinaVice Chairman
Ben T. MorrisCEO and Director of Sanders MorrisHarris Group
Harley A. Whitfield, Sr.Of Counsel, Whitfield& Eddy, P.L.C.
David S. MulcahyPrivate Investor andChairman andOwner, MonarchHoldings, Inc.
John C. AndersonDoctor ofChiropracticMedicine
A M E R I C A N E Q U I T Y

9
B O A R D O F D I R E C T O R S
James M. GerlachExecutive VicePresident
D. J. Noble Chairman of theBoard, President andTreasurer
A.J. Strickland, IIIProfessor of StrategicManagement at theUniversity of Alabama
Kevin R. Wingert President of LifeCompany
Robert L. HiltonInsurance Consultant

AM
ER
IC
AN
E
QU
IT
Y
10
SHAREHOLDER INFORMATIONTo learn more about American Equity Investment Life Holding Company you can request news releases, annual reports, financial supplements and Forms 10-K and 10-Q by contacting:
Debra J. Richardson, Sr. Vice President and Secretary American Equity Investment Life Holding Company5000 Westown Parkway, Suite 440West Des Moines, IA 50266 (515) 273-3551, Fax (515) 221-9989 email: [email protected]
WEB SITEAmerican Equity's web site, www.american-equity.com, is continuously updated and includes news releases, conference calls, stock price information, quarterly reports, SEC filings, management presentations and more.
CORPORATE HEADQUARTERSAmerican Equity Investment Life Holding Company5000 Westown Parkway, Suite 440West Des Moines, IA 50266(515) 221-0002 www.american-equity.com
ANNUAL MEETING OF SHAREHOLDERSThursday, June 9, 20053:30 p.m. Central TimeAmerican Equity Investment Life Holding Company Headquarters
STOCK TRANSFER AND REGISTRAREquiServe Trust Company, N.A.PO Box 43010Providence, RI 02940-3010Telephone: (877) 282-1169www.equiserve.com
S H A R E H O L D E R I N F O R M A T I O N
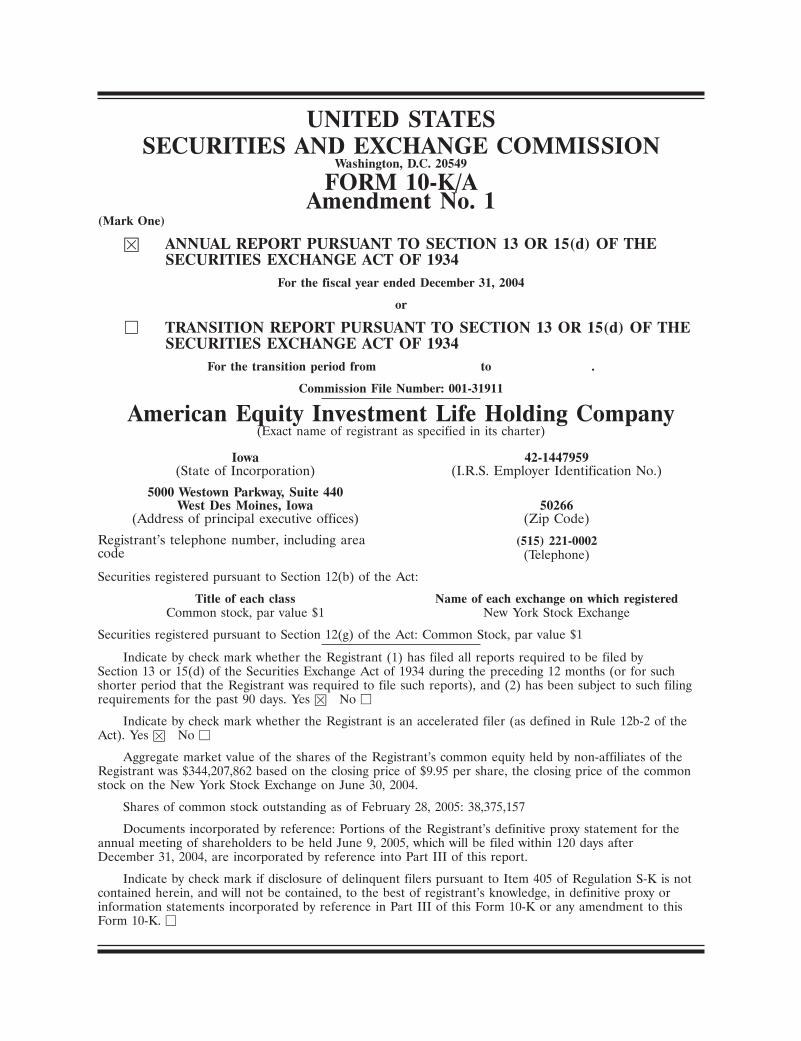
UNITED STATESSECURITIES AND EXCHANGE COMMISSION
Washington, D.C. 20549
FORM 10-K/AAmendment No. 1
(Mark One)
� ANNUAL REPORT PURSUANT TO SECTION 13 OR 15(d) OF THESECURITIES EXCHANGE ACT OF 1934
For the fiscal year ended December 31, 2004
or
� TRANSITION REPORT PURSUANT TO SECTION 13 OR 15(d) OF THESECURITIES EXCHANGE ACT OF 1934
For the transition period from to .
Commission File Number: 001-31911
American Equity Investment Life Holding Company(Exact name of registrant as specified in its charter)
Iowa 42-1447959(State of Incorporation) (I.R.S. Employer Identification No.)
5000 Westown Parkway, Suite 440West Des Moines, Iowa 50266
(Address of principal executive offices) (Zip Code)
Registrant’s telephone number, including area (515) 221-0002code (Telephone)
Securities registered pursuant to Section 12(b) of the Act:
Title of each class Name of each exchange on which registeredCommon stock, par value $1 New York Stock Exchange
Securities registered pursuant to Section 12(g) of the Act: Common Stock, par value $1
Indicate by check mark whether the Registrant (1) has filed all reports required to be filed bySection 13 or 15(d) of the Securities Exchange Act of 1934 during the preceding 12 months (or for suchshorter period that the Registrant was required to file such reports), and (2) has been subject to such filingrequirements for the past 90 days. Yes � No �
Indicate by check mark whether the Registrant is an accelerated filer (as defined in Rule 12b-2 of theAct). Yes � No �
Aggregate market value of the shares of the Registrant’s common equity held by non-affiliates of theRegistrant was $344,207,862 based on the closing price of $9.95 per share, the closing price of the commonstock on the New York Stock Exchange on June 30, 2004.
Shares of common stock outstanding as of February 28, 2005: 38,375,157
Documents incorporated by reference: Portions of the Registrant’s definitive proxy statement for theannual meeting of shareholders to be held June 9, 2005, which will be filed within 120 days afterDecember 31, 2004, are incorporated by reference into Part III of this report.
Indicate by check mark if disclosure of delinquent filers pursuant to Item 405 of Regulation S-K is notcontained herein, and will not be contained, to the best of registrant’s knowledge, in definitive proxy orinformation statements incorporated by reference in Part III of this Form 10-K or any amendment to thisForm 10-K. �
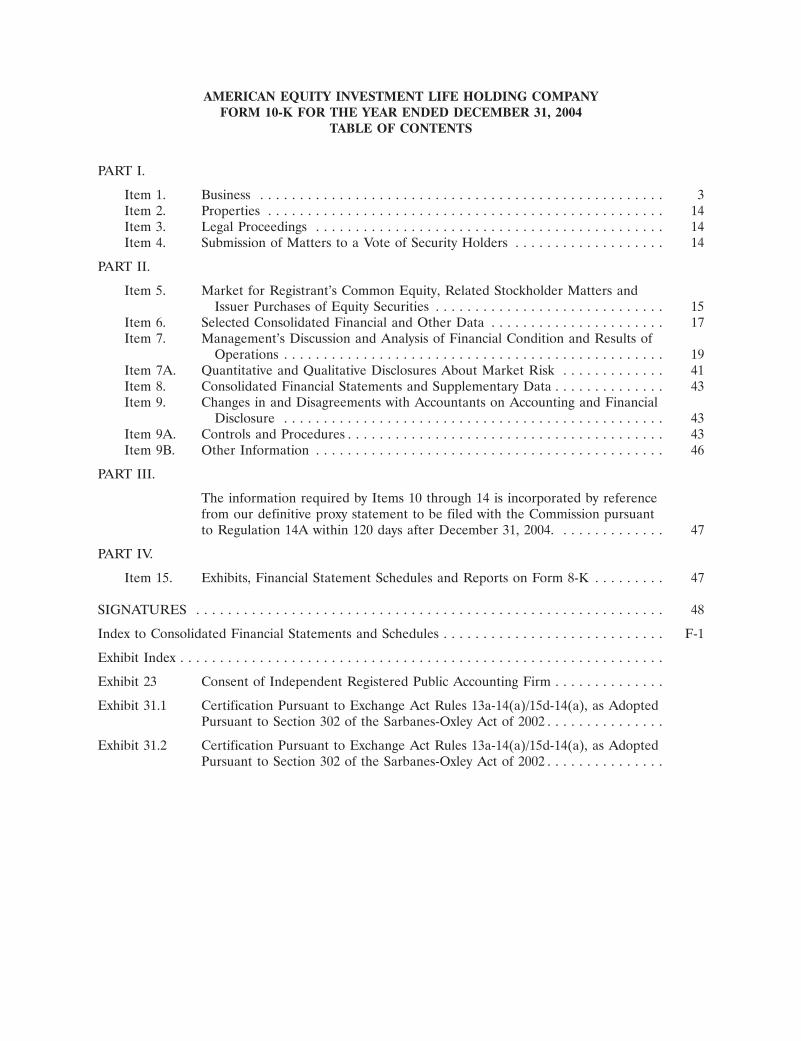
AMERICAN EQUITY INVESTMENT LIFE HOLDING COMPANYFORM 10-K FOR THE YEAR ENDED DECEMBER 31, 2004
TABLE OF CONTENTS
PART I.
Item 1. Business . . . . . . . . . . . . . . . . . . . . . . . . . . . . . . . . . . . . . . . . . . . . . . . . . . . 3Item 2. Properties . . . . . . . . . . . . . . . . . . . . . . . . . . . . . . . . . . . . . . . . . . . . . . . . . . 14Item 3. Legal Proceedings . . . . . . . . . . . . . . . . . . . . . . . . . . . . . . . . . . . . . . . . . . . . 14Item 4. Submission of Matters to a Vote of Security Holders . . . . . . . . . . . . . . . . . . . 14
PART II.
Item 5. Market for Registrant’s Common Equity, Related Stockholder Matters andIssuer Purchases of Equity Securities . . . . . . . . . . . . . . . . . . . . . . . . . . . . . 15
Item 6. Selected Consolidated Financial and Other Data . . . . . . . . . . . . . . . . . . . . . . 17Item 7. Management’s Discussion and Analysis of Financial Condition and Results of
Operations . . . . . . . . . . . . . . . . . . . . . . . . . . . . . . . . . . . . . . . . . . . . . . . . 19Item 7A. Quantitative and Qualitative Disclosures About Market Risk . . . . . . . . . . . . . 41Item 8. Consolidated Financial Statements and Supplementary Data . . . . . . . . . . . . . . 43Item 9. Changes in and Disagreements with Accountants on Accounting and Financial
Disclosure . . . . . . . . . . . . . . . . . . . . . . . . . . . . . . . . . . . . . . . . . . . . . . . . 43Item 9A. Controls and Procedures . . . . . . . . . . . . . . . . . . . . . . . . . . . . . . . . . . . . . . . . 43Item 9B. Other Information . . . . . . . . . . . . . . . . . . . . . . . . . . . . . . . . . . . . . . . . . . . . 46
PART III.
The information required by Items 10 through 14 is incorporated by referencefrom our definitive proxy statement to be filed with the Commission pursuantto Regulation 14A within 120 days after December 31, 2004. . . . . . . . . . . . . . 47
PART IV.
Item 15. Exhibits, Financial Statement Schedules and Reports on Form 8-K . . . . . . . . . 47
SIGNATURES . . . . . . . . . . . . . . . . . . . . . . . . . . . . . . . . . . . . . . . . . . . . . . . . . . . . . . . . . . . 48
Index to Consolidated Financial Statements and Schedules . . . . . . . . . . . . . . . . . . . . . . . . . . . . F-1
Exhibit Index . . . . . . . . . . . . . . . . . . . . . . . . . . . . . . . . . . . . . . . . . . . . . . . . . . . . . . . . . . . . .
Exhibit 23 Consent of Independent Registered Public Accounting Firm . . . . . . . . . . . . . .
Exhibit 31.1 Certification Pursuant to Exchange Act Rules 13a-14(a)/15d-14(a), as AdoptedPursuant to Section 302 of the Sarbanes-Oxley Act of 2002 . . . . . . . . . . . . . . .
Exhibit 31.2 Certification Pursuant to Exchange Act Rules 13a-14(a)/15d-14(a), as AdoptedPursuant to Section 302 of the Sarbanes-Oxley Act of 2002 . . . . . . . . . . . . . . .
EXPLANATORY NOTE
This Amendment No. 1 on Form 10-K/A is being filed with respect to our Annual Report onForm 10-K for the fiscal year ended December 31, 2004, filed with the Securities and ExchangeCommission on March 14, 2005. This Amendment No. 1 includes ‘‘Management’s Annual Report onInternal Control over Financial Reporting’’ required by Item 308(a) of Regulation S-K and the related‘‘Attestation Report of our Independent Registered Public Accounting Firm’’ required by Item 308(b)of Regulation S-K. This Amendment No. 1 does not contain updates to reflect any events occurringafter the original March 14, 2005 filing of our Annual Report on Form 10-K for the fiscal year endedDecember 31, 2004. All information contained in this Amendment No. 1 is subject to updating andsupplementing as provided in our reports filed with the Securities and Exchange Commission, as maybe amended, for periods subsequent to the date of the original filing of the Annual Report onForm 10-K.
PART I
ITEM 1. BUSINESS
Introduction
We were formed on December 15, 1995 to develop, market, issue and administer annuities and lifeinsurance. We are a full service underwriter of a broad array of annuity and insurance products. Ourbusiness consists primarily of the sale of fixed rate and index annuities and, accordingly, we have onlyone business segment. Our business strategy is to focus on our annuity business and earn predicablereturns by managing investment spreads and investment risk. We are currently licensed to sell ourproducts in 48 states and the District of Columbia.
On December 9, 2003, we completed an initial public offering of 18,700,000 shares of our commonstock at a price of $9.00 per share. Pursuant to the over-allotment option granted to the underwritersin the offering, the underwriters purchased an additional 2,000,000 shares on December 29, 2003 andan additional 805,000 shares on January 7, 2004, which fully exercised the over-allotment option. Theproceeds from our initial public offering (including proceeds from shares issued pursuant to theover-allotment option), net of the underwriting discount and expenses, were approximately$178.0 million.
Investor related information, including periodic reports filed on Forms 10-K, 10-Q and 8-K and allamendments to such reports may be found on our internet website at www.american-equity.com assoon as reasonably practicable after such reports are filed with the SEC. In addition, the Company hasavailable on its website its: (i) code of business conduct and ethics; (ii) audit committee charter;(iii) compensation committee charter; (iv) nominating/corporate governance committee charter and(v) corporate governance guidelines.
Annuity Market Overview
Our target market includes the group of individuals ages 45-75 who are seeking to accumulatetax-deferred savings. We believe that significant growth opportunities exist for annuity products becauseof favorable demographic and economic trends. According to the U.S. Census Bureau, there were35 million Americans age 65 and older in 2000, representing 12% of the U.S. population. By 2030, thissector of the population is expected to increase to 20% of the total population. Our fixed rate andindex annuity products are particularly attractive to this group as a result of the guarantee of principalwith respect to those products, competitive rates of credited interest, tax-deferred growth andalternative payout options.
According to LIMRA International, total industry sales of individual annuities were $224.4 billionin 2004 and $218.8 billion in 2003. Fixed annuity sales, which include index and fixed rate annuities
Page 3 of 48
were $90.9 billion in 2004 and $89.4 billion in 2003. Sales of index annuities increased 69% to a record$24.3 billion in 2004 from $14.4 billion in 2003. We believe index annuities, which have a crediting ratelinked to the change in various indices, appeal to policyholders interested in participating in returnslinked to equity and/or bond markets without the risk of loss of principal. Our wide range of fixed rateannuity products has enabled us to enjoy favorable growth during volatile equity and bond markets.
Strategy
Our business strategy is to focus on our annuity business and earn predictable returns by managinginvestment spreads and investment risk. Key elements of this strategy include the following:
Expand our Current Independent Agency Network. We believe that our successful relationshipswith approximately 70 national marketing organizations and, through them, 46,000 independentagents, represent a significant competitive advantage. We intend to grow and enhance our coredistribution channel by expanding our relationships with national marketing organizations andindependent agents, by addressing their product needs and by providing the highest quality servicepossible.
Continue to Introduce Innovative and Competitive Products. We intend to be at the forefront ofthe fixed and index annuity industry in developing and introducing innovative and new competitiveproducts. We were the first company to introduce an index annuity which allowed policyholders toearn returns linked to the Dow Jones Indexsm. We were also one of the first companies to offer anindex product offering a choice among interest crediting strategies which includes both equity andbond indices as well as a traditional fixed rate strategy. We believe that our continued focus onanticipating and being responsive to the product needs of our independent agents andpolicyholders will lead to increased customer loyalty, revenues and profitability.
Use our Expertise to Achieve Targeted Spreads on Annuity Products. We have had a successfultrack record in achieving the targeted spreads on our annuity products. We intend to leverage ourexperience and expertise in managing the investment spread during a range of interest rateenvironments to achieve our targeted spreads.
Maintain our Profitability Focus and Improve Operating Efficiency. We are committed toimproving our profitability by advancing the scope and sophistication of our investmentmanagement and spread capabilities and continuously seeking out operating efficiencies within ourcompany. We have made substantial investments in technology improvements to our business,including the development of a password-secure website which allows our independent agents toreceive proprietary sales, marketing and product materials and the implementation of softwaredesigned to enable us to operate in a completely paperless environment with respect to policyadministration. Further, we have implemented competitive incentive programs for our nationalmarketing organizations, agents and employees to stimulate performance.
Take Advantage of the Growing Popularity of Some of Our Products. We believe that thegrowing popularity of some of our products that allow equity and bond market participationwithout the risk of loss of the premium deposit presents an attractive opportunity to grow ourbusiness. We intend to capitalize on our reputation as a leading marketer of index annuities in thisexpanding segment of the annuity market.
Products
Our products include fixed rate annuities, index annuities, a variable annuity and life insurance.
Page 4 of 48
Fixed Rate Annuities
These products, which accounted for approximately 16% and 36% of our total annuity depositscollected for the years ended December 31, 2004 and 2003, respectively, include single premiumdeferred annuities (‘‘SPDAs’’), flexible premium deferred annuities (‘‘FPDAs’’) and single premiumimmediate annuities (‘‘SPIAs’’). An SPDA generally involves the tax-deferred accumulation of intereston a single premium paid by the policyholder. After a number of years, as specified in the annuitycontract, the annuitant may elect to take the proceeds of the annuity either in a single payment or in aseries of payments for life, for a fixed number of years, or for a combination of these payment options.We also sell SPDAs, under which the annual crediting rate is guaranteed for either a three-year or afive-year period. FDPAs are similar to SPDAs in many respects, except that the FPDA allows additionaldeposits in varying amounts by the policyholder without a new application.
Our SPDAs and FPDAs (excluding the multi-year rate guaranteed products) generally have aninterest rate (the ‘‘crediting rate’’) that is guaranteed by us for the first policy year. After the firstpolicy year, we have the discretionary ability to change the crediting rate once annually to any rate ator above a guaranteed minimum rate. The guaranteed rate on our non-multi-year rate guaranteedpolicies in force and new issues ranges from 2.25% to 4.00%. The guaranteed rate on our multi-yearrate guaranteed policies in force ranges from 3.05% to 4.80% for the three-year rate guaranteedproduct and from 3.25% to 7% for the five-year rate guaranteed product. The initial crediting rate islargely a function of the interest rate we can earn on invested assets acquired with new annuity depositsand the rates offered on similar products by our competitors. For subsequent adjustments to creditingrates, we take into account the yield on our investment portfolio, annuity surrender assumptions,competitive industry pricing and crediting rate history for particular groups of annuity policies withsimilar characteristics.
Approximately 99% and 92% of our fixed rate annuity sales during the years ended December 31,2004 and 2003, respectively, were ‘‘bonus’’ products. The initial crediting rate on these productsspecifies a bonus crediting rate ranging from 1% to 7% of the annuity deposit. After the first year, thebonus interest portion of the initial crediting rate is automatically discontinued, and the renewalcrediting rate is established. Generally, there is a compensating adjustment in the commission paid tothe agent to offset the first year interest bonus. In all situations, we obtain an acknowledgment fromthe policyholder, upon policy issuance, that a specified portion of the first year interest will not be paidin renewal years. As of December 31, 2004, crediting rates on our outstanding SPDAs and FPDAsgenerally ranged from 3.10% to 7.50%, excluding interest bonuses guaranteed for the first year. Theaverage crediting rate on FPDAs and SPDAs including interest bonuses at December 31, 2004 was4.42%, and the average crediting rate on those products excluding bonuses was 4.18%.
Policyholders are typically permitted to withdraw all or a part of the premium paid, plus accruedinterest credited to the account (the ‘‘accumulation value’’), subject to the assessment of a surrendercharge for withdrawals in excess of specified limits. Most of our SPDAs and FPDAs provide forpenalty-free withdrawals of up to 10% of the accumulation value each year after the first year, subjectto limitations. Withdrawals in excess of allowable penalty-free amounts are assessed a surrender chargeduring a penalty period which generally ranges from 3 to 15 years after the date the policy is issued.This surrender charge is initially 8.25% to 25% of the accumulation value and generally decreases byapproximately one to two percentage points per year during the surrender charge period. Surrendercharges are set at levels aimed at protecting us from loss on early terminations and reducing thelikelihood of policyholders terminating their policies during periods of increasing interest rates. Thispractice lengthens the effective duration of the policy liabilities and enhances our ability to maintainprofitability on such policies.
Our SPIAs are designed to provide a series of periodic payments for a fixed period of time or forlife, according to the policyholder’s choice at the time of issue. The amounts, frequency, and length of
Page 5 of 48
time of the payments are fixed at the outset of the annuity contract. SPIAs are often purchased bypersons at or near retirement age who desire a steady stream of payments over a future period ofyears. The implicit interest rate on SPIAs is based on market conditions when the policy is issued. Theimplicit interest rate on our outstanding SPIAs averaged 3.83% and 4.25% at December 31, 2004 and2003, respectively.
Index Annuities
Index annuities accounted for approximately 84% and 64% of the total annuity deposits collectedfor the years ended December 31, 2004 and 2003, respectively. These products allow policyholders tolink returns to the performance of a particular index without the risk of loss of their principal. Most ofthese products allow policyholders to transfer funds once a year among several different creditingstrategies, including one or more index based strategies and a traditional fixed rate strategy.
The annuity contract value is equal to the premiums paid increased for returns which are basedupon a percentage (the ‘‘participation rate’’) of the annual appreciation (based in certain situations onmonthly averages or monthly point-to-point calculations) in a recognized index or benchmark. Theparticipation rate, which we may reset annually, generally varies among the index products from 50% to100%. Some of the products also have an ‘‘asset fee’’ ranging from 1.5% to 5%, which is deductedfrom the interest to be credited. The asset fees may be adjusted annually by us, subject to stated limits.In addition, some products apply an overall limit (or ‘‘cap’’), ranging from 5% to 13%, on the amountof annual interest the policyholder may earn in any one contract year, and the applicable cap also maybe adjusted annually subject to stated minimums. The minimum guaranteed contract values are equalto 80% to 100% of the premium collected plus interest credited at an annual rate ranging from 2% to3.5%. We purchase options on the applicable indices as an investment to provide the income needed tofund the amount of the index credits on the index products. The setting of the participation rates, assetfees and caps is a function of the interest rate we can earn on the invested assets acquired with annuityfund deposits, cost of options and features offered on similar products by competitors. Approximately57% and 39% of our index annuity sales for the years ended December 31, 2004 and 2003, respectively,were ‘‘premium bonus’’ products. The initial annuity deposit on these policies is increased at issuanceby the specified premium bonus ranging from 1.5% to 10%. Generally, there is a compensatingadjustment in the commission paid to the agent to offset the premium bonus.
The index annuities provide for penalty-free withdrawals of up to 10% of premium oraccumulation value (depending on the product) in each year after the first year of the annuity’s term.Other withdrawals are subject to a surrender charge ranging initially from 5% to 20% over a surrenderperiod ranging from 5 to 17 years. During the applicable surrender charge period, the surrendercharges on some index products remain level, while on other index products, the surrender chargesdecline by one to two percentage points per year. After a number of years, as specified in the annuitycontract, the annuitant may elect to take the proceeds of the annuity either in a single payment or in aseries of payments for life, for a fixed number of years, a combination of these payment options, orre-enter into a new contract term.
Variable Annuities
Variable annuities differ from fixed rate and index annuities in that the policyholder, rather thanthe insurance company, bears the investment risk and the policyholder’s return of principal and rate ofreturn are dependent upon the performance of the particular investment option selected by thepolicyholder. Profits on variable annuities are derived from the fees charged to contract owners ratherthan from the investment spread.
Page 6 of 48
Life Insurance
These products include traditional ordinary and term, universal life and other interest-sensitive lifeinsurance products. We have approximately $2.6 billion of life insurance in force as of December 31,2004. We intend to continue offering a complete line of life insurance products for individual andgroup markets. Premiums related to this business accounted for 3% of the revenues in the years endedDecember 31, 2004 and 2003 and 5% of the revenues in the year ended December 21, 2002.
Investments
Investment activities are an integral part of our business, and net investment income is asignificant component of our total revenues. Profitability of many of our products is significantlyaffected by spreads between interest yields on investments and rates credited on annuity liabilities.Although substantially all credited rates on non-multi-year rate guaranteed SPDAs and FPDAs may bechanged annually, subject to minimum guarantees, changes in crediting rates may not be sufficient tomaintain targeted investment spreads in all economic and market environments. In addition,competition and other factors, including the potential for increases in surrenders and withdrawals, maylimit our ability to adjust or to maintain crediting rates at levels necessary to avoid narrowing ofspreads under certain market conditions. For the year ended December 31, 2004, the weighted averageyield, computed on the average amortized cost basis of our investment portfolio, was 6.28%; theweighted average cost of our liabilities at December 31, 2004, excluding interest bonuses guaranteed forthe first year of the annuity contract, was 3.90%.
We manage the indexed-based risk component of our index annuities by purchasing call options onthe applicable indices to fund the annual index credits on these annuities and by adjusting theparticipation rates, asset fee rates and other product features to reflect the change in the cost of suchoptions (which varies based on market conditions). All of such options are purchased to fund the indexcredits on our index annuities at their respective anniversary dates, and new options are purchased ateach of the anniversary dates to fund the next annual index credits.
For additional information regarding the composition of our investment portfolio and our interestrate risk management, see Quantitative and Qualitative Disclosures About Market Risk and note 3 toour audited consolidated financial statements.
Marketing
We market our products through a variable cost brokerage distribution network of approximately70 national marketing organizations and 46,000 independent agents as of December 31, 2004. Weemphasize high quality service to our agents and policyholders along with the prompt payment ofcommissions to our agents. We believe this has been significant in building excellent relationships withour existing agency force.
Our independent agents and agencies range in profile from national sales organizations to personalproducing general agents. We aggressively recruit new agents and expect to continue to expand ourindependent agency force. In our recruitment efforts, we emphasize that agents have direct access toour executive officers, giving us an edge in recruiting over larger and foreign-owned competitors. Wealso have favorable relationships with our national marketing organizations, which have enabled us toefficiently sell through an expanded number of independent agents. We are currently licensed to sellour products in 48 states and the District of Columbia. We have applied for licenses to sell ourproducts in the two remaining states.
The insurance distribution system is comprised of insurance brokers and marketing organizations.We are pursuing a strategy to increase the size of our distribution network by developing additionalrelationships with national and regional marketing organizations. These organizations typically recruit
Page 7 of 48
agents for us by advertising our products and our commission structure, through direct mail advertising,or through seminars for insurance agents and brokers. These organizations bear most of the costincurred in marketing our products. We compensate marketing organizations by paying them apercentage of the commissions earned on new annuity policy sales generated by the agents recruited insuch organizations. We also conduct incentive programs for marketing organizations and agents fromtime to time, including equity-based programs for our leading national marketers. For additionalinformation regarding our equity-based programs for our leading national marketers see note 10 to ouraudited consolidated financial statements. We generally do not enter into exclusive arrangements withthese marketing organizations.
Two of our national marketing organizations each accounted for more than 10% of the annuitydeposits and insurance premiums collections during the year ended December 31, 2004. The states withthe largest share of direct premiums collected during 2004 were: Florida (11.7%), California (10.7%),Texas (8.6%), Illinois (7.2%) and Michigan (5.2%).
Competition and Ratings
We operate in a highly competitive industry. Many of our competitors are substantially larger andenjoy substantially greater financial resources, higher ratings by rating agencies, broader and morediversified product lines and more widespread agency relationships. Our annuity products compete withindex, fixed rate and variable annuities sold by other insurance companies and also with mutual fundproducts, traditional bank investments and other investment and retirement funding alternatives offeredby asset managers, banks, and broker-dealers. Our insurance products compete with other insurancecompanies, financial intermediaries and other institutions based on a number of features, includingcrediting rates, policy terms and conditions, service provided to distribution channels and policyholders,ratings, reputation and broker compensation.
The sales agents for our products use the ratings assigned to an insurer by independent ratingagencies as one factor in determining which insurer’s annuity to market. In recent years, the market forannuities has been dominated by those insurers with the highest ratings. American Equity Life hasreceived a financial strength rating of ‘‘B++’’ (Very Good) with a stable outlook from A.M. BestCompany and ‘‘BBB+’’ with a stable outlook from Standard & Poor’s. A.M. Best Company andStandard & Poor’s changed their outlook on our rating from negative to stable subsequent to thecompletion of our December 2003 initial public offering. In July, 2002, A.M. Best Company andStandard & Poor’s adjusted our financial strength ratings from ‘‘A-’’(Excellent) to ‘‘B++’’(Very Good)and ‘‘A-’’ to ‘‘BBB+’’, respectively. The adjustments initially had no impact on sales of new annuityproducts or in lapses of existing balances. Beginning in November, 2002, our monthly sales volumesbegan to decline primarily as a result of certain actions by us, including reductions in crediting ratesand suspension of new sales of some products. The degree to which ratings adjustments alsocontributed to this decline is unknown. Our ability to grow sales of new annuities and the level ofsurrenders of our existing annuity contracts in force during 2005 may be affected by the current ratings.
Financial strength ratings generally involve quantitative and qualitative evaluations by ratingagencies of a company’s financial condition and operating performance. Generally, rating agencies basetheir ratings upon information furnished to them by the insurer and upon their own investigations,studies and assumptions. Ratings are based upon factors of concern to policyholders, agents andintermediaries and are not directed toward the protection of investors and are not recommendations tobuy, sell or hold securities.
A.M. Best Company ratings currently range from ‘‘A++’’ (Superior) to ‘‘F’’ (In Liquidation), andinclude 16 separate ratings categories. Within these categories, ‘‘A++’’ (Superior) and ‘‘A+’’ (Superior)are the highest, followed by ‘‘A’’ (Excellent) and ‘‘A-’’ (Excellent) then followed by ‘‘B++’’ (Very Good)and ‘‘B+’’ (Very Good). Publications of A.M. Best Company indicate that the ‘‘B++’’ rating is
Page 8 of 48
assigned to those companies that, in A.M. Best Company’s opinion, have demonstrated a good abilityto meet their ongoing obligations to policyholders.
Standard & Poor’s insurer financial strength ratings currently range from ‘‘AAA’’ to ‘‘NR’’, andinclude 21 separate ratings categories. Within these categories, ‘‘AAA’’ and ‘‘AA’’ are the highest,followed by ‘‘A’’ and ‘‘BBB’’. Publications of Standard & Poor’s indicate that an insurer rated ‘‘BBB’’ orhigher is regarded as having strong financial security characteristics, but is somewhat more likely to beaffected by adverse business conditions than are higher rated insurers.
A.M. Best Company and Standard & Poor’s review their ratings of insurance companies from timeto time. There can be no assurance that any particular rating will continue for any given period of timeor that it will not be changed or withdrawn entirely if, in their judgment, circumstances so warrant. Ifour ratings were to be adjusted again for any reason, we could experience a material decline in thesales of our products and the persistency of our existing business.
Page 9 of 48
Reinsurance
Coinsurance
American Equity Life has entered into two coinsurance agreements with EquiTrust Life InsuranceCompany (‘‘EquiTrust’’), an affiliate of Farm Bureau Life Insurance Company (‘‘Farm Bureau’’),covering 70% of certain of our fixed rate and index annuities issued from August 1, 2001 throughDecember 31, 2001, 40% of those contracts issued during 2002 and 2003, and 20% of those contractsissued from January 1, 2004 to July 31, 2004, when the agreement was suspended by mutual consent ofthe parties. As a result of the suspension, new business will no longer be ceded to EquiTrust unless anduntil the parties mutually agree to resume the coinsurance of new business. The business reinsuredunder these agreements is not eligible for recapture before the expiration of 10 years. EquiTrust hasreceived a financial strength rating of ‘‘A’’ from A.M. Best Company. As of December 31, 2004, FarmBureau beneficially owned 14.4% of our issued and outstanding common stock.
Total annuity deposits ceded were $202.1 million, $649.4 million and $837.9 million for the yearsended December 31, 2004, 2003 and 2002, respectively. We received expense allowances of$22.6 million, $65.6 million and $99.4 million under this agreement for the years ended December 31,2004, 2003 and 2002, respectively. The balance due under this agreement to EquiTrust was$32.0 million at December 31, 2004 and $22.6 million at December 31, 2003, and represents the marketvalue of the call options related to the ceded business held by us to fund the index credits and cashdue to or from EquiTrust related to the transfer of ceded annuity deposits. At December 31, 2004 and2003, the aggregate policy benefit reserves transferred to EquiTrust under these agreements were$2.1 billion and $1.9 billion, respectively. We remain liable with respect to the policy liabilities ceded toEquiTrust should it fail to meet the obligations assumed by it.
American Equity Life has also entered into a modified coinsurance agreement to cede 70% of itsvariable annuity business to EquiTrust. Separate account deposits ceded under this agreement duringthe years ended December 31, 2004, 2003 and 2002 were immaterial. Under this agreement and relatedadministrative services agreements, we paid EquiTrust $0.2 million for the each of years endedDecember 31, 2004, 2003 and 2002. The modified coinsurance agreement will continue untiltermination by written notice at the election of either party. Any such termination will apply to thesubmission or acceptance of new policies, and business reinsured under the agreement prior to anysuch termination is not eligible for recapture before the expiration of 10 years.
Financial Reinsurance
American Equity Life has entered into two reinsurance transactions with Hannover LifeReassurance Company of America, (‘‘Hannover’’), which are treated as reinsurance under statutoryaccounting practices and as financial reinsurance under accounting principles generally accepted in theUnited States, (‘‘GAAP’’). Hannover has received a financial strength rating of ‘‘A+’’ from A.M. BestCompany. The first transaction became effective November 1, 2002 (the ‘‘2002 Hannover Transaction’’)and the second transaction became effective September 30, 2003 (the ‘‘2003 Hannover Transaction’’).The agreements for these transactions include a coinsurance segment and a yearly renewable termsegment reinsuring a portion of death benefits payable on certain annuities issued from January 1, 2002to December 31, 2002 (2002 Hannover Transaction) and issued from January 1, 2003 to September 30,2003 (2003 Hannover Transaction). The coinsurance segments provide reinsurance to the extent of6.88% (2002 Hannover Transaction) and 13.41% (2003 Hannover Transaction) of all risks associatedwith our annuity policies covered by these reinsurance agreements. The 2002 Hannover Transactionprovided $29.8 million in net statutory surplus benefit during 2002 and the 2003 Hannover Transactionprovided $29.7 million in net statutory surplus benefit during 2003. The statutory surplus benefitsprovided by these agreements were reduced by $13.1 million in 2004 and $6.8 million in 2003. Theremaining statutory surplus benefit under these agreements will be reduced in the following years asfollows: 2005—$11.6 million; 2006—$12.4 million; 2007—$13.2 million; 2008—$6.2 million. Risk charges
Page 10 of 48
attributable to the 2003 and 2002 Hannover Transactions of $2.2 million, $1.6 million and $0.2 millionwere incurred during 2004, 2003 and 2002, respectively.
The statutory surplus benefit provided by the 2003 Hannover Transaction replaced the statutorysurplus benefit previously provided by a financial reinsurance agreement with a subsidiary of SwissReinsurance Company. We terminated this agreement and recaptured all reserves subject to thisagreement effective September 30, 2003. This agreement was effective January 1, 2001, and provided aninitial statutory surplus benefit of $35.0 million in 2001. The statutory surplus benefit remaining atJanuary 1, 2003 was $30.9 million, all of which was eliminated during 2003. Risk charges and interestexpense incurred on the cash portion of the surplus benefit provided by the agreement were$0.2 million and $0.6 million for the years ended December 31, 2003 and 2002, respectively.
Indemnity Reinsurance
Consistent with the general practice of the life insurance industry, American Equity Life entersinto agreements of indemnity reinsurance with other insurance companies in order to reinsure portionsof the coverage provided by its life and accident and health insurance products. Indemnity reinsuranceagreements are intended to limit a life insurer’s maximum loss on a large or unusually hazardous riskor to diversify its risks. The maximum loss retained by us on all life insurance policies we have issuedwas $0.1 million or less as of December 31, 2004. Indemnity reinsurance does not discharge the originalinsurer’s primary liability to the insured. American Equity Life’s reinsured business related to theseblocks of business is primarily ceded to two reinsurers. Reinsurance related to life and accident andhealth insurance that was ceded by us primarily to two reinsurers was immaterial. We believe theassuming companies will be able to honor all contractual commitments, based on our periodic review oftheir financial statements, insurance industry reports and reports filed with state insurance departments.
Regulation
Life insurance companies are subject to regulation and supervision by the states in which theytransact business. State insurance laws establish supervisory agencies with broad regulatory authority,including the power to:
• grant and revoke licenses to transact business;
• regulate and supervise trade practices and market conduct;
• establish guaranty associations;
• license agents;
• approve policy forms;
• approve premium rates for some lines of business;
• establish reserve requirements;
• prescribe the form and content of required financial statements and reports;
• determine the reasonableness and adequacy of statutory capital and surplus;
• perform financial, market conduct and other examinations;
• define acceptable accounting principles;
• regulate the type and amount of permitted investments;
• limit the amount of dividends and surplus note payments that can be paid without obtainingregulatory approval.
Our life subsidiaries are subject to periodic examinations by state regulatory authorities. In 2002,the Iowa Insurance Division completed an examination of American Equity Life as of December 31,
Page 11 of 48
2000. No adjustments to our financial statements were recommended or required as a result of thisexamination. The Iowa Insurance Division is currently conducting an examination of American EquityLife as of December 31, 2003. We have not been informed of any material adjustments which will berecommended or required as a result of this examination.
The payment of dividends or the distributions, including surplus note payments, by our lifesubsidiaries is subject to regulation by each subsidiary’s state of domicile’s insurance department.Currently, American Equity Life may pay dividends or make other distributions without the priorapproval of its state of domicile’s insurance department, unless such payments, together with all othersuch payments within the preceding twelve months, exceed the greater of (1) American Equity Life’sstatutory net gain from operations for the preceding calendar year, or (2) 10% of American EquityLife’s statutory surplus at the preceding December 31. For 2005, up to approximately $60.9 million canbe distributed as dividends by American Equity Life without prior approval of its state of domicile’sinsurance department. In addition, dividends and surplus note payments may be made only out ofearned surplus, and all surplus note payments are subject to prior approval by regulatory authorities.American Equity Life had approximately $114.6 million of earned surplus at December 31, 2004.
Most states have also enacted regulations on the activities of insurance holding company systems,including acquisitions, extraordinary dividends, the terms of surplus notes, the terms of affiliatetransactions and other related matters. We are registered pursuant to such legislation in Iowa. Recently,a number of state legislatures have considered or have enacted legislative proposals that alter and, inmany cases, increase the authority of state agencies to regulate insurance companies and holdingcompany systems.
Most states, including Iowa and New York where our life subsidiaries are domiciled, have enactedlegislation or adopted administrative regulations affecting the acquisition of control of insurancecompanies as well as transactions between insurance companies and persons controlling them. Thenature and extent of such legislation and regulations currently in effect vary from state to state.However, most states require administrative approval of the direct or indirect acquisition of 10% ormore of the outstanding voting securities of an insurance company incorporated in the state. Theacquisition of 10% of such securities is generally deemed to be the acquisition of ‘‘control’’ for thepurpose of the holding company statutes and requires not only the filing of detailed informationconcerning the acquiring parties and the plan of acquisition, but also administrative approval prior tothe acquisition. In many states, the insurance authority may find that ‘‘control’’ in fact does not exist incircumstances in which a person owns or controls more than 10% of the voting securities.
Although the federal government does not directly regulate the business of insurance, federallegislation and administrative policies in several areas, including pension regulation, age and sexdiscrimination, financial services regulation, securities regulation and federal taxation can significantlyaffect the insurance business. In addition, legislation has been passed which could result in the federalgovernment assuming some role in regulating insurance companies and which allows combinationsbetween insurance companies, banks and other entities.
In 1998, the Securities and Exchange Commission (‘‘SEC’’) requested comments as to whetherindex annuities, such as those sold by us, should be treated as securities under the federal securitieslaws rather than as insurance products. Treatment of these products as securities would likely requireadditional registration and licensing of these products and the agents selling them, as well as cause usto seek additional marketing relationships for these products. No action has been taken by the SEC onthis issue.
State insurance regulators and the National Association of Insurance Commissioners, or NAIC, arecontinually reexamining existing laws and regulations and developing new legislation for the passage bystate legislatures and new regulations for adoption by insurance authorities. Proposed laws and
Page 12 of 48
regulations or those still under development pertain to insurer solvency and market conduct and inrecent years have focused on:
• insurance company investments;
• risk-based capital (‘‘RBC’’) guidelines, which consist of regulatory targeted surplus levels basedon the relationship of statutory capital and surplus, with prescribed adjustments, to the sum ofstated percentages of each element of a specified list of company risk exposures;
• the implementation of non-statutory guidelines and the circumstances under which dividendsmay be paid;
• product approvals;
• agent licensing;
• underwriting practices;
• insurance and annuity sales practices.
The NAIC’s RBC requirements are intended to be used by insurance regulators as an earlywarning tool to identify deteriorating or weakly capitalized insurance companies for the purpose ofinitiating regulatory action. The RBC formula defines a new minimum capital standard whichsupplements low, fixed minimum capital and surplus requirements previously implemented on astate-by-state basis. Such requirements are not designed as a ranking mechanism for adequatelycapitalized companies.
The NAIC’s RBC requirements provide for four levels of regulatory attention depending on theratio of a company’s total adjusted capital to its RBC. Adjusted capital is defined as the total ofstatutory capital, surplus, asset valuation reserve and certain other adjustments. Calculations using theNAIC formula at December 31, 2004, indicate that the ratio of total adjusted capital to RBC for usexceeded the highest level at which regulatory action might be initiated by approximately 2.5 times.
Our life subsidiaries also may be required, under the solvency or guaranty laws of most states inwhich they do business, to pay assessments up to certain prescribed limits to fund policyholder losses orliabilities of insolvent insurance companies. These assessments may be deferred or forgiven under mostguaranty laws if they would threaten an insurer’s financial strength and, in certain instances, may beoffset against future premium taxes. Assessments related to business reinsured for periods prior to theeffective date of the reinsurance are the responsibility of the ceding companies.
Federal Income Taxation
The annuity and life insurance products that we market generally provide the policyholder with afederal income tax advantage, as compared to certain other savings investments such as certificates ofdeposit and taxable bonds, in that federal income taxation on any increases in the contract values (i.e.,the ‘‘inside build-up’’) of these products is deferred until it is received by the policyholder. With othersavings investments, the increase in value is generally taxed each year as it is realized. Additionally, lifeinsurance death benefits are generally exempt from income tax.
From time to time, various tax law changes have been proposed that could have an adverse effecton our business, including the elimination of all or a portion of the income tax advantage describedabove for annuities and life insurance. If legislation were enacted to eliminate the tax deferral forannuities, such a change would have an adverse effect on our ability to sell non-qualified annuities.Non-qualified annuities are annuities that are not sold to an individual retirement account or otherqualified retirement plan.
In June 2001, the Economic Growth and Tax Relief Reconciliation Act of 2001 (the ‘‘2001 Act’’)was enacted. The 2001 Act implemented a staged decrease in individual tax rates that began in 2001and was accelerated when the Jobs and Growth Tax Relief Reconciliation Act of 2003 (the ‘‘2003 Act’’)
Page 13 of 48
was enacted. While the decreases in rates are temporary (the pre-2001 rates will return in 2011), thepresent value of the tax deferred advantage of annuities and life insurance products is less, which mighthinder our ability to sell such products and/or increase the rate at which our current policyholderssurrender their policies.
Our life subsidiaries are taxed under the life insurance company provisions of the InternalRevenue Code of 1986, as amended (the ‘‘Code’’). Provisions in the Code require a portion of theexpenses incurred in selling insurance products to be capitalized and deducted over a period of years,as opposed to being immediately deducted in the year incurred. This provision increases the currentincome tax expense charged to gain from operations for statutory accounting purposes which reducesstatutory net income and surplus and, accordingly, may decrease the amount of cash dividends that maybe paid by our life subsidiaries.
Employees
As of December 31, 2004, we had approximately 230 full-time employees, of which approximately220 are located in West Des Moines, Iowa, and 10 are located in the Pell City, Alabama office. Wehave experienced no work stoppages or strikes and consider our relations with our employees to beexcellent. None of our employees are represented by a union.
ITEM 2. PROPERTIES
We do not own any real estate. We lease space for our principal offices in West Des Moines, Iowa,pursuant to written leases for approximately 45,000 square feet. The leases expire on June 30, 2006 andhave a renewal option for an additional five year term at a rental rate equal to the prevailing fairmarket rate. We also lease space for our office in Pell City, Alabama, pursuant to a written lease datedJanuary 3, 2000, for approximately 5,680 square feet. This lease is currently on a month-to-month basis.
ITEM 3. LEGAL PROCEEDINGS
We are occasionally involved in litigation, both as a defendant and as a plaintiff. In addition, stateregulatory bodies, such as state insurance departments, the SEC, the National Association of SecuritiesDealers, Inc., the Department of Labor, and other regulatory bodies regularly make inquiries andconduct examinations or investigations concerning our compliance with, among other things, insurancelaws, securities laws, the Employee Retirement Income Security Act of 1974, as amended and lawsgoverning the activities of broker-dealers.
Companies in the life insurance and annuity business have faced litigation, including class actionlawsuits, alleging improper product design, improper sales practices and similar claims. We arecurrently a defendant in several purported class action lawsuits filed in state courts alleging impropersales practices. In these lawsuits, the plaintiffs are seeking returns of premiums and other compensatoryand punitive damages. We have reached a final settlement in one of these cases, the impact of which isexpected to be immaterial. The class was certified as such incident to the settlement of that case. Noclass has been certified in any of the other pending cases at this time. Although we have denied allallegations in these lawsuits and intend to vigorously defend against them, the lawsuits are in the earlystages of litigation and neither their outcomes nor a range of possible outcomes can be determined atthis time. However, we do not believe that these lawsuits will have a material adverse effect on ourbusiness, financial condition or results of operations.
In addition, we are from time to time, subject to other legal proceedings and claims in theordinary course of business, none of which we believe are likely to have a material adverse effect onour financial position, results of operations or cash flows. There can be no assurance that suchlitigation, or any future litigation, will not have a material adverse effect on our business, financialcondition or results of operations.
ITEM 4. SUBMISSION OF MATTERS TO A VOTE OF SECURITY HOLDERS
None.
Page 14 of 48
PART II
ITEM 5. MARKET FOR REGISTRANT’S COMMON EQUITY, RELATED STOCKHOLDERMATTERS AND ISSUER PURCHASES OF EQUITY SECURITIES
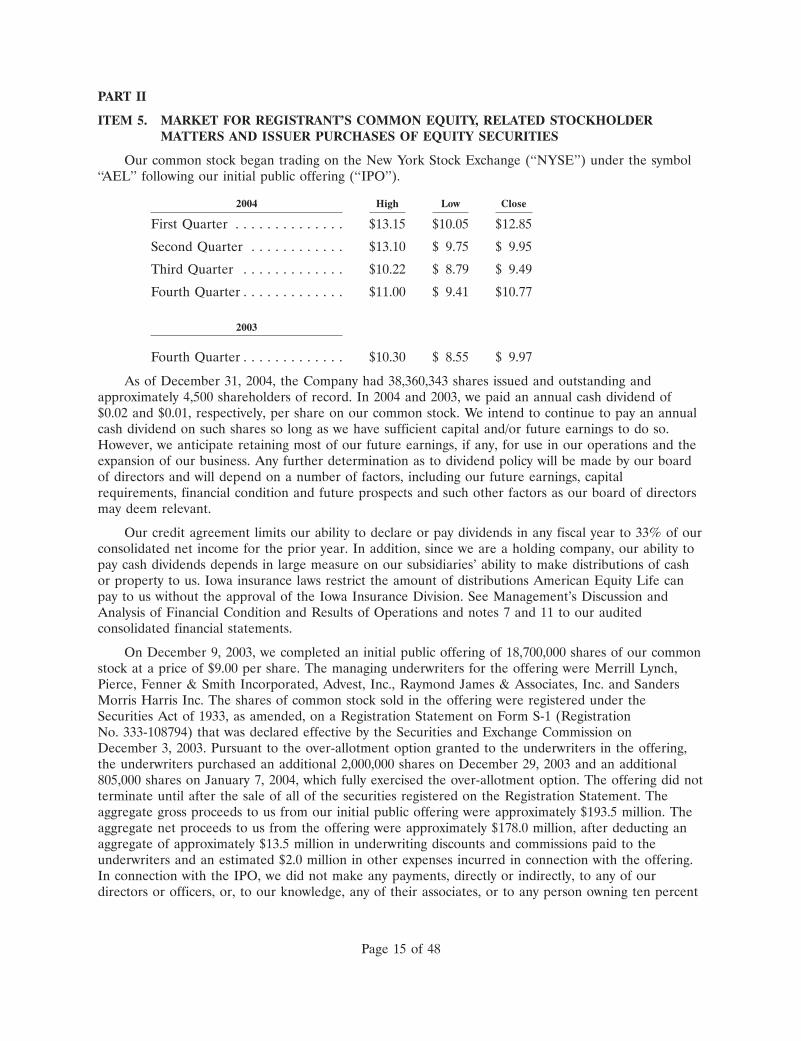
Our common stock began trading on the New York Stock Exchange (‘‘NYSE’’) under the symbol‘‘AEL’’ following our initial public offering (‘‘IPO’’).
2004 High Low Close
First Quarter . . . . . . . . . . . . . . $13.15 $10.05 $12.85
Second Quarter . . . . . . . . . . . . $13.10 $ 9.75 $ 9.95
Third Quarter . . . . . . . . . . . . . $10.22 $ 8.79 $ 9.49
Fourth Quarter . . . . . . . . . . . . . $11.00 $ 9.41 $10.77
2003
Fourth Quarter . . . . . . . . . . . . . $10.30 $ 8.55 $ 9.97
As of December 31, 2004, the Company had 38,360,343 shares issued and outstanding andapproximately 4,500 shareholders of record. In 2004 and 2003, we paid an annual cash dividend of$0.02 and $0.01, respectively, per share on our common stock. We intend to continue to pay an annualcash dividend on such shares so long as we have sufficient capital and/or future earnings to do so.However, we anticipate retaining most of our future earnings, if any, for use in our operations and theexpansion of our business. Any further determination as to dividend policy will be made by our boardof directors and will depend on a number of factors, including our future earnings, capitalrequirements, financial condition and future prospects and such other factors as our board of directorsmay deem relevant.
Our credit agreement limits our ability to declare or pay dividends in any fiscal year to 33% of ourconsolidated net income for the prior year. In addition, since we are a holding company, our ability topay cash dividends depends in large measure on our subsidiaries’ ability to make distributions of cashor property to us. Iowa insurance laws restrict the amount of distributions American Equity Life canpay to us without the approval of the Iowa Insurance Division. See Management’s Discussion andAnalysis of Financial Condition and Results of Operations and notes 7 and 11 to our auditedconsolidated financial statements.
On December 9, 2003, we completed an initial public offering of 18,700,000 shares of our commonstock at a price of $9.00 per share. The managing underwriters for the offering were Merrill Lynch,Pierce, Fenner & Smith Incorporated, Advest, Inc., Raymond James & Associates, Inc. and SandersMorris Harris Inc. The shares of common stock sold in the offering were registered under theSecurities Act of 1933, as amended, on a Registration Statement on Form S-1 (RegistrationNo. 333-108794) that was declared effective by the Securities and Exchange Commission onDecember 3, 2003. Pursuant to the over-allotment option granted to the underwriters in the offering,the underwriters purchased an additional 2,000,000 shares on December 29, 2003 and an additional805,000 shares on January 7, 2004, which fully exercised the over-allotment option. The offering did notterminate until after the sale of all of the securities registered on the Registration Statement. Theaggregate gross proceeds to us from our initial public offering were approximately $193.5 million. Theaggregate net proceeds to us from the offering were approximately $178.0 million, after deducting anaggregate of approximately $13.5 million in underwriting discounts and commissions paid to theunderwriters and an estimated $2.0 million in other expenses incurred in connection with the offering.In connection with the IPO, we did not make any payments, directly or indirectly, to any of ourdirectors or officers, or, to our knowledge, any of their associates, or to any person owning ten percent
Page 15 of 48

or more of any class of our equity securities, or to any of our affiliates. All of the net proceeds werecontributed to our life subsidiaries to fund future growth of our annuity business.
There were no sales of unregistered equity securities during 2004 not previously reported onForm 8-K.
Issuer Purchases of Equity Securities
We did not have any issuer purchases of equity securities for the quarter ended December 31,2004.
Page 16 of 48
ITEM 6. SELECTED CONSOLIDATED FINANCIAL AND OTHER DATA
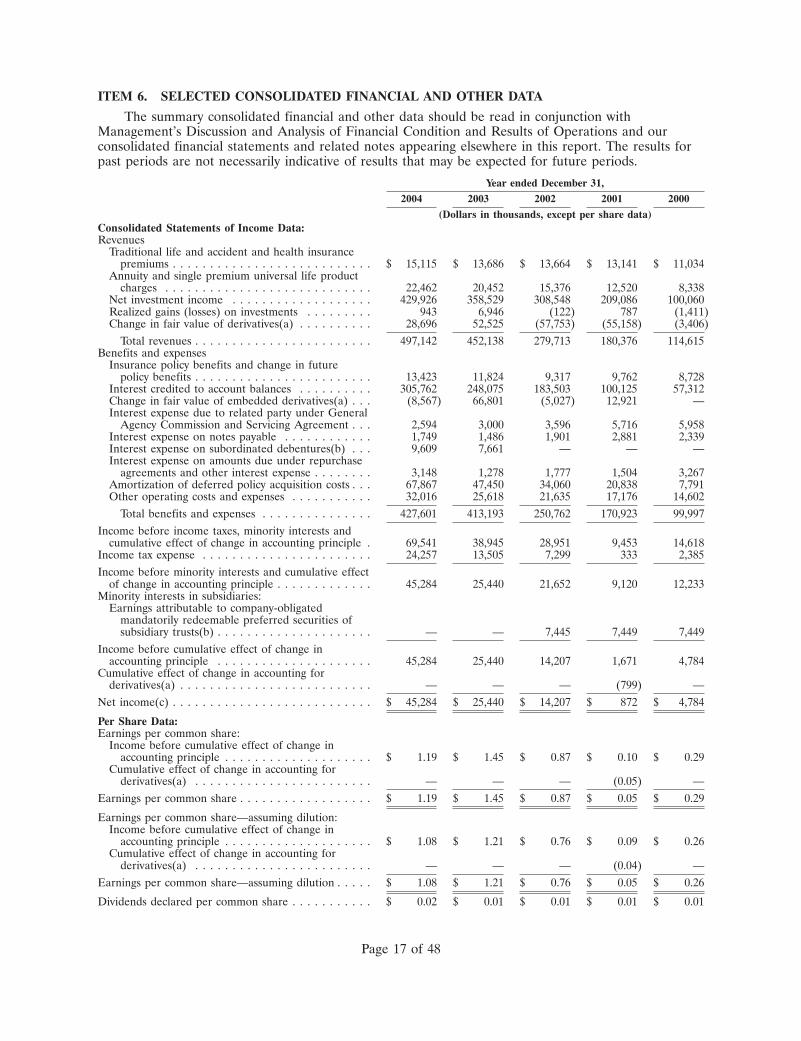
The summary consolidated financial and other data should be read in conjunction withManagement’s Discussion and Analysis of Financial Condition and Results of Operations and ourconsolidated financial statements and related notes appearing elsewhere in this report. The results forpast periods are not necessarily indicative of results that may be expected for future periods.
Year ended December 31,2004 2003 2002 2001 2000
(Dollars in thousands, except per share data)Consolidated Statements of Income Data:Revenues
Traditional life and accident and health insurancepremiums . . . . . . . . . . . . . . . . . . . . . . . . . . . $ 15,115 $ 13,686 $ 13,664 $ 13,141 $ 11,034
Annuity and single premium universal life productcharges . . . . . . . . . . . . . . . . . . . . . . . . . . . . 22,462 20,452 15,376 12,520 8,338
Net investment income . . . . . . . . . . . . . . . . . . . 429,926 358,529 308,548 209,086 100,060Realized gains (losses) on investments . . . . . . . . . 943 6,946 (122) 787 (1,411)Change in fair value of derivatives(a) . . . . . . . . . . 28,696 52,525 (57,753) (55,158) (3,406)
Total revenues . . . . . . . . . . . . . . . . . . . . . . . . 497,142 452,138 279,713 180,376 114,615Benefits and expenses
Insurance policy benefits and change in futurepolicy benefits . . . . . . . . . . . . . . . . . . . . . . . . 13,423 11,824 9,317 9,762 8,728
Interest credited to account balances . . . . . . . . . . 305,762 248,075 183,503 100,125 57,312Change in fair value of embedded derivatives(a) . . . (8,567) 66,801 (5,027) 12,921 —Interest expense due to related party under General
Agency Commission and Servicing Agreement . . . 2,594 3,000 3,596 5,716 5,958Interest expense on notes payable . . . . . . . . . . . . 1,749 1,486 1,901 2,881 2,339Interest expense on subordinated debentures(b) . . . 9,609 7,661 — — —Interest expense on amounts due under repurchase
agreements and other interest expense . . . . . . . . 3,148 1,278 1,777 1,504 3,267Amortization of deferred policy acquisition costs . . . 67,867 47,450 34,060 20,838 7,791Other operating costs and expenses . . . . . . . . . . . 32,016 25,618 21,635 17,176 14,602
Total benefits and expenses . . . . . . . . . . . . . . . 427,601 413,193 250,762 170,923 99,997Income before income taxes, minority interests and
cumulative effect of change in accounting principle . 69,541 38,945 28,951 9,453 14,618Income tax expense . . . . . . . . . . . . . . . . . . . . . . . 24,257 13,505 7,299 333 2,385Income before minority interests and cumulative effect
of change in accounting principle . . . . . . . . . . . . . 45,284 25,440 21,652 9,120 12,233Minority interests in subsidiaries:
Earnings attributable to company-obligatedmandatorily redeemable preferred securities ofsubsidiary trusts(b) . . . . . . . . . . . . . . . . . . . . . — — 7,445 7,449 7,449
Income before cumulative effect of change inaccounting principle . . . . . . . . . . . . . . . . . . . . . 45,284 25,440 14,207 1,671 4,784
Cumulative effect of change in accounting forderivatives(a) . . . . . . . . . . . . . . . . . . . . . . . . . . — — — (799) —
Net income(c) . . . . . . . . . . . . . . . . . . . . . . . . . . . $ 45,284 $ 25,440 $ 14,207 $ 872 $ 4,784
Per Share Data:Earnings per common share:
Income before cumulative effect of change inaccounting principle . . . . . . . . . . . . . . . . . . . . $ 1.19 $ 1.45 $ 0.87 $ 0.10 $ 0.29
Cumulative effect of change in accounting forderivatives(a) . . . . . . . . . . . . . . . . . . . . . . . . — — — (0.05) —
Earnings per common share . . . . . . . . . . . . . . . . . . $ 1.19 $ 1.45 $ 0.87 $ 0.05 $ 0.29
Earnings per common share—assuming dilution:Income before cumulative effect of change in
accounting principle . . . . . . . . . . . . . . . . . . . . $ 1.08 $ 1.21 $ 0.76 $ 0.09 $ 0.26Cumulative effect of change in accounting for
derivatives(a) . . . . . . . . . . . . . . . . . . . . . . . . — — — (0.04) —Earnings per common share—assuming dilution . . . . . $ 1.08 $ 1.21 $ 0.76 $ 0.05 $ 0.26
Dividends declared per common share . . . . . . . . . . . $ 0.02 $ 0.01 $ 0.01 $ 0.01 $ 0.01
Page 17 of 48
At December 31,2004 2003 2002 2001 2000
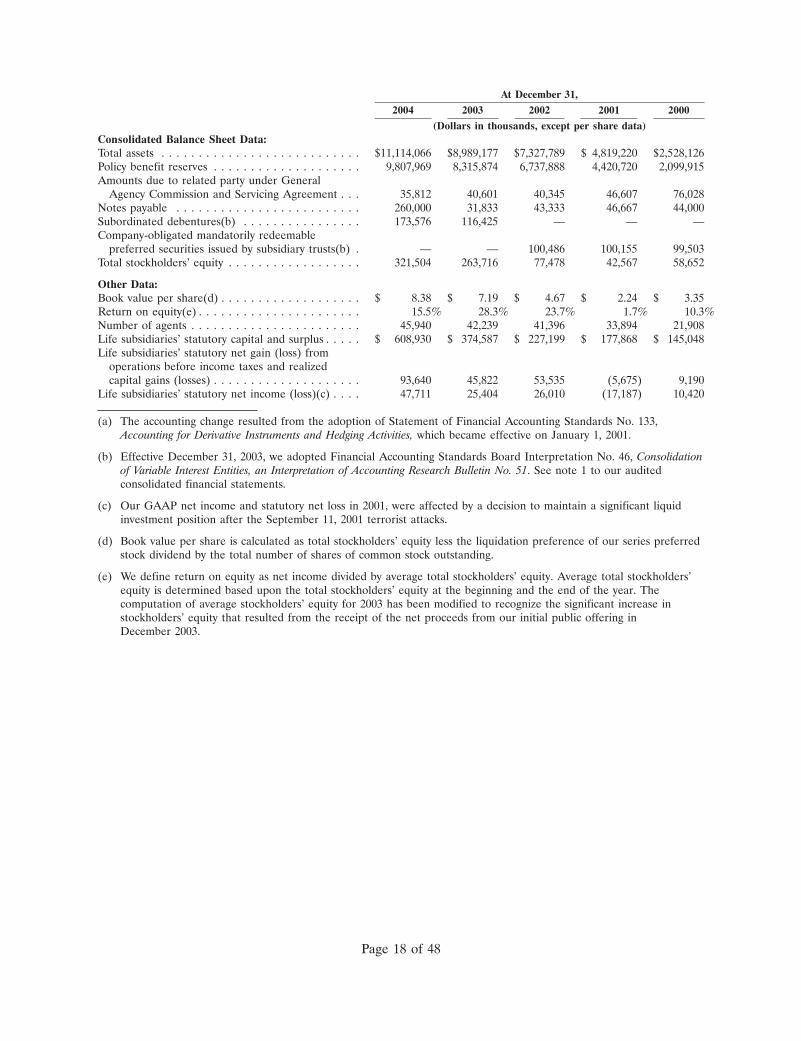
(Dollars in thousands, except per share data)Consolidated Balance Sheet Data:Total assets . . . . . . . . . . . . . . . . . . . . . . . . . . . $11,114,066 $8,989,177 $7,327,789 $ 4,819,220 $2,528,126Policy benefit reserves . . . . . . . . . . . . . . . . . . . . 9,807,969 8,315,874 6,737,888 4,420,720 2,099,915Amounts due to related party under General
Agency Commission and Servicing Agreement . . . 35,812 40,601 40,345 46,607 76,028Notes payable . . . . . . . . . . . . . . . . . . . . . . . . . 260,000 31,833 43,333 46,667 44,000Subordinated debentures(b) . . . . . . . . . . . . . . . . 173,576 116,425 — — —Company-obligated mandatorily redeemable
preferred securities issued by subsidiary trusts(b) . — — 100,486 100,155 99,503Total stockholders’ equity . . . . . . . . . . . . . . . . . . 321,504 263,716 77,478 42,567 58,652
Other Data:Book value per share(d) . . . . . . . . . . . . . . . . . . . $ 8.38 $ 7.19 $ 4.67 $ 2.24 $ 3.35Return on equity(e) . . . . . . . . . . . . . . . . . . . . . . 15.5% 28.3% 23.7% 1.7% 10.3%Number of agents . . . . . . . . . . . . . . . . . . . . . . . 45,940 42,239 41,396 33,894 21,908Life subsidiaries’ statutory capital and surplus . . . . . $ 608,930 $ 374,587 $ 227,199 $ 177,868 $ 145,048Life subsidiaries’ statutory net gain (loss) from
operations before income taxes and realizedcapital gains (losses) . . . . . . . . . . . . . . . . . . . . 93,640 45,822 53,535 (5,675) 9,190
Life subsidiaries’ statutory net income (loss)(c) . . . . 47,711 25,404 26,010 (17,187) 10,420
(a) The accounting change resulted from the adoption of Statement of Financial Accounting Standards No. 133,Accounting for Derivative Instruments and Hedging Activities, which became effective on January 1, 2001.
(b) Effective December 31, 2003, we adopted Financial Accounting Standards Board Interpretation No. 46, Consolidationof Variable Interest Entities, an Interpretation of Accounting Research Bulletin No. 51. See note 1 to our auditedconsolidated financial statements.
(c) Our GAAP net income and statutory net loss in 2001, were affected by a decision to maintain a significant liquidinvestment position after the September 11, 2001 terrorist attacks.
(d) Book value per share is calculated as total stockholders’ equity less the liquidation preference of our series preferredstock dividend by the total number of shares of common stock outstanding.
(e) We define return on equity as net income divided by average total stockholders’ equity. Average total stockholders’equity is determined based upon the total stockholders’ equity at the beginning and the end of the year. Thecomputation of average stockholders’ equity for 2003 has been modified to recognize the significant increase instockholders’ equity that resulted from the receipt of the net proceeds from our initial public offering inDecember 2003.
Page 18 of 48
ITEM 7. MANAGEMENT’S DISCUSSION AND ANALYSIS OF FINANCIAL CONDITION ANDRESULTS OF OPERATIONS
Management’s discussion and analysis reviews our consolidated financial position at December 31,2004 and 2003, and our consolidated results of operations for the three years in the period endedDecember 31, 2004, and where appropriate, factors that may affect future financial performance. Thisdiscussion should be read in conjunction with our consolidated financial statements, notes thereto andselected consolidated financial data appearing elsewhere in this report.
Cautionary Statement Regarding Forward-Looking Information
All statements, trend analyses and other information contained in this report and elsewhere (suchas in filings by us with the Securities and Exchange Commission, press releases, presentations by us orour management or oral statements) relative to markets for our products and trends in our operationsor financial results, as well as other statements including words such as ‘‘anticipate’’, ‘‘believe’’, ‘‘plan’’,‘‘estimate’’, ‘‘expect’’, ‘‘intend’’, and other similar expressions, constitute forward-looking statements. Wecaution that these statements may and often do vary from actual results and the differences betweenthese statements and actual results can be material. Accordingly, we cannot assure you that actualresults will not differ materially from those expressed or implied by the forward-looking statements.Factors that could contribute to these differences include, among other things:
• general economic conditions and other factors, including prevailing interest rate levels and stockand credit market performance which may affect (among other things) our ability to sell ourproducts, our ability to access capital resources and the costs associated therewith, the marketvalue of our investments and the lapse rate and profitability of our policies;
• customer response to new products and marketing initiatives;
• changes in the Federal income tax laws and regulations which may affect the relative income taxadvantages of our products;
• increasing competition in the sale of annuities;
• regulatory changes or actions, including those relating to regulation of financial services affecting(among other things) bank sales and underwriting of insurance products and regulation of thesale, underwriting and pricing of products;
• the risk factors or uncertainties listed from time to time in our private placement memorandumsor filings with the Securities and Exchange Commission.
Overview
We specialize in the sale of individual annuities (primarily deferred annuities) and, to a lesserextent, we also sell life insurance policies. Under accounting principles generally accepted in the UnitedStates, or GAAP, premium collections for deferred annuities are reported as deposit liabilities insteadof as revenues. Sources of revenues for products accounted for as deposit liabilities are net investmentincome, surrender charges deducted from the account balances of policyholders in connection withwithdrawals, realized gains and losses on investments and changes in fair value of derivatives.Components of expenses for products accounted for as deposit liabilities are interest credited toaccount balances, changes in fair value of embedded derivatives, amortization of deferred policyacquisition costs and deferred sales inducements, other operating costs and expenses and income taxes.
Earnings from products accounted for as deposit liabilities are primarily generated from the excessof net investment income earned over the interest credited to the policyholder, or the ‘‘investmentspread’’. In the case of index annuities, the investment spread consists of net investment income in
Page 19 of 48
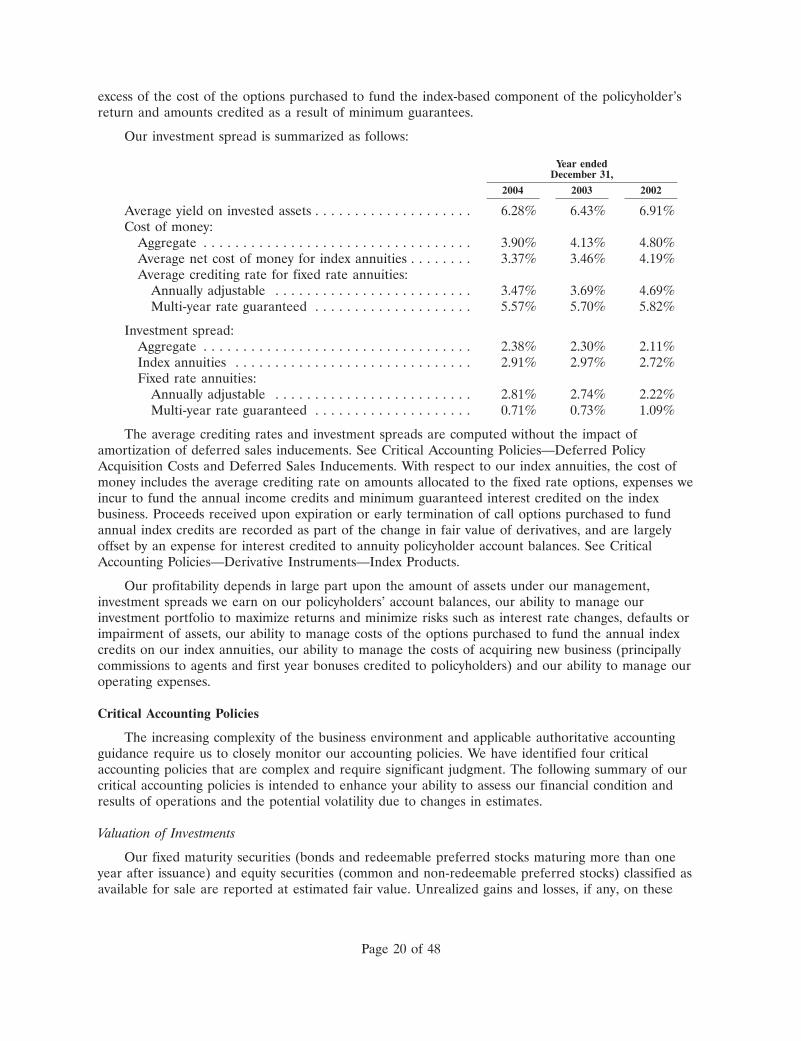
excess of the cost of the options purchased to fund the index-based component of the policyholder’sreturn and amounts credited as a result of minimum guarantees.
Our investment spread is summarized as follows:
Year endedDecember 31,
2004 2003 2002
Average yield on invested assets . . . . . . . . . . . . . . . . . . . . 6.28% 6.43% 6.91%Cost of money:
Aggregate . . . . . . . . . . . . . . . . . . . . . . . . . . . . . . . . . . 3.90% 4.13% 4.80%Average net cost of money for index annuities . . . . . . . . 3.37% 3.46% 4.19%Average crediting rate for fixed rate annuities:
Annually adjustable . . . . . . . . . . . . . . . . . . . . . . . . . 3.47% 3.69% 4.69%Multi-year rate guaranteed . . . . . . . . . . . . . . . . . . . . 5.57% 5.70% 5.82%
Investment spread:Aggregate . . . . . . . . . . . . . . . . . . . . . . . . . . . . . . . . . . 2.38% 2.30% 2.11%Index annuities . . . . . . . . . . . . . . . . . . . . . . . . . . . . . . 2.91% 2.97% 2.72%Fixed rate annuities:
Annually adjustable . . . . . . . . . . . . . . . . . . . . . . . . . 2.81% 2.74% 2.22%Multi-year rate guaranteed . . . . . . . . . . . . . . . . . . . . 0.71% 0.73% 1.09%
The average crediting rates and investment spreads are computed without the impact ofamortization of deferred sales inducements. See Critical Accounting Policies—Deferred PolicyAcquisition Costs and Deferred Sales Inducements. With respect to our index annuities, the cost ofmoney includes the average crediting rate on amounts allocated to the fixed rate options, expenses weincur to fund the annual income credits and minimum guaranteed interest credited on the indexbusiness. Proceeds received upon expiration or early termination of call options purchased to fundannual index credits are recorded as part of the change in fair value of derivatives, and are largelyoffset by an expense for interest credited to annuity policyholder account balances. See CriticalAccounting Policies—Derivative Instruments—Index Products.
Our profitability depends in large part upon the amount of assets under our management,investment spreads we earn on our policyholders’ account balances, our ability to manage ourinvestment portfolio to maximize returns and minimize risks such as interest rate changes, defaults orimpairment of assets, our ability to manage costs of the options purchased to fund the annual indexcredits on our index annuities, our ability to manage the costs of acquiring new business (principallycommissions to agents and first year bonuses credited to policyholders) and our ability to manage ouroperating expenses.
Critical Accounting Policies
The increasing complexity of the business environment and applicable authoritative accountingguidance require us to closely monitor our accounting policies. We have identified four criticalaccounting policies that are complex and require significant judgment. The following summary of ourcritical accounting policies is intended to enhance your ability to assess our financial condition andresults of operations and the potential volatility due to changes in estimates.
Valuation of Investments
Our fixed maturity securities (bonds and redeemable preferred stocks maturing more than oneyear after issuance) and equity securities (common and non-redeemable preferred stocks) classified asavailable for sale are reported at estimated fair value. Unrealized gains and losses, if any, on these
Page 20 of 48
securities are included directly in a separate component of stockholders’ equity, net of income taxesand certain adjustments for assumed changes in amortization of deferred policy acquisition costs anddeferred sales inducements. Fair values for securities that are actively traded are determined usingquoted market prices. For fixed maturity securities that are not actively traded, fair values areestimated using price matrices developed using yield data and other factors relating to instruments orsecurities with similar characteristics. The carrying amounts of all our investments are reviewed on anongoing basis for credit deterioration. If this review indicates a decline in market value that is otherthan temporary, our carrying amount in the investment is reduced to its fair value and a specificwritedown is taken. Such reductions in carrying amount are recognized as realized losses and chargedto earnings.
Our periodic assessment of our ability to recover the amortized cost basis of investments that havematerially lower quoted market prices requires a high degree of management judgment and involvesuncertainty. Factors considered in evaluating whether a decline in value is other than temporaryinclude:
• the length of time and the extent to which the fair value has been less than cost;
• the financial condition and near-term prospects of the issuer;
• whether the investment is rated investment grade;
• whether the issuer is current on all payments and all contractual payments have been made asagreed;
• our intent and ability to retain the investment for a period of time sufficient to allow for anyanticipated recovery;
• consideration of rating agency actions;
• changes in cash flows of asset-backed and mortgage-backed securities.
In addition, for securities expected to be sold, an other than temporary impairment charge isrecognized if we do not expect the fair value of a security to recover to cost or amortized cost prior tothe expected date of sale. Once an impairment charge has been recorded, we then continue to reviewthe other than temporarily impaired securities for appropriate valuation on an ongoing basis. Realizedlosses through a charge to earnings may be recognized in future periods should we later conclude thatthe decline in market value below amortized cost is other than temporary pursuant to our accountingpolicy described above.
Page 21 of 48
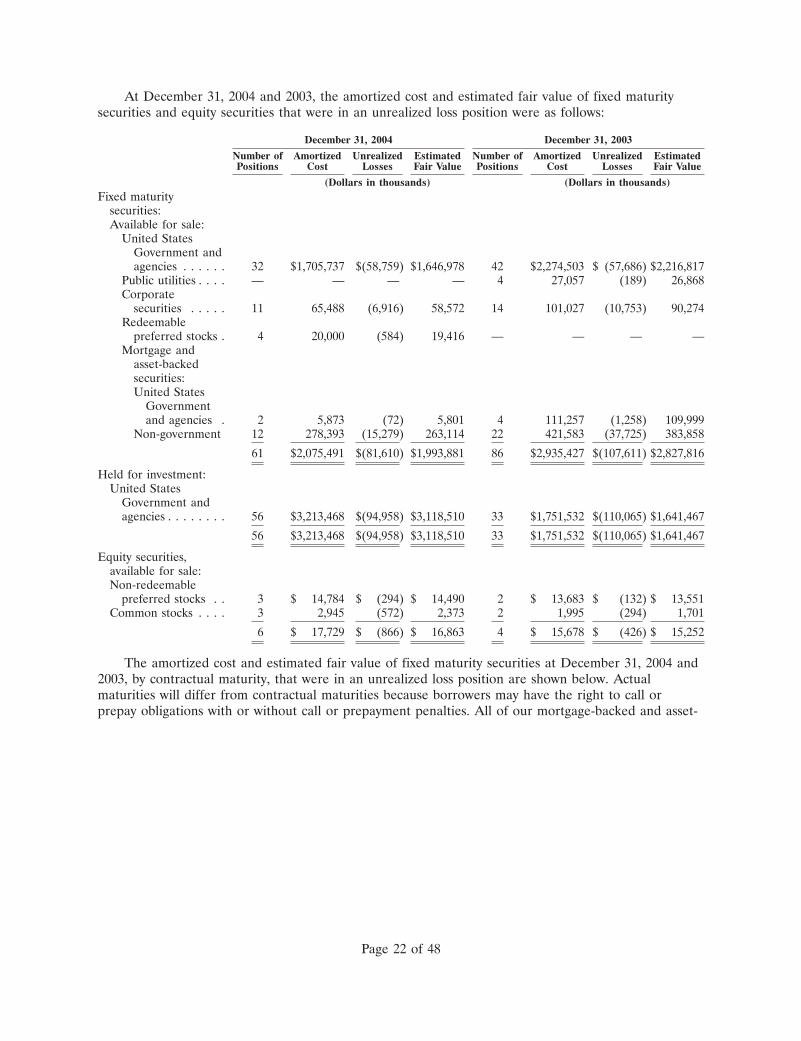
At December 31, 2004 and 2003, the amortized cost and estimated fair value of fixed maturitysecurities and equity securities that were in an unrealized loss position were as follows:
December 31, 2004 December 31, 2003
Number of Amortized Unrealized Estimated Number of Amortized Unrealized EstimatedPositions Cost Losses Fair Value Positions Cost Losses Fair Value
(Dollars in thousands) (Dollars in thousands)Fixed maturity
securities:Available for sale:
United StatesGovernment andagencies . . . . . . 32 $1,705,737 $(58,759) $1,646,978 42 $2,274,503 $ (57,686) $2,216,817
Public utilities . . . . — — — — 4 27,057 (189) 26,868Corporate
securities . . . . . 11 65,488 (6,916) 58,572 14 101,027 (10,753) 90,274Redeemable
preferred stocks . 4 20,000 (584) 19,416 — — — —Mortgage and
asset-backedsecurities:United States
Governmentand agencies . 2 5,873 (72) 5,801 4 111,257 (1,258) 109,999
Non-government 12 278,393 (15,279) 263,114 22 421,583 (37,725) 383,858
61 $2,075,491 $(81,610) $1,993,881 86 $2,935,427 $(107,611) $2,827,816
Held for investment:United States
Government andagencies . . . . . . . . 56 $3,213,468 $(94,958) $3,118,510 33 $1,751,532 $(110,065) $1,641,467
56 $3,213,468 $(94,958) $3,118,510 33 $1,751,532 $(110,065) $1,641,467
Equity securities,available for sale:Non-redeemable
preferred stocks . . 3 $ 14,784 $ (294) $ 14,490 2 $ 13,683 $ (132) $ 13,551Common stocks . . . . 3 2,945 (572) 2,373 2 1,995 (294) 1,701
6 $ 17,729 $ (866) $ 16,863 4 $ 15,678 $ (426) $ 15,252
The amortized cost and estimated fair value of fixed maturity securities at December 31, 2004 and2003, by contractual maturity, that were in an unrealized loss position are shown below. Actualmaturities will differ from contractual maturities because borrowers may have the right to call orprepay obligations with or without call or prepayment penalties. All of our mortgage-backed and asset-
Page 22 of 48
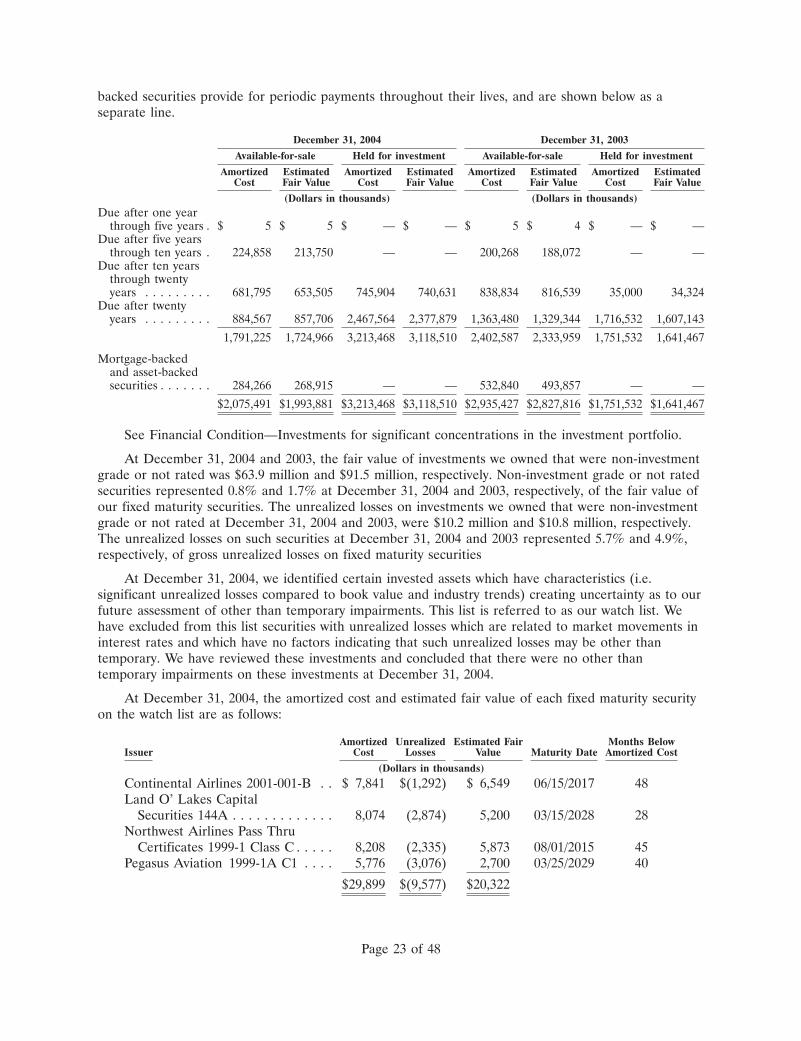
backed securities provide for periodic payments throughout their lives, and are shown below as aseparate line.
December 31, 2004 December 31, 2003
Available-for-sale Held for investment Available-for-sale Held for investment
Amortized Estimated Amortized Estimated Amortized Estimated Amortized EstimatedCost Fair Value Cost Fair Value Cost Fair Value Cost Fair Value
(Dollars in thousands) (Dollars in thousands)Due after one year
through five years . $ 5 $ 5 $ — $ — $ 5 $ 4 $ — $ —Due after five years
through ten years . 224,858 213,750 — — 200,268 188,072 — —Due after ten years
through twentyyears . . . . . . . . . 681,795 653,505 745,904 740,631 838,834 816,539 35,000 34,324
Due after twentyyears . . . . . . . . . 884,567 857,706 2,467,564 2,377,879 1,363,480 1,329,344 1,716,532 1,607,143
1,791,225 1,724,966 3,213,468 3,118,510 2,402,587 2,333,959 1,751,532 1,641,467
Mortgage-backedand asset-backedsecurities . . . . . . . 284,266 268,915 — — 532,840 493,857 — —
$2,075,491 $1,993,881 $3,213,468 $3,118,510 $2,935,427 $2,827,816 $1,751,532 $1,641,467
See Financial Condition—Investments for significant concentrations in the investment portfolio.
At December 31, 2004 and 2003, the fair value of investments we owned that were non-investmentgrade or not rated was $63.9 million and $91.5 million, respectively. Non-investment grade or not ratedsecurities represented 0.8% and 1.7% at December 31, 2004 and 2003, respectively, of the fair value ofour fixed maturity securities. The unrealized losses on investments we owned that were non-investmentgrade or not rated at December 31, 2004 and 2003, were $10.2 million and $10.8 million, respectively.The unrealized losses on such securities at December 31, 2004 and 2003 represented 5.7% and 4.9%,respectively, of gross unrealized losses on fixed maturity securities
At December 31, 2004, we identified certain invested assets which have characteristics (i.e.significant unrealized losses compared to book value and industry trends) creating uncertainty as to ourfuture assessment of other than temporary impairments. This list is referred to as our watch list. Wehave excluded from this list securities with unrealized losses which are related to market movements ininterest rates and which have no factors indicating that such unrealized losses may be other thantemporary. We have reviewed these investments and concluded that there were no other thantemporary impairments on these investments at December 31, 2004.
At December 31, 2004, the amortized cost and estimated fair value of each fixed maturity securityon the watch list are as follows:
Amortized Unrealized Estimated Fair Months BelowIssuer Cost Losses Value Maturity Date Amortized Cost
(Dollars in thousands)
Continental Airlines 2001-001-B . . $ 7,841 $(1,292) $ 6,549 06/15/2017 48Land O’ Lakes Capital
Securities 144A . . . . . . . . . . . . . 8,074 (2,874) 5,200 03/15/2028 28Northwest Airlines Pass Thru
Certificates 1999-1 Class C . . . . . 8,208 (2,335) 5,873 08/01/2015 45Pegasus Aviation 1999-1A C1 . . . . 5,776 (3,076) 2,700 03/25/2029 40
$29,899 $(9,577) $20,322
Page 23 of 48
Our analysis of these securities and their credit performance at December 31, 2004 is as follows:
Continental Airlines Pass Thru Certificates 2001-001 Class B are backed by the general credit ofContinental Airlines as well as the collateral from a pool of airplanes. We determined that another than temporary impairment charge was not necessary for the following reasons: (i) webelieved that Continental Airlines’ improving liquidity reduced the likelihood of bankruptcy and(ii) even if Continental Airlines were to declare bankruptcy, the chance of full recovery on thissecurity was high due to the excess collateral coverage supplied by the aircraft collateral.
Land O’ Lakes is a national, farmer-owned food and agricultural cooperative. We determined thatan other than temporary impairment charge was not necessary for the following reasons: (i) LandO’ Lakes operates in a cyclical industry and had successfully managed through previous cyclicallows; (ii) we calculated that Land O’ Lakes had adequate EBITDA to interest coverage of bankdebt and 4.51 times for bond debt and determined that Land O’ Lakes had adequate liquidity;(iii) Land O’ Lakes was in the process of improving its balance sheet by maintaining liquidity andselling non-strategic assets and investments; and (iv) further improvements were expected in thefuture.
Northwest Airlines Pass Thru Certificates 1999-1 Class C are backed by the general credit ofNorthwest Airlines as well as the collateral from a pool of airplanes. We determined that an otherthan temporary impairment charge was not necessary for the following reasons: (i) we believedthat a bankruptcy was unlikely since Northwest had begun to see benefits from its attempts toreturn to profitability; (ii) we believed Northwest had adequate liquidity; (iii) we calculatedNorthwest to have unrestricted cash at the end of the third quarter of 2004 of approximately$2.5 billion; (iv) even if Northwest declared bankruptcy, these bonds would have remained currentfor at least 18 months due to a liquidity coverage feature and the bonds could remain current after18 months if Northwest affirmed the leases on the planes in the collateral pool in the unlikelyevent of a bankruptcy; and (v) based upon the liquidity of Northwest ($2.5 billion at September 30,2004).
Pegasus Aviation 1999-1A C1 is backed by leases on airplanes and is structured as a pass-throughsecurity. We took an impairment charge of $1.9 million on this security in the fourth quarter of2001 because we did not expect to receive further principal payments. However, due to thecontinued problems in the leased airplane industry, the market value of this security had declinedfurther. We determined that no additional other than temporary impairment change was necessaryfor the following reasons: (i) although we did not expect to receive principal payments on thissecurity, we expected that interest payments would continue to be made until 2019 and (ii) thevalue of the expected future interest payments supported the current book value.
Each of the four securities on the watch list is current in respect to payments of principal andinterest. We have concluded for each of the four securities on the watch list that we have the intentand the ability to hold these securities for a period of time sufficient to allow for a recovery in fairvalue.
We took writedowns on certain other investments that we concluded did have an other thantemporary impairment during 2004, 2003 and 2002 of $12.8 million, $9.8 million and $13.0 million,respectively. Following is a discussion of each security for which we have taken write downs during theyears ended December 31, 2004, 2003 and 2002.
We owned the Class A3-A Tranche of the Juniper collateralized bond obligation. We wrote downthis security by $2.0 million to its fair value in the first quarter of 2002. Due to the structure ofpayments from the collateralized bond obligation, it was likely that we would continue receivinginterest payments for the foreseeable future, but it was unlikely that we would receive our entire
Page 24 of 48
principal at maturity. The fair value of this security continued to decline in subsequent months andwe sold the bond at an additional loss of $0.5 million in the second quarter of 2003.
Pegasus 2001-1A C2 is an asset-backed security backed by leases on 41 specific aircraft. We wrotedown this security by $3.0 million in the third quarter of 2002. The downturn in the airline industryhad caused lease rates on renewing leases to be significantly below expectations and this wasexacerbated by the terrorist attacks on September 11, 2001. Due to the continuing problems in theairline industry and continued lower lease rates on renewing leases, we took an additional writedown of $2.9 million on this security in the first quarter of 2003.
Jet Equipment Trust is an asset-backed security backed by collateral from a pool of planes and thegeneral credit of United Airlines. We wrote down this security by $6.4 million in the third quarterof 2002. The downturn in the airline industry and the possibility of United Airlines declaringbankruptcy had caused this security to trade significantly below cost at the time of the originalwrite down. United Airlines declared bankruptcy in the fourth quarter of 2002 and discontinuedmaking lease payments on the planes that support this trust. Due to the fact that any furtherpayments on this security were unlikely, we took an additional write down of $1.6 million in thefourth quarter of 2002 to reduce the book value to zero.
Oakwood Mortgage 1999-E Class M2 is an asset-backed security backed by installment salescontracts secured by manufactured homes and liens on real estate. We wrote down this security by$4.2 million in the third quarter of 2003 due to continuing high default rates for the manufacturedhousing industry causing doubt about the return of the entire principal balance. We wrote thissecurity down by an additional $2.7 million during the fourth quarter of 2003 due to furtherdeterioration in default rates.
Oakwood Mortgage 2000-C Class M1 is backed by installment sales contracts secured bymanufactured homes and liens on real estate. We wrote this security down by $7.6 million in thefirst quarter of 2004 due to an increase in default rates and realized losses above expected levelsalong with a downgrade to below investment grade on March 8, 2004. We took an additionalwritedown on this security of $3.7 million in the third quarter of 2004 due to continueddeterioration in default rates.
Diversified Asset Securities II Class B-1 is a pool of asset-backed securities that entitle the holdersthereof to receive payments that depend primarily on the cash flow from a specified pool offinancial assets. We wrote this security down by $1.5 million during the second quarter of 2004based upon the deterioration of the underlying collateral along with a downgrade to belowinvestment grade on June 2, 2004. We sold this security for an immaterial loss during the fourthquarter of 2004.
In making the decisions to write down the securities described above, we considered whether thefactors leading to those write downs impacted any other securities held in our portfolio. In cases wherewe determined that a decline in value was related to an industry-wide concern, we considered theimpact of such concern on all securities we held within that industry classification.
Page 25 of 48
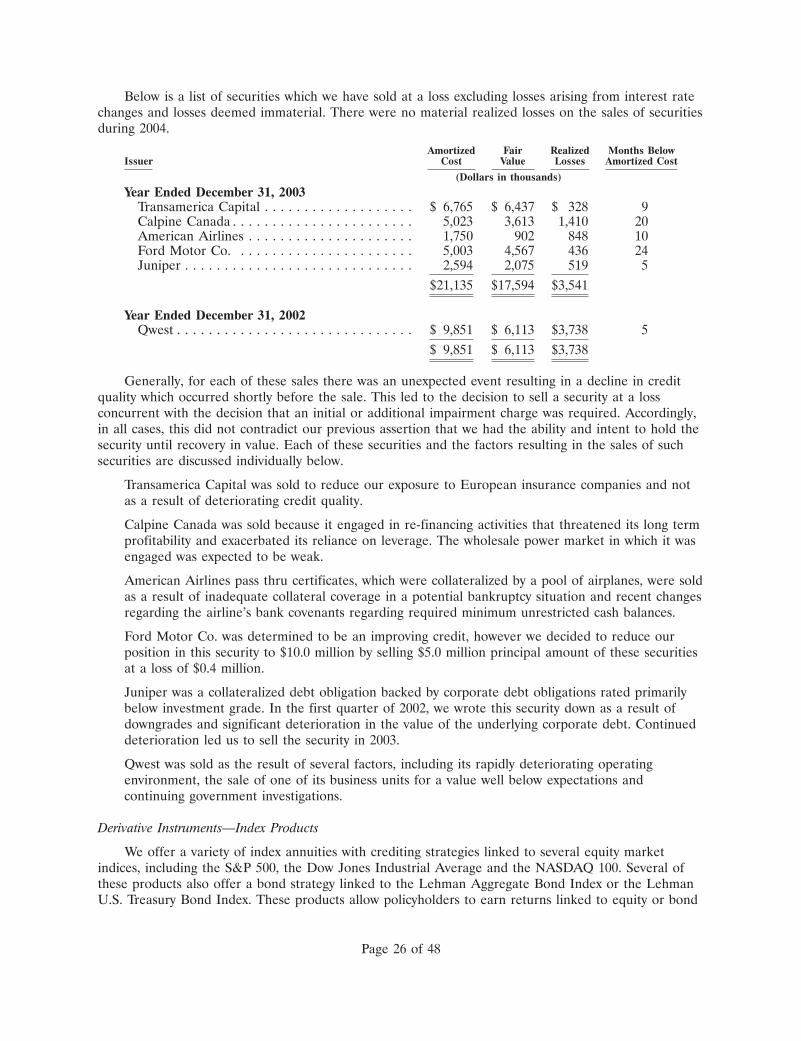
Below is a list of securities which we have sold at a loss excluding losses arising from interest ratechanges and losses deemed immaterial. There were no material realized losses on the sales of securitiesduring 2004.
Amortized Fair Realized Months BelowIssuer Cost Value Losses Amortized Cost
(Dollars in thousands)
Year Ended December 31, 2003Transamerica Capital . . . . . . . . . . . . . . . . . . . $ 6,765 $ 6,437 $ 328 9Calpine Canada . . . . . . . . . . . . . . . . . . . . . . . 5,023 3,613 1,410 20American Airlines . . . . . . . . . . . . . . . . . . . . . 1,750 902 848 10Ford Motor Co. . . . . . . . . . . . . . . . . . . . . . . 5,003 4,567 436 24Juniper . . . . . . . . . . . . . . . . . . . . . . . . . . . . . 2,594 2,075 519 5
$21,135 $17,594 $3,541
Year Ended December 31, 2002Qwest . . . . . . . . . . . . . . . . . . . . . . . . . . . . . . $ 9,851 $ 6,113 $3,738 5
$ 9,851 $ 6,113 $3,738
Generally, for each of these sales there was an unexpected event resulting in a decline in creditquality which occurred shortly before the sale. This led to the decision to sell a security at a lossconcurrent with the decision that an initial or additional impairment charge was required. Accordingly,in all cases, this did not contradict our previous assertion that we had the ability and intent to hold thesecurity until recovery in value. Each of these securities and the factors resulting in the sales of suchsecurities are discussed individually below.
Transamerica Capital was sold to reduce our exposure to European insurance companies and notas a result of deteriorating credit quality.
Calpine Canada was sold because it engaged in re-financing activities that threatened its long termprofitability and exacerbated its reliance on leverage. The wholesale power market in which it wasengaged was expected to be weak.
American Airlines pass thru certificates, which were collateralized by a pool of airplanes, were soldas a result of inadequate collateral coverage in a potential bankruptcy situation and recent changesregarding the airline’s bank covenants regarding required minimum unrestricted cash balances.
Ford Motor Co. was determined to be an improving credit, however we decided to reduce ourposition in this security to $10.0 million by selling $5.0 million principal amount of these securitiesat a loss of $0.4 million.
Juniper was a collateralized debt obligation backed by corporate debt obligations rated primarilybelow investment grade. In the first quarter of 2002, we wrote this security down as a result ofdowngrades and significant deterioration in the value of the underlying corporate debt. Continueddeterioration led us to sell the security in 2003.
Qwest was sold as the result of several factors, including its rapidly deteriorating operatingenvironment, the sale of one of its business units for a value well below expectations andcontinuing government investigations.
Derivative Instruments—Index Products
We offer a variety of index annuities with crediting strategies linked to several equity marketindices, including the S&P 500, the Dow Jones Industrial Average and the NASDAQ 100. Several ofthese products also offer a bond strategy linked to the Lehman Aggregate Bond Index or the LehmanU.S. Treasury Bond Index. These products allow policyholders to earn returns linked to equity or bond
Page 26 of 48
index appreciation without the risk of loss of their principal. Most of these products allow policyholdersto transfer funds once a year among several different crediting strategies, including one or more of theindex based strategies and a traditional fixed rate strategy. Substantially all of our index productsrequire annual crediting of interest and an annual reset of the applicable index on the contractanniversary date. The computation of the annual index credit is based upon either a one year annualpoint-to-point calculation (i.e., the gain in the applicable index from one anniversary date to the nextanniversary date), a monthly averaging of the index during the contract year, or a one year monthlypoint-to-point calculation (the net gain determined by adding the twelve monthly gains and losses inthe applicable index within the one year period from one anniversary date to the next anniversarydate).
The annuity contract value is equal to the premiums paid plus annual index credits based upon apercentage, known as the ‘‘participation rate’’, of the annual appreciation (based in some instances onmonthly averages or monthly point-to-point calculations) in a recognized index or benchmark. Theparticipation rate, which we may reset annually, generally varies among the index products from 50% to100%. Some of the products have an ‘‘asset fee’’ ranging from 1.5 to 5%, which is deducted from theinterest to be credited. The asset fees may be adjusted annually by us, subject to stated limits. Inaddition, some products apply an overall limit, or ‘‘cap’’, ranging from 5% to 13%, on the amount ofannual interest the policyholder may earn in any one contract year, and the applicable cap also may beadjusted annually subject to stated minimums. The minimum guaranteed contract values range from80% to 100% of the premium collected plus interest credited on the minimum guaranteed contractvalue at an annual rate of 2% to 3.5%.
We purchase one-year call options on the applicable indices as an investment to provide theincome needed to fund the amount of the annual index credits on the index products. New one-yearoptions are purchased at the outset of each contract year. We budget an amount to purchase thespecific options needed to fund the annual index credits, and the cost of the options represents our costof providing the credits. The amount we budget for the purchase of index call options is based on ourinterest spread targets and is comparable to the credited rates of interest we offer on fixed rateannuities. For example, if the yield on our invested assets is 6.25% and our targeted spread is 2.50%,we allocate up to 3.75% of the premium in the first year or account balance after the first year to thepurchase of one-year call options. Participation rates, which define the policyholder’s level ofparticipation in index gains each year, are determined by option costs. For example, if, based oncurrent market conditions, the amount allocated to the purchase of options is sufficient to purchase anoption that will provide a return equal to 70% of the annual gain in the applicable index, we will setthe policyholder’s participation rate at 70%. We have the ability to modify participation rates each yearwhen a new option is purchased. In general, if option costs increase, participation rates may bedecreased, and if option costs decrease, participation rates may be increased. We purchase call optionsweekly based upon new and renewing index account values during the applicable week, and thepurchases are made by category according to the particular products and indices applicable to the newor renewing account values. Any proceeds received on the options at the expiration of the one-yearterm fund the related index credits to the policyholders. If there is no gain in an index, thepolicyholder receives a zero index credit on the policy, and we incur no costs beyond the option cost,except in cases where the minimum guaranteed value of a contract exceeds its index value.
Page 27 of 48
Market value changes associated with the call options are reported as an increase or decrease inrevenues in our consolidated statements of income in accordance with Statement of FinancialAccounting Standards (‘‘SFAS’’) No. 133, ‘‘Accounting for Derivative Instruments and Hedging Activities’’.The risk associated with prospective purchases of future one-year options is the uncertainty of the cost,which will determine whether we are able to earn our spread on our index business. All our indexproducts permit us to modify participation rates, asset fees or annual income caps at least once a year.This feature is comparable to our fixed rate annuities, which allow us to adjust crediting rates annually.By modifying our participation rates or other features, we can limit our costs of purchasing the relatedone-year call options, except in cases where contractual features would prevent further modifications.Based upon actuarial testing which we conduct as a part of the design of our index products and on anongoing basis, we believe the risk that contractual features would prevent us from controlling optioncosts is not material.
After the purchase of the one-year call options and payment of acquisition costs, we invest thebalance of index premiums as a part of our general account invested assets. With respect to the indexproducts, our investment spread is measured as the difference between the aggregate yield on therelevant portion of our invested assets, less the aggregate option costs and the costs associated withminimum guarantees. If the minimum guaranteed value of an index product exceeds the index value(computed on a cumulative basis over the life of the contract) then the general account earnings areavailable to satisfy the minimum guarantees. If there were little or no gains in the entire series ofone-year options purchased over the expected life of an index annuity (typically 10 to 15 years), thenwe would incur expenses for credited interest over and above our option costs, causing our spread totighten and reducing our profits or potentially resulting in losses on these products.
Under SFAS No. 133, all derivative instruments (including certain derivative instruments embeddedin other contracts) are recognized in the balance sheet at their fair values and changes in fair value arerecognized immediately in earnings. This impacts the items of revenue and expense we report on ourindex business as follows:
• We must mark to market the purchased call options we use to fund the annual index credits onour index annuities based upon quoted market prices from related counterparties. We record thechange in fair value of these options as a component of our revenues. Included within thechange in fair value of the options is an element reflecting the time value of the options, whichinitially is their purchase cost declining to zero at the end of their one-year lives. The change infair value of derivatives also includes proceeds received at the expiration of the one year optionterms and gains or losses recognized upon early termination.
• Under SFAS No. 133, the future annual index credits on our index annuities are treated as a‘‘series of embedded derivatives’’ over the expected life of the applicable contracts. We arerequired to estimate the fair value of policy liabilities for index annuities, including theembedded derivatives, by valuing the ‘‘host’’ (or guaranteed) component of the liabilities andprojecting (i) the expected index credits on the next policy anniversary dates and (ii) the net costof annual options we will purchase in the future to fund index credits. Our estimates of the fairvalue of these embedded derivatives are based on assumptions related to underlying policy terms(including annual participation rates, asset fees, cap rates and minimum guarantees), indexvalues, notional amounts, strike prices and expected lives of the policies. The change in fairvalue of embedded derivatives increases with increases in volatility in the indices and interestrates. The change in fair value of the embedded derivatives will not correspond to the change infair value of the purchased options because the purchased options are one-year options whilethe options valued in the fair value of embedded derivatives cover the expected life of thecontracts which typically exceed 10 years.
Page 28 of 48
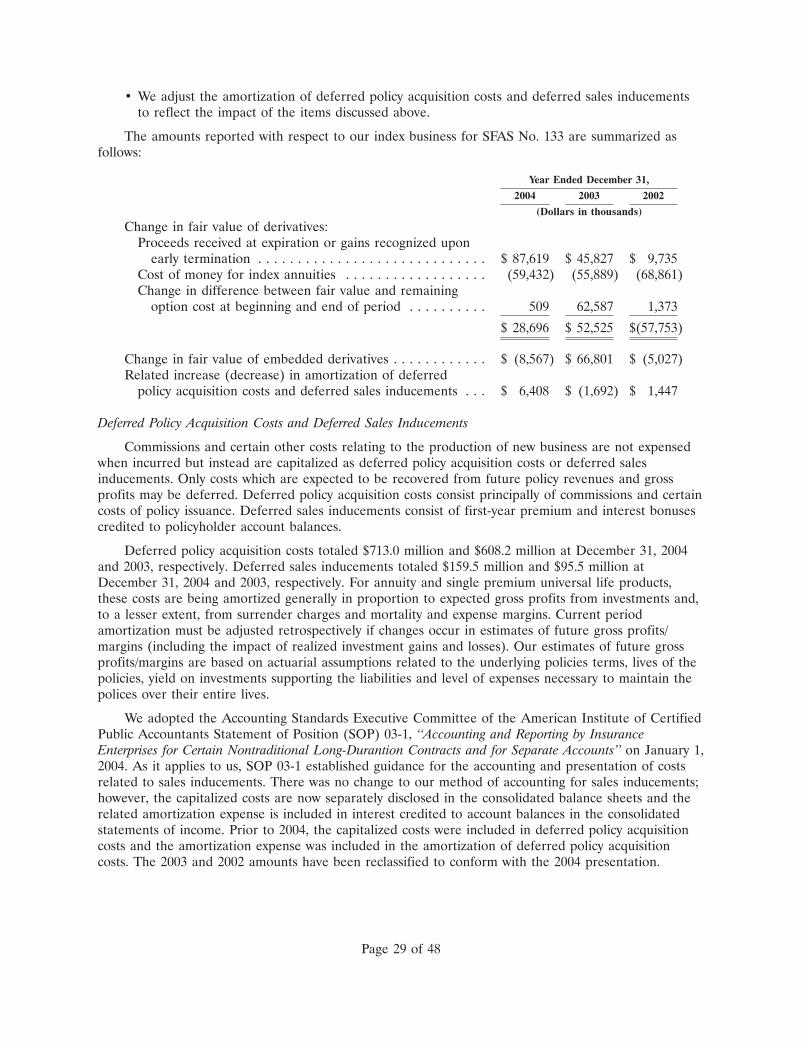
• We adjust the amortization of deferred policy acquisition costs and deferred sales inducementsto reflect the impact of the items discussed above.
The amounts reported with respect to our index business for SFAS No. 133 are summarized asfollows:
Year Ended December 31,
2004 2003 2002
(Dollars in thousands)
Change in fair value of derivatives:Proceeds received at expiration or gains recognized upon
early termination . . . . . . . . . . . . . . . . . . . . . . . . . . . . . $ 87,619 $ 45,827 $ 9,735Cost of money for index annuities . . . . . . . . . . . . . . . . . . (59,432) (55,889) (68,861)Change in difference between fair value and remaining
option cost at beginning and end of period . . . . . . . . . . 509 62,587 1,373
$ 28,696 $ 52,525 $(57,753)
Change in fair value of embedded derivatives . . . . . . . . . . . . $ (8,567) $ 66,801 $ (5,027)Related increase (decrease) in amortization of deferred
policy acquisition costs and deferred sales inducements . . . $ 6,408 $ (1,692) $ 1,447
Deferred Policy Acquisition Costs and Deferred Sales Inducements
Commissions and certain other costs relating to the production of new business are not expensedwhen incurred but instead are capitalized as deferred policy acquisition costs or deferred salesinducements. Only costs which are expected to be recovered from future policy revenues and grossprofits may be deferred. Deferred policy acquisition costs consist principally of commissions and certaincosts of policy issuance. Deferred sales inducements consist of first-year premium and interest bonusescredited to policyholder account balances.
Deferred policy acquisition costs totaled $713.0 million and $608.2 million at December 31, 2004and 2003, respectively. Deferred sales inducements totaled $159.5 million and $95.5 million atDecember 31, 2004 and 2003, respectively. For annuity and single premium universal life products,these costs are being amortized generally in proportion to expected gross profits from investments and,to a lesser extent, from surrender charges and mortality and expense margins. Current periodamortization must be adjusted retrospectively if changes occur in estimates of future gross profits/margins (including the impact of realized investment gains and losses). Our estimates of future grossprofits/margins are based on actuarial assumptions related to the underlying policies terms, lives of thepolicies, yield on investments supporting the liabilities and level of expenses necessary to maintain thepolices over their entire lives.
We adopted the Accounting Standards Executive Committee of the American Institute of CertifiedPublic Accountants Statement of Position (SOP) 03-1, ‘‘Accounting and Reporting by InsuranceEnterprises for Certain Nontraditional Long-Durantion Contracts and for Separate Accounts’’ on January 1,2004. As it applies to us, SOP 03-1 established guidance for the accounting and presentation of costsrelated to sales inducements. There was no change to our method of accounting for sales inducements;however, the capitalized costs are now separately disclosed in the consolidated balance sheets and therelated amortization expense is included in interest credited to account balances in the consolidatedstatements of income. Prior to 2004, the capitalized costs were included in deferred policy acquisitioncosts and the amortization expense was included in the amortization of deferred policy acquisitioncosts. The 2003 and 2002 amounts have been reclassified to conform with the 2004 presentation.
Page 29 of 48
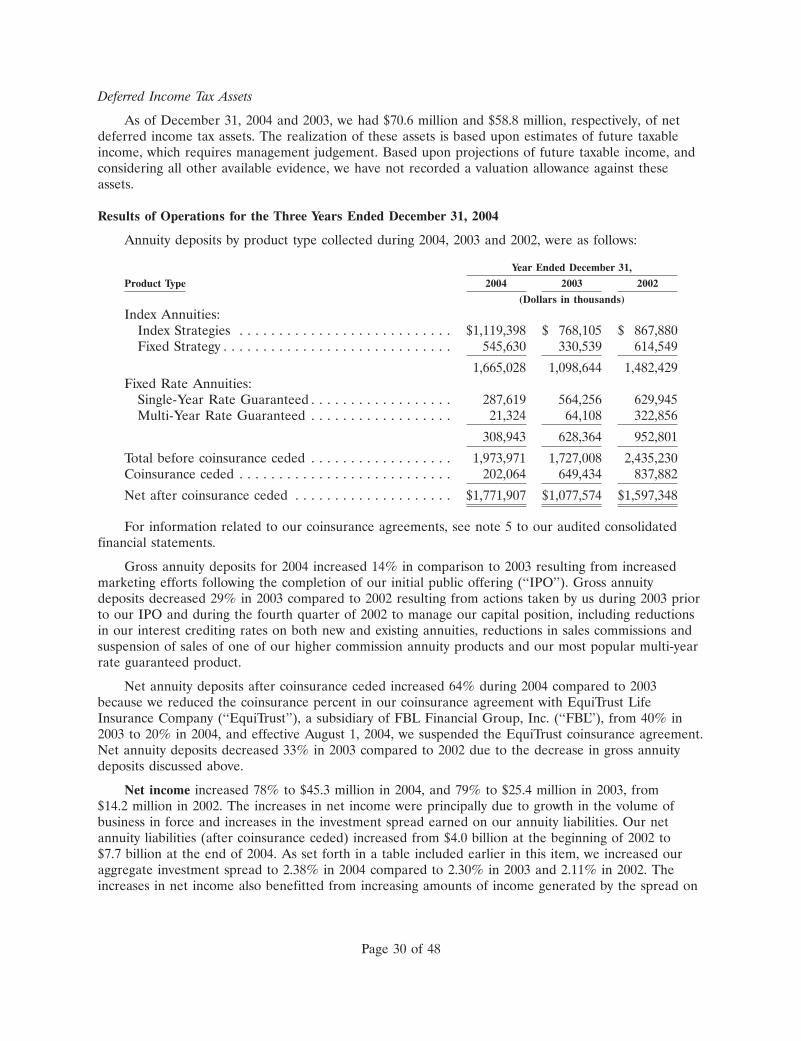
Deferred Income Tax Assets
As of December 31, 2004 and 2003, we had $70.6 million and $58.8 million, respectively, of netdeferred income tax assets. The realization of these assets is based upon estimates of future taxableincome, which requires management judgement. Based upon projections of future taxable income, andconsidering all other available evidence, we have not recorded a valuation allowance against theseassets.
Results of Operations for the Three Years Ended December 31, 2004
Annuity deposits by product type collected during 2004, 2003 and 2002, were as follows:
Year Ended December 31,
Product Type 2004 2003 2002
(Dollars in thousands)
Index Annuities:Index Strategies . . . . . . . . . . . . . . . . . . . . . . . . . . . $1,119,398 $ 768,105 $ 867,880Fixed Strategy . . . . . . . . . . . . . . . . . . . . . . . . . . . . . 545,630 330,539 614,549
1,665,028 1,098,644 1,482,429Fixed Rate Annuities:
Single-Year Rate Guaranteed . . . . . . . . . . . . . . . . . . 287,619 564,256 629,945Multi-Year Rate Guaranteed . . . . . . . . . . . . . . . . . . 21,324 64,108 322,856
308,943 628,364 952,801
Total before coinsurance ceded . . . . . . . . . . . . . . . . . . 1,973,971 1,727,008 2,435,230Coinsurance ceded . . . . . . . . . . . . . . . . . . . . . . . . . . . 202,064 649,434 837,882
Net after coinsurance ceded . . . . . . . . . . . . . . . . . . . . $1,771,907 $1,077,574 $1,597,348
For information related to our coinsurance agreements, see note 5 to our audited consolidatedfinancial statements.
Gross annuity deposits for 2004 increased 14% in comparison to 2003 resulting from increasedmarketing efforts following the completion of our initial public offering (‘‘IPO’’). Gross annuitydeposits decreased 29% in 2003 compared to 2002 resulting from actions taken by us during 2003 priorto our IPO and during the fourth quarter of 2002 to manage our capital position, including reductionsin our interest crediting rates on both new and existing annuities, reductions in sales commissions andsuspension of sales of one of our higher commission annuity products and our most popular multi-yearrate guaranteed product.
Net annuity deposits after coinsurance ceded increased 64% during 2004 compared to 2003because we reduced the coinsurance percent in our coinsurance agreement with EquiTrust LifeInsurance Company (‘‘EquiTrust’’), a subsidiary of FBL Financial Group, Inc. (‘‘FBL’’), from 40% in2003 to 20% in 2004, and effective August 1, 2004, we suspended the EquiTrust coinsurance agreement.Net annuity deposits decreased 33% in 2003 compared to 2002 due to the decrease in gross annuitydeposits discussed above.
Net income increased 78% to $45.3 million in 2004, and 79% to $25.4 million in 2003, from$14.2 million in 2002. The increases in net income were principally due to growth in the volume ofbusiness in force and increases in the investment spread earned on our annuity liabilities. Our netannuity liabilities (after coinsurance ceded) increased from $4.0 billion at the beginning of 2002 to$7.7 billion at the end of 2004. As set forth in a table included earlier in this item, we increased ouraggregate investment spread to 2.38% in 2004 compared to 2.30% in 2003 and 2.11% in 2002. Theincreases in net income also benefitted from increasing amounts of income generated by the spread on
Page 30 of 48
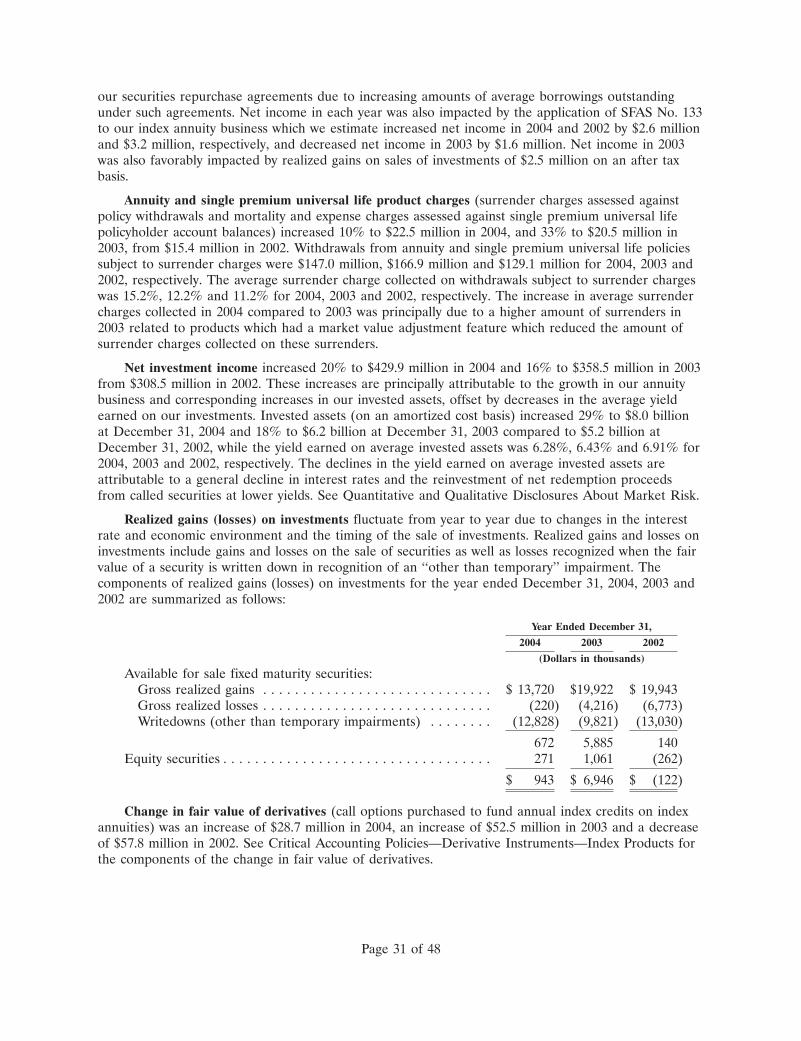
our securities repurchase agreements due to increasing amounts of average borrowings outstandingunder such agreements. Net income in each year was also impacted by the application of SFAS No. 133to our index annuity business which we estimate increased net income in 2004 and 2002 by $2.6 millionand $3.2 million, respectively, and decreased net income in 2003 by $1.6 million. Net income in 2003was also favorably impacted by realized gains on sales of investments of $2.5 million on an after taxbasis.
Annuity and single premium universal life product charges (surrender charges assessed againstpolicy withdrawals and mortality and expense charges assessed against single premium universal lifepolicyholder account balances) increased 10% to $22.5 million in 2004, and 33% to $20.5 million in2003, from $15.4 million in 2002. Withdrawals from annuity and single premium universal life policiessubject to surrender charges were $147.0 million, $166.9 million and $129.1 million for 2004, 2003 and2002, respectively. The average surrender charge collected on withdrawals subject to surrender chargeswas 15.2%, 12.2% and 11.2% for 2004, 2003 and 2002, respectively. The increase in average surrendercharges collected in 2004 compared to 2003 was principally due to a higher amount of surrenders in2003 related to products which had a market value adjustment feature which reduced the amount ofsurrender charges collected on these surrenders.
Net investment income increased 20% to $429.9 million in 2004 and 16% to $358.5 million in 2003from $308.5 million in 2002. These increases are principally attributable to the growth in our annuitybusiness and corresponding increases in our invested assets, offset by decreases in the average yieldearned on our investments. Invested assets (on an amortized cost basis) increased 29% to $8.0 billionat December 31, 2004 and 18% to $6.2 billion at December 31, 2003 compared to $5.2 billion atDecember 31, 2002, while the yield earned on average invested assets was 6.28%, 6.43% and 6.91% for2004, 2003 and 2002, respectively. The declines in the yield earned on average invested assets areattributable to a general decline in interest rates and the reinvestment of net redemption proceedsfrom called securities at lower yields. See Quantitative and Qualitative Disclosures About Market Risk.
Realized gains (losses) on investments fluctuate from year to year due to changes in the interestrate and economic environment and the timing of the sale of investments. Realized gains and losses oninvestments include gains and losses on the sale of securities as well as losses recognized when the fairvalue of a security is written down in recognition of an ‘‘other than temporary’’ impairment. Thecomponents of realized gains (losses) on investments for the year ended December 31, 2004, 2003 and2002 are summarized as follows:
Year Ended December 31,
2004 2003 2002
(Dollars in thousands)
Available for sale fixed maturity securities:Gross realized gains . . . . . . . . . . . . . . . . . . . . . . . . . . . . . $ 13,720 $19,922 $ 19,943Gross realized losses . . . . . . . . . . . . . . . . . . . . . . . . . . . . . (220) (4,216) (6,773)Writedowns (other than temporary impairments) . . . . . . . . (12,828) (9,821) (13,030)
672 5,885 140Equity securities . . . . . . . . . . . . . . . . . . . . . . . . . . . . . . . . . . 271 1,061 (262)
$ 943 $ 6,946 $ (122)
Change in fair value of derivatives (call options purchased to fund annual index credits on indexannuities) was an increase of $28.7 million in 2004, an increase of $52.5 million in 2003 and a decreaseof $57.8 million in 2002. See Critical Accounting Policies—Derivative Instruments—Index Products forthe components of the change in fair value of derivatives.
Page 31 of 48
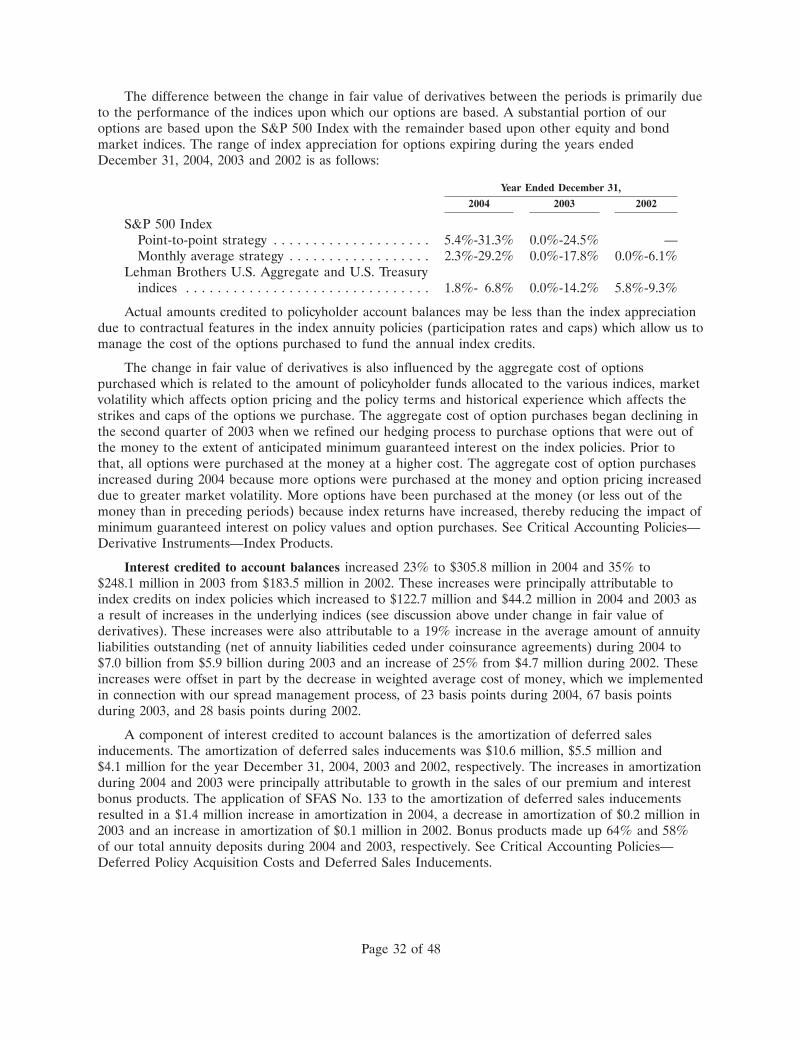
The difference between the change in fair value of derivatives between the periods is primarily dueto the performance of the indices upon which our options are based. A substantial portion of ouroptions are based upon the S&P 500 Index with the remainder based upon other equity and bondmarket indices. The range of index appreciation for options expiring during the years endedDecember 31, 2004, 2003 and 2002 is as follows:
Year Ended December 31,
2004 2003 2002
S&P 500 IndexPoint-to-point strategy . . . . . . . . . . . . . . . . . . . . 5.4%-31.3% 0.0%-24.5% —Monthly average strategy . . . . . . . . . . . . . . . . . . 2.3%-29.2% 0.0%-17.8% 0.0%-6.1%
Lehman Brothers U.S. Aggregate and U.S. Treasuryindices . . . . . . . . . . . . . . . . . . . . . . . . . . . . . . . 1.8%- 6.8% 0.0%-14.2% 5.8%-9.3%
Actual amounts credited to policyholder account balances may be less than the index appreciationdue to contractual features in the index annuity policies (participation rates and caps) which allow us tomanage the cost of the options purchased to fund the annual index credits.
The change in fair value of derivatives is also influenced by the aggregate cost of optionspurchased which is related to the amount of policyholder funds allocated to the various indices, marketvolatility which affects option pricing and the policy terms and historical experience which affects thestrikes and caps of the options we purchase. The aggregate cost of option purchases began declining inthe second quarter of 2003 when we refined our hedging process to purchase options that were out ofthe money to the extent of anticipated minimum guaranteed interest on the index policies. Prior tothat, all options were purchased at the money at a higher cost. The aggregate cost of option purchasesincreased during 2004 because more options were purchased at the money and option pricing increaseddue to greater market volatility. More options have been purchased at the money (or less out of themoney than in preceding periods) because index returns have increased, thereby reducing the impact ofminimum guaranteed interest on policy values and option purchases. See Critical Accounting Policies—Derivative Instruments—Index Products.
Interest credited to account balances increased 23% to $305.8 million in 2004 and 35% to$248.1 million in 2003 from $183.5 million in 2002. These increases were principally attributable toindex credits on index policies which increased to $122.7 million and $44.2 million in 2004 and 2003 asa result of increases in the underlying indices (see discussion above under change in fair value ofderivatives). These increases were also attributable to a 19% increase in the average amount of annuityliabilities outstanding (net of annuity liabilities ceded under coinsurance agreements) during 2004 to$7.0 billion from $5.9 billion during 2003 and an increase of 25% from $4.7 million during 2002. Theseincreases were offset in part by the decrease in weighted average cost of money, which we implementedin connection with our spread management process, of 23 basis points during 2004, 67 basis pointsduring 2003, and 28 basis points during 2002.
A component of interest credited to account balances is the amortization of deferred salesinducements. The amortization of deferred sales inducements was $10.6 million, $5.5 million and$4.1 million for the year December 31, 2004, 2003 and 2002, respectively. The increases in amortizationduring 2004 and 2003 were principally attributable to growth in the sales of our premium and interestbonus products. The application of SFAS No. 133 to the amortization of deferred sales inducementsresulted in a $1.4 million increase in amortization in 2004, a decrease in amortization of $0.2 million in2003 and an increase in amortization of $0.1 million in 2002. Bonus products made up 64% and 58%of our total annuity deposits during 2004 and 2003, respectively. See Critical Accounting Policies—Deferred Policy Acquisition Costs and Deferred Sales Inducements.
Page 32 of 48
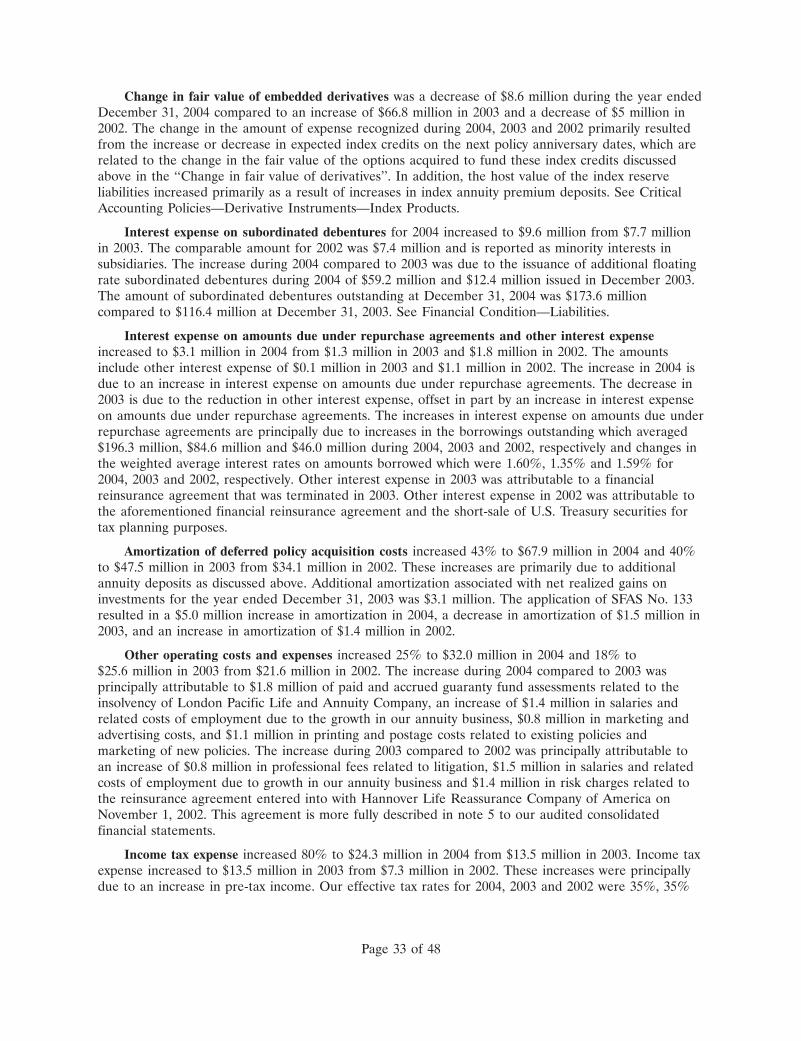
Change in fair value of embedded derivatives was a decrease of $8.6 million during the year endedDecember 31, 2004 compared to an increase of $66.8 million in 2003 and a decrease of $5 million in2002. The change in the amount of expense recognized during 2004, 2003 and 2002 primarily resultedfrom the increase or decrease in expected index credits on the next policy anniversary dates, which arerelated to the change in the fair value of the options acquired to fund these index credits discussedabove in the ‘‘Change in fair value of derivatives’’. In addition, the host value of the index reserveliabilities increased primarily as a result of increases in index annuity premium deposits. See CriticalAccounting Policies—Derivative Instruments—Index Products.
Interest expense on subordinated debentures for 2004 increased to $9.6 million from $7.7 millionin 2003. The comparable amount for 2002 was $7.4 million and is reported as minority interests insubsidiaries. The increase during 2004 compared to 2003 was due to the issuance of additional floatingrate subordinated debentures during 2004 of $59.2 million and $12.4 million issued in December 2003.The amount of subordinated debentures outstanding at December 31, 2004 was $173.6 millioncompared to $116.4 million at December 31, 2003. See Financial Condition—Liabilities.
Interest expense on amounts due under repurchase agreements and other interest expenseincreased to $3.1 million in 2004 from $1.3 million in 2003 and $1.8 million in 2002. The amountsinclude other interest expense of $0.1 million in 2003 and $1.1 million in 2002. The increase in 2004 isdue to an increase in interest expense on amounts due under repurchase agreements. The decrease in2003 is due to the reduction in other interest expense, offset in part by an increase in interest expenseon amounts due under repurchase agreements. The increases in interest expense on amounts due underrepurchase agreements are principally due to increases in the borrowings outstanding which averaged$196.3 million, $84.6 million and $46.0 million during 2004, 2003 and 2002, respectively and changes inthe weighted average interest rates on amounts borrowed which were 1.60%, 1.35% and 1.59% for2004, 2003 and 2002, respectively. Other interest expense in 2003 was attributable to a financialreinsurance agreement that was terminated in 2003. Other interest expense in 2002 was attributable tothe aforementioned financial reinsurance agreement and the short-sale of U.S. Treasury securities fortax planning purposes.
Amortization of deferred policy acquisition costs increased 43% to $67.9 million in 2004 and 40%to $47.5 million in 2003 from $34.1 million in 2002. These increases are primarily due to additionalannuity deposits as discussed above. Additional amortization associated with net realized gains oninvestments for the year ended December 31, 2003 was $3.1 million. The application of SFAS No. 133resulted in a $5.0 million increase in amortization in 2004, a decrease in amortization of $1.5 million in2003, and an increase in amortization of $1.4 million in 2002.
Other operating costs and expenses increased 25% to $32.0 million in 2004 and 18% to$25.6 million in 2003 from $21.6 million in 2002. The increase during 2004 compared to 2003 wasprincipally attributable to $1.8 million of paid and accrued guaranty fund assessments related to theinsolvency of London Pacific Life and Annuity Company, an increase of $1.4 million in salaries andrelated costs of employment due to the growth in our annuity business, $0.8 million in marketing andadvertising costs, and $1.1 million in printing and postage costs related to existing policies andmarketing of new policies. The increase during 2003 compared to 2002 was principally attributable toan increase of $0.8 million in professional fees related to litigation, $1.5 million in salaries and relatedcosts of employment due to growth in our annuity business and $1.4 million in risk charges related tothe reinsurance agreement entered into with Hannover Life Reassurance Company of America onNovember 1, 2002. This agreement is more fully described in note 5 to our audited consolidatedfinancial statements.
Income tax expense increased 80% to $24.3 million in 2004 from $13.5 million in 2003. Income taxexpense increased to $13.5 million in 2003 from $7.3 million in 2002. These increases were principallydue to an increase in pre-tax income. Our effective tax rates for 2004, 2003 and 2002 were 35%, 35%
Page 33 of 48
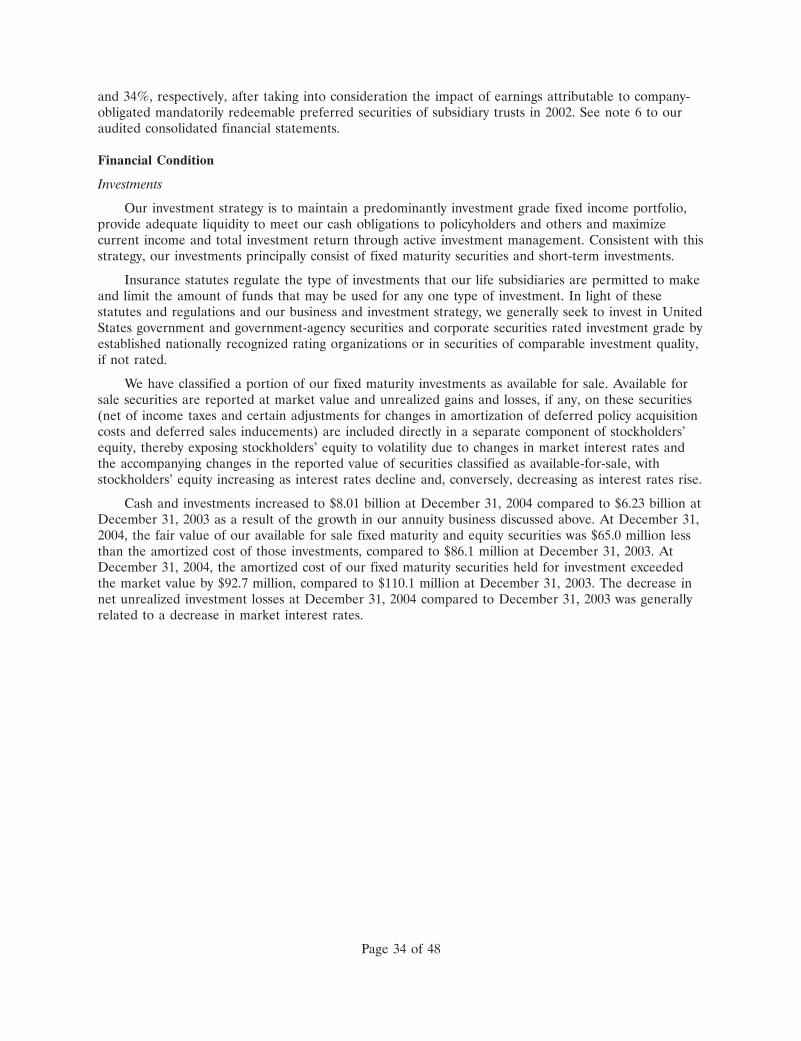
and 34%, respectively, after taking into consideration the impact of earnings attributable to company-obligated mandatorily redeemable preferred securities of subsidiary trusts in 2002. See note 6 to ouraudited consolidated financial statements.
Financial Condition
Investments
Our investment strategy is to maintain a predominantly investment grade fixed income portfolio,provide adequate liquidity to meet our cash obligations to policyholders and others and maximizecurrent income and total investment return through active investment management. Consistent with thisstrategy, our investments principally consist of fixed maturity securities and short-term investments.
Insurance statutes regulate the type of investments that our life subsidiaries are permitted to makeand limit the amount of funds that may be used for any one type of investment. In light of thesestatutes and regulations and our business and investment strategy, we generally seek to invest in UnitedStates government and government-agency securities and corporate securities rated investment grade byestablished nationally recognized rating organizations or in securities of comparable investment quality,if not rated.
We have classified a portion of our fixed maturity investments as available for sale. Available forsale securities are reported at market value and unrealized gains and losses, if any, on these securities(net of income taxes and certain adjustments for changes in amortization of deferred policy acquisitioncosts and deferred sales inducements) are included directly in a separate component of stockholders’equity, thereby exposing stockholders’ equity to volatility due to changes in market interest rates andthe accompanying changes in the reported value of securities classified as available-for-sale, withstockholders’ equity increasing as interest rates decline and, conversely, decreasing as interest rates rise.
Cash and investments increased to $8.01 billion at December 31, 2004 compared to $6.23 billion atDecember 31, 2003 as a result of the growth in our annuity business discussed above. At December 31,2004, the fair value of our available for sale fixed maturity and equity securities was $65.0 million lessthan the amortized cost of those investments, compared to $86.1 million at December 31, 2003. AtDecember 31, 2004, the amortized cost of our fixed maturity securities held for investment exceededthe market value by $92.7 million, compared to $110.1 million at December 31, 2003. The decrease innet unrealized investment losses at December 31, 2004 compared to December 31, 2003 was generallyrelated to a decrease in market interest rates.
Page 34 of 48
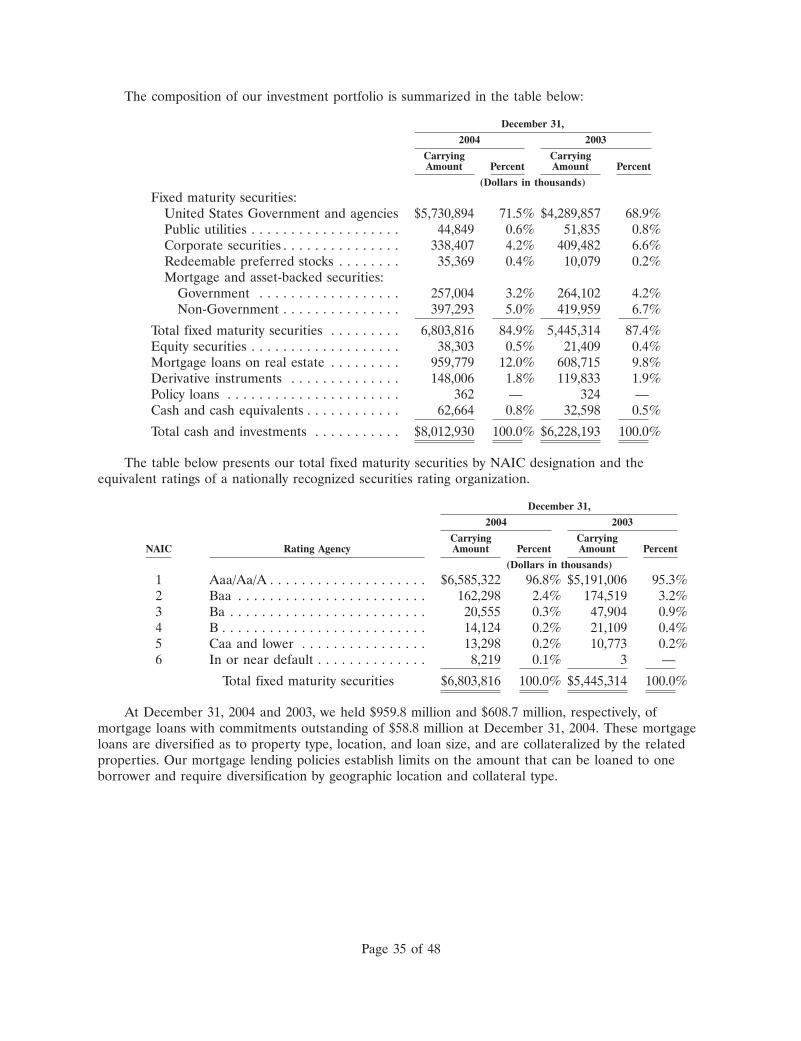
The composition of our investment portfolio is summarized in the table below:
December 31,
2004 2003
Carrying CarryingAmount Percent Amount Percent
(Dollars in thousands)
Fixed maturity securities:United States Government and agencies $5,730,894 71.5% $4,289,857 68.9%Public utilities . . . . . . . . . . . . . . . . . . . 44,849 0.6% 51,835 0.8%Corporate securities . . . . . . . . . . . . . . . 338,407 4.2% 409,482 6.6%Redeemable preferred stocks . . . . . . . . 35,369 0.4% 10,079 0.2%Mortgage and asset-backed securities:
Government . . . . . . . . . . . . . . . . . . 257,004 3.2% 264,102 4.2%Non-Government . . . . . . . . . . . . . . . 397,293 5.0% 419,959 6.7%
Total fixed maturity securities . . . . . . . . . 6,803,816 84.9% 5,445,314 87.4%Equity securities . . . . . . . . . . . . . . . . . . . 38,303 0.5% 21,409 0.4%Mortgage loans on real estate . . . . . . . . . 959,779 12.0% 608,715 9.8%Derivative instruments . . . . . . . . . . . . . . 148,006 1.8% 119,833 1.9%Policy loans . . . . . . . . . . . . . . . . . . . . . . 362 — 324 —Cash and cash equivalents . . . . . . . . . . . . 62,664 0.8% 32,598 0.5%
Total cash and investments . . . . . . . . . . . $8,012,930 100.0% $6,228,193 100.0%
The table below presents our total fixed maturity securities by NAIC designation and theequivalent ratings of a nationally recognized securities rating organization.
December 31,
2004 2003
Carrying CarryingNAIC Rating Agency Amount Percent Amount Percent
(Dollars in thousands)
1 Aaa/Aa/A . . . . . . . . . . . . . . . . . . . . $6,585,322 96.8% $5,191,006 95.3%2 Baa . . . . . . . . . . . . . . . . . . . . . . . . 162,298 2.4% 174,519 3.2%3 Ba . . . . . . . . . . . . . . . . . . . . . . . . . 20,555 0.3% 47,904 0.9%4 B . . . . . . . . . . . . . . . . . . . . . . . . . . 14,124 0.2% 21,109 0.4%5 Caa and lower . . . . . . . . . . . . . . . . 13,298 0.2% 10,773 0.2%6 In or near default . . . . . . . . . . . . . . 8,219 0.1% 3 —
Total fixed maturity securities $6,803,816 100.0% $5,445,314 100.0%
At December 31, 2004 and 2003, we held $959.8 million and $608.7 million, respectively, ofmortgage loans with commitments outstanding of $58.8 million at December 31, 2004. These mortgageloans are diversified as to property type, location, and loan size, and are collateralized by the relatedproperties. Our mortgage lending policies establish limits on the amount that can be loaned to oneborrower and require diversification by geographic location and collateral type.
Page 35 of 48
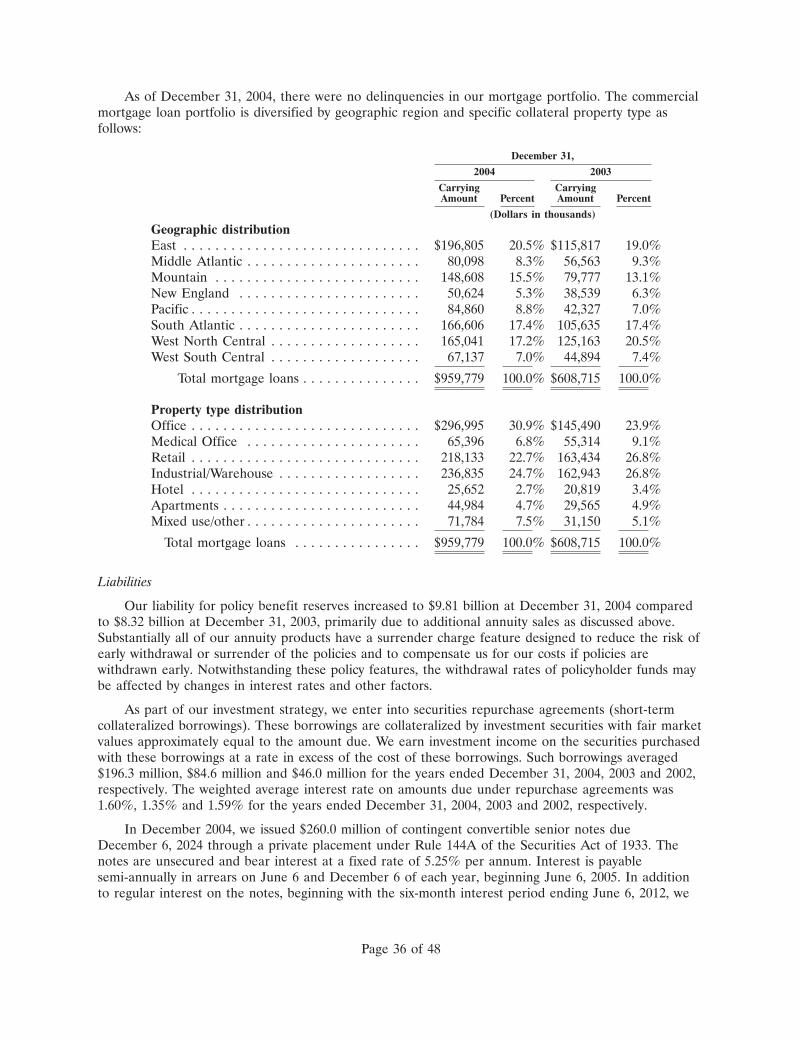
As of December 31, 2004, there were no delinquencies in our mortgage portfolio. The commercialmortgage loan portfolio is diversified by geographic region and specific collateral property type asfollows:
December 31,
2004 2003
Carrying CarryingAmount Percent Amount Percent
(Dollars in thousands)
Geographic distributionEast . . . . . . . . . . . . . . . . . . . . . . . . . . . . . . $196,805 20.5% $115,817 19.0%Middle Atlantic . . . . . . . . . . . . . . . . . . . . . . 80,098 8.3% 56,563 9.3%Mountain . . . . . . . . . . . . . . . . . . . . . . . . . . 148,608 15.5% 79,777 13.1%New England . . . . . . . . . . . . . . . . . . . . . . . 50,624 5.3% 38,539 6.3%Pacific . . . . . . . . . . . . . . . . . . . . . . . . . . . . . 84,860 8.8% 42,327 7.0%South Atlantic . . . . . . . . . . . . . . . . . . . . . . . 166,606 17.4% 105,635 17.4%West North Central . . . . . . . . . . . . . . . . . . . 165,041 17.2% 125,163 20.5%West South Central . . . . . . . . . . . . . . . . . . . 67,137 7.0% 44,894 7.4%
Total mortgage loans . . . . . . . . . . . . . . . $959,779 100.0% $608,715 100.0%
Property type distributionOffice . . . . . . . . . . . . . . . . . . . . . . . . . . . . . $296,995 30.9% $145,490 23.9%Medical Office . . . . . . . . . . . . . . . . . . . . . . 65,396 6.8% 55,314 9.1%Retail . . . . . . . . . . . . . . . . . . . . . . . . . . . . . 218,133 22.7% 163,434 26.8%Industrial/Warehouse . . . . . . . . . . . . . . . . . . 236,835 24.7% 162,943 26.8%Hotel . . . . . . . . . . . . . . . . . . . . . . . . . . . . . 25,652 2.7% 20,819 3.4%Apartments . . . . . . . . . . . . . . . . . . . . . . . . . 44,984 4.7% 29,565 4.9%Mixed use/other . . . . . . . . . . . . . . . . . . . . . . 71,784 7.5% 31,150 5.1%
Total mortgage loans . . . . . . . . . . . . . . . . $959,779 100.0% $608,715 100.0%
Liabilities
Our liability for policy benefit reserves increased to $9.81 billion at December 31, 2004 comparedto $8.32 billion at December 31, 2003, primarily due to additional annuity sales as discussed above.Substantially all of our annuity products have a surrender charge feature designed to reduce the risk ofearly withdrawal or surrender of the policies and to compensate us for our costs if policies arewithdrawn early. Notwithstanding these policy features, the withdrawal rates of policyholder funds maybe affected by changes in interest rates and other factors.
As part of our investment strategy, we enter into securities repurchase agreements (short-termcollateralized borrowings). These borrowings are collateralized by investment securities with fair marketvalues approximately equal to the amount due. We earn investment income on the securities purchasedwith these borrowings at a rate in excess of the cost of these borrowings. Such borrowings averaged$196.3 million, $84.6 million and $46.0 million for the years ended December 31, 2004, 2003 and 2002,respectively. The weighted average interest rate on amounts due under repurchase agreements was1.60%, 1.35% and 1.59% for the years ended December 31, 2004, 2003 and 2002, respectively.
In December 2004, we issued $260.0 million of contingent convertible senior notes dueDecember 6, 2024 through a private placement under Rule 144A of the Securities Act of 1933. Thenotes are unsecured and bear interest at a fixed rate of 5.25% per annum. Interest is payablesemi-annually in arrears on June 6 and December 6 of each year, beginning June 6, 2005. In additionto regular interest on the notes, beginning with the six-month interest period ending June 6, 2012, we
Page 36 of 48
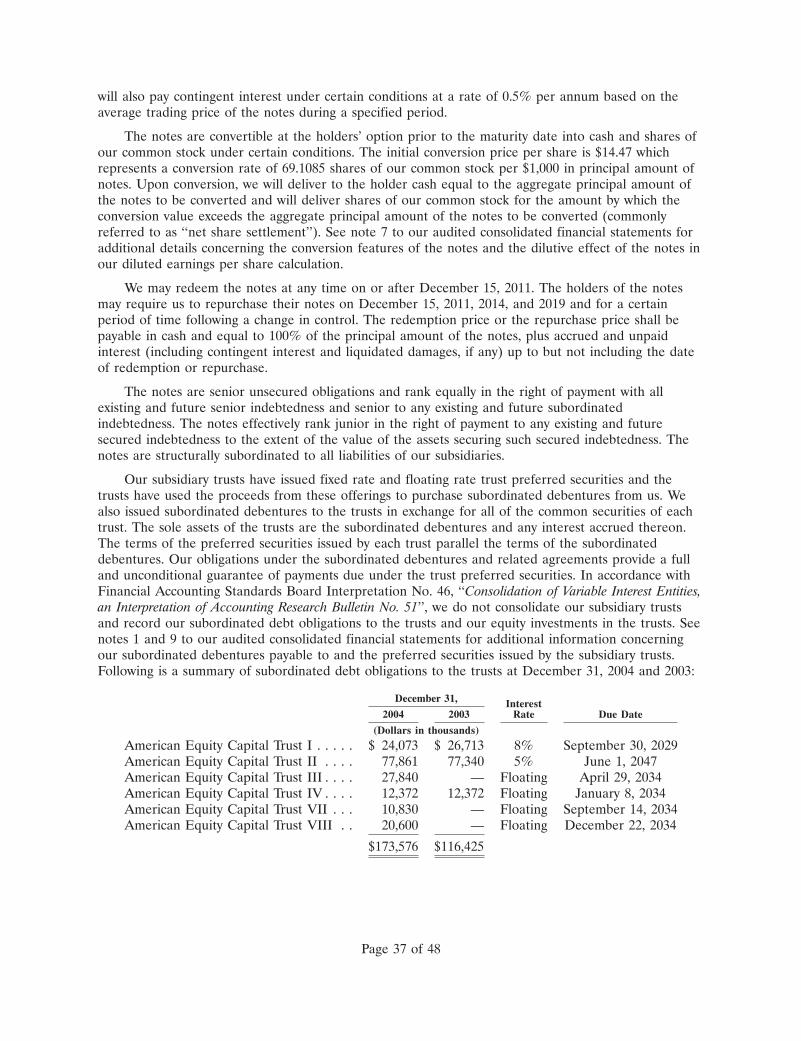
will also pay contingent interest under certain conditions at a rate of 0.5% per annum based on theaverage trading price of the notes during a specified period.
The notes are convertible at the holders’ option prior to the maturity date into cash and shares ofour common stock under certain conditions. The initial conversion price per share is $14.47 whichrepresents a conversion rate of 69.1085 shares of our common stock per $1,000 in principal amount ofnotes. Upon conversion, we will deliver to the holder cash equal to the aggregate principal amount ofthe notes to be converted and will deliver shares of our common stock for the amount by which theconversion value exceeds the aggregate principal amount of the notes to be converted (commonlyreferred to as ‘‘net share settlement’’). See note 7 to our audited consolidated financial statements foradditional details concerning the conversion features of the notes and the dilutive effect of the notes inour diluted earnings per share calculation.
We may redeem the notes at any time on or after December 15, 2011. The holders of the notesmay require us to repurchase their notes on December 15, 2011, 2014, and 2019 and for a certainperiod of time following a change in control. The redemption price or the repurchase price shall bepayable in cash and equal to 100% of the principal amount of the notes, plus accrued and unpaidinterest (including contingent interest and liquidated damages, if any) up to but not including the dateof redemption or repurchase.
The notes are senior unsecured obligations and rank equally in the right of payment with allexisting and future senior indebtedness and senior to any existing and future subordinatedindebtedness. The notes effectively rank junior in the right of payment to any existing and futuresecured indebtedness to the extent of the value of the assets securing such secured indebtedness. Thenotes are structurally subordinated to all liabilities of our subsidiaries.
Our subsidiary trusts have issued fixed rate and floating rate trust preferred securities and thetrusts have used the proceeds from these offerings to purchase subordinated debentures from us. Wealso issued subordinated debentures to the trusts in exchange for all of the common securities of eachtrust. The sole assets of the trusts are the subordinated debentures and any interest accrued thereon.The terms of the preferred securities issued by each trust parallel the terms of the subordinateddebentures. Our obligations under the subordinated debentures and related agreements provide a fulland unconditional guarantee of payments due under the trust preferred securities. In accordance withFinancial Accounting Standards Board Interpretation No. 46, ‘‘Consolidation of Variable Interest Entities,an Interpretation of Accounting Research Bulletin No. 51’’, we do not consolidate our subsidiary trustsand record our subordinated debt obligations to the trusts and our equity investments in the trusts. Seenotes 1 and 9 to our audited consolidated financial statements for additional information concerningour subordinated debentures payable to and the preferred securities issued by the subsidiary trusts.Following is a summary of subordinated debt obligations to the trusts at December 31, 2004 and 2003:
December 31, Interest2004 2003 Rate Due Date
(Dollars in thousands)
American Equity Capital Trust I . . . . . $ 24,073 $ 26,713 8% September 30, 2029American Equity Capital Trust II . . . . 77,861 77,340 5% June 1, 2047American Equity Capital Trust III . . . . 27,840 — Floating April 29, 2034American Equity Capital Trust IV . . . . 12,372 12,372 Floating January 8, 2034American Equity Capital Trust VII . . . 10,830 — Floating September 14, 2034American Equity Capital Trust VIII . . 20,600 — Floating December 22, 2034
$173,576 $116,425
Page 37 of 48
The interest rate for the floating rate subordinated debentures is based upon the three monthLondon Interbank Offered rate plus 4.00% for Trust III and IV and 3.75% for Trust VII and VIII.
American Equity Capital Trust I issued 865,671 shares of trust preferred securities, of which 2,000shares are held by one of our subsidiaries. During 2004, 88,000 shares of these trust preferred securitiesconverted into 325,923 shares of our common stock. The remaining 777,671 shares of these trustpreferred securities are convertible into 2,872,794 shares of our common stock.
American Equity Capital Trust II issued $97.0 million (97,000 shares) of 5% trust preferredsecurities and we issued $100 million of our 5% subordinated debentures. The consideration receivedby American Equity Capital Trust II in connection with the issue of its trust preferred securitiesconsisted of fixed income trust preferred securities of equal value issued by FBL.
During the third quarter of 2004, we entered into a $50 million revolving line of credit with threebanks. There is no amount outstanding under this revolving line of credit at December 31, 2004. Seenote 7 to our audited consolidated financial statements for additional details concerning the terms ofthe revolving line of credit. At December 31, 2003, we had $31.8 million outstanding under a creditagreement. All amounts outstanding under this agreement were repaid during 2004.
Stockholders’ Equity
In 1997, in connection with a rights offering of shares of our common stock, we issued subscriptionrights to purchase an aggregate of 2,157,375 shares of our common stock to certain officers anddirectors. The subscription rights have an exercise price of $5.33 per share. During 2002, the board ofdirectors extended the expiration date of the subscription rights from December 1, 2002 toDecember 1, 2005 and in conjunction therewith, we recognized compensation expense of $0.3 million.
During 1998, we issued 625,000 shares of 1998 Series A Participating Preferred Stock (aggregateliquidation preference of $10.0 million). During 2004, all of these shares converted into 1,875,000shares of our common stock. Prior to conversion, these shares had participating dividend rights with theshares of our common stock, when and as such dividends were declared.
During 2003, we purchased 1,435,500 shares of our common stock at a total cost of $9.3 million($6.49 per share). We issued these shares and 155,583 shares held as treasury stock to a rabbi trustestablished for the benefit of agents who have earned shares of our common stock under the AmericanEquity Investment NMO Deferred Compensation Plan. See note 10 to our audited consolidatedfinancial statements.
On December 9, 2003, we completed an initial public offering of 18,700,000 shares of our commonstock at a price of $9.00 per share. Pursuant to the over-allotment option granted to the underwritersin this offering, the underwriters purchased an additional 2,000,000 shares on December 29, 2003 andan additional 805,000 shares on January 7, 2004, which fully exercised the over-allotment option. Theproceeds from our initial public offering (including proceeds from shares issued pursuant to theover-allotment option), net of the underwriting discount and expenses, were approximately$178.0 million.
During 2004, we issued 54,385 shares of our common stock to an agent’s beneficiaries in relationto shares earned under the American Equity Investment NMO Deferred Compensation Plan. Seenote 10 to our audited consolidated financial statements.
Liquidity for Insurance Operations
Our life subsidiaries generally receive adequate cash flow from premium collections and investmentincome to meet their obligations. Annuity and life insurance liabilities are generally long-term innature. Policyholders may, however, withdraw funds or surrender their policies, subject to surrender
Page 38 of 48
and withdrawal penalty provisions. At December 31, 2004, approximately 99% of our annuity liabilitieswere subject to penalty upon surrender, with a weighted average remaining surrender charge period of8.8 years and a weighted average surrender charge rate of 12%.
We believe that the diversity of our investment portfolio and the concentration of investments inhigh-quality securities provides sufficient liquidity to meet foreseeable cash requirements. Theinvestment portfolio at December 31, 2004 included $2.6 billion (amortized cost basis) of publiclytraded available for sale investment grade bonds. Although there is no present need or intent todispose of such investments, our life subsidiaries could readily liquidate portions of their investments, ifsuch a need arose. See Quantitative and Qualitative Disclosures about Market Risk for furtherdiscussion of the related interest rate risk exposure. In addition, investments could be used to facilitateborrowings under repurchase agreements. As indicated above, such borrowings have been used byAmerican Equity Life from time to time to increase our return on investments.
Liquidity of Parent Company
We, as the parent company, are a legal entity separate and distinct from our subsidiaries, and haveno business operations. We need liquidity primarily to service our debt, including the convertible seniornotes and subordinated debentures issued to subsidiary trusts, pay operating expenses and paydividends to stockholders. The primary sources of funds for these payments are: (i) investment advisoryfees from our life subsidiaries; (ii) dividends on capital stock and surplus note interest payments fromAmerican Equity Life; (iii) investment income on our investments; and (iv) principal and interestpayments received on our notes receivable from American Equity Investment Service Company (seediscussion that follows). These sources provide adequate cash flow to us to meet our current andreasonably foreseeable future obligations. We may also obtain cash by drawing down our $50 millionrevolving line of credit or by issuing debt or equity securities.
The payment of dividends or distributions, including surplus note payments, by our life subsidiariesis subject to regulation by each subsidiary’s state of domicile’s insurance department. Currently,American Equity Life may pay dividends or make other distributions without the prior approval of itsstate of domicile’s insurance department, unless such payments, together with all other such paymentswithin the preceding twelve months, exceed the greater of (1) American Equity Life’s net gain fromoperations for the preceding calendar year, or (2) 10% of American Equity Life’s statutory surplus atthe preceding December 31. For 2005, up to approximately $60.9 million can be distributed asdividends by American Equity Life without prior approval of the Iowa Insurance Division. In addition,dividends and surplus note payments may be made only out of earned surplus, and all surplus notepayments are subject to prior approval by regulatory authorities in the life subsidiary’s state ofdomicile. American Equity Life had approximately $114.6 million of earned surplus at December 31,2004.
The maximum distribution permitted by law or contract is not necessarily indicative of an insurer’sactual ability to pay such distributions, which may be constrained by business and regulatoryconsiderations, such as the impact of such distributions on surplus, which could affect the insurer’sratings or competitive position, the amount of premiums that can be written and the ability to payfuture dividends or make other distributions. Further, state insurance laws and regulations require thatthe statutory surplus of our life subsidiaries following any dividend or distribution must be reasonablein relation to their outstanding liabilities and adequate for their financial needs.
The transfer of funds by American Equity Life is also restricted by a covenant in our revolving lineof credit agreement which requires American Equity Life to maintain a minimum risk-based capitalratio of 200%.
Statutory accounting practices prescribed or permitted for our life subsidiaries differ in manyrespects from those governing the preparation of financial statements under GAAP. Accordingly,
Page 39 of 48
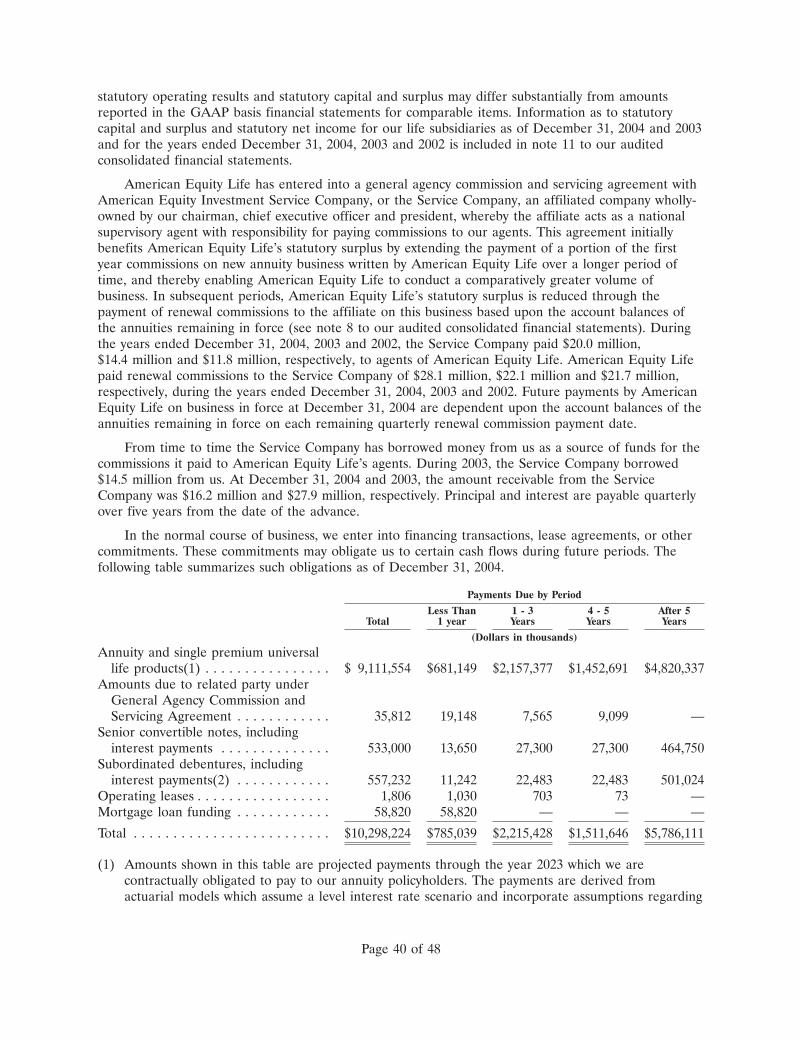
statutory operating results and statutory capital and surplus may differ substantially from amountsreported in the GAAP basis financial statements for comparable items. Information as to statutorycapital and surplus and statutory net income for our life subsidiaries as of December 31, 2004 and 2003and for the years ended December 31, 2004, 2003 and 2002 is included in note 11 to our auditedconsolidated financial statements.
American Equity Life has entered into a general agency commission and servicing agreement withAmerican Equity Investment Service Company, or the Service Company, an affiliated company wholly-owned by our chairman, chief executive officer and president, whereby the affiliate acts as a nationalsupervisory agent with responsibility for paying commissions to our agents. This agreement initiallybenefits American Equity Life’s statutory surplus by extending the payment of a portion of the firstyear commissions on new annuity business written by American Equity Life over a longer period oftime, and thereby enabling American Equity Life to conduct a comparatively greater volume ofbusiness. In subsequent periods, American Equity Life’s statutory surplus is reduced through thepayment of renewal commissions to the affiliate on this business based upon the account balances ofthe annuities remaining in force (see note 8 to our audited consolidated financial statements). Duringthe years ended December 31, 2004, 2003 and 2002, the Service Company paid $20.0 million,$14.4 million and $11.8 million, respectively, to agents of American Equity Life. American Equity Lifepaid renewal commissions to the Service Company of $28.1 million, $22.1 million and $21.7 million,respectively, during the years ended December 31, 2004, 2003 and 2002. Future payments by AmericanEquity Life on business in force at December 31, 2004 are dependent upon the account balances of theannuities remaining in force on each remaining quarterly renewal commission payment date.
From time to time the Service Company has borrowed money from us as a source of funds for thecommissions it paid to American Equity Life’s agents. During 2003, the Service Company borrowed$14.5 million from us. At December 31, 2004 and 2003, the amount receivable from the ServiceCompany was $16.2 million and $27.9 million, respectively. Principal and interest are payable quarterlyover five years from the date of the advance.
In the normal course of business, we enter into financing transactions, lease agreements, or othercommitments. These commitments may obligate us to certain cash flows during future periods. Thefollowing table summarizes such obligations as of December 31, 2004.
Payments Due by Period
Less Than 1 - 3 4 - 5 After 5Total 1 year Years Years Years
(Dollars in thousands)
Annuity and single premium universallife products(1) . . . . . . . . . . . . . . . . $ 9,111,554 $681,149 $2,157,377 $1,452,691 $4,820,337
Amounts due to related party underGeneral Agency Commission andServicing Agreement . . . . . . . . . . . . 35,812 19,148 7,565 9,099 —
Senior convertible notes, includinginterest payments . . . . . . . . . . . . . . 533,000 13,650 27,300 27,300 464,750
Subordinated debentures, includinginterest payments(2) . . . . . . . . . . . . 557,232 11,242 22,483 22,483 501,024
Operating leases . . . . . . . . . . . . . . . . . 1,806 1,030 703 73 —Mortgage loan funding . . . . . . . . . . . . 58,820 58,820 — — —
Total . . . . . . . . . . . . . . . . . . . . . . . . . $10,298,224 $785,039 $2,215,428 $1,511,646 $5,786,111
(1) Amounts shown in this table are projected payments through the year 2023 which we arecontractually obligated to pay to our annuity policyholders. The payments are derived fromactuarial models which assume a level interest rate scenario and incorporate assumptions regarding
Page 40 of 48
mortality and persistency, when applicable. These assumptions are based on our historicalexperience. Amount shown are net of expected reinsurance recoveries.
(2) Projected interest payments related to variable interest rate subordinated debentures assumes levelinterest rates. Amount shown is net of $2.1 million equity investments in the trusts due to thecontractual right of offset upon repayment of the notes. See Financial Condition—Liabilities.
Pending Accounting Changes
In March 2004, the FASB’s Emerging Issues Task Force (EITF) reached a consensus on EITFIssue No. 03-1, ‘‘The Meaning of Other-Than-Temporary Impairment and Its Application to CertainInvestments’’ (EITF 03-1). EITF 03-1 provides guidance regarding the meaning ofother-than-temporary impairment and its application to investments classified as either available forsale or held to maturity under FASB Statement No. 115, ‘‘Accounting for Certain Investments in Debtand Equity Securities,’’ and to equity securities accounted for under the cost method. Included inEITF 03-1 is guidance on how to account for impairments that are solely due to interest rate changes,including changes resulting from increases in sector credit spreads. This guidance was to becomeeffective for reporting periods beginning after June 15, 2004. However, on September 30, 2004, theFASB issued a Staff Position that delays the effective date for the recognition and measurementguidance of EITF 03-1 until additional clarifying guidance is issued. The issuance of this guidance wasdelayed during the fourth quarter of 2004, with additional discussion of this issue by the FASB plannedfor 2005. We are not able to assess the impact of the adoption of EITF 03-1 until final guidance isissued.
In December 2004, the FASB issued Statement of Financial Accounting Standards (‘‘SFAS’’)No. 123 (Revised 2004), ‘‘Share-Based Payment’’ (‘‘SFAS 123R’’). This standard requires expensingstock options and other share-based payments and supersedes SFAS No. 123, which had allowedcompanies to choose between expensing stock options or showing proforma disclosure only. Thisstandard is effective for us as of July 1, 2005 and will apply to all awards granted, modified, cancelledor purchased after that date as well as the unvested portion of prior awards. We will adopt thestandard as of the effective date and do not believe it will have a material effect on our financialstatements.
Inflation
Inflation does not have a significant effect on our balance sheet. We have minimal investments inproperty, equipment or inventories. To the extent that interest rates may change to reflect inflation orinflation expectations, there would be an effect on our balance sheet and operations. Higher interestrates experienced in recent periods have decreased the value of our fixed maturity investments. It islikely that declining interest rates would have the opposite effect. It is not possible to calculate theeffect such changes in interest rates, if any, have had on our operating results.
ITEM 7A. QUANTITATIVE AND QUALITATIVE DISCLOSURES ABOUT MARKET RISK
We seek to invest our available funds in a manner that will maximize shareholder value and fundfuture obligations to policyholders and debtors, subject to appropriate risk considerations. We seek tomeet this objective through investments that: (i) consist predominately of investment grade fixedmaturity securities; (ii) have projected returns which satisfy our spread targets; and (iii) havecharacteristics which support the underlying liabilities. Many of our products incorporate surrendercharges, market interest rate adjustments or other features to encourage persistency.
Page 41 of 48
We seek to maximize the total return on our available for sale investments through activeinvestment management. Accordingly, we have determined that our available for sale portfolio of fixedmaturity securities is available to be sold in response to: (i) changes in market interest rates;(ii) changes in relative values of individual securities and asset sectors; (iii) changes in prepaymentrisks; (iv) changes in credit quality outlook for certain securities; (v) liquidity needs; and (vi) otherfactors. We have a portfolio of held for investment securities which consists principally of long durationbonds issued by U.S. government agencies. These securities are purchased to secure long-term yieldswhich meet our spread targets and support the underlying liabilities.
Interest rate risk is our primary market risk exposure. Substantial and sustained increases anddecreases in market interest rates can affect the profitability of our products, the amount of interest wepay on our subordinated debentures payable, and the market value of our investments. Our floatingrate trust preferred securities issued by Trusts III, IV, VII, and VIII bear interest at the three monthLIBOR plus 3.75% - 4.00%. Our outstanding balance of floating rate trust preferred securities atDecember 31, 2004 was $69.5 million. The profitability of most of our products depends on the spreadsbetween interest yield on investments and rates credited on insurance liabilities. We have the ability toadjust crediting rates (participation or asset fee rates for index annuities) on substantially all of ourannuity policies at least annually (subject to minimum guaranteed values). In addition, substantially allof our annuity products have surrender and withdrawal penalty provisions designed to encouragepersistency and to help ensure targeted spreads are earned. However, competitive factors, including theimpact of the level of surrenders and withdrawals, may limit our ability to adjust or maintain creditingrates at levels necessary to avoid narrowing of spreads under certain market conditions.
A major component of our interest rate risk management program is structuring the investmentportfolio with cash flow characteristics consistent with the cash flow characteristics of our insuranceliabilities. We use computer models to simulate cash flows expected from our existing business undervarious interest rate scenarios. These simulations enable us to measure the potential gain or loss in fairvalue of our interest rate-sensitive financial instruments, to evaluate the adequacy of expected cashflows from our assets to meet the expected cash requirements of our liabilities and to determine if it isnecessary to lengthen or shorten the average life and duration of our investment portfolio. The‘‘duration’’ of a security is the time weighted present value of the security’s expected cash flows and isused to measure a security’s sensitivity to changes in interest rates. When the durations of assets andliabilities are similar, exposure to interest rate risk is minimized because a change in value of assetsshould be largely offset by a change in the value of liabilities.
If interest rates were to increase 10% (48 basis points) from levels at December 31, 2004, weestimate that the fair value of our fixed maturity securities would decrease by approximately$328.0 million. The impact on stockholders’ equity of such decrease (net of income taxes and certainadjustments for changes in amortization of deferred policy acquisition costs and deferred salesinducements) would be an increase of $34.5 million in the accumulated other comprehensive loss. Thecomputer models used to estimate the impact of a 10% change in market interest rates incorporatenumerous assumptions, require significant estimates and assume an immediate and parallel change ininterest rates without any management of the investment portfolio in reaction to such change.Consequently, potential changes in value of our financial instruments indicated by the simulations willlikely be different from the actual changes experienced under given interest rate scenarios, and thedifferences may be material. Because we actively manage our investments and liabilities, our netexposure to interest rates can vary over time. However, any such decreases in the fair value of our fixedmaturity securities (unless related to credit concerns of the issuer requiring recognition of an otherthan temporary impairment) would generally be realized only if we were required to sell such securitiesat losses prior to the their maturity to meet our liquidity needs, which we manage using the surrenderand withdrawal provisions of our annuity contracts and through other means as discussed earlier. SeeFinancial Condition—Liquidity for Insurance Operations for a further discussion of the liquidity risk.
Page 42 of 48
At December 31, 2004, 85% of our fixed income securities have call features and 9% were subjectto call redemption. Another 70% will become subject to call redemption through December 31, 2005.During the years ended December 31, 2004 and 2003, we received $2.18 billion and $2.52 billion,respectively, in net redemption proceeds related to the exercise of such call options. We havereinvestment risk related to these redemptions to the extent we cannot reinvest the net proceeds inassets with credit quality and yield characteristics similar to the redeemed bonds. Such reinvestmentrisk typically occurs in a declining rate environment. Should rates decline to levels which tighten thespread between our average portfolio yield and average cost of interest credited on our annuityliabilities, we have the ability to reduce crediting rates on most of our annuity liabilities to maintain thespread at our targeted level. At December 31, 2004, approximately 82% of our annuity liabilities aresubject to annual adjustment of the applicable crediting rates at our discretion, limited by minimumguaranteed crediting rates of 2% to 4%.
With respect to our index annuities, we purchase call options on the applicable indices to fund theannual index credits on such annuities. These options are primarily one-year instruments purchased tomatch the funding requirements of the underlying policies. Proceeds received at expiration of the calloptions are substantially offset by an increase in the amounts added to policyholder account balancesfor index products. For the years ended December 31, 2004 and 2003, index credits to policyholders ontheir anniversaries were $122.7 million and $44.2 million, respectively. Proceeds received at expirationof these options related to such credits were $87.2 million and $41.1 million, respectively. Thedifference between proceeds received at expiration of these options and index credits for 2004 isprimarily due to credits attributable to minimum guaranteed interest self funded by us. During 2003, werefined our hedging process to purchase options out of the money to the extent of anticipatedminimum guaranteed interest on index policies. On the anniversary dates of the index policies, wepurchase new one-year call options to fund the next annual index credits. The risk associated with theseprospective purchases is the uncertainty of the cost, which will determine whether we are able to earnour spread on our index business. This is a risk we attempt to manage through the terms of our indexannuities, which permit us to change annual participation rates, asset fees, and caps, subject tocontractual features. By modifying participation rates, asset fees or caps, we can limit option costs tobudgeted amounts, except in cases where the contractual features would prevent further modifications.Based upon actuarial testing which we conduct as a part of the design of our index products and on anongoing basis, we believe the risk that contractual features would prevent us from controlling optioncosts is not material.
ITEM 8. CONSOLIDATED FINANCIAL STATEMENTS AND SUPPLEMENTARY DATA.
The consolidated financial statements are included as a part of this report on Form 10-K onpages F-1 through F-34.
ITEM 9. CHANGES IN AND DISAGREEMENTS WITH ACCOUNTANTS ON ACCOUNTING ANDFINANCIAL DISCLOSURE
None.
ITEM 9A. CONTROLS AND PROCEDURES
Evaluation of Disclosure Controls and Procedures.
In accordance with Rule 13a-15(b) of the Securities Exchange Act of 1934 (the ‘‘Exchange Act’’),as of the end of the period covered by this Annual Report on Form 10-K, the Company’s managementevaluated, with the participation of the Company’s Chief Executive Officer and Chief Financial Officer,the effectiveness of the design and operation of the Company’s disclosure controls and procedures (asdefined in Rule 13a-15(e) under the Exchange Act). Based on their evaluation of these disclosure
Page 43 of 48
controls and procedures, the Company’s Chief Executive Officer and Chief Financial Officer haveconcluded that, as a result of the material weakness in the Company’s internal control over financialreporting discussed below, the disclosure controls and procedures were not effective in recording,processing, summarizing and reporting, on a timely basis, information required to be disclosed by theCompany in the reports the Company files or submits under the Exchange Act.
Management’s Report on Internal Control over Financial Reporting.
The management of the Company is responsible for establishing and maintaining adequate internalcontrol over financial reporting, as defined in the Exchange Act Rule 13a-15(f). The Company’sinternal control system is designed to provide reasonable assurance to the Company’s management andthe board of directors regarding the preparation and fair presentation of published financial statements.All internal control systems, no matter how well designed, have inherent limitations. Therefore, eventhose systems determined effective can provide only reasonable assurance with respect to financialstatement preparation and presentation. Also, projections of any evaluation of effectiveness to futureperiods are subject to risk that controls may become inadequate because of changes in conditions, orthat the degree of compliance with the policies or procedures may deteriorate.
The Company’s management assessed the effectiveness of the Company’s internal control overfinancial reporting as of December 31, 2004 based upon criteria established in Internal Control —Integrated Framework issued by the Committee of Sponsoring Organizations of the TreadwayCommission. Management determined a lack of formal documentation exists surrounding theCompany’s review of its deferred policy acquisition costs and deferred sales inducements, its unlockinganalysis and the related assumptions and estimates used in connection with these items. In additionmanagement concluded that the review of inputs into the models for estimating deferred policyacquisition costs and deferred sales inducements was inadequate. As a result, management hasconcluded that a material weakness exists and thus is not be able to conclude that its internal controlover financial reporting was effective as of the end of the period covered by the Company’s AnnualReport on Form 10-K. However, this weakness in the Company’s internal control over financialreporting did not result in any material misstatement of the Company’s financial statements for 2004.
Management’s assessment of the effectiveness of our internal control over financial reporting as ofDecember 31, 2004 has been audited by Ernst & Young LLP, an independent registered publicaccounting firm, as stated in their report which is included elsewhere herein.
Remediation
The Company’s remediation of this material weakness includes the implementation of additionalreview procedures for the inputs into the models for deferred policy acquisition costs and deferredsales inducements and a more formal documentation process of the review and approval at eachreporting period of the amounts recorded for deferred policy acquisition costs and deferred salesinducements and the assumptions and estimates used in this process. This remediation is expected to bein place prior to the filing of the Company’s first quarterly report in 2005.
Report of Independent Registered Public Accounting Firm on Internal Control over Financial Reporting
The Board of Directors and StockholdersAmerican Equity Investment Life Holding Company
We have audited management’s assessment, included in the accompanying Management’s Reporton Internal Control over Financial Reporting, that American Equity Investment Life Holding Companydid not maintain effective internal control over financial reporting as of December 31, 2004, because ofthe effect of the material weakness identified in management’s assessment as described below based oncriteria established in Internal Control — Integrated Framework issued by the Committee of
Page 44 of 48
Sponsoring Organizations of the Treadway Commission (the COSO criteria). American EquityInvestment Life Holding Company’s management is responsible for maintaining effective internalcontrol over financial reporting and for its assessment of the effectiveness of internal control overfinancial reporting. Our responsibility is to express an opinion on management’s assessment and anopinion on the effectiveness of the company’s internal control over financial reporting based on ouraudit.
We conducted our audit in accordance with the standards of the Public Company AccountingOversight Board (United States). Those standards require that we plan and perform the audit to obtainreasonable assurance about whether effective internal control over financial reporting was maintainedin all material respects. Our audit included obtaining an understanding of internal control overfinancial reporting, evaluating management’s assessment, testing and evaluating the design andoperating effectiveness of internal control, and performing such other procedures as we considerednecessary in the circumstances. We believe that our audit provides a reasonable basis for our opinion.
A company’s internal control over financial reporting is a process designed to provide reasonableassurance regarding the reliability of financial reporting and the preparation of financial statements forexternal purposes in accordance with generally accepted accounting principles. A company’s internalcontrol over financial reporting includes those policies and procedures that (1) pertain to themaintenance of records that, in reasonable detail, accurately and fairly reflect the transactions anddispositions of the assets of the company; (2) provide reasonable assurance that transactions arerecorded as necessary to permit preparation of financial statements in accordance with generallyaccepted accounting principles, and that receipts and expenditures of the company are being made onlyin accordance with authorizations of management and directors of the company; (3) provide reasonableassurance regarding prevention or timely detection of unauthorized acquisition, use, or disposition ofthe company’s assets that could have a material effect on the financial statements.
Because of its inherent limitations, internal control over financial reporting may not prevent ordetect misstatements. Also, projections of any evaluation of effectiveness to future periods are subjectto the risk that controls may become inadequate because of changes in conditions, or that the degreeof compliance with the policies or procedures may deteriorate.
A material weakness is a control deficiency, or combination of control deficiencies, that results inmore than a remote likelihood that a material misstatement of the annual or interim financialstatements will not be prevented or detected. The following material weakness has been identified andincluded in management’s assessment: In its assessment as of December 31, 2004, managementidentified as a material weakness that there was not an effective review of the inputs into theCompany’s models for estimating deferred policy acquisition costs and deferred sales inducements andthe lack of formal documentation surrounding the Company’s review of its deferred policy acquisitioncosts and deferred sales inducements, its unlocking analysis and the related assumptions and estimatesused in connection with these items. As a result of this material weakness in internal control, duringthe fourth quarter of 2004 the Company recorded an adjustment to its deferred policy acquisition costsand deferred sales inducements assets as of December 31, 2004, and for the related amortization ofdeferred policy acquisition costs and interest credited to account balances. This material weakness wasconsidered in determining the nature, timing, and extent of audit tests applied in our audit of the 2004consolidated financial statements, and this report does not affect our report dated March 11, 2005,which expressed an unqualified opinion on those consolidated financial statements.
Page 45 of 48
In our opinion, management’s assessment that American Equity Investment Life Holding Companydid not maintain effective internal control over financial reporting as of December 31, 2004, is fairlystated, in all material respects, based on the COSO criteria. Also, in our opinion, because of the effectsof the material weakness described above on the achievement of the objectives of the control criteria,American Equity Investment Life Holding Company has not maintained effective internal control overfinancial reporting as of December 31, 2004, based on the COSO criteria.
/s/ Ernst & Young LLP
Des Moines, IowaMarch 23, 2005
Changes in Internal Control over Financial Reporting.
There were no changes in the Company’s internal control over financial reporting that occurredduring the quarter ended December 31, 2004 that have materially affected, or are reasonable likely tomaterially affect, the Company’s internal control over financial reporting.
ITEM 9B. OTHER INFORMATION
There is no information required to be disclosed on Form 8-K for the quarter ended December 31,2004 which has not been previously reported.
Page 46 of 48

PART III
The information required by Part III is incorporated by reference from our definitive proxystatement for our annual meeting of shareholders to be held June 9, 2005 to be filed with theCommission pursuant to Regulation 14A within 120 days after December 31, 2004.
PART IV
ITEM 15. EXHIBITS, FINANCIAL STATEMENT SCHEDULES, AND REPORTS ON FORM 8-K
Financial Statements and Financial Statement Schedules. See Index to Consolidated FinancialStatements and Schedules on page F-1 for a list of financial statements and financial statementschedules included in this report.
All other schedules to the consolidated financial statements required by Article 7 ofRegulation S-X are omitted because they are not applicable, not required, or because the informationis included elsewhere in the consolidated financial statements or notes thereto.
Exhibits. See Exhibit Index immediately preceding the Exhibits for a list of Exhibits filed with thisreport.
Page 47 of 48

SIGNATURES
Pursuant to the requirements of Section 13 or 15(d) of the Securities Exchange Act of 1934, theregistrant has duly caused this report to be signed on its behalf by the undersigned, thereunto dulyauthorized, this 24th day of March, 2005.
AMERICAN EQUITY INVESTMENT LIFE
HOLDING COMPANY
By: /s/ WENDY L. CARLSON
Wendy L. Carlson, Authorized Officer
Page 48 of 48
AMERICAN EQUITY INVESTMENT LIFE HOLDING COMPANYINDEX TO CONSOLIDATED FINANCIAL STATEMENTS AND SCHEDULES
YEARS ENDED DECEMBER 31, 2004, 2003, AND 2002
Report of Independent Registered Public Accounting Firm . . . . . . . . . . . . . . . . . . . . . . . . . . . . F-3
Consolidated Financial Statements
Consolidated Balance Sheets . . . . . . . . . . . . . . . . . . . . . . . . . . . . . . . . . . . . . . . . . . . . . . . . . . F-4Consolidated Statements of Income . . . . . . . . . . . . . . . . . . . . . . . . . . . . . . . . . . . . . . . . . . . . . F-6Consolidated Statements of Changes in Stockholders’ Equity . . . . . . . . . . . . . . . . . . . . . . . . . . F-7Consolidated Statements of Cash Flows . . . . . . . . . . . . . . . . . . . . . . . . . . . . . . . . . . . . . . . . . . F-8Notes to Consolidated Financial Statements . . . . . . . . . . . . . . . . . . . . . . . . . . . . . . . . . . . . . . . F-10
Schedules
Schedule I—Summary of Investments—Other Than Investments in Related Parties . . . . . . . . . . F-40Schedule II—Condensed Financial Information of Registrant . . . . . . . . . . . . . . . . . . . . . . . . . . F-41Schedule III—Supplementary Insurance Information . . . . . . . . . . . . . . . . . . . . . . . . . . . . . . . . F-46Schedule IV—Reinsurance . . . . . . . . . . . . . . . . . . . . . . . . . . . . . . . . . . . . . . . . . . . . . . . . . . . F-47

(This page has been left blank intentionally.)
F-2
REPORT OF INDEPENDENT REGISTERED PUBLIC ACCOUNTING FIRM
The Board of Directors and StockholdersAmerican Equity Investment Life Holding Company
We have audited the accompanying consolidated balance sheets of American Equity InvestmentLife Holding Company as of December 31, 2004 and 2003, and the related consolidated statements ofincome, changes in stockholders’ equity, and cash flows for each of the three years in the period endedDecember 31, 2004. Our audits also included the financial statement schedules listed in the Index onpage F-1. These financial statements and schedules are the responsibility of the Company’smanagement. Our responsibility is to express an opinion on these financial statements and schedulesbased on our audits.
We conducted our audits in accordance with the standards of the Public Company AccountingOversight Board (United States). Those standards require that we plan and perform the audit to obtainreasonable assurance about whether the financial statements are free of material misstatement. Anaudit includes examining, on a test basis, evidence supporting the amounts and disclosures in thefinancial statements. An audit also includes assessing the accounting principles used and significantestimates made by management, as well as evaluating the overall financial statement presentation. Webelieve that our audits provide a reasonable basis for our opinion.
In our opinion, the financial statements referred to above present fairly, in all material respects,the consolidated financial position of American Equity Investment Life Holding Company atDecember 31, 2004 and 2003, and the consolidated results of its operations and its cash flows for eachof the three years in the period ended December 31, 2004, in conformity with U.S. generally acceptedaccounting principles. Also, in our opinion, the related financial statement schedules, when consideredin relation to the financial statements taken as a whole, present fairly in all material respects theinformation set forth therein.
As discussed in Note 1 to the consolidated financial statements, the Company changed its methodof reporting certain variable interest entities, in response to a new accounting standard that becameeffective December 31, 2003.
/s/ ERNST & YOUNG LLP
Des Moines, IowaMarch 14, 2005
F-3
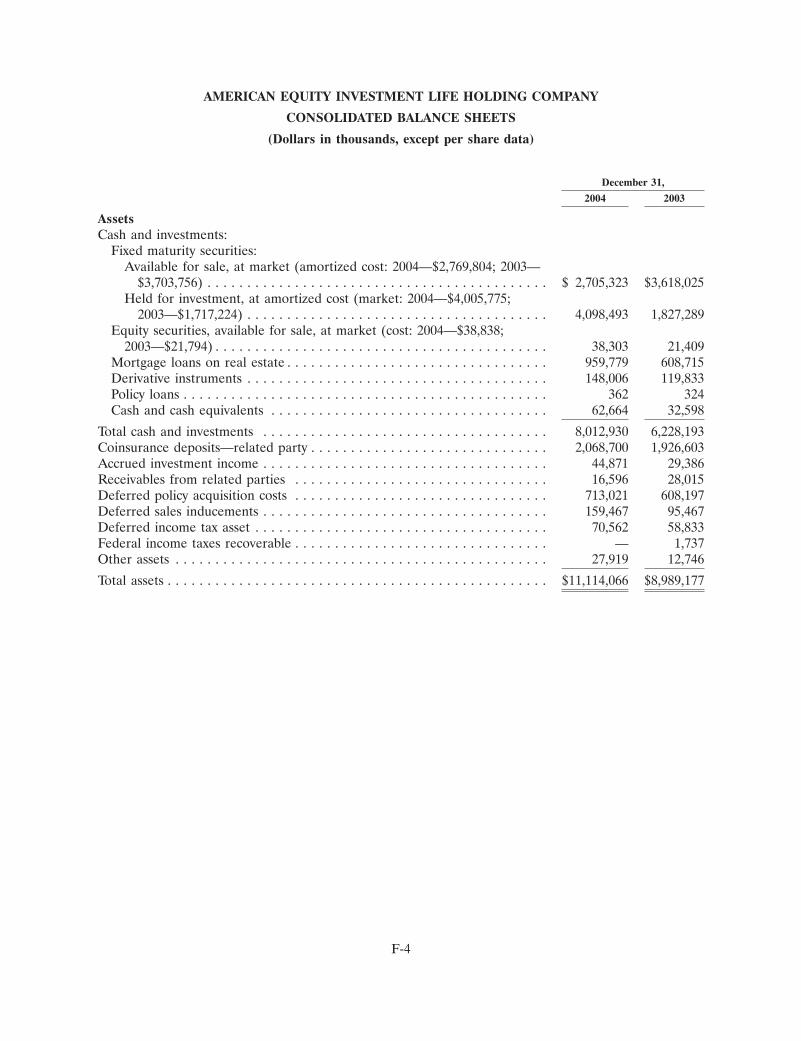
AMERICAN EQUITY INVESTMENT LIFE HOLDING COMPANY
CONSOLIDATED BALANCE SHEETS
(Dollars in thousands, except per share data)
December 31,
2004 2003
AssetsCash and investments:
Fixed maturity securities:Available for sale, at market (amortized cost: 2004—$2,769,804; 2003—
$3,703,756) . . . . . . . . . . . . . . . . . . . . . . . . . . . . . . . . . . . . . . . . . . . $ 2,705,323 $3,618,025Held for investment, at amortized cost (market: 2004—$4,005,775;
2003—$1,717,224) . . . . . . . . . . . . . . . . . . . . . . . . . . . . . . . . . . . . . . 4,098,493 1,827,289Equity securities, available for sale, at market (cost: 2004—$38,838;
2003—$21,794) . . . . . . . . . . . . . . . . . . . . . . . . . . . . . . . . . . . . . . . . . . 38,303 21,409Mortgage loans on real estate . . . . . . . . . . . . . . . . . . . . . . . . . . . . . . . . . 959,779 608,715Derivative instruments . . . . . . . . . . . . . . . . . . . . . . . . . . . . . . . . . . . . . . 148,006 119,833Policy loans . . . . . . . . . . . . . . . . . . . . . . . . . . . . . . . . . . . . . . . . . . . . . . 362 324Cash and cash equivalents . . . . . . . . . . . . . . . . . . . . . . . . . . . . . . . . . . . 62,664 32,598
Total cash and investments . . . . . . . . . . . . . . . . . . . . . . . . . . . . . . . . . . . . 8,012,930 6,228,193Coinsurance deposits—related party . . . . . . . . . . . . . . . . . . . . . . . . . . . . . . 2,068,700 1,926,603Accrued investment income . . . . . . . . . . . . . . . . . . . . . . . . . . . . . . . . . . . . 44,871 29,386Receivables from related parties . . . . . . . . . . . . . . . . . . . . . . . . . . . . . . . . 16,596 28,015Deferred policy acquisition costs . . . . . . . . . . . . . . . . . . . . . . . . . . . . . . . . 713,021 608,197Deferred sales inducements . . . . . . . . . . . . . . . . . . . . . . . . . . . . . . . . . . . . 159,467 95,467Deferred income tax asset . . . . . . . . . . . . . . . . . . . . . . . . . . . . . . . . . . . . . 70,562 58,833Federal income taxes recoverable . . . . . . . . . . . . . . . . . . . . . . . . . . . . . . . . — 1,737Other assets . . . . . . . . . . . . . . . . . . . . . . . . . . . . . . . . . . . . . . . . . . . . . . . 27,919 12,746
Total assets . . . . . . . . . . . . . . . . . . . . . . . . . . . . . . . . . . . . . . . . . . . . . . . . $11,114,066 $8,989,177
F-4
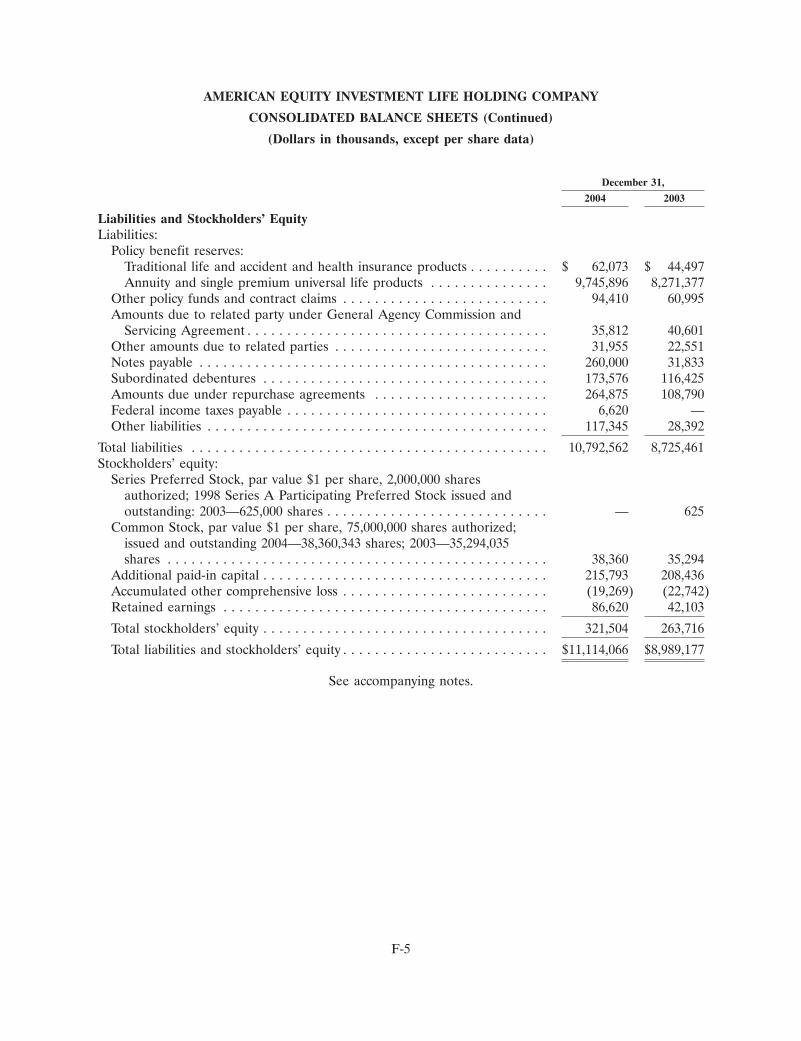
AMERICAN EQUITY INVESTMENT LIFE HOLDING COMPANY
CONSOLIDATED BALANCE SHEETS (Continued)
(Dollars in thousands, except per share data)
December 31,
2004 2003
Liabilities and Stockholders’ EquityLiabilities:
Policy benefit reserves:Traditional life and accident and health insurance products . . . . . . . . . . $ 62,073 $ 44,497Annuity and single premium universal life products . . . . . . . . . . . . . . . 9,745,896 8,271,377
Other policy funds and contract claims . . . . . . . . . . . . . . . . . . . . . . . . . . 94,410 60,995Amounts due to related party under General Agency Commission and
Servicing Agreement . . . . . . . . . . . . . . . . . . . . . . . . . . . . . . . . . . . . . . 35,812 40,601Other amounts due to related parties . . . . . . . . . . . . . . . . . . . . . . . . . . . 31,955 22,551Notes payable . . . . . . . . . . . . . . . . . . . . . . . . . . . . . . . . . . . . . . . . . . . . 260,000 31,833Subordinated debentures . . . . . . . . . . . . . . . . . . . . . . . . . . . . . . . . . . . . 173,576 116,425Amounts due under repurchase agreements . . . . . . . . . . . . . . . . . . . . . . 264,875 108,790Federal income taxes payable . . . . . . . . . . . . . . . . . . . . . . . . . . . . . . . . . 6,620 —Other liabilities . . . . . . . . . . . . . . . . . . . . . . . . . . . . . . . . . . . . . . . . . . . 117,345 28,392
Total liabilities . . . . . . . . . . . . . . . . . . . . . . . . . . . . . . . . . . . . . . . . . . . . . 10,792,562 8,725,461Stockholders’ equity:
Series Preferred Stock, par value $1 per share, 2,000,000 sharesauthorized; 1998 Series A Participating Preferred Stock issued andoutstanding: 2003—625,000 shares . . . . . . . . . . . . . . . . . . . . . . . . . . . . — 625
Common Stock, par value $1 per share, 75,000,000 shares authorized;issued and outstanding 2004—38,360,343 shares; 2003—35,294,035shares . . . . . . . . . . . . . . . . . . . . . . . . . . . . . . . . . . . . . . . . . . . . . . . . 38,360 35,294
Additional paid-in capital . . . . . . . . . . . . . . . . . . . . . . . . . . . . . . . . . . . . 215,793 208,436Accumulated other comprehensive loss . . . . . . . . . . . . . . . . . . . . . . . . . . (19,269) (22,742)Retained earnings . . . . . . . . . . . . . . . . . . . . . . . . . . . . . . . . . . . . . . . . . 86,620 42,103
Total stockholders’ equity . . . . . . . . . . . . . . . . . . . . . . . . . . . . . . . . . . . . 321,504 263,716
Total liabilities and stockholders’ equity . . . . . . . . . . . . . . . . . . . . . . . . . . $11,114,066 $8,989,177
See accompanying notes.
F-5
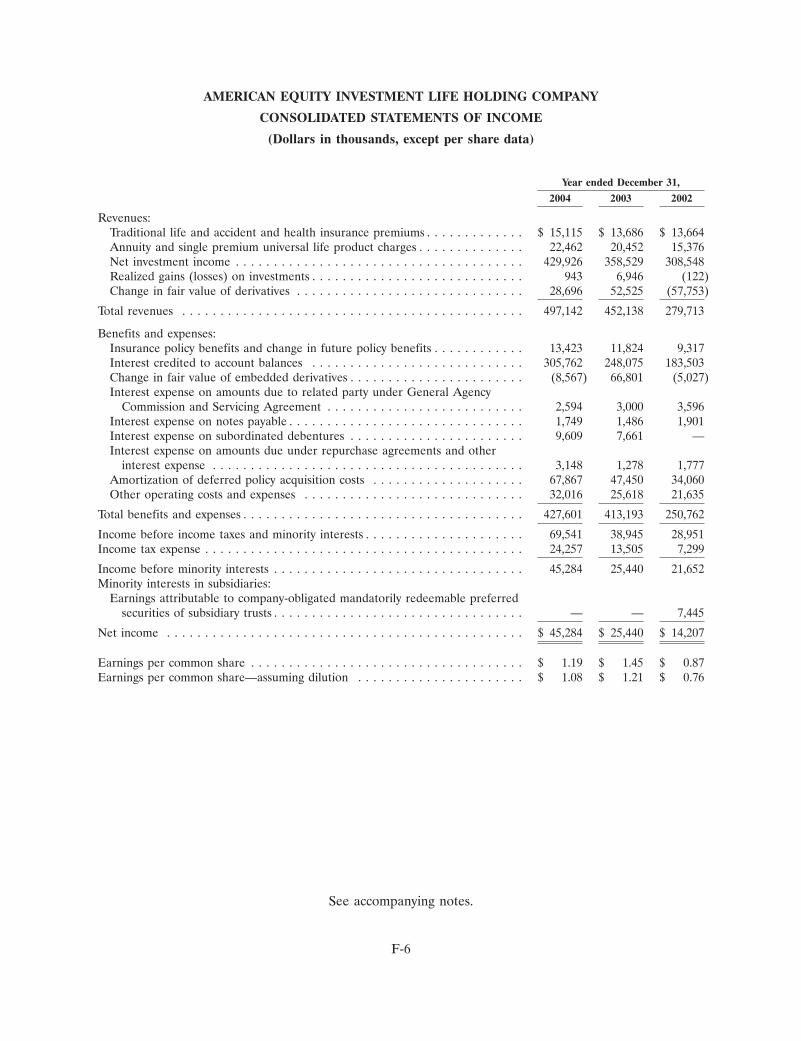
AMERICAN EQUITY INVESTMENT LIFE HOLDING COMPANY
CONSOLIDATED STATEMENTS OF INCOME
(Dollars in thousands, except per share data)
Year ended December 31,
2004 2003 2002
Revenues:Traditional life and accident and health insurance premiums . . . . . . . . . . . . . $ 15,115 $ 13,686 $ 13,664Annuity and single premium universal life product charges . . . . . . . . . . . . . . 22,462 20,452 15,376Net investment income . . . . . . . . . . . . . . . . . . . . . . . . . . . . . . . . . . . . . . 429,926 358,529 308,548Realized gains (losses) on investments . . . . . . . . . . . . . . . . . . . . . . . . . . . . 943 6,946 (122)Change in fair value of derivatives . . . . . . . . . . . . . . . . . . . . . . . . . . . . . . 28,696 52,525 (57,753)
Total revenues . . . . . . . . . . . . . . . . . . . . . . . . . . . . . . . . . . . . . . . . . . . . . 497,142 452,138 279,713
Benefits and expenses:Insurance policy benefits and change in future policy benefits . . . . . . . . . . . . 13,423 11,824 9,317Interest credited to account balances . . . . . . . . . . . . . . . . . . . . . . . . . . . . 305,762 248,075 183,503Change in fair value of embedded derivatives . . . . . . . . . . . . . . . . . . . . . . . (8,567) 66,801 (5,027)Interest expense on amounts due to related party under General Agency
Commission and Servicing Agreement . . . . . . . . . . . . . . . . . . . . . . . . . . 2,594 3,000 3,596Interest expense on notes payable . . . . . . . . . . . . . . . . . . . . . . . . . . . . . . . 1,749 1,486 1,901Interest expense on subordinated debentures . . . . . . . . . . . . . . . . . . . . . . . 9,609 7,661 —Interest expense on amounts due under repurchase agreements and other
interest expense . . . . . . . . . . . . . . . . . . . . . . . . . . . . . . . . . . . . . . . . . 3,148 1,278 1,777Amortization of deferred policy acquisition costs . . . . . . . . . . . . . . . . . . . . 67,867 47,450 34,060Other operating costs and expenses . . . . . . . . . . . . . . . . . . . . . . . . . . . . . 32,016 25,618 21,635
Total benefits and expenses . . . . . . . . . . . . . . . . . . . . . . . . . . . . . . . . . . . . . 427,601 413,193 250,762
Income before income taxes and minority interests . . . . . . . . . . . . . . . . . . . . . 69,541 38,945 28,951Income tax expense . . . . . . . . . . . . . . . . . . . . . . . . . . . . . . . . . . . . . . . . . . 24,257 13,505 7,299
Income before minority interests . . . . . . . . . . . . . . . . . . . . . . . . . . . . . . . . . 45,284 25,440 21,652Minority interests in subsidiaries:
Earnings attributable to company-obligated mandatorily redeemable preferredsecurities of subsidiary trusts . . . . . . . . . . . . . . . . . . . . . . . . . . . . . . . . . — — 7,445
Net income . . . . . . . . . . . . . . . . . . . . . . . . . . . . . . . . . . . . . . . . . . . . . . . $ 45,284 $ 25,440 $ 14,207
Earnings per common share . . . . . . . . . . . . . . . . . . . . . . . . . . . . . . . . . . . . $ 1.19 $ 1.45 $ 0.87Earnings per common share—assuming dilution . . . . . . . . . . . . . . . . . . . . . . $ 1.08 $ 1.21 $ 0.76
See accompanying notes.
F-6
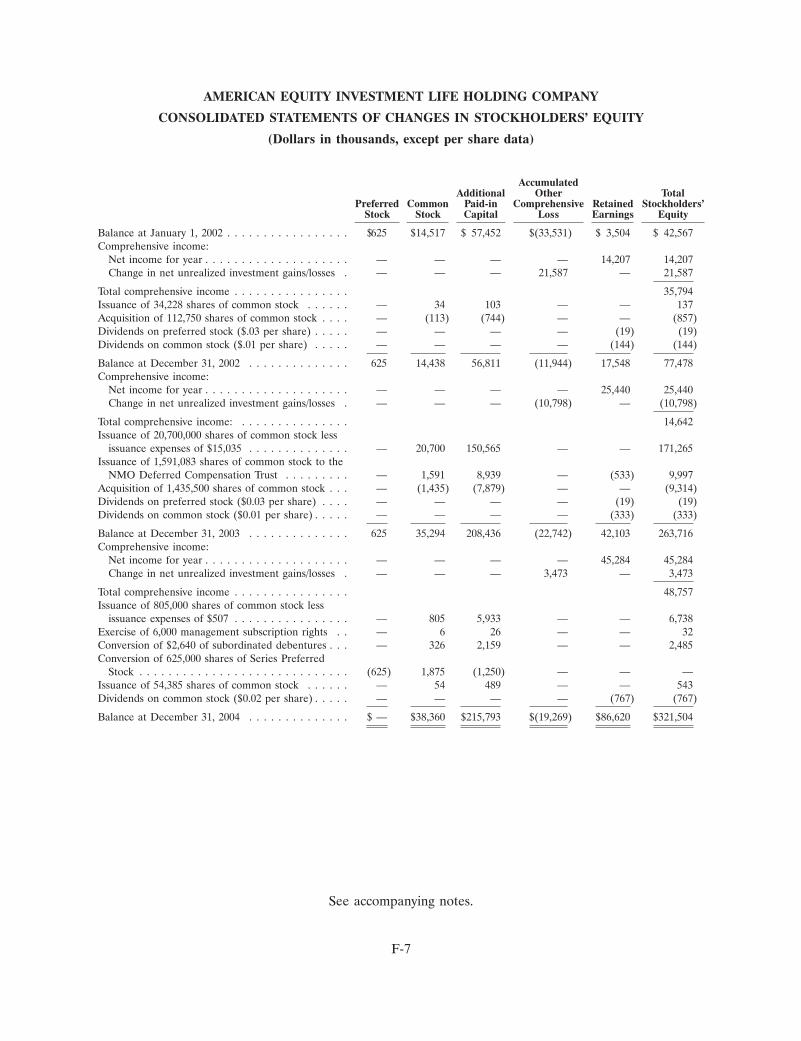
AMERICAN EQUITY INVESTMENT LIFE HOLDING COMPANY
CONSOLIDATED STATEMENTS OF CHANGES IN STOCKHOLDERS’ EQUITY
(Dollars in thousands, except per share data)
AccumulatedAdditional Other Total
Preferred Common Paid-in Comprehensive Retained Stockholders’Stock Stock Capital Loss Earnings Equity
Balance at January 1, 2002 . . . . . . . . . . . . . . . . . $625 $14,517 $ 57,452 $(33,531) $ 3,504 $ 42,567Comprehensive income:
Net income for year . . . . . . . . . . . . . . . . . . . . — — — — 14,207 14,207Change in net unrealized investment gains/losses . — — — 21,587 — 21,587
Total comprehensive income . . . . . . . . . . . . . . . . 35,794Issuance of 34,228 shares of common stock . . . . . . — 34 103 — — 137Acquisition of 112,750 shares of common stock . . . . — (113) (744) — — (857)Dividends on preferred stock ($.03 per share) . . . . . — — — — (19) (19)Dividends on common stock ($.01 per share) . . . . . — — — — (144) (144)
Balance at December 31, 2002 . . . . . . . . . . . . . . 625 14,438 56,811 (11,944) 17,548 77,478Comprehensive income:
Net income for year . . . . . . . . . . . . . . . . . . . . — — — — 25,440 25,440Change in net unrealized investment gains/losses . — — — (10,798) — (10,798)
Total comprehensive income: . . . . . . . . . . . . . . . 14,642Issuance of 20,700,000 shares of common stock less
issuance expenses of $15,035 . . . . . . . . . . . . . . — 20,700 150,565 — — 171,265Issuance of 1,591,083 shares of common stock to the
NMO Deferred Compensation Trust . . . . . . . . . — 1,591 8,939 — (533) 9,997Acquisition of 1,435,500 shares of common stock . . . — (1,435) (7,879) — — (9,314)Dividends on preferred stock ($0.03 per share) . . . . — — — — (19) (19)Dividends on common stock ($0.01 per share) . . . . . — — — — (333) (333)
Balance at December 31, 2003 . . . . . . . . . . . . . . 625 35,294 208,436 (22,742) 42,103 263,716Comprehensive income:
Net income for year . . . . . . . . . . . . . . . . . . . . — — — — 45,284 45,284Change in net unrealized investment gains/losses . — — — 3,473 — 3,473
Total comprehensive income . . . . . . . . . . . . . . . . 48,757Issuance of 805,000 shares of common stock less
issuance expenses of $507 . . . . . . . . . . . . . . . . — 805 5,933 — — 6,738Exercise of 6,000 management subscription rights . . — 6 26 — — 32Conversion of $2,640 of subordinated debentures . . . — 326 2,159 — — 2,485Conversion of 625,000 shares of Series Preferred
Stock . . . . . . . . . . . . . . . . . . . . . . . . . . . . . (625) 1,875 (1,250) — — —Issuance of 54,385 shares of common stock . . . . . . — 54 489 — — 543Dividends on common stock ($0.02 per share) . . . . . — — — — (767) (767)
Balance at December 31, 2004 . . . . . . . . . . . . . . $ — $38,360 $215,793 $(19,269) $86,620 $321,504
See accompanying notes.
F-7
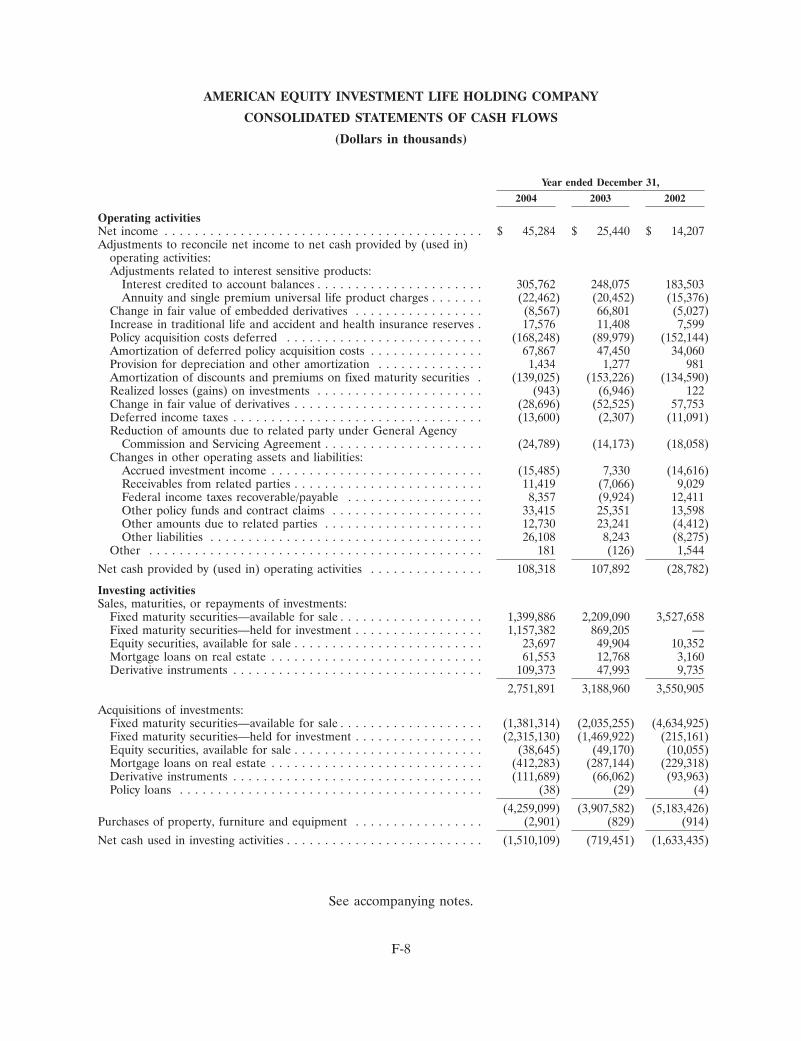
AMERICAN EQUITY INVESTMENT LIFE HOLDING COMPANY
CONSOLIDATED STATEMENTS OF CASH FLOWS
(Dollars in thousands)
Year ended December 31,
2004 2003 2002
Operating activitiesNet income . . . . . . . . . . . . . . . . . . . . . . . . . . . . . . . . . . . . . . . . . . $ 45,284 $ 25,440 $ 14,207Adjustments to reconcile net income to net cash provided by (used in)
operating activities:Adjustments related to interest sensitive products:
Interest credited to account balances . . . . . . . . . . . . . . . . . . . . . . 305,762 248,075 183,503Annuity and single premium universal life product charges . . . . . . . (22,462) (20,452) (15,376)
Change in fair value of embedded derivatives . . . . . . . . . . . . . . . . . (8,567) 66,801 (5,027)Increase in traditional life and accident and health insurance reserves . 17,576 11,408 7,599Policy acquisition costs deferred . . . . . . . . . . . . . . . . . . . . . . . . . . (168,248) (89,979) (152,144)Amortization of deferred policy acquisition costs . . . . . . . . . . . . . . . 67,867 47,450 34,060Provision for depreciation and other amortization . . . . . . . . . . . . . . 1,434 1,277 981Amortization of discounts and premiums on fixed maturity securities . (139,025) (153,226) (134,590)Realized losses (gains) on investments . . . . . . . . . . . . . . . . . . . . . . (943) (6,946) 122Change in fair value of derivatives . . . . . . . . . . . . . . . . . . . . . . . . . (28,696) (52,525) 57,753Deferred income taxes . . . . . . . . . . . . . . . . . . . . . . . . . . . . . . . . . (13,600) (2,307) (11,091)Reduction of amounts due to related party under General Agency
Commission and Servicing Agreement . . . . . . . . . . . . . . . . . . . . . (24,789) (14,173) (18,058)Changes in other operating assets and liabilities:
Accrued investment income . . . . . . . . . . . . . . . . . . . . . . . . . . . . (15,485) 7,330 (14,616)Receivables from related parties . . . . . . . . . . . . . . . . . . . . . . . . . 11,419 (7,066) 9,029Federal income taxes recoverable/payable . . . . . . . . . . . . . . . . . . 8,357 (9,924) 12,411Other policy funds and contract claims . . . . . . . . . . . . . . . . . . . . 33,415 25,351 13,598Other amounts due to related parties . . . . . . . . . . . . . . . . . . . . . 12,730 23,241 (4,412)Other liabilities . . . . . . . . . . . . . . . . . . . . . . . . . . . . . . . . . . . . 26,108 8,243 (8,275)
Other . . . . . . . . . . . . . . . . . . . . . . . . . . . . . . . . . . . . . . . . . . . . 181 (126) 1,544
Net cash provided by (used in) operating activities . . . . . . . . . . . . . . . 108,318 107,892 (28,782)
Investing activitiesSales, maturities, or repayments of investments:
Fixed maturity securities—available for sale . . . . . . . . . . . . . . . . . . . 1,399,886 2,209,090 3,527,658Fixed maturity securities—held for investment . . . . . . . . . . . . . . . . . 1,157,382 869,205 —Equity securities, available for sale . . . . . . . . . . . . . . . . . . . . . . . . . 23,697 49,904 10,352Mortgage loans on real estate . . . . . . . . . . . . . . . . . . . . . . . . . . . . 61,553 12,768 3,160Derivative instruments . . . . . . . . . . . . . . . . . . . . . . . . . . . . . . . . . 109,373 47,993 9,735
2,751,891 3,188,960 3,550,905
Acquisitions of investments:Fixed maturity securities—available for sale . . . . . . . . . . . . . . . . . . . (1,381,314) (2,035,255) (4,634,925)Fixed maturity securities—held for investment . . . . . . . . . . . . . . . . . (2,315,130) (1,469,922) (215,161)Equity securities, available for sale . . . . . . . . . . . . . . . . . . . . . . . . . (38,645) (49,170) (10,055)Mortgage loans on real estate . . . . . . . . . . . . . . . . . . . . . . . . . . . . (412,283) (287,144) (229,318)Derivative instruments . . . . . . . . . . . . . . . . . . . . . . . . . . . . . . . . . (111,689) (66,062) (93,963)Policy loans . . . . . . . . . . . . . . . . . . . . . . . . . . . . . . . . . . . . . . . . (38) (29) (4)
(4,259,099) (3,907,582) (5,183,426)Purchases of property, furniture and equipment . . . . . . . . . . . . . . . . . (2,901) (829) (914)
Net cash used in investing activities . . . . . . . . . . . . . . . . . . . . . . . . . . (1,510,109) (719,451) (1,633,435)
See accompanying notes.
F-8
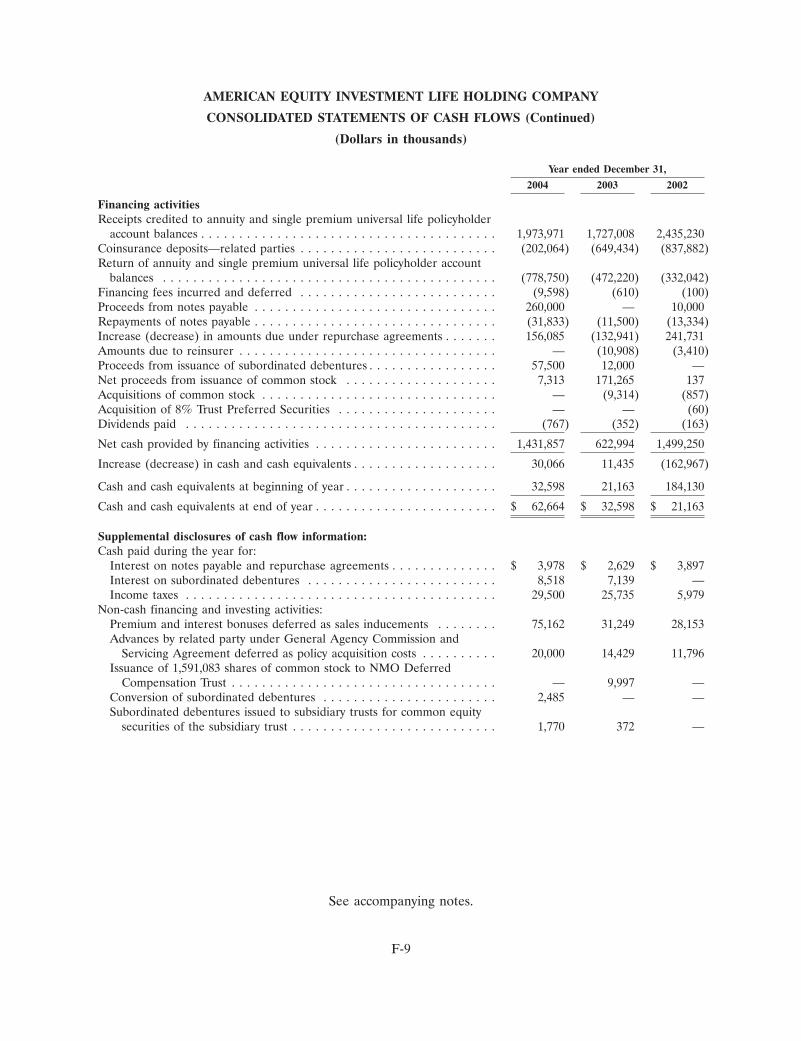
AMERICAN EQUITY INVESTMENT LIFE HOLDING COMPANY
CONSOLIDATED STATEMENTS OF CASH FLOWS (Continued)
(Dollars in thousands)
Year ended December 31,
2004 2003 2002
Financing activitiesReceipts credited to annuity and single premium universal life policyholder
account balances . . . . . . . . . . . . . . . . . . . . . . . . . . . . . . . . . . . . . . . 1,973,971 1,727,008 2,435,230Coinsurance deposits—related parties . . . . . . . . . . . . . . . . . . . . . . . . . . (202,064) (649,434) (837,882)Return of annuity and single premium universal life policyholder account
balances . . . . . . . . . . . . . . . . . . . . . . . . . . . . . . . . . . . . . . . . . . . . (778,750) (472,220) (332,042)Financing fees incurred and deferred . . . . . . . . . . . . . . . . . . . . . . . . . . (9,598) (610) (100)Proceeds from notes payable . . . . . . . . . . . . . . . . . . . . . . . . . . . . . . . . 260,000 — 10,000Repayments of notes payable . . . . . . . . . . . . . . . . . . . . . . . . . . . . . . . . (31,833) (11,500) (13,334)Increase (decrease) in amounts due under repurchase agreements . . . . . . . 156,085 (132,941) 241,731Amounts due to reinsurer . . . . . . . . . . . . . . . . . . . . . . . . . . . . . . . . . . — (10,908) (3,410)Proceeds from issuance of subordinated debentures . . . . . . . . . . . . . . . . . 57,500 12,000 —Net proceeds from issuance of common stock . . . . . . . . . . . . . . . . . . . . 7,313 171,265 137Acquisitions of common stock . . . . . . . . . . . . . . . . . . . . . . . . . . . . . . . — (9,314) (857)Acquisition of 8% Trust Preferred Securities . . . . . . . . . . . . . . . . . . . . . — — (60)Dividends paid . . . . . . . . . . . . . . . . . . . . . . . . . . . . . . . . . . . . . . . . . (767) (352) (163)
Net cash provided by financing activities . . . . . . . . . . . . . . . . . . . . . . . . 1,431,857 622,994 1,499,250
Increase (decrease) in cash and cash equivalents . . . . . . . . . . . . . . . . . . . 30,066 11,435 (162,967)
Cash and cash equivalents at beginning of year . . . . . . . . . . . . . . . . . . . . 32,598 21,163 184,130
Cash and cash equivalents at end of year . . . . . . . . . . . . . . . . . . . . . . . . $ 62,664 $ 32,598 $ 21,163
Supplemental disclosures of cash flow information:Cash paid during the year for:
Interest on notes payable and repurchase agreements . . . . . . . . . . . . . . $ 3,978 $ 2,629 $ 3,897Interest on subordinated debentures . . . . . . . . . . . . . . . . . . . . . . . . . 8,518 7,139 —Income taxes . . . . . . . . . . . . . . . . . . . . . . . . . . . . . . . . . . . . . . . . . 29,500 25,735 5,979
Non-cash financing and investing activities:Premium and interest bonuses deferred as sales inducements . . . . . . . . 75,162 31,249 28,153Advances by related party under General Agency Commission and
Servicing Agreement deferred as policy acquisition costs . . . . . . . . . . 20,000 14,429 11,796Issuance of 1,591,083 shares of common stock to NMO Deferred
Compensation Trust . . . . . . . . . . . . . . . . . . . . . . . . . . . . . . . . . . . — 9,997 —Conversion of subordinated debentures . . . . . . . . . . . . . . . . . . . . . . . 2,485 — —Subordinated debentures issued to subsidiary trusts for common equity
securities of the subsidiary trust . . . . . . . . . . . . . . . . . . . . . . . . . . . 1,770 372 —
See accompanying notes.
F-9
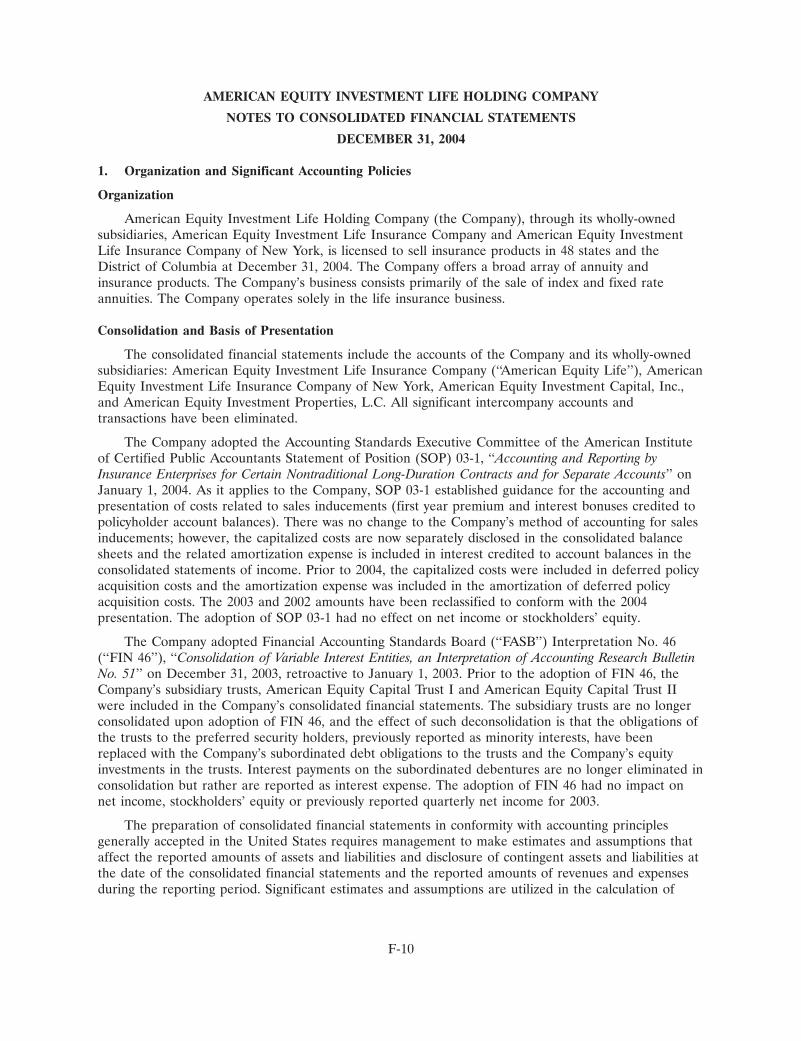
AMERICAN EQUITY INVESTMENT LIFE HOLDING COMPANY
NOTES TO CONSOLIDATED FINANCIAL STATEMENTS
DECEMBER 31, 2004
1. Organization and Significant Accounting Policies
Organization
American Equity Investment Life Holding Company (the Company), through its wholly-ownedsubsidiaries, American Equity Investment Life Insurance Company and American Equity InvestmentLife Insurance Company of New York, is licensed to sell insurance products in 48 states and theDistrict of Columbia at December 31, 2004. The Company offers a broad array of annuity andinsurance products. The Company’s business consists primarily of the sale of index and fixed rateannuities. The Company operates solely in the life insurance business.
Consolidation and Basis of Presentation
The consolidated financial statements include the accounts of the Company and its wholly-ownedsubsidiaries: American Equity Investment Life Insurance Company (‘‘American Equity Life’’), AmericanEquity Investment Life Insurance Company of New York, American Equity Investment Capital, Inc.,and American Equity Investment Properties, L.C. All significant intercompany accounts andtransactions have been eliminated.
The Company adopted the Accounting Standards Executive Committee of the American Instituteof Certified Public Accountants Statement of Position (SOP) 03-1, ‘‘Accounting and Reporting byInsurance Enterprises for Certain Nontraditional Long-Duration Contracts and for Separate Accounts’’ onJanuary 1, 2004. As it applies to the Company, SOP 03-1 established guidance for the accounting andpresentation of costs related to sales inducements (first year premium and interest bonuses credited topolicyholder account balances). There was no change to the Company’s method of accounting for salesinducements; however, the capitalized costs are now separately disclosed in the consolidated balancesheets and the related amortization expense is included in interest credited to account balances in theconsolidated statements of income. Prior to 2004, the capitalized costs were included in deferred policyacquisition costs and the amortization expense was included in the amortization of deferred policyacquisition costs. The 2003 and 2002 amounts have been reclassified to conform with the 2004presentation. The adoption of SOP 03-1 had no effect on net income or stockholders’ equity.
The Company adopted Financial Accounting Standards Board (‘‘FASB’’) Interpretation No. 46(‘‘FIN 46’’), ‘‘Consolidation of Variable Interest Entities, an Interpretation of Accounting Research BulletinNo. 51’’ on December 31, 2003, retroactive to January 1, 2003. Prior to the adoption of FIN 46, theCompany’s subsidiary trusts, American Equity Capital Trust I and American Equity Capital Trust IIwere included in the Company’s consolidated financial statements. The subsidiary trusts are no longerconsolidated upon adoption of FIN 46, and the effect of such deconsolidation is that the obligations ofthe trusts to the preferred security holders, previously reported as minority interests, have beenreplaced with the Company’s subordinated debt obligations to the trusts and the Company’s equityinvestments in the trusts. Interest payments on the subordinated debentures are no longer eliminated inconsolidation but rather are reported as interest expense. The adoption of FIN 46 had no impact onnet income, stockholders’ equity or previously reported quarterly net income for 2003.
The preparation of consolidated financial statements in conformity with accounting principlesgenerally accepted in the United States requires management to make estimates and assumptions thataffect the reported amounts of assets and liabilities and disclosure of contingent assets and liabilities atthe date of the consolidated financial statements and the reported amounts of revenues and expensesduring the reporting period. Significant estimates and assumptions are utilized in the calculation of
F-10
AMERICAN EQUITY INVESTMENT LIFE HOLDING COMPANY
NOTES TO CONSOLIDATED FINANCIAL STATEMENTS (Continued)
DECEMBER 31, 2004
deferred policy acquisition costs, deferred sales inducements, policyholder liabilities and accruals,valuation of embedded derivatives on index reserves and valuation allowances on deferred tax assetsand investments. It is reasonably possible that actual experience could differ from the estimates andassumptions utilized.
Reclassifications
Certain items appearing in the 2003 and 2002 consolidated financial statements have beenreclassified to conform with the current year presentation.
Investments
Fixed maturity securities (bonds and redeemable preferred stocks maturing more than one yearafter issuance) that may be sold prior to maturity are classified as available for sale. Available for salesecurities are reported at estimated fair value and unrealized gains and losses, if any, on thesesecurities are included directly in a separate component of stockholders’ equity, net of income taxesand certain adjustments, for assumed changes in amortization of deferred policy acquisition costs anddeferred sales inducements. Premiums and discounts are amortized/accrued using methods which resultin a constant yield over the securities’ expected lives. Amortization/accrual of premiums and discountson mortgage and asset-backed securities incorporate prepayment assumptions to estimate the securities’expected lives.
Fixed maturity securities that the Company has the positive intent and ability to hold to maturityare classified as held for investment. Held for investment securities are reported at cost adjusted foramortization of premiums and discounts. Changes in the market value of these securities, except fordeclines that are other than temporary, are not reflected in the Company’s financial statements.Premiums and discounts are amortized/accrued using methods which result in a constant yield over thesecurities’ expected lives.
Equity securities, comprised of common and non-redeemable preferred stocks, are classified asavailable for sale and are reported at market value. Unrealized gains and losses are included directly ina separate component of stockholders’ equity, net of income taxes.
Mortgage loans on real estate are reported at cost, adjusted for amortization of premiums andaccrual of discounts. If the Company determines that the value of any mortgage loan is impaired, thecarrying amount of the mortgage loan will be reduced to its fair value, based upon the present value ofexpected future cash flows from the loan discounted at the loan’s effective interest rate, or the fairvalue of the underlying collateral.
Policy loans are reported at unpaid principal.
The carrying amounts of all the Company’s investments are reviewed on an ongoing basis forcredit deterioration. If this review indicates a decline in market value that is other than temporary, theCompany’s carrying amount in the investment is reduced to its estimated fair value and a specificwritedown is taken. Such reductions in carrying amount are recognized as realized losses and chargedto income. Realized gains and losses on sales are determined on the basis of specific identification ofinvestments.
Market values, as reported herein, of fixed maturity and equity securities are based on the latestquoted market prices, or for those fixed maturity securities not readily marketable, at values which arerepresentative of the market values of issues of comparable yield and quality.
F-11
AMERICAN EQUITY INVESTMENT LIFE HOLDING COMPANY
NOTES TO CONSOLIDATED FINANCIAL STATEMENTS (Continued)
DECEMBER 31, 2004
Derivative Instruments
Pursuant to Statement of Financial Accounting Standards (‘‘SFAS’’) No. 133, Accounting forDerivative Instruments and Hedging Activities, all derivative instruments (including certain derivativeinstruments embedded in other contracts) are recognized in the balance sheet at their fair values andchanges in fair value are recognized immediately in earnings, unless the derivatives qualify as hedges offuture cash flows. For derivatives qualifying as hedges of future cash flows, the effective portion of thechanges in fair value is recorded temporarily in equity, then recognized in earnings along with therelated effects of the hedged items. Any ‘‘ineffective’’ portion of a hedge is reported in earnings as itoccurs.
The Company has index annuity products that guarantee the return of principal to the policyholderand credit interest based on a percentage of the gain in a specified market index. A portion of thepremium from each policyholder is invested in investment grade fixed income securities to cover theminimum guaranteed value due the policyholder at the end of the contract term. A portion of thepremium is used to purchase derivatives consisting of call options on the applicable market indices tofund the index credits due to index annuity policyholders. Substantially all such call options are oneyear options purchased to match the funding requirements of the underlying policies. The call optionsare marked to market with the change in fair value included as a component of our revenues. On therespective anniversary dates of the index policies, the index used to compute the annual index credit isreset and the Company purchases new one-year call options to fund the next annual index credit. TheCompany manages the cost of these purchases through the terms of its index annuities, which permitsthe Company to change annual participation rates, asset fees, and/or caps, subject to guaranteedminimums. By reducing participation rates, asset fees or caps, the Company can limit option costs tobudgeted amounts except in cases where the contractual features would prevent further modifications.
The Company’s strategy attempts to mitigate any potential risk of loss under these agreementsthrough a regular monitoring process which evaluates the program’s effectiveness. The Company isexposed to risk of loss in the event of nonperformance by the counterparties and, accordingly, theCompany purchases its option contracts from multiple counterparties and evaluates the creditworthinessof all counterparties prior to purchase of the contracts. At December 31, 2004, all of these options hadbeen purchased from nationally recognized investment banking institutions with a Standard and Poor’scredit rating of BBB+ or higher.
Under SFAS No. 133, the future annual index credits on the Company’s index annuities are treatedas a ‘‘series of embedded derivatives’’ over the expected life of the applicable contract. The Companydoes not purchase call options to fund the index liabilities which may arise after the next policyanniversary date. The Company must value both the call options and the related forward embeddedoptions in the policies at fair value. The change in fair value for the call options is included in changein fair value of derivatives and the change in fair value adjustment of the embedded options is includedin change in fair value of embedded derivatives in the Consolidated Statements of Income.
Amortization of deferred policy acquisition costs and deferred sales inducements increased by$6.4 million in 2004, decreased by $1.7 million in 2003 and increased by $1.4 million in 2002 as a resultof the impact of SFAS No. 133.
Cash and Cash Equivalents
For purposes of the consolidated statements of cash flows, the Company considers all highly liquiddebt instruments purchased with a maturity of three months or less to be cash equivalents.
F-12
AMERICAN EQUITY INVESTMENT LIFE HOLDING COMPANY
NOTES TO CONSOLIDATED FINANCIAL STATEMENTS (Continued)
DECEMBER 31, 2004
Deferred Policy Acquisition Costs and Deferred Sales Inducements
To the extent recoverable from future policy revenues and gross profits, certain costs of producingnew business, principally commissions, first-year premium and interest bonuses credited to policyholderaccount balances and certain costs of policy issuance (including policy issue costs of $6.3 million,$3.8 million and $4.1 million in 2004, 2003 and 2002, respectively) have been deferred and capitalizedas deferred policy acquisition costs or deferred sales inducements. For annuity and single premiumuniversal life products, these capitalized costs are being amortized generally in proportion to expectedgross profits from surrender charges and investment, mortality, and expense margins. That amortizationis adjusted retrospectively when estimates of future gross profits/margins (including the impact ofrealized investment gains and losses) to be realized from a group of products are revised. Deferredpolicy acquisition costs and deferred sales inducements are also adjusted for the change in amortizationthat would have occurred if available-for-sale fixed maturity securities had been sold at their aggregatemarket value and the proceeds reinvested at current yields. The impact of this adjustment is included inaccumulated other comprehensive income (loss) within stockholders’ equity.
For traditional life and accident and health insurance, deferred policy acquisition costs are beingamortized over the premium-paying period of the related policies in proportion to premium revenuesrecognized, principally using the same assumptions for interest, mortality and withdrawals that are usedfor computing liabilities for future policy benefits subject to traditional ‘‘lock-in’’ concepts.
Future Policy Benefits
Future policy benefit reserves for annuity and single premium universal life products are computedunder a retrospective deposit method and represent policy account balances before applicablesurrender charges. Policy benefits and claims that are charged to expense include benefit claimsincurred in the period in excess of related policy account balances. Interest crediting rates (includingfirst year interest bonuses capitalized as deferred sales inducements) for these products ranged from3.0% to 11.5% in 2004 and 2003 and from 3.0% to 12.0% in 2002. These rates include first-yearinterest bonuses capitalized as deferred sales inducements.
The liability for future policy benefits for traditional life insurance is based on net level premiumreserves, including assumptions as to interest, mortality, and other assumptions underlying theguaranteed policy cash values. Reserve interest assumptions are level and range from 3.0% to 6.0%.The liabilities for future policy benefits for accident and health insurance are computed using a netlevel premium method, including assumptions as to morbidity and other assumptions based on theCompany’s experience, modified as necessary to give effect to anticipated trends and to includeprovisions for possible unfavorable deviations. Policy benefit claims are charged to expense in theperiod that the claims are incurred.
Unpaid claims include amounts for losses and related adjustment expenses and are determinedusing individual claim evaluations and statistical analysis. Unpaid claims represent estimates of theultimate net costs of all losses, reported and unreported, which remain unpaid at December 31 of eachyear. These estimates are necessarily subject to the impact of future changes in claim severity,frequency and other factors. In spite of the variability inherent in such situations, management believesthat the unpaid claim amounts are adequate. The estimates are continuously reviewed and asadjustments to these amounts become necessary, such adjustments are reflected in current operations.
F-13
AMERICAN EQUITY INVESTMENT LIFE HOLDING COMPANY
NOTES TO CONSOLIDATED FINANCIAL STATEMENTS (Continued)
DECEMBER 31, 2004
Certain group policies include provisions for annual experience refunds of premiums equal to netpremiums received less a 16% administrative fee and less claims incurred. Such amounts (2004—$0.0 million; 2003—$0.1 million; and 2002—$0.3 million) are reported as a reduction of traditional lifeand accident and health insurance premiums in the consolidated statements of income.
Deferred Income Taxes
Deferred income tax assets or liabilities are computed based on the temporary differences betweenthe financial statement and income tax bases of assets and liabilities using the enacted marginal taxrate. Deferred income tax expenses or credits are based on the changes in the asset or liability fromperiod to period. Deferred income tax assets are subject to ongoing evaluation of whether such assetswill be realized. The ultimate realization of deferred income tax assets depends on generating futuretaxable income during the periods in which temporary differences become deductible. If future incomeis not generated as expected, deferred income tax assets may need to be written off.
Stockholders’ Equity
On December 9, 2003, the Company completed an initial public offering of 18,700,000 shares of itscommon stock at a price of $9.00 per share. Pursuant to the over-allotment option granted to theunderwriters in the offering, the underwriters purchased an additional 2,000,000 shares onDecember 29, 2003 and an additional 805,000 shares on January 7, 2004, which fully exercised theover-allotment option. The proceeds from the initial public offering (including proceeds from sharesissued pursuant to the over-allotment option), net of the underwriting discount and expenses, wereapproximately $178.0 million.
The Company issued 625,000 shares of 1998 Series A Participating Preferred Stock (aggregateliquidation preference of $10.0 million). During 2004, all of these shares converted into 1,875,000shares of the Company’s common stock. Prior to conversion, these preferred shares had participatingdividend rights with shares of the Company’s common stock, when and as such dividends weredeclared.
Recognition of Premium Revenues and Costs
Revenues for annuity and single premium universal life products include surrender chargesassessed against policyholder account balances and mortality and expense charges (single premiumuniversal life products only) during the period. Expenses related to these products include interestcredited to policyholder account balances and benefit claims incurred in excess of policyholder accountbalances (single premium universal life products only).
Traditional life and accident and health insurance premiums are recognized as revenues over thepremium-paying period. Future policy benefits are recognized as expenses over the life of the policy bymeans of the provision for future policy benefits.
All insurance-related revenues, benefits, losses and expenses are reported net of reinsurance ceded.
Premiums and Deposits by Product Type
The Company markets index annuities, fixed rate annuities, a variable annuity and life insurance.In connection with its reinsured group life business, the Company also collects renewal premiums on
F-14
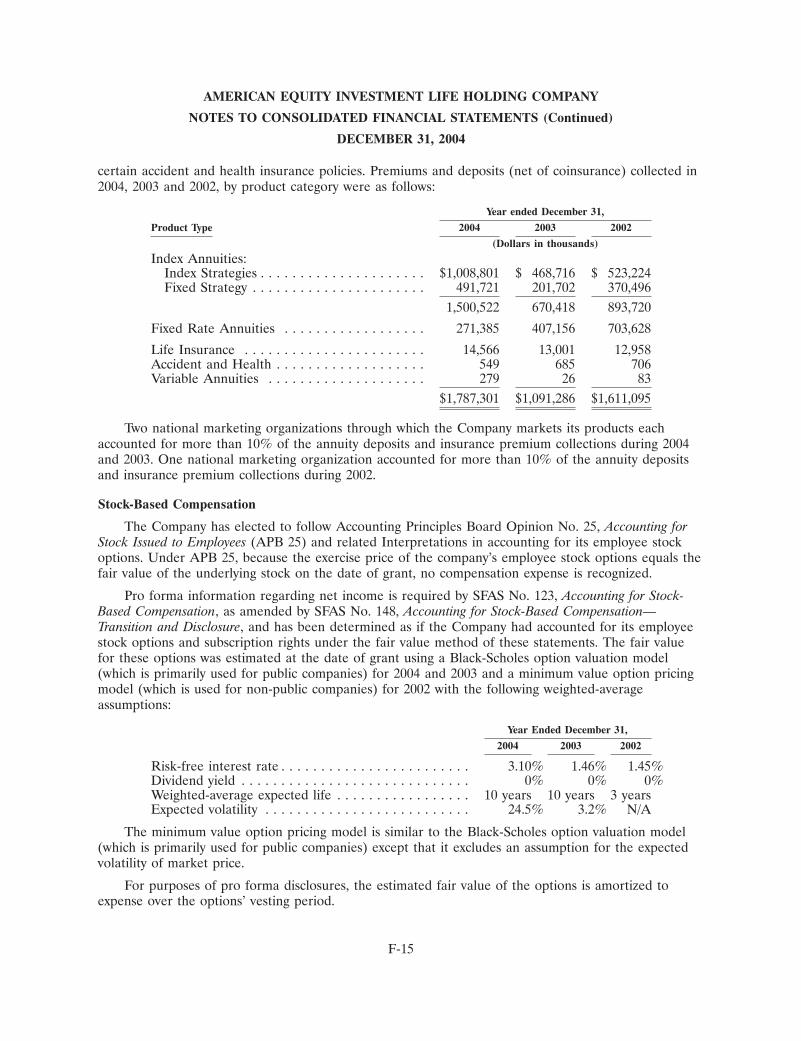
AMERICAN EQUITY INVESTMENT LIFE HOLDING COMPANY
NOTES TO CONSOLIDATED FINANCIAL STATEMENTS (Continued)
DECEMBER 31, 2004
certain accident and health insurance policies. Premiums and deposits (net of coinsurance) collected in2004, 2003 and 2002, by product category were as follows:
Year ended December 31,
Product Type 2004 2003 2002
(Dollars in thousands)
Index Annuities:Index Strategies . . . . . . . . . . . . . . . . . . . . . $1,008,801 $ 468,716 $ 523,224Fixed Strategy . . . . . . . . . . . . . . . . . . . . . . 491,721 201,702 370,496
1,500,522 670,418 893,720
Fixed Rate Annuities . . . . . . . . . . . . . . . . . . 271,385 407,156 703,628
Life Insurance . . . . . . . . . . . . . . . . . . . . . . . 14,566 13,001 12,958Accident and Health . . . . . . . . . . . . . . . . . . . 549 685 706Variable Annuities . . . . . . . . . . . . . . . . . . . . 279 26 83
$1,787,301 $1,091,286 $1,611,095
Two national marketing organizations through which the Company markets its products eachaccounted for more than 10% of the annuity deposits and insurance premium collections during 2004and 2003. One national marketing organization accounted for more than 10% of the annuity depositsand insurance premium collections during 2002.
Stock-Based Compensation
The Company has elected to follow Accounting Principles Board Opinion No. 25, Accounting forStock Issued to Employees (APB 25) and related Interpretations in accounting for its employee stockoptions. Under APB 25, because the exercise price of the company’s employee stock options equals thefair value of the underlying stock on the date of grant, no compensation expense is recognized.
Pro forma information regarding net income is required by SFAS No. 123, Accounting for Stock-Based Compensation, as amended by SFAS No. 148, Accounting for Stock-Based Compensation—Transition and Disclosure, and has been determined as if the Company had accounted for its employeestock options and subscription rights under the fair value method of these statements. The fair valuefor these options was estimated at the date of grant using a Black-Scholes option valuation model(which is primarily used for public companies) for 2004 and 2003 and a minimum value option pricingmodel (which is used for non-public companies) for 2002 with the following weighted-averageassumptions:
Year Ended December 31,
2004 2003 2002
Risk-free interest rate . . . . . . . . . . . . . . . . . . . . . . . . 3.10% 1.46% 1.45%Dividend yield . . . . . . . . . . . . . . . . . . . . . . . . . . . . . 0% 0% 0%Weighted-average expected life . . . . . . . . . . . . . . . . . 10 years 10 years 3 yearsExpected volatility . . . . . . . . . . . . . . . . . . . . . . . . . . 24.5% 3.2% N/A
The minimum value option pricing model is similar to the Black-Scholes option valuation model(which is primarily used for public companies) except that it excludes an assumption for the expectedvolatility of market price.
For purposes of pro forma disclosures, the estimated fair value of the options is amortized toexpense over the options’ vesting period.
F-15
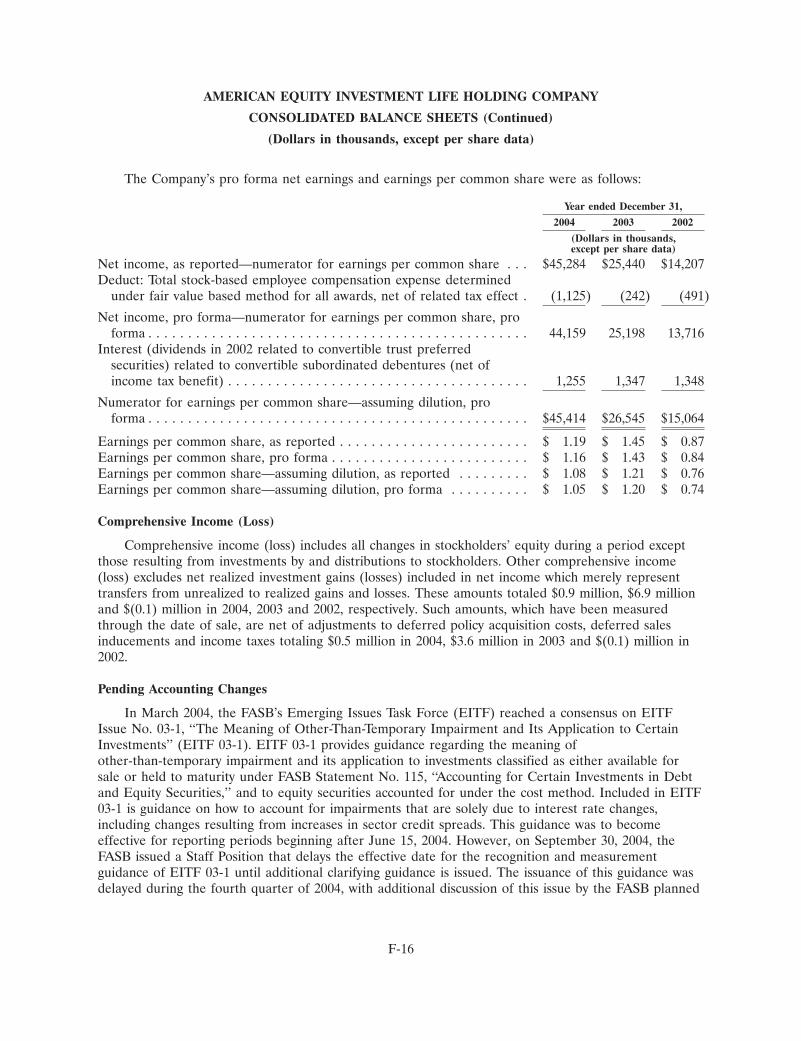
AMERICAN EQUITY INVESTMENT LIFE HOLDING COMPANY
CONSOLIDATED BALANCE SHEETS (Continued)
(Dollars in thousands, except per share data)
The Company’s pro forma net earnings and earnings per common share were as follows:
Year ended December 31,
2004 2003 2002
(Dollars in thousands,except per share data)
Net income, as reported—numerator for earnings per common share . . . $45,284 $25,440 $14,207Deduct: Total stock-based employee compensation expense determined
under fair value based method for all awards, net of related tax effect . (1,125) (242) (491)
Net income, pro forma—numerator for earnings per common share, proforma . . . . . . . . . . . . . . . . . . . . . . . . . . . . . . . . . . . . . . . . . . . . . . . . 44,159 25,198 13,716
Interest (dividends in 2002 related to convertible trust preferredsecurities) related to convertible subordinated debentures (net ofincome tax benefit) . . . . . . . . . . . . . . . . . . . . . . . . . . . . . . . . . . . . . . 1,255 1,347 1,348
Numerator for earnings per common share—assuming dilution, proforma . . . . . . . . . . . . . . . . . . . . . . . . . . . . . . . . . . . . . . . . . . . . . . . . $45,414 $26,545 $15,064
Earnings per common share, as reported . . . . . . . . . . . . . . . . . . . . . . . . $ 1.19 $ 1.45 $ 0.87Earnings per common share, pro forma . . . . . . . . . . . . . . . . . . . . . . . . . $ 1.16 $ 1.43 $ 0.84Earnings per common share—assuming dilution, as reported . . . . . . . . . $ 1.08 $ 1.21 $ 0.76Earnings per common share—assuming dilution, pro forma . . . . . . . . . . $ 1.05 $ 1.20 $ 0.74
Comprehensive Income (Loss)
Comprehensive income (loss) includes all changes in stockholders’ equity during a period exceptthose resulting from investments by and distributions to stockholders. Other comprehensive income(loss) excludes net realized investment gains (losses) included in net income which merely representtransfers from unrealized to realized gains and losses. These amounts totaled $0.9 million, $6.9 millionand $(0.1) million in 2004, 2003 and 2002, respectively. Such amounts, which have been measuredthrough the date of sale, are net of adjustments to deferred policy acquisition costs, deferred salesinducements and income taxes totaling $0.5 million in 2004, $3.6 million in 2003 and $(0.1) million in2002.
Pending Accounting Changes
In March 2004, the FASB’s Emerging Issues Task Force (EITF) reached a consensus on EITFIssue No. 03-1, ‘‘The Meaning of Other-Than-Temporary Impairment and Its Application to CertainInvestments’’ (EITF 03-1). EITF 03-1 provides guidance regarding the meaning ofother-than-temporary impairment and its application to investments classified as either available forsale or held to maturity under FASB Statement No. 115, ‘‘Accounting for Certain Investments in Debtand Equity Securities,’’ and to equity securities accounted for under the cost method. Included in EITF03-1 is guidance on how to account for impairments that are solely due to interest rate changes,including changes resulting from increases in sector credit spreads. This guidance was to becomeeffective for reporting periods beginning after June 15, 2004. However, on September 30, 2004, theFASB issued a Staff Position that delays the effective date for the recognition and measurementguidance of EITF 03-1 until additional clarifying guidance is issued. The issuance of this guidance wasdelayed during the fourth quarter of 2004, with additional discussion of this issue by the FASB planned
F-16
AMERICAN EQUITY INVESTMENT LIFE HOLDING COMPANY
CONSOLIDATED BALANCE SHEETS (Continued)
(Dollars in thousands, except per share data)
for 2005. We are not able to assess the impact of the adoption of EITF 03-1 until final guidance isissued.
In December 2004, the FASB issued Statement of Financial Accounting Standards (‘‘SFAS’’)No. 123 (Revised 2004), ‘‘Share-Based Payment’’ (‘‘SFAS 123R’’). This standard requires expensingstock options and other share-based payments and supersedes SFAS No. 123, which had allowedcompanies to choose between expensing stock options or showing proforma disclosure only. Thisstandard is effective for the Company as of July 1, 2005 and will apply to all awards granted, modified,cancelled or purchased after that date as well as the unvested portion of prior awards. The Companywill adopt the standard as of the effective date and does not believe it will have a material effect onthe financial statements.
2. Fair Values of Financial Instruments
The following methods and assumptions were used by the Company in estimating the fair values offinancial instruments:
Fixed maturity securities: Quoted market prices, when available, or price matrices for securitieswhich are not actively traded, developed using yield data and other factors relating to instruments orsecurities with similar characteristics.
Equity securities: Quoted market prices.
Mortgage loans on real estate: Discounted expected cash flows using interest rates currently beingoffered for similar loans.
Derivative instruments: Quoted market prices from related counterparties.
Policy loans: The Company has not attempted to determine the fair values associated with itspolicy loans, as management believes any differences between the Company’s carrying value and thefair values afforded these instruments are immaterial to the Company’s financial position and,accordingly, the cost to provide such disclosure is not worth the benefit to be derived.
Cash and cash equivalents: Amounts reported in the consolidated balance sheets for theseinstruments approximate their fair values.
Annuity and single premium universal life policy benefit reserves and coinsurance deposits—relatedparty: Fair values of the Company’s liabilities under contracts not involving significant mortality ormorbidity risks (principally deferred annuities), are stated at the cost the Company would incur toextinguish the liability (i.e., the cash surrender value) adjusted as required under SFAS No. 133. Thecoinsurance deposits related to the annuity benefit reserves have fair values determined in a similarfashion. The Company is not required to and has not estimated the fair value of its liabilities underother contracts.
Notes payable and amounts due under repurchase agreements: The fair value of the contingentconvertible senior notes is based upon quoted market prices. The amounts reported in the consolidatedbalance sheets for other notes payable and short term indebtedness under repurchase agreements withvariable interest rates approximate their fair values.
F-17
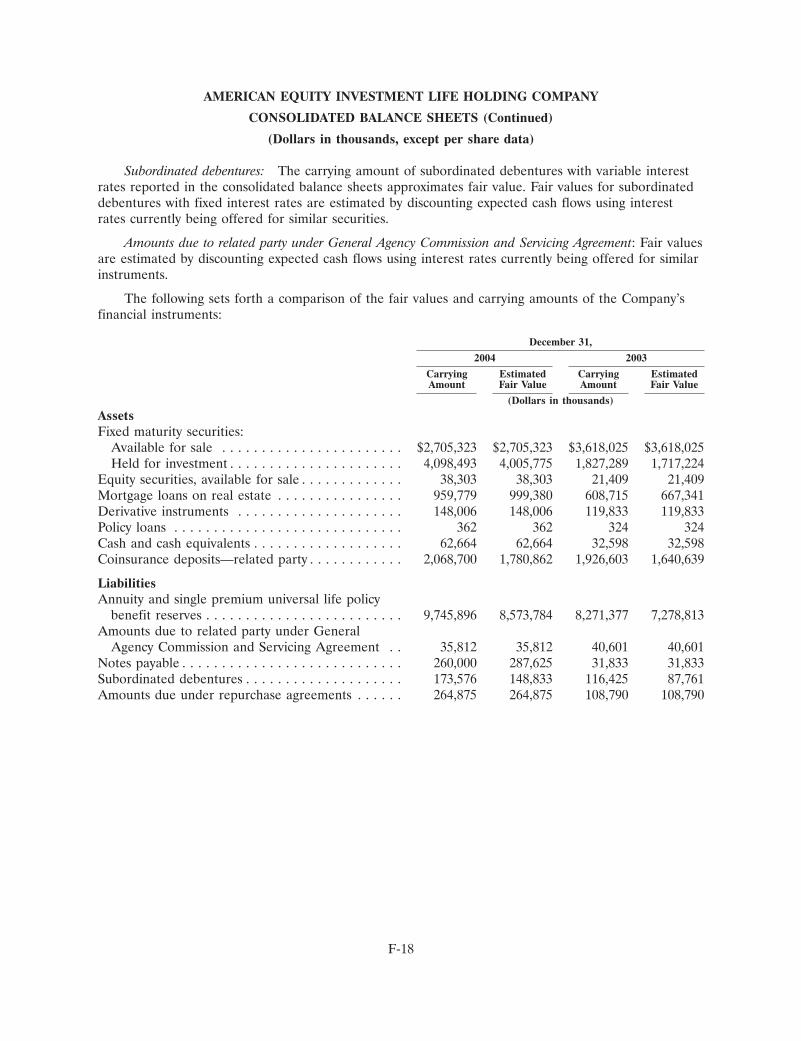
AMERICAN EQUITY INVESTMENT LIFE HOLDING COMPANY
CONSOLIDATED BALANCE SHEETS (Continued)
(Dollars in thousands, except per share data)
Subordinated debentures: The carrying amount of subordinated debentures with variable interestrates reported in the consolidated balance sheets approximates fair value. Fair values for subordinateddebentures with fixed interest rates are estimated by discounting expected cash flows using interestrates currently being offered for similar securities.
Amounts due to related party under General Agency Commission and Servicing Agreement: Fair valuesare estimated by discounting expected cash flows using interest rates currently being offered for similarinstruments.
The following sets forth a comparison of the fair values and carrying amounts of the Company’sfinancial instruments:
December 31,
2004 2003
Carrying Estimated Carrying EstimatedAmount Fair Value Amount Fair Value
(Dollars in thousands)
AssetsFixed maturity securities:
Available for sale . . . . . . . . . . . . . . . . . . . . . . . $2,705,323 $2,705,323 $3,618,025 $3,618,025Held for investment . . . . . . . . . . . . . . . . . . . . . . 4,098,493 4,005,775 1,827,289 1,717,224
Equity securities, available for sale . . . . . . . . . . . . . 38,303 38,303 21,409 21,409Mortgage loans on real estate . . . . . . . . . . . . . . . . 959,779 999,380 608,715 667,341Derivative instruments . . . . . . . . . . . . . . . . . . . . . 148,006 148,006 119,833 119,833Policy loans . . . . . . . . . . . . . . . . . . . . . . . . . . . . . 362 362 324 324Cash and cash equivalents . . . . . . . . . . . . . . . . . . . 62,664 62,664 32,598 32,598Coinsurance deposits—related party . . . . . . . . . . . . 2,068,700 1,780,862 1,926,603 1,640,639
LiabilitiesAnnuity and single premium universal life policy
benefit reserves . . . . . . . . . . . . . . . . . . . . . . . . . 9,745,896 8,573,784 8,271,377 7,278,813Amounts due to related party under General
Agency Commission and Servicing Agreement . . 35,812 35,812 40,601 40,601Notes payable . . . . . . . . . . . . . . . . . . . . . . . . . . . . 260,000 287,625 31,833 31,833Subordinated debentures . . . . . . . . . . . . . . . . . . . . 173,576 148,833 116,425 87,761Amounts due under repurchase agreements . . . . . . 264,875 264,875 108,790 108,790
F-18
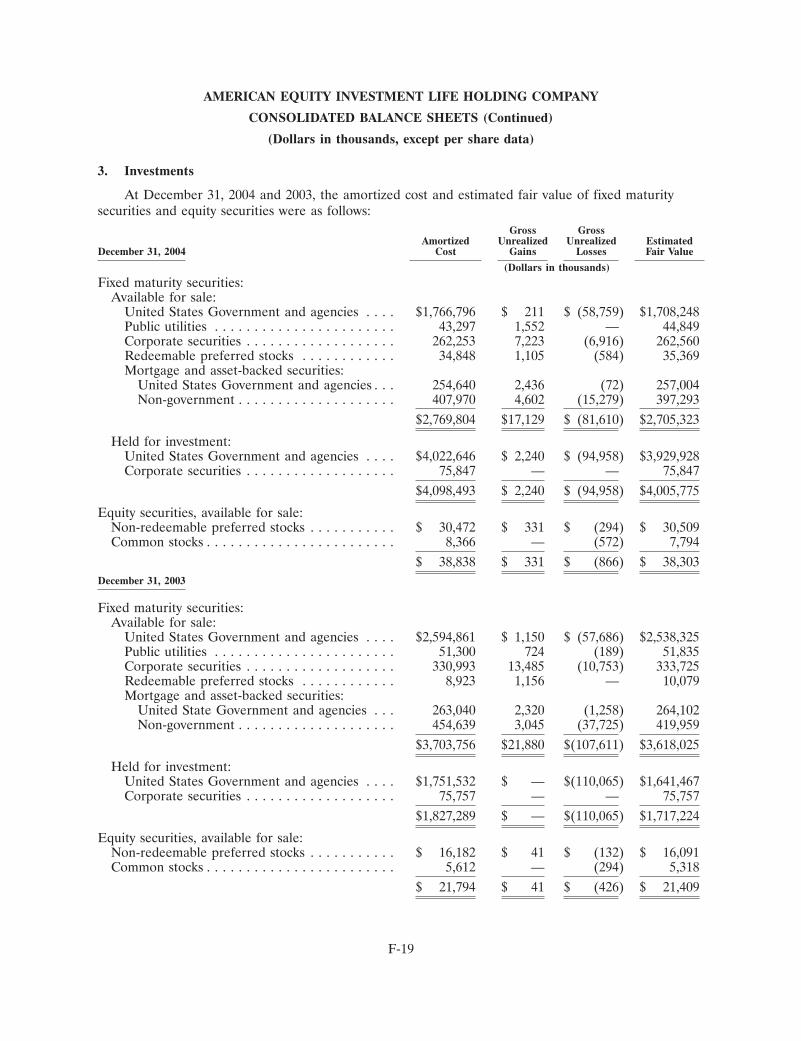
AMERICAN EQUITY INVESTMENT LIFE HOLDING COMPANY
CONSOLIDATED BALANCE SHEETS (Continued)
(Dollars in thousands, except per share data)
3. Investments
At December 31, 2004 and 2003, the amortized cost and estimated fair value of fixed maturitysecurities and equity securities were as follows:
Gross GrossAmortized Unrealized Unrealized Estimated
December 31, 2004 Cost Gains Losses Fair Value
(Dollars in thousands)
Fixed maturity securities:Available for sale:
United States Government and agencies . . . . $1,766,796 $ 211 $ (58,759) $1,708,248Public utilities . . . . . . . . . . . . . . . . . . . . . . . 43,297 1,552 — 44,849Corporate securities . . . . . . . . . . . . . . . . . . . 262,253 7,223 (6,916) 262,560Redeemable preferred stocks . . . . . . . . . . . . 34,848 1,105 (584) 35,369Mortgage and asset-backed securities:
United States Government and agencies . . . 254,640 2,436 (72) 257,004Non-government . . . . . . . . . . . . . . . . . . . . 407,970 4,602 (15,279) 397,293
$2,769,804 $17,129 $ (81,610) $2,705,323
Held for investment:United States Government and agencies . . . . $4,022,646 $ 2,240 $ (94,958) $3,929,928Corporate securities . . . . . . . . . . . . . . . . . . . 75,847 — — 75,847
$4,098,493 $ 2,240 $ (94,958) $4,005,775
Equity securities, available for sale:Non-redeemable preferred stocks . . . . . . . . . . . $ 30,472 $ 331 $ (294) $ 30,509Common stocks . . . . . . . . . . . . . . . . . . . . . . . . 8,366 — (572) 7,794
$ 38,838 $ 331 $ (866) $ 38,303December 31, 2003
Fixed maturity securities:Available for sale:
United States Government and agencies . . . . $2,594,861 $ 1,150 $ (57,686) $2,538,325Public utilities . . . . . . . . . . . . . . . . . . . . . . . 51,300 724 (189) 51,835Corporate securities . . . . . . . . . . . . . . . . . . . 330,993 13,485 (10,753) 333,725Redeemable preferred stocks . . . . . . . . . . . . 8,923 1,156 — 10,079Mortgage and asset-backed securities:
United State Government and agencies . . . 263,040 2,320 (1,258) 264,102Non-government . . . . . . . . . . . . . . . . . . . . 454,639 3,045 (37,725) 419,959
$3,703,756 $21,880 $(107,611) $3,618,025
Held for investment:United States Government and agencies . . . . $1,751,532 $ — $(110,065) $1,641,467Corporate securities . . . . . . . . . . . . . . . . . . . 75,757 — — 75,757
$1,827,289 $ — $(110,065) $1,717,224
Equity securities, available for sale:Non-redeemable preferred stocks . . . . . . . . . . . $ 16,182 $ 41 $ (132) $ 16,091Common stocks . . . . . . . . . . . . . . . . . . . . . . . . 5,612 — (294) 5,318
$ 21,794 $ 41 $ (426) $ 21,409
F-19
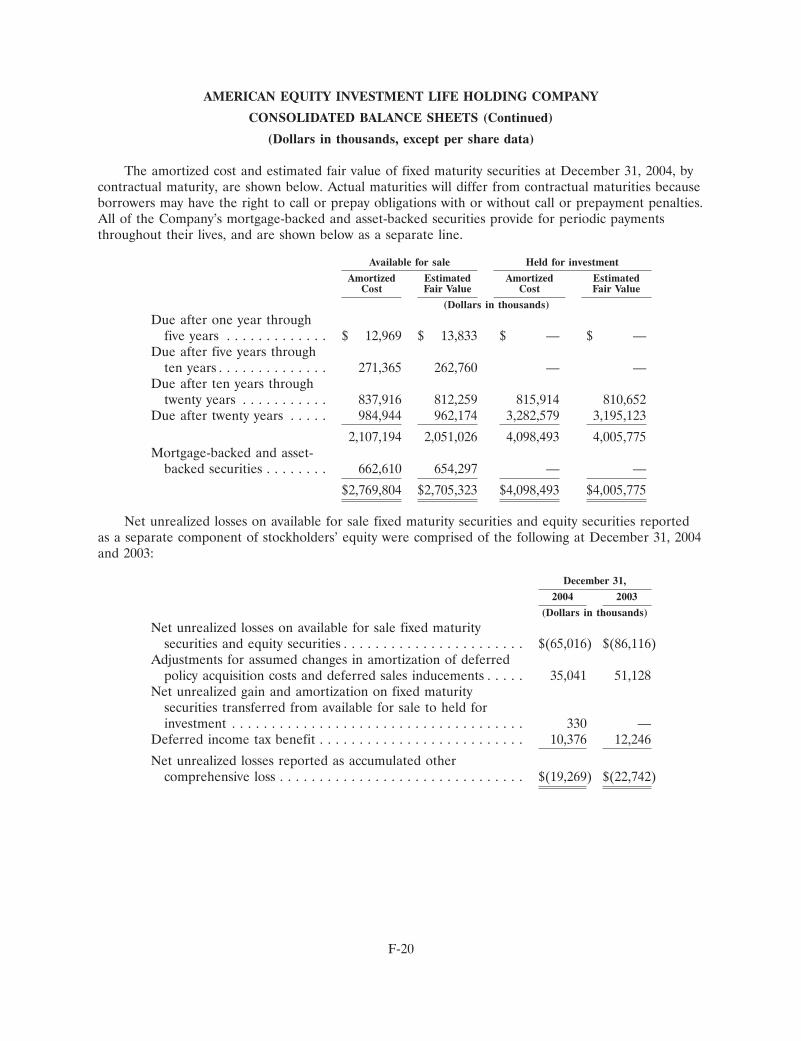
AMERICAN EQUITY INVESTMENT LIFE HOLDING COMPANY
CONSOLIDATED BALANCE SHEETS (Continued)
(Dollars in thousands, except per share data)
The amortized cost and estimated fair value of fixed maturity securities at December 31, 2004, bycontractual maturity, are shown below. Actual maturities will differ from contractual maturities becauseborrowers may have the right to call or prepay obligations with or without call or prepayment penalties.All of the Company’s mortgage-backed and asset-backed securities provide for periodic paymentsthroughout their lives, and are shown below as a separate line.
Available for sale Held for investment
Amortized Estimated Amortized EstimatedCost Fair Value Cost Fair Value
(Dollars in thousands)
Due after one year throughfive years . . . . . . . . . . . . . $ 12,969 $ 13,833 $ — $ —
Due after five years throughten years . . . . . . . . . . . . . . 271,365 262,760 — —
Due after ten years throughtwenty years . . . . . . . . . . . 837,916 812,259 815,914 810,652
Due after twenty years . . . . . 984,944 962,174 3,282,579 3,195,123
2,107,194 2,051,026 4,098,493 4,005,775Mortgage-backed and asset-
backed securities . . . . . . . . 662,610 654,297 — —
$2,769,804 $2,705,323 $4,098,493 $4,005,775
Net unrealized losses on available for sale fixed maturity securities and equity securities reportedas a separate component of stockholders’ equity were comprised of the following at December 31, 2004and 2003:
December 31,
2004 2003
(Dollars in thousands)
Net unrealized losses on available for sale fixed maturitysecurities and equity securities . . . . . . . . . . . . . . . . . . . . . . . $(65,016) $(86,116)
Adjustments for assumed changes in amortization of deferredpolicy acquisition costs and deferred sales inducements . . . . . 35,041 51,128
Net unrealized gain and amortization on fixed maturitysecurities transferred from available for sale to held forinvestment . . . . . . . . . . . . . . . . . . . . . . . . . . . . . . . . . . . . . 330 —
Deferred income tax benefit . . . . . . . . . . . . . . . . . . . . . . . . . . 10,376 12,246
Net unrealized losses reported as accumulated othercomprehensive loss . . . . . . . . . . . . . . . . . . . . . . . . . . . . . . . $(19,269) $(22,742)
F-20
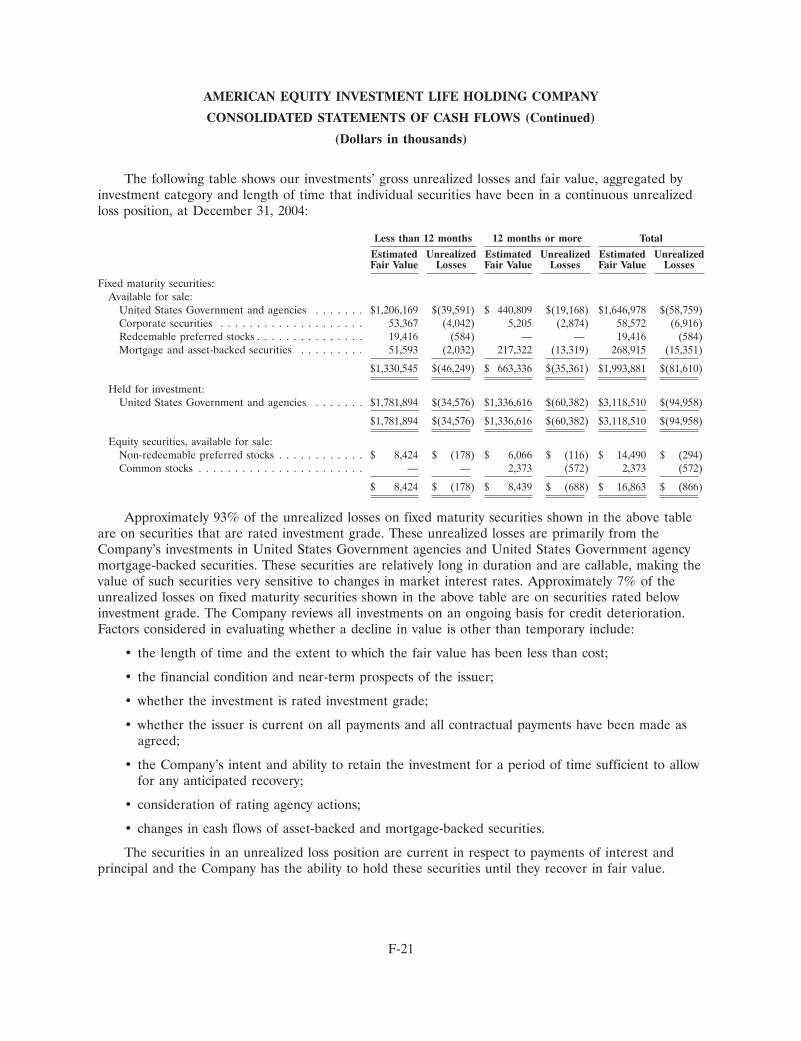
AMERICAN EQUITY INVESTMENT LIFE HOLDING COMPANY
CONSOLIDATED STATEMENTS OF CASH FLOWS (Continued)
(Dollars in thousands)
The following table shows our investments’ gross unrealized losses and fair value, aggregated byinvestment category and length of time that individual securities have been in a continuous unrealizedloss position, at December 31, 2004:
Less than 12 months 12 months or more Total
Estimated Unrealized Estimated Unrealized Estimated UnrealizedFair Value Losses Fair Value Losses Fair Value Losses
Fixed maturity securities:Available for sale:
United States Government and agencies . . . . . . . $1,206,169 $(39,591) $ 440,809 $(19,168) $1,646,978 $(58,759)Corporate securities . . . . . . . . . . . . . . . . . . . . 53,367 (4,042) 5,205 (2,874) 58,572 (6,916)Redeemable preferred stocks . . . . . . . . . . . . . . . 19,416 (584) — — 19,416 (584)Mortgage and asset-backed securities . . . . . . . . . 51,593 (2,032) 217,322 (13,319) 268,915 (15,351)
$1,330,545 $(46,249) $ 663,336 $(35,361) $1,993,881 $(81,610)
Held for investment:United States Government and agencies . . . . . . . $1,781,894 $(34,576) $1,336,616 $(60,382) $3,118,510 $(94,958)
$1,781,894 $(34,576) $1,336,616 $(60,382) $3,118,510 $(94,958)
Equity securities, available for sale:Non-redeemable preferred stocks . . . . . . . . . . . . $ 8,424 $ (178) $ 6,066 $ (116) $ 14,490 $ (294)Common stocks . . . . . . . . . . . . . . . . . . . . . . . — — 2,373 (572) 2,373 (572)
$ 8,424 $ (178) $ 8,439 $ (688) $ 16,863 $ (866)
Approximately 93% of the unrealized losses on fixed maturity securities shown in the above tableare on securities that are rated investment grade. These unrealized losses are primarily from theCompany’s investments in United States Government agencies and United States Government agencymortgage-backed securities. These securities are relatively long in duration and are callable, making thevalue of such securities very sensitive to changes in market interest rates. Approximately 7% of theunrealized losses on fixed maturity securities shown in the above table are on securities rated belowinvestment grade. The Company reviews all investments on an ongoing basis for credit deterioration.Factors considered in evaluating whether a decline in value is other than temporary include:
• the length of time and the extent to which the fair value has been less than cost;
• the financial condition and near-term prospects of the issuer;
• whether the investment is rated investment grade;
• whether the issuer is current on all payments and all contractual payments have been made asagreed;
• the Company’s intent and ability to retain the investment for a period of time sufficient to allowfor any anticipated recovery;
• consideration of rating agency actions;
• changes in cash flows of asset-backed and mortgage-backed securities.
The securities in an unrealized loss position are current in respect to payments of interest andprincipal and the Company has the ability to hold these securities until they recover in fair value.
F-21
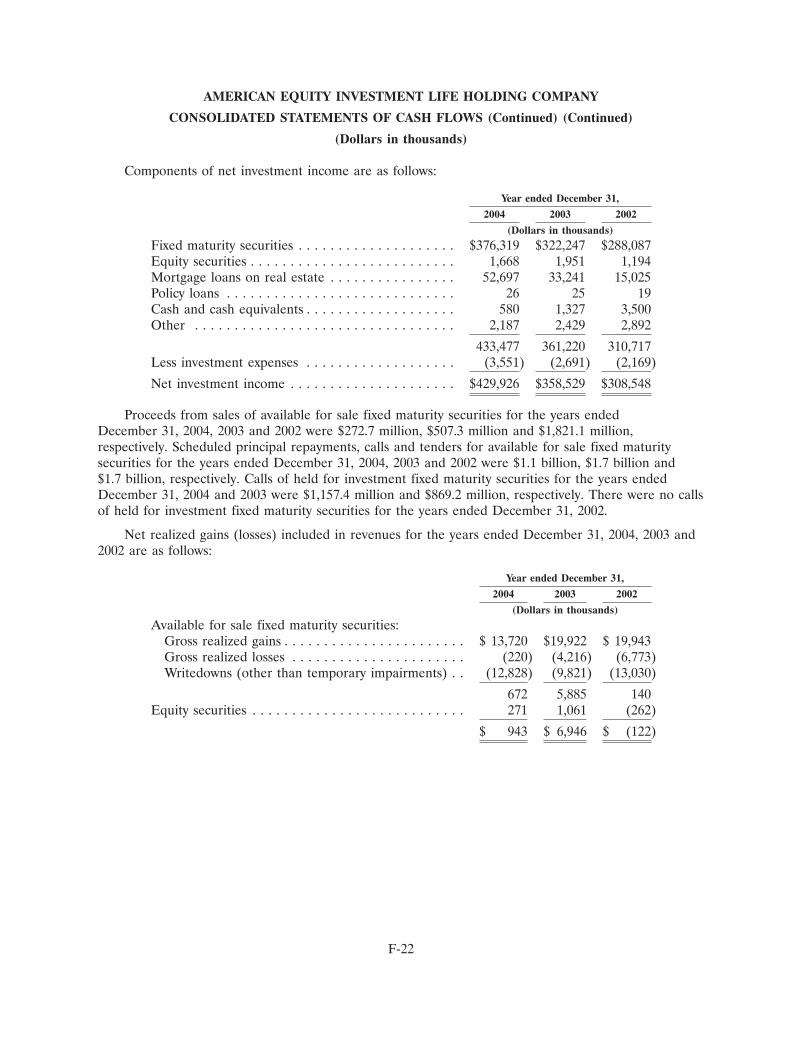
AMERICAN EQUITY INVESTMENT LIFE HOLDING COMPANY
CONSOLIDATED STATEMENTS OF CASH FLOWS (Continued) (Continued)
(Dollars in thousands)
Components of net investment income are as follows:
Year ended December 31,
2004 2003 2002
(Dollars in thousands)
Fixed maturity securities . . . . . . . . . . . . . . . . . . . . $376,319 $322,247 $288,087Equity securities . . . . . . . . . . . . . . . . . . . . . . . . . . 1,668 1,951 1,194Mortgage loans on real estate . . . . . . . . . . . . . . . . 52,697 33,241 15,025Policy loans . . . . . . . . . . . . . . . . . . . . . . . . . . . . . 26 25 19Cash and cash equivalents . . . . . . . . . . . . . . . . . . . 580 1,327 3,500Other . . . . . . . . . . . . . . . . . . . . . . . . . . . . . . . . . 2,187 2,429 2,892
433,477 361,220 310,717Less investment expenses . . . . . . . . . . . . . . . . . . . (3,551) (2,691) (2,169)
Net investment income . . . . . . . . . . . . . . . . . . . . . $429,926 $358,529 $308,548
Proceeds from sales of available for sale fixed maturity securities for the years endedDecember 31, 2004, 2003 and 2002 were $272.7 million, $507.3 million and $1,821.1 million,respectively. Scheduled principal repayments, calls and tenders for available for sale fixed maturitysecurities for the years ended December 31, 2004, 2003 and 2002 were $1.1 billion, $1.7 billion and$1.7 billion, respectively. Calls of held for investment fixed maturity securities for the years endedDecember 31, 2004 and 2003 were $1,157.4 million and $869.2 million, respectively. There were no callsof held for investment fixed maturity securities for the years ended December 31, 2002.
Net realized gains (losses) included in revenues for the years ended December 31, 2004, 2003 and2002 are as follows:
Year ended December 31,
2004 2003 2002
(Dollars in thousands)
Available for sale fixed maturity securities:Gross realized gains . . . . . . . . . . . . . . . . . . . . . . . $ 13,720 $19,922 $ 19,943Gross realized losses . . . . . . . . . . . . . . . . . . . . . . (220) (4,216) (6,773)Writedowns (other than temporary impairments) . . (12,828) (9,821) (13,030)
672 5,885 140Equity securities . . . . . . . . . . . . . . . . . . . . . . . . . . . 271 1,061 (262)
$ 943 $ 6,946 $ (122)
F-22
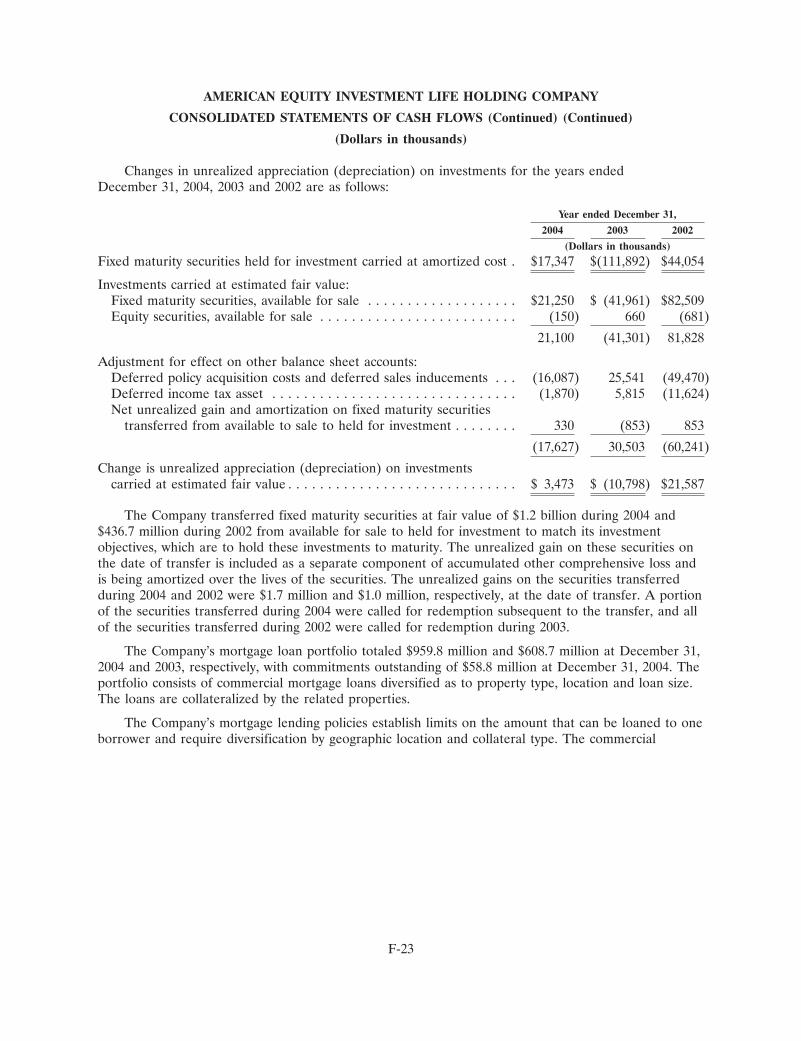
AMERICAN EQUITY INVESTMENT LIFE HOLDING COMPANY
CONSOLIDATED STATEMENTS OF CASH FLOWS (Continued) (Continued)
(Dollars in thousands)
Changes in unrealized appreciation (depreciation) on investments for the years endedDecember 31, 2004, 2003 and 2002 are as follows:
Year ended December 31,
2004 2003 2002
(Dollars in thousands)
Fixed maturity securities held for investment carried at amortized cost . $17,347 $(111,892) $44,054
Investments carried at estimated fair value:Fixed maturity securities, available for sale . . . . . . . . . . . . . . . . . . . $21,250 $ (41,961) $82,509Equity securities, available for sale . . . . . . . . . . . . . . . . . . . . . . . . . (150) 660 (681)
21,100 (41,301) 81,828
Adjustment for effect on other balance sheet accounts:Deferred policy acquisition costs and deferred sales inducements . . . (16,087) 25,541 (49,470)Deferred income tax asset . . . . . . . . . . . . . . . . . . . . . . . . . . . . . . . (1,870) 5,815 (11,624)Net unrealized gain and amortization on fixed maturity securities
transferred from available to sale to held for investment . . . . . . . . 330 (853) 853
(17,627) 30,503 (60,241)
Change is unrealized appreciation (depreciation) on investmentscarried at estimated fair value . . . . . . . . . . . . . . . . . . . . . . . . . . . . . $ 3,473 $ (10,798) $21,587
The Company transferred fixed maturity securities at fair value of $1.2 billion during 2004 and$436.7 million during 2002 from available for sale to held for investment to match its investmentobjectives, which are to hold these investments to maturity. The unrealized gain on these securities onthe date of transfer is included as a separate component of accumulated other comprehensive loss andis being amortized over the lives of the securities. The unrealized gains on the securities transferredduring 2004 and 2002 were $1.7 million and $1.0 million, respectively, at the date of transfer. A portionof the securities transferred during 2004 were called for redemption subsequent to the transfer, and allof the securities transferred during 2002 were called for redemption during 2003.
The Company’s mortgage loan portfolio totaled $959.8 million and $608.7 million at December 31,2004 and 2003, respectively, with commitments outstanding of $58.8 million at December 31, 2004. Theportfolio consists of commercial mortgage loans diversified as to property type, location and loan size.The loans are collateralized by the related properties.
The Company’s mortgage lending policies establish limits on the amount that can be loaned to oneborrower and require diversification by geographic location and collateral type. The commercial
F-23
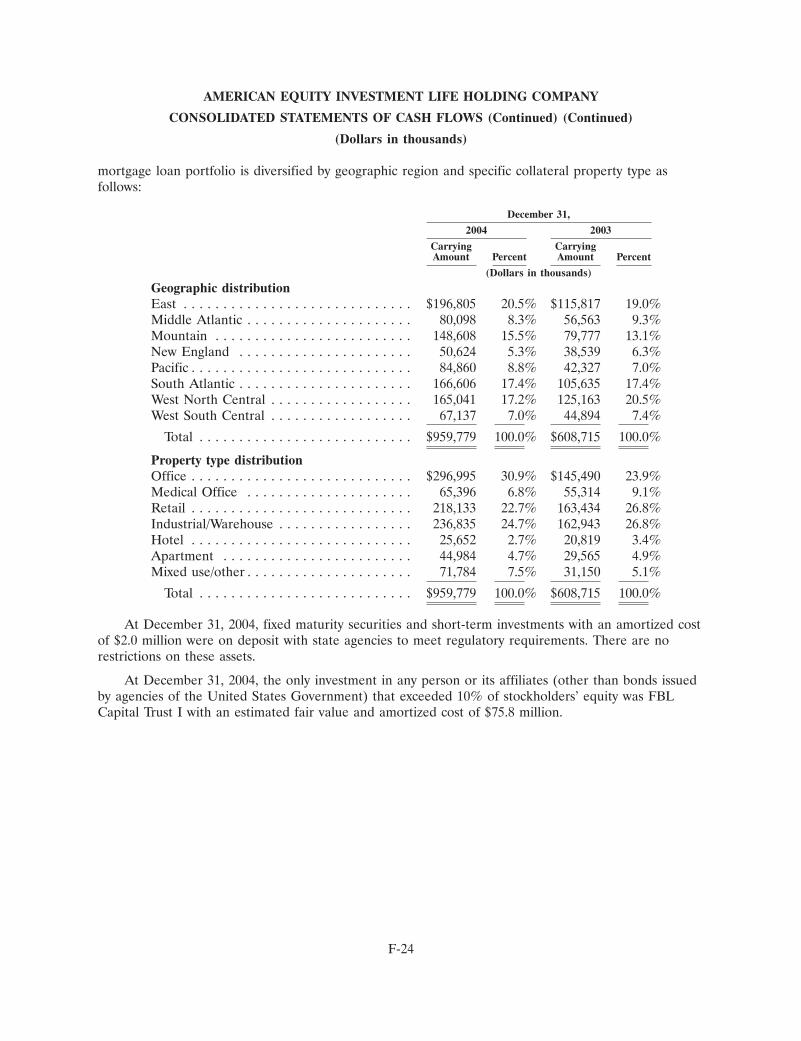
AMERICAN EQUITY INVESTMENT LIFE HOLDING COMPANY
CONSOLIDATED STATEMENTS OF CASH FLOWS (Continued) (Continued)
(Dollars in thousands)
mortgage loan portfolio is diversified by geographic region and specific collateral property type asfollows:
December 31,
2004 2003
Carrying CarryingAmount Percent Amount Percent
(Dollars in thousands)
Geographic distributionEast . . . . . . . . . . . . . . . . . . . . . . . . . . . . . $196,805 20.5% $115,817 19.0%Middle Atlantic . . . . . . . . . . . . . . . . . . . . . 80,098 8.3% 56,563 9.3%Mountain . . . . . . . . . . . . . . . . . . . . . . . . . 148,608 15.5% 79,777 13.1%New England . . . . . . . . . . . . . . . . . . . . . . 50,624 5.3% 38,539 6.3%Pacific . . . . . . . . . . . . . . . . . . . . . . . . . . . . 84,860 8.8% 42,327 7.0%South Atlantic . . . . . . . . . . . . . . . . . . . . . . 166,606 17.4% 105,635 17.4%West North Central . . . . . . . . . . . . . . . . . . 165,041 17.2% 125,163 20.5%West South Central . . . . . . . . . . . . . . . . . . 67,137 7.0% 44,894 7.4%
Total . . . . . . . . . . . . . . . . . . . . . . . . . . . $959,779 100.0% $608,715 100.0%
Property type distributionOffice . . . . . . . . . . . . . . . . . . . . . . . . . . . . $296,995 30.9% $145,490 23.9%Medical Office . . . . . . . . . . . . . . . . . . . . . 65,396 6.8% 55,314 9.1%Retail . . . . . . . . . . . . . . . . . . . . . . . . . . . . 218,133 22.7% 163,434 26.8%Industrial/Warehouse . . . . . . . . . . . . . . . . . 236,835 24.7% 162,943 26.8%Hotel . . . . . . . . . . . . . . . . . . . . . . . . . . . . 25,652 2.7% 20,819 3.4%Apartment . . . . . . . . . . . . . . . . . . . . . . . . 44,984 4.7% 29,565 4.9%Mixed use/other . . . . . . . . . . . . . . . . . . . . . 71,784 7.5% 31,150 5.1%
Total . . . . . . . . . . . . . . . . . . . . . . . . . . . $959,779 100.0% $608,715 100.0%
At December 31, 2004, fixed maturity securities and short-term investments with an amortized costof $2.0 million were on deposit with state agencies to meet regulatory requirements. There are norestrictions on these assets.
At December 31, 2004, the only investment in any person or its affiliates (other than bonds issuedby agencies of the United States Government) that exceeded 10% of stockholders’ equity was FBLCapital Trust I with an estimated fair value and amortized cost of $75.8 million.
F-24
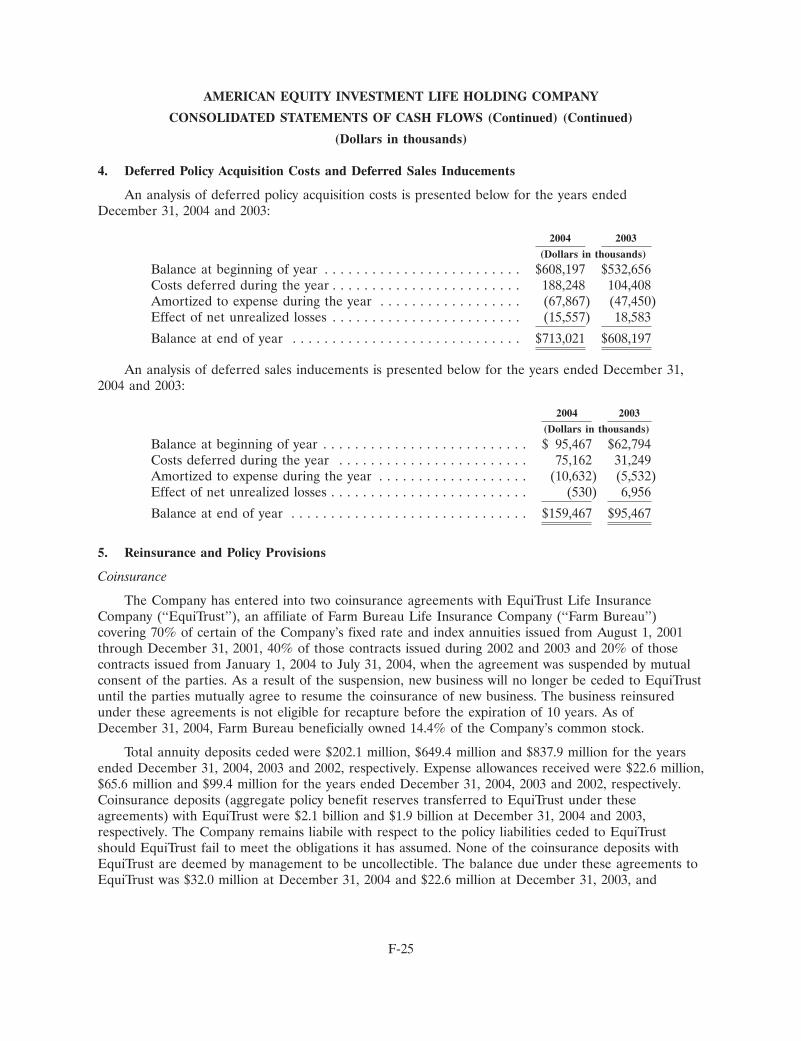
AMERICAN EQUITY INVESTMENT LIFE HOLDING COMPANY
CONSOLIDATED STATEMENTS OF CASH FLOWS (Continued) (Continued)
(Dollars in thousands)
4. Deferred Policy Acquisition Costs and Deferred Sales Inducements
An analysis of deferred policy acquisition costs is presented below for the years endedDecember 31, 2004 and 2003:
2004 2003
(Dollars in thousands)
Balance at beginning of year . . . . . . . . . . . . . . . . . . . . . . . . . $608,197 $532,656Costs deferred during the year . . . . . . . . . . . . . . . . . . . . . . . . 188,248 104,408Amortized to expense during the year . . . . . . . . . . . . . . . . . . (67,867) (47,450)Effect of net unrealized losses . . . . . . . . . . . . . . . . . . . . . . . . (15,557) 18,583
Balance at end of year . . . . . . . . . . . . . . . . . . . . . . . . . . . . . $713,021 $608,197
An analysis of deferred sales inducements is presented below for the years ended December 31,2004 and 2003:
2004 2003
(Dollars in thousands)
Balance at beginning of year . . . . . . . . . . . . . . . . . . . . . . . . . . $ 95,467 $62,794Costs deferred during the year . . . . . . . . . . . . . . . . . . . . . . . . 75,162 31,249Amortized to expense during the year . . . . . . . . . . . . . . . . . . . (10,632) (5,532)Effect of net unrealized losses . . . . . . . . . . . . . . . . . . . . . . . . . (530) 6,956
Balance at end of year . . . . . . . . . . . . . . . . . . . . . . . . . . . . . . $159,467 $95,467
5. Reinsurance and Policy Provisions
Coinsurance
The Company has entered into two coinsurance agreements with EquiTrust Life InsuranceCompany (‘‘EquiTrust’’), an affiliate of Farm Bureau Life Insurance Company (‘‘Farm Bureau’’)covering 70% of certain of the Company’s fixed rate and index annuities issued from August 1, 2001through December 31, 2001, 40% of those contracts issued during 2002 and 2003 and 20% of thosecontracts issued from January 1, 2004 to July 31, 2004, when the agreement was suspended by mutualconsent of the parties. As a result of the suspension, new business will no longer be ceded to EquiTrustuntil the parties mutually agree to resume the coinsurance of new business. The business reinsuredunder these agreements is not eligible for recapture before the expiration of 10 years. As ofDecember 31, 2004, Farm Bureau beneficially owned 14.4% of the Company’s common stock.
Total annuity deposits ceded were $202.1 million, $649.4 million and $837.9 million for the yearsended December 31, 2004, 2003 and 2002, respectively. Expense allowances received were $22.6 million,$65.6 million and $99.4 million for the years ended December 31, 2004, 2003 and 2002, respectively.Coinsurance deposits (aggregate policy benefit reserves transferred to EquiTrust under theseagreements) with EquiTrust were $2.1 billion and $1.9 billion at December 31, 2004 and 2003,respectively. The Company remains liabile with respect to the policy liabilities ceded to EquiTrustshould EquiTrust fail to meet the obligations it has assumed. None of the coinsurance deposits withEquiTrust are deemed by management to be uncollectible. The balance due under these agreements toEquiTrust was $32.0 million at December 31, 2004 and $22.6 million at December 31, 2003, and
F-25
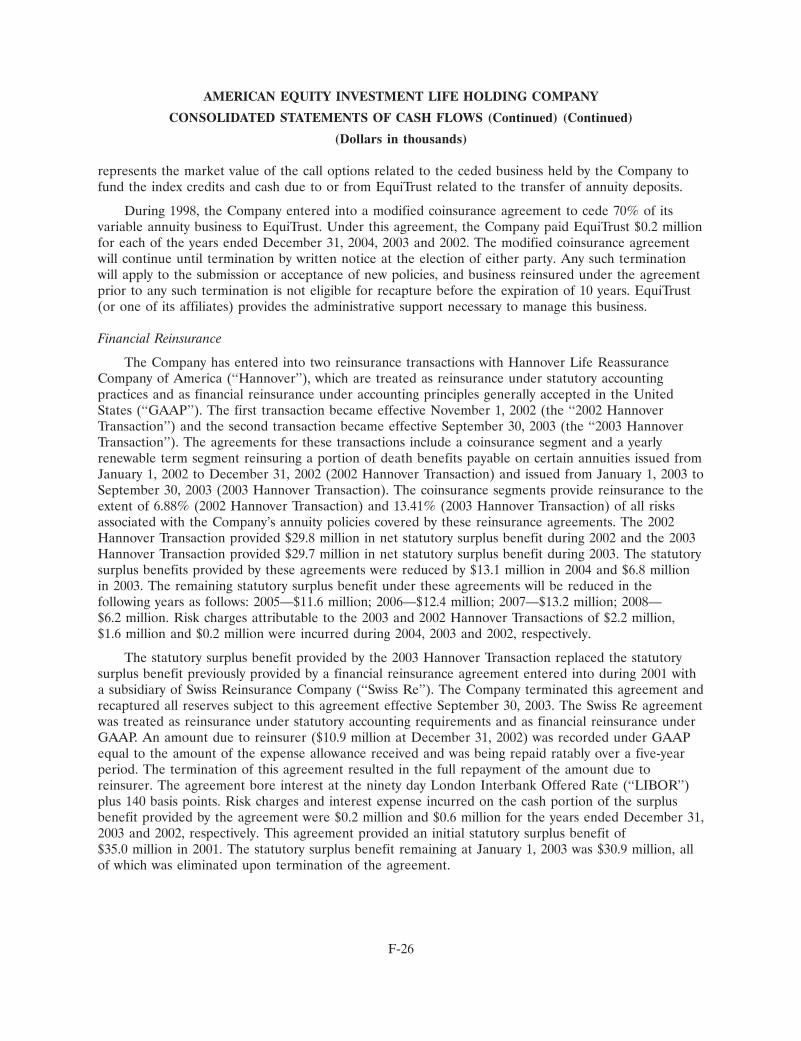
AMERICAN EQUITY INVESTMENT LIFE HOLDING COMPANY
CONSOLIDATED STATEMENTS OF CASH FLOWS (Continued) (Continued)
(Dollars in thousands)
represents the market value of the call options related to the ceded business held by the Company tofund the index credits and cash due to or from EquiTrust related to the transfer of annuity deposits.
During 1998, the Company entered into a modified coinsurance agreement to cede 70% of itsvariable annuity business to EquiTrust. Under this agreement, the Company paid EquiTrust $0.2 millionfor each of the years ended December 31, 2004, 2003 and 2002. The modified coinsurance agreementwill continue until termination by written notice at the election of either party. Any such terminationwill apply to the submission or acceptance of new policies, and business reinsured under the agreementprior to any such termination is not eligible for recapture before the expiration of 10 years. EquiTrust(or one of its affiliates) provides the administrative support necessary to manage this business.
Financial Reinsurance
The Company has entered into two reinsurance transactions with Hannover Life ReassuranceCompany of America (‘‘Hannover’’), which are treated as reinsurance under statutory accountingpractices and as financial reinsurance under accounting principles generally accepted in the UnitedStates (‘‘GAAP’’). The first transaction became effective November 1, 2002 (the ‘‘2002 HannoverTransaction’’) and the second transaction became effective September 30, 2003 (the ‘‘2003 HannoverTransaction’’). The agreements for these transactions include a coinsurance segment and a yearlyrenewable term segment reinsuring a portion of death benefits payable on certain annuities issued fromJanuary 1, 2002 to December 31, 2002 (2002 Hannover Transaction) and issued from January 1, 2003 toSeptember 30, 2003 (2003 Hannover Transaction). The coinsurance segments provide reinsurance to theextent of 6.88% (2002 Hannover Transaction) and 13.41% (2003 Hannover Transaction) of all risksassociated with the Company’s annuity policies covered by these reinsurance agreements. The 2002Hannover Transaction provided $29.8 million in net statutory surplus benefit during 2002 and the 2003Hannover Transaction provided $29.7 million in net statutory surplus benefit during 2003. The statutorysurplus benefits provided by these agreements were reduced by $13.1 million in 2004 and $6.8 millionin 2003. The remaining statutory surplus benefit under these agreements will be reduced in thefollowing years as follows: 2005—$11.6 million; 2006—$12.4 million; 2007—$13.2 million; 2008—$6.2 million. Risk charges attributable to the 2003 and 2002 Hannover Transactions of $2.2 million,$1.6 million and $0.2 million were incurred during 2004, 2003 and 2002, respectively.
The statutory surplus benefit provided by the 2003 Hannover Transaction replaced the statutorysurplus benefit previously provided by a financial reinsurance agreement entered into during 2001 witha subsidiary of Swiss Reinsurance Company (‘‘Swiss Re’’). The Company terminated this agreement andrecaptured all reserves subject to this agreement effective September 30, 2003. The Swiss Re agreementwas treated as reinsurance under statutory accounting requirements and as financial reinsurance underGAAP. An amount due to reinsurer ($10.9 million at December 31, 2002) was recorded under GAAPequal to the amount of the expense allowance received and was being repaid ratably over a five-yearperiod. The termination of this agreement resulted in the full repayment of the amount due toreinsurer. The agreement bore interest at the ninety day London Interbank Offered Rate (‘‘LIBOR’’)plus 140 basis points. Risk charges and interest expense incurred on the cash portion of the surplusbenefit provided by the agreement were $0.2 million and $0.6 million for the years ended December 31,2003 and 2002, respectively. This agreement provided an initial statutory surplus benefit of$35.0 million in 2001. The statutory surplus benefit remaining at January 1, 2003 was $30.9 million, allof which was eliminated upon termination of the agreement.
F-26
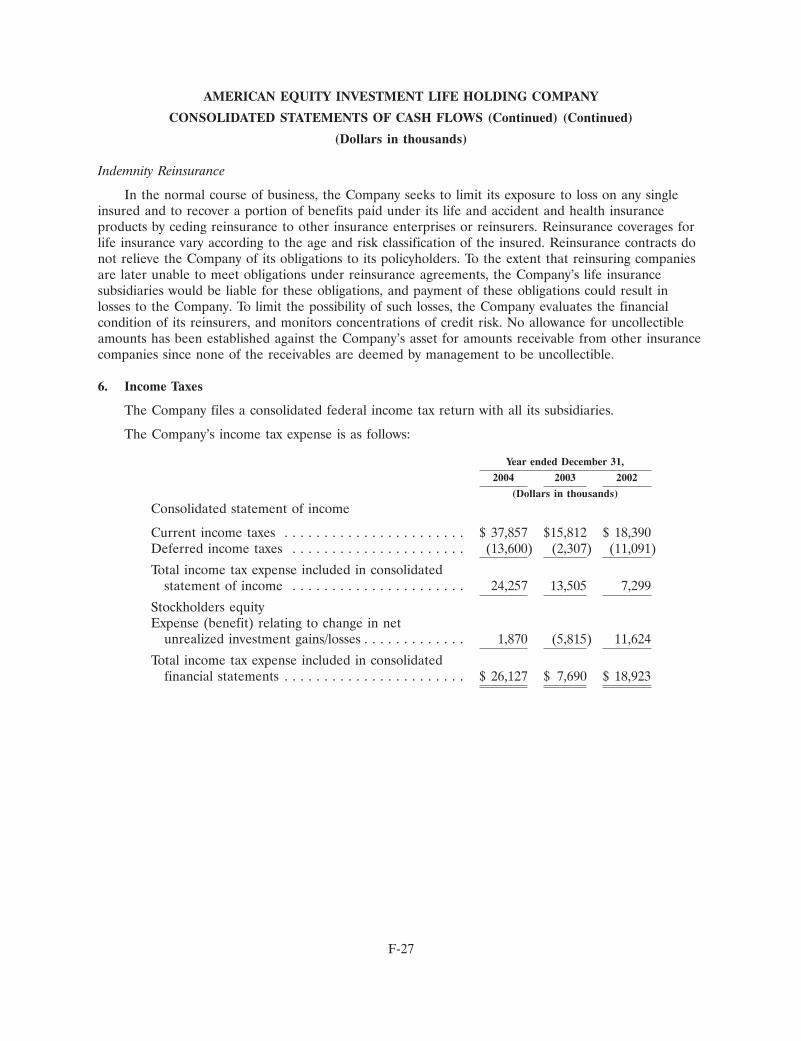
AMERICAN EQUITY INVESTMENT LIFE HOLDING COMPANY
CONSOLIDATED STATEMENTS OF CASH FLOWS (Continued) (Continued)
(Dollars in thousands)
Indemnity Reinsurance
In the normal course of business, the Company seeks to limit its exposure to loss on any singleinsured and to recover a portion of benefits paid under its life and accident and health insuranceproducts by ceding reinsurance to other insurance enterprises or reinsurers. Reinsurance coverages forlife insurance vary according to the age and risk classification of the insured. Reinsurance contracts donot relieve the Company of its obligations to its policyholders. To the extent that reinsuring companiesare later unable to meet obligations under reinsurance agreements, the Company’s life insurancesubsidiaries would be liable for these obligations, and payment of these obligations could result inlosses to the Company. To limit the possibility of such losses, the Company evaluates the financialcondition of its reinsurers, and monitors concentrations of credit risk. No allowance for uncollectibleamounts has been established against the Company’s asset for amounts receivable from other insurancecompanies since none of the receivables are deemed by management to be uncollectible.
6. Income Taxes
The Company files a consolidated federal income tax return with all its subsidiaries.
The Company’s income tax expense is as follows:
Year ended December 31,
2004 2003 2002
(Dollars in thousands)
Consolidated statement of income
Current income taxes . . . . . . . . . . . . . . . . . . . . . . . $ 37,857 $15,812 $ 18,390Deferred income taxes . . . . . . . . . . . . . . . . . . . . . . (13,600) (2,307) (11,091)
Total income tax expense included in consolidatedstatement of income . . . . . . . . . . . . . . . . . . . . . . 24,257 13,505 7,299
Stockholders equityExpense (benefit) relating to change in net
unrealized investment gains/losses . . . . . . . . . . . . . 1,870 (5,815) 11,624
Total income tax expense included in consolidatedfinancial statements . . . . . . . . . . . . . . . . . . . . . . . $ 26,127 $ 7,690 $ 18,923
F-27
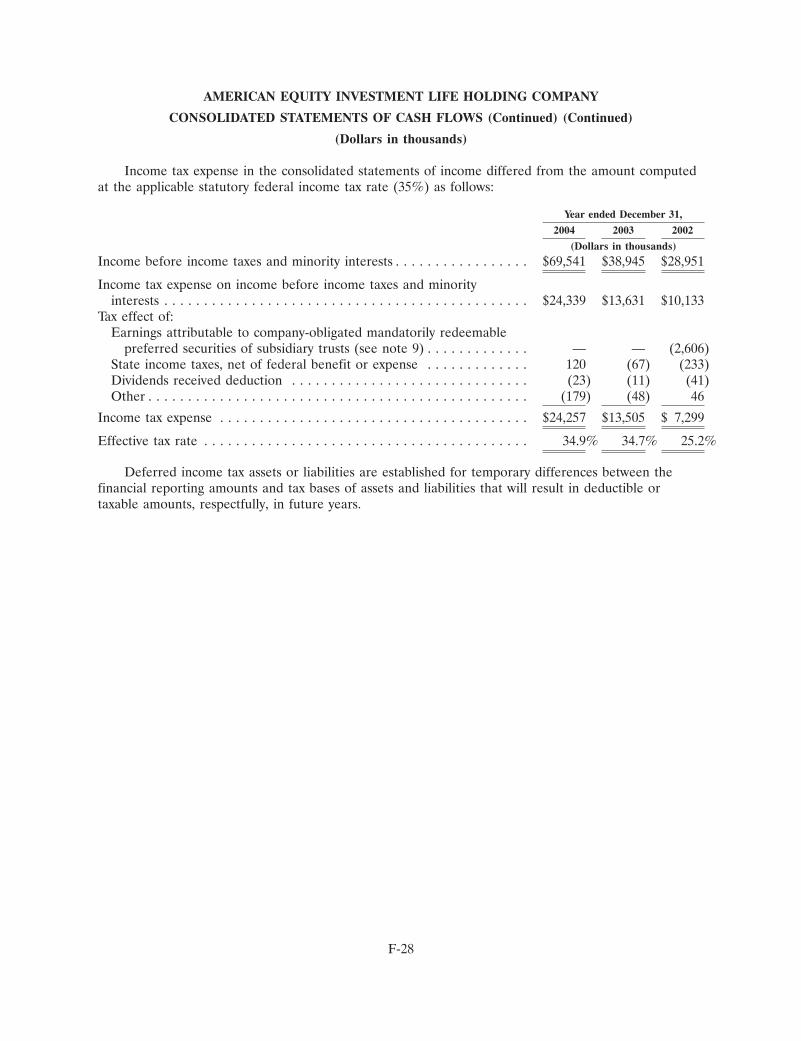
AMERICAN EQUITY INVESTMENT LIFE HOLDING COMPANY
CONSOLIDATED STATEMENTS OF CASH FLOWS (Continued) (Continued)
(Dollars in thousands)
Income tax expense in the consolidated statements of income differed from the amount computedat the applicable statutory federal income tax rate (35%) as follows:
Year ended December 31,
2004 2003 2002
(Dollars in thousands)
Income before income taxes and minority interests . . . . . . . . . . . . . . . . . $69,541 $38,945 $28,951
Income tax expense on income before income taxes and minorityinterests . . . . . . . . . . . . . . . . . . . . . . . . . . . . . . . . . . . . . . . . . . . . . . $24,339 $13,631 $10,133
Tax effect of:Earnings attributable to company-obligated mandatorily redeemable
preferred securities of subsidiary trusts (see note 9) . . . . . . . . . . . . . — — (2,606)State income taxes, net of federal benefit or expense . . . . . . . . . . . . . 120 (67) (233)Dividends received deduction . . . . . . . . . . . . . . . . . . . . . . . . . . . . . . (23) (11) (41)Other . . . . . . . . . . . . . . . . . . . . . . . . . . . . . . . . . . . . . . . . . . . . . . . . (179) (48) 46
Income tax expense . . . . . . . . . . . . . . . . . . . . . . . . . . . . . . . . . . . . . . . $24,257 $13,505 $ 7,299
Effective tax rate . . . . . . . . . . . . . . . . . . . . . . . . . . . . . . . . . . . . . . . . . 34.9% 34.7% 25.2%
Deferred income tax assets or liabilities are established for temporary differences between thefinancial reporting amounts and tax bases of assets and liabilities that will result in deductible ortaxable amounts, respectfully, in future years.
F-28
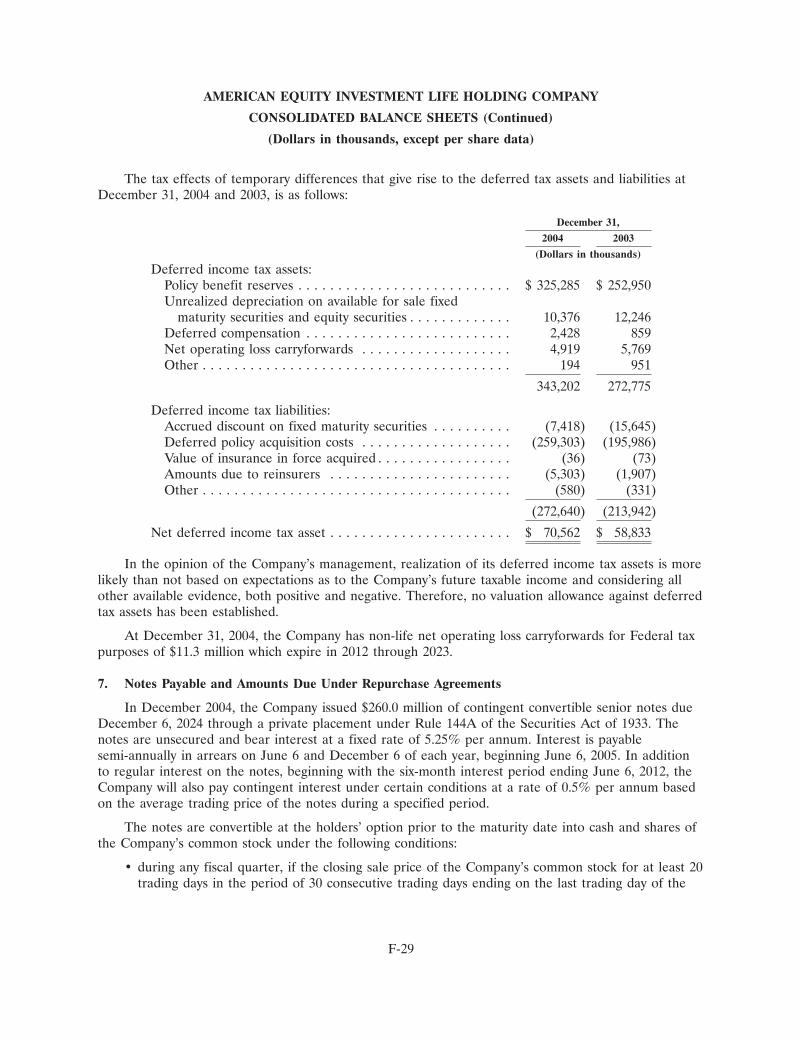
AMERICAN EQUITY INVESTMENT LIFE HOLDING COMPANY
CONSOLIDATED BALANCE SHEETS (Continued)
(Dollars in thousands, except per share data)
The tax effects of temporary differences that give rise to the deferred tax assets and liabilities atDecember 31, 2004 and 2003, is as follows:
December 31,
2004 2003
(Dollars in thousands)
Deferred income tax assets:Policy benefit reserves . . . . . . . . . . . . . . . . . . . . . . . . . . . $ 325,285 $ 252,950Unrealized depreciation on available for sale fixed
maturity securities and equity securities . . . . . . . . . . . . . 10,376 12,246Deferred compensation . . . . . . . . . . . . . . . . . . . . . . . . . . 2,428 859Net operating loss carryforwards . . . . . . . . . . . . . . . . . . . 4,919 5,769Other . . . . . . . . . . . . . . . . . . . . . . . . . . . . . . . . . . . . . . . 194 951
343,202 272,775
Deferred income tax liabilities:Accrued discount on fixed maturity securities . . . . . . . . . . (7,418) (15,645)Deferred policy acquisition costs . . . . . . . . . . . . . . . . . . . (259,303) (195,986)Value of insurance in force acquired . . . . . . . . . . . . . . . . . (36) (73)Amounts due to reinsurers . . . . . . . . . . . . . . . . . . . . . . . (5,303) (1,907)Other . . . . . . . . . . . . . . . . . . . . . . . . . . . . . . . . . . . . . . . (580) (331)
(272,640) (213,942)
Net deferred income tax asset . . . . . . . . . . . . . . . . . . . . . . . $ 70,562 $ 58,833
In the opinion of the Company’s management, realization of its deferred income tax assets is morelikely than not based on expectations as to the Company’s future taxable income and considering allother available evidence, both positive and negative. Therefore, no valuation allowance against deferredtax assets has been established.
At December 31, 2004, the Company has non-life net operating loss carryforwards for Federal taxpurposes of $11.3 million which expire in 2012 through 2023.
7. Notes Payable and Amounts Due Under Repurchase Agreements
In December 2004, the Company issued $260.0 million of contingent convertible senior notes dueDecember 6, 2024 through a private placement under Rule 144A of the Securities Act of 1933. Thenotes are unsecured and bear interest at a fixed rate of 5.25% per annum. Interest is payablesemi-annually in arrears on June 6 and December 6 of each year, beginning June 6, 2005. In additionto regular interest on the notes, beginning with the six-month interest period ending June 6, 2012, theCompany will also pay contingent interest under certain conditions at a rate of 0.5% per annum basedon the average trading price of the notes during a specified period.
The notes are convertible at the holders’ option prior to the maturity date into cash and shares ofthe Company’s common stock under the following conditions:
• during any fiscal quarter, if the closing sale price of the Company’s common stock for at least 20trading days in the period of 30 consecutive trading days ending on the last trading day of the
F-29
AMERICAN EQUITY INVESTMENT LIFE HOLDING COMPANY
CONSOLIDATED BALANCE SHEETS (Continued)
(Dollars in thousands, except per share data)
fiscal quarter preceding the quarter in which the conversion occurs is more than 120% of theconversion price of the notes in effect on that 30th trading day;
• the Company has called the notes for redemption and the redemption has not yet occurred; or
• upon the occurrence of specified corporate transactions.
Holders may convert any outstanding notes into cash and shares of the Company’s common stockat an initial conversion price per share of $14.47. This represents a conversion rate of approximately69.1085 shares of common stock per $1,000 in principal amount of notes (the ‘‘Conversion Rate’’).Subject to certain exceptions described in the indenture covering these notes, at the time the notes aretendered for conversion, the value (the ‘‘Conversion Value’’) of the cash and shares of the Company’scommon stock, if any, to be received by a holder converting $1,000 principal amount of the notes willbe determined by multiplying the Conversion Rate by the ‘‘Ten Day Average Closing Stock Price’’,which equals the average of the closing per share prices of the Company’s common stock on the NewYork Stock Exchange on the ten consecutive trading days beginning on the second trading dayfollowing the day the notes are submitted for conversion. The Company will deliver the ConversionValue to holders as follows: (1) an amount in cash (the ‘‘Principal Return’’) equal to the lesser of(a) the aggregate Conversion Value of the notes to be converted and (b) the aggregate principalamount of the notes to be converted, and (2) if the aggregate Conversion Value of the notes to beconverted is greater than the Principal Return, an amount in shares (the ‘‘Net Shares’’) equal to suchaggregate Conversion Value less the Principal Return (the ‘‘Net Share Amount’’) and (3) an amount incash in lieu of fractional shares of common stock. The number of Net Shares to be paid will bedetermined by dividing the Net Share Amount by the Ten Day Average Closing Stock Price.
The Company may redeem some or all of the notes at any time on or after December 15, 2011. Inaddition, the holders may require the Company to repurchase all or a portion of their notes onDecember 15, 2011, 2014, and 2019 and upon a change in control, as defined in the indenturegoverning the notes, holders may require the Company to repurchase all or a portion of their notes fora period of time after the change in control. The redemption price or repurchase price shall be payablein cash and equal to 100% of the principal amount of the notes plus accrued and unpaid interest(contingent interest and liquidated damages, if any) up to but not including the date of redemption orrepurchase.
The notes are senior unsecured obligations and rank equally in right of payment with all existingand future senior indebtedness and senior to any existing and future subordinated indebtedness. Thenotes effectively rank junior in right of payment to any existing and future secured indebtedness to theextent of the value of the assets securing such secured indebtedness. The notes are structurallysubordinated to all liabilities of the Company’s subsidiaries.
Pursuant to EITF Issue No. 04-8, ‘‘The Effect of Contingently Convertible Debt on DilutedEarnings Per Share’’, the Company will be required to include the dilutive effect of the contingentconvertible senior notes in its diluted earnings per share calculation, regardless of whether the marketprice trigger has been met. Because the notes include a mandatory cash settlement feature for theprincipal amount, incremental dilutive shares will only exist when the average fair value of theCompany’s common stock for a reporting period exceeds the initial conversion price per share of$14.47.
The Company has agreed to file a registration statement pursuant to which it will register theresale of the notes and the shares issuable upon conversion of the notes. If such registration statement
F-30
AMERICAN EQUITY INVESTMENT LIFE HOLDING COMPANY
CONSOLIDATED BALANCE SHEETS (Continued)
(Dollars in thousands, except per share data)
is not filed or declared effective within certain time periods specified in a registration rights agreementbetween the Company and the initial purchasers of the notes, the Company will be required to payliquidated damages to the holders of the notes.
On September 22, 2004, the Company entered into a $50 million revolving line of credit agreementwith three banks. The revolving period of the facility will be three years followed by a two-year termout option. The applicable interest rate will be floating at LIBOR plus 1.75% or prime rate, as electedby the Company. There is no amount outstanding under the revolving line of credit at December 31,2004. Under this agreement, without obtaining a waiver from the lenders, the Company is required tomaintain a minimum risk-based capital ratio at American Equity Investment Life Insurance Company, amaximum ratio of senior debt to total capital, and is prohibited from paying dividends on its capitalstock in excess of 33% of consolidated net income for the prior year.
At December 31, 2003, the Company had $31.8 million outstanding under a credit agreement withprincipal and interest payments paid quarterly. The notes bore interest at (3.57% at December 31,2003) prime or LIBOR plus a specified margin of up to 2.25%. The Company repaid all outstandingamounts under this agreement during 2004.
As part of its investment strategy, the Company enters into securities repurchase agreements(short-term collateralized borrowings). These borrowings are collateralized by investment securities withfair market values approximately equal to the amount due. Such borrowings averaged $196.3 million,$84.6 million, $46.0 million for the years ended December 31, 2004, 2003 and 2002, respectively. Theweighted average interest rate on amounts due under repurchase agreements was 1.60%, 1.35% and1.59% for the years ended December 31, 2004, 2003 and 2002, respectively.
8. General Agency Commission and Servicing Agreement
The Company has a General Agency Commission and Servicing Agreement (‘‘ServicingAgreement’’) with American Equity Investment Service Company (the Service Company), wholly-ownedby David J. Noble, Chairman, Chief Executive Officer and President of the Company, whereby theService Company acts as a national supervisory agent with responsibility for paying commissions toagents of the Company. Under the terms of the Servicing Agreement, as amended, the ServiceCompany has paid a portion (ranging from 13.5% to 100%) of the agents’ commissions for certainannuity policies issued during 1997-1999 and 2002-2004. In return, the Company has paid and agreed topay quarterly renewal commissions to the Service Company ranging from .0975% to .375% based uponthe account values of the applicable annuity policies issued during those years. No renewal commissionis paid unless the underlying policy is in force on the date renewal commissions are calculated pursuantto the terms of the Servicing Agreement.
The Company records a liability to the Service Company for the amounts paid by the ServiceCompany to the Company’s agents and capitalizes such amounts as deferred policy acquisition costs.For all years except 2004, renewal commissions are capped and interest expense computed at a 9%imputed interest rate. The liability to the Service Company for policies issued during 2004 was createdon December 31, 2004 and quarterly renewal commissions are payable for five years. The effectiveinterest rate based upon the estimated future renewal commissions for these policies as ofDecember 31, 2004 is 14.8%. Actual renewal commission payments may vary from expected based uponthe persistency and account value growth of the covered policies.
F-31
AMERICAN EQUITY INVESTMENT LIFE HOLDING COMPANY
CONSOLIDATED BALANCE SHEETS (Continued)
(Dollars in thousands, except per share data)
During the years ended December 31, 2004, 2003 and 2002, the Service Company paid$20.0 million, $14.4 million and $11.8 million, respectively, to agents of the Company and the Companypaid renewal commissions to the Service Company of $28.1 million, $22.1 million and $21.7 million,respectively. Estimated future payments under the Servicing Agreement at December 31, 2004 are asfollows (Dollars in thousands):
Year ending December 31:2005 . . . . . . . . . . . . . . . . . . . . . . . . . . . . . . . . . . . . . . . . . . . . . . . . . . $22,7322006 . . . . . . . . . . . . . . . . . . . . . . . . . . . . . . . . . . . . . . . . . . . . . . . . . . 5,8912007 . . . . . . . . . . . . . . . . . . . . . . . . . . . . . . . . . . . . . . . . . . . . . . . . . . 5,6592008 . . . . . . . . . . . . . . . . . . . . . . . . . . . . . . . . . . . . . . . . . . . . . . . . . . 5,4362009 . . . . . . . . . . . . . . . . . . . . . . . . . . . . . . . . . . . . . . . . . . . . . . . . . . 5,221
44,939Amounts representing interest . . . . . . . . . . . . . . . . . . . . . . . . . . . . . . . . . (9,127)
Net amount . . . . . . . . . . . . . . . . . . . . . . . . . . . . . . . . . . . . . . . . . . . . . . $35,812
As a source of funding its portion of producing agents’ commission payments, the ServiceCompany borrowed funds from Mr. Noble and a third party. The amount payable to Mr. Noble by theService Company at December 31, 2004 and 2003 was $3.0 million and $14.3 million, respectively. Asan alternate source of funds for such first year commissions, the Service Company borrowed funds fromthe Company. Notes receivable from the Service Company under this arrangement are summarized asfollows (Dollars in thousands):
December 31,
2004 2003
Interest at 8.75% . . . . . . . . . . . . . . . . . . . . . . . . . . . . . . . . . . . $ — $ 3,619Interest at 9.00% . . . . . . . . . . . . . . . . . . . . . . . . . . . . . . . . . . . 419 2,003Interest at 9.50% . . . . . . . . . . . . . . . . . . . . . . . . . . . . . . . . . . . 3,444 7,799Interest at Prime . . . . . . . . . . . . . . . . . . . . . . . . . . . . . . . . . . . 12,325 14,500
$16,188 $27,921
Principal and interest on all loans to the Service Company are payable quarterly over five yearsfrom the date of the advance. The Service Company repays the above described indebtedness from therenewal commissions paid to it under the General Agency Commission and Servicing Agreement.
9. Subordinated Debentures
The Company’s wholly-owned subsidiary trusts (not consolidated under FIN 46) have issued fixedrate and floating rate trust preferred securities and have used the proceeds from these offerings topurchase subordinated debentures from the Company. The Company also issued subordinateddebentures to the trusts in exchange for all of the common securities of each trust. The sole assets ofthe trusts are the subordinated debentures and any interest accrued thereon. The interest paymentdates on the subordinated debentures correspond to the distribution dates on the trust preferredsecurities issued by the trusts. The trust preferred securities mature simultaneously with thesubordinated debentures. The Company’s obligations under the subordinated debentures and relatedagreements provide a full and unconditional guarantee of payments due under the trust preferred
F-32
AMERICAN EQUITY INVESTMENT LIFE HOLDING COMPANY
CONSOLIDATED BALANCE SHEETS (Continued)
(Dollars in thousands, except per share data)
securities. Following is a summary of subordinated debt obligations to the trusts at December 31, 2004and 2003:
December 31, Interest2004 2003 Rate Due Date
(Dollars in thousands)
American Equity Capital Trust I . . . . . $ 24,073 $ 26,713 8% September 30, 2029American Equity Capital Trust II . . . . 77,861 77,340 5% June 1, 2047American Equity Capital Trust III . . . . 27,840 — Floating April 29, 2034American Equity Capital Trust IV . . . . 12,372 12,372 Floating January 8, 2034American Equity Capital Trust VII . . . 10,830 — Floating September 14, 2034American Equity Capital Trust VIII . . 20,600 — Floating December 22, 2034
$173,576 $116,425
The interest rate for the floating rate subordinated debentures are based upon the three monthLondon Interbank Offered rate plus 4.00% for Trust III and IV and 3.75% for Trust VII and VIII.
American Equity Capital Trust I issued 865,671 shares of trust preferred securities, of which 2,000shares are held by one of the Company’s subsidiaries. During 2004, 88,000 shares of these trustpreferred securities converted into 325,923 shares of the Company’s common stock. The remaining777,761 shares of these trust preferred securities are convertible into 2,872,794 shares of the Company’scommon stock.
The principal amount of the subordinated debentures issued by the Company to American EquityCapital Trust II (‘‘Trust II’’) is $100.0 million. These debentures were assigned a fair value of$74.7 million at the date of issue (based upon an effective yield-to-maturity of 7%). The differencebetween the fair value at the date of issue and the principal amount is being accreted over the life ofthe debentures. The trust preferred securities issued by Trust II were issued to Iowa Farm BureauFederation, which owns more than 50% of the voting capital stock of FBL Financial Group, Inc.(‘‘FBL’’), parent company of Farm Bureau. The consideration received by Trust II in connection withthe issuance of its trust preferred securities consisted of fixed income securities of equal value whichwere issued by FBL.
10. Retirement and Stock Compensation Plans
The Company has adopted a contributory defined contribution plan which is qualified underSection 401(k) of the Internal Revenue Code. The plan covers substantially all full-time employees ofthe Company, subject to minimum eligibility requirements. Employees can contribute up to 15% oftheir annual salary (with a maximum contribution of $13,000 in 2004, $12,000 in 2003 and $11,000 in2002) to the plan. The Company contributes an additional amount, subject to limitations, based on thevoluntary contribution of the employee. Further, the plan provides for additional employercontributions based on the discretion of the Board of Directors. Plan contributions charged to expensewere $0.2 million for the year ended December 31, 2004 and $0.1 million for each of the years endedDecember 31, 2003 and 2002.
The Company has entered into deferred compensation arrangements with certain officers,directors, and consultants, whereby these individuals agreed to take common stock of the Company at afuture date in lieu of cash payments at the time of service. The common stock is to be issued in
F-33
AMERICAN EQUITY INVESTMENT LIFE HOLDING COMPANY
CONSOLIDATED BALANCE SHEETS (Continued)
(Dollars in thousands, except per share data)
conjunction with a ‘‘trigger event’’, as that term is defined in the individual agreements. AtDecember 31, 2004 and 2003, these individuals have earned, and the Company has reserved for futureissuance, 377,853 and 345,829 shares of common stock, respectively, pursuant to these arrangements.The Company has accrued liabilities of $1.9 million and $1.5 million at December 31, 2004 and 2003,respectively, representing the value associated with the shares earned.
During 1997, the Company established the American Equity Investment NMO DeferredCompensation Plan (‘‘NMO Deferred Compensation Plan’’) whereby agents can earn common stock inaddition to their normal commissions. Awards are calculated using formulas determined annually by theCompany’s Board of Directors and are generally based upon new annuity deposits. For the years endedDecember 31, 2004, 2003 and 2002, agents earned the right to receive 414,117 shares, 325,370 shares,and 692,439 shares, respectively. These shares will be distributed at the end of the vesting and deferralperiod of 9 years. A portion of the awards may be subject to forfeiture if certain production levels arenot met over the remaining vesting period. The Company recognizes commission expense as the awardsvest. For the years ended December 31, 2004, 2003 and 2002, agents vested in 449,869 shares, 405,796shares and 476,918 shares of common stock, respectively, and the Company recorded commissionexpense (which was subsequently capitalized as deferred policy acquisition costs) of $4.9 million,$2.6 million and $2.6 million, respectively, under these plans. Amounts accrued are reported as otherliabilities until the shares have been issued. At December 31, 2004, the Company has reserved2,411,445 shares for future issuance under the plans.
During 2003, the Company created a Rabbi Trust, the NMO Deferred Compensation Trust (the‘‘Trust’’) and issued 1,591,083 shares of its common stock to the Trust to fund the vested share liabilityestablished under the NMO Deferred Compensation Plan. In accordance with FASB’s Emerging IssuesTask Force Issue No. 97-14, ‘‘Accounting for Deferred Compensation Arrangements where AmountsEarned are Held in a Rabbi Trust and Invested’’, the stock held in the Trust is included as part ofcommon stock issued and outstanding. In the December 31, 2004 consolidated balance sheet, thecommon shares held in the Rabbi Trust and the related Trust obligation funded by such shares areincluded in the common stock and additional paid-in-capital components as a respective deduction andaddition, with no impact on the reported amount of total stockholders’ equity, as the Plan does notpermit diversification and must be settled by the delivery of a fixed number of shares of the Company’sstock.
Prior to the Company’s initial public offering, the Company performed an internal valuation whichinvolved estimates by management to determine a market value as there was no publicly quoted marketvalue for the Company’s stock. Those estimates were based upon various factors including past stocktransactions with third parties, growth in the Company’s revenues, comparison of the Company’sgrowth pattern to other companies and annual valuations completed by investment bankers familiarwith the operations of the Company. The results of the internal valuation affected the amount ofcommission expense recognized (which was capitalized as deferred policy acquisition costs) inconnection with the NMO Deferred Compensation Plan as described in the preceding paragraph. Theresults of the internal valuation of the Company’s stock also affected the calculation of earnings percommon share—assuming dilution by affecting the number of dilutive securities used in the calculation(see Note 13).
The Company has a Stock Option and Warrant Agreement with Mr. Noble (owner of 4% of itsoutstanding common stock at December 31, 2004) which allows the purchase of 1,200,000 shares of theCompany’s common stock. Included in this amount are warrants to purchase 240,000 shares of common
F-34
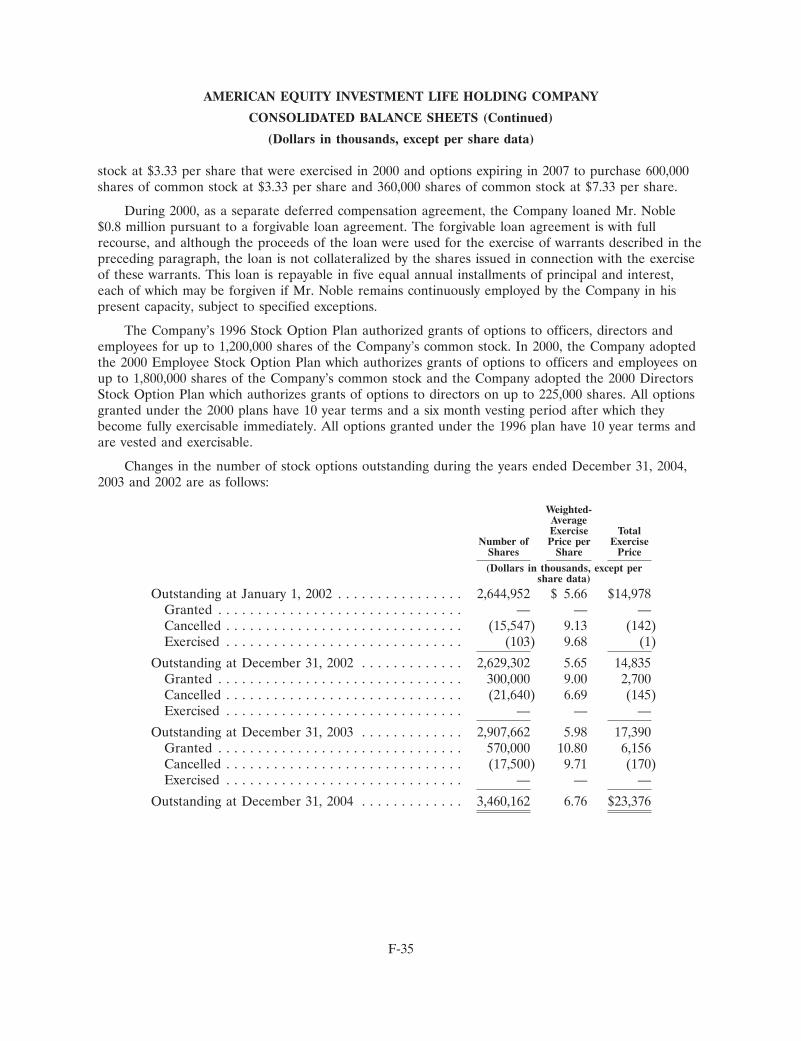
AMERICAN EQUITY INVESTMENT LIFE HOLDING COMPANY
CONSOLIDATED BALANCE SHEETS (Continued)
(Dollars in thousands, except per share data)
stock at $3.33 per share that were exercised in 2000 and options expiring in 2007 to purchase 600,000shares of common stock at $3.33 per share and 360,000 shares of common stock at $7.33 per share.
During 2000, as a separate deferred compensation agreement, the Company loaned Mr. Noble$0.8 million pursuant to a forgivable loan agreement. The forgivable loan agreement is with fullrecourse, and although the proceeds of the loan were used for the exercise of warrants described in thepreceding paragraph, the loan is not collateralized by the shares issued in connection with the exerciseof these warrants. This loan is repayable in five equal annual installments of principal and interest,each of which may be forgiven if Mr. Noble remains continuously employed by the Company in hispresent capacity, subject to specified exceptions.
The Company’s 1996 Stock Option Plan authorized grants of options to officers, directors andemployees for up to 1,200,000 shares of the Company’s common stock. In 2000, the Company adoptedthe 2000 Employee Stock Option Plan which authorizes grants of options to officers and employees onup to 1,800,000 shares of the Company’s common stock and the Company adopted the 2000 DirectorsStock Option Plan which authorizes grants of options to directors on up to 225,000 shares. All optionsgranted under the 2000 plans have 10 year terms and a six month vesting period after which theybecome fully exercisable immediately. All options granted under the 1996 plan have 10 year terms andare vested and exercisable.
Changes in the number of stock options outstanding during the years ended December 31, 2004,2003 and 2002 are as follows:
Weighted-AverageExercise Total
Number of Price per ExerciseShares Share Price
(Dollars in thousands, except pershare data)
Outstanding at January 1, 2002 . . . . . . . . . . . . . . . . 2,644,952 $ 5.66 $14,978Granted . . . . . . . . . . . . . . . . . . . . . . . . . . . . . . . — — —Cancelled . . . . . . . . . . . . . . . . . . . . . . . . . . . . . . (15,547) 9.13 (142)Exercised . . . . . . . . . . . . . . . . . . . . . . . . . . . . . . (103) 9.68 (1)
Outstanding at December 31, 2002 . . . . . . . . . . . . . 2,629,302 5.65 14,835Granted . . . . . . . . . . . . . . . . . . . . . . . . . . . . . . . 300,000 9.00 2,700Cancelled . . . . . . . . . . . . . . . . . . . . . . . . . . . . . . (21,640) 6.69 (145)Exercised . . . . . . . . . . . . . . . . . . . . . . . . . . . . . . — — —
Outstanding at December 31, 2003 . . . . . . . . . . . . . 2,907,662 5.98 17,390Granted . . . . . . . . . . . . . . . . . . . . . . . . . . . . . . . 570,000 10.80 6,156Cancelled . . . . . . . . . . . . . . . . . . . . . . . . . . . . . . (17,500) 9.71 (170)Exercised . . . . . . . . . . . . . . . . . . . . . . . . . . . . . . — — —
Outstanding at December 31, 2004 . . . . . . . . . . . . . 3,460,162 6.76 $23,376
F-35
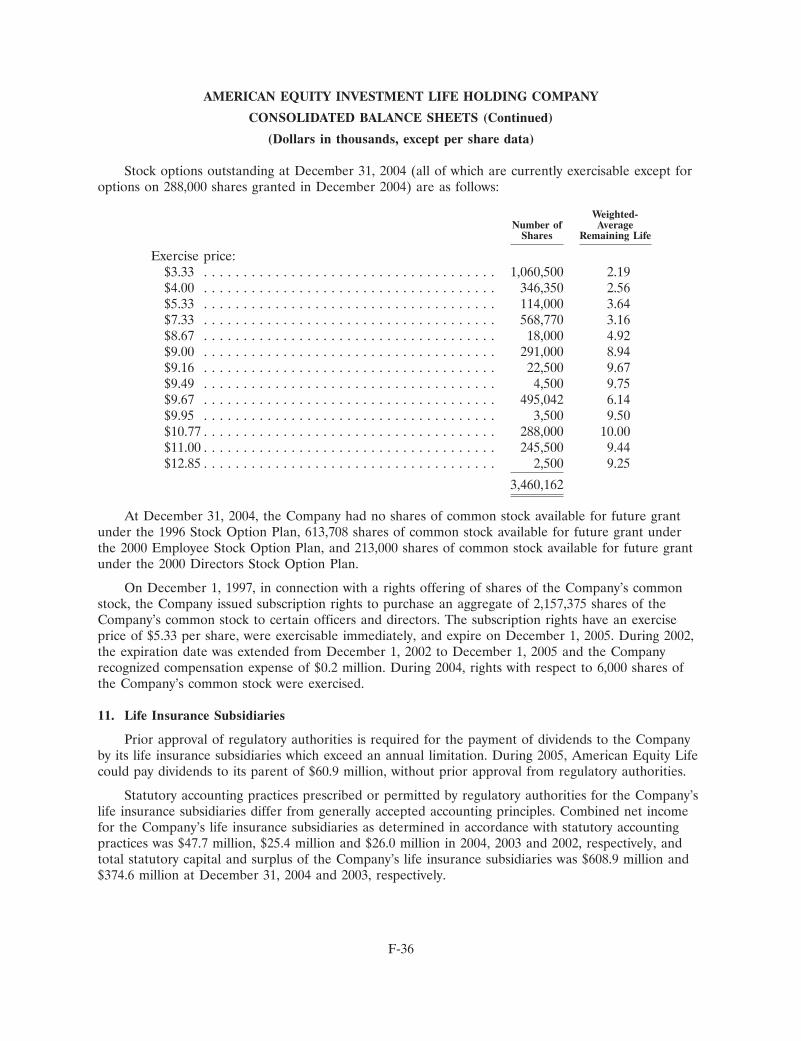
AMERICAN EQUITY INVESTMENT LIFE HOLDING COMPANY
CONSOLIDATED BALANCE SHEETS (Continued)
(Dollars in thousands, except per share data)
Stock options outstanding at December 31, 2004 (all of which are currently exercisable except foroptions on 288,000 shares granted in December 2004) are as follows:
Weighted-Number of Average
Shares Remaining Life
Exercise price:$3.33 . . . . . . . . . . . . . . . . . . . . . . . . . . . . . . . . . . . . . 1,060,500 2.19$4.00 . . . . . . . . . . . . . . . . . . . . . . . . . . . . . . . . . . . . . 346,350 2.56$5.33 . . . . . . . . . . . . . . . . . . . . . . . . . . . . . . . . . . . . . 114,000 3.64$7.33 . . . . . . . . . . . . . . . . . . . . . . . . . . . . . . . . . . . . . 568,770 3.16$8.67 . . . . . . . . . . . . . . . . . . . . . . . . . . . . . . . . . . . . . 18,000 4.92$9.00 . . . . . . . . . . . . . . . . . . . . . . . . . . . . . . . . . . . . . 291,000 8.94$9.16 . . . . . . . . . . . . . . . . . . . . . . . . . . . . . . . . . . . . . 22,500 9.67$9.49 . . . . . . . . . . . . . . . . . . . . . . . . . . . . . . . . . . . . . 4,500 9.75$9.67 . . . . . . . . . . . . . . . . . . . . . . . . . . . . . . . . . . . . . 495,042 6.14$9.95 . . . . . . . . . . . . . . . . . . . . . . . . . . . . . . . . . . . . . 3,500 9.50$10.77 . . . . . . . . . . . . . . . . . . . . . . . . . . . . . . . . . . . . . 288,000 10.00$11.00 . . . . . . . . . . . . . . . . . . . . . . . . . . . . . . . . . . . . . 245,500 9.44$12.85 . . . . . . . . . . . . . . . . . . . . . . . . . . . . . . . . . . . . . 2,500 9.25
3,460,162
At December 31, 2004, the Company had no shares of common stock available for future grantunder the 1996 Stock Option Plan, 613,708 shares of common stock available for future grant underthe 2000 Employee Stock Option Plan, and 213,000 shares of common stock available for future grantunder the 2000 Directors Stock Option Plan.
On December 1, 1997, in connection with a rights offering of shares of the Company’s commonstock, the Company issued subscription rights to purchase an aggregate of 2,157,375 shares of theCompany’s common stock to certain officers and directors. The subscription rights have an exerciseprice of $5.33 per share, were exercisable immediately, and expire on December 1, 2005. During 2002,the expiration date was extended from December 1, 2002 to December 1, 2005 and the Companyrecognized compensation expense of $0.2 million. During 2004, rights with respect to 6,000 shares ofthe Company’s common stock were exercised.
11. Life Insurance Subsidiaries
Prior approval of regulatory authorities is required for the payment of dividends to the Companyby its life insurance subsidiaries which exceed an annual limitation. During 2005, American Equity Lifecould pay dividends to its parent of $60.9 million, without prior approval from regulatory authorities.
Statutory accounting practices prescribed or permitted by regulatory authorities for the Company’slife insurance subsidiaries differ from generally accepted accounting principles. Combined net incomefor the Company’s life insurance subsidiaries as determined in accordance with statutory accountingpractices was $47.7 million, $25.4 million and $26.0 million in 2004, 2003 and 2002, respectively, andtotal statutory capital and surplus of the Company’s life insurance subsidiaries was $608.9 million and$374.6 million at December 31, 2004 and 2003, respectively.
F-36
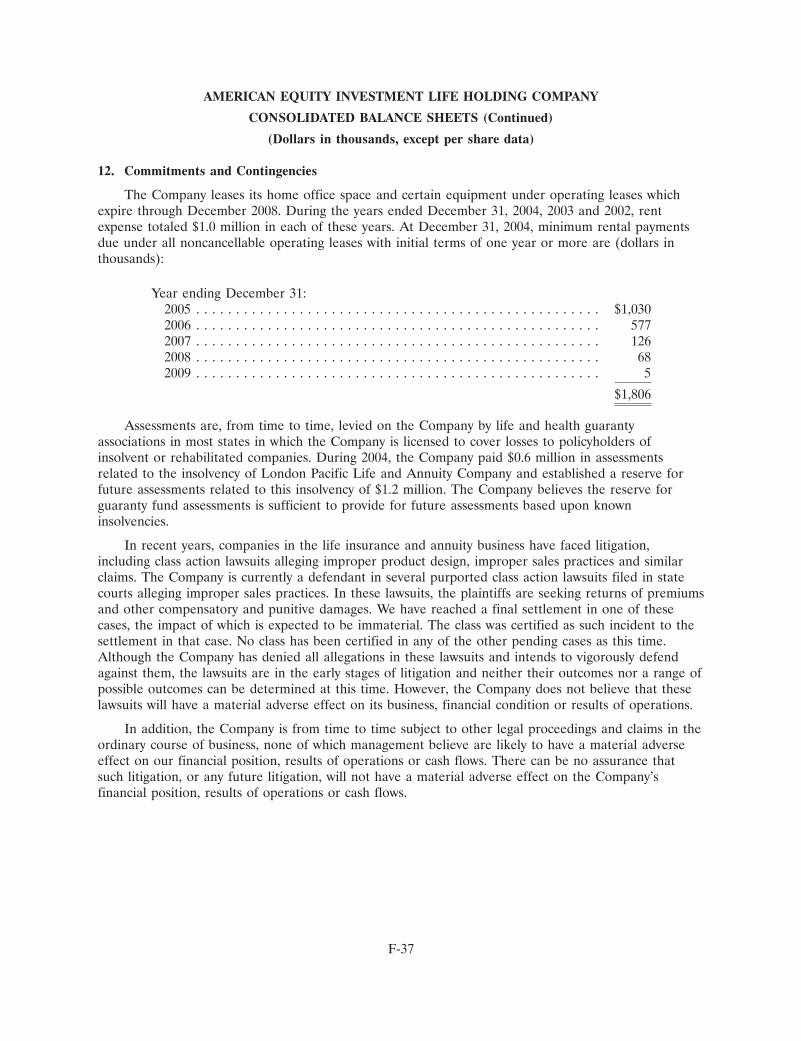
AMERICAN EQUITY INVESTMENT LIFE HOLDING COMPANY
CONSOLIDATED BALANCE SHEETS (Continued)
(Dollars in thousands, except per share data)
12. Commitments and Contingencies
The Company leases its home office space and certain equipment under operating leases whichexpire through December 2008. During the years ended December 31, 2004, 2003 and 2002, rentexpense totaled $1.0 million in each of these years. At December 31, 2004, minimum rental paymentsdue under all noncancellable operating leases with initial terms of one year or more are (dollars inthousands):
Year ending December 31:2005 . . . . . . . . . . . . . . . . . . . . . . . . . . . . . . . . . . . . . . . . . . . . . . . . . . . $1,0302006 . . . . . . . . . . . . . . . . . . . . . . . . . . . . . . . . . . . . . . . . . . . . . . . . . . . 5772007 . . . . . . . . . . . . . . . . . . . . . . . . . . . . . . . . . . . . . . . . . . . . . . . . . . . 1262008 . . . . . . . . . . . . . . . . . . . . . . . . . . . . . . . . . . . . . . . . . . . . . . . . . . . 682009 . . . . . . . . . . . . . . . . . . . . . . . . . . . . . . . . . . . . . . . . . . . . . . . . . . . 5
$1,806
Assessments are, from time to time, levied on the Company by life and health guarantyassociations in most states in which the Company is licensed to cover losses to policyholders ofinsolvent or rehabilitated companies. During 2004, the Company paid $0.6 million in assessmentsrelated to the insolvency of London Pacific Life and Annuity Company and established a reserve forfuture assessments related to this insolvency of $1.2 million. The Company believes the reserve forguaranty fund assessments is sufficient to provide for future assessments based upon knowninsolvencies.
In recent years, companies in the life insurance and annuity business have faced litigation,including class action lawsuits alleging improper product design, improper sales practices and similarclaims. The Company is currently a defendant in several purported class action lawsuits filed in statecourts alleging improper sales practices. In these lawsuits, the plaintiffs are seeking returns of premiumsand other compensatory and punitive damages. We have reached a final settlement in one of thesecases, the impact of which is expected to be immaterial. The class was certified as such incident to thesettlement in that case. No class has been certified in any of the other pending cases as this time.Although the Company has denied all allegations in these lawsuits and intends to vigorously defendagainst them, the lawsuits are in the early stages of litigation and neither their outcomes nor a range ofpossible outcomes can be determined at this time. However, the Company does not believe that theselawsuits will have a material adverse effect on its business, financial condition or results of operations.
In addition, the Company is from time to time subject to other legal proceedings and claims in theordinary course of business, none of which management believe are likely to have a material adverseeffect on our financial position, results of operations or cash flows. There can be no assurance thatsuch litigation, or any future litigation, will not have a material adverse effect on the Company’sfinancial position, results of operations or cash flows.
F-37
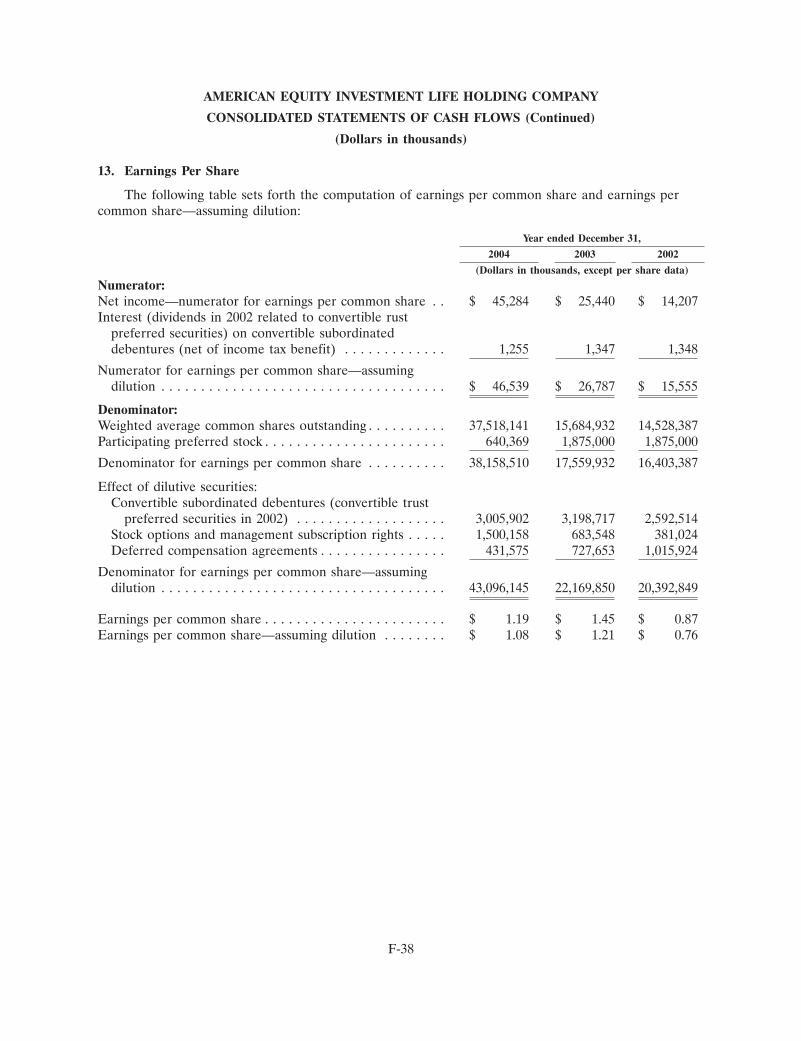
AMERICAN EQUITY INVESTMENT LIFE HOLDING COMPANY
CONSOLIDATED STATEMENTS OF CASH FLOWS (Continued)
(Dollars in thousands)
13. Earnings Per Share
The following table sets forth the computation of earnings per common share and earnings percommon share—assuming dilution:
Year ended December 31,
2004 2003 2002
(Dollars in thousands, except per share data)
Numerator:Net income—numerator for earnings per common share . . $ 45,284 $ 25,440 $ 14,207Interest (dividends in 2002 related to convertible rust
preferred securities) on convertible subordinateddebentures (net of income tax benefit) . . . . . . . . . . . . . 1,255 1,347 1,348
Numerator for earnings per common share—assumingdilution . . . . . . . . . . . . . . . . . . . . . . . . . . . . . . . . . . . . $ 46,539 $ 26,787 $ 15,555
Denominator:Weighted average common shares outstanding . . . . . . . . . . 37,518,141 15,684,932 14,528,387Participating preferred stock . . . . . . . . . . . . . . . . . . . . . . . 640,369 1,875,000 1,875,000
Denominator for earnings per common share . . . . . . . . . . 38,158,510 17,559,932 16,403,387
Effect of dilutive securities:Convertible subordinated debentures (convertible trust
preferred securities in 2002) . . . . . . . . . . . . . . . . . . . 3,005,902 3,198,717 2,592,514Stock options and management subscription rights . . . . . 1,500,158 683,548 381,024Deferred compensation agreements . . . . . . . . . . . . . . . . 431,575 727,653 1,015,924
Denominator for earnings per common share—assumingdilution . . . . . . . . . . . . . . . . . . . . . . . . . . . . . . . . . . . . 43,096,145 22,169,850 20,392,849
Earnings per common share . . . . . . . . . . . . . . . . . . . . . . . $ 1.19 $ 1.45 $ 0.87Earnings per common share—assuming dilution . . . . . . . . $ 1.08 $ 1.21 $ 0.76
F-38
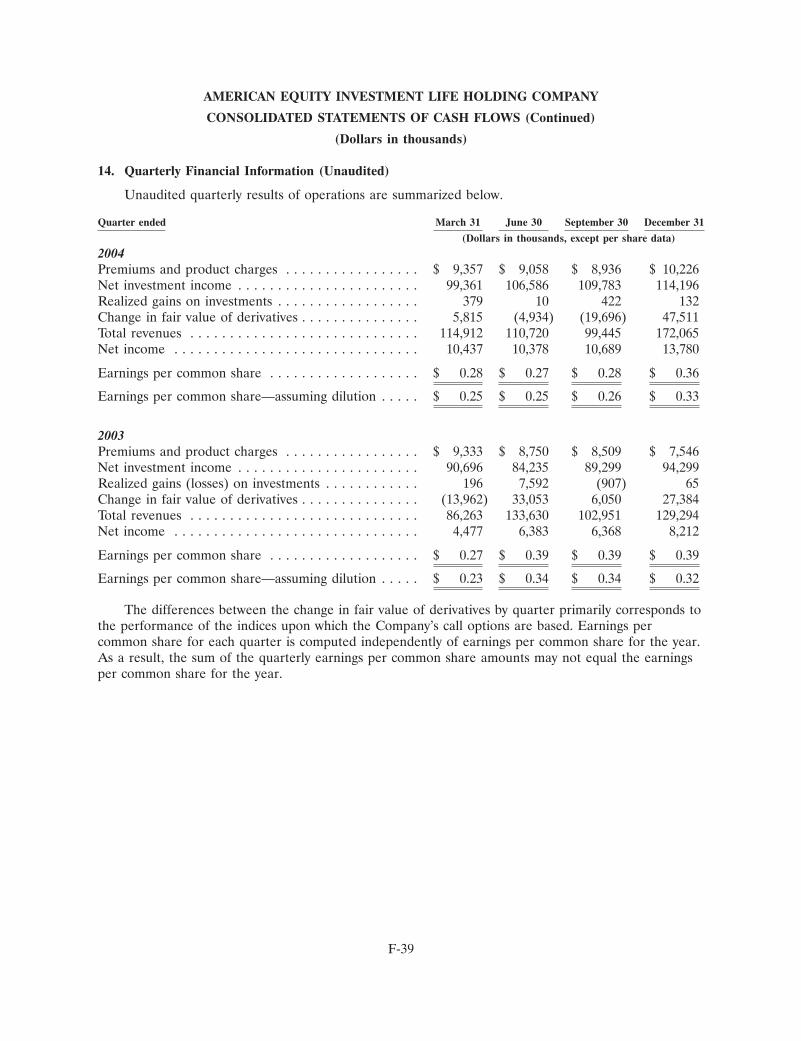
AMERICAN EQUITY INVESTMENT LIFE HOLDING COMPANY
CONSOLIDATED STATEMENTS OF CASH FLOWS (Continued)
(Dollars in thousands)
14. Quarterly Financial Information (Unaudited)
Unaudited quarterly results of operations are summarized below.
Quarter ended March 31 June 30 September 30 December 31
(Dollars in thousands, except per share data)
2004Premiums and product charges . . . . . . . . . . . . . . . . . $ 9,357 $ 9,058 $ 8,936 $ 10,226Net investment income . . . . . . . . . . . . . . . . . . . . . . . 99,361 106,586 109,783 114,196Realized gains on investments . . . . . . . . . . . . . . . . . . 379 10 422 132Change in fair value of derivatives . . . . . . . . . . . . . . . 5,815 (4,934) (19,696) 47,511Total revenues . . . . . . . . . . . . . . . . . . . . . . . . . . . . . 114,912 110,720 99,445 172,065Net income . . . . . . . . . . . . . . . . . . . . . . . . . . . . . . . 10,437 10,378 10,689 13,780
Earnings per common share . . . . . . . . . . . . . . . . . . . $ 0.28 $ 0.27 $ 0.28 $ 0.36
Earnings per common share—assuming dilution . . . . . $ 0.25 $ 0.25 $ 0.26 $ 0.33
2003Premiums and product charges . . . . . . . . . . . . . . . . . $ 9,333 $ 8,750 $ 8,509 $ 7,546Net investment income . . . . . . . . . . . . . . . . . . . . . . . 90,696 84,235 89,299 94,299Realized gains (losses) on investments . . . . . . . . . . . . 196 7,592 (907) 65Change in fair value of derivatives . . . . . . . . . . . . . . . (13,962) 33,053 6,050 27,384Total revenues . . . . . . . . . . . . . . . . . . . . . . . . . . . . . 86,263 133,630 102,951 129,294Net income . . . . . . . . . . . . . . . . . . . . . . . . . . . . . . . 4,477 6,383 6,368 8,212
Earnings per common share . . . . . . . . . . . . . . . . . . . $ 0.27 $ 0.39 $ 0.39 $ 0.39
Earnings per common share—assuming dilution . . . . . $ 0.23 $ 0.34 $ 0.34 $ 0.32
The differences between the change in fair value of derivatives by quarter primarily corresponds tothe performance of the indices upon which the Company’s call options are based. Earnings percommon share for each quarter is computed independently of earnings per common share for the year.As a result, the sum of the quarterly earnings per common share amounts may not equal the earningsper common share for the year.
F-39
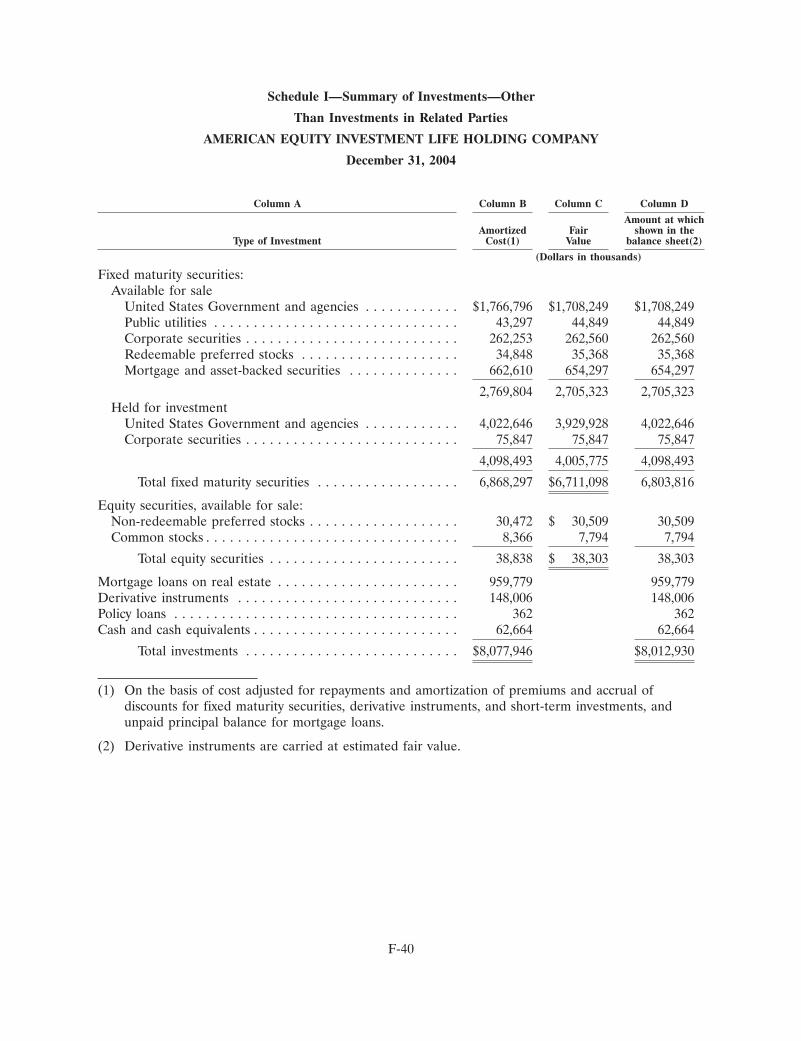
Schedule I—Summary of Investments—Other
Than Investments in Related Parties
AMERICAN EQUITY INVESTMENT LIFE HOLDING COMPANY
December 31, 2004
Column A Column B Column C Column D
Amount at whichAmortized Fair shown in the
Type of Investment Cost(1) Value balance sheet(2)
(Dollars in thousands)
Fixed maturity securities:Available for sale
United States Government and agencies . . . . . . . . . . . . $1,766,796 $1,708,249 $1,708,249Public utilities . . . . . . . . . . . . . . . . . . . . . . . . . . . . . . . 43,297 44,849 44,849Corporate securities . . . . . . . . . . . . . . . . . . . . . . . . . . . 262,253 262,560 262,560Redeemable preferred stocks . . . . . . . . . . . . . . . . . . . . 34,848 35,368 35,368Mortgage and asset-backed securities . . . . . . . . . . . . . . 662,610 654,297 654,297
2,769,804 2,705,323 2,705,323Held for investment
United States Government and agencies . . . . . . . . . . . . 4,022,646 3,929,928 4,022,646Corporate securities . . . . . . . . . . . . . . . . . . . . . . . . . . . 75,847 75,847 75,847
4,098,493 4,005,775 4,098,493
Total fixed maturity securities . . . . . . . . . . . . . . . . . . 6,868,297 $6,711,098 6,803,816
Equity securities, available for sale:Non-redeemable preferred stocks . . . . . . . . . . . . . . . . . . . 30,472 $ 30,509 30,509Common stocks . . . . . . . . . . . . . . . . . . . . . . . . . . . . . . . . 8,366 7,794 7,794
Total equity securities . . . . . . . . . . . . . . . . . . . . . . . . 38,838 $ 38,303 38,303
Mortgage loans on real estate . . . . . . . . . . . . . . . . . . . . . . . 959,779 959,779Derivative instruments . . . . . . . . . . . . . . . . . . . . . . . . . . . . 148,006 148,006Policy loans . . . . . . . . . . . . . . . . . . . . . . . . . . . . . . . . . . . . 362 362Cash and cash equivalents . . . . . . . . . . . . . . . . . . . . . . . . . . 62,664 62,664
Total investments . . . . . . . . . . . . . . . . . . . . . . . . . . . $8,077,946 $8,012,930
(1) On the basis of cost adjusted for repayments and amortization of premiums and accrual ofdiscounts for fixed maturity securities, derivative instruments, and short-term investments, andunpaid principal balance for mortgage loans.
(2) Derivative instruments are carried at estimated fair value.
F-40
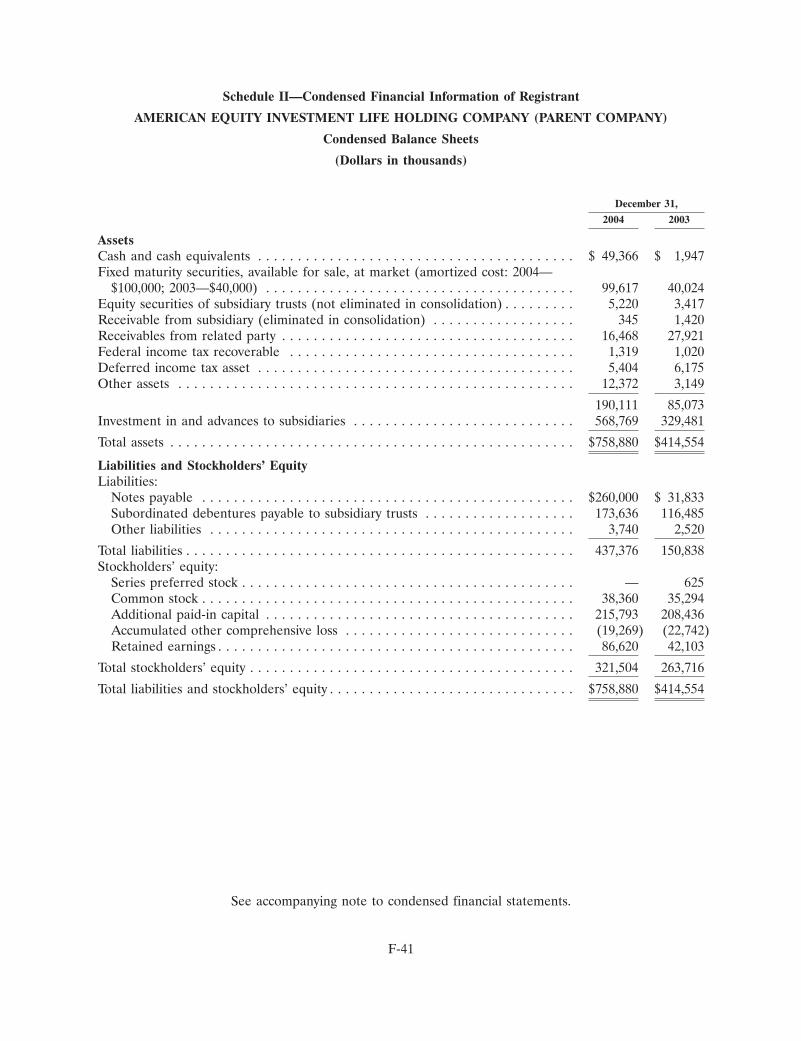
Schedule II—Condensed Financial Information of Registrant
AMERICAN EQUITY INVESTMENT LIFE HOLDING COMPANY (PARENT COMPANY)
Condensed Balance Sheets
(Dollars in thousands)
December 31,
2004 2003
AssetsCash and cash equivalents . . . . . . . . . . . . . . . . . . . . . . . . . . . . . . . . . . . . . . . . $ 49,366 $ 1,947Fixed maturity securities, available for sale, at market (amortized cost: 2004—
$100,000; 2003—$40,000) . . . . . . . . . . . . . . . . . . . . . . . . . . . . . . . . . . . . . . . 99,617 40,024Equity securities of subsidiary trusts (not eliminated in consolidation) . . . . . . . . . 5,220 3,417Receivable from subsidiary (eliminated in consolidation) . . . . . . . . . . . . . . . . . . 345 1,420Receivables from related party . . . . . . . . . . . . . . . . . . . . . . . . . . . . . . . . . . . . . 16,468 27,921Federal income tax recoverable . . . . . . . . . . . . . . . . . . . . . . . . . . . . . . . . . . . . 1,319 1,020Deferred income tax asset . . . . . . . . . . . . . . . . . . . . . . . . . . . . . . . . . . . . . . . . 5,404 6,175Other assets . . . . . . . . . . . . . . . . . . . . . . . . . . . . . . . . . . . . . . . . . . . . . . . . . . 12,372 3,149
190,111 85,073Investment in and advances to subsidiaries . . . . . . . . . . . . . . . . . . . . . . . . . . . . 568,769 329,481
Total assets . . . . . . . . . . . . . . . . . . . . . . . . . . . . . . . . . . . . . . . . . . . . . . . . . . . $758,880 $414,554
Liabilities and Stockholders’ EquityLiabilities:
Notes payable . . . . . . . . . . . . . . . . . . . . . . . . . . . . . . . . . . . . . . . . . . . . . . . $260,000 $ 31,833Subordinated debentures payable to subsidiary trusts . . . . . . . . . . . . . . . . . . . 173,636 116,485Other liabilities . . . . . . . . . . . . . . . . . . . . . . . . . . . . . . . . . . . . . . . . . . . . . . 3,740 2,520
Total liabilities . . . . . . . . . . . . . . . . . . . . . . . . . . . . . . . . . . . . . . . . . . . . . . . . . 437,376 150,838Stockholders’ equity:
Series preferred stock . . . . . . . . . . . . . . . . . . . . . . . . . . . . . . . . . . . . . . . . . . — 625Common stock . . . . . . . . . . . . . . . . . . . . . . . . . . . . . . . . . . . . . . . . . . . . . . . 38,360 35,294Additional paid-in capital . . . . . . . . . . . . . . . . . . . . . . . . . . . . . . . . . . . . . . . 215,793 208,436Accumulated other comprehensive loss . . . . . . . . . . . . . . . . . . . . . . . . . . . . . (19,269) (22,742)Retained earnings . . . . . . . . . . . . . . . . . . . . . . . . . . . . . . . . . . . . . . . . . . . . . 86,620 42,103
Total stockholders’ equity . . . . . . . . . . . . . . . . . . . . . . . . . . . . . . . . . . . . . . . . . 321,504 263,716
Total liabilities and stockholders’ equity . . . . . . . . . . . . . . . . . . . . . . . . . . . . . . . $758,880 $414,554
See accompanying note to condensed financial statements.
F-41
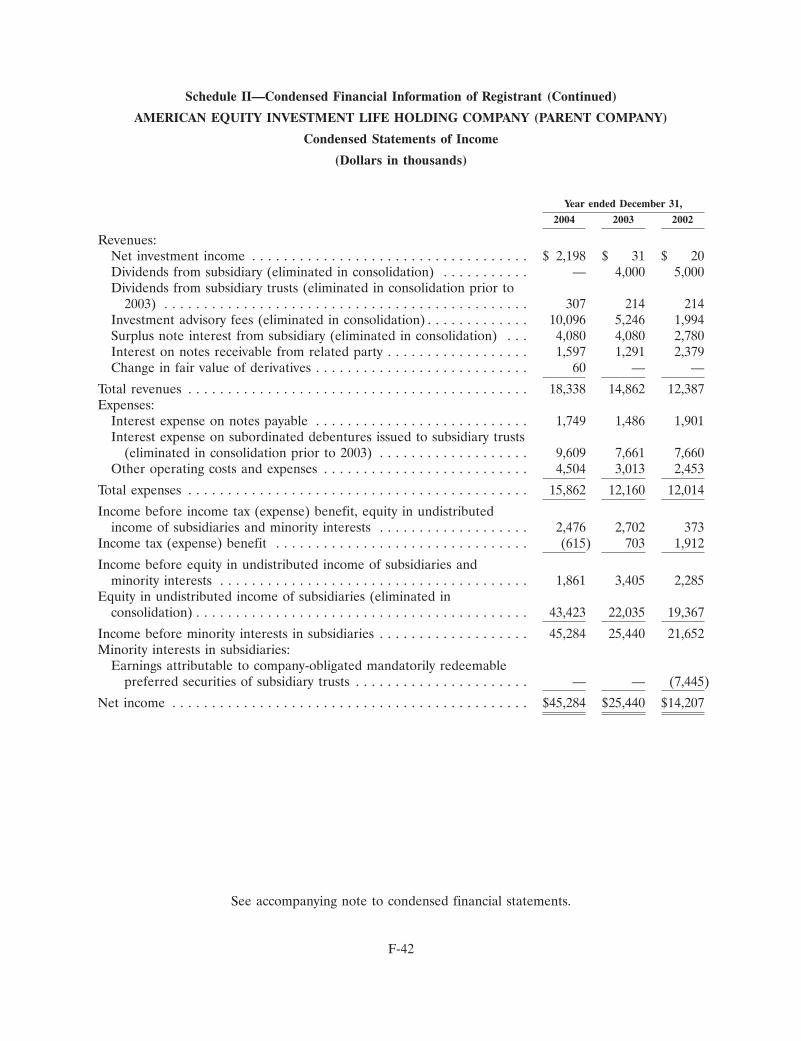
Schedule II—Condensed Financial Information of Registrant (Continued)
AMERICAN EQUITY INVESTMENT LIFE HOLDING COMPANY (PARENT COMPANY)
Condensed Statements of Income
(Dollars in thousands)
Year ended December 31,
2004 2003 2002
Revenues:Net investment income . . . . . . . . . . . . . . . . . . . . . . . . . . . . . . . . . . . $ 2,198 $ 31 $ 20Dividends from subsidiary (eliminated in consolidation) . . . . . . . . . . . — 4,000 5,000Dividends from subsidiary trusts (eliminated in consolidation prior to
2003) . . . . . . . . . . . . . . . . . . . . . . . . . . . . . . . . . . . . . . . . . . . . . . 307 214 214Investment advisory fees (eliminated in consolidation) . . . . . . . . . . . . . 10,096 5,246 1,994Surplus note interest from subsidiary (eliminated in consolidation) . . . 4,080 4,080 2,780Interest on notes receivable from related party . . . . . . . . . . . . . . . . . . 1,597 1,291 2,379Change in fair value of derivatives . . . . . . . . . . . . . . . . . . . . . . . . . . . 60 — —
Total revenues . . . . . . . . . . . . . . . . . . . . . . . . . . . . . . . . . . . . . . . . . . . 18,338 14,862 12,387Expenses:
Interest expense on notes payable . . . . . . . . . . . . . . . . . . . . . . . . . . . 1,749 1,486 1,901Interest expense on subordinated debentures issued to subsidiary trusts
(eliminated in consolidation prior to 2003) . . . . . . . . . . . . . . . . . . . 9,609 7,661 7,660Other operating costs and expenses . . . . . . . . . . . . . . . . . . . . . . . . . . 4,504 3,013 2,453
Total expenses . . . . . . . . . . . . . . . . . . . . . . . . . . . . . . . . . . . . . . . . . . . 15,862 12,160 12,014
Income before income tax (expense) benefit, equity in undistributedincome of subsidiaries and minority interests . . . . . . . . . . . . . . . . . . . 2,476 2,702 373
Income tax (expense) benefit . . . . . . . . . . . . . . . . . . . . . . . . . . . . . . . . (615) 703 1,912
Income before equity in undistributed income of subsidiaries andminority interests . . . . . . . . . . . . . . . . . . . . . . . . . . . . . . . . . . . . . . . 1,861 3,405 2,285
Equity in undistributed income of subsidiaries (eliminated inconsolidation) . . . . . . . . . . . . . . . . . . . . . . . . . . . . . . . . . . . . . . . . . . 43,423 22,035 19,367
Income before minority interests in subsidiaries . . . . . . . . . . . . . . . . . . . 45,284 25,440 21,652Minority interests in subsidiaries:
Earnings attributable to company-obligated mandatorily redeemablepreferred securities of subsidiary trusts . . . . . . . . . . . . . . . . . . . . . . — — (7,445)
Net income . . . . . . . . . . . . . . . . . . . . . . . . . . . . . . . . . . . . . . . . . . . . . $45,284 $25,440 $14,207
See accompanying note to condensed financial statements.
F-42
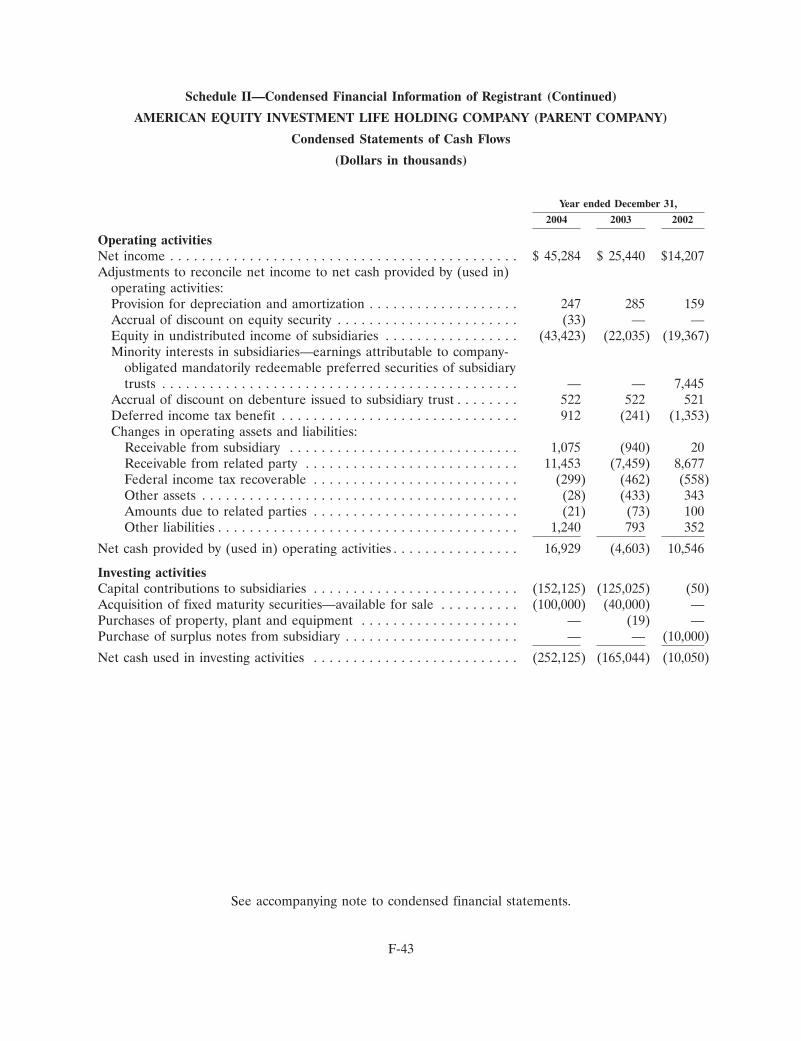
Schedule II—Condensed Financial Information of Registrant (Continued)
AMERICAN EQUITY INVESTMENT LIFE HOLDING COMPANY (PARENT COMPANY)
Condensed Statements of Cash Flows
(Dollars in thousands)
Year ended December 31,
2004 2003 2002
Operating activitiesNet income . . . . . . . . . . . . . . . . . . . . . . . . . . . . . . . . . . . . . . . . . . . . $ 45,284 $ 25,440 $14,207Adjustments to reconcile net income to net cash provided by (used in)
operating activities:Provision for depreciation and amortization . . . . . . . . . . . . . . . . . . . 247 285 159Accrual of discount on equity security . . . . . . . . . . . . . . . . . . . . . . . (33) — —Equity in undistributed income of subsidiaries . . . . . . . . . . . . . . . . . (43,423) (22,035) (19,367)Minority interests in subsidiaries—earnings attributable to company-
obligated mandatorily redeemable preferred securities of subsidiarytrusts . . . . . . . . . . . . . . . . . . . . . . . . . . . . . . . . . . . . . . . . . . . . . — — 7,445
Accrual of discount on debenture issued to subsidiary trust . . . . . . . . 522 522 521Deferred income tax benefit . . . . . . . . . . . . . . . . . . . . . . . . . . . . . . 912 (241) (1,353)Changes in operating assets and liabilities:
Receivable from subsidiary . . . . . . . . . . . . . . . . . . . . . . . . . . . . . 1,075 (940) 20Receivable from related party . . . . . . . . . . . . . . . . . . . . . . . . . . . 11,453 (7,459) 8,677Federal income tax recoverable . . . . . . . . . . . . . . . . . . . . . . . . . . (299) (462) (558)Other assets . . . . . . . . . . . . . . . . . . . . . . . . . . . . . . . . . . . . . . . . (28) (433) 343Amounts due to related parties . . . . . . . . . . . . . . . . . . . . . . . . . . (21) (73) 100Other liabilities . . . . . . . . . . . . . . . . . . . . . . . . . . . . . . . . . . . . . . 1,240 793 352
Net cash provided by (used in) operating activities . . . . . . . . . . . . . . . . 16,929 (4,603) 10,546
Investing activitiesCapital contributions to subsidiaries . . . . . . . . . . . . . . . . . . . . . . . . . . (152,125) (125,025) (50)Acquisition of fixed maturity securities—available for sale . . . . . . . . . . (100,000) (40,000) —Purchases of property, plant and equipment . . . . . . . . . . . . . . . . . . . . — (19) —Purchase of surplus notes from subsidiary . . . . . . . . . . . . . . . . . . . . . . — — (10,000)
Net cash used in investing activities . . . . . . . . . . . . . . . . . . . . . . . . . . (252,125) (165,044) (10,050)
See accompanying note to condensed financial statements.
F-43
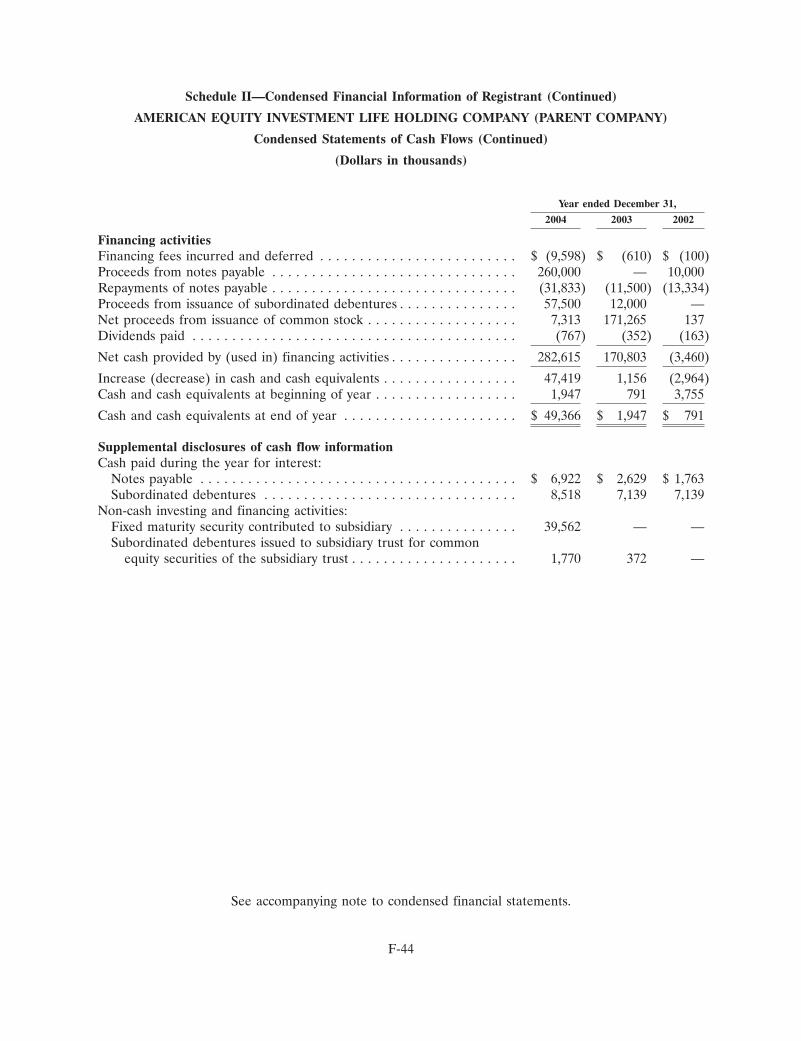
Schedule II—Condensed Financial Information of Registrant (Continued)
AMERICAN EQUITY INVESTMENT LIFE HOLDING COMPANY (PARENT COMPANY)
Condensed Statements of Cash Flows (Continued)
(Dollars in thousands)
Year ended December 31,
2004 2003 2002
Financing activitiesFinancing fees incurred and deferred . . . . . . . . . . . . . . . . . . . . . . . . . $ (9,598) $ (610) $ (100)Proceeds from notes payable . . . . . . . . . . . . . . . . . . . . . . . . . . . . . . . 260,000 — 10,000Repayments of notes payable . . . . . . . . . . . . . . . . . . . . . . . . . . . . . . . (31,833) (11,500) (13,334)Proceeds from issuance of subordinated debentures . . . . . . . . . . . . . . . 57,500 12,000 —Net proceeds from issuance of common stock . . . . . . . . . . . . . . . . . . . 7,313 171,265 137Dividends paid . . . . . . . . . . . . . . . . . . . . . . . . . . . . . . . . . . . . . . . . . (767) (352) (163)
Net cash provided by (used in) financing activities . . . . . . . . . . . . . . . . 282,615 170,803 (3,460)
Increase (decrease) in cash and cash equivalents . . . . . . . . . . . . . . . . . 47,419 1,156 (2,964)Cash and cash equivalents at beginning of year . . . . . . . . . . . . . . . . . . 1,947 791 3,755
Cash and cash equivalents at end of year . . . . . . . . . . . . . . . . . . . . . . $ 49,366 $ 1,947 $ 791
Supplemental disclosures of cash flow informationCash paid during the year for interest:
Notes payable . . . . . . . . . . . . . . . . . . . . . . . . . . . . . . . . . . . . . . . . $ 6,922 $ 2,629 $ 1,763Subordinated debentures . . . . . . . . . . . . . . . . . . . . . . . . . . . . . . . . 8,518 7,139 7,139
Non-cash investing and financing activities:Fixed maturity security contributed to subsidiary . . . . . . . . . . . . . . . 39,562 — —Subordinated debentures issued to subsidiary trust for common
equity securities of the subsidiary trust . . . . . . . . . . . . . . . . . . . . . 1,770 372 —
See accompanying note to condensed financial statements.
F-44
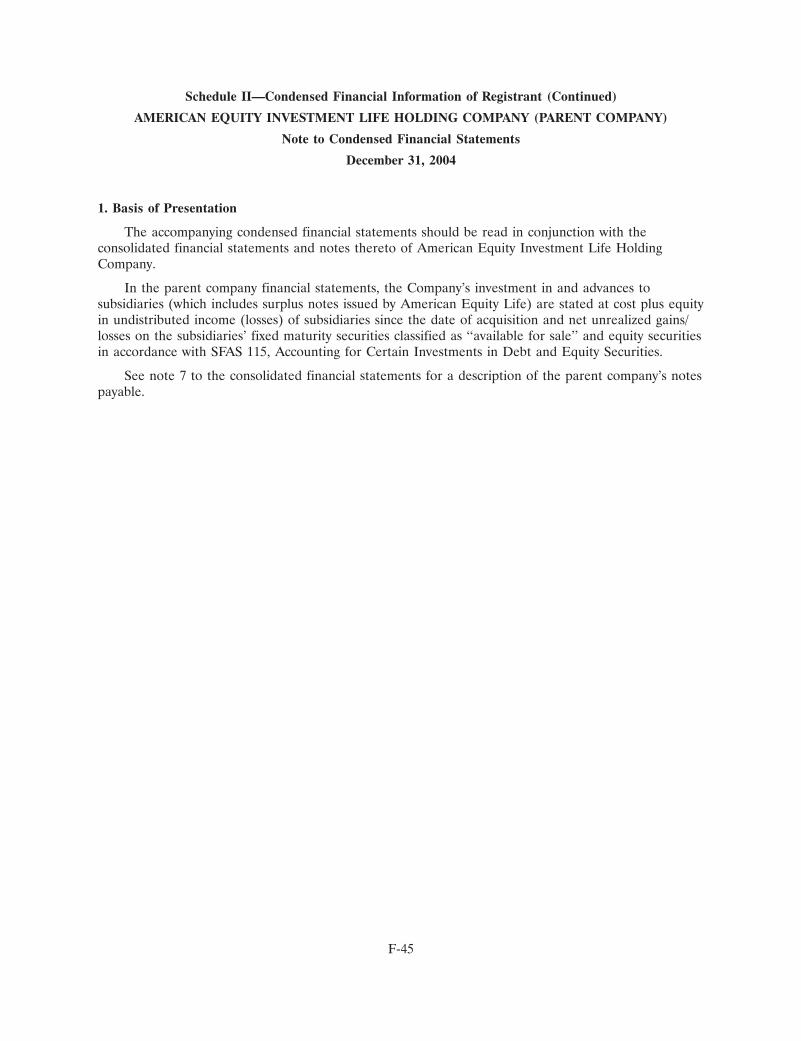
Schedule II—Condensed Financial Information of Registrant (Continued)
AMERICAN EQUITY INVESTMENT LIFE HOLDING COMPANY (PARENT COMPANY)
Note to Condensed Financial Statements
December 31, 2004
1. Basis of Presentation
The accompanying condensed financial statements should be read in conjunction with theconsolidated financial statements and notes thereto of American Equity Investment Life HoldingCompany.
In the parent company financial statements, the Company’s investment in and advances tosubsidiaries (which includes surplus notes issued by American Equity Life) are stated at cost plus equityin undistributed income (losses) of subsidiaries since the date of acquisition and net unrealized gains/losses on the subsidiaries’ fixed maturity securities classified as ‘‘available for sale’’ and equity securitiesin accordance with SFAS 115, Accounting for Certain Investments in Debt and Equity Securities.
See note 7 to the consolidated financial statements for a description of the parent company’s notespayable.
F-45
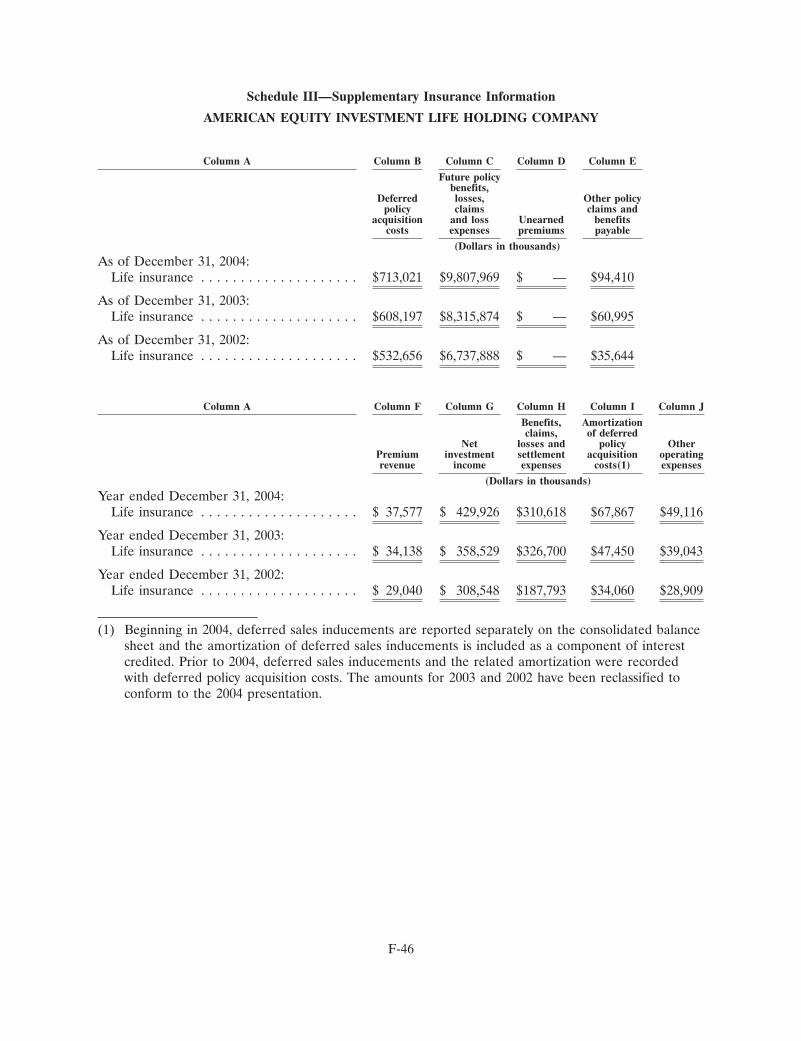
Schedule III—Supplementary Insurance Information
AMERICAN EQUITY INVESTMENT LIFE HOLDING COMPANY
Column A Column B Column C Column D Column E
Future policybenefits,
Deferred losses, Other policypolicy claims claims and
acquisition and loss Unearned benefitscosts expenses premiums payable
(Dollars in thousands)
As of December 31, 2004:Life insurance . . . . . . . . . . . . . . . . . . . . $713,021 $9,807,969 $ — $94,410
As of December 31, 2003:Life insurance . . . . . . . . . . . . . . . . . . . . $608,197 $8,315,874 $ — $60,995
As of December 31, 2002:Life insurance . . . . . . . . . . . . . . . . . . . . $532,656 $6,737,888 $ — $35,644
Column A Column F Column G Column H Column I Column J
Benefits, Amortizationclaims, of deferred
Net losses and policy OtherPremium investment settlement acquisition operatingrevenue income expenses costs(1) expenses
(Dollars in thousands)
Year ended December 31, 2004:Life insurance . . . . . . . . . . . . . . . . . . . . $ 37,577 $ 429,926 $310,618 $67,867 $49,116
Year ended December 31, 2003:Life insurance . . . . . . . . . . . . . . . . . . . . $ 34,138 $ 358,529 $326,700 $47,450 $39,043
Year ended December 31, 2002:Life insurance . . . . . . . . . . . . . . . . . . . . $ 29,040 $ 308,548 $187,793 $34,060 $28,909
(1) Beginning in 2004, deferred sales inducements are reported separately on the consolidated balancesheet and the amortization of deferred sales inducements is included as a component of interestcredited. Prior to 2004, deferred sales inducements and the related amortization were recordedwith deferred policy acquisition costs. The amounts for 2003 and 2002 have been reclassified toconform to the 2004 presentation.
F-46
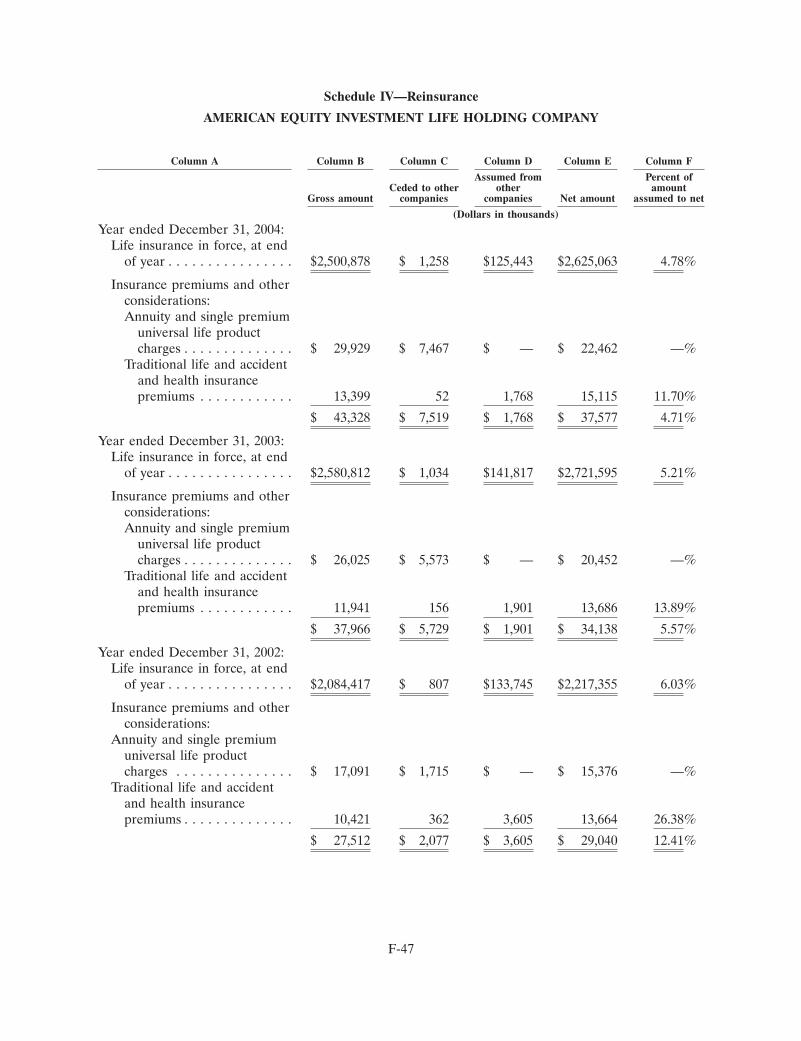
Schedule IV—Reinsurance
AMERICAN EQUITY INVESTMENT LIFE HOLDING COMPANY
Column A Column B Column C Column D Column E Column F
Assumed from Percent ofCeded to other other amount
Gross amount companies companies Net amount assumed to net
(Dollars in thousands)
Year ended December 31, 2004:Life insurance in force, at end
of year . . . . . . . . . . . . . . . . $2,500,878 $ 1,258 $125,443 $2,625,063 4.78%
Insurance premiums and otherconsiderations:Annuity and single premium
universal life productcharges . . . . . . . . . . . . . . $ 29,929 $ 7,467 $ — $ 22,462 —%
Traditional life and accidentand health insurancepremiums . . . . . . . . . . . . 13,399 52 1,768 15,115 11.70%
$ 43,328 $ 7,519 $ 1,768 $ 37,577 4.71%
Year ended December 31, 2003:Life insurance in force, at end
of year . . . . . . . . . . . . . . . . $2,580,812 $ 1,034 $141,817 $2,721,595 5.21%
Insurance premiums and otherconsiderations:Annuity and single premium
universal life productcharges . . . . . . . . . . . . . . $ 26,025 $ 5,573 $ — $ 20,452 —%
Traditional life and accidentand health insurancepremiums . . . . . . . . . . . . 11,941 156 1,901 13,686 13.89%
$ 37,966 $ 5,729 $ 1,901 $ 34,138 5.57%
Year ended December 31, 2002:Life insurance in force, at end
of year . . . . . . . . . . . . . . . . $2,084,417 $ 807 $133,745 $2,217,355 6.03%
Insurance premiums and otherconsiderations:
Annuity and single premiumuniversal life productcharges . . . . . . . . . . . . . . . $ 17,091 $ 1,715 $ — $ 15,376 —%
Traditional life and accidentand health insurancepremiums . . . . . . . . . . . . . . 10,421 362 3,605 13,664 26.38%
$ 27,512 $ 2,077 $ 3,605 $ 29,040 12.41%
F-47
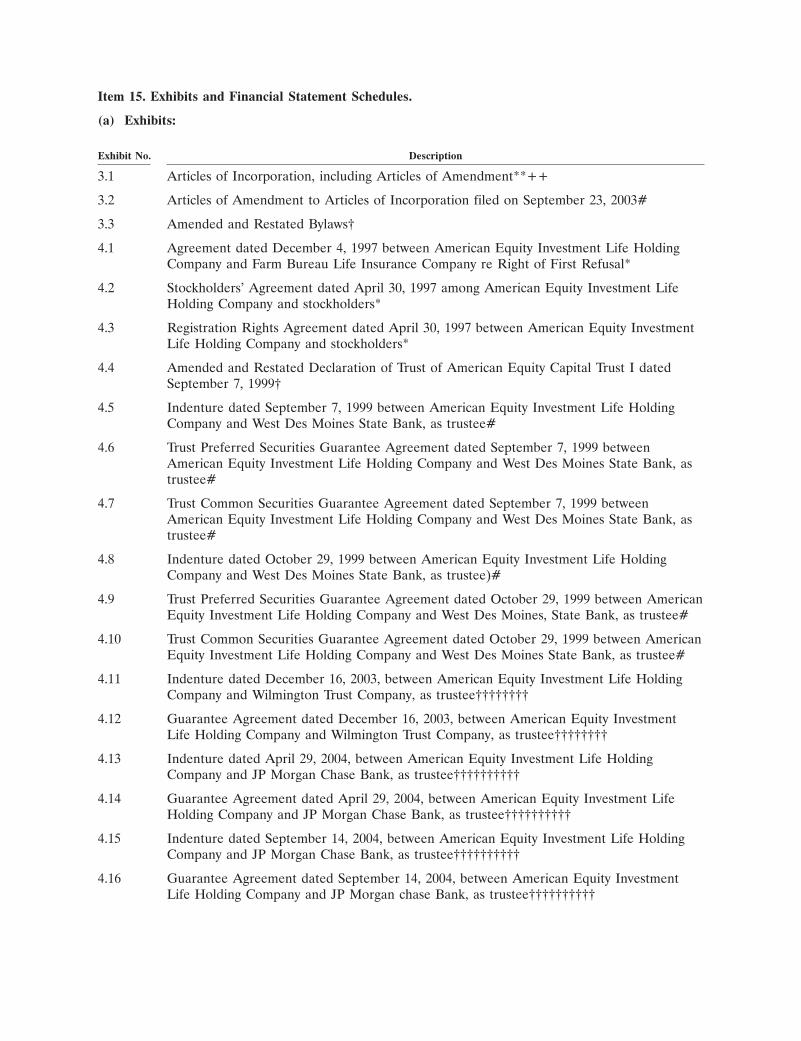
Item 15. Exhibits and Financial Statement Schedules.
(a) Exhibits:
Exhibit No. Description
3.1 Articles of Incorporation, including Articles of Amendment**++
3.2 Articles of Amendment to Articles of Incorporation filed on September 23, 2003#
3.3 Amended and Restated Bylaws†
4.1 Agreement dated December 4, 1997 between American Equity Investment Life HoldingCompany and Farm Bureau Life Insurance Company re Right of First Refusal*
4.2 Stockholders’ Agreement dated April 30, 1997 among American Equity Investment LifeHolding Company and stockholders*
4.3 Registration Rights Agreement dated April 30, 1997 between American Equity InvestmentLife Holding Company and stockholders*
4.4 Amended and Restated Declaration of Trust of American Equity Capital Trust I datedSeptember 7, 1999†
4.5 Indenture dated September 7, 1999 between American Equity Investment Life HoldingCompany and West Des Moines State Bank, as trustee#
4.6 Trust Preferred Securities Guarantee Agreement dated September 7, 1999 betweenAmerican Equity Investment Life Holding Company and West Des Moines State Bank, astrustee#
4.7 Trust Common Securities Guarantee Agreement dated September 7, 1999 betweenAmerican Equity Investment Life Holding Company and West Des Moines State Bank, astrustee#
4.8 Indenture dated October 29, 1999 between American Equity Investment Life HoldingCompany and West Des Moines State Bank, as trustee)#
4.9 Trust Preferred Securities Guarantee Agreement dated October 29, 1999 between AmericanEquity Investment Life Holding Company and West Des Moines, State Bank, as trustee#
4.10 Trust Common Securities Guarantee Agreement dated October 29, 1999 between AmericanEquity Investment Life Holding Company and West Des Moines State Bank, as trustee#
4.11 Indenture dated December 16, 2003, between American Equity Investment Life HoldingCompany and Wilmington Trust Company, as trustee††††††††
4.12 Guarantee Agreement dated December 16, 2003, between American Equity InvestmentLife Holding Company and Wilmington Trust Company, as trustee††††††††
4.13 Indenture dated April 29, 2004, between American Equity Investment Life HoldingCompany and JP Morgan Chase Bank, as trustee††††††††††
4.14 Guarantee Agreement dated April 29, 2004, between American Equity Investment LifeHolding Company and JP Morgan Chase Bank, as trustee††††††††††
4.15 Indenture dated September 14, 2004, between American Equity Investment Life HoldingCompany and JP Morgan Chase Bank, as trustee††††††††††
4.16 Guarantee Agreement dated September 14, 2004, between American Equity InvestmentLife Holding Company and JP Morgan chase Bank, as trustee††††††††††
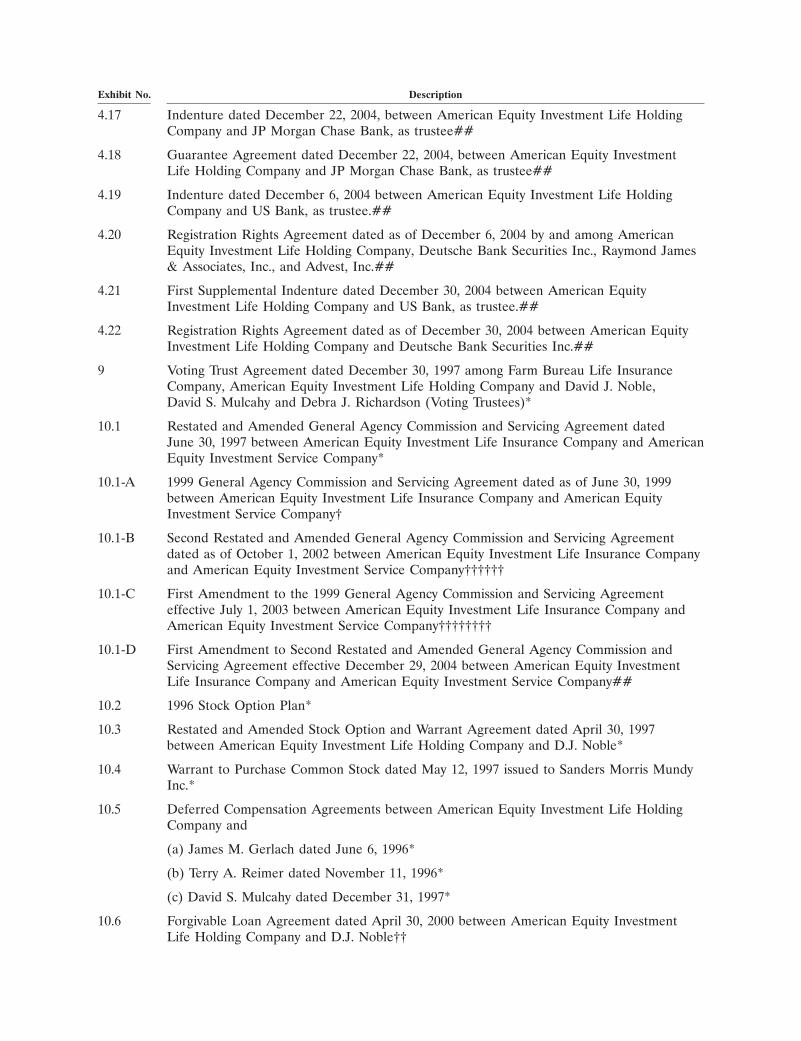
Exhibit No. Description
4.17 Indenture dated December 22, 2004, between American Equity Investment Life HoldingCompany and JP Morgan Chase Bank, as trustee##
4.18 Guarantee Agreement dated December 22, 2004, between American Equity InvestmentLife Holding Company and JP Morgan Chase Bank, as trustee##
4.19 Indenture dated December 6, 2004 between American Equity Investment Life HoldingCompany and US Bank, as trustee.##
4.20 Registration Rights Agreement dated as of December 6, 2004 by and among AmericanEquity Investment Life Holding Company, Deutsche Bank Securities Inc., Raymond James& Associates, Inc., and Advest, Inc.##
4.21 First Supplemental Indenture dated December 30, 2004 between American EquityInvestment Life Holding Company and US Bank, as trustee.##
4.22 Registration Rights Agreement dated as of December 30, 2004 between American EquityInvestment Life Holding Company and Deutsche Bank Securities Inc.##
9 Voting Trust Agreement dated December 30, 1997 among Farm Bureau Life InsuranceCompany, American Equity Investment Life Holding Company and David J. Noble,David S. Mulcahy and Debra J. Richardson (Voting Trustees)*
10.1 Restated and Amended General Agency Commission and Servicing Agreement datedJune 30, 1997 between American Equity Investment Life Insurance Company and AmericanEquity Investment Service Company*
10.1-A 1999 General Agency Commission and Servicing Agreement dated as of June 30, 1999between American Equity Investment Life Insurance Company and American EquityInvestment Service Company†
10.1-B Second Restated and Amended General Agency Commission and Servicing Agreementdated as of October 1, 2002 between American Equity Investment Life Insurance Companyand American Equity Investment Service Company††††††
10.1-C First Amendment to the 1999 General Agency Commission and Servicing Agreementeffective July 1, 2003 between American Equity Investment Life Insurance Company andAmerican Equity Investment Service Company††††††††
10.1-D First Amendment to Second Restated and Amended General Agency Commission andServicing Agreement effective December 29, 2004 between American Equity InvestmentLife Insurance Company and American Equity Investment Service Company##
10.2 1996 Stock Option Plan*
10.3 Restated and Amended Stock Option and Warrant Agreement dated April 30, 1997between American Equity Investment Life Holding Company and D.J. Noble*
10.4 Warrant to Purchase Common Stock dated May 12, 1997 issued to Sanders Morris MundyInc.*
10.5 Deferred Compensation Agreements between American Equity Investment Life HoldingCompany and
(a) James M. Gerlach dated June 6, 1996*
(b) Terry A. Reimer dated November 11, 1996*
(c) David S. Mulcahy dated December 31, 1997*
10.6 Forgivable Loan Agreement dated April 30, 2000 between American Equity InvestmentLife Holding Company and D.J. Noble††
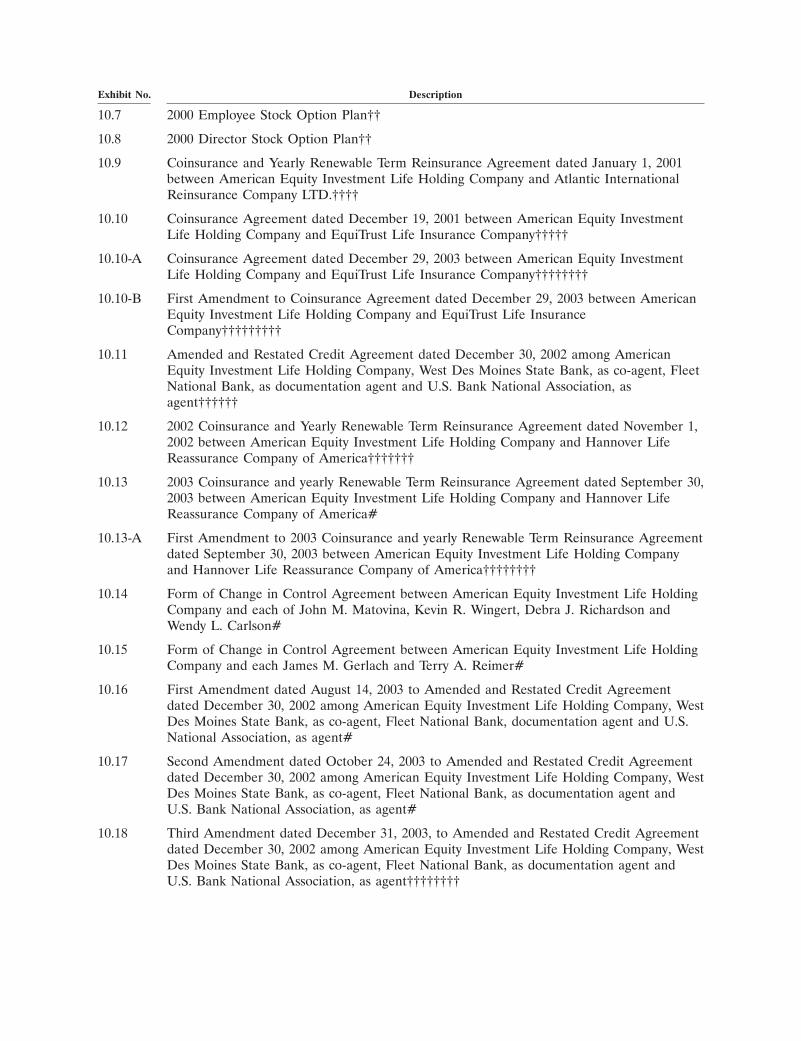
Exhibit No. Description
10.7 2000 Employee Stock Option Plan††
10.8 2000 Director Stock Option Plan††
10.9 Coinsurance and Yearly Renewable Term Reinsurance Agreement dated January 1, 2001between American Equity Investment Life Holding Company and Atlantic InternationalReinsurance Company LTD.††††
10.10 Coinsurance Agreement dated December 19, 2001 between American Equity InvestmentLife Holding Company and EquiTrust Life Insurance Company†††††
10.10-A Coinsurance Agreement dated December 29, 2003 between American Equity InvestmentLife Holding Company and EquiTrust Life Insurance Company††††††††
10.10-B First Amendment to Coinsurance Agreement dated December 29, 2003 between AmericanEquity Investment Life Holding Company and EquiTrust Life InsuranceCompany†††††††††
10.11 Amended and Restated Credit Agreement dated December 30, 2002 among AmericanEquity Investment Life Holding Company, West Des Moines State Bank, as co-agent, FleetNational Bank, as documentation agent and U.S. Bank National Association, asagent††††††
10.12 2002 Coinsurance and Yearly Renewable Term Reinsurance Agreement dated November 1,2002 between American Equity Investment Life Holding Company and Hannover LifeReassurance Company of America†††††††
10.13 2003 Coinsurance and yearly Renewable Term Reinsurance Agreement dated September 30,2003 between American Equity Investment Life Holding Company and Hannover LifeReassurance Company of America#
10.13-A First Amendment to 2003 Coinsurance and yearly Renewable Term Reinsurance Agreementdated September 30, 2003 between American Equity Investment Life Holding Companyand Hannover Life Reassurance Company of America††††††††
10.14 Form of Change in Control Agreement between American Equity Investment Life HoldingCompany and each of John M. Matovina, Kevin R. Wingert, Debra J. Richardson andWendy L. Carlson#
10.15 Form of Change in Control Agreement between American Equity Investment Life HoldingCompany and each James M. Gerlach and Terry A. Reimer#
10.16 First Amendment dated August 14, 2003 to Amended and Restated Credit Agreementdated December 30, 2002 among American Equity Investment Life Holding Company, WestDes Moines State Bank, as co-agent, Fleet National Bank, documentation agent and U.S.National Association, as agent#
10.17 Second Amendment dated October 24, 2003 to Amended and Restated Credit Agreementdated December 30, 2002 among American Equity Investment Life Holding Company, WestDes Moines State Bank, as co-agent, Fleet National Bank, as documentation agent andU.S. Bank National Association, as agent#
10.18 Third Amendment dated December 31, 2003, to Amended and Restated Credit Agreementdated December 30, 2002 among American Equity Investment Life Holding Company, WestDes Moines State Bank, as co-agent, Fleet National Bank, as documentation agent andU.S. Bank National Association, as agent††††††††
Exhibit No. Description
10.19 Fourth Amendment dated June 30, 2004 to Amended and Restated Credit Agreementdated December 30, 2002 among American Equity Investment Life Holding Company, WestDes Moines State Bank, as co-agent, Fleet National Bank, as documentation agent andU.S. Bank National Association, as agent†††††††††
10.20 Amended and Restated Credit Agreement dated September 22, 2004 among AmericanEquity Investment Life Holding Company, West Des Moines State Bank, LaSalle Bank andU.S. Bank National Association††††††††††
21.1 Subsidiaries of American Equity Investment Life Holding Company††††††††
23 Consent of Independent Registered Public Accounting Firm
31.1 Certification of Chief Executive Officer pursuant to 18 U.S.C. Section 1350, as AdoptedPursuant to Section 302 of the Sarbanes-Oxley Act of 2002
31.2 Certification of Chief Financial Officer pursuant to 18 U.S.C. Section 1350, as AdoptedPursuant to Section 302 of the Sarbanes-Oxley Act of 2002
32.1 Certification of Chief Executive Officer pursuant to 18 U.S.C. Section 1350, as AdoptedPursuant to Section 906 of the Sarbanes-Oxley Act of 2002
32.2 Certification of Chief Financial Officer pursuant to 18 U.S.C. Section 1350, as AdoptedPursuant to Section 906 of the Sarbanes-Oxley Act of 2002
* Incorporated by reference to American Equity Investment Life Holding Company’sRegistration Statement on Form 10 dated April 29, 1999
** Incorporated by reference to the Registration Statement on Form 10 dated April 29, 1999and Post-Effective Amendment No. 1 to the Registration Statement on Form 10 datedJuly 20, 1999
† Incorporated by reference to Form 10-K for the period ended December 31, 1999
†† Incorporated by reference to Form 10-Q for the period ended June 30, 2000
††† Incorporated by reference to Form 10-K for the period ended December 31, 2000
†††† Incorporated by reference to Form 10-Q for the period ended September 30, 2001
††††† Incorporated by reference to Form 10-K for the period ended December 31, 2001
†††††† Incorporated by reference to Form 10-K for the period ended December 31, 2002
††††††† Incorporated by reference to Form 10-Q for the period ended June 30, 2003
†††††††† Incorporated by reference to Form 10-K for the period ended December 31, 2003
††††††††† Incorporated by reference to Form 10-Q for the period ended June 30, 2004
†††††††††† Incorporated by reference to Form 10-Q for the period ended September 30, 2004
# Incorporated by reference to the Registration Statement on Form S-1 dated September 15,2003, including all pre-effective amendments thereto
## Previously filed with the original Form 10-K for the period ended December 31, 2004
Exhibit 23
CONSENT OF INDEPENDENT REGISTERED PUBLIC ACCOUNTING FIRM
We consent to the incorporation by reference in the Registration Statement (Form S-3No. 333-113630) of American Equity Investment Life Holding Company and in the related Prospectusof our report dated March 23, 2005, with respect to American Equity Investment Life HoldingCompany management’s assessment of the effectiveness of internal control over financial reporting, andthe effectiveness of internal control over financial reporting of American Equity Investment LifeHolding Company, included in this Form 10-K/A.
/s/ ERNST & YOUNG LLP
Des Moines, IowaMarch 23, 2005
Exhibit 31.1
CERTIFICATION PURSUANT TO18 U.S.C. SECTION 1350,
AS ADOPTED PURSUANT TOSECTION 302 OF THE SARBANES-OXLEY ACT OF 2002
I, David J. Noble, certify that:
1. I have reviewed this annual report on Form 10-K/A of American Equity Investment Life HoldingCompany;
2. Based on my knowledge, this report does not contain any untrue statement of a material fact oromit to state a material fact necessary to make the statements made, in light of the circumstancesunder which such statements were made, not misleading with respect to the period covered by thisreport;
3. Based on my knowledge, the financial statements, and other financial information included in thisreport, fairly present in all material respects the financial condition, results of operations and cashflows of the registrant as of, and for, the periods presented in this report;
4. The registrant’s other certifying officer(s) and I are responsible for establishing and maintainingdisclosure controls and procedures (as defined in Exchange Act Rules 13a-15(e) and 15d-15(e)) forthe registrant and have:
(a) Designed such disclosure controls and procedures, or caused such disclosure controls andprocedures to be designed under our supervision, to ensure that material information relatingto the registrant, including its consolidated subsidiaries, is made known to us by others withinthose entities, particularly during the period in which this report is being prepared;
(b) Designed such internal control over financial reporting, or caused such internal control overfinancial reporting to be designed under our supervision, to provide reasonable assuranceregarding the reliability of financial reporting and the preparation of financial statements forexternal purposes in accordance with generally accepted accounting principles;
(c) Evaluated the effectiveness of the registrant’s disclosure controls and procedures andpresented in this report our conclusions about the effectiveness of the disclosure controls andprocedures, as of the end of the period covered by this report based on such evaluation; and
(d) Disclosed in this report any change in the registrant’s internal control over financial reportingthat occurred during the registrant’s most recent fiscal quarter (the registrant’s fourth quarterin the case of an annual report) that has materially affected, or is reasonably likely tomaterially affect, the registrant’s internal control over financial reporting.
5. The registrant’s other certifying officer(s) and I have disclosed, based on our most recentevaluation of internal control over financial reporting, to the registrant’s auditors and the auditcommittee of registrant’s board of directors (or persons performing the equivalent functions):
(a) All significant deficiencies and material weaknesses in the design or operation of internalcontrol over financial reporting which are reasonably likely to adversely affect the registrant’sability to record, process, summarize and report financial information; and
(b) Any fraud, whether or not material, that involves management or other employees who have asignificant role in the registrant’s internal controls over financial reporting.
Date: March 24, 2005 By: /s/ DAVID J. NOBLE
David J. Noble, Chief Executive Officer (PrincipalExecutive Officer)

Exhibit 31.2
CERTIFICATION PURSUANT TO18 U.S.C. SECTION 1350,
AS ADOPTED PURSUANT TOSECTION 302 OF THE SARBANES-OXLEY ACT OF 2002
I, Wendy L. Carlson, certify that:
1. I have reviewed this annual report on Form 10-K/A of American Equity Investment Life HoldingCompany;
2. Based on my knowledge, this report does not contain any untrue statement of a material fact oromit to state a material fact necessary to make the statements made, in light of the circumstancesunder which such statements were made, not misleading with respect to the period covered by thisreport;
3. Based on my knowledge, the financial statements, and other financial information included in thisreport, fairly present in all material respects the financial condition, results of operations and cashflows of the registrant as of, and for, the periods presented in this report;
4. The registrant’s other certifying officer(s) and I are responsible for establishing and maintainingdisclosure controls and procedures (as defined in Exchange Act Rules 13a-15(e) and 15d-15(e)) forthe registrant and have:
(a) Designed such disclosure controls and procedures, or caused such disclosure controls andprocedures to be designed under our supervision, to ensure that material information relatingto the registrant, including its consolidated subsidiaries, is made known to us by others withinthose entities, particularly during the period in which this report is being prepared;
(b) Designed such internal control over financial reporting, or caused such internal control overfinancial reporting to be designed under our supervision, to provide reasonable assuranceregarding the reliability of financial reporting and the preparation of financial statements forexternal purposes in accordance with generally accepted accounting principles;
(c) Evaluated the effectiveness of the registrant’s disclosure controls and procedures andpresented in this report our conclusions about the effectiveness of the disclosure controls andprocedures, as of the end of the period covered by this report based on such evaluation; and
(d) Disclosed in this report any change in the registrant’s internal control over financial reportingthat occurred during the registrant’s most recent fiscal quarter (the registrant’s fourth quarterin the case of an annual report) that has materially affected, or is reasonably likely tomaterially affect, the registrant’s internal control over financial reporting.
5. The registrant’s other certifying officer(s) and I have disclosed, based on our most recentevaluation of internal control over financial reporting, to the registrant’s auditors and the auditcommittee of registrant’s board of directors (or persons performing the equivalent functions):
(a) All significant deficiencies and material weaknesses in the design or operation of internalcontrol over financial reporting which are reasonably likely to adversely affect the registrant’sability to record, process, summarize and report financial information; and
(b) Any fraud, whether or not material, that involves management or other employees who have asignificant role in the registrant’s internal controls over financial reporting.
Date: March 24, 2005 By: /s/ WENDY L. CARLSON
Wendy L. Carlson, Chief Financial Officer (PrincipalFinancial Officer)
Exhibit 32.1
CERTIFICATION PURSUANT TO18 U.S.C. SECTION 1350,
AS ADOPTED PURSUANT TOSECTION 906 OF THE SARBANES-OXLEY ACT OF 2002
In connection with the Annual Report of American Equity Investment Life Holding Company (the‘‘Company’’) on Form 10-K/A for the fiscal year ended December 31, 2004 as filed with the Securitiesand Exchange Commission on the date hereof (the ‘‘Report’’), I, David J. Noble, Chief ExecutiveOfficer of the Company, certify, pursuant to 18 U.S.C. § 1350, as adopted pursuant to § 906 of theSarbanes-Oxley Act of 2002, that:
1. The Report fully complies with the requirements of section 13(a) or 15(d) of the SecuritiesExchange Act of 1934; and
2. The information contained in the Report fairly presents, in all material respects, the financialcondition and results of operations of the Company.
Date: March 24, 2005
By: /s/ DAVID J. NOBLE
D.J. Noble, Chief Executive Officer (Principal ExecutiveOfficer)

Exhibit 32.2
CERTIFICATION PURSUANT TO18 U.S.C. SECTION 1350,
AS ADOPTED PURSUANT TOSECTION 906 OF THE SARBANES-OXLEY ACT OF 2002
In connection with the Annual Report of American Equity Investment Life Holding Company (the‘‘Company’’) on Form 10-K/A for the fiscal year ended December 31, 2004 as filed with the Securitiesand Exchange Commission on the date hereof (the ‘‘Report’’), I, Wendy L. Carlson, Chief FinancialOfficer of the Company, certify, pursuant to 18 U.S.C. § 1350, as adopted pursuant to § 906 of theSarbanes-Oxley Act of 2002, that:
1. The Report fully complies with the requirements of section 13(a) or 15(d) of the SecuritiesExchange Act of 1934; and
2. The information contained in the Report fairly presents, in all material respects, the financialcondition and results of operations of the Company.
Date: March 24, 2005
By: /s/ WENDY L. CARLSON
Wendy L. Carlson, Chief Financial Officer (PrincipalFinancial Officer)

AMERICAN EQUITY succeeds by adhering to the guiding
principles that distinguish us in our industry. Summed up in
three words—People, Service and Future—these principles
serve as constant reminders of why we’re here and how
we work together in fulfilling our common goals.

A M E R I C A N E Q U I T Y I N V E S T M E N T L I F E H O L D I N G C O M P A N Y
2 0 0 4 A N N U A L R E P O R T & F O R M 1 0 - K A
5 0 0 0 W E S T O W N P A R K W AY, S U I T E 4 4 0
W E S T D E S M O I N E S , I O W A 5 0 2 6 6
5 1 5 . 2 2 1 . 0 0 0 2 � 8 8 8 . 2 2 1 . 1 2 3 4
w w w . a m e r i c a n - e q u i t y . c o m