Embed Size (px)
Citation preview
Copyright 2014, Academy of Nutrition and Dietetics. All rights reserved. No part of this publication may be reproduced, stored in a retrieval system, or transmitted in any form or by any means without the prior written consent of the publisher. Printed in the United States of America.
The views expressed in this publication are those of the authors and do not necessarily reflect policies and/or official positions of the Academy of Nutrition and Dietetics. Mention of product names in this publication does not constitute endorsement by the authors or the Academy of Nutrition and Dietetics. The Academy of Nutrition and Dietetics disclaims responsibility for the application of the information contained herein.
ISBN 978-0-88091-480-2
10 9 8 7 6 5 4 3 2 1
For more information on the Academy of Nutrition and Dietetics, visit: www.eatright.org
Preface
Over the years, the Academy of Nutrition and Dietetics (the Academy, formerly the American Dietetic Association) has received many requests from members for objective, reliable information about industry norms for pay and benefit levels for the dietetics profession. Database surveys have been periodically conducted, providing generalized salary information for the major dietetics practice areas. However, many wanted more specific information, and the concept of a salary survey by specific job title was suggested by members at the association’s Food & Nutrition Conference & Expo in St. Louis, Missouri, in October 2001. A Salary Survey Work Group was formed shortly thereafter, with the Group’s work culminating in the first Compensation & Benefits Survey, mailed in summer 2002. The ensuing report provided the most authoritative source ever for data on salaries, benefits, and work settings for core jobs in dietetics.
To continue to provide this valuable resource to the profession, the Academy has funded updates of that original extensive survey in 2005, 2007, 2009, 2011, and now in 2013. To make this valuable resource even more accessible to practitioners, this full edition is available for purchase and download at www.eatright.org/salarysurvey (free to Academy members, for purchase to nonmembers). The package includes access to interactive salary calculation worksheets for both RDs and DTRs, offering users an estimation of what professionals with similar characteristics and similar situations earn, on average.
To facilitate trending, the 2013 survey questionnaire is essentially identical to 2011.
Current plans are for this survey to be conducted on a biennial basis. This authoritative source of data on salaries, benefits, and work settings will be an asset to professionals and their employers in all major dietetics practice settings, in addition to providing reference material for self-employed dietetics professionals.
Preface iii


Acknowledgments
The Academy of Nutrition and Dietetics wishes to thank the 9,058 Academy members and dietetics practitioners who responded to the compensation and benefits survey. Additional thanks go to Betsy Hornick, MS, RD, who worked in a consultant capacity to help develop the job titles and descriptors that were fundamental to the compensation and benefits surveys since 2002, and to edit the final manuscript.
Acknowledgments v


Contents
1. Executive Summary ..............................................................................................................................1
2. Overview of Survey Results
Methodology ............................................................................................................................................5
Dietetics Employment ..............................................................................................................................6
Practitioner Profile....................................................................................................................................7
Employers.................................................................................................................................................9
Positions Held.........................................................................................................................................10
Position Characteristics ..........................................................................................................................11
RD Compensation ..................................................................................................................................12
DTR Compensation ................................................................................................................................21
Compensation by Position ......................................................................................................................29
Benefits...................................................................................................................................................32
Conclusion..............................................................................................................................................35
3. RD Compensation
Notes.......................................................................................................................................................37
Compensation by:
2013 Versus 2011 ............................................................................................................................38
Years in Field ..................................................................................................................................38
Years in Position .............................................................................................................................39
Prior Career .....................................................................................................................................39
Education (Highest Degree Held) ...................................................................................................40
Education and Years in Field ..........................................................................................................40
Highest Dietetics Degree.................................................................................................................41
Highest Dietetics Degree at Registration.........................................................................................41
Highest Dietetics Degree at Registration and Years in Field ..........................................................42
Credentials Held ..............................................................................................................................43
Academy Membership ....................................................................................................................44
Practice Area of Primary Position ...................................................................................................44
Practice Area and Years in Field .....................................................................................................45
Practice Area and Education ...........................................................................................................47
Work Setting ...................................................................................................................................48
Employment Sector .........................................................................................................................49
Organization Size ...........................................................................................................................49
Primary Position ..............................................................................................................................50
Responsibility Level........................................................................................................................52
Number Supervised .........................................................................................................................52
Budget Responsibility .....................................................................................................................53
Patient/Client Responsibility ...........................................................................................................53
RD Requirement..............................................................................................................................54
State Licensure Requirement...........................................................................................................54
Pay Basis .........................................................................................................................................54
Contents vii
3. RD Compensation (continued)
Compensation by:
Full Time Status .............................................................................................................................. 55
Eligibility for Overtime Compensation ........................................................................................... 55
Benefits Level ................................................................................................................................. 55
Location (Census Division)............................................................................................................. 56
Location (State)............................................................................................................................... 56
Location (Metro Area) .................................................................................................................... 58
4. DTR Compensation
Notes ...................................................................................................................................................... 61
Compensation by:
2013 Versus 2011 ........................................................................................................................... 62
Years in Field .................................................................................................................................. 62
Years in Position ............................................................................................................................. 63
Prior Career ..................................................................................................................................... 63
Education (Highest Degree Held) ................................................................................................... 64
Education and Years in Field .......................................................................................................... 64
Highest Dietetics Degree ................................................................................................................ 65
Highest Dietetics Degree at Registration ........................................................................................ 65
Highest Dietetics Degree at Registration and Years in Field .......................................................... 66
Credentials Held.............................................................................................................................. 67
Academy Membership .................................................................................................................... 68
Practice Area of Primary Position ................................................................................................... 68
Practice Area and Years in Field..................................................................................................... 69
Practice Area and Education ........................................................................................................... 71
Work Setting ................................................................................................................................... 72
Employment Sector ......................................................................................................................... 73
Organization Size ............................................................................................................................ 73
Primary Position.............................................................................................................................. 74
Responsibility Level ....................................................................................................................... 75
Number Supervised......................................................................................................................... 75
Budget Responsibility ..................................................................................................................... 76
Patient/Client Responsibility........................................................................................................... 76
DTR Requirement ........................................................................................................................... 77
State Licensure Requirement .......................................................................................................... 77
Pay Basis ......................................................................................................................................... 77
Full Time Status .............................................................................................................................. 78
Eligibility for Overtime Compensation ........................................................................................... 78
Benefits Level ................................................................................................................................. 78
Location (Census Division)............................................................................................................. 79
Location (Selected States)............................................................................................................... 79
Location (Selected Metro Areas) .................................................................................................... 80
Compensation & Benefits Survey of the Dietetics Profession 2013 viii
5. Compensation by Position broken out by 2013 versus 2011, years in field, years in position, education, credentials held, employment sector, and responsibilities
Notes.......................................................................................................................................................81
Clinical Nutrition – Acute Care/Inpatient
Dietetic Technician, Clinical ...........................................................................................................82
Clinical Dietitian .............................................................................................................................83
Clinical Dietitian, Specialist – Bariatrics ........................................................................................84
Clinical Dietitian, Specialist – Diabetes ..........................................................................................85
Clinical Dietitian, Specialist – Eating Disorders .............................................................................86
Clinical Dietitian, Specialist – Oncology ........................................................................................87
Clinical Dietitian, Specialist – Psychiatric ......................................................................................88
Clinical Dietitian, Specialist – Renal...............................................................................................89
Clinical Dietitian, Specialist – Other ...............................................................................................90
Pediatric/Neonatal Dietitian ............................................................................................................91
Nutrition Support Dietitian..............................................................................................................92
Clinical Nutrition – Ambulatory Care
Outpatient Dietitian, General ..........................................................................................................93
Outpatient Dietitian, Specialist – Diabetes ......................................................................................94
Outpatient Dietitian, Specialist – Oncology ....................................................................................95
Outpatient Dietitian, Specialist – Pediatrics ....................................................................................96
Outpatient Dietitian, Specialist – Renal ..........................................................................................97
Outpatient Dietitian, Specialist – Weight Management ..................................................................98
Outpatient Dietitian, Specialist – Other...........................................................................................99
Home Care Dietitian......................................................................................................................100
Clinical Nutrition – Long Term Care
Clinical Dietitian, Long Term Care ...............................................................................................101
Dietetic Technician, Long Term Care ...........................................................................................102
Community
WIC Nutritionist............................................................................................................................103
Public Health Nutritionist..............................................................................................................104
Cooperative Extension Educator/Specialist...................................................................................105
School/Child Care Nutritionist ......................................................................................................106
Corrections Dietitian ......................................................................... [insufficient data, not reported]
Nutrition Coordinator for Head Start Program ..............................................................................107
Nutritionist for Food Bank or Assistance Program .......................................................................108
Contents ix

5. Compensation by Position (continued) broken out by 2013 versus 2011, years in field, years in position, education, credentials held, employment sector, and responsibilities
Food and Nutrition Management
Executive-level Professional ......................................................................................................... 109
Director of Food and Nutrition Services ....................................................................................... 110
Director of Clinical Nutrition ........................................................................................................ 111
Clinical Nutrition Manager ........................................................................................................... 112
Assistant Foodservice Director .................................................................................................... 113
School Foodservice Director ......................................................................................................... 114
Dietetic Technician, Foodservice Management ............................................................................ 115
Consultation and Business
Private Practice Dietitian – Patient/Client Nutrition Care............................................................. 116
Consultant – Community and/or Corporate Programs .................................................................. 117
Consultant – Communications ...................................................................................................... 118
Sales Representative ..................................................................................................................... 119
Public Relations and/or Marketing Professional ........................................................................... 120
Corporate Dietitian........................................................................................................................ 121
Research & Development Nutritionist .......................................................................................... 122
Manager of Nutrition Communications ............................................ [insufficient data, not reported]
Director of Nutrition ..................................................................................................................... 123
Education and Research
Instructor/Lecturer ........................................................................................................................ 124
Assistant Professor ........................................................................................................................ 125
Associate Professor ....................................................................................................................... 126
Professor ....................................................................................................................................... 127
Administrator, Higher Education ...................................................... [insufficient data, not reported]
Didactic Program Director ............................................................................................................ 128
Dietetic Internship Director........................................................................................................... 129
Research Dietitian ......................................................................................................................... 130
Compensation & Benefits Survey of the Dietetics Profession 2013 x

6. Benefits
Notes.....................................................................................................................................................131
Retirement Benefits by:
Registration Status and Full-Time Status ......................................................................................132
Employment Sector and Organization Size ...................................................................................133
Work Setting (1)............................................................................................................................134
Work Setting (2)............................................................................................................................135
Location (Census Division) ...........................................................................................................136
Insurance Benefits by:
Registration Status and Full-Time Status ......................................................................................137
Employment Sector and Organization Size ...................................................................................140
Work Setting (1)............................................................................................................................143
Work Setting (2)............................................................................................................................146
Location (Census Division) ...........................................................................................................149
Other Benefits by:
Registration Status and Full-Time Status ......................................................................................152
Employment Sector and Organization Size ...................................................................................155
Work Setting (1)............................................................................................................................158
Work Setting (2)............................................................................................................................161
Location (Census Division) ...........................................................................................................164
Benefits Level by:
Registration Status and Full-Time Status ......................................................................................167
Employment Sector and Organization Size ...................................................................................168
Work Setting (1)............................................................................................................................169
Work Setting (2)............................................................................................................................170
Location (Census Division) ...........................................................................................................171
Contents xi

7. Respondent Profile results by practitioner status and registration status
Notes .................................................................................................................................................... 173
Employment Status .............................................................................................................................. 174
Job Loss................................................................................................................................................ 174
Reason(s) for Non-Employment in Dietetics .......................................................................................175
Demographic Characteristics
Gender........................................................................................................................................... 176
Age ................................................................................................................................................ 177
Heritage/Race................................................................................................................................ 178
Professional Qualifications
Education (Highest Degree Held) .................................................................................................179
Highest Nutrition/Dietetics Degree ............................................................................................... 180
Highest Nutrition/Dietetics Degree at Registration....................................................................... 181
Year of First Employment in Dietetics ......................................................................................... 182
Years in Field ................................................................................................................................ 183
Prior Career ................................................................................................................................... 184
Registration Status ........................................................................................................................ 184
Credentials Held............................................................................................................................ 185
Academy Membership .................................................................................................................. 187
Employment Situation
Employment Sector ....................................................................................................................... 188
Work Setting ................................................................................................................................. 189
Work Location (Census Division).................................................................................................191
Organization Size .......................................................................................................................... 192
Position
Practice Area of Primary Position ................................................................................................. 193
Primary Position............................................................................................................................ 194
Responsibility Level ..................................................................................................................... 200
Number Supervised....................................................................................................................... 201
Budget Responsibility ................................................................................................................... 202
Nutritional Risk of Patients/Clients Seen ...................................................................................... 203
Registration Requirements ............................................................................................................ 204
State Licensure/Certification Requirement ................................................................................... 205
Years in Position ........................................................................................................................... 206
Eligibility to Receive Overtime Compensation............................................................................. 207
Benefits Level ............................................................................................................................... 208
Position Pay Base: Hours Per Week ............................................................................................ 209
Position Pay Base: Weeks Per Year ............................................................................................. 210
Position Pay Base: Hours Per Year ..............................................................................................211
Position Pay Base: Incidence of Full-Time Employment ............................................................ 212
Compensation & Benefits Survey of the Dietetics Profession 2013 xii
8. Appendix
Methodological Notes ..........................................................................................................................213
Geographic Definitions ........................................................................................................................215
Statistical Glossary ...............................................................................................................................216
Title Index: Compensation by Position ................................................................................................217
Position Descriptions ............................................................................................................................219
Questionnaire........................................................................................................................................221
Response Form .....................................................................................................................................225
Contents xiii

1. Executive Summary
Continuing to serve the profession's needs, the Academy of Nutrition and Dietetics ("the Academy," formerly the American Dietetic Association) has completed the sixth administration of the landmark survey on compensation and benefits in the dietetics profession that was first executed in 2002.
Methodology
The 2013 survey was conducted across a probability sample drawn from the population of all domestic active category Academy members (N = 53,113) plus all domestic nonmembers (N = 37,229) maintaining current registration as a Registered Dietitian (RD) or Dietetic Technician, Registered (DTR). To preserve confidentiality of response, an outside research firm was contracted to collect survey data via the mail and the Internet. Data was collected from June 6 through August 5, 2013.
The 2013 survey carries forward a key feature of prior efforts, presenting results not only at the level of registration (RD, DTR) or in the context of various practice areas, but also in terms of the specific jobs (including nontraditional jobs) dietetics professionals hold. Compensation data are thus now available for the specific jobs that account for an estimated 93% of dietetics employment.
From the sample of 30,000, 9,058 usable responses were received – a 30% response rate. The strong response rate, and the large number of overall responses, makes this continuing series the most exhaustive investigation available of compensation in the dietetics profession.
Dietetics Employment
18% of respondents reported they are not currently employed or self-employed in a dietetics-related position. Most survey results reflect the 7,469 respondents who indicated they are currently working in the profession – "practitioners."
Practitioner Profile
95% of practitioners are female. Median age is 46 years; 29% are 55 or older, and 26% are under 35. 4% indicated they are of Hispanic heritage; 9% indicated a race other than White (5% Asian, 3% Black/African American, and 1% other).
47% of practicing RDs hold master's degrees, and 4% doctoral degrees, as their highest level of attainment. Among practicing DTRs, 39% hold a bachelor's degree or higher.
67% of practicing RDs are members of the Academy, as are 40% of practicing DTRs. 44% of RDs and 5% of DTRs reported holding a state license/ certification (not required in all states). 21% of RDs and 11% of DTRs hold one or more of the specialty certifications asked about (e.g., CDE, CNSC, CSP, CDM, and CFFP).
The typical (median) RD practitioner has 16 years of work experience in dietetics/nutrition (excluding time taken off to return to school, raise a family, or work in other areas); the typical DTR practitioner has 18 years experience.
Employers
7% of practitioners are self-employed (primarily RDs); 30% work for a for-profit firm, 38% for a non-profit, and 19% for the government.
The most common work setting for RDs is an inpatient acute-care facility (24%). 12% report working in an ambulatory/outpatient care facility (e.g., clinic, physician's office, etc.), followed by long-term, extended care, or assisted living facility (e.g., nursing home), at 10%.
The majority of DTRs work in one of two settings: an inpatient acute-care facility (33%) or a long-term, extended care, or assisted living facility (27%). No other setting was indicated by more than 8%.
Positions Held
Based on their selection of one most closely matching core position, dietetics practitioners are
Executive Summary 1
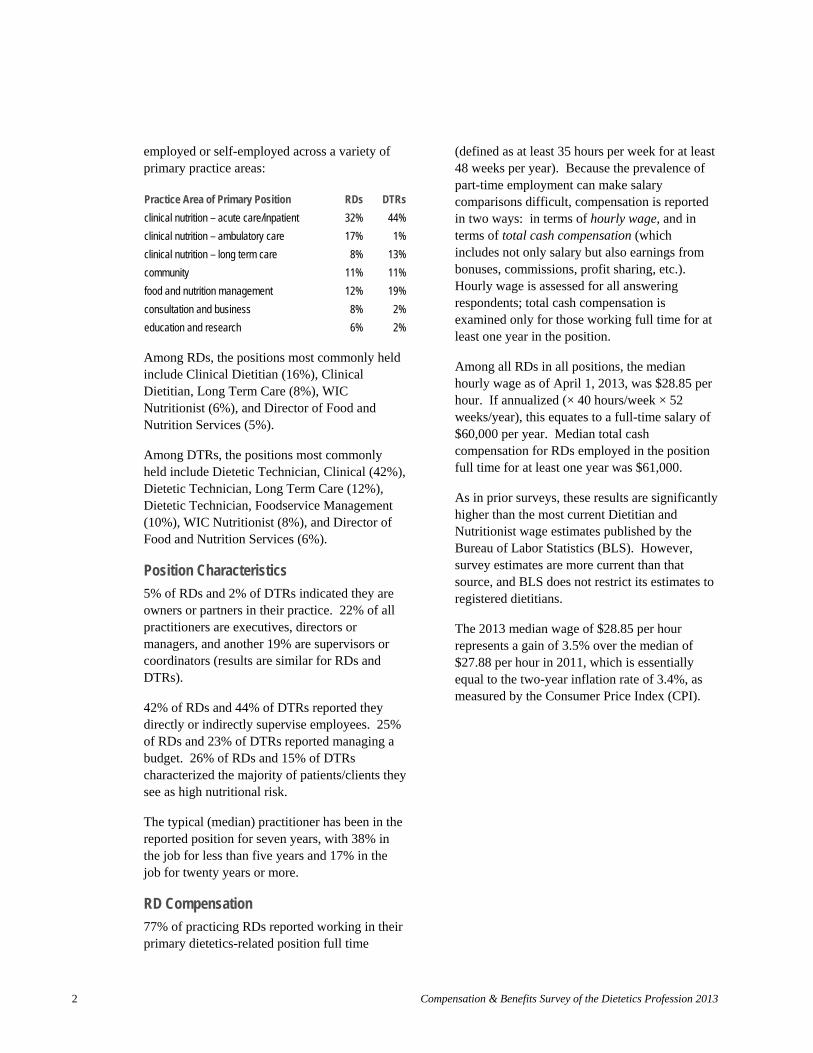
employed or self-employed across a variety of primary practice areas:
Practice Area of Primary Position RDs DTRs
clinical nutrition – acute care/inpatient 32% 44%
clinical nutrition – ambulatory care 17% 1%
clinical nutrition – long term care 8% 13%
community 11% 11%
food and nutrition management 12% 19%
consultation and business 8% 2%
education and research 6% 2%
Among RDs, the positions most commonly held include Clinical Dietitian (16%), Clinical Dietitian, Long Term Care (8%), WIC Nutritionist (6%), and Director of Food and Nutrition Services (5%).
Among DTRs, the positions most commonly held include Dietetic Technician, Clinical (42%), Dietetic Technician, Long Term Care (12%), Dietetic Technician, Foodservice Management (10%), WIC Nutritionist (8%), and Director of Food and Nutrition Services (6%).
Position Characteristics
5% of RDs and 2% of DTRs indicated they are owners or partners in their practice. 22% of all practitioners are executives, directors or managers, and another 19% are supervisors or coordinators (results are similar for RDs and DTRs).
42% of RDs and 44% of DTRs reported they directly or indirectly supervise employees. 25% of RDs and 23% of DTRs reported managing a budget. 26% of RDs and 15% of DTRs characterized the majority of patients/clients they see as high nutritional risk.
The typical (median) practitioner has been in the reported position for seven years, with 38% in the job for less than five years and 17% in the job for twenty years or more.
RD Compensation
77% of practicing RDs reported working in their primary dietetics-related position full time
(defined as at least 35 hours per week for at least 48 weeks per year). Because the prevalence of part-time employment can make salary comparisons difficult, compensation is reported in two ways: in terms of hourly wage, and in terms of total cash compensation (which includes not only salary but also earnings from bonuses, commissions, profit sharing, etc.). Hourly wage is assessed for all answering respondents; total cash compensation is examined only for those working full time for at least one year in the position.
Among all RDs in all positions, the median hourly wage as of April 1, 2013, was $28.85 per hour. If annualized (× 40 hours/week × 52 weeks/year), this equates to a full-time salary of $60,000 per year. Median total cash compensation for RDs employed in the position full time for at least one year was $61,000.
As in prior surveys, these results are significantly higher than the most current Dietitian and Nutritionist wage estimates published by the Bureau of Labor Statistics (BLS). However, survey estimates are more current than that source, and BLS does not restrict its estimates to registered dietitians.
The 2013 median wage of $28.85 per hour represents a gain of 3.5% over the median of $27.88 per hour in 2011, which is essentially equal to the two-year inflation rate of 3.4%, as measured by the Consumer Price Index (CPI).
Compensation & Benefits Survey of the Dietetics Profession 2013 2

Of interest is the range of RD compensation:
hourly wage
total cash
10th percentile (10% earn less) $20.43 $43,000
25th percentile (25% earn less) $24.04 $50,200
50th percentile (50% earn less) $28.85 $61,000
75th percentile (75% earn less) $34.86 $75,000
90th percentile (90% earn less) $43.27 $92,700
Factors showing the strongest association with compensation levels for RDs include number of years of experience, level of supervisory responsibility, budget responsibility, and practice area: clinical and community positions tend to pay less, whereas business, management, education, and research positions pay more.
The highest-paying non-academic positions held by substantial numbers of RDs include:
median median hourly total
wage cash
Executive-level Professional $44.23 $97,500
Director of Food and Nutrition $36.06 $75,000 Services
Director of Clinical Nutrition $36.06 $75,000
Sales Representative $36.06 $93,500
Clinical Nutrition Manager $33.65 $72,000
Director of Nutrition $33.53 $69,800
School Foodservice Director $31.87 $69,000
Corporate Dietitian $31.25 $65,500
Home Care Dietitian $31.09 $65,100
Assistant Foodservice Director $30.29 $66,000
DTR Compensation
85% of DTRs reported working in their primary dietetics-related position full time (at least 35 hours per week, at least 48 weeks per year).
Among all DTRs in all positions, the median hourly wage as of April 1, 2013, was $19.23 per hour; if annualized, this equates to a salary of $40,000 per year.
Median total cash compensation for DTRs employed in the position full time for at least one year was $40,000.
The 2013 median wage of $19.23 per hour represents no change from 2011, trailing the 3.4% inflation rate (CPI).
DTR compensation also spans a considerable range:
hourly wage
total cash
10th percentile (10% earn less) $13.67 $29,500
25th percentile (25% earn less) $16.30 $34,600
50th percentile (50% earn less) $19.23 $40,000
75th percentile (75% earn less) $23.08 $50,000
90th percentile (90% earn less) $28.65 $60,000
Factors showing the strongest association with compensation levels for DTRs include number of years of experience, supervisory and budget responsibility, and practice area (on average, community positions receive lower compensation than others).
A wide range of compensation exists for the five positions held by substantial numbers of DTRs:
median median hourly total wage cash
Director of Food and Nutrition $36.06 $75,000 Services
WIC Nutritionist $24.04 $49,500
Dietetic Technician, Foodservice $19.23 $44,800 Management
Dietetic Technician, Long Term $19.23 $40,600 Care
Dietetic Technician, Clinical $19.23 $40,000
Compensation By Position
Positions showing the greatest percentage gains in median wage since 2011, each outpacing the rate of inflation, were Research Dietitian; Outpatient Dietitian; Specialist - Weight Management; WIC Nutritionist; Clinical Dietitian; Outpatient Dietitian, Specialist - Renal; Director of Food and Nutrition Services; Private Practice Dietitian - Patient/Client Nutrition Care; Outpatient Dietitian, General;
Executive Summary 3

Dietetic Technician, Clinical; Outpatient Dietitian, Specialist - Diabetes; and Pediatric/Neonatal Dietitian.
Benefits
Dietetics practitioners as a whole are offered a variety of benefits through their work:
% offered
NET: any retirement benefit 83%
defined benefit retirement plan (pension) 25%
defined contribution plan 72%
life insurance 78%
disability insurance (long- and/or short-term) 74%
accidental death & dismemberment AD&D) 63%
long-term care insurance 44%
business travel insurance 17%
high deductible medical insurance - 54% for employees
high deductible medical insurance - 52% for dependents
lower deductible medical insurance or managed 66% care plan - for employees
lower deductible medical insurance or managed 64% care plan - for dependents
dental insurance or group plan - for employees 81%
dental insurance or group plan - for dependents 77%
prescription drug benefit 73%
vision insurance or group plan 75%
healthcare reimbursement or flexible spending 69%account
retiree medical coverage 29%
NET: paid time off 85%
NET: benefits related to professional/career development 73%
NET: other benefits related to quality of work life 88%
NET indicates selection of one or more items in category
Future Surveys
Current plans are for this survey to be conducted on a biennial basis. This authoritative source of data on salaries, benefits and work settings should prove to be an asset to professionals and their employers in all major dietetics practice settings, as well as providing reference material for self-employed dietetics practitioners.
Compensation & Benefits Survey of the Dietetics Profession 2013 4
--------------------------------------------------------------
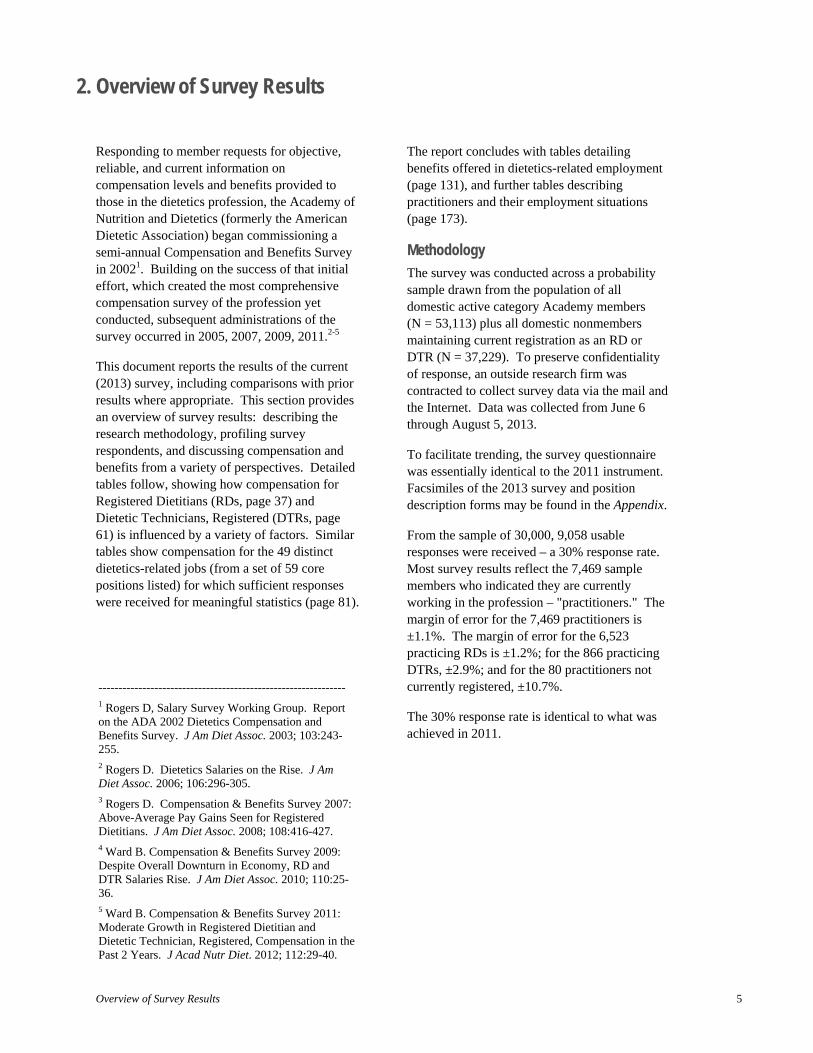
2. Overview of Survey Results
Responding to member requests for objective, reliable, and current information on compensation levels and benefits provided to those in the dietetics profession, the Academy of Nutrition and Dietetics (formerly the American Dietetic Association) began commissioning a semi-annual Compensation and Benefits Survey in 20021 . Building on the success of that initial effort, which created the most comprehensive compensation survey of the profession yet conducted, subsequent administrations of the survey occurred in 2005, 2007, 2009, 2011.2-5
This document reports the results of the current (2013) survey, including comparisons with prior results where appropriate. This section provides an overview of survey results: describing the research methodology, profiling survey respondents, and discussing compensation and benefits from a variety of perspectives. Detailed tables follow, showing how compensation for Registered Dietitians (RDs, page 37) and Dietetic Technicians, Registered (DTRs, page 61) is influenced by a variety of factors. Similar tables show compensation for the 49 distinct dietetics-related jobs (from a set of 59 core positions listed) for which sufficient responses were received for meaningful statistics (page 81).
1 Rogers D, Salary Survey Working Group. Report on the ADA 2002 Dietetics Compensation and Benefits Survey. J Am Diet Assoc. 2003; 103:243255. 2 Rogers D. Dietetics Salaries on the Rise. J Am Diet Assoc. 2006; 106:296-305. 3 Rogers D. Compensation & Benefits Survey 2007: Above-Average Pay Gains Seen for Registered Dietitians. J Am Diet Assoc. 2008; 108:416-427. 4 Ward B. Compensation & Benefits Survey 2009: Despite Overall Downturn in Economy, RD and DTR Salaries Rise. J Am Diet Assoc. 2010; 110:2536. 5 Ward B. Compensation & Benefits Survey 2011: Moderate Growth in Registered Dietitian andDietetic Technician, Registered, Compensation in thePast 2 Years. J Acad Nutr Diet. 2012; 112:29-40.
The report concludes with tables detailing benefits offered in dietetics-related employment (page 131), and further tables describing practitioners and their employment situations (page 173).
Methodology
The survey was conducted across a probability sample drawn from the population of all domestic active category Academy members (N = 53,113) plus all domestic nonmembers maintaining current registration as an RD or DTR (N = 37,229). To preserve confidentiality of response, an outside research firm was contracted to collect survey data via the mail and the Internet. Data was collected from June 6 through August 5, 2013.
To facilitate trending, the survey questionnaire was essentially identical to the 2011 instrument. Facsimiles of the 2013 survey and position description forms may be found in the Appendix.
From the sample of 30,000, 9,058 usable responses were received – a 30% response rate. Most survey results reflect the 7,469 sample members who indicated they are currently working in the profession – "practitioners." The margin of error for the 7,469 practitioners is ±1.1%. The margin of error for the 6,523 practicing RDs is ±1.2%; for the 866 practicing DTRs, ±2.9%; and for the 80 practitioners not currently registered, ±10.7%.
The 30% response rate is identical to what was achieved in 2011.
Overview of Survey Results 5
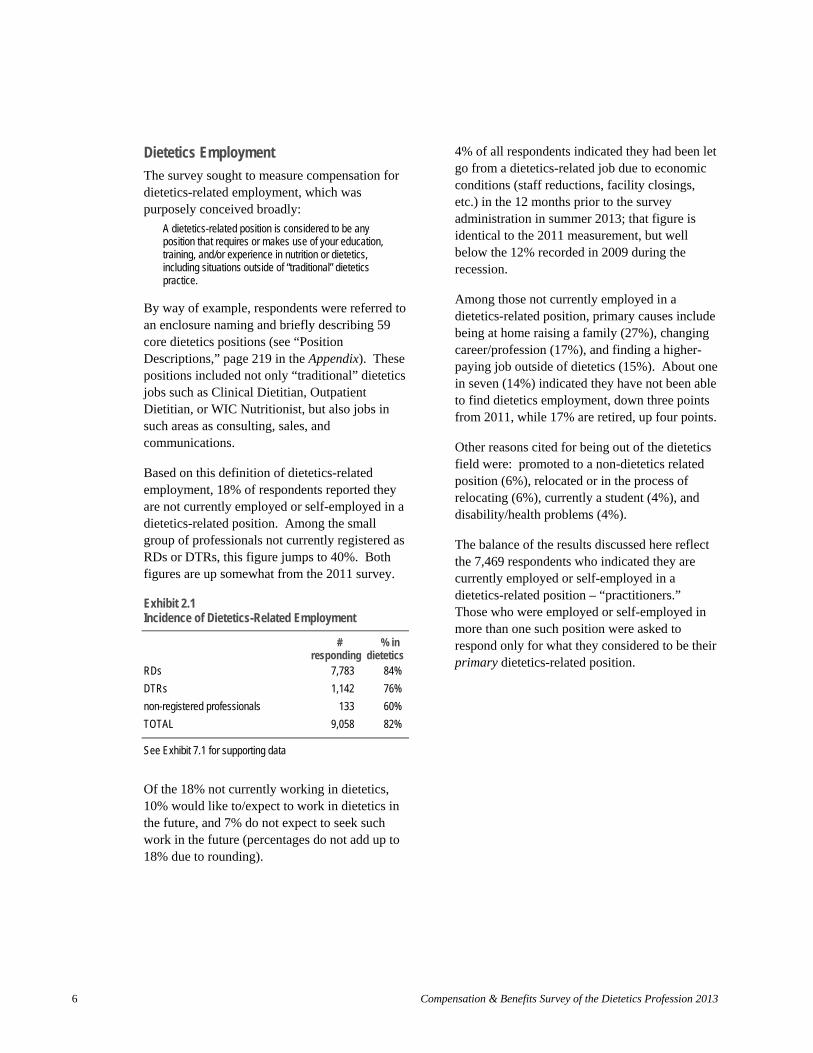
Dietetics Employment
The survey sought to measure compensation for dietetics-related employment, which was purposely conceived broadly:
A dietetics-related position is considered to be any position that requires or makes use of your education, training, and/or experience in nutrition or dietetics, including situations outside of “traditional” dietetics practice.
By way of example, respondents were referred to an enclosure naming and briefly describing 59 core dietetics positions (see “Position Descriptions,” page 219 in the Appendix). These positions included not only “traditional” dietetics jobs such as Clinical Dietitian, Outpatient Dietitian, or WIC Nutritionist, but also jobs in such areas as consulting, sales, and communications.
Based on this definition of dietetics-related employment, 18% of respondents reported they are not currently employed or self-employed in a dietetics-related position. Among the small group of professionals not currently registered as RDs or DTRs, this figure jumps to 40%. Both figures are up somewhat from the 2011 survey.
Exhibit 2.1 Incidence of Dietetics-Related Employment
# % in responding dietetics
RDs 7,783 84%
DTRs 1,142 76%
non-registered professionals 133 60%
TOTAL 9,058 82%
See Exhibit 7.1 for supporting data
Of the 18% not currently working in dietetics, 10% would like to/expect to work in dietetics in the future, and 7% do not expect to seek such work in the future (percentages do not add up to 18% due to rounding).
4% of all respondents indicated they had been let go from a dietetics-related job due to economic conditions (staff reductions, facility closings, etc.) in the 12 months prior to the survey administration in summer 2013; that figure is identical to the 2011 measurement, but well below the 12% recorded in 2009 during the recession.
Among those not currently employed in a dietetics-related position, primary causes include being at home raising a family (27%), changing career/profession (17%), and finding a higher-paying job outside of dietetics (15%). About one in seven (14%) indicated they have not been able to find dietetics employment, down three points from 2011, while 17% are retired, up four points.
Other reasons cited for being out of the dietetics field were: promoted to a non-dietetics related position (6%), relocated or in the process of relocating (6%), currently a student (4%), and disability/health problems (4%).
The balance of the results discussed here reflect the 7,469 respondents who indicated they are currently employed or self-employed in a dietetics-related position – “practitioners.” Those who were employed or self-employed in more than one such position were asked to respond only for what they considered to be their primary dietetics-related position.
Compensation & Benefits Survey of the Dietetics Profession 2013 6
Practitioner Profile
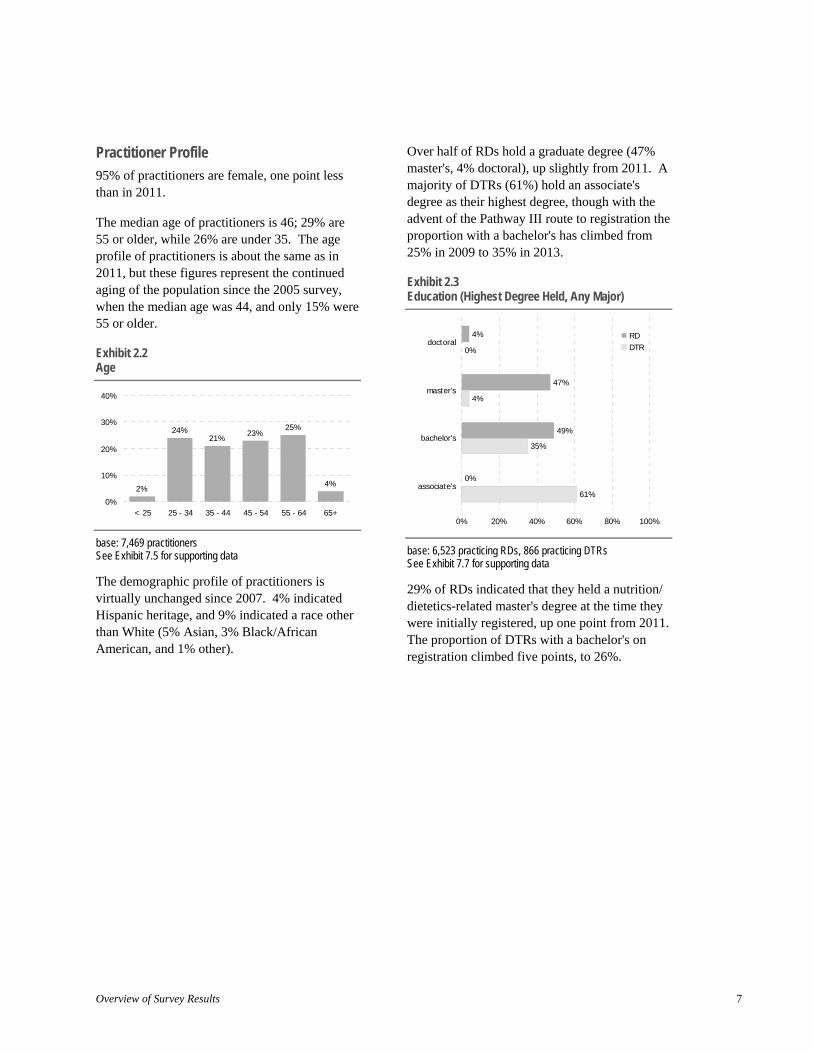
95% of practitioners are female, one point less than in 2011.
The median age of practitioners is 46; 29% are 55 or older, while 26% are under 35. The age profile of practitioners is about the same as in 2011, but these figures represent the continued aging of the population since the 2005 survey, when the median age was 44, and only 15% were 55 or older.
Exhibit 2.2 Age
40%
30%
20%
10%
0%
25%24% 23%21%
4%2%
< 25 25 - 34 35 - 44 45 - 54 55 - 64 65+
base: 7,469 practitioners See Exhibit 7.5 for supporting data
The demographic profile of practitioners is virtually unchanged since 2007. 4% indicated Hispanic heritage, and 9% indicated a race other than White (5% Asian, 3% Black/African American, and 1% other).
Over half of RDs hold a graduate degree (47% master's, 4% doctoral), up slightly from 2011. A majority of DTRs (61%) hold an associate's degree as their highest degree, though with the advent of the Pathway III route to registration the proportion with a bachelor's has climbed from 25% in 2009 to 35% in 2013.
Exhibit 2.3 Education (Highest Degree Held, Any Major)
doctoral
master's
bachelor's
associate's
4%
47%
49%
0%
0%
4%
35%
RD DTR
61%
0% 20% 40% 60% 80% 100%
base: 6,523 practicing RDs, 866 practicing DTRs See Exhibit 7.7 for supporting data
29% of RDs indicated that they held a nutrition/ dietetics-related master's degree at the time they were initially registered, up one point from 2011. The proportion of DTRs with a bachelor's on registration climbed five points, to 26%.
Overview of Survey Results 7

67% of practicing RDs are members of the Academy, as are 40% of practicing DTRs.
44% of RDs reported holding a state license or certification. 5% of DTRs said they are state licensed/certified.
21% of RDs and 11% of DTRs indicated holding one or more of the 13 specialty certifications asked about, rates virtually unchanged since 2011.
Certifications selected by more than 1% of RDs include CDE (Certified Diabetes Educator, 10%), CNSC (Certified Nutrition Support Clinician, 6%), and CSP (Certified Specialist in Pediatric Nutrition, 2%).
Named by more than 1% of DTRs were CDM (Certified Dietary Manager, 9%) and CFPP (Certified Food Protection Professional, 5%).
Exhibit 2.4 Credentials
Academy member
state license
certifications
44%
21%
40%
5%
11%
67%
RD DTR
0% 20% 40% 60% 80% 100%
base: 6,523 practicing RDs, 866 practicing DTRs See Exhibits 7.14 and 7.15 for supporting data
The typical (median) RD reports 16 years of work experience in dietetics/nutrition (excluding time taken off to return to school, raise a family, or work in other areas); the median for DTRs is slightly higher, at 18 years. As with age, both values have remained about the same since 2011.
Exhibit 2.5 Years in Field
40%
30% 26% 22%
18% 20% 15% 15%
10% 3%
1% 0%
< 1 1 - 4 5 - 9 10 - 19 20 - 29 30 - 39 40+ year
base: 7,469 practitioners See Exhibit 7.11 for supporting data
Dietetics/nutrition is a second career of 13% of practicing RDs, and for more than one in five (22%) practicing DTRs.
Exhibit 2.6 Second Career
dietetics a second career
not a second career
13%
86%
22%
77%
RD DTR
0% 20% 40% 60% 80% 100%
base: 6,523 practicing RDs, 866 practicing DTRs See Exhibit 7.12 for supporting data
Compensation & Benefits Survey of the Dietetics Profession 2013 8

Employers
7% of practitioners are self-employed, 30% work at a for-profit firm, 38% at a non-profit, and 19% for government.
Self-employment is more common among RDs than DTRs (8% versus 3%, respectively), while a greater proportion of DTRs are found in nonprofit settings (38% of RDs, 45% of DTRs). These figures have not appreciably changed since the first study in 2002.
Exhibit 2.7 Employment Sector
for-profit 30%
non-profit 38%
gov't 19%
self-employed
7%
base: 7,469 practitioners See Exhibit 7.16 for supporting data
For RDs, the most common work setting, indicated by about one in four (24%), is an inpatient acute-care facility. 12% reported working in an ambulatory/outpatient care facility (e.g., clinic, physician's office, etc.), followed by long-term, extended care, or assisted living facility (e.g., nursing home), at 10%. These top three settings employ almost half of all practicing RDs. The other half work across numerous other settings, none indicated by more than 7%.
The majority of DTRs work in two settings: inpatient acute-care facilities (33%) or long-term, extended care, or assisted living facilities (27%). 8% work in a community or public health program. No other setting was indicated by more than 5%.
Exhibit 2.8 Work Setting - Top Mentions
acute -inpatient 33%
acute -outpatient
LTC/ extended/ assisted
ambulatory
community/public health
governmentagency/dept
RD faculty DTR
24%
6%
10%
12%
7%
6%
6%
1%
27%
1%
8%
5%
4%
0% 10% 20% 30% 40%
base: 6,523 practicing RDs, 866 practicing DTRs See Exhibit 7.17 for supporting data
Overview of Survey Results 9

The typical (median) practitioner works in a large organization, employing 1,219 people at all locations. RDs tend to work in larger organizations than DTRs (medians 1,403 and 631, respectively). These numbers have risen steadily for the last several surveys.
Exhibit 2.9 Organization Size Number of Employees, All Locations
40%
30% 27% 23%
20% 17%
10% 11% 11% 10%
0% < 10 10 - 99 100 - 999 1,000 - 5,000 - 25,000+
4,999 24,999
base: 7,469 practitioners See Exhibit 7.19 for supporting data
Positions Held
Respondents were asked to review a list of 59 core position titles and brief descriptions, and identify the one description that most closely matched their primary position, even if the job title differed from their own (see page 219 in Appendix for the full set of position descriptions).
93% of responding practitioners found a match; thus the compensation data reported here represents the vast majority of dietetics employment situations.
The 59 positions are grouped into seven distinct practice areas, with acute care/inpatient the most prevalent, and consultation/business and education/research the least.
Exhibit 2.10 Practice Area of Primary Position
RDs DTRs
clinical nutrition – acute care/inpatient 32% 44%
clinical nutrition – ambulatory care 17% 1%
clinical nutrition – long term care 8% 13%
community 11% 11%
food and nutrition management 12% 19%
consultation and business 8% 2%
education and research 6% 2%
base: 6,523 practicing RDs, 866 practicing DTRs See Exhibit 7.20 for supporting data
In results very similar to those seen in previous surveys, positions most commonly held by RDs include:
Exhibit 2.11 Highest Incidence Positions – RDs
Clinical Dietitian 16%
Clinical Dietitian, Specialist – Renal 3%
Pediatric/Neonatal Dietitian 3%
Nutrition Support Dietitian 3%
Outpatient Dietitian, General 4%
Outpatient Dietitian, Specialist – Diabetes 4%
Outpatient Dietitian, Specialist – Renal 3%
Clinical Dietitian, Long Term Care 8%
WIC Nutritionist 6%
Public Health Nutritionist 3%
Director of Food and Nutrition Services 5%
Clinical Nutrition Manager 3%
base: 6,523 practicing RDs See Exhibit 7.21 for supporting data
The fact that no position exceeds 16% is due to the wide distribution of RDs over the 59 core position titles listed.
Compensation & Benefits Survey of the Dietetics Profession 2013 10

Among DTRs, five positions account for most of the employment.
Exhibit 2.12 Highest Incidence Positions – DTRs
Dietetic Technician, Clinical 42%
Dietetic Technician, Long Term Care 12%
WIC Nutritionist 8%
Director of Food and Nutrition Services 6%
Dietetic Technician, Foodservice Management 10%
base: 866 practicing DTRs See Exhibit 7.21 for supporting data
Position Characteristics
5% of RDs and 2% of DTRs indicated they are owners of or partners in their practices.
22% of practitioners overall are executives, directors, or managers, and another 19% are supervisors or coordinators. Responsibility levels have changed little since the 2002 survey.
Exhibit 2.13 Responsibility Level
other53%
owner, partner
4%
19%
exec, dir, mgr supervisor 22%
base: 7,469 practitioners See Exhibit 7.22 for supporting data
42% of RDs and 44% of DTRs reported they directly or indirectly supervise employees, percentages similar to 2011. For those supervising, the median number supervised is eight for RDs, and 15 for DTRs.
Exhibit 2.14 Number Supervised
60% 57%
40%
20%
0% none 1 - 2 3 - 9 10 - 49 50+
base: 7,469 practitioners See Exhibit 7.23 for supporting data
25% of RDs and 23% of DTRs reported managing a budget, identical to results from two years ago. Median budget size is $374,000 for RDs and $293,000 for DTRs, with 11% of RDs and 8% of DTRs managing budgets of $500,000 or more.
Exhibit 2.15 Budget Responsibility
9% 12%
15%
5%
80% 74%
60%
40%
20%
0%
7% 7% 10%
none < $100K $100 - $499K $500K+
base: 7,469 practitioners See Exhibit 7.24 for supporting data
Overview of Survey Results 11

In results similar to those seen in 2011, one quarter (24%) of practitioners subjectively assess that a majority of their patients are high risk nutritionally, with about half (48%) indicating moderate risk, and 10% low or no risk. 16% do not work with patients/clients. RDs are more likely than DTRs to see a majority of high-risk patients/clients, 26% versus 15%.
Exhibit 2.16 Nutritional Risk of Patients/Clients Seen
high risk
moderate
low risk
do not see patients
26%
15%
47%
9%
15%
17% RD
12% DTR
56%
0% 20% 40% 60%
base: 7,469 practitioners See Exhibit 7.25 for supporting data
The typical practitioner has been in his or her primary dietetics position for seven years, with 38% in the job for less than five years, and 17% in the job for 20 years or more. The typical DTR has been in his/her position three years longer than the typical RD (ten years versus seven).
Exhibit 2.17 Years in Position
40% 33%
30%
20%
10%
0% < 1 year 1 - 2 3 - 9 10 - 19 20 - 29 30+
years
23% 23%
12%
4% 5%
base: 7,469 practitioners See Exhibit 7.28 for supporting data
83% of RDs indicated that registration is a requirement for their positions, and an additional 12% indicated it is preferred but not required. This compares to 52% of DTRs indicating registration is a requirement, and 26% indicating it is preferred.
Respondents were also asked if state licensure or certification is a requirement for their positions. 61% of RDs answered in the affirmative, as did 35% of DTRs.
RD Compensation
68% of RDs reported their pay was based on 40 hours per week or more, with an additional 13% indicating a pay base of between 30 and 37.5 hours per week. Nearly all (99%) of RDs indicated their positions are year-round (52 weeks).
For the purposes of this survey, full-time employment is defined as at least 35 hours per week for at least 48 weeks per year. By this definition, 77% of RDs are employed full time in 2013, up four points from 73% in 2009.
As in 2011, 18% of RDs are eligible to receive overtime compensation.
Exhibit 2.18 RD Pay Base
part-time 23%
full-time 77%
base: 6,048 practicing RDs See Exhibit 7.34 for supporting data
(Analyses of hours worked and compensation received are based on the subset of respondents providing complete information for all relevant questions.)
Compensation & Benefits Survey of the Dietetics Profession 2013 12

----------------------------------------------------------------
---------------------------------------------------------------
Because the prevalence of part-time employment can make salary comparisons difficult, compensation is reported in two ways: in terms of hourly wage, and in terms of total cash compensation (which includes not only salary but also earnings from overtime pay, on-call pay, commissions, bonuses, incentive pay, profit sharing or distributions, and cash retirement benefits received). Hourly wage is assessed for all answering respondents; total cash compensation is examined only for those working full time for at least one year in the position.
Among all RDs in all positions, the median hourly wage as of April 1, 2013, was $28.85. If annualized (× 40 hours/week × 52 weeks/year), this equates to a full-time salary of $60,000 per year. Median total cash compensation for RDs employed in the position full time for at least one year was $61,000.
These results are higher than the most current Bureau of Labor Statistics (BLS) estimates for Dietitians and Nutritionists, at $26.56 per hour, annualized at $55,2006 . Two factors help account for the discrepancy: this survey data is current as of April 1, 2013, nearly a year more current than the BLS estimate; and BLS does not restrict its estimate to registered dietitians.
At $28.85, the median hourly wage for all RDs is up 3.5% from its value of $27.88 in the 2011 survey.
Exhibit 2.19 RD Median Hourly Wage Trends
+3.5%
$27.24 $27.88 $28. 85
$25.48 $23.80
$22.00
2002 2005 2007 2009 2011 2013
base (2013): 6,048 practicing RDs
The 3.5% increase in median wage since 2011 bests the prior two-year gain of 2.3% reported in the last survey, and is essentially equal to the rate of inflation during the period (3.4% change in CPI from April 2011 to April 20137).
Further, an analysis of hourly wage estimates for 24 allied health occupations reported by the Bureau of Labor Statistics showed a 3.8% gain between May 2010 and May 20128 . Both of these comparisons suggest that RD compensation has essentially kept pace with the economy as a whole in the past two years.
6 U.S. Department of Labor, Bureau of Labor Statistics. Occupational Employment Statistics, May 2012: 29-1031 Dietitians and Nutritionists. www.bls.gov/oes/current/oes291031.htm. Accessed 08/31/2013.
7 U.S. Department of Labor, Bureau of Labor Statistics. Consumer Price Index - All Urban Consumers, ftp://ftp.bls.gov/pub/special.requests/ cpi/cpiai.txt. Accessed 08/31/2013. 8 U.S. Department of Labor, Bureau of Labor Statistics, Healthcare Practitioners and Technical Occupations, National Occupational Employment and Wage Estimates, www.bls.gov/oes/current/ oes_nat.htm#29-0000. Accessed 8/31/2013.
Overview of Survey Results 13
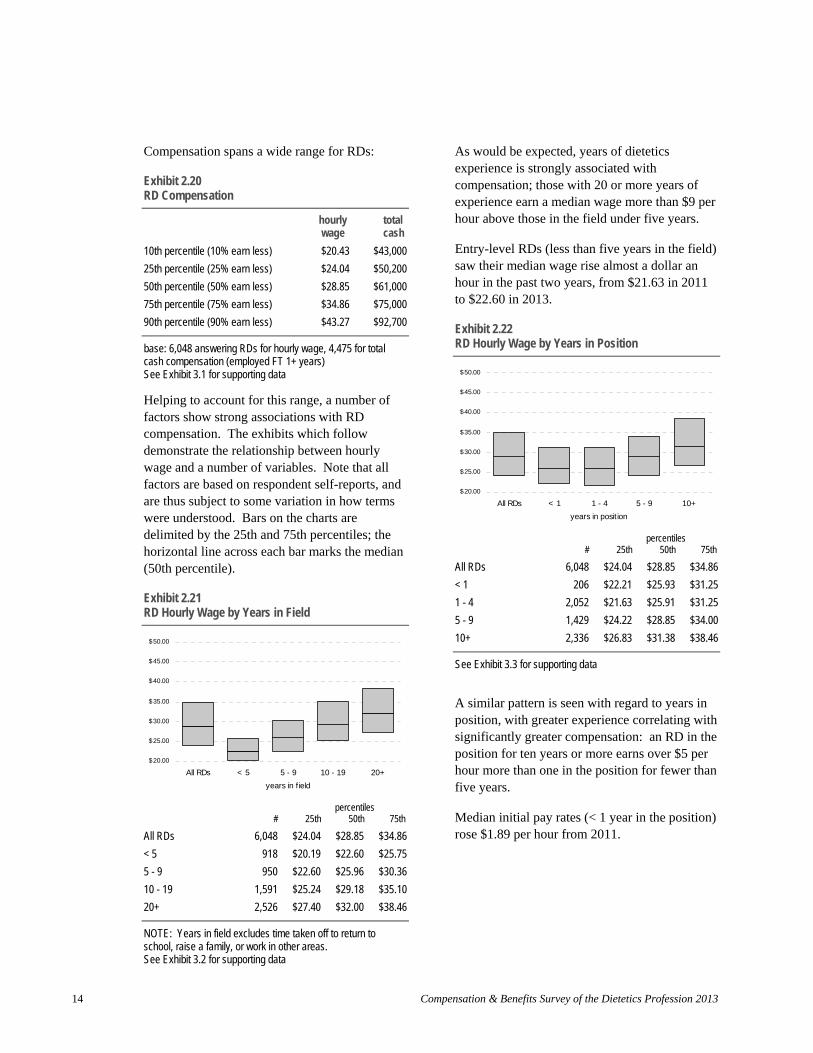
Compensation spans a wide range for RDs:
Exhibit 2.20 RD Compensation
hourly total wage cash
10th percentile (10% earn less) $20.43 $43,000
25th percentile (25% earn less) $24.04 $50,200
50th percentile (50% earn less) $28.85 $61,000
75th percentile (75% earn less) $34.86 $75,000
90th percentile (90% earn less) $43.27 $92,700
base: 6,048 answering RDs for hourly wage, 4,475 for total cash compensation (employed FT 1+ years) See Exhibit 3.1 for supporting data
Helping to account for this range, a number of factors show strong associations with RD compensation. The exhibits which follow demonstrate the relationship between hourly wage and a number of variables. Note that all factors are based on respondent self-reports, and are thus subject to some variation in how terms were understood. Bars on the charts are delimited by the 25th and 75th percentiles; the horizontal line across each bar marks the median (50th percentile).
Exhibit 2.21 RD Hourly Wage by Years in Field
$ 50.00
$ 45.00
$ 40.00
$ 35.00
$ 30.00
$ 25.00
$ 20.00
All RDs < 5 5 - 9 10 - 19 20+
years in field
percentiles # 25th 50th 75th
All RDs 6,048 $24.04 $28.85 $34.86
< 5 918 $20.19 $22.60 $25.75
5 - 9 950 $22.60 $25.96 $30.36
10 - 19 1,591 $25.24 $29.18 $35.10
20+ 2,526 $27.40 $32.00 $38.46
NOTE: Years in field excludes time taken off to return to school, raise a family, or work in other areas. See Exhibit 3.2 for supporting data
As would be expected, years of dietetics experience is strongly associated with compensation; those with 20 or more years of experience earn a median wage more than $9 per hour above those in the field under five years.
Entry-level RDs (less than five years in the field) saw their median wage rise almost a dollar an hour in the past two years, from $21.63 in 2011 to $22.60 in 2013.
Exhibit 2.22 RD Hourly Wage by Years in Position
$50.00
$45.00
$40.00
$35.00
$30.00
$25.00
$20.00
All RDs < 1 1 - 4 5 - 9 10+
years in position
percentiles # 25th 50th 75th
All RDs 6,048 $24.04 $28.85 $34.86
< 1 206 $22.21 $25.93 $31.25
1 - 4 2,052 $21.63 $25.91 $31.25
5 - 9 1,429 $24.22 $28.85 $34.00
10+ 2,336 $26.83 $31.38 $38.46
See Exhibit 3.3 for supporting data
A similar pattern is seen with regard to years in position, with greater experience correlating with significantly greater compensation: an RD in the position for ten years or more earns over $5 per hour more than one in the position for fewer than five years.
Median initial pay rates (< 1 year in the position) rose $1.89 per hour from 2011.
Compensation & Benefits Survey of the Dietetics Profession 2013 14

Exhibit 2.23 RD Hourly Wage by Education (Highest Degree Held, Any Major)
$ 50.00
$ 45.00
$ 40.00
$ 35.00
$ 30.00
$ 25.00
$ 20.00
All RDs bachelor's master's doctorate
highest degree (any major)
percentiles # 25th 50th 75th
All RDs 6,048 $24.04 $28.85 $34.86
bachelor's 2,989 $23.37 $27.68 $33.12
master's 2,841 $24.72 $29.57 $36.06
doctorate 216 $28.85 $36.06 $45.83
See Exhibit 3.5 for supporting data
Education beyond the bachelor's degree continues to be associated with hourly wage gains. The difference between the median wage of RDs with a bachelor's as their highest degree (any major), and that of RDs with a master's degree (any major), is $1.89 per hour in 2013. (This differential has shrunk somewhat since 2011, when it was $2.41 per hour.)
Earning a PhD is associated with even greater gains; median earnings for those with a doctorate (at $36.06) are more than $8 per hour above RDs with a bachelor's degree.
It is important to note that bivariate analyses such as this do not take into account other correlating factors which may also drive compensation. For example, those with PhDs tend to work primarily in academia, and pay scales are higher than average for RDs in that setting.
Exhibit 2.24 RD Hourly Wage by Highest Dietetics Degree
$ 50.00
$ 45.00
$ 40.00
$ 35.00
$ 30.00
$ 25.00
$ 20.00
All RDs bachelor's master's
highest dietetics degree
doctorate
# 25th percentiles
50th 75th
All RDs 6,048 $24.04 $28.85 $34.86
bachelor's 3,446 $24.00 $28.13 $33.65
master's 2,410 $24.04 $29.26 $36.06
doctorate 169 $29.26 $36.06 $45.78
See Exhibit 3.7 for supporting data
Dietetics-related degrees held by RDs also correlate with salary increases. These correlations are not markedly different than those shown for highest degree held (regardless of dietetics emphasis).
Analyzed for the first time in the 2013 survey is the effect of entering the profession with a master's rather than a bachelor's. Median wage for those entering the field within the last five years and having a dietetics-related master's when registered is $23.08; for those with a bachelor's, $22.30. So the entry-level master's premium is currently $.78 per hour.
Overview of Survey Results 15

Exhibit 2.25 RD Hourly Wage by Credentials Held
$ 50.00
$ 45.00
$ 40.00
$ 35.00
$ 30.00
$ 25.00
$ 20.00
A ll RDs y es no y es no licensed? certif ication(s)?
percentiles # 25th 50th 75th
All RDs 6,048 $24.04 $28.85 $34.86
state license 2,712 $24.04 $28.50 $33.65
no state license 3,336 $24.04 $28.85 $36.06
specialty certification(s) 1,326 $26.13 $30.29 $35.26
no certifications 4,722 $23.56 $28.37 $34.62
See Exhibit 3.10 for supporting data
Historically, those with a state license earned somewhat less than those without, due mainly to the effects of the large non-licensed pool of RDs in California, a high-wage state. In 2013, however, that gap has essentially disappeared, with only $.35 per hour separating licensed from non-licensed practitioners.
Holding one or more of the specialty certifications asked about continues to correlate with a wage premium, though at $1.92 per hour that premium has diminished somewhat (from $2.54 in 2011). Highest median hourly wages are seen for those holding the certifications CSG (Certified Specialist in Gerontological Nutrition), CSP (Certified Specialist in Pediatric Nutrition), and CDE (Certified Diabetes Educator), each more than $2 per hour higher than RDs with no specialty certifications.
Exhibit 2.26 RD Hourly Wage by Academy Membership
$50.00
$45.00
$40.00
$35.00
$30.00
$25.00
$20.00
All RDs member
Academy membership
not
# 25th percentiles
50th 75th
All RDs
Academy member
not a member
6,048
4,084
1,964
$24.04
$24.04
$24.04
$28.85
$28.85
$28.50
$34.86
$35.10
$33.87
See Exhibit 3.11 for supporting data
As in previous surveys, results show a small positive association between Academy membership and RD compensation; typical members earn $0.35 per hour more than nonmembers.
Compensation & Benefits Survey of the Dietetics Profession 2013 16
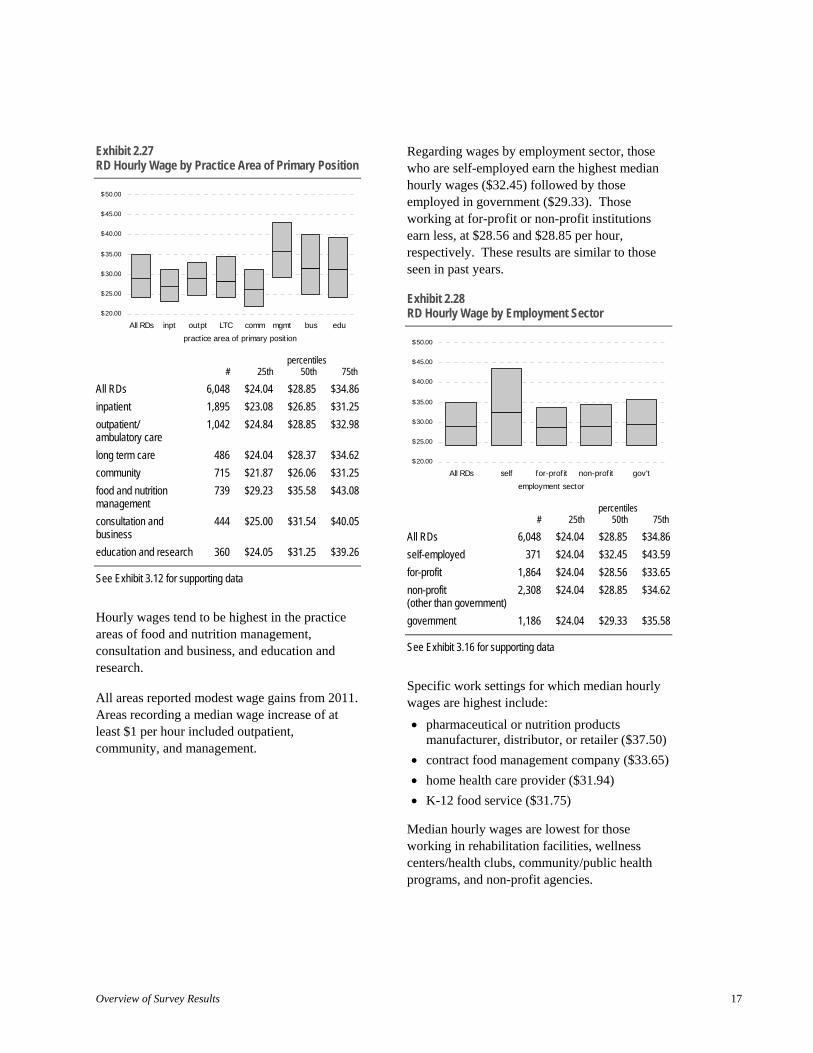
Regarding wages by employment sector, those who are self-employed earn the highest median hourly wages ($32.45) followed by those employed in government ($29.33). Those working at for-profit or non-profit institutions earn less, at $28.56 and $28.85 per hour, respectively. These results are similar to those seen in past years.
Exhibit 2.28 RD Hourly Wage by Employment Sector
$ 50.00
$ 45.00
$ 40.00
$ 35.00
$ 30.00
$ 25.00
$ 20.00
All RDs self for-profit non-profit gov't
employment sector
percentiles # 25th 50th 75th
All RDs 6,048 $24.04 $28.85 $34.86
self-employed 371 $24.04 $32.45 $43.59
for-profit 1,864 $24.04 $28.56 $33.65
non-profit (other than government)
2,308 $24.04 $28.85 $34.62
government 1,186 $24.04 $29.33 $35.58
See Exhibit 3.16 for supporting data
Specific work settings for which median hourly wages are highest include:
pharmaceutical or nutrition products manufacturer, distributor, or retailer ($37.50)
contract food management company ($33.65)
home health care provider ($31.94)
K-12 food service ($31.75)
Median hourly wages are lowest for those working in rehabilitation facilities, wellness centers/health clubs, community/public health programs, and non-profit agencies.
See Exhibit 3.12 for supporting data
Hourly wages tend to be highest in the practice areas of food and nutrition management, consultation and business, and education and research.
All areas reported modest wage gains from 2011. Areas recording a median wage increase of at least $1 per hour included outpatient, community, and management.
Exhibit 2.27 RD Hourly Wage by Practice Area of Primary Position
$ 50.00
$ 45.00
$ 40.00
$ 35.00
$ 30.00
$ 25.00
$ 20.00
All RDs inpt outpt LTC comm mgmt bus
practice area of primary position
# 25th
All RDs 6,048 $24.04
inpatient 1,895 $23.08
outpatient/ 1,042 $24.84ambulatory care
long term care 486 $24.04
community 715 $21.87
food and nutrition 739 $29.23management
consultation and 444 $25.00business
education and research 360 $24.05
percentiles 50th
$28.85
$26.85
$28.85
$28.37
$26.06
$35.58
$31.54
$31.25
edu
75th
$34.86
$31.25
$32.98
$34.62
$31.25
$43.08
$40.05
$39.26
Overview of Survey Results 17
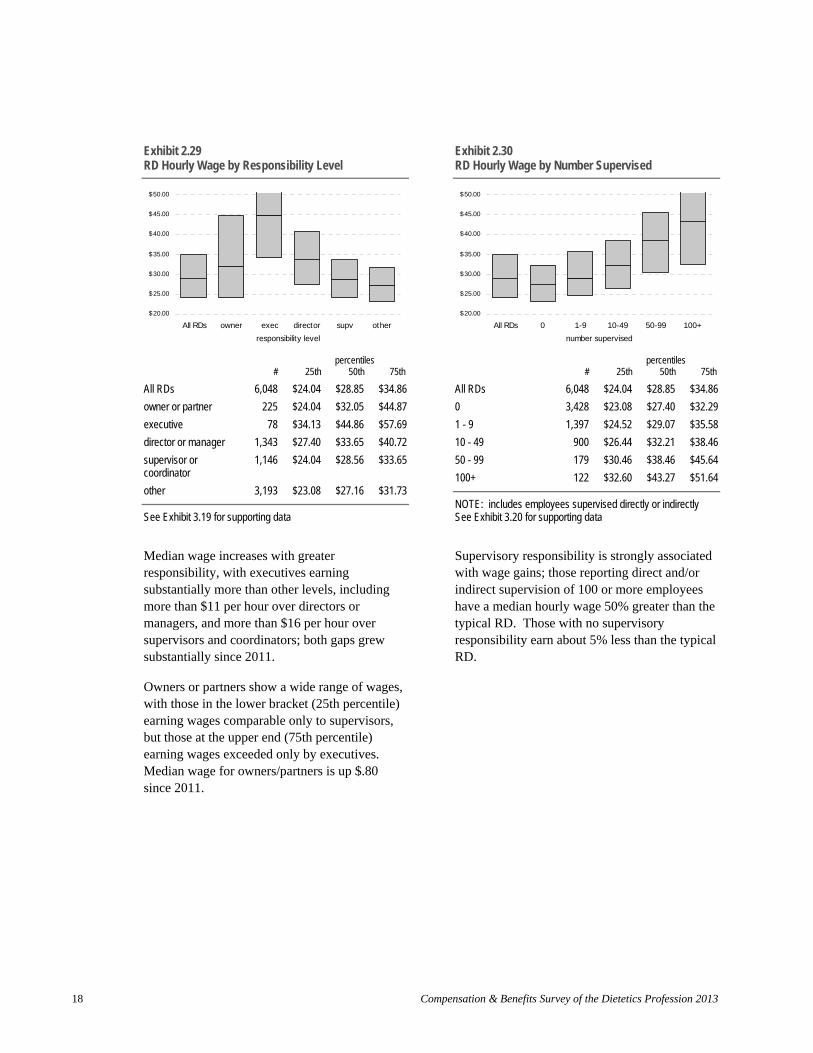
Exhibit 2.29 Exhibit 2.30 RD Hourly Wage by Responsibility Level RD Hourly Wage by Number Supervised
$ 50.00 $50.00
$ 45.00 $45.00
$ 40.00 $40.00
$ 35.00 $35.00
$ 30.00 $30.00
$ 25.00 $25.00
$ 20.00 $20.00
All RDs owner exec director supv other
responsibility level
percentiles # 25th 50th 75th
All RDs 6,048 $24.04 $28.85 $34.86
owner or partner 225 $24.04 $32.05 $44.87
executive 78 $34.13 $44.86 $57.69
director or manager 1,343 $27.40 $33.65 $40.72
supervisor or coordinator
1,146 $24.04 $28.56 $33.65
other 3,193 $23.08 $27.16 $31.73
See Exhibit 3.19 for supporting data
Median wage increases with greater responsibility, with executives earning substantially more than other levels, including more than $11 per hour over directors or managers, and more than $16 per hour over supervisors and coordinators; both gaps grew substantially since 2011.
Owners or partners show a wide range of wages, with those in the lower bracket (25th percentile) earning wages comparable only to supervisors, but those at the upper end (75th percentile) earning wages exceeded only by executives. Median wage for owners/partners is up $.80 since 2011.
All RDs 0 1-9 10-49 50-99 100+
number supervised
# 25th percentiles
50th 75th
All RDs 6,048 $24.04 $28.85 $34.86
0 3,428 $23.08 $27.40 $32.29
1 - 9 1,397 $24.52 $29.07 $35.58
10 - 49 900 $26.44 $32.21 $38.46
50 - 99 179 $30.46 $38.46 $45.64
100+ 122 $32.60 $43.27 $51.64
NOTE: includes employees supervised directly or indirectly See Exhibit 3.20 for supporting data
Supervisory responsibility is strongly associated with wage gains; those reporting direct and/or indirect supervision of 100 or more employees have a median hourly wage 50% greater than the typical RD. Those with no supervisory responsibility earn about 5% less than the typical RD.
Compensation & Benefits Survey of the Dietetics Profession 2013 18
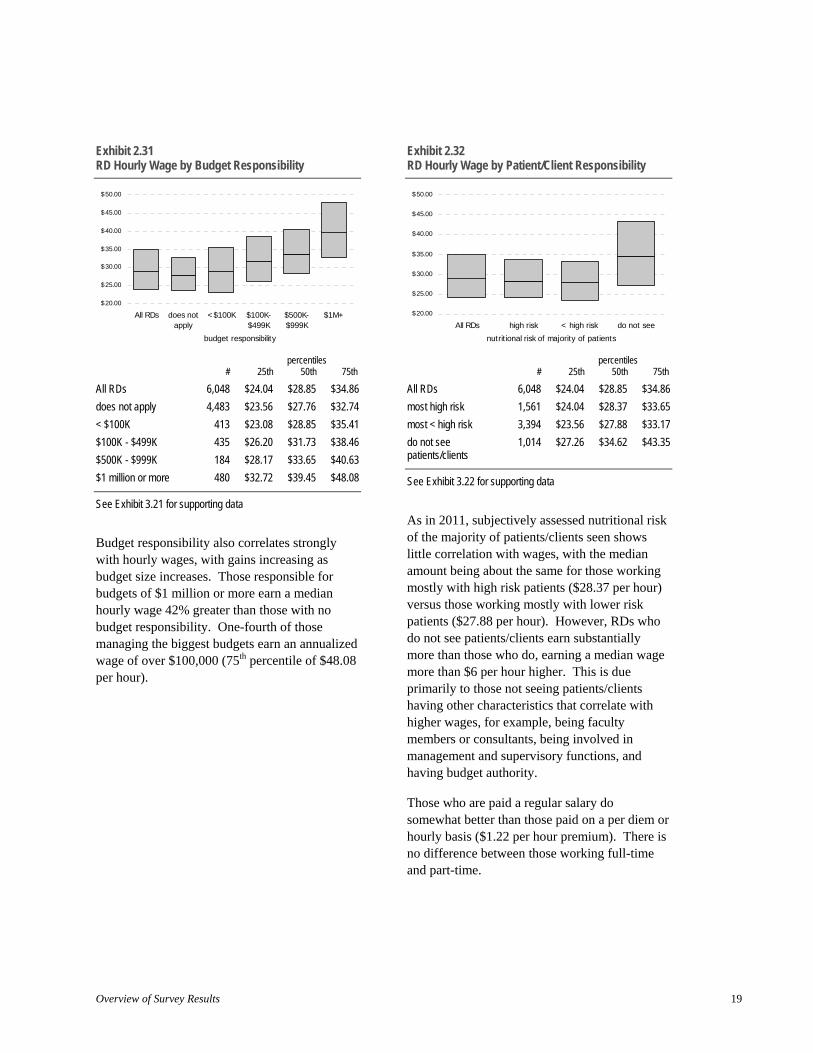
Exhibit 2.31 RD Hourly Wage by Budget Responsibility
$ 50.00
$ 45.00
$ 40.00
$ 35.00
$ 30.00
$ 25.00
$ 20.00
All RDs does not <$100K $100K- $500K- $1M+apply $499K $999K
budget responsibility
percentiles # 25th 50th 75th
All RDs 6,048 $24.04 $28.85 $34.86
does not apply 4,483 $23.56 $27.76 $32.74
< $100K 413 $23.08 $28.85 $35.41
$100K - $499K 435 $26.20 $31.73 $38.46
$500K - $999K 184 $28.17 $33.65 $40.63
$1 million or more 480 $32.72 $39.45 $48.08
See Exhibit 3.21 for supporting data
Budget responsibility also correlates strongly with hourly wages, with gains increasing as budget size increases. Those responsible for budgets of $1 million or more earn a median hourly wage 42% greater than those with no budget responsibility. One-fourth of those managing the biggest budgets earn an annualized wage of over $100,000 (75th percentile of $48.08 per hour).
Exhibit 2.32 RD Hourly Wage by Patient/Client Responsibility
$ 50.00
$ 45.00
$ 40.00
$ 35.00
$ 30.00
$ 25.00
$ 20.00
All RDs high risk < high risk do not see
nutritional risk of majority of patients
percentiles # 25th 50th 75th
All RDs 6,048 $24.04 $28.85 $34.86
most high risk 1,561 $24.04 $28.37 $33.65
most < high risk 3,394 $23.56 $27.88 $33.17
do not see 1,014 $27.26 $34.62 $43.35 patients/clients
See Exhibit 3.22 for supporting data
As in 2011, subjectively assessed nutritional risk of the majority of patients/clients seen shows little correlation with wages, with the median amount being about the same for those working mostly with high risk patients ($28.37 per hour) versus those working mostly with lower risk patients ($27.88 per hour). However, RDs who do not see patients/clients earn substantially more than those who do, earning a median wage more than $6 per hour higher. This is due primarily to those not seeing patients/clients having other characteristics that correlate with higher wages, for example, being faculty members or consultants, being involved in management and supervisory functions, and having budget authority.
Those who are paid a regular salary do somewhat better than those paid on a per diem or hourly basis ($1.22 per hour premium). There is no difference between those working full-time and part-time.
Overview of Survey Results 19

Exhibit 2.33 RD Hourly Wage by Location (Census Divisions)
$ 50.00
$ 45.00
$ 40.00
$ 35.00
$ 30.00
$ 25.00
$ 20.00
All RDs New Middle EN WN England Atlantic Central Central
$ 50.00
$ 45.00
$ 40.00
$ 35.00
$ 30.00
$ 25.00
$ 20.00
All RDs South ES WS Mountain Pacific Atl Central Central
location (Census Division)
percentiles # 25th 50th 75th
All RDs 6,048 $24.04 $28.85 $34.86
New England 350 $25.00 $31.25 $38.10
Middle Atlantic 796 $25.12 $30.02 $36.06
East North Central 1,088 $23.38 $27.52 $32.99
West North Central 608 $22.19 $26.92 $31.70
South Atlantic 1,023 $23.80 $27.88 $33.65
East South Central 357 $21.98 $26.44 $32.12
West South Central 601 $23.08 $27.21 $32.77
Mountain 373 $23.90 $28.85 $34.13
Pacific 848 $28.85 $33.65 $39.63
See Exhibit 3.29 for supporting data
RD compensation varies to some degree according to location. In terms of the nine standard Census Divisions, RDs on the coasts (in New England, Middle Atlantic, and Pacific states) earn median wages of $30 per hour or higher; those in the West North Central and East South Central states earn less than $27 per hour. (See page 215 of the Appendix for the region definitions by state.)
Further details of RD compensation by state and by major metropolitan area may be found on pages 56-60 in the RD Compensation section.
Compensation & Benefits Survey of the Dietetics Profession 2013 20

--------------------------------------------------------------
DTR Compensation
69% of DTRs reported their position’s pay is based on 40 hours per week or more, with an additional 18% indicating a pay base of between 30 and 37.5 hours per week. Virtually all DTRs indicated their position is year-round.
85% of DTRs work full time as defined in this report (35 hours or more per week for 48 weeks per year or more), up three points from 2011, and up ten points from the baseline measurement of 75% in 2002.
Exhibit 2.34 DTR Pay Base
full-time 85%
part-time 15%
base: 747 practicing DTRs See Exhibit 7.34 for supporting data
(Analyses of hours worked and compensation received are based on the subset of respondents providing complete information for all relevant questions.)
Nearly half of DTRs (46%) are eligible to receive overtime compensation, a much higher rate than was reported for RDs (18%).
As with RDs, DTR pay is analyzed in terms of hourly wage and total cash compensation. Refer back to page 13 for details on how these are calculated.
Among all DTRs in all positions, the median hourly wage as of April 1, 2013, was $19.23 per hour; if annualized, this equates to a salary of $40,000 per year. Median total cash compensation for DTRs employed in the position full time for at least one year was $40,000.
As with RDs, these current survey estimates are higher than those published by the Bureau of Labor Statistics (May 2012 median = $12.62, annualized at $26,200)9 . Two factors help account for the discrepancy: this survey data is current as of April 1, 2013, nearly a year more current than the BLS estimate; and BLS does not restrict its estimate to registered dietetic technicians.
DTR median wage and total cash compensation are identical to those reported in 2011. In the context of a 3.4% inflation increase during that time, DTRs have lost some ground.
Exhibit 2.35 DTR Median Hourly Wage Trends
+0.0%
$19.23 $19. 23 $18.75 $17.31
$16.35 $14.74
2002 2005 2007 2009 2011 2013
base (2013): 747 practicing DTRs
9 U.S. Department of Labor, Bureau of Labor Statistics. Occupational Employment Statistics, May 2012: 29-2051 Dietetic Technicians. /www.bls.gov/oes/current/oes292051.htm Accessed 08/31/2013.
Overview of Survey Results 21
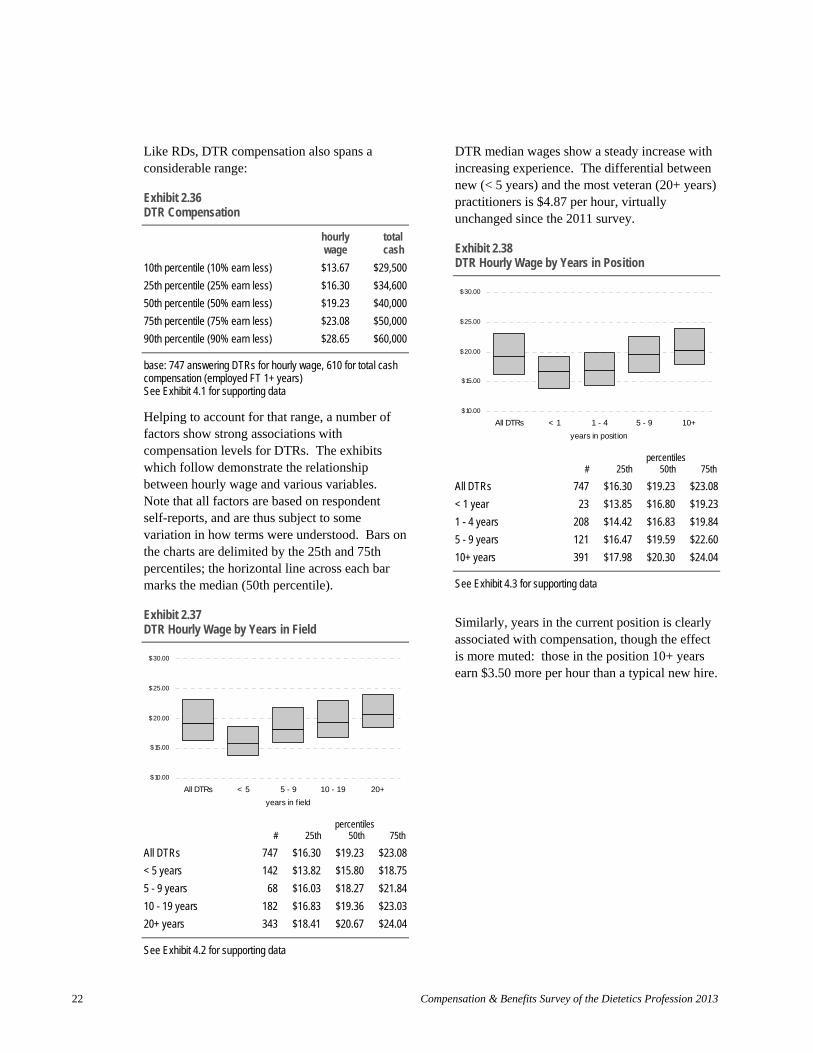
Like RDs, DTR compensation also spans a considerable range:
Exhibit 2.36 DTR Compensation
hourly wage
total cash
10th percentile (10% earn less) $13.67 $29,500
25th percentile (25% earn less) $16.30 $34,600
50th percentile (50% earn less) $19.23 $40,000
75th percentile (75% earn less) $23.08 $50,000
90th percentile (90% earn less) $28.65 $60,000
base: 747 answering DTRs for hourly wage, 610 for total cash compensation (employed FT 1+ years) See Exhibit 4.1 for supporting data
Helping to account for that range, a number of factors show strong associations with compensation levels for DTRs. The exhibits which follow demonstrate the relationship between hourly wage and various variables. Note that all factors are based on respondent self-reports, and are thus subject to some variation in how terms were understood. Bars on the charts are delimited by the 25th and 75th percentiles; the horizontal line across each bar marks the median (50th percentile).
Exhibit 2.37 DTR Hourly Wage by Years in Field
$ 30.00
$ 25.00
$ 20.00
$ 15.00
$ 10.00
All DTRs < 5 5 - 9 10 - 19 20+
years in field
percentiles # 25th 50th 75th
All DTRs 747 $16.30 $19.23 $23.08
< 5 years 142 $13.82 $15.80 $18.75
5 - 9 years 68 $16.03 $18.27 $21.84
10 - 19 years 182 $16.83 $19.36 $23.03
20+ years 343 $18.41 $20.67 $24.04
DTR median wages show a steady increase with increasing experience. The differential between new (< 5 years) and the most veteran (20+ years) practitioners is $4.87 per hour, virtually unchanged since the 2011 survey.
Exhibit 2.38 DTR Hourly Wage by Years in Position
$30.00
$25.00
$20.00
$15.00
$10.00
All DTRs < 1 1 - 4 5 - 9 10+
years in position
percentiles # 25th 50th 75th
All DTRs 747 $16.30 $19.23 $23.08
< 1 year 23 $13.85 $16.80 $19.23
1 - 4 years 208 $14.42 $16.83 $19.84
5 - 9 years 121 $16.47 $19.59 $22.60
10+ years 391 $17.98 $20.30 $24.04
See Exhibit 4.3 for supporting data
Similarly, years in the current position is clearly associated with compensation, though the effect is more muted: those in the position 10+ years earn $3.50 more per hour than a typical new hire.
See Exhibit 4.2 for supporting data
Compensation & Benefits Survey of the Dietetics Profession 2013 22

Exhibit 2.39 DTR Hourly Wage by Education (Highest Degree Held, Any Major)
$ 30.00
$ 25.00
$ 20.00
$ 15.00
$ 10.00
All DTRs associate's bachelor's master's
highest degree held (any major)
percentiles # 25th 50th 75th
All DTRs 747 $16.30 $19.23 $23.08
associate's degree 463 $16.48 $19.23 $22.60
bachelor's degree 255 $15.49 $19.23 $23.08
master's degree 28 $19.27 $22.21 $26.80
See Exhibit 4.5 for supporting data
In a somewhat surprising result, the $0.98 premium seen in 2011 for having a bachelor's rather than an associate's degree as the highest degree held (any major) completely disappears in the 2013 survey: both classes report median wages of $19.23 per hour. Earning a master's, however, still results in a nearly $3 per hour premium.
Exhibit 2.40 DTR Hourly Wage by Highest Dietetics Degree
$ 30.00
$ 25.00
$ 20.00
$ 15.00
$ 10.00
All DTRs associate's bachelor's master's
highest dietetics degree
percentiles # 25th 50th 75th
All DTRs 747 $16.30 $19.23 $23.08
associate's degree 532 $16.76 $19.23 $22.90
bachelor's degree 199 $15.38 $19.23 $23.56
master's degree 11
See Exhibit 4.7 for supporting data; statistics not reported if based on fewer than 15 responses
A virtually identical view is seen when the focus is on highest dietetics-related degree held; median wages are equal for associate's and bachelor's.
For the first time in 2013, the effect of having a bachelor's on entry to the profession was measured. For those in their first five years of work, and holding a dietetics-related bachelor's when they were initially registered as DTRs, the median wage is $15.54. For those with an associate's on entry, it is $15.68. The two pathways to registration as a DTR appear to lead to the same destination in terms of compensation. (Recall that associate's-prepared DTRs also complete an internship, which is not required for Pathway III qualification.)
Overview of Survey Results 23

Exhibit 2.41 DTR Hourly Wage by Credentials Held
$ 30.00
$ 25.00
$ 20.00
$ 15.00
$ 10.00
All DTRs y es no y es no licensed? certif ication(s)?
percentiles # 25th 50th 75th
All DTRs 747 $16.30 $19.23 $23.08
state license 36 $17.83 $19.91 $24.76
no state license 711 $16.23 $19.23 $23.03
specialty certification(s) 83 $17.60 $21.00 $24.73
no certifications 664 $16.03 $19.23 $22.35
See Exhibit 4.10 for supporting data
For DTRs, state licensure makes a slight positive difference to the median wage received, with those who are licensed doing $.68 per hour better than those who are not.
Possession of one or more specialty certifications asked about also results in a median hourly wage gain of $1.77 per hour. Specialty certifications most commonly held by DTRs are the CDM (Certified Dietary Manager), which adds $2.40 per hour compared to all DTRs, and the CFPP (Certified Food Protection Professional), which commands a $1.44 per hour premium.
Exhibit 2.42 DTR Hourly Wage by Academy Membership
$30.00
$25.00
$20.00
$15.00
$10.00
All DTRs Academy member not
Academy membership
percentiles # 25th 50th 75th
All DTRs 747 $16.30 $19.23 $23.08
Academy member 289 $16.07 $19.78 $24.04
not a member 458 $16.31 $19.23 $22.07
See Exhibit 4.11 for supporting data
As with RDs, Academy membership is associated with modestly higher compensation levels for DTRs. The differential in median hourly wage in 2013 is $0.55 per hour.
Compensation & Benefits Survey of the Dietetics Profession 2013 24

Exhibit 2.43 Exhibit 2.44 DTR Hourly Wage by Practice Area of Primary DTR Hourly Wage by Employment Sector Position
$ 30.00
$ 30.00
$ 25.00
$ 20.00
$ 15.00
$ 10.00
All inpt outpt LTC comm mgmt bus edu DTRs
practice area of primary position
percentiles # 25th 50th 75th
All DTRs 747 $16.30 $19.23 $23.08
inpatient 328 $15.87 $19.23 $21.63
outpatient/ 5 ambulatory care
long term care 100 $15.38 $19.23 $22.48
community 87 $15.54 $17.95 $21.63
food and nutrition 149 $17.87 $21.63 $27.40 management
consultation and 8 business
education and research 11
See Exhibit 4.12 for supporting data; statistics not reported if based on fewer than 15 responses
By practice area of primary position, the highest median wage for DTRs is earned by those in food and nutrition management, at $21.63 per hour. (Those in education/research and consultation/business were among the wage leaders in past surveys, but the number of respondents in these practice areas has dropped below the reporting threshold of 15.)
Lowest median hourly wages are seen in the community nutrition practice area ($17.95).
$ 25.00
$ 20.00
$ 15.00
$ 10.00
All DTRs self- for- non- gov't employed profit profit
employment sector
percentiles # 25th 50th 75th
All DTRs 747 $16.30 $19.23 $23.08
self-employed 8
for-profit 220 $15.44 $19.23 $22.90
non-profit 346 $16.41 $19.23 $22.60
government 124 $16.57 $20.19 $23.56
See Exhibit 4.16 for supporting data; statistics not reported if based on fewer than 15 responses
By employment sector, median hourly wage is highest for DTRs among government employees, at $20.19, though this represents a $.29 per hour drop from 2011. DTRs working in for-profit and non-profit institutions saw modest gains from 2011.
The number of responding self-employed DTRs is below the threshold for reporting, as it has been since the 2005 survey, so no statistics are shown.
In terms of specific work settings, the highest median hourly wage is earned by DTRs in government agencies/departments or K-12 food service, both $20.67 per hour. Lowest is seen for those in public health programs, at $17.79.
Overview of Survey Results 25
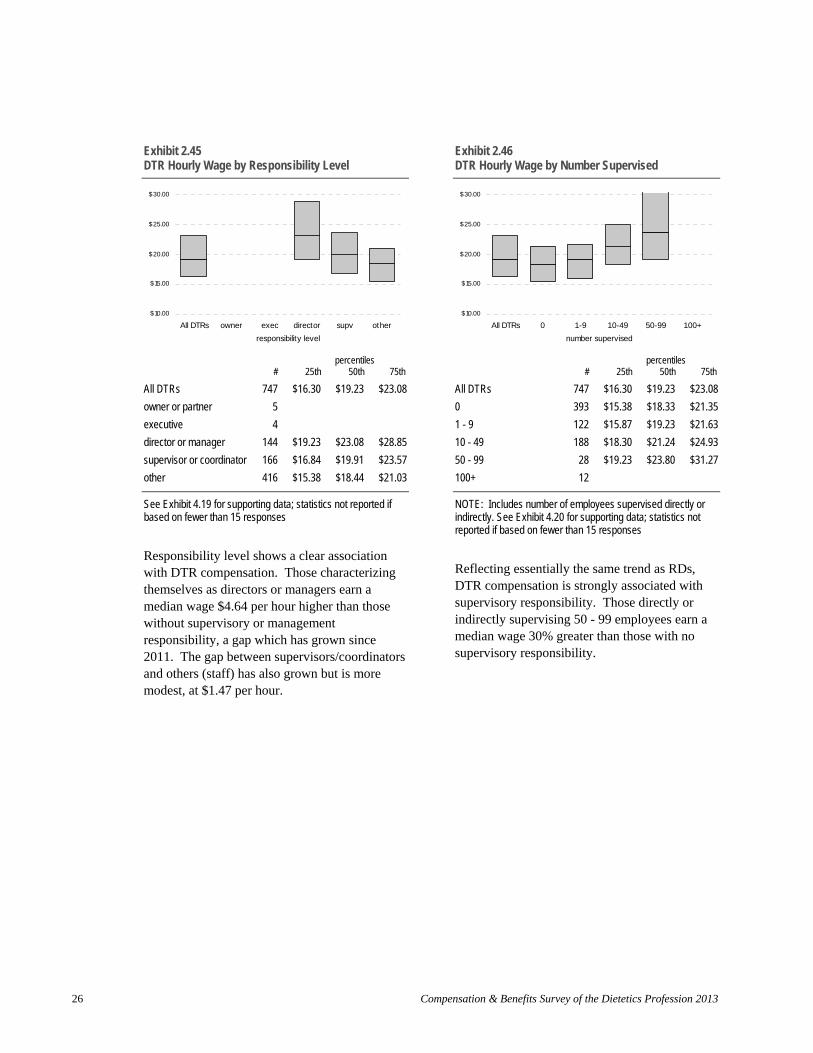
Exhibit 2.45 Exhibit 2.46 DTR Hourly Wage by Responsibility Level DTR Hourly Wage by Number Supervised
$ 30.00
$ 25.00
$ 20.00
$ 15.00
$ 10.00
All DTRs owner ex ec director supv other
responsibility level
percentiles # 25th 50th 75th
All DTRs 747 $16.30 $19.23 $23.08
owner or partner 5
executive 4
director or manager 144 $19.23 $23.08 $28.85
supervisor or coordinator 166 $16.84 $19.91 $23.57
other 416 $15.38 $18.44 $21.03
See Exhibit 4.19 for supporting data; statistics not reported if based on fewer than 15 responses
Responsibility level shows a clear association with DTR compensation. Those characterizing themselves as directors or managers earn a median wage $4.64 per hour higher than those without supervisory or management responsibility, a gap which has grown since 2011. The gap between supervisors/coordinators and others (staff) has also grown but is more modest, at $1.47 per hour.
$30.00
$25.00
$20.00
$15.00
$10.00
All DTRs 0 1-9 10-49 50-99 100+
number supervised
percentiles # 25th 50th 75th
All DTRs 747 $16.30 $19.23 $23.08
0 393 $15.38 $18.33 $21.35
1 - 9 122 $15.87 $19.23 $21.63
10 - 49 188 $18.30 $21.24 $24.93
50 - 99 28 $19.23 $23.80 $31.27
100+ 12
NOTE: Includes number of employees supervised directly or indirectly. See Exhibit 4.20 for supporting data; statistics not reported if based on fewer than 15 responses
Reflecting essentially the same trend as RDs, DTR compensation is strongly associated with supervisory responsibility. Those directly or indirectly supervising 50 - 99 employees earn a median wage 30% greater than those with no supervisory responsibility.
Compensation & Benefits Survey of the Dietetics Profession 2013 26

Exhibit 2.47 Exhibit 2.48 DTR Hourly Wage by Budget Responsibility DTR Hourly Wage by Patient/Client Responsibility
$ 30.00 $ 30.00
$ 25.00 $ 25.00
$ 20.00 $ 20.00
$ 15.00
$ 10.00
All DTRs does not <$100K $100K- $500K- $1M+apply $499K $999K
budget responsibility
percentiles # 25th 50th 75th
All DTRs 747 $16.30 $19.23 $23.08
does not apply 549 $15.79 $19.18 $21.63
< $100K 46 $15.38 $18.25 $22.58
$100K - $499K 69 $18.27 $21.63 $26.92
$500K - $999K 33 $20.50 $23.08 $31.25
$1 million + 33 $24.28 $32.21 $38.46
See Exhibit 4.21 for supporting data
Budget responsibility is also clearly associated with DTR compensation, with those managing large budgets ($1 million or more) earning 68% more than those with no budget responsibility.
However, a minimum budget authority of $100,000 appears necessary to experience wage effects. Those managing a budget of less than $100,000 earned 5% less than those without budget authority. But those managing budgets at the next level ($100,000 - $499,999) saw a gain of 13% over those with no budget authority.
$ 15.00
$ 10.00
All DTRs high risk < high risk do not see
nutritional risk of majority of patients
percentiles # 25th 50th 75th
All DTRs 747 $16.30 $19.23 $23.08
most high risk 110 $16.38 $19.23 $23.08
most < high risk 545 $15.93 $19.23 $22.12
do not see 80 $17.97 $21.75 $28.82 patients/clients
See Exhibit 4.22 for supporting data
In 2013, no difference in median wage is seen for DTRs with respect to the subjectively assessed nutritional risk of the majority of patients served. As with RDs, those not working with patients/clients do better than those who do, earning $2.52 more per hour.
Those paid a regular wage or salary earn a median wage of $20.19 per hour, versus $18.24 for those paid on a per diem or hourly basis. Likewise, those not eligible to receive overtime compensation earn a higher median hourly wage ($20.19) than those who are eligible ($18.75). Those working less than full time earn a slightly lower median hourly wage than those working full time ($19.00 versus $19.23).
Overview of Survey Results 27
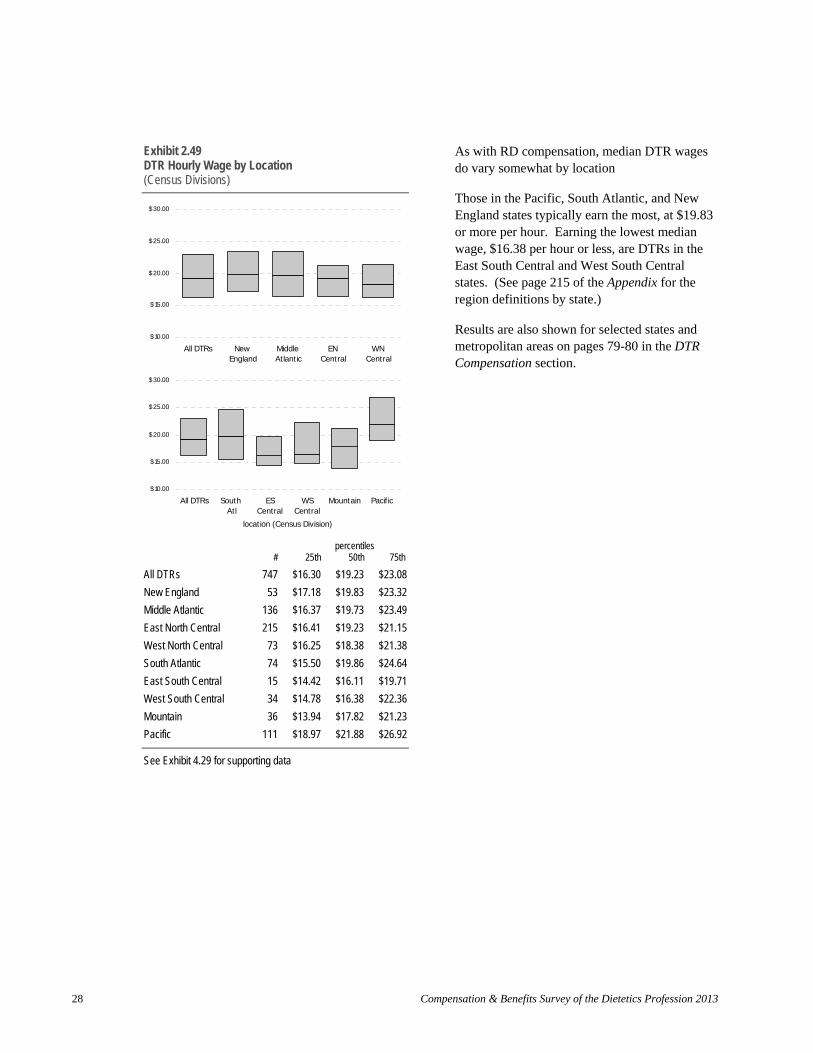
Exhibit 2.49 DTR Hourly Wage by Location (Census Divisions)
$ 30.00
$ 25.00
$ 20.00
$ 15.00
$ 10.00
All DTRs New Middle EN WN England Atlantic Central Central
$ 30.00
$ 25.00
$ 20.00
$ 15.00
$ 10.00
All DTRs South ES WS Mountain Pacific Atl Central Central
location (Census Division)
percentiles # 25th 50th 75th
All DTRs 747 $16.30 $19.23 $23.08
New England 53 $17.18 $19.83 $23.32
Middle Atlantic 136 $16.37 $19.73 $23.49
East North Central 215 $16.41 $19.23 $21.15
West North Central 73 $16.25 $18.38 $21.38
South Atlantic 74 $15.50 $19.86 $24.64
East South Central 15 $14.42 $16.11 $19.71
West South Central 34 $14.78 $16.38 $22.36
Mountain 36 $13.94 $17.82 $21.23
Pacific 111 $18.97 $21.88 $26.92
See Exhibit 4.29 for supporting data
As with RD compensation, median DTR wages do vary somewhat by location
Those in the Pacific, South Atlantic, and New England states typically earn the most, at $19.83 or more per hour. Earning the lowest median wage, $16.38 per hour or less, are DTRs in the East South Central and West South Central states. (See page 215 of the Appendix for the region definitions by state.)
Results are also shown for selected states and metropolitan areas on pages 79-80 in the DTR Compensation section.
Compensation & Benefits Survey of the Dietetics Profession 2013 28
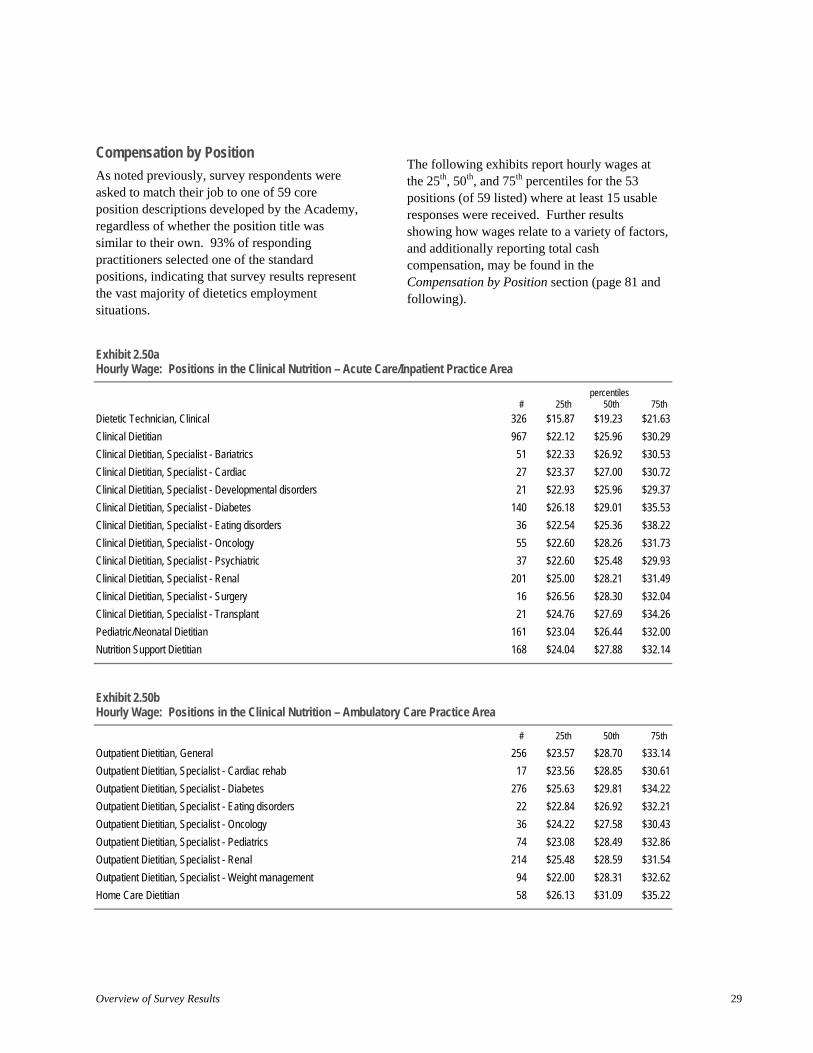
Compensation by Position
As noted previously, survey respondents were asked to match their job to one of 59 core position descriptions developed by the Academy, regardless of whether the position title was similar to their own. 93% of responding practitioners selected one of the standard positions, indicating that survey results represent the vast majority of dietetics employment situations.
Exhibit 2.50a
The following exhibits report hourly wages at the 25th, 50th, and 75th percentiles for the 53 positions (of 59 listed) where at least 15 usable responses were received. Further results showing how wages relate to a variety of factors, and additionally reporting total cash compensation, may be found in the Compensation by Position section (page 81 and following).
Hourly Wage: Positions in the Clinical Nutrition – Acute Care/Inpatient Practice Area
# 25th percentiles
50th 75th
Dietetic Technician, Clinical 326 $15.87 $19.23 $21.63
Clinical Dietitian 967 $22.12 $25.96 $30.29
Clinical Dietitian, Specialist - Bariatrics 51 $22.33 $26.92 $30.53
Clinical Dietitian, Specialist - Cardiac 27 $23.37 $27.00 $30.72
Clinical Dietitian, Specialist - Developmental disorders 21 $22.93 $25.96 $29.37
Clinical Dietitian, Specialist - Diabetes 140 $26.18 $29.01 $35.53
Clinical Dietitian, Specialist - Eating disorders 36 $22.54 $25.36 $38.22
Clinical Dietitian, Specialist - Oncology 55 $22.60 $28.26 $31.73
Clinical Dietitian, Specialist - Psychiatric 37 $22.60 $25.48 $29.93
Clinical Dietitian, Specialist - Renal 201 $25.00 $28.21 $31.49
Clinical Dietitian, Specialist - Surgery 16 $26.56 $28.30 $32.04
Clinical Dietitian, Specialist - Transplant 21 $24.76 $27.69 $34.26
Pediatric/Neonatal Dietitian 161 $23.04 $26.44 $32.00
Nutrition Support Dietitian 168 $24.04 $27.88 $32.14
Exhibit 2.50b Hourly Wage: Positions in the Clinical Nutrition – Ambulatory Care Practice Area
# 25th 50th 75th
Outpatient Dietitian, General 256 $23.57 $28.70 $33.14
Outpatient Dietitian, Specialist - Cardiac rehab 17 $23.56 $28.85 $30.61
Outpatient Dietitian, Specialist - Diabetes 276 $25.63 $29.81 $34.22
Outpatient Dietitian, Specialist - Eating disorders 22 $22.84 $26.92 $32.21
Outpatient Dietitian, Specialist - Oncology 36 $24.22 $27.58 $30.43
Outpatient Dietitian, Specialist - Pediatrics 74 $23.08 $28.49 $32.86
Outpatient Dietitian, Specialist - Renal 214 $25.48 $28.59 $31.54
Outpatient Dietitian, Specialist - Weight management 94 $22.00 $28.31 $32.62
Home Care Dietitian 58 $26.13 $31.09 $35.22
Overview of Survey Results 29

Exhibit 2.50c Hourly Wage: Positions in the Clinical Nutrition – Long Term Care Practice Area
# 25th percentiles
50th 75th
Clinical Dietitian, Long Term Care 497 $24.04 $28.00 $34.62
Dietetic Technician, Long Term Care 95 $15.38 $19.23 $22.60
Exhibit 2.50d Hourly Wage: Positions in the Community Practice Area
# 25th 50th 75th
WIC Nutritionist 435 $19.71 $24.04 $28.21
Public Health Nutritionist 192 $23.08 $27.50 $34.62
Cooperative Extension Educator/Specialist 66 $20.09 $25.00 $31.45
School/Child Care Nutritionist 72 $20.83 $28.85 $34.98
Nutrition Coordinator for Head Start Program 25 $19.91 $25.41 $31.58
Nutritionist for Food Bank or Assistance Program 23 $21.68 $24.04 $29.81
Exhibit 2.50e Hourly Wage: Positions in the Food and Nutrition Management Practice Area
# 25th 50th 75th
Executive-level Professional 70 $37.50 $44.23 $55.56
Director of Food and Nutrition Services 335 $28.85 $36.06 $44.86
Director of Clinical Nutrition 46 $28.85 $36.06 $45.25
Clinical Nutrition Manager 202 $28.85 $33.65 $38.46
Assistant Foodservice Director 112 $23.08 $30.29 $36.90
School Foodservice Director 56 $24.22 $31.87 $40.96
Dietetic Technician, Foodservice Management 82 $16.41 $19.23 $25.96
Exhibit 2.50f Hourly Wage: Positions in the Consultation and Business Practice Area
# 25th 50th 75th
Private Practice Dietitian - Patient/Client Nutrition Care 91 $19.95 $28.85 $41.67
Consultant - Community and/or Corporate Programs 104 $24.04 $29.21 $38.46
Consultant - Communications 18 $24.36 $33.30 $46.63
Sales Representative 56 $31.25 $36.06 $43.15
Public Relations and/or Marketing Professional 19 $24.04 $29.57 $39.66
Corporate Dietitian 93 $25.48 $31.25 $39.66
Research & Development Nutritionist 24 $31.58 $38.46 $48.56
Director of Nutrition 42 $28.85 $33.53 $40.62
Compensation & Benefits Survey of the Dietetics Profession 2013 30
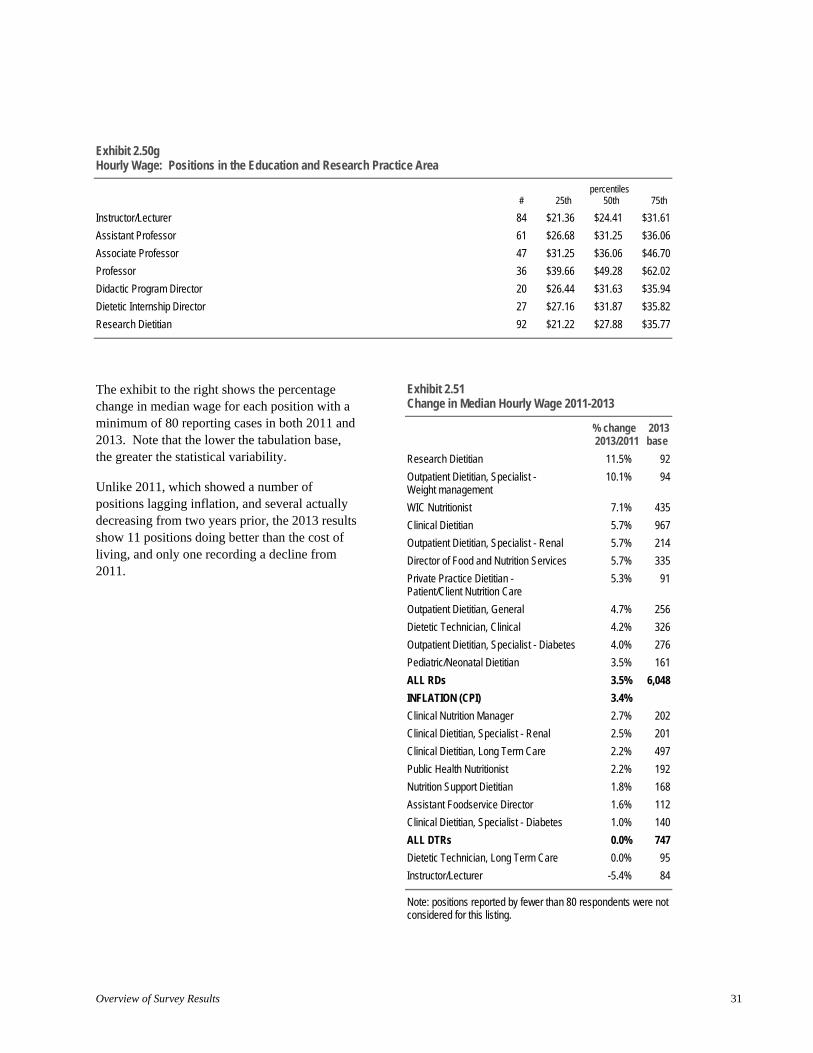
Exhibit 2.50g Hourly Wage: Positions in the Education and Research Practice Area
# 25th percentiles
50th 75th
Instructor/Lecturer 84 $21.36 $24.41 $31.61
Assistant Professor 61 $26.68 $31.25 $36.06
Associate Professor 47 $31.25 $36.06 $46.70
Professor 36 $39.66 $49.28 $62.02
Didactic Program Director 20 $26.44 $31.63 $35.94
Dietetic Internship Director 27 $27.16 $31.87 $35.82
Research Dietitian 92 $21.22 $27.88 $35.77
The exhibit to the right shows the percentage change in median wage for each position with a minimum of 80 reporting cases in both 2011 and 2013. Note that the lower the tabulation base, the greater the statistical variability.
Unlike 2011, which showed a number of positions lagging inflation, and several actually decreasing from two years prior, the 2013 results show 11 positions doing better than the cost of living, and only one recording a decline from 2011.
Exhibit 2.51 Change in Median Hourly Wage 2011-2013
% change 2013/2011
2013 base
Research Dietitian 11.5% 92
Outpatient Dietitian, Specialist - 10.1% 94 Weight management
WIC Nutritionist 7.1% 435
Clinical Dietitian 5.7% 967
Outpatient Dietitian, Specialist - Renal 5.7% 214
Director of Food and Nutrition Services 5.7% 335
Private Practice Dietitian - 5.3% 91 Patient/Client Nutrition Care
Outpatient Dietitian, General 4.7% 256
Dietetic Technician, Clinical 4.2% 326
Outpatient Dietitian, Specialist - Diabetes 4.0% 276
Pediatric/Neonatal Dietitian 3.5% 161
ALL RDs 3.5% 6,048
INFLATION (CPI) 3.4%
Clinical Nutrition Manager 2.7% 202
Clinical Dietitian, Specialist - Renal 2.5% 201
Clinical Dietitian, Long Term Care 2.2% 497
Public Health Nutritionist 2.2% 192
Nutrition Support Dietitian 1.8% 168
Assistant Foodservice Director 1.6% 112
Clinical Dietitian, Specialist - Diabetes 1.0% 140
ALL DTRs 0.0% 747
Dietetic Technician, Long Term Care 0.0% 95
Instructor/Lecturer -5.4% 84
Note: positions reported by fewer than 80 respondents were not considered for this listing.
Overview of Survey Results 31

Benefits Exhibit 2.53 Insurance Benefits Offered
An investigation of benefits packages offered to dietetics practitioners has always been a part of the Academy's Compensation & Benefits surveys. In 2011, this section was greatly expanded to include additional types of benefits and different levels of offerings, an approach continued with the 2013 survey.
Exhibit 2.52 Retirement Benefits Offered
NET: any retirement benefit offered 83%
defined benefit plan (pension) 25%
NET: defined contribution plan 72%
defined contribution plan (e.g. 401(k)), 62% employer contributes
defined contribution plan, 10% employer does NOT contribute
no retirement benefit offered 16%
no answer 1%
base: 7,469 practitioners (multiple answers) NET indicates selection of one or more items in category See Exhibit 6.1 for supporting data
83% of practitioners reported their employers offer them some type of retirement benefit (whether they take advantage of it or not). This figure is essentially unchanged from 2011, though the proportion being offered a defined benefit plan (pension) plummeted from 36% to 25%. In 2013, 62% of employers offer a defined contribution plan (e.g., 401(k)) to which they contribute, and another 10% such a plan without employer contribution. These results are similar to two years ago.
Results regarding a range of hazard and health insurances were mostly similar to those seen in 2011.
employer contributes? offers yes no
life insurance 78% 53% 25%
disability insurance 74% 41% 33%(long- and short-term)
accidental death & dismemberment 63% 30% 33%(AD&D) insurance
long-term care insurance 44% 12% 32%
business travel insurance 17% 9% 8%
high-deductible medical insurance - 54% 40% 14%for employees
high-deductible medical insurance - 52% 36% 16%for dependents
lower-deductible medical insurance or 66% 52% 14%managed care plan - for employees
lower-deductible medical insurance or 64% 47% 17%managed care plan - for dependents
dental insurance or group plan - 81% 54% 27%for employees
dental insurance or group plan - 77% 48% 29%for dependents
prescription drug benefit 73% 50% 23%
vision insurance or group plan 75% 47% 28%
healthcare reimbursement or flexible 69% 30% 39%spending account
retiree medical coverage 29% 16% 13%
base: 7,469 practitioners (multiple answers) See Exhibit 6.2 for supporting data
A majority of practitioners are offered the following: life insurance, disability insurance, AD&D insurance, medical coverage for themselves and dependents, dental coverage for themselves and dependents, a prescription drug benefit, vision insurance, and a healthcare reimbursement or flexible spending account. The proportions of employers contributing towards those coverages, however, are significantly lower.
Compensation & Benefits Survey of the Dietetics Profession 2013 32
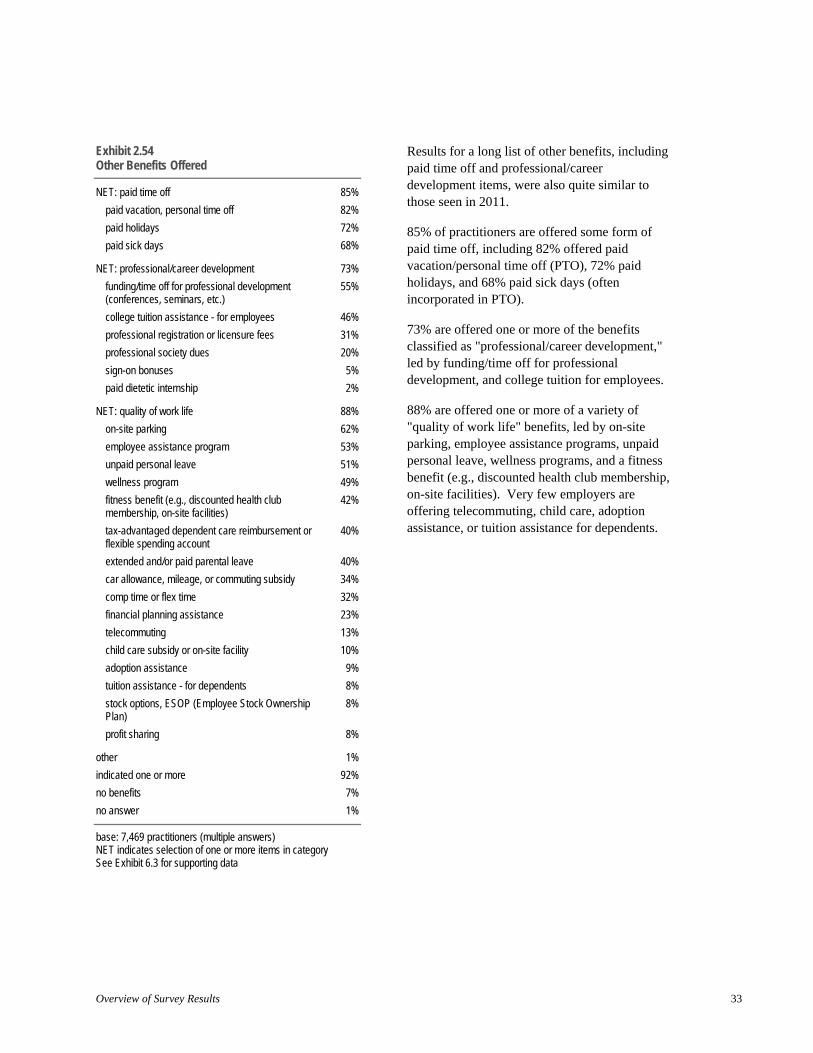
Exhibit 2.54 Results for a long list of other benefits, including Other Benefits Offered paid time off and professional/career
NET: paid time off
paid vacation, personal time off
paid holidays
paid sick days
NET: professional/career development
funding/time off for professional development (conferences, seminars, etc.)
college tuition assistance - for employees
professional registration or licensure fees
professional society dues
sign-on bonuses
paid dietetic internship
NET: quality of work life
on-site parking
employee assistance program
unpaid personal leave
wellness program
fitness benefit (e.g., discounted health club membership, on-site facilities)
tax-advantaged dependent care reimbursement or flexible spending account
extended and/or paid parental leave
car allowance, mileage, or commuting subsidy
comp time or flex time
financial planning assistance
telecommuting
child care subsidy or on-site facility
adoption assistance
tuition assistance - for dependents
stock options, ESOP (Employee Stock Ownership Plan)
profit sharing
other
indicated one or more
no benefits
no answer
base: 7,469 practitioners (multiple answers) NET indicates selection of one or more items in category See Exhibit 6.3 for supporting data
development items, were also quite similar to 85%
those seen in 2011. 82%
72% 85% of practitioners are offered some form of 68% paid time off, including 82% offered paid
73% vacation/personal time off (PTO), 72% paid
55% holidays, and 68% paid sick days (often incorporated in PTO).
46% 73% are offered one or more of the benefits 31% classified as "professional/career development," 20% led by funding/time off for professional
5% development, and college tuition for employees.
2%
88% 88% are offered one or more of a variety of
62% "quality of work life" benefits, led by on-site
53% parking, employee assistance programs, unpaid
51% personal leave, wellness programs, and a fitness benefit (e.g., discounted health club membership, 49% on-site facilities). Very few employers are 42% offering telecommuting, child care, adoption
40% assistance, or tuition assistance for dependents.
40%
34%
32%
23%
13%
10%
9%
8%
8%
8%
1%
92%
7%
1%
Overview of Survey Results 33
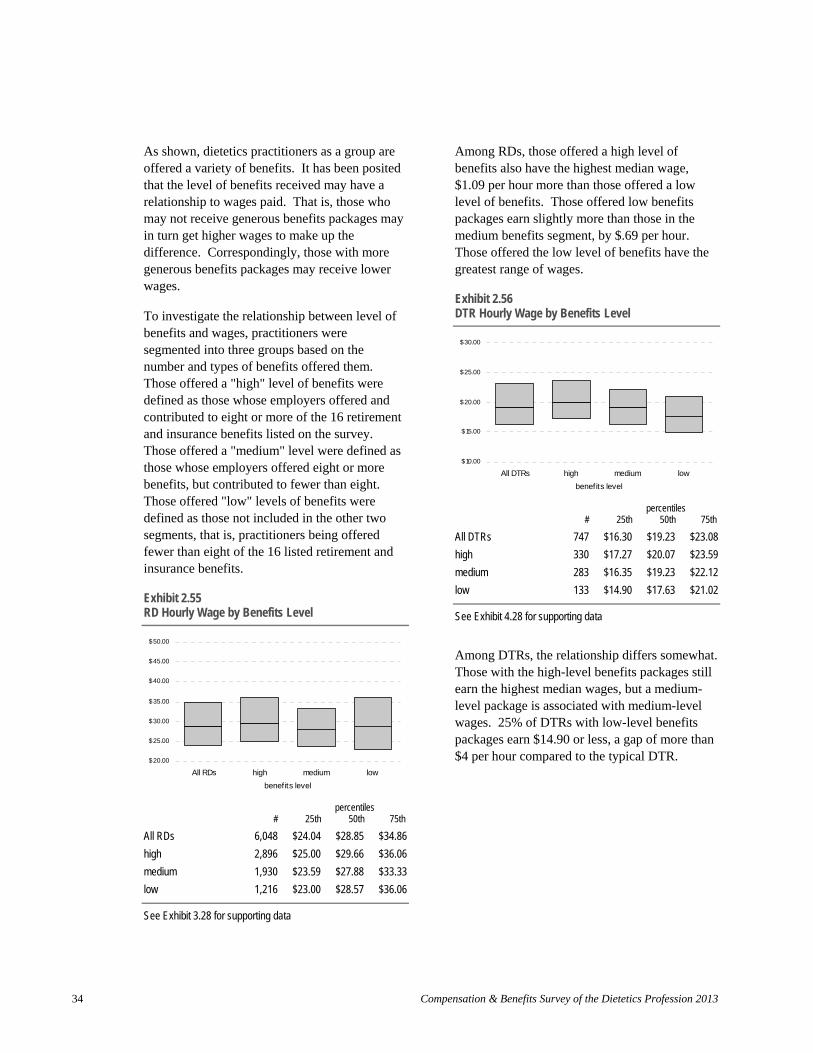
As shown, dietetics practitioners as a group are offered a variety of benefits. It has been posited that the level of benefits received may have a relationship to wages paid. That is, those who may not receive generous benefits packages may in turn get higher wages to make up the difference. Correspondingly, those with more generous benefits packages may receive lower wages.
To investigate the relationship between level of benefits and wages, practitioners were segmented into three groups based on the number and types of benefits offered them. Those offered a "high" level of benefits were defined as those whose employers offered and contributed to eight or more of the 16 retirement and insurance benefits listed on the survey. Those offered a "medium" level were defined as those whose employers offered eight or more benefits, but contributed to fewer than eight. Those offered "low" levels of benefits were defined as those not included in the other two segments, that is, practitioners being offered fewer than eight of the 16 listed retirement and insurance benefits.
Exhibit 2.55 RD Hourly Wage by Benefits Level
$ 50.00
$ 45.00
$ 40.00
$ 35.00
$ 30.00
$ 25.00
$ 20.00
All RDs high medium
benefits level
low
All RDs
high
medium
low
#
6,048
2,896
1,930
1,216
25th
$24.04
$25.00
$23.59
$23.00
percentiles 50th 75th
$28.85 $34.86
$29.66 $36.06
$27.88 $33.33
$28.57 $36.06
See Exhibit 3.28 for supporting data
Among RDs, those offered a high level of benefits also have the highest median wage, $1.09 per hour more than those offered a low level of benefits. Those offered low benefits packages earn slightly more than those in the medium benefits segment, by $.69 per hour. Those offered the low level of benefits have the greatest range of wages.
Exhibit 2.56 DTR Hourly Wage by Benefits Level
$30.00
$25.00
$20.00
$15.00
$10.00
All DTRs high medium
benefits level
low
# 25th percentiles
50th 75th
All DTRs 747 $16.30 $19.23 $23.08
high
medium
330
283
$17.27
$16.35
$20.07
$19.23
$23.59
$22.12
low 133 $14.90 $17.63 $21.02
See Exhibit 4.28 for supporting data
Among DTRs, the relationship differs somewhat. Those with the high-level benefits packages still earn the highest median wages, but a medium-level package is associated with medium-level wages. 25% of DTRs with low-level benefits packages earn $14.90 or less, a gap of more than $4 per hour compared to the typical DTR.
Compensation & Benefits Survey of the Dietetics Profession 2013 34
Conclusion
In underwriting the Compensation & Benefits Survey of the Dietetics Profession 2013, the Academy of Nutrition and Dietetics has again provided a comprehensive and current resource to help dietetics practitioners manage their careers. This survey provides valuable perspectives on how specific dietetics jobs are compensated, shows how a variety of factors relate to compensation levels, and identifies important trends.
The Academy plans to continue updating the survey every two years, and actively seeks suggestions for its improvement (see Response Form following page 224). With the help and participation of dietetics practitioners, future surveys will continue to serve as an invaluable asset to the profession.
Overview of Survey Results 35


3. RD Compensation
Notes
Tables in this section report compensation for the 6,048 Registered Dietitians (RDs) who provided complete hour and compensation information. Results are broken out by a number of factors to demonstrate the relative effects of qualifications, experience, and employment situation in determining compensation levels.
Note that all factors are based on respondent self-reports and are thus subject to some variation in how terms were understood.
Two measures are reported: hourly wage and total cash compensation.
In accordance with Bureau of Labor Statistics practice, hourly wage may be converted to an annualized salary by multiplying the wage by 40 hours per week and 52 weeks per year.
Total cash compensation is reported only for practitioners employed or self-employed in the position full time for at least one year, and includes sources of compensation beyond salary/wages, such as overtime pay, on-call pay, commissions, bonuses, incentive pay, profit sharing or distributions, and cash retirement benefits received. For some workers, such as consultants, salespeople, and executives, a significant part of their compensation can come from sources other than salary. For such individuals, total cash compensation provides a more accurate picture of compensation than wages alone.
In addition to the number of individuals answering, five percentile values are reported for each measure: 10% of practitioners earn less than the 10th percentile, 25% earn less than the 25th percentile, and so on. All percentiles are suppressed if there are fewer than 15 valid responses; the 10th and 90th percentiles are suppressed if there are fewer than 30 valid responses.
Compensation by location is reported in terms of the nine standard Census Divisions:
RD Compensation 37

Exhibit 3.1 RD Compensation 2013 Versus 2011
HOURLY WAGE TOTAL CASH COMPENSATION (those employed full time, 1+ years)
# - - - - - - - - p e r c e n t i l e s - - - - - - # - - - - - - - - p e r c e n t i l e s - - - - - - - answering 10th 25th 50th 75th 90th answering 10th 25th 50th 75th 90th
All RDs - 2013 6048 $20.43 $24.04 $28.85 $34.86 $43.27 4475 $43,000 $50,200 $61,000 $75,000 $92,700
All RDs - 2011 6291 $19.71 $23.08 $27.88 $33.65 $42.00 4617 $42,000 $49,000 $59,300 $72,800 $92,200
% change 3.7% 4.2% 3.5% 3.6% 3.0% 2.4% 2.4% 2.9% 3.0% 0.5%
Note: Results not shown if fewer than 15 valid values; 10th and 90th percentiles not shown if fewer than 30 valid values.
Exhibit 3.2 RD Compensation by Years in Field
HOURLY WAGE TOTAL CASH COMPENSATION (those employed full time, 1+ years)
# - - - - - - - - p e r c e n t i l e s - - - - - - # - - - - - - - - p e r c e n t i l e s - - - - - - - answering 10th 25th 50th 75th 90th answering 10th 25th 50th 75th 90th
All RDs 6048
Years in Field 20+ years 2526 10 - 19 years 1591 5 - 9 years 950 1 - 4 years 898 < 1 year 20 NET: < 5 years 918
$20.43 $24.04 $28.85 $34.86 $43.27 4475 $43,000 $50,200 $61,000 $75,000 $92,700
$24.04 $27.40 $32.00 $38.46 $48.08 1869 $50,400 $59,000 $69,700 $83,000 $104,000 $22.36 $25.24 $29.18 $35.10 $41.93 1136 $47,500 $53,300 $63,000 $75,500 $91,000 $19.52 $22.60 $25.96 $30.36 $35.89 729 $42,000 $47,600 $55,000 $63,500 $75,000 $18.27 $20.19 $22.60 $25.80 $30.29 694 $38,700 $42,000 $47,000 $53,000 $60,200
$18.65 $20.67 $23.72 2 $18.27 $20.19 $22.60 $25.75 $30.29 696 $38,700 $42,000 $47,000 $53,000 $60,300
Note: Results not shown if fewer than 15 valid values; 10th and 90th percentiles not shown if fewer than 30 valid values.
Compensation & Benefits Survey of the Dietetics Profession 2013 38

Exhibit 3.3 RD Compensation by Years in Position
HOURLY WAGE TOTAL CASH COMPENSATION (those employed full time, 1+ years)
# - - - - - - - - p e r c e n t i l e s - - - - - - # - - - - - - - - p e r c e n t i l e s - - - - - - - answering 10th 25th 50th 75th 90th answering 10th 25th 50th 75th 90th
All RDs 6048 $20.43 $24.04 $28.85 $34.86 $43.27
Years in Position 10+ years 2336 $23.56 $26.83 $31.38 $38.46 $46.70 5 - 9 years 1429 $20.91 $24.22 $28.85 $34.00 $40.87 1 - 4 years 2052 $19.23 $21.63 $25.91 $31.25 $38.46 < 1 year 206 $19.55 $22.21 $25.93 $31.25 $39.23
4475 $43,000 $50,200 $61,000 $75,000 $92,700
1786 $50,000 $57,500 $68,200 $81,900 $100,000 1092 $45,000 $52,000 $60,700 $72,500 $91,000 1597 $40,000 $45,400 $53,500 $65,000 $80,000
Note: Results not shown if fewer than 15 valid values; 10th and 90th percentiles not shown if fewer than 30 valid values.
Exhibit 3.4 RD Compensation by Prior Career
HOURLY WAGE TOTAL CASH COMPENSATION (those employed full time, 1+ years)
# - - - - - - - - p e r c e n t i l e s - - - - - - # - - - - - - - - p e r c e n t i l e s - - - - - - - answering 10th 25th 50th 75th 90th answering 10th 25th 50th 75th 90th
All RDs 6048 $20.43 $24.04 $28.85 $34.86 $43.27 4475 $43,000 $50,200 $61,000 $75,000 $92,700
Prior Career dietetics is second career 777 $20.20 $24.04 $28.37 $33.72 $39.58 571 $45,000 $50,200 $60,000 $72,500 $85,000 dietetics is first career 5206 $20.43 $24.04 $28.85 $34.98 $43.27 3859 $43,000 $50,200 $61,000 $75,000 $94,500
Note: Results not shown if fewer than 15 valid values; 10th and 90th percentiles not shown if fewer than 30 valid values.
RD Compensation 39

Exhibit 3.5 RD Compensation by Education (Highest Degree Held)
HOURLY WAGE TOTAL CASH COMPENSATION (those employed full time, 1+ years)
# - - - - - - - - p e r c e n t i l e s - - - - - - # - - - - - - - - p e r c e n t i l e s - - - - - - - answering 10th 25th 50th 75th 90th answering 10th 25th 50th 75th 90th
All RDs 6048 $20.43 $24.04 $28.85 $34.86 $43.27
Education (Highest Degree) doctoral degree 216 $23.42 $28.85 $36.06 $45.83 $55.67
master's degree 2841 $21.15 $24.72 $29.57 $36.06 $45.62 bachelor's degree 2989 $20.03 $23.37 $27.68 $33.12 $39.42
associate's degree 1
4475 $43,000 $50,200 $61,000 $75,000 $92,700
189 $53,000 $64,800 $80,000 $100,500 $122,000 2125 $45,000 $52,200 $63,800 $77,900 $96,000 2159 $42,000 $48,300 $58,000 $70,000 $83,200
1
Note: Results not shown if fewer than 15 valid values; 10th and 90th percentiles not shown if fewer than 30 valid values.
Exhibit 3.6 RD Compensation by Education and Years in Field
HOURLY WAGE TOTAL CASH COMPENSATION (those employed full time, 1+ years)
# - - - - - - - - p e r c e n t i l e s - - - - - - # - - - - - - - - p e r c e n t i l e s - - - - - - - answering 10th 25th 50th 75th 90th answering 10th 25th 50th 75th 90th
All RDs 6048
doctoral degree 216 20+ years 118 10 - 19 years 58 5 - 9 years 22 1 - 4 years 14 < 1 year NET: < 5 years 14
master's degree 2841 20+ years 1248 10 - 19 years 708 5 - 9 years 445 1 - 4 years 403 < 1 year 8 NET: < 5 years 411
bachelor's degree 2989 20+ years 1159 10 - 19 years 825 5 - 9 years 483 1 - 4 years 480 < 1 year 12 NET: < 5 years 492
$20.43 $24.04 $28.85 $34.86 $43.27 4475 $43,000 $50,200 $61,000 $75,000 $92,700
$23.42 $28.85 $36.06 $45.83 $55.67 189 $53,000 $64,800 $80,000 $100,500 $122,000 $27.83 $32.21 $38.46 $50.56 $58.80 102 $55,600 $72,800 $91,000 $110,700 $125,700 $23.45 $28.85 $35.44 $43.35 $57.91 50 $50,300 $63,200 $75,500 $90,800 $129,000
$21.89 $30.05 $36.06 20 $52,500 $71,500 $83,800 13
13
$21.15 $24.72 $29.57 $36.06 $45.62 2125 $45,000 $52,200 $63,800 $77,900 $96,000 $24.04 $27.98 $33.33 $40.38 $50.96 949 $52,000 $60,000 $71,000 $86,000 $110,000 $22.60 $25.92 $29.93 $36.06 $43.30 517 $48,500 $55,000 $65,000 $78,000 $95,000 $20.19 $23.08 $26.44 $30.80 $36.06 340 $43,000 $49,200 $57,000 $65,100 $77,000 $18.61 $20.63 $23.32 $26.44 $32.09 300 $39,000 $43,000 $48,400 $55,000 $64,400
$18.56 $20.55 $23.30 $26.44 $32.11 300 $39,000 $43,000 $48,400 $55,000 $64,400
$20.03 $23.37 $27.68 $33.12 $39.42 2159 $42,000 $48,300 $58,000 $70,000 $83,200 $23.08 $26.44 $30.53 $35.71 $43.27 817 $49,900 $56,000 $65,000 $77,000 $94,100 $21.87 $25.00 $28.75 $33.65 $39.32 569 $45,900 $52,000 $60,500 $72,000 $85,600 $19.23 $22.00 $25.00 $29.81 $34.13 369 $40,000 $46,000 $52,000 $62,000 $70,500 $18.27 $20.00 $22.00 $25.00 $28.21 380 $38,000 $42,000 $46,000 $51,900 $58,000
2 $18.03 $19.96 $22.00 $25.00 $28.21 382 $38,000 $41,900 $46,000 $52,000 $58,200
Note: Results not shown if fewer than 15 valid values; 10th and 90th percentiles not shown if fewer than 30 valid values.
Compensation & Benefits Survey of the Dietetics Profession 2013 40

Exhibit 3.7 RD Compensation by Highest Dietetics Degree
HOURLY WAGE TOTAL CASH COMPENSATION (those employed full time, 1+ years)
# - - - - - - - - p e r c e n t i l e s - - - - - - # - - - - - - - - p e r c e n t i l e s - - - - - - - answering 10th 25th 50th 75th 90th answering 10th 25th 50th 75th 90th
All RDs 6048 $20.43 $24.04 $28.85 $34.86 $43.27
Highest Dietetics Degree doctoral degree 169 $23.08 $29.26 $36.06 $45.78 $55.77
master's degree 2410 $20.91 $24.04 $29.26 $36.06 $44.87 bachelor's degree 3446 $20.19 $24.00 $28.13 $33.65 $40.67
associate's degree 4
4475 $43,000 $50,200 $61,000 $75,000 $92,700
146 $53,700 $65,000 $80,000 $103,500 $120,600 1803 $45,000 $52,000 $63,000 $76,500 $95,000 2511 $42,300 $49,900 $60,000 $71,400 $88,000
3
Note: Results not shown if fewer than 15 valid values; 10th and 90th percentiles not shown if fewer than 30 valid values.
Exhibit 3.8 RD Compensation by Highest Dietetics Degree at Registration
HOURLY WAGE TOTAL CASH COMPENSATION (those employed full time, 1+ years)
# - - - - - - - - p e r c e n t i l e s - - - - - - # - - - - - - - - p e r c e n t i l e s - - - - - - - answering 10th 25th 50th 75th 90th answering 10th 25th 50th 75th 90th
All RDs 6048
Highest Dietetics Degree at Registration doctoral degree 46
master's degree 1712 bachelor's degree 4237 associate's degree 23
$20.43 $24.04 $28.85 $34.86 $43.27 4475 $43,000 $50,200 $61,000 $75,000 $92,700
$23.27 $29.47 $36.06 $45.72 $63.53 42 $50,500 $62,300 $79,200 $93,500 $126,300 $20.64 $24.04 $29.20 $36.06 $45.19 1303 $44,100 $51,000 $63,000 $78,000 $96,100 $20.40 $24.04 $28.85 $34.38 $41.67 3097 $43,000 $50,000 $60,000 $72,900 $90,500
$24.52 $30.05 $33.12 16 $52,000 $62,500 $73,800
Note: Results not shown if fewer than 15 valid values; 10th and 90th percentiles not shown if fewer than 30 valid values.
RD Compensation 41

42 Compensation & Benefits Survey of the Dietetics Profession 2013
Exhibit 3.9 RD Compensation by Highest Dietetics Degree at Registration and Years in Field
HOURLY WAGE TOTAL CASH COMPENSATION (those employed full time, 1+ years) # - - - - - - - - p e r c e n t i l e s - - - - - - - # - - - - - - - - p e r c e n t i l e s - - - - - - - answering 10th 25th 50th 75th 90th answering 10th 25th 50th 75th 90th
All RDs 6048 $20.43 $24.04 $28.85 $34.86 $43.27 4475 $43,000 $50,200 $61,000 $75,000 $92,700 master's degree 1712 $20.64 $24.04 $29.20 $36.06 $45.19 1303 $44,100 $51,000 $63,000 $78,000 $96,100 20+ years 696 $24.04 $28.04 $33.17 $40.87 $51.57 546 $52,000 $60,000 $70,900 $87,800 $111,000 10 - 19 years 413 $22.12 $25.55 $30.29 $36.06 $43.69 306 $48,000 $55,000 $65,400 $79,800 $95,200 5 - 9 years 261 $20.19 $23.08 $26.44 $31.25 $37.79 196 $42,400 $49,000 $56,600 $66,800 $81,300 1 - 4 years 309 $18.51 $20.31 $23.08 $26.96 $32.59 235 $39,000 $43,000 $48,200 $55,000 $64,600 < 1 year 8 NET: < 5 years 317 $18.50 $20.25 $23.08 $26.68 $32.67 235 $39,000 $43,000 $48,200 $55,000 $64,600 bachelor's degree 4237 $20.40 $24.04 $28.85 $34.38 $41.67 3097 $43,000 $50,000 $60,000 $72,900 $90,500 20+ years 1792 $23.67 $27.05 $31.25 $37.97 $47.01 1294 $50,000 $58,000 $68,300 $81,400 $101,200 10 - 19 years 1144 $22.44 $25.24 $28.85 $34.62 $41.03 806 $47,300 $53,000 $62,000 $74,600 $90,000 5 - 9 years 675 $19.23 $22.36 $25.72 $30.05 $35.00 522 $41,000 $47,000 $54,100 $63,000 $72,000 1 - 4 years 577 $18.27 $20.19 $22.33 $25.10 $28.85 449 $38,000 $42,000 $46,200 $52,000 $58,200 < 1 year 12 2 NET: < 5 years 589 $18.27 $20.19 $22.30 $25.00 $28.85 451 $38,000 $42,000 $46,200 $52,000 $58,300
Note: Results not shown if fewer than 15 valid values; 10th and 90th percentiles not shown if fewer than 30 valid values.

Exhibit 3.10 RD Compensation by Credentials Held
HOURLY WAGE TOTAL CASH COMPENSATION
# answering
- - - - - p e r c e n t i l e s - - - - - - - 10th 25th 50th 75th 90th
# answering
(those employed full time, 1+ years) - - - - p e r c e n t i l e s - - - -
10th 25th 50th 75th 90th
All RDs 6048 $20.43 $24.04 $28.85 $34.86 $43.27 4475 $43,000 $50,200 $61,000 $75,000 $92,700
Credentials Held
state license 2712 $20.19 $24.04 $28.50 $33.65 $40.38 2009 $43,000 $50,000 $60,000 $72,000 $87,000 no state license 3336 $20.56 $24.04 $28.85 $36.06 $44.71 2466 $43,300 $51,000 $62,000 $77,000 $96,000
specialty certification(s) no specialty certifications
1326 4722
$23.08 $20.04
$26.13 $23.56
$30.29 $28.37
$35.26 $34.62
$41.35 $43.27
986 3489
$48,100$42,300
$55,000 $50,000
$64,300 $60,000
$75,000 $88,600 $75,000 $94,000
CDE (Certified Diabetes Educator) 651 $23.12 $26.59 $30.67 $35.58 $41.61 448 $50,000 $57,100 $65,000 $75,300 $87,200 CDM (Certified Dietary Manager) 15 $25.48 $29.71 $40.87 12 CFM (Certified Food Manager) 25 $24.09 $30.02 $35.47 19 $57,300 $67,600 $75,000 CFPP (Certified Food Protection Professional) 36 $21.74 $25.72 $29.44 $35.46 $46.39 28 $56,300 $60,900 $72,500 CNSC (Certified Nutrition Support Clinician) 344 $23.08 $25.73 $30.29 $34.52 $40.87 287 $46,900 $53,000 $62,800 $73,600 $87,800 CSG (Certified Specialist in Gerontological Nutrition) 55 $24.02 $27.40 $30.77 $38.46 $47.82 39 $49,900 $58,000 $65,000 $78,000 $100,000 CSO (Board Certified Specialist in Oncology Nutrition) 61 $24.04 $25.80 $28.85 $34.62 $38.46 49 $51,900 $55,500 $63,000 $72,800 $80,000 CSP (Certified Specialist in Pediatric Nutrition) 95 $23.08 $26.44 $30.77 $36.06 $40.02 72 $48,600 $53,800 $62,000 $75,000 $89,600
CSR (Certified Specialist in Renal Nutrition) 62 $24.06 $26.39 $30.39 $36.42 $42.93 47 $51,600 $57,000 $64,000 $73,800 $89,300 CSSD (Certified Specialist in Sports Dietetics) 52 $22.92 $25.06 $29.57 $35.82 $41.73 39 $50,000 $55,000 $65,000 $84,000 $108,000
Note: Results not shown if fewer than 15 valid values; 10th and 90th percentiles not shown if fewer than 30 valid values.
RD Compensation 43

Exhibit 3.11 RD Compensation by Academy Membership
HOURLY WAGE TOTAL CASH COMPENSATION (those employed full time, 1+ years)
# - - - - - - - - p e r c e n t i l e s - - - - - - # - - - - - - - - p e r c e n t i l e s - - - - - - - answering 10th 25th 50th 75th 90th answering 10th 25th 50th 75th 90th
All RDs 6048 $20.43 $24.04 $28.85 $34.86 $43.27 4475 $43,000 $50,200 $61,000 $75,000 $92,700
Academy of Nutrition and Dietetics Membership Academy member 4084 $20.51 $24.04 $28.85 $35.10 $43.62 3050 $43,700 $51,000 $62,000 $75,000 $95,000
not a member 1964 $20.19 $24.04 $28.50 $33.87 $40.87 1425 $42,700 $50,000 $60,000 $72,000 $86,400
Note: Results not shown if fewer than 15 valid values; 10th and 90th percentiles not shown if fewer than 30 valid values.
Exhibit 3.12 RD Compensation by Practice Area of Primary Position
HOURLY WAGE TOTAL CASH COMPENSATION (those employed full time, 1+ years)
# - - - - - - - - p e r c e n t i l e s - - - - - - # - - - - - - - - p e r c e n t i l e s - - - - - - - answering 10th 25th 50th 75th 90th answering 10th 25th 50th 75th 90th
All RDs 6048 $20.43 $24.04 $28.85 $34.86 $43.27 4475 $43,000 $50,200 $61,000 $75,000 $92,700
Practice Area of Primary Position clinical nutrition - acute care/inpatient 1895 $20.19 $23.08 $26.85 $31.25 $36.92 1355 $42,000 $48,000 $55,400 $65,000 $75,000 clinical nutrition - ambulatory care 1042 $21.15 $24.84 $28.85 $32.98 $38.27 683 $45,000 $52,000 $60,800 $70,000 $80,000 clinical nutrition - long term care 486 $20.62 $24.04 $28.37 $34.62 $43.08 304 $42,700 $50,000 $58,400 $70,000 $81,100 education and research 360 $20.06 $24.05 $31.25 $39.26 $50.91 273 $46,800 $56,600 $70,000 $90,000 $111,600 community 715 $19.23 $21.87 $26.06 $31.25 $38.46 583 $40,000 $45,900 $55,000 $67,000 $84,000 food and nutrition management 739 $24.52 $29.23 $35.58 $43.08 $51.92 699 $51,500 $62,300 $75,000 $92,000 $113,000 consultation and business 444 $19.23 $25.00 $31.54 $40.05 $54.21 303 $46,500 $57,000 $70,000 $93,500 $124,600
Note: Results not shown if fewer than 15 valid values; 10th and 90th percentiles not shown if fewer than 30 valid values.
Compensation & Benefits Survey of the Dietetics Profession 2013 44
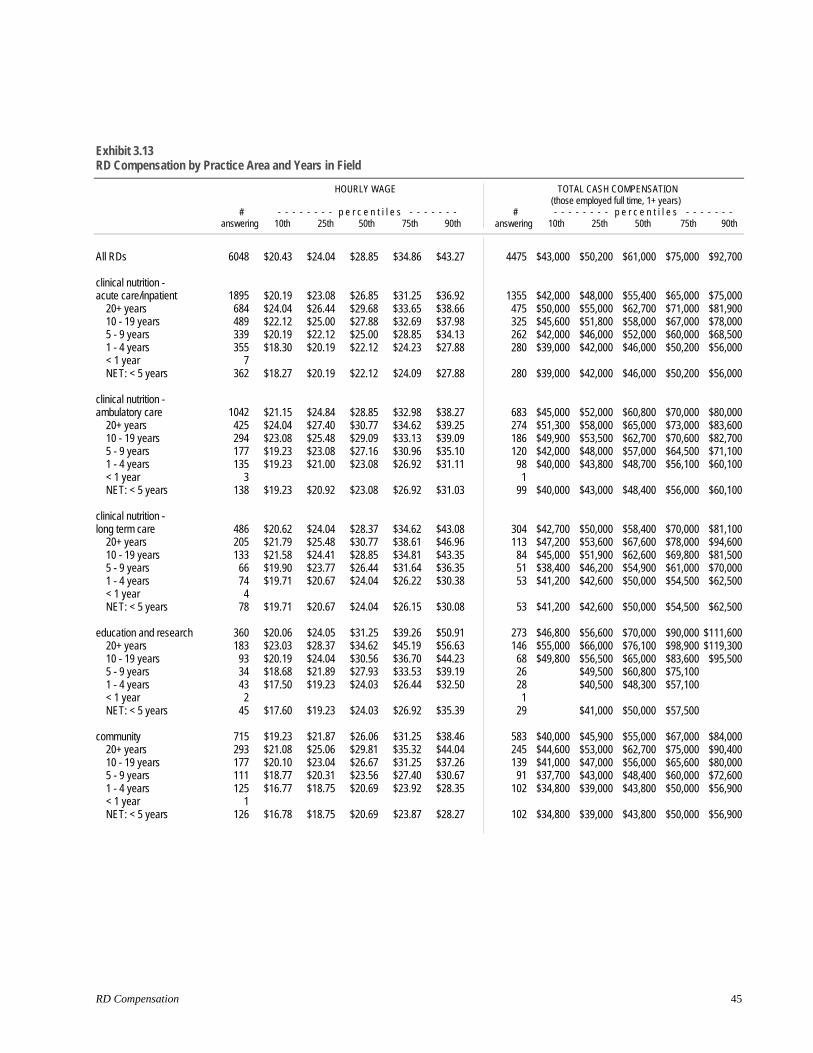
Exhibit 3.13 RD Compensation by Practice Area and Years in Field
HOURLY WAGE TOTAL CASH COMPENSATION (those employed full time, 1+ years)
# - - - - - - - - p e r c e n t i l e s - - - - - - # - - - - - - - - p e r c e n t i l e s - - - - - - - answering 10th 25th 50th 75th 90th answering 10th 25th 50th 75th 90th
All RDs 6048
clinical nutrition - acute care/inpatient 1895
20+ years 684 10 - 19 years 489 5 - 9 years 339 1 - 4 years 355 < 1 year 7 NET: < 5 years 362
clinical nutrition - ambulatory care 1042
20+ years 425 10 - 19 years 294 5 - 9 years 177 1 - 4 years 135 < 1 year 3 NET: < 5 years 138
clinical nutrition - long term care 486
20+ years 205 10 - 19 years 133 5 - 9 years 66 1 - 4 years 74 < 1 year 4 NET: < 5 years 78
education and research 360 20+ years 183 10 - 19 years 93 5 - 9 years 34 1 - 4 years 43 < 1 year 2 NET: < 5 years 45
community 715 20+ years 293 10 - 19 years 177 5 - 9 years 111 1 - 4 years 125 < 1 year 1 NET: < 5 years 126
$20.43 $24.04 $28.85 $34.86 $43.27 4475 $43,000
$20.19 $23.08 $26.85 $31.25 $36.92 1355 $42,000$24.04 $26.44 $29.68 $33.65 $38.66 475 $50,000$22.12 $25.00 $27.88 $32.69 $37.98 325 $45,600$20.19 $22.12 $25.00 $28.85 $34.13 262 $42,000$18.30 $20.19 $22.12 $24.23 $27.88 280 $39,000
$18.27 $20.19 $22.12 $24.09 $27.88 280 $39,000
$21.15 $24.84 $28.85 $32.98 $38.27 683 $45,000$24.04 $27.40 $30.77 $34.62 $39.25 274 $51,300$23.08 $25.48 $29.09 $33.13 $39.09 186 $49,900$19.23 $23.08 $27.16 $30.96 $35.10 120 $42,000$19.23 $21.00 $23.08 $26.92 $31.11 98 $40,000
1 $19.23 $20.92 $23.08 $26.92 $31.03 99 $40,000
$20.62 $24.04 $28.37 $34.62 $43.08 304 $42,700$21.79 $25.48 $30.77 $38.61 $46.96 113 $47,200$21.58 $24.41 $28.85 $34.81 $43.35 84 $45,000$19.90 $23.77 $26.44 $31.64 $36.35 51 $38,400$19.71 $20.67 $24.04 $26.22 $30.38 53 $41,200
$19.71 $20.67 $24.04 $26.15 $30.08 53 $41,200
$20.06 $24.05 $31.25 $39.26 $50.91 273 $46,800$23.03 $28.37 $34.62 $45.19 $56.63 146 $55,000$20.19 $24.04 $30.56 $36.70 $44.23 68 $49,800$18.68 $21.89 $27.93 $33.53 $39.19 26$17.50 $19.23 $24.03 $26.44 $32.50 28
1 $17.60 $19.23 $24.03 $26.92 $35.39 29
$19.23 $21.87 $26.06 $31.25 $38.46 583 $40,000$21.08 $25.06 $29.81 $35.32 $44.04 245 $44,600$20.10 $23.04 $26.67 $31.25 $37.26 139 $41,000$18.77 $20.31 $23.56 $27.40 $30.67 91 $37,700$16.77 $18.75 $20.69 $23.92 $28.35 102 $34,800
$16.78 $18.75 $20.69 $23.87 $28.27 102 $34,800
$50,200 $61,000 $75,000 $92,700
$48,000 $55,400 $65,000 $75,000 $55,000 $62,700 $71,000 $81,900 $51,800 $58,000 $67,000 $78,000 $46,000 $52,000 $60,000 $68,500 $42,000 $46,000 $50,200 $56,000
$42,000 $46,000 $50,200 $56,000
$52,000 $60,800 $70,000 $80,000 $58,000 $65,000 $73,000 $83,600 $53,500 $62,700 $70,600 $82,700 $48,000 $57,000 $64,500 $71,100 $43,800 $48,700 $56,100 $60,100
$43,000 $48,400 $56,000 $60,100
$50,000 $58,400 $70,000 $81,100 $53,600 $67,600 $78,000 $94,600 $51,900 $62,600 $69,800 $81,500 $46,200 $54,900 $61,000 $70,000 $42,600 $50,000 $54,500 $62,500
$42,600 $50,000 $54,500 $62,500
$56,600 $70,000 $90,000 $111,600 $66,000 $76,100 $98,900 $119,300 $56,500 $65,000 $83,600 $95,500 $49,500 $60,800 $75,100 $40,500 $48,300 $57,100
$41,000 $50,000 $57,500
$45,900 $55,000 $67,000 $84,000 $53,000 $62,700 $75,000 $90,400 $47,000 $56,000 $65,600 $80,000 $43,000 $48,400 $60,000 $72,600 $39,000 $43,800 $50,000 $56,900
$39,000 $43,800 $50,000 $56,900
RD Compensation 45

Exhibit 3.13 (continued) RD Compensation by Practice Area and Years in Field
HOURLY WAGE TOTAL CASH COMPENSATION
# answering
- - - - - p e r c e n t i l e s - - - - - - - 10th 25th 50th 75th 90th
# answering
(those employed full time, 1+ years) - - - - p e r c e n t i l e s - - - -
10th 25th 50th 75th 90th
All RDs 6048
food and nutrition management 739 20+ years 405 10 - 19 years 180 5 - 9 years 95 1 - 4 years 50 < 1 year 1 NET: < 5 years 51
consultation and business 444 20+ years 170 10 - 19 years 124 5 - 9 years 66 1 - 4 years 77 < 1 year 1 NET: < 5 years 78
$20.43 $24.04 $28.85 $34.86 $43.27 4475 $43,000 $50,200 $61,000 $75,000 $92,700
$24.52 $29.23 $35.58 $43.08 $51.92 699 $51,500 $62,300 $75,000 $92,000 $113,000 $28.85 $33.65 $38.94 $47.32 $57.21 386 $61,000 $70,000 $82,000 $100,000 $123,300 $25.16 $28.37 $33.77 $38.46 $45.67 173 $53,000 $60,000 $73,000 $83,000 $100,000 $22.60 $25.00 $29.81 $33.65 $39.61 89 $47,300 $53,000 $63,000 $73,400 $83,200 $19.86 $21.59 $24.76 $28.21 $37.38 43 $40,500 $44,400 $50,000 $57,000 $79,200
$19.35 $21.47 $24.52 $28.00 $37.27 43 $40,500 $44,400 $50,000 $57,000 $79,200
$19.23 $25.00 $31.54 $40.05 $54.21 303 $46,500 $57,000 $70,000 $93,500 $124,600 $20.70 $28.85 $35.18 $44.95 $60.00 105 $55,000 $65,100 $80,000 $103,000 $132,200 $24.04 $27.46 $33.65 $41.35 $55.12 90 $52,000 $61,300 $76,500 $96,000 $125,000 $17.76 $22.96 $28.85 $35.70 $40.02 40 $48,000 $51,900 $61,000 $82,900 $100,000 $18.69 $20.92 $25.00 $31.13 $38.46 63 $38,200 $45,000 $53,700 $64,000 $86,300
$18.87 $21.04 $25.06 $31.07 $38.46 63 $38,200 $45,000 $53,700 $64,000 $86,300
Note: Results not shown if fewer than 15 valid values; 10th and 90th percentiles not shown if fewer than 30 valid values.
Compensation & Benefits Survey of the Dietetics Profession 2013 46

Exhibit 3.14 RD Compensation by Practice Area and Education
HOURLY WAGE TOTAL CASH COMPENSATION
# answering
- - - - - p e r c e n t i l e s - - - - - - - 10th 25th 50th 75th 90th
# answering
(those employed full time, 1+ years) - - - - p e r c e n t i l e s - - - -
10th 25th 50th 75th 90th
All RDs 6048
clinical nutrition - acute care/inpatient 1895
doctoral degree 16 master's degree 783
bachelor's degree 1094 associate's degree 1
clinical nutrition - ambulatory care 1042
doctoral degree 6 master's degree 499
bachelor's degree 537 associate's degree
clinical nutrition - long term care 486
doctoral degree 2 master's degree 179
bachelor's degree 305 associate's degree
education and research 360 doctoral degree 144
master's degree 185 bachelor's degree 31
associate's degree
community 715doctoral degree 12 master's degree 346
bachelor's degree 357 associate's degree
food and nutrition management 739doctoral degree 9 master's degree 409
bachelor's degree 321 associate's degree
consultation and business 444doctoral degree 11 master's degree 246
bachelor's degree 187 associate's degree
$20.43 $24.04 $28.85 $34.86 $43.27 4475 $43,000 $50,200 $61,000 $75,000 $92,700
$20.19 $23.08 $26.85 $31.25 $36.92 1355 $42,000 $48,000 $55,400 $65,000 $75,000 $29.05 $36.54 $42.94 13
$20.26 $23.30 $27.00 $31.30 $37.50 567 $43,000 $49,100 $57,000 $66,000 $76,000 $20.19 $22.99 $26.44 $31.25 $36.06 773 $42,000 $47,000 $55,000 $64,000 $73,000
1
$21.15 $24.84 $28.85 $32.98 $38.27 683 $45,000 $52,000 $60,800 $70,000 $80,000 4
$21.63 $25.48 $29.23 $33.65 $39.00 329 $46,200 $53,100 $62,000 $70,000 $82,000 $20.67 $24.04 $28.61 $32.44 $36.54 350 $44,000 $50,000 $60,000 $68,900 $77,800
$20.62 $24.04 $28.37 $34.62 $43.08 304 $42,700 $50,000 $58,400 $70,000 $81,100
$20.67 $24.10 $29.33 $36.06 $46.21 109 $43,000 $50,000 $60,000 $72,000 $84,000 $20.47 $24.04 $27.88 $33.83 $40.00 195 $42,500 $50,000 $58,000 $70,000 $80,000
$20.06 $24.05 $31.25 $39.26 $50.91 273 $46,800 $56,600 $70,000 $90,000 $111,600 $23.08 $28.85 $35.98 $46.09 $57.93 131 $52,100 $65,000 $80,000 $100,000 $121,600 $19.23 $23.75 $28.85 $36.06 $44.23 120 $46,700 $55,000 $66,000 $79,900 $93,800 $19.23 $21.15 $24.04 $33.00 $41.45 22 $42,900 $49,800 $69,600
$19.23 $21.87 $26.06 $31.25 $38.46 583 $40,000 $45,900 $55,000 $67,000 $84,000 11
$19.71 $23.08 $27.29 $33.65 $40.14 286 $41,000 $48,000 $57,100 $71,000 $88,000 $18.45 $20.67 $25.00 $29.81 $35.10 286 $38,000 $43,000 $52,100 $63,000 $73,300
$24.52 $29.23 $35.58 $43.08 $51.92 699 $51,500 $62,300 $75,000 $92,000 $113,000 9
$26.44 $32.02 $37.02 $45.67 $55.29 387 $55,700 $68,000 $78,000 $96,200 $120,000 $22.22 $27.03 $32.69 $39.42 $46.53 303 $47,400 $57,000 $70,000 $83,600 $101,000
$19.23 $25.00 $31.54 $40.05 $54.21 303 $46,500 $57,000 $70,000 $93,500 $124,600 9
$20.22 $25.39 $32.25 $40.50 $56.07 171 $47,000 $58,000 $72,000 $93,500 $129,200 $19.23 $24.04 $30.29 $38.94 $49.51 123 $44,200 $55,000 $65,500 $90,000 $117,800
Note: Results not shown if fewer than 15 valid values; 10th and 90th percentiles not shown if fewer than 30 valid values.
RD Compensation 47

Exhibit 3.15 RD Compensation by Work Setting
HOURLY WAGE TOTAL CASH COMPENSATION
# answering
- - - - - p e r c e n t i l e s - - - - - - - 10th 25th 50th 75th 90th
# answering
(those employed full time, 1+ years) - - - - p e r c e n t i l e s - - - -
10th 25th 50th 75th 90th
All RDs 6048 $20.43 $24.04 $28.85 $34.86 $43.27 4475 $43,000 $50,200 $61,000 $75,000 $92,700
Work Setting acute-care - inpatient 1432 $20.45 $23.56 $27.88 $33.65 $40.38 1147 $43,000 $49,800 $58,800 $72,000 $88,800 acute-care - outpatient 344 $20.45 $24.88 $28.85 $33.65 $39.40 210 $43,000 $52,000 $60,400 $71,000 $84,900 ambulatory/outpatient 753 $22.12 $25.00 $28.85 $33.00 $38.46 514 $45,600 $52,000 $60,100 $68,500 $80,000 long-term/extended care 613 $21.26 $24.73 $28.85 $35.10 $43.27 404 $44,600 $52,000 $61,300 $72,600 $84,800 rehabilitation facility 102 $20.77 $23.89 $27.64 $33.41 $42.36 65 $43,000 $47,900 $55,600 $64,000 $80,800 wellness center or health club 68 $16.98 $20.55 $25.96 $31.19 $35.11 37 $38,400 $46,700 $55,000 $64,800 $70,400 private practice 133 $16.40 $21.17 $30.22 $41.34 $56.92 47 $29,100 $42,000 $56,000 $78,000 $121,000 govt agency/dept 382 $20.67 $25.39 $31.25 $36.92 $44.45 335 $44,600 $53,500 $66,000 $79,000 $95,000 community/public health program 446 $18.99 $22.12 $26.38 $31.25 $36.62 346 $39,700 $46,400 $55,000 $66,100 $79,300 non-profit agency/ organization 204 $20.00 $23.92 $27.43 $34.10 $43.43 153 $42,000 $50,000 $60,000 $77,000 $97,400 faculty 363 $19.33 $23.56 $30.22 $37.50 $50.91 272 $45,000 $54,000 $68,000 $85,800 $110,700 food mfr/dist/retailer 79 $20.83 $24.04 $31.25 $45.91 $54.81 67 $46,100 $56,000 $78,400 $104,400 $141,000 pharmaceutical mfr/dist/retailer 83 $25.53 $31.25 $37.50 $44.23 $56.73 71 $57,900 $75,000 $90,000 $115,000 $135,000 K-12 food service 128 $20.67 $25.00 $31.75 $40.38 $47.14 116 $42,900 $52,100 $69,800 $84,800 $106,500 contract food management company 101 $23.00 $26.69 $33.65 $41.14 $55.29 94 $47,900 $58,900 $74,700 $95,100 $120,500 home health care provider 72 $18.78 $25.79 $31.94 $37.86 $41.56 45 $46,600 $57,600 $68,700 $77,100 $88,600
Note: Results not shown if fewer than 15 valid values; 10th and 90th percentiles not shown if fewer than 30 valid values.
Compensation & Benefits Survey of the Dietetics Profession 2013 48
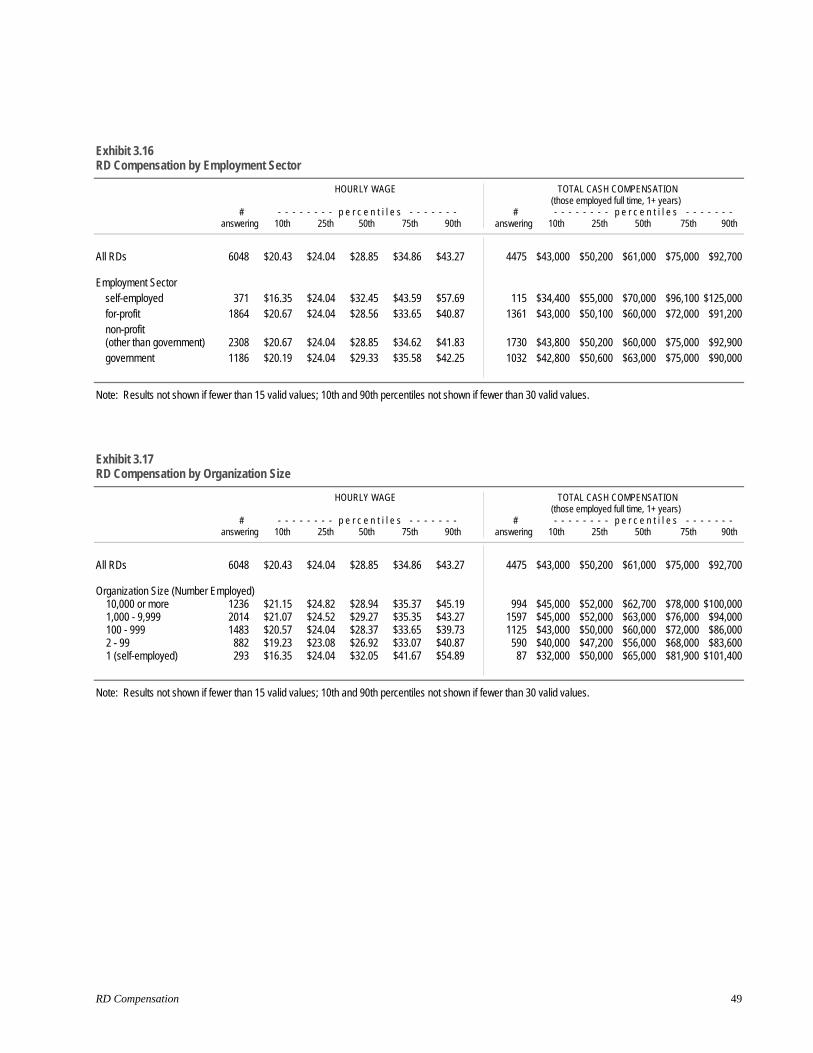
RD Compensation 49
Exhibit 3.16 RD Compensation by Employment Sector
HOURLY WAGE TOTAL CASH COMPENSATION (those employed full time, 1+ years) # - - - - - - - - p e r c e n t i l e s - - - - - - - # - - - - - - - - p e r c e n t i l e s - - - - - - - answering 10th 25th 50th 75th 90th answering 10th 25th 50th 75th 90th
All RDs 6048 $20.43 $24.04 $28.85 $34.86 $43.27 4475 $43,000 $50,200 $61,000 $75,000 $92,700 Employment Sector
self-employed 371 $16.35 $24.04 $32.45 $43.59 $57.69 115 $34,400 $55,000 $70,000 $96,100 $125,000 for-profit 1864 $20.67 $24.04 $28.56 $33.65 $40.87 1361 $43,000 $50,100 $60,000 $72,000 $91,200 non-profit (other than government) 2308 $20.67 $24.04 $28.85 $34.62 $41.83 1730 $43,800 $50,200 $60,000 $75,000 $92,900 government 1186 $20.19 $24.04 $29.33 $35.58 $42.25 1032 $42,800 $50,600 $63,000 $75,000 $90,000
Note: Results not shown if fewer than 15 valid values; 10th and 90th percentiles not shown if fewer than 30 valid values.
Exhibit 3.17 RD Compensation by Organization Size
HOURLY WAGE TOTAL CASH COMPENSATION (those employed full time, 1+ years) # - - - - - - - - p e r c e n t i l e s - - - - - - - # - - - - - - - - p e r c e n t i l e s - - - - - - - answering 10th 25th 50th 75th 90th answering 10th 25th 50th 75th 90th
All RDs 6048 $20.43 $24.04 $28.85 $34.86 $43.27 4475 $43,000 $50,200 $61,000 $75,000 $92,700 Organization Size (Number Employed) 10,000 or more 1236 $21.15 $24.82 $28.94 $35.37 $45.19 994 $45,000 $52,000 $62,700 $78,000 $100,000 1,000 - 9,999 2014 $21.07 $24.52 $29.27 $35.35 $43.27 1597 $45,000 $52,000 $63,000 $76,000 $94,000 100 - 999 1483 $20.57 $24.04 $28.37 $33.65 $39.73 1125 $43,000 $50,000 $60,000 $72,000 $86,000 2 - 99 882 $19.23 $23.08 $26.92 $33.07 $40.87 590 $40,000 $47,200 $56,000 $68,000 $83,600 1 (self-employed) 293 $16.35 $24.04 $32.05 $41.67 $54.89 87 $32,000 $50,000 $65,000 $81,900 $101,400
Note: Results not shown if fewer than 15 valid values; 10th and 90th percentiles not shown if fewer than 30 valid values.

Exhibit 3.18 RD Compensation by Primary Position
HOURLY WAGE TOTAL CASH COMPENSATION
# answering
- - - - - p e r c e n t i l e s - - - - - - - 10th 25th 50th 75th 90th
# answering
(those employed full time, 1+ years) - - - - p e r c e n t i l e s - - - -
10th 25th 50th 75th 90th
All RDs 6048 $20.43 $24.04 $28.85 $34.86 $43.27 4475 $43,000 $50,200 $61,000 $75,000 $92,700
Dietetic Technician, Clinical 6 2 Clinical Dietitian 956 $19.71 $22.24 $25.96 $30.34 $36.06 664 $40,900 $45,400 $53,500 $62,000 $72,400 Clinical Dietitian Specialist:
Bariatrics 51 $19.54 $22.33 $26.92 $30.53 $39.28 31 $40,300 $43,500 $50,000 $60,000 $83,600 Cardiac 27 $23.37 $27.00 $30.72 23 $48,600 $53,000 $65,000 Developmental disorders 19 $22.79 $25.84 $29.33 11 Diabetes 139 $22.49 $26.26 $29.12 $35.58 $40.06 79 $50,000 $55,000 $62,500 $73,000 $86,000 Eating disorders 34 $19.47 $23.37 $25.48 $38.70 $49.24 24 $50,100 $55,500 $77,000 HIV/AIDS 4 2 Oncology 55 $20.15 $22.60 $28.26 $31.73 $38.46 40 $42,000 $47,400 $58,900 $68,500 $79,500 Psychiatric 37 $19.92 $22.60 $25.48 $29.93 $36.35 28 $49,900 $53,000 $59,800 Renal 200 $22.62 $25.00 $28.17 $31.61 $34.94 148 $46,400 $52,000 $60,000 $67,700 $73,000 Substance abuse 3 2 Surgery 16 $26.56 $28.30 $32.04 14 Transplant 21 $24.76 $27.69 $34.26 18 $50,800 $56,000 $71,900
Pediatric/Neonatal Dietitian 161 $20.67 $23.04 $26.44 $32.00 $36.64 124 $42,700 $47,900 $55,300 $66,000 $76,100 Nutrition Support Dietitian 166 $21.63 $24.04 $27.94 $32.28 $36.06 145 $46,000 $50,500 $58,600 $68,700 $77,000
Outpatient Dietitian, General 248 $20.67 $24.04 $28.85 $33.17 $39.20 146 $42,800 $50,000 $61,000 $70,000 $82,500 Outpatient Dietitian Specialist:
Allergy 4 2 Cardiac rehabilitation 17 $23.56 $28.85 $30.61 7 Diabetes 276 $22.60 $25.63 $29.81 $34.22 $40.11 187 $46,000 $53,300 $63,000 $72,500 $85,000 Eating disorders 22 $22.84 $26.92 $32.21 8 Oncology 36 $21.05 $24.22 $27.58 $30.43 $35.68 28 $50,500 $55,500 $63,000 Pediatrics 74 $20.65 $23.08 $28.49 $32.86 $37.50 47 $44,000 $47,800 $54,000 $65,000 $78,000 Renal 214 $23.08 $25.48 $28.59 $31.54 $34.62 151 $48,200 $53,000 $59,500 $66,300 $72,900 Weight Management 93 $18.80 $22.02 $28.37 $32.64 $36.86 68 $41,400 $47,200 $58,500 $67,600 $75,600
Home Care Dietitian 58 $19.23 $26.13 $31.09 $35.22 $38.56 39 $47,000 $57,700 $65,100 $74,600 $83,200
Clinical Dietitian, Long Term Care 484 $20.59 $24.04 $28.34 $34.62 $43.14 302 $42,700 $50,000 $58,100 $70,000 $81,100 Dietetic Technician, Long Term Care 2 2
Instructor/Lecturer 79 $17.95 $21.15 $24.29 $29.33 $40.87 36 $44,500 $48,500 $56,300 $69,800 $87,200 Assistant Professor 61 $23.18 $26.68 $31.25 $36.06 $45.57 57 $49,600 $59,300 $67,500 $78,000 $95,400 Associate Professor 45 $28.75 $31.73 $36.54 $47.39 $60.92 39 $65,000 $70,000 $80,500 $96,000 $116,000 Professor 32 $31.02 $39.66 $49.28 $59.29 $91.49 31 $69,200 $80,000 $110,000 $140,000 $208,000 Administrator, Higher Education 11 9 Didactic Program Director 20 $26.44 $31.63 $35.94 19 $55,000 $68,000 $86,000 Dietetic Internship Director 27 $27.16 $31.87 $35.82 23 $58,000 $69,500 $82,000 Research Dietitian 85 $19.23 $21.88 $28.85 $37.18 $43.65 59 $40,000 $46,600 $60,000 $78,000 $92,000
Compensation & Benefits Survey of the Dietetics Profession 2013 50

Exhibit 3.18 (continued) RD Compensation by Primary Position
HOURLY WAGE TOTAL CASH COMPENSATION
# answering
- - - - - p e r c e n t i l e s - - - - - - - 10th 25th 50th 75th 90th
# answering
(those employed full time, 1+ years) - - - - p e r c e n t i l e s - - - -
10th 25th 50th 75th 90th
All RDs 6048 $20.43 $24.04 $28.85 $34.86 $43.27 4475 $43,000 $50,200 $61,000 $75,000 $92,700
WIC Nutritionist 362 $18.75 $20.90 $25.00 $29.12 $34.56 287 $39,000 $44,000 $51,000 $62,000 $72,000 Public Health Nutritionist 185 $20.26 $23.08 $27.40 $34.86 $43.40 162 $42,000 $48,800 $60,000 $75,000 $90,000 Cooperative Extension Educator/Specialist 56 $18.51 $20.79 $26.44 $33.39 $45.49 45 $38,300 $42,500 $55,000 $70,700 $91,000 School/Child Care Nutritionist 64 $19.60 $22.52 $28.85 $36.06 $43.51 55 $41,600 $48,000 $61,000 $75,000 $87,400 Corrections Dietitian 8 7 Nutrition Coordinator for Head Start Program 21 $21.37 $25.96 $32.85 13 Nutritionist for Food Bank or Assistance Program 19 $22.50 $25.96 $31.25 14
Executive-level Professional 66 $31.03 $38.34 $44.47 $56.15 $70.13 63 $69,000 $80,000 $98,000 $127,000 $170,300 Director of Food and Nutrition Services 285 $25.29 $30.77 $36.54 $45.67 $52.93 272 $53,300 $65,800 $78,500 $98,800 $116,100 Director of Clinical Nutrition 44 $26.44 $30.29 $36.54 $45.37 $55.60 40 $55,100 $63,300 $75,000 $96,600 $124,800 Clinical Nutrition Manager 200 $25.00 $28.85 $33.65 $38.02 $43.05 187 $51,800 $60,000 $72,000 $80,300 $93,000 Assistant Foodservice Director 94 $20.79 $24.79 $32.35 $38.46 $45.12 91 $43,100 $51,000 $69,100 $80,500 $94,300 School Foodservice Director 48 $21.14 $26.80 $32.28 $42.26 $51.35 44 $47,500 $58,300 $70,000 $88,200 $109,000 Dietetic Technician, Foodservice Management 2 2
Private Practice Dietitian - Patient/Client Nutrition Care 90 $15.38 $19.77 $28.85 $39.26 $55.73 38 $24,500 $40,000 $51,000 $75,000 $112,900 Consultant - Community and/or Corporate Programs 98 $19.47 $24.04 $29.91 $39.78 $54.96 52 $41,100 $55,000 $64,800 $87,300 $110,500 Consultant - Communications 17 $26.93 $35.34 $47.11 7 Sales Representative 55 $26.78 $31.25 $36.06 $43.27 $53.84 47 $65,800 $79,000 $93,500 $115,000 $135,400 Public Relations and/or Marketing Professional 18 $23.64 $29.69 $40.08 17 $52,700 $80,500 $93,000 Corporate Dietitian 92 $22.18 $25.48 $31.25 $39.18 $46.01 75 $48,000 $58,000 $65,400 $85,000 $103,000 Research & Development Nutritionist 21 $31.91 $38.46 $45.19 20 $68,900 $81,700 $113,600 Manager of Nutrition Communications 14 12 Director of Nutrition 39 $24.52 $28.85 $33.41 $40.24 $61.54 35 $49,400 $60,000 $69,500 $87,000 $135,800
Note: Results not shown if fewer than 15 valid values; 10th and 90th percentiles not shown if fewer than 30 valid values.
RD Compensation 51

Exhibit 3.19 RD Compensation by Responsibility Level
HOURLY WAGE TOTAL CASH COMPENSATION (those employed full time, 1+ years)
# - - - - - - - - p e r c e n t i l e s - - - - - - # - - - - - - - - p e r c e n t i l e s - - - - - - - answering 10th 25th 50th 75th 90th answering 10th 25th 50th 75th 90th
All RDs 6048
Responsibility Level owner or partner 225
executive 78 director or manager 1343 supervisor or coordinator 1146
other 3193
$20.43
$16.35 $24.04 $23.08 $20.67
$19.78
$24.04
$24.04 $34.13 $27.40 $24.04
$23.08
$28.85
$32.05 $44.86 $33.65 $28.56
$27.16
$34.86
$44.87 $57.69 $40.72
$33.65 $31.73
$43.27
$64.46 $71.11 $50.00
$39.21 $37.55
4475
9471
1230919
2123
$43,000
$31,000 $50,000 $49,500
$43,600 $42,000
$50,200 $61,000 $75,000 $92,700
$55,000 $70,000 $94,300 $137,500 $75,000 $96,000 $130,000 $164,400 $58,900 $72,100 $88,400 $108,900
$50,000 $60,000 $70,000 $85,000 $48,000 $57,000 $66,500 $78,000
Note: Results not shown if fewer than 15 valid values; 10th and 90th percentiles not shown if fewer than 30 valid values.
Exhibit 3.20 RD Compensation by Number Supervised
HOURLY WAGE TOTAL CASH COMPENSATION (those employed full time, 1+ years)
# - - - - - - - - p e r c e n t i l e s - - - - - - # - - - - - - - - p e r c e n t i l e s - - - - - - - answering 10th 25th 50th 75th 90th answering 10th 25th 50th 75th 90th
All RDs 6048 $20.43 $24.04 $28.85 $34.86 $43.27 4475 $43,000 $50,200 $61,000 $75,000 $92,700
Number Supervised 100+ 122 $23.43 $32.60 $43.27 $51.64 $59.89 118 $50,000 $68,900 $92,000 $113,200 $133,100 50 - 99 179 $25.00 $30.46 $38.46 $45.64 $54.67 174 $53,000 $66,000 $81,000 $96,000 $116,000 10 - 49 900 $22.60 $26.44 $32.21 $38.46 $45.94 813 $47,000 $56,000 $69,000 $82,000 $100,000 1 - 9 1397 $20.42 $24.52 $29.07 $35.58 $42.31 1125 $43,000 $51,000 $61,800 $75,000 $92,500 none 3428 $20.00 $23.08 $27.40 $32.29 $38.46 2228 $42,200 $48,300 $57,000 $68,000 $80,500
Note: Results not shown if fewer than 15 valid values; 10th and 90th percentiles not shown if fewer than 30 valid values.
Compensation & Benefits Survey of the Dietetics Profession 2013 52
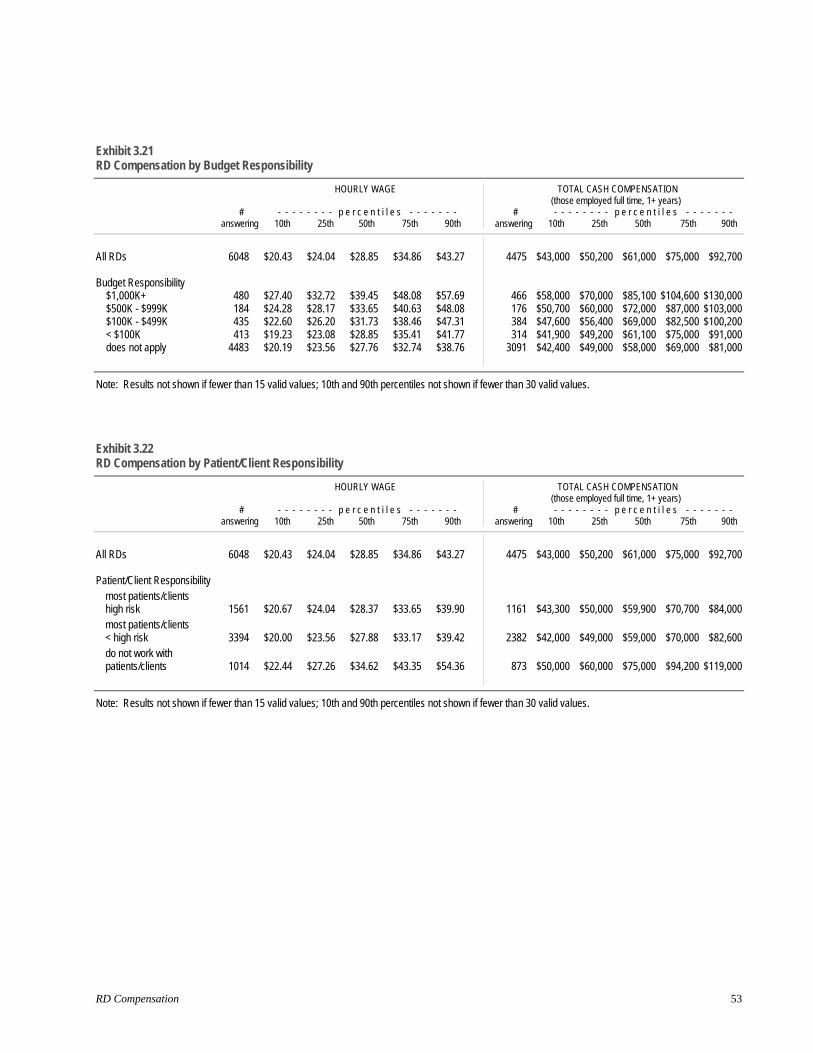
Exhibit 3.21 RD Compensation by Budget Responsibility
HOURLY WAGE TOTAL CASH COMPENSATION
# answering
- - - - - p e r c e n t i l e s - - - - - - - 10th 25th 50th 75th 90th
# answering
(those employed full time, 1+ years) - - - - p e r c e n t i l e s - - - -
10th 25th 50th 75th 90th
All RDs 6048 $20.43 $24.04 $28.85 $34.86 $43.27 4475 $43,000 $50,200 $61,000 $75,000 $92,700
Budget Responsibility $1,000K+ 480 $27.40 $32.72 $39.45 $48.08 $57.69 466 $58,000 $70,000 $85,100 $104,600 $130,000
$500K - $999K 184 $24.28 $28.17 $33.65 $40.63 $48.08 176 $50,700 $60,000 $72,000 $87,000 $103,000 $100K - $499K 435 $22.60 $26.20 $31.73 $38.46 $47.31 384 $47,600 $56,400 $69,000 $82,500 $100,200
< $100K 413 $19.23 $23.08 $28.85 $35.41 $41.77 314 $41,900 $49,200 $61,100 $75,000 $91,000 does not apply 4483 $20.19 $23.56 $27.76 $32.74 $38.76 3091 $42,400 $49,000 $58,000 $69,000 $81,000
Note: Results not shown if fewer than 15 valid values; 10th and 90th percentiles not shown if fewer than 30 valid values.
Exhibit 3.22 RD Compensation by Patient/Client Responsibility
HOURLY WAGE TOTAL CASH COMPENSATION (those employed full time, 1+ years)
# - - - - - - - - p e r c e n t i l e s - - - - - - # - - - - - - - - p e r c e n t i l e s - - - - - - - answering 10th 25th 50th 75th 90th answering 10th 25th 50th 75th 90th
All RDs 6048 $20.43 $24.04 $28.85 $34.86 $43.27
Patient/Client Responsibility most patients/clients high risk 1561 $20.67 $24.04 $28.37 $33.65 $39.90 most patients/clients < high risk 3394 $20.00 $23.56 $27.88 $33.17 $39.42 do not work with patients/clients 1014 $22.44 $27.26 $34.62 $43.35 $54.36
4475 $43,000 $50,200 $61,000 $75,000 $92,700
1161 $43,300 $50,000 $59,900 $70,700 $84,000
2382 $42,000 $49,000 $59,000 $70,000 $82,600
873 $50,000 $60,000 $75,000 $94,200 $119,000
Note: Results not shown if fewer than 15 valid values; 10th and 90th percentiles not shown if fewer than 30 valid values.
RD Compensation 53

Exhibit 3.23 RD Compensation by RD Requirement
HOURLY WAGE TOTAL CASH COMPENSATION (those employed full time, 1+ years)
# - - - - - - - - p e r c e n t i l e s - - - - - - # - - - - - - - - p e r c e n t i l e s - - - - - - - answering 10th 25th 50th 75th 90th answering 10th 25th 50th 75th 90th
All RDs 6048 $20.43 $24.04 $28.85 $34.86 $43.27
RD Requirement RD is required 5039 $20.67 $24.04 $28.85 $34.13 $40.87 RD is preferred 722 $19.25 $24.04 $30.29 $38.46 $50.04 neither 263 $18.79 $23.56 $31.25 $43.27 $55.68
4475 $43,000 $50,200 $61,000 $75,000 $92,700
3648 $43,500 $50,000 $60,000 $72,000 $86,000 599 $42,400 $51,800 $66,300 $88,300 $112,000 211 $40,600 $51,000 $72,800 $96,000 $130,000
Note: Results not shown if fewer than 15 valid values; 10th and 90th percentiles not shown if fewer than 30 valid values.
Exhibit 3.24 RD Compensation by State Licensure Requirement
HOURLY WAGE TOTAL CASH COMPENSATION (those employed full time, 1+ years)
# - - - - - - - - p e r c e n t i l e s - - - - - - # - - - - - - - - p e r c e n t i l e s - - - - - - - answering 10th 25th 50th 75th 90th answering 10th 25th 50th 75th 90th
All RDs 6048 $20.43 $24.04 $28.85 $34.86 $43.27 4475 $43,000 $50,200 $61,000 $75,000 $92,700
State Licensure Requirement licensure is required 3682 $20.19 $23.51 $27.70 $32.86 $39.00 2652 $42,300 $49,000 $58,500 $70,000 $83,000 licensure is not required 2331 $21.15 $25.48 $31.25 $38.46 $48.08 1798 $45,000 $54,000 $67,000 $82,000 $104,000
Note: Results not shown if fewer than 15 valid values; 10th and 90th percentiles not shown if fewer than 30 valid values.
Exhibit 3.25 RD Compensation by Pay Basis
HOURLY WAGE TOTAL CASH COMPENSATION (those employed full time, 1+ years)
# - - - - - - - - p e r c e n t i l e s - - - - - - # - - - - - - - - p e r c e n t i l e s - - - - - - - answering 10th 25th 50th 75th 90th answering 10th 25th 50th 75th 90th
All RDs 6048 $20.43 $24.04 $28.85 $34.86 $43.27 4475 $43,000 $50,200 $61,000 $75,000 $92,700
Pay Basis per diem/hourly fee 1528 $19.23 $23.08 $27.63 $33.96 $43.27 601 $39,200 $46,600 $56,000 $69,200 $83,200 regular wage/salary 4477 $21.00 $24.27 $28.85 $35.10 $42.79 3838 $44,100 $51,500 $62,000 $75,000 $94,000
Note: Results not shown if fewer than 15 valid values; 10th and 90th percentiles not shown if fewer than 30 valid values.
Compensation & Benefits Survey of the Dietetics Profession 2013 54
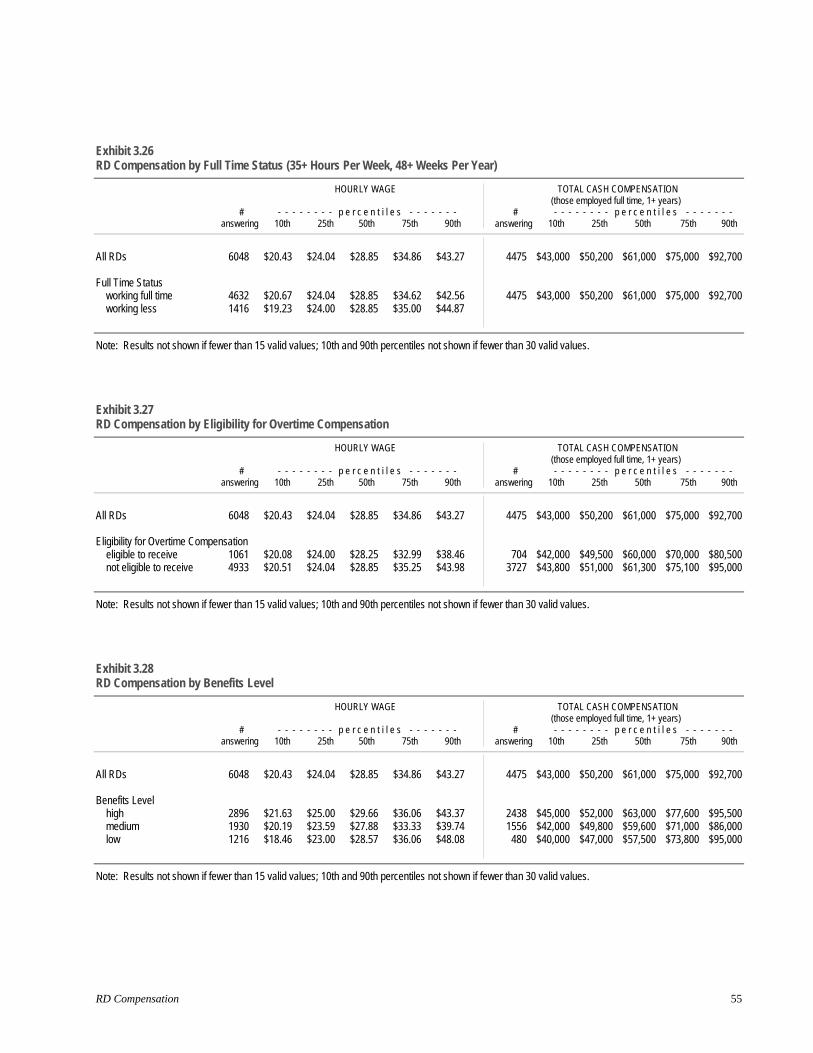
Exhibit 3.26 RD Compensation by Full Time Status (35+ Hours Per Week, 48+ Weeks Per Year)
HOURLY WAGE TOTAL CASH COMPENSATION (those employed full time, 1+ years)
# - - - - - - - - p e r c e n t i l e s - - - - - - # - - - - - - - - p e r c e n t i l e s - - - - - - - answering 10th 25th 50th 75th 90th answering 10th 25th 50th 75th 90th
All RDs 6048 $20.43 $24.04 $28.85 $34.86 $43.27 4475 $43,000 $50,200 $61,000 $75,000 $92,700
Full Time Status working full time 4632 $20.67 $24.04 $28.85 $34.62 $42.56 4475 $43,000 $50,200 $61,000 $75,000 $92,700 working less 1416 $19.23 $24.00 $28.85 $35.00 $44.87
Note: Results not shown if fewer than 15 valid values; 10th and 90th percentiles not shown if fewer than 30 valid values.
Exhibit 3.27 RD Compensation by Eligibility for Overtime Compensation
HOURLY WAGE TOTAL CASH COMPENSATION (those employed full time, 1+ years)
# - - - - - - - - p e r c e n t i l e s - - - - - - # - - - - - - - - p e r c e n t i l e s - - - - - - - answering 10th 25th 50th 75th 90th answering 10th 25th 50th 75th 90th
All RDs 6048 $20.43 $24.04 $28.85 $34.86 $43.27 4475 $43,000 $50,200 $61,000 $75,000 $92,700
Eligibility for Overtime Compensation eligible to receive 1061 $20.08 $24.00 $28.25 $32.99 $38.46 704 $42,000 $49,500 $60,000 $70,000 $80,500 not eligible to receive 4933 $20.51 $24.04 $28.85 $35.25 $43.98 3727 $43,800 $51,000 $61,300 $75,100 $95,000
Note: Results not shown if fewer than 15 valid values; 10th and 90th percentiles not shown if fewer than 30 valid values.
Exhibit 3.28 RD Compensation by Benefits Level
HOURLY WAGE TOTAL CASH COMPENSATION (those employed full time, 1+ years)
# - - - - - - - - p e r c e n t i l e s - - - - - - # - - - - - - - - p e r c e n t i l e s - - - - - - - answering 10th 25th 50th 75th 90th answering 10th 25th 50th 75th 90th
All RDs 6048 $20.43 $24.04 $28.85 $34.86 $43.27
Benefits Level high 2896 $21.63 $25.00 $29.66 $36.06 $43.37 medium 1930 $20.19 $23.59 $27.88 $33.33 $39.74 low 1216 $18.46 $23.00 $28.57 $36.06 $48.08
4475 $43,000 $50,200 $61,000 $75,000 $92,700
2438 $45,000 $52,000 $63,000 $77,600 $95,500 1556 $42,000 $49,800 $59,600 $71,000 $86,000 480 $40,000 $47,000 $57,500 $73,800 $95,000
Note: Results not shown if fewer than 15 valid values; 10th and 90th percentiles not shown if fewer than 30 valid values.
RD Compensation 55
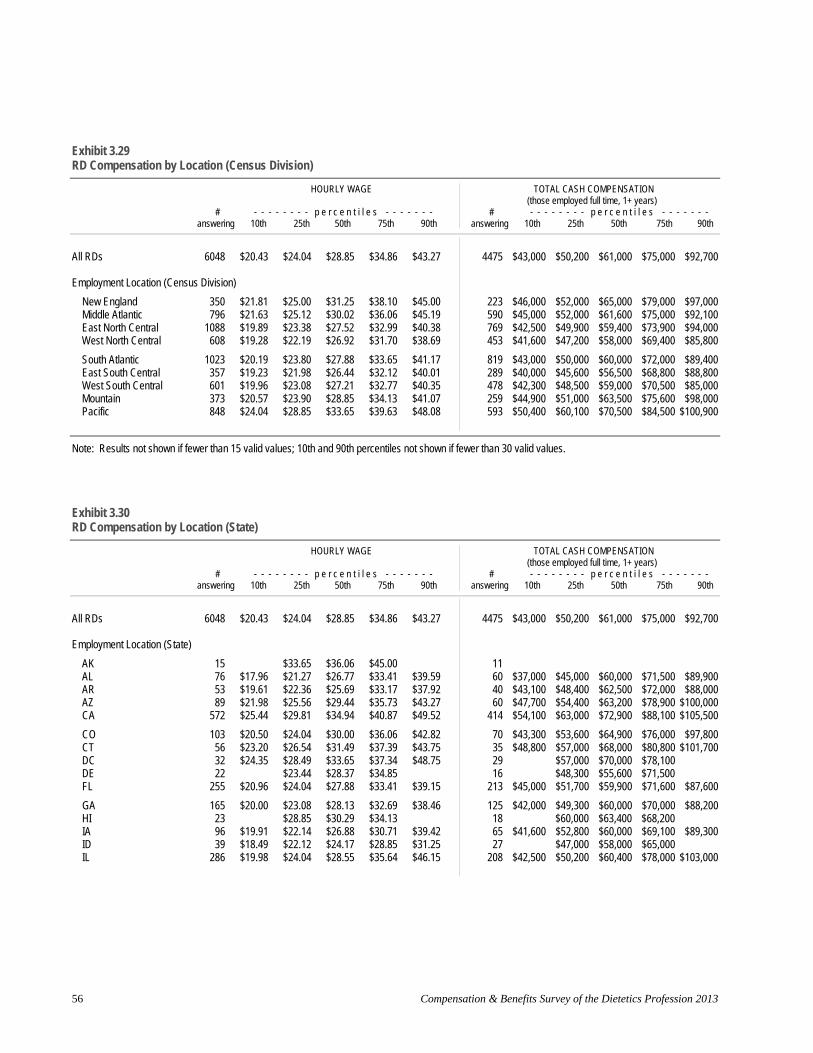
Exhibit 3.29 RD Compensation by Location (Census Division)
HOURLY WAGE TOTAL CASH COMPENSATION
# answering
- - - - - p e r c e n t i l e s - - - - - - - 10th 25th 50th 75th 90th
# answering
(those employed full time, 1+ years) - - - - p e r c e n t i l e s - - - -
10th 25th 50th 75th 90th
All RDs 6048 $20.43 $24.04 $28.85 $34.86 $43.27 4475 $43,000 $50,200 $61,000 $75,000 $92,700
Employment Location (Census Division)
New England 350 Middle Atlantic 796
$21.81 $21.63
$25.00 $25.12
$31.25 $30.02
$38.10 $36.06
$45.00 $45.19
223590
$46,000 $45,000
$52,000 $52,000
$65,000 $61,600
$79,000 $97,000 $75,000 $92,100
East North Central 1088 $19.89 $23.38 $27.52 $32.99 $40.38 769 $42,500 $49,900 $59,400 $73,900 $94,000 West North Central 608 $19.28 $22.19 $26.92 $31.70 $38.69 453 $41,600 $47,200 $58,000 $69,400 $85,800
South Atlantic 1023 $20.19 $23.80 $27.88 $33.65 $41.17 819 $43,000 $50,000 $60,000 $72,000 $89,400 East South Central 357 $19.23 $21.98 $26.44 $32.12 $40.01 289 $40,000 $45,600 $56,500 $68,800 $88,800 West South Central 601 $19.96 $23.08 $27.21 $32.77 $40.35 478 $42,300 $48,500 $59,000 $70,500 $85,000
Mountain 373 $20.57 $23.90 $28.85 $34.13 $41.07 259 $44,900 $51,000 $63,500 $75,600 $98,000 Pacific 848 $24.04 $28.85 $33.65 $39.63 $48.08 593 $50,400 $60,100 $70,500 $84,500 $100,900
Note: Results not shown if fewer than 15 valid values; 10th and 90th percentiles not shown if fewer than 30 valid values.
Exhibit 3.30 RD Compensation by Location (State)
HOURLY WAGE TOTAL CASH COMPENSATION (those employed full time, 1+ years)
# - - - - - - - - p e r c e n t i l e s - - - - - - # - - - - - - - - p e r c e n t i l e s - - - - - - - answering 10th 25th 50th 75th 90th answering 10th 25th 50th 75th 90th
All RDs 6048 $20.43 $24.04 $28.85 $34.86 $43.27 4475 $43,000 $50,200 $61,000 $75,000 $92,700
Employment Location (State)
AK 15 $33.65 $36.06 $45.00 11 AL 76 $17.96 $21.27 $26.77 $33.41 $39.59 60 $37,000 $45,000 $60,000 $71,500 $89,900 AR 53 $19.61 $22.36 $25.69 $33.17 $37.92 40 $43,100 $48,400 $62,500 $72,000 $88,000 AZ 89 $21.98 $25.56 $29.44 $35.73 $43.27 60 $47,700 $54,400 $63,200 $78,900 $100,000 CA 572 $25.44 $29.81 $34.94 $40.87 $49.52 414 $54,100 $63,000 $72,900 $88,100 $105,500
CO 103 $20.50 $24.04 $30.00 $36.06 $42.82 70 $43,300 $53,600 $64,900 $76,000 $97,800 CT 56 $23.20 $26.54 $31.49 $37.39 $43.75 35 $48,800 $57,000 $68,000 $80,800 $101,700 DC 32 $24.35 $28.49 $33.65 $37.34 $48.75 29 $57,000 $70,000 $78,100 DE 22 $23.44 $28.37 $34.85 16 $48,300 $55,600 $71,500 FL 255 $20.96 $24.04 $27.88 $33.41 $39.15 213 $45,000 $51,700 $59,900 $71,600 $87,600
GA 165 $20.00 $23.08 $28.13 $32.69 $38.46 125 $42,000 $49,300 $60,000 $70,000 $88,200 HI 23 $28.85 $30.29 $34.13 18 $60,000 $63,400 $68,200 IA 96 $19.91 $22.14 $26.88 $30.71 $39.42 65 $41,600 $52,800 $60,000 $69,100 $89,300 ID 39 $18.49 $22.12 $24.17 $28.85 $31.25 27 $47,000 $58,000 $65,000 IL 286 $19.98 $24.04 $28.55 $35.64 $46.15 208 $42,500 $50,200 $60,400 $78,000 $103,000
Compensation & Benefits Survey of the Dietetics Profession 2013 56

Exhibit 3.30 (continued) RD Compensation by Location (State)
HOURLY WAGE TOTAL CASH COMPENSATION
# answering
- - - - - p e r c e n t i l e s - - - - - - - 10th 25th 50th 75th 90th
# answering
(those employed full time, 1+ years) - - - - p e r c e n t i l e s - - - -
10th 25th 50th 75th 90th
All RDs 6048
IN 128KS 65KY 75LA 84MA 188
MD 125 ME 29 MI 207MN 168MO 165
MS 57MT 16 NC 196
ND 33 NE 51
NH 21 NJ 156
NM 36 NV 32 NY 353
OH 281OK 67OR 81PA 287PR 15
RI 34 SC 59
SD 30 TN 149TX 397
UT 50VA 119VT 22 WA 155WI 186
WV 35 WY 8
$20.43
$19.23 $21.02 $19.39 $18.88 $22.49
$22.60
$19.98 $20.66 $18.75
$18.26
$19.23$16.85
$20.52
$23.72$19.49 $22.95
$22.33
$19.23 $18.16 $23.08 $19.71
$20.98 $19.23
$20.38 $20.19 $20.67
$19.93 $20.67
$21.94 $21.53
$20.45
$24.04
$21.68 $23.56 $22.16 $21.83 $25.96
$25.66$23.92
$23.08 $24.04 $20.47
$19.86$20.03
$22.60$18.49
$21.63
$22.84 $27.00
$21.69 $27.15
$25.96
$23.08 $20.19 $25.56 $24.04
$16.00
$23.08 $22.12
$23.35 $23.08 $24.04
$22.41 $25.00
$23.48 $26.44 $24.04
$22.44
$28.85
$27.38 $27.40 $25.96 $25.38 $32.33
$33.01$28.61
$26.45 $28.29 $25.53
$26.44$24.28
$25.06$22.04
$26.92
$27.88 $32.75
$28.99 $31.01
$30.82
$26.92 $24.52 $30.42 $27.40
$23.08
$27.64 $25.00
$26.78 $26.72 $27.99
$26.38 $29.12
$30.58 $30.05 $27.84
$27.40
$34.86
$32.06 $34.62 $30.29 $30.76 $38.68
$39.17$32.74
$31.97 $33.65 $31.25
$33.65$31.73
$29.81$29.52
$31.25
$35.37 $38.87
$35.70 $34.86
$36.78
$31.96 $32.69 $36.99 $32.50
$35.90
$33.65 $30.29
$37.02 $32.21 $33.09
$32.30 $36.78
$41.63 $34.62 $32.51
$31.25
$43.27
$38.46 $41.93 $40.38 $37.98 $45.51
$48.22
$40.46 $39.95 $36.06
$42.22
$35.39 $34.23
$39.69
$48.47 $38.98 $40.95
$47.92
$38.94 $46.96 $47.69 $40.25
$37.26 $35.88
$52.47 $40.06 $40.58
$48.74 $45.19
$42.21 $38.71
$41.73
4475
83515962
121
10021
153126135
4710
1531836
11 104
2525
269
1935155
21713
234722
123325
369412 93
132
296
$43,000
$40,200 $45,200 $40,000 $39,200 $46,600
$46,500
$42,200 $43,500 $40,000
$38,000
$42,000
$42,000
$50,000
$47,000
$41,300 $39,000 $45,000 $41,000
$40,000
$42,000 $43,000
$40,900 $43,500
$48,100 $45,000
$50,200 $61,000 $75,000 $92,700
$46,100 $60,000 $76,500 $91,200 $50,000 $60,000 $75,000 $100,000 $46,100 $54,000 $62,000 $75,800 $45,000 $56,500 $69,500 $79,500 $54,600 $68,000 $80,000 $99,200
$53,300 $68,500 $81,600 $102,700 $47,200 $55,000 $68,300
$49,000 $57,000 $69,800 $93,400 $50,000 $60,800 $72,000 $86,000 $45,500 $55,300 $67,000 $80,600
$42,000 $58,400 $72,000 $96,700
$48,300 $53,000 $63,800 $76,500 $36,900 $42,800 $61,100 $44,600 $55,800 $64,800 $83,000
$57,100 $69,900 $82,800 $113,500 $48,300 $65,000 $76,000 $56,100 $65,000 $73,400 $53,000 $64,000 $75,600 $93,000
$48,100 $56,300 $72,000 $90,000 $43,000 $54,000 $68,000 $93,600 $51,000 $64,000 $75,700 $101,600 $50,000 $58,000 $70,000 $82,600
$48,000 $58,000 $70,500 $45,000 $52,000 $66,600 $73,000 $49,500 $60,000 $69,800 $46,000 $56,500 $69,000 $90,000 $49,800 $60,000 $71,600 $87,000
$48,000 $62,400 $85,300 $122,600 $52,000 $63,000 $79,200 $98,500
$55,000 $63,700 $75,000 $89,700 $50,800 $60,000 $73,500 $87,900
$52,500 $60,100 $69,900
Note: Results not shown if fewer than 15 valid values; 10th and 90th percentiles not shown if fewer than 30 valid values.
RD Compensation 57

Exhibit 3.31 RD Compensation by Location (Metro Area)
HOURLY WAGE TOTAL CASH COMPENSATION
# answering
- - - - - p e r c e n t i l e s - - - - - - - 10th 25th 50th 75th 90th
# answering
(those employed full time, 1+ years) - - - - p e r c e n t i l e s - - - -
10th 25th 50th 75th 90th
All RDs 6048 $20.43
Employment Location (Metropolitan Area)
Akron OH 27Albany-Schenectady-Troy NY 25 Albuquerque NM 31 $19.48Ann Arbor MI 21Atlanta-Sandy Springs- Marietta GA 104 $20.19
Austin-Round Rock- San Marcos TX 36 $17.67Baltimore-Towson MD 63 $21.81Birmingham-Hoover AL 27Boston-Cambridge-Quincy MA-NH 139 $22.36Buffalo-Niagara Falls NY 34 $19.47
Charlotte-Gastonia-Rock Hill NC-SC 35 $19.81Chicago-Naperville-Joliet IL-IN-WI 228 $21.63Cincinnati-Middletown OH-KY-IN 50 $19.71Cleveland-Elyria-Mentor OH 65 $19.23Columbia SC 17
Columbus OH 51 $19.40Dallas-Fort Worth-Arlington TX 119 $22.12Dayton OH 16 Denver-Aurora CO 63 $21.33Des Moines- West Des Moines IA 24
Detroit-Warren-Livonia MI 65 $22.72Durham NC 28Grand Rapids-Wyoming MI 18 Hartford-West Hartford- East Hartford CT 24 Houston-Sugar Land- Baytown TX 93 $20.38
Indianapolis-Carmel IN 52 $19.88Jackson MS 20Jacksonville FL 24Kansas City MO-KS 62 $20.93Knoxville TN 28
$24.04
$20.70$25.72
$21.63 $21.64
$23.14
$20.67 $24.04 $25.24
$25.96 $21.95
$23.08
$25.00
$22.29 $23.56
$19.77
$24.52
$24.04$21.40
$25.00
$25.04
$25.00 $23.68
$23.91
$26.54
$24.04
$22.02 $20.19 $21.63 $22.86
$20.97
$28.85
$25.00$29.81
$28.85 $28.37
$28.55
$25.24 $31.25 $30.77
$32.69 $25.32
$26.44
$28.85
$27.37 $28.37
$23.77
$28.85
$28.61$24.04
$30.61
$30.15
$27.40 $25.96
$28.37
$31.17
$28.85
$28.13 $25.14 $25.00 $26.38
$24.55
$34.86
$34.62 $36.92
$36.06 $34.38
$32.86
$28.61 $35.40
$39.42
$38.94$31.73
$34.62
$36.06
$32.93$33.65 $25.51
$34.62
$33.65 $27.86
$36.06
$38.10
$31.48 $30.53
$36.30
$34.84
$34.66
$33.31 $29.63 $28.85 $31.89
$31.17
$43.27
$42.04
$41.41
$32.69 $46.60
$48.08 $37.59
$38.65
$46.33
$43.89 $39.65
$42.79
$40.87
$41.49
$40.58
$45.50
$40.53
$40.82
4475
19192017
78
3348 22
9625
27
170
374414
32
9510 47
17
462214
16
77
3517194418
$43,000
$42,000
$37,200$44,800
$47,900
$45,100
$40,400 $45,700
$43,000
$44,600
$45,500
$47,900
$42,200
$41,400
$42,800
$50,200 $61,000 $75,000 $92,700
$48,100 $53,000 $70,000 $53,000 $62,000 $75,000 $46,900 $63,800 $76,800 $50,800 $64,900 $81,000
$48,400 $60,000 $70,000 $96,400
$43,400 $54,000 $62,600 $80,200 $47,600 $60,900 $78,400 $105,400 $51,900 $67,500 $86,400
$54,700 $69,000 $83,100 $100,300 $45,300 $54,000 $73,200
$48,800 $55,000 $68,000
$51,500 $61,000 $80,000 $103,000
$46,800 $58,200 $75,100 $92,600 $50,300 $60,100 $76,500 $101,500
$51,300 $65,500 $83,800 $114,800
$50,000 $60,500 $73,000 $85,400
$55,000 $64,900 $75,000 $115,600
$56,200 $65,600 $84,700
$52,000 $56,500 $70,200 $93,300 $52,000 $59,000 $70,000
$55,500 $66,400 $73,300
$51,000 $62,000 $77,500 $98,500
$46,100 $60,900 $78,000 $95,500 $45,800 $53,900 $64,000 $45,000 $52,000 $63,800 $48,300 $60,000 $74,300 $94,000
$43,900 $52,900 $67,500
Compensation & Benefits Survey of the Dietetics Profession 2013 58
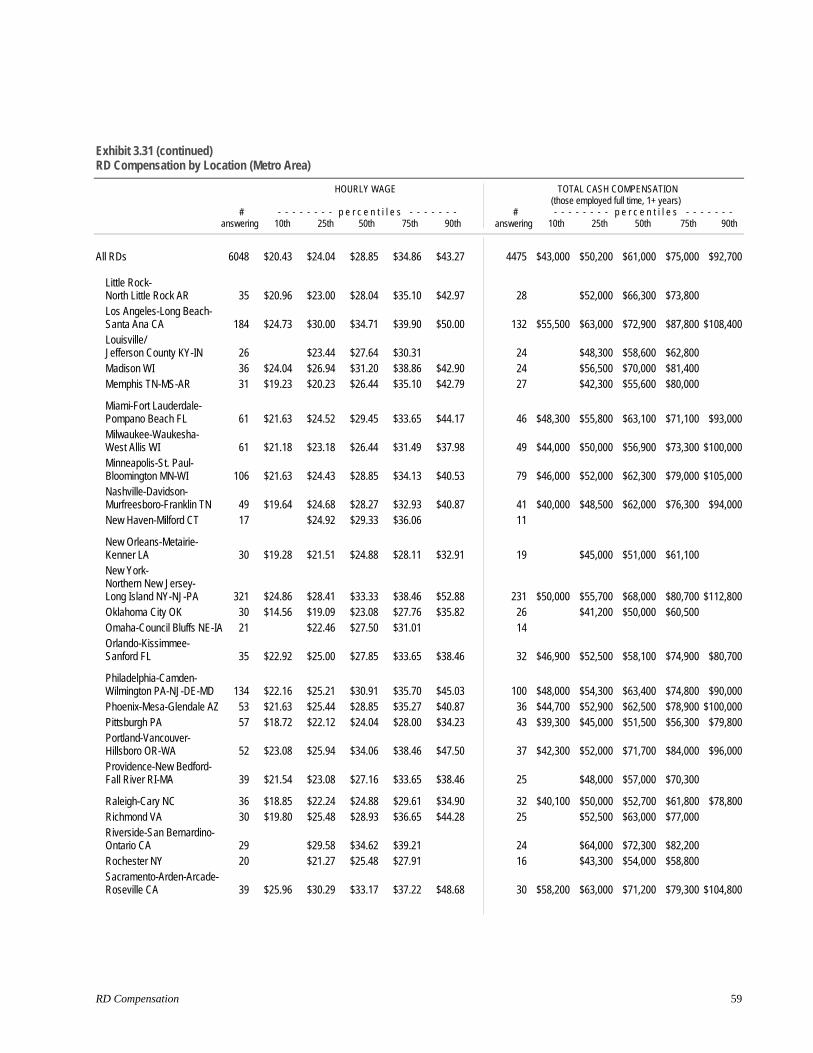
Exhibit 3.31 (continued) RD Compensation by Location (Metro Area)
HOURLY WAGE TOTAL CASH COMPENSATION
# answering
- - - - - p e r c e n t i l e s - - - - - - - 10th 25th 50th 75th 90th
# answering
(those employed full time, 1+ years) - - - - p e r c e n t i l e s - - - -
10th 25th 50th 75th 90th
All RDs 6048 $20.43 $24.04 $28.85 $34.86 $43.27 4475 $43,000 $50,200 $61,000 $75,000 $92,700
Little Rock-North Little Rock AR 35 $20.96 $23.00 $28.04 $35.10 $42.97 28 $52,000 $66,300 $73,800 Los Angeles-Long Beach- Santa Ana CA 184 $24.73 $30.00 $34.71 $39.90 $50.00 132 $55,500 $63,000 $72,900 $87,800 $108,400 Louisville/ Jefferson County KY-IN 26 $23.44 $27.64 $30.31 24 $48,300 $58,600 $62,800 Madison WI 36 $24.04 $26.94 $31.20 $38.86 $42.90 24 $56,500 $70,000 $81,400 Memphis TN-MS-AR 31 $19.23 $20.23 $26.44 $35.10 $42.79 27 $42,300 $55,600 $80,000
Miami-Fort Lauderdale- Pompano Beach FL 61 $21.63 $24.52 $29.45 $33.65 $44.17 46 $48,300 $55,800 $63,100 $71,100 $93,000 Milwaukee-Waukesha- West Allis WI 61 $21.18 $23.18 $26.44 $31.49 $37.98 49 $44,000 $50,000 $56,900 $73,300 $100,000 Minneapolis-St. Paul- Bloomington MN-WI 106 $21.63 $24.43 $28.85 $34.13 $40.53 79 $46,000 $52,000 $62,300 $79,000 $105,000 Nashville-DavidsonMurfreesboro-Franklin TN 49 $19.64 $24.68 $28.27 $32.93 $40.87 41 $40,000 $48,500 $62,000 $76,300 $94,000 New Haven-Milford CT 17 $24.92 $29.33 $36.06 11
New Orleans-Metairie- Kenner LA 30 $19.28 $21.51 $24.88 $28.11 $32.91 19 $45,000 $51,000 $61,100 New York- Northern New Jersey- Long Island NY-NJ-PA 321 $24.86 $28.41 $33.33 $38.46 $52.88 231 $50,000 $55,700 $68,000 $80,700 $112,800 Oklahoma City OK 30 $14.56 $19.09 $23.08 $27.76 $35.82 26 $41,200 $50,000 $60,500 Omaha-Council Bluffs NE-IA 21 $22.46 $27.50 $31.01 14 Orlando-Kissimmee- Sanford FL 35 $22.92 $25.00 $27.85 $33.65 $38.46 32 $46,900 $52,500 $58,100 $74,900 $80,700
Philadelphia-Camden- Wilmington PA-NJ-DE-MD 134 $22.16 $25.21 $30.91 $35.70 $45.03 100 $48,000 $54,300 $63,400 $74,800 $90,000 Phoenix-Mesa-Glendale AZ 53 $21.63 $25.44 $28.85 $35.27 $40.87 36 $44,700 $52,900 $62,500 $78,900 $100,000 Pittsburgh PA 57 $18.72 $22.12 $24.04 $28.00 $34.23 43 $39,300 $45,000 $51,500 $56,300 $79,800 Portland-Vancouver- Hillsboro OR-WA 52 $23.08 $25.94 $34.06 $38.46 $47.50 37 $42,300 $52,000 $71,700 $84,000 $96,000 Providence-New Bedford- Fall River RI-MA 39 $21.54 $23.08 $27.16 $33.65 $38.46 25 $48,000 $57,000 $70,300
Raleigh-Cary NC 36 $18.85 $22.24 $24.88 $29.61 $34.90 32 $40,100 $50,000 $52,700 $61,800 $78,800 Richmond VA 30 $19.80 $25.48 $28.93 $36.65 $44.28 25 $52,500 $63,000 $77,000 Riverside-San Bernardino- Ontario CA 29 $29.58 $34.62 $39.21 24 $64,000 $72,300 $82,200 Rochester NY 20 $21.27 $25.48 $27.91 16 $43,300 $54,000 $58,800 Sacramento-Arden-Arcade- Roseville CA 39 $25.96 $30.29 $33.17 $37.22 $48.68 30 $58,200 $63,000 $71,200 $79,300 $104,800
RD Compensation 59
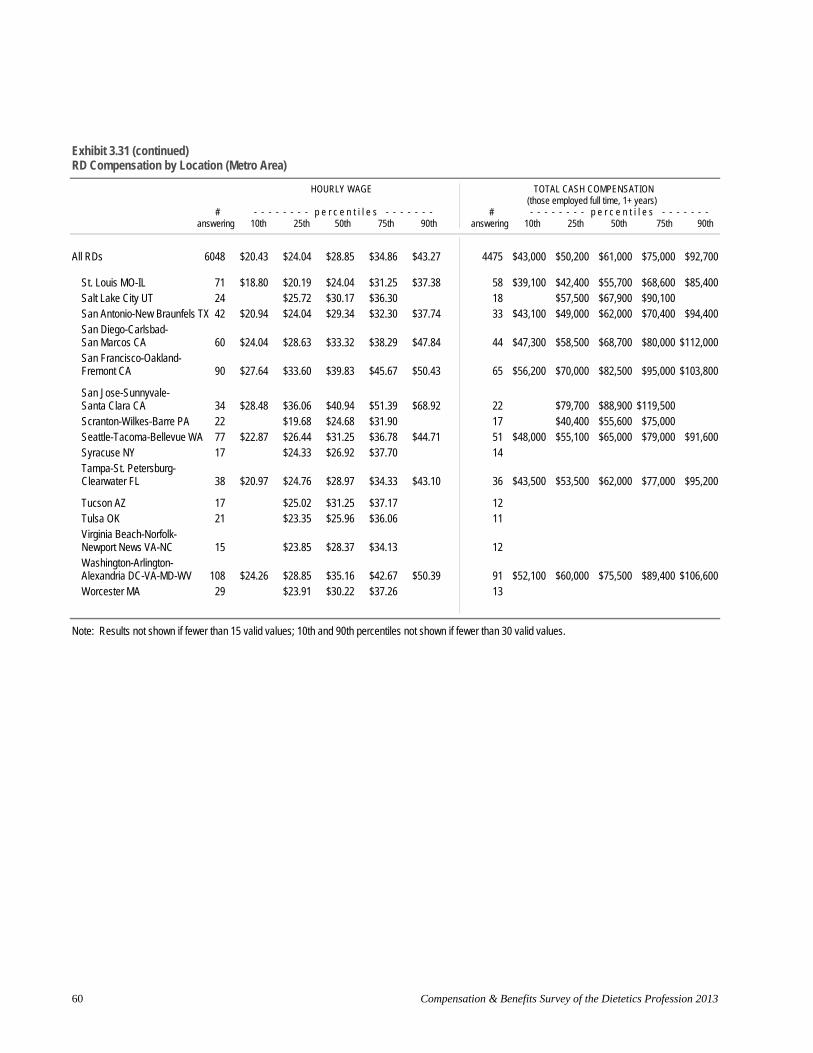
Exhibit 3.31 (continued) RD Compensation by Location (Metro Area)
HOURLY WAGE TOTAL CASH COMPENSATION
# answering
- - - - - p e r c e n t i l e s - - - - - - - 10th 25th 50th 75th 90th
# answering
(those employed full time, 1+ years) - - - - p e r c e n t i l e s - - - -
10th 25th 50th 75th 90th
All RDs 6048 $20.43 $24.04 $28.85 $34.86 $43.27 4475
St. Louis MO-IL 71 $18.80 $20.19 $24.04 $31.25 $37.38 58Salt Lake City UT 24 $25.72 $30.17 $36.30 18San Antonio-New Braunfels TX 42 $20.94 $24.04 $29.34 $32.30 $37.74 33 San Diego-Carlsbad- San Marcos CA 60 $24.04 $28.63 $33.32 $38.29 $47.84 44San Francisco-Oakland- Fremont CA 90 $27.64 $33.60 $39.83 $45.67 $50.43 65
San Jose-Sunnyvale- Santa Clara CA 34 $28.48 $36.06 $40.94 $51.39 $68.92 22Scranton-Wilkes-Barre PA 22 $19.68 $24.68 $31.90 17Seattle-Tacoma-Bellevue WA 77 $22.87 $26.44 $31.25 $36.78 $44.71 51Syracuse NY 17 $24.33 $26.92 $37.70 14 Tampa-St. Petersburg- Clearwater FL 38 $20.97 $24.76 $28.97 $34.33 $43.10 36
Tucson AZ 17 $25.02 $31.25 $37.17 12 Tulsa OK 21 $23.35 $25.96 $36.06 11 Virginia Beach-Norfolk- Newport News VA-NC 15 $23.85 $28.37 $34.13 12 Washington-Arlington- Alexandria DC-VA-MD-WV 108 $24.26 $28.85 $35.16 $42.67 $50.39 91Worcester MA 29 $23.91 $30.22 $37.26 13
$43,000 $50,200 $61,000 $75,000 $92,700
$39,100
$43,100
$42,400 $57,500
$49,000
$55,700 $67,900 $62,000
$68,600 $85,400 $90,100 $70,400 $94,400
$47,300 $58,500 $68,700 $80,000 $112,000
$56,200 $70,000 $82,500 $95,000 $103,800
$48,000
$79,700 $40,400 $55,100
$88,900 $119,500 $55,600 $65,000
$75,000 $79,000 $91,600
$43,500 $53,500 $62,000 $77,000 $95,200
$52,100 $60,000 $75,500 $89,400 $106,600
Note: Results not shown if fewer than 15 valid values; 10th and 90th percentiles not shown if fewer than 30 valid values.
Compensation & Benefits Survey of the Dietetics Profession 2013 60

4. DTR Compensation
Notes
Tables in this section report compensation for the 747 Dietetic Technicians, Registered (DTRs) who provided complete hour and compensation information. Results are broken out by a number of factors to demonstrate the relative effects of qualifications, experience, and employment situation in determining compensation levels.
Note that all factors are based on respondent self-reports and are thus subject to some variation in how terms were understood.
Two measures are reported: hourly wage and total cash compensation.
In accordance with Bureau of Labor Statistics practice, hourly wage may be converted to an annualized salary by multiplying the wage by 40 hours per week and 52 weeks per year.
Total cash compensation is reported only for practitioners employed or self-employed in the position full time for at least one year, and includes sources of compensation beyond salary/wages, such as overtime pay, on-call pay, commissions, bonuses, incentive pay, profit sharing or distributions, and cash retirement benefits received. For some workers, such as consultants, salespeople, and executives, a significant part of their compensation can come from sources other than salary. For such individuals, total cash compensation provides a more accurate picture of compensation than wages alone.
In addition to the number of individuals answering, five percentile values are reported for each measure: 10% of practitioners earn less than the 10th percentile, 25% earn less than the 25th percentile, and so on. All percentiles are suppressed if there are fewer than 15 valid responses; the 10th and 90th percentiles are suppressed if there are fewer than 30 valid responses.
Compensation by location is reported in terms of the nine standard Census Divisions:
DTR Compensation 61

Exhibit 4.1 DTR Compensation 2013 Versus 2011
HOURLY WAGE TOTAL CASH COMPENSATION
# answering
- - - - - p e r c e n t i l e s - - - - - - - 10th 25th 50th 75th 90th
# answering
(those employed full time, 1+ years) - - - - p e r c e n t i l e s - - - -
10th 25th 50th 75th 90th
All DTRs - 2013 747 $13.67 $16.30 $19.23 $23.08 $28.65 610 $29,500 $34,600 $40,000 $50,000 $60,000
All DTRs - 2011 759 $14.25 $16.48 $19.23 $22.95 $27.16 599 $30,000 $35,000 $40,000 $48,000 $58,000
% change -4.1% -1.1% 0.0% 0.6% 5.5% -1.7% -1.1% 0.0% 4.2% 3.4%
Note: Results not shown if fewer than 15 valid values; 10th and 90th percentiles not shown if fewer than 30 valid values.
Exhibit 4.2 DTR Compensation by Years in Field
# answering
HOURLY WAGE
- - - - - p e r c e n t i l e s - - - - - - - 10th 25th 50th 75th 90th
# answering
TOTAL CASH COMPENSATION (those employed full time, 1+ years)
- - - - p e r c e n t i l e s - - - -10th 25th 50th 75th 90th
All DTRs 747
Years in Field 20+ years 10 - 19 years 5 - 9 years 1 - 4 years < 1 year NET: < 5 years
343 182
68 134
8 142
$13.67 $16.30 $19.23 $23.08 $28.65 610 $29,500 $34,600 $40,000 $50,000 $60,000
$15.46 $18.41 $20.67 $24.04 $28.85 294 $32,000 $38,300 $44,000 $52,000 $61,500 $14.42 $16.83 $19.36 $23.03 $30.82 155 $30,000 $35,000 $40,000 $50,000 $65,000 $13.36 $16.03 $18.27 $21.84 $25.72 56 $29,400 $34,900 $39,300 $47,700 $55,000 $11.78 $13.69 $15.59 $18.80 $22.60 94 $24,000 $28,900 $32,400 $38,100 $48,300
1 $12.02 $13.82 $15.80 $18.75 $21.97 95 $24,000 $28,600 $32,200 $38,000 $48,200
Note: Results not shown if fewer than 15 valid values; 10th and 90th percentiles not shown if fewer than 30 valid values.
Compensation & Benefits Survey of the Dietetics Profession 2013 62

Exhibit 4.3 DTR Compensation by Years in Position
HOURLY WAGE TOTAL CASH COMPENSATION (those employed full time, 1+ years)
# - - - - - - - - p e r c e n t i l e s - - - - - - # - - - - - - - - p e r c e n t i l e s - - - - - - - answering 10th 25th 50th 75th 90th answering 10th 25th 50th 75th 90th
All DTRs 747 $13.67 $16.30 $19.23 $23.08 $28.65
Years in Position 10+ years 391 $15.38 $17.98 $20.30 $24.04 $28.85 5 - 9 years 121 $13.46 $16.47 $19.59 $22.60 $28.69 1 - 4 years 208 $12.29 $14.42 $16.83 $19.84 $23.63 < 1 year 23 $13.85 $16.80 $19.23
610 $29,500 $34,600 $40,000 $50,000 $60,000
335 $32,000 $38,000 $43,000 $52,000 $62,200 107 $28,100 $35,500 $41,000 $49,000 $62,000 168 $25,600 $30,000 $35,000 $41,600 $50,100
Note: Results not shown if fewer than 15 valid values; 10th and 90th percentiles not shown if fewer than 30 valid values.
Exhibit 4.4 DTR Compensation by Prior Career
HOURLY WAGE TOTAL CASH COMPENSATION (those employed full time, 1+ years)
# - - - - - - - - p e r c e n t i l e s - - - - - - # - - - - - - - - p e r c e n t i l e s - - - - - - - answering 10th 25th 50th 75th 90th answering 10th 25th 50th 75th 90th
All DTRs 747 $13.67 $16.30 $19.23 $23.08 $28.65 610 $29,500 $34,600 $40,000 $50,000 $60,000
Prior Career dietetics is second career 156 $14.28 $16.37 $19.23 $22.12 $26.44 127 $30,800 $35,000 $40,000 $48,000 $56,200 dietetics is first career 582 $13.46 $16.09 $19.23 $23.08 $28.85 475 $29,000 $34,000 $40,000 $50,000 $60,600
Note: Results not shown if fewer than 15 valid values; 10th and 90th percentiles not shown if fewer than 30 valid values.
DTR Compensation 63
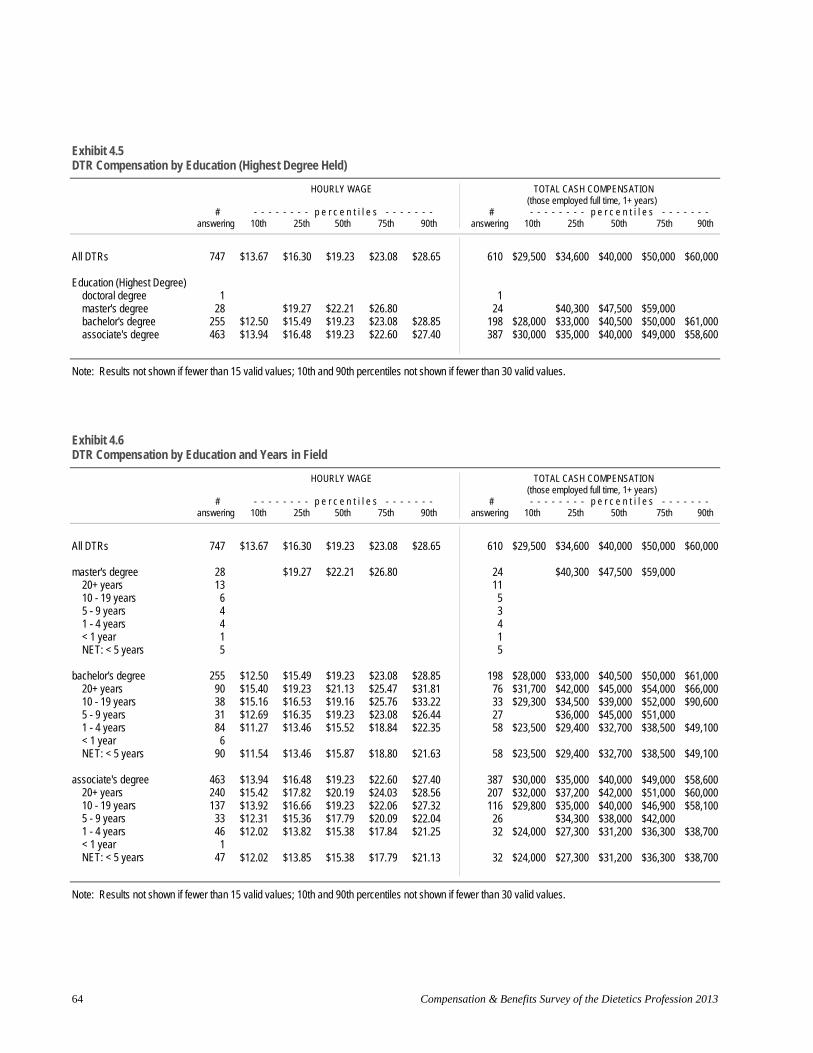
Exhibit 4.5 DTR Compensation by Education (Highest Degree Held)
HOURLY WAGE TOTAL CASH COMPENSATION
# answering
- - - - - p e r c e n t i l e s - - - - - - - 10th 25th 50th 75th 90th
# answering
(those employed full time, 1+ years) - - - - p e r c e n t i l e s - - - -
10th 25th 50th 75th 90th
All DTRs 747 $13.67 $16.30 $19.23 $23.08 $28.65
Education (Highest Degree) doctoral degree 1 master's degree 28 $19.27 $22.21 $26.80
bachelor's degree 255 $12.50 $15.49 $19.23 $23.08 $28.85 associate's degree 463 $13.94 $16.48 $19.23 $22.60 $27.40
610 $29,500 $34,600 $40,000 $50,000 $60,000
1 24 $40,300 $47,500 $59,000
198 $28,000 $33,000 $40,500 $50,000 $61,000 387 $30,000 $35,000 $40,000 $49,000 $58,600
Note: Results not shown if fewer than 15 valid values; 10th and 90th percentiles not shown if fewer than 30 valid values.
Exhibit 4.6 DTR Compensation by Education and Years in Field
HOURLY WAGE TOTAL CASH COMPENSATION (those employed full time, 1+ years)
# - - - - - - - - p e r c e n t i l e s - - - - - - # - - - - - - - - p e r c e n t i l e s - - - - - - - answering 10th 25th 50th 75th 90th answering 10th 25th 50th 75th 90th
All DTRs 747
master's degree 2820+ years 13 10 - 19 years 6 5 - 9 years 4 1 - 4 years 4 < 1 year 1 NET: < 5 years 5
bachelor's degree 255 20+ years 90 10 - 19 years 38 5 - 9 years 31 1 - 4 years 84 < 1 year 6 NET: < 5 years 90
associate's degree 463 20+ years 240 10 - 19 years 137 5 - 9 years 33 1 - 4 years 46 < 1 year 1 NET: < 5 years 47
$13.67 $16.30 $19.23 $23.08 $28.65 610 $29,500 $34,600 $40,000 $50,000 $60,000
$19.27 $22.21 $26.80 2411
$40,300 $47,500 $59,000
5 3 4 1 5
$12.50$15.40 $15.16 $12.69 $11.27
$15.49$19.23 $16.53 $16.35 $13.46
$19.23$21.13 $19.16 $19.23 $15.52
$23.08 $25.47 $25.76 $23.08 $18.84
$28.85 $31.81 $33.22 $26.44 $22.35
19876332758
$28,000 $31,700 $29,300
$23,500
$33,000 $42,000 $34,500 $36,000 $29,400
$40,500 $45,000 $39,000 $45,000 $32,700
$50,000 $54,000 $52,000 $51,000 $38,500
$61,000 $66,000 $90,600
$49,100
$11.54 $13.46 $15.87 $18.80 $21.63 58 $23,500 $29,400 $32,700 $38,500 $49,100
$13.94$15.42 $13.92 $12.31 $12.02
$16.48$17.82 $16.66 $15.36 $13.82
$19.23$20.19 $19.23 $17.79 $15.38
$22.60 $24.03 $22.06 $20.09 $17.84
$27.40 $28.56 $27.32 $22.04 $21.25
387207116
2632
$30,000 $32,000 $29,800
$24,000
$35,000 $37,200 $35,000 $34,300 $27,300
$40,000 $42,000 $40,000 $38,000 $31,200
$49,000 $51,000 $46,900 $42,000 $36,300
$58,600 $60,000 $58,100
$38,700
$12.02 $13.85 $15.38 $17.79 $21.13 32 $24,000 $27,300 $31,200 $36,300 $38,700
Note: Results not shown if fewer than 15 valid values; 10th and 90th percentiles not shown if fewer than 30 valid values.
Compensation & Benefits Survey of the Dietetics Profession 2013 64
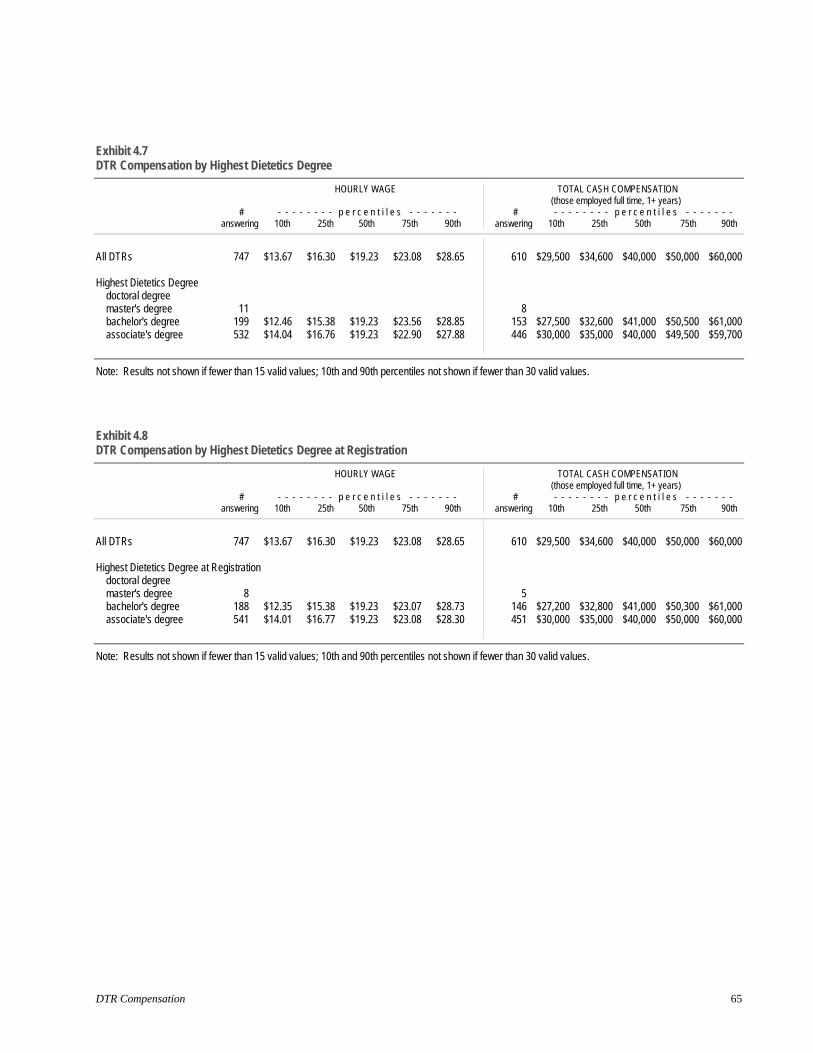
Exhibit 4.7 DTR Compensation by Highest Dietetics Degree
HOURLY WAGE TOTAL CASH COMPENSATION
# answering
- - - - - p e r c e n t i l e s - - - - - - - 10th 25th 50th 75th 90th
# answering
(those employed full time, 1+ years) - - - - p e r c e n t i l e s - - - -
10th 25th 50th 75th 90th
All DTRs 747 $13.67 $16.30 $19.23 $23.08 $28.65
Highest Dietetics Degree doctoral degree master's degree 11
bachelor's degree 199 $12.46 $15.38 $19.23 $23.56 $28.85 associate's degree 532 $14.04 $16.76 $19.23 $22.90 $27.88
610 $29,500 $34,600 $40,000 $50,000 $60,000
8 153 $27,500 $32,600 $41,000 $50,500 $61,000 446 $30,000 $35,000 $40,000 $49,500 $59,700
Note: Results not shown if fewer than 15 valid values; 10th and 90th percentiles not shown if fewer than 30 valid values.
Exhibit 4.8 DTR Compensation by Highest Dietetics Degree at Registration
HOURLY WAGE TOTAL CASH COMPENSATION (those employed full time, 1+ years)
# - - - - - - - - p e r c e n t i l e s - - - - - - # - - - - - - - - p e r c e n t i l e s - - - - - - - answering 10th 25th 50th 75th 90th answering 10th 25th 50th 75th 90th
All DTRs 747 $13.67 $16.30 $19.23 $23.08 $28.65
Highest Dietetics Degree at Registration doctoral degree master's degree 8
bachelor's degree 188 $12.35 $15.38 $19.23 $23.07 $28.73 associate's degree 541 $14.01 $16.77 $19.23 $23.08 $28.30
610 $29,500 $34,600 $40,000 $50,000 $60,000
5 146 $27,200 $32,800 $41,000 $50,300 $61,000 451 $30,000 $35,000 $40,000 $50,000 $60,000
Note: Results not shown if fewer than 15 valid values; 10th and 90th percentiles not shown if fewer than 30 valid values.
DTR Compensation 65
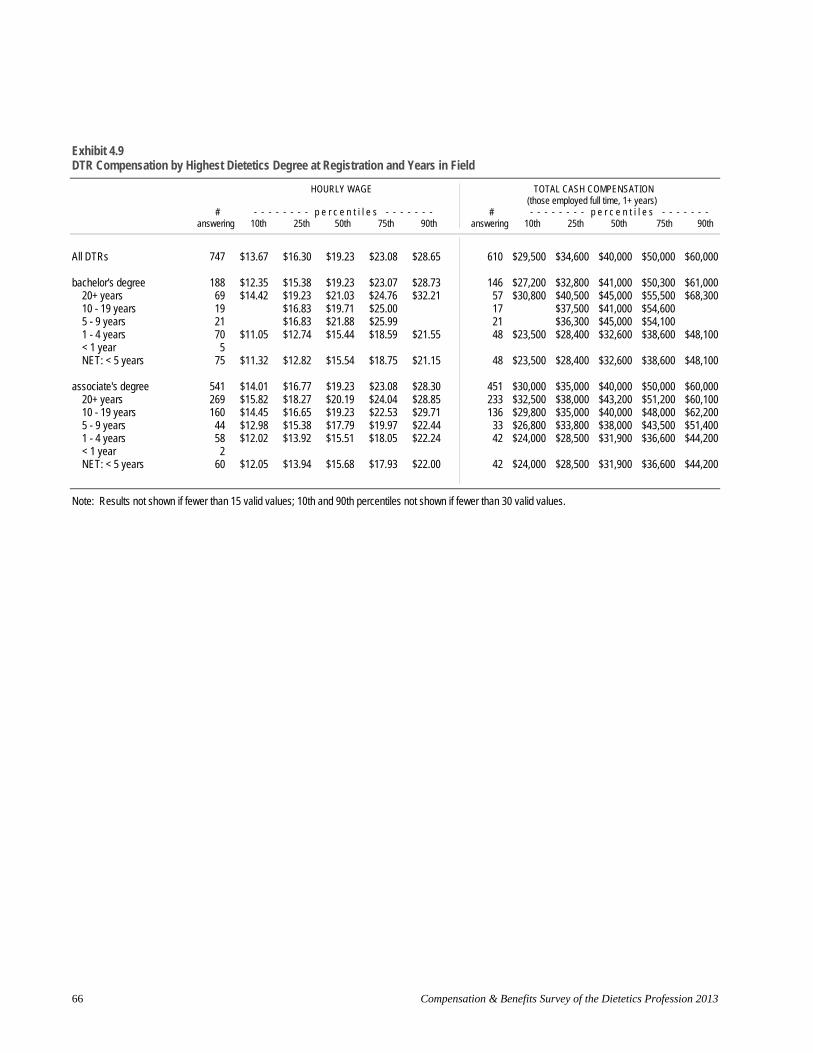
Exhibit 4.9 DTR Compensation by Highest Dietetics Degree at Registration and Years in Field
# answering
HOURLY WAGE
- - - - - p e r c e n t i l e s - - - - - - - 10th 25th 50th 75th 90th
# answering
TOTAL CASH COMPENSATION (those employed full time, 1+ years)
- - - - p e r c e n t i l e s - - - -10th 25th 50th 75th 90th
All DTRs 747
bachelor's degree 20+ years 10 - 19 years 5 - 9 years 1 - 4 years < 1 year NET: < 5 years
18869 19 21 70 5
75
associate's degree 20+ years 10 - 19 years 5 - 9 years 1 - 4 years < 1 year NET: < 5 years
541269 160
44 58 2
60
$13.67 $16.30 $19.23 $23.08 $28.65 610 $29,500 $34,600 $40,000 $50,000 $60,000
$12.35 $15.38 $19.23 $23.07 $28.73 146 $27,200 $32,800 $41,000 $50,300 $61,000 $14.42 $19.23 $21.03 $24.76 $32.21 57 $30,800 $40,500 $45,000 $55,500 $68,300
$16.83 $19.71 $25.00 17 $37,500 $41,000 $54,600$16.83 $21.88 $25.99 21 $36,300 $45,000 $54,100
$11.05 $12.74 $15.44 $18.59 $21.55 48 $23,500 $28,400 $32,600 $38,600 $48,100
$11.32 $12.82 $15.54 $18.75 $21.15 48 $23,500 $28,400 $32,600 $38,600 $48,100
$14.01 $16.77 $19.23 $23.08 $28.30 451 $30,000 $35,000 $40,000 $50,000 $60,000 $15.82 $18.27 $20.19 $24.04 $28.85 233 $32,500 $38,000 $43,200 $51,200 $60,100 $14.45 $16.65 $19.23 $22.53 $29.71 136 $29,800 $35,000 $40,000 $48,000 $62,200 $12.98 $15.38 $17.79 $19.97 $22.44 33 $26,800 $33,800 $38,000 $43,500 $51,400 $12.02 $13.92 $15.51 $18.05 $22.24 42 $24,000 $28,500 $31,900 $36,600 $44,200
$12.05 $13.94 $15.68 $17.93 $22.00 42 $24,000 $28,500 $31,900 $36,600 $44,200
Note: Results not shown if fewer than 15 valid values; 10th and 90th percentiles not shown if fewer than 30 valid values.
Compensation & Benefits Survey of the Dietetics Profession 2013 66
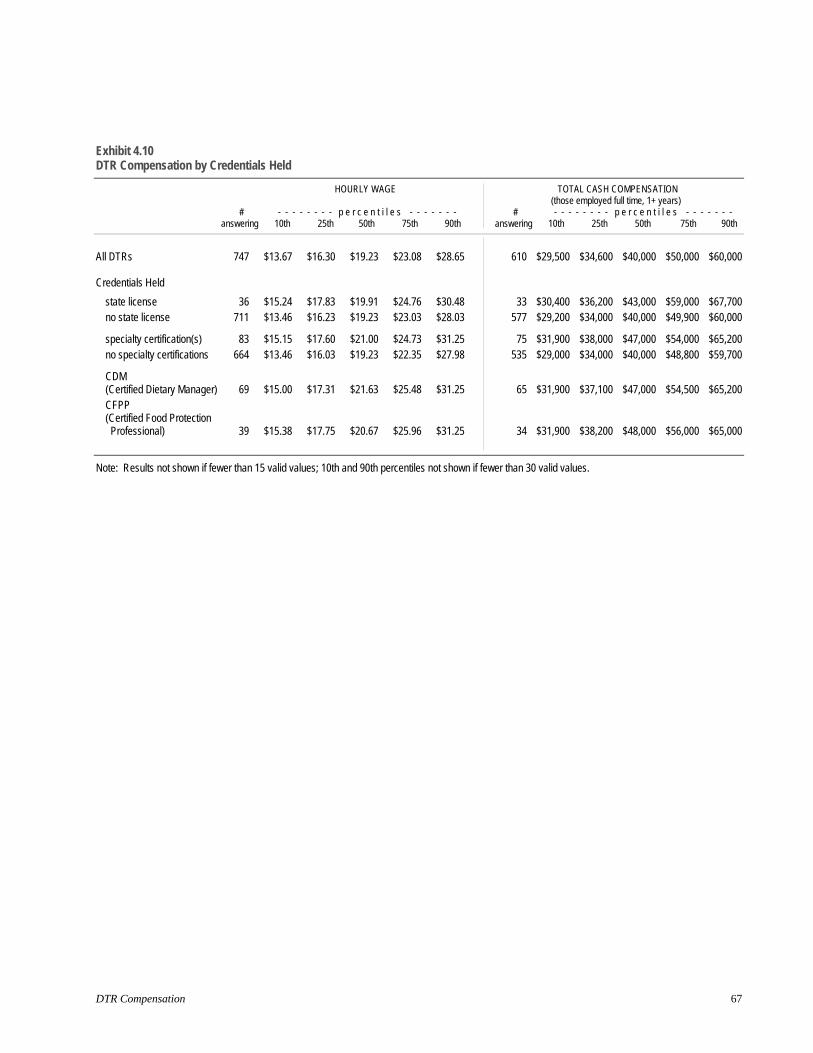
Exhibit 4.10 DTR Compensation by Credentials Held
HOURLY WAGE TOTAL CASH COMPENSATION
# answering
- - - - - p e r c e n t i l e s - - - - - - - 10th 25th 50th 75th 90th
# answering
(those employed full time, 1+ years) - - - - p e r c e n t i l e s - - - -
10th 25th 50th 75th 90th
All DTRs 747 $13.67 $16.30 $19.23 $23.08 $28.65 610 $29,500 $34,600 $40,000 $50,000 $60,000
Credentials Held
state license 36 $15.24 $17.83 $19.91 $24.76 $30.48 33 $30,400 $36,200 $43,000 $59,000 $67,700 no state license 711 $13.46 $16.23 $19.23 $23.03 $28.03 577 $29,200 $34,000 $40,000 $49,900 $60,000
specialty certification(s) 83 $15.15 $17.60 $21.00 $24.73 $31.25 75 $31,900 $38,000 $47,000 $54,000 $65,200 no specialty certifications 664 $13.46 $16.03 $19.23 $22.35 $27.98 535 $29,000 $34,000 $40,000 $48,800 $59,700
CDM (Certified Dietary Manager) 69 $15.00 $17.31 $21.63 $25.48 $31.25 65 $31,900 $37,100 $47,000 $54,500 $65,200 CFPP (Certified Food Protection Professional) 39 $15.38 $17.75 $20.67 $25.96 $31.25 34 $31,900 $38,200 $48,000 $56,000 $65,000
Note: Results not shown if fewer than 15 valid values; 10th and 90th percentiles not shown if fewer than 30 valid values.
DTR Compensation 67

Exhibit 4.11 DTR Compensation by Academy Membership
HOURLY WAGE TOTAL CASH COMPENSATION (those employed full time, 1+ years)
# - - - - - - - - p e r c e n t i l e s - - - - - - # - - - - - - - - p e r c e n t i l e s - - - - - - - answering 10th 25th 50th 75th 90th answering 10th 25th 50th 75th 90th
All DTRs 747 $13.67 $16.30 $19.23 $23.08 $28.65 610 $29,500 $34,600 $40,000 $50,000 $60,000
Academy of Nutrition and Dietetics Membership Academy member 289 $13.85 $16.07 $19.78 $24.04 $30.05 234 $28,100 $35,000 $42,000 $51,000 $63,800
not a member 458 $13.46 $16.31 $19.23 $22.07 $27.20 376 $30,000 $34,100 $40,000 $48,700 $58,600
Note: Results not shown if fewer than 15 valid values; 10th and 90th percentiles not shown if fewer than 30 valid values.
Exhibit 4.12 DTR Compensation by Practice Area of Primary Position
HOURLY WAGE TOTAL CASH COMPENSATION (those employed full time, 1+ years)
# - - - - - - - - p e r c e n t i l e s - - - - - - # - - - - - - - - p e r c e n t i l e s - - - - - - - answering 10th 25th 50th 75th 90th answering 10th 25th 50th 75th 90th
All DTRs 747 $13.67 $16.30 $19.23 $23.08 $28.65
Practice Area of Primary Position clinical nutrition - acute care/inpatient 328 $13.33 $15.87 $19.23 $21.63 $25.00 clinical nutrition - ambulatory care 5 clinical nutrition - long term care 100 $13.49 $15.38 $19.23 $22.48 $27.90 education and research 11 community 87 $13.46 $15.54 $17.95 $21.63 $25.63 food and nutrition management 149 $15.82 $17.87 $21.63 $27.40 $33.65 consultation and business 8
610 $29,500 $34,600 $40,000 $50,000 $60,000
257 $28,500 $33,100 $40,000 $45,600 $53,000
3
82 $27,600 $32,800 $41,000 $49,900 $59,500 10 68 $26,200 $32,000 $36,600 $43,700 $51,200
143 $32,600 $38,000 $46,000 $59,500 $75,000 5
Note: Results not shown if fewer than 15 valid values; 10th and 90th percentiles not shown if fewer than 30 valid values.
Compensation & Benefits Survey of the Dietetics Profession 2013 68
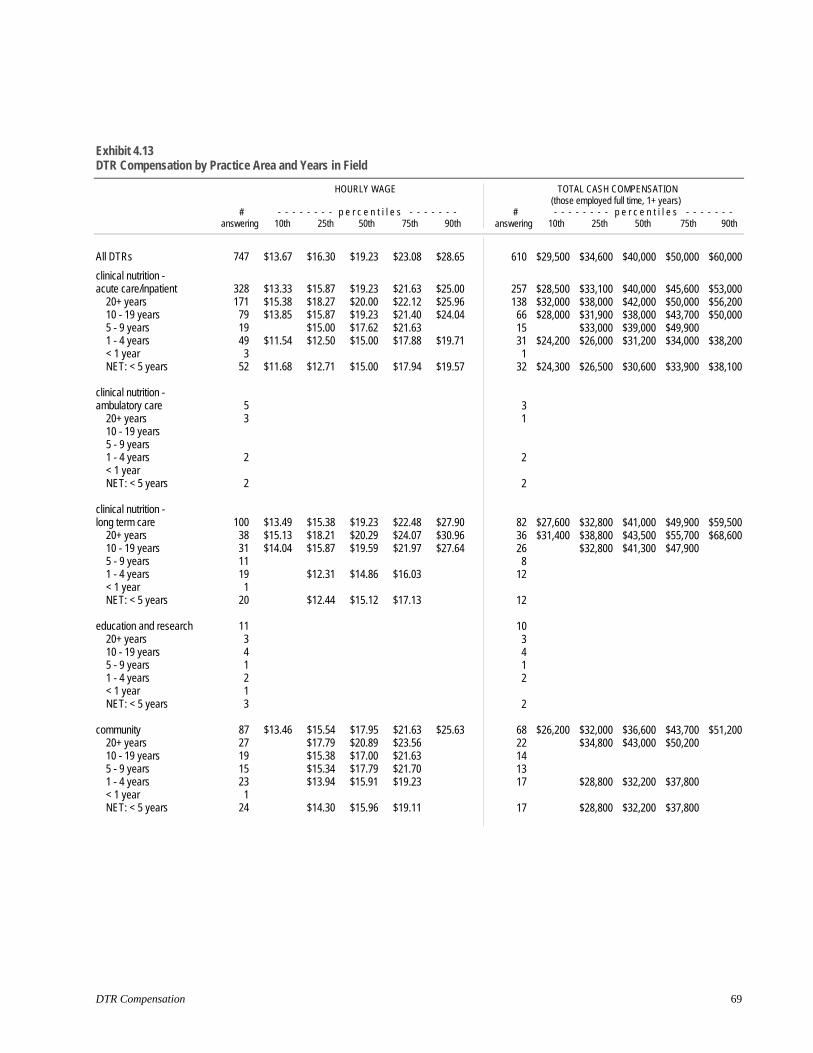
Exhibit 4.13 DTR Compensation by Practice Area and Years in Field
HOURLY WAGE TOTAL CASH COMPENSATION (those employed full time, 1+ years)
# - - - - - - - - p e r c e n t i l e s - - - - - - # - - - - - - - - p e r c e n t i l e s - - - - - - - answering 10th 25th 50th 75th 90th answering 10th 25th 50th 75th 90th
All DTRs 747
clinical nutrition - acute care/inpatient 328
20+ years 171 10 - 19 years 79 5 - 9 years 19 1 - 4 years 49 < 1 year 3 NET: < 5 years 52
clinical nutrition - ambulatory care 5
20+ years 3 10 - 19 years 5 - 9 years 1 - 4 years 2 < 1 year NET: < 5 years 2
clinical nutrition - long term care 100
20+ years 38 10 - 19 years 31 5 - 9 years 11 1 - 4 years 19 < 1 year 1 NET: < 5 years 20
education and research 11 20+ years 3 10 - 19 years 4 5 - 9 years 1 1 - 4 years 2 < 1 year 1 NET: < 5 years 3
community 87 20+ years 27 10 - 19 years 19 5 - 9 years 15 1 - 4 years 23 < 1 year 1 NET: < 5 years 24
$13.67
$13.33 $15.38 $13.85
$11.54
$11.68
$13.49$15.13 $14.04
$13.46
$16.30
$15.87$18.27 $15.87 $15.00 $12.50
$12.71
$15.38$18.21 $15.87
$12.31
$12.44
$15.54$17.79 $15.38 $15.34 $13.94
$14.30
$19.23
$19.23$20.00 $19.23 $17.62 $15.00
$15.00
$19.23$20.29 $19.59
$14.86
$15.12
$17.95$20.89 $17.00 $17.79 $15.91
$15.96
$23.08
$21.63$22.12 $21.40 $21.63 $17.88
$17.94
$22.48 $24.07 $21.97
$16.03
$17.13
$21.63$23.56 $21.63 $21.70 $19.23
$19.11
$28.65
$25.00 $25.96 $24.04
$19.71
$19.57
$27.90 $30.96 $27.64
$25.63
610
257 138
6615311
32
3 1
2
2
8236268
12
12
10 3 4 1 2
2
6822141317
17
$29,500
$28,500 $32,000 $28,000
$24,200
$24,300
$27,600 $31,400
$26,200
$34,600 $40,000 $50,000 $60,000
$33,100 $40,000 $45,600 $53,000 $38,000 $42,000 $50,000 $56,200 $31,900 $38,000 $43,700 $50,000 $33,000 $39,000 $49,900 $26,000 $31,200 $34,000 $38,200
$26,500 $30,600 $33,900 $38,100
$32,800 $41,000 $49,900 $59,500 $38,800 $43,500 $55,700 $68,600 $32,800 $41,300 $47,900
$32,000 $36,600 $43,700 $51,200 $34,800 $43,000 $50,200
$28,800 $32,200 $37,800
$28,800 $32,200 $37,800
DTR Compensation 69

Exhibit 4.13 (continued) DTR Compensation by Practice Area and Years in Field
HOURLY WAGE TOTAL CASH COMPENSATION (those employed full time, 1+ years)
# - - - - - - - - p e r c e n t i l e s - - - - - - # - - - - - - - - p e r c e n t i l e s - - - - - - - answering 10th 25th 50th 75th 90th answering 10th 25th 50th 75th 90th
All DTRs 747 $13.67 $16.30 $19.23 $23.08 $28.65
food and nutrition management 149 $15.82 $17.87 $21.63 $27.40 $33.65 20+ years 77 $16.72 $19.10 $23.08 $28.74 $37.50 10 - 19 years 32 $16.83 $18.27 $21.24 $31.25 $38.99 5 - 9 years 13 1 - 4 years 24 $14.54 $16.86 $21.03 < 1 year 1 NET: < 5 years 25 $14.66 $16.41 $20.43
consultation and business 8 20+ years 1 10 - 19 years 1 5 - 9 years 2 1 - 4 years 4 < 1 year NET: < 5 years 4
610 $29,500 $34,600 $40,000 $50,000 $60,000
143 $32,600 $38,000 $46,000 $59,500 $75,000 75 $34,600 $40,000 $49,500 $60,200 $77,100 32 $35,000 $38,100 $44,900 $60,500 $85,500 1321 $30,500 $36,000 $47,000
21 $30,500 $36,000 $47,000
5 1
1 3
3
Note: Results not shown if fewer than 15 valid values; 10th and 90th percentiles not shown if fewer than 30 valid values.
Compensation & Benefits Survey of the Dietetics Profession 2013 70
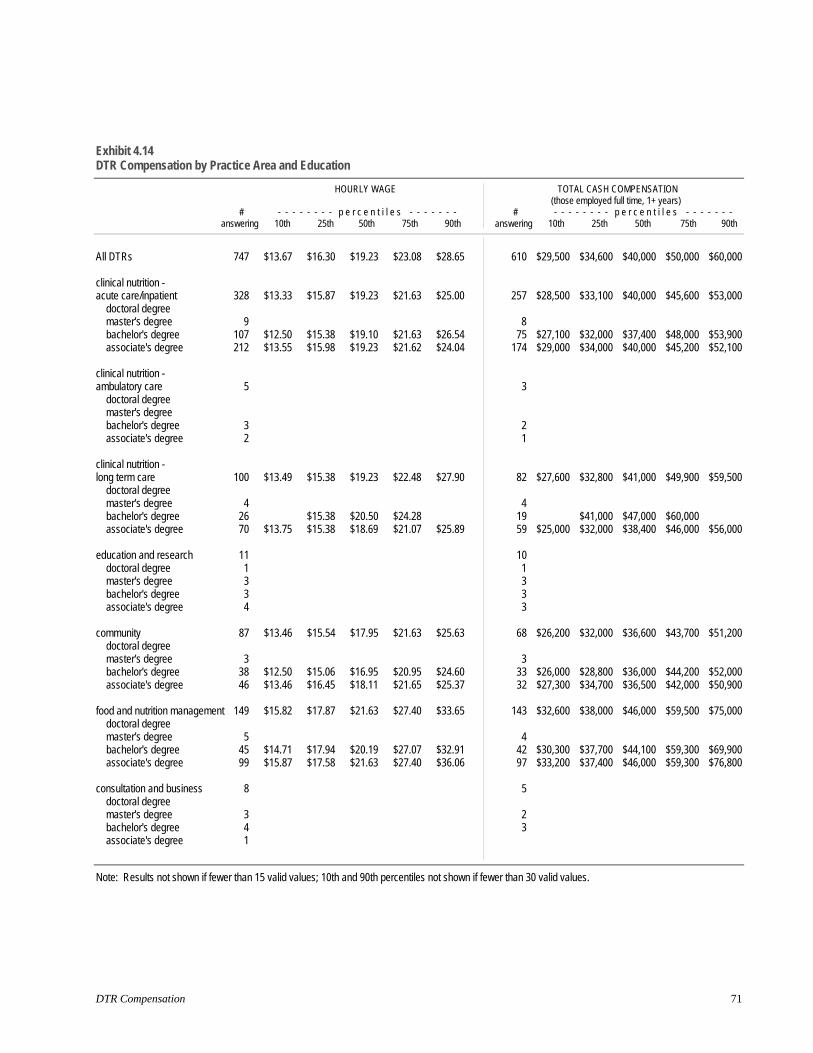
Exhibit 4.14 DTR Compensation by Practice Area and Education
HOURLY WAGE TOTAL CASH COMPENSATION
# answering
- - - - - p e r c e n t i l e s - - - - - - - 10th 25th 50th 75th 90th
# answering
(those employed full time, 1+ years) - - - - p e r c e n t i l e s - - - -
10th 25th 50th 75th 90th
All DTRs 747 $13.67 $16.30 $19.23 $23.08 $28.65 610 $29,500 $34,600 $40,000 $50,000 $60,000
clinical nutrition - acute care/inpatient
doctoral degree master's degree
328
9
$13.33 $15.87 $19.23 $21.63 $25.00 257
8
$28,500 $33,100 $40,000 $45,600 $53,000
bachelor's degree associate's degree
107 212
$12.50 $13.55
$15.38 $15.98
$19.10 $19.23
$21.63 $21.62
$26.54 $24.04
75174
$27,100$29,000
$32,000$34,000
$37,400 $40,000
$48,000 $45,200
$53,900 $52,100
clinical nutrition - ambulatory care
doctoral degree master's degree
5 3
bachelor's degree associate's degree
3 2
2 1
clinical nutrition - long term care
doctoral degree master's degree
100
4
$13.49 $15.38 $19.23 $22.48 $27.90 82
4
$27,600 $32,800 $41,000 $49,900 $59,500
bachelor's degree associate's degree
26 70 $13.75
$15.38 $15.38
$20.50 $18.69
$24.28 $21.07 $25.89
1959 $25,000
$41,000$32,000
$47,000 $38,400
$60,000 $46,000 $56,000
education and research 11 10 doctoral degree master's degree bachelor's degree associate's degree
1 3 3 4
1 3 3 3
community doctoral degree
87 $13.46 $15.54 $17.95 $21.63 $25.63 68 $26,200 $32,000 $36,600 $43,700 $51,200
master's degree bachelor's degree associate's degree
3 38 46
$12.50 $13.46
$15.06 $16.45
$16.95 $18.11
$20.95 $21.65
$24.60 $25.37
3 3332
$26,000$27,300
$28,800$34,700
$36,000 $36,500
$44,200 $42,000
$52,000 $50,900
food and nutrition management doctoral degree master's degree
149
5
$15.82 $17.87 $21.63 $27.40 $33.65 143
4
$32,600 $38,000 $46,000 $59,500 $75,000
bachelor's degree associate's degree
45 99
$14.71 $15.87
$17.94 $17.58
$20.19 $21.63
$27.07 $27.40
$32.91 $36.06
4297
$30,300$33,200
$37,700$37,400
$44,100 $46,000
$59,300 $59,300
$69,900 $76,800
consultation and business 8 5 doctoral degree master's degree bachelor's degree associate's degree
3 4 1
2 3
Note: Results not shown if fewer than 15 valid values; 10th and 90th percentiles not shown if fewer than 30 valid values.
DTR Compensation 71

Exhibit 4.15 DTR Compensation by Work Setting
HOURLY WAGE TOTAL CASH COMPENSATION
# answering
- - - - - p e r c e n t i l e s - - - - - - - 10th 25th 50th 75th 90th
# answering
(those employed full time, 1+ years) - - - - p e r c e n t i l e s - - - -
10th 25th 50th 75th 90th
All DTRs
Work Setting acute-care - inpatient acute-care - outpatient ambulatory/outpatient long-term/extended care rehabilitation facility wellness center or health club private practice govt agency/dept community/ public health program non-profit agency/organization faculty food mfr/dist/retailer pharmaceutical mfr/dist/retailer K-12 food service contract food management company home health care provider
747 $13.67 $16.30 $19.23 $23.08 $28.65 610
251 $12.92 $15.99 $19.23 $21.63 $26.92 204 6 3 5 4
214 $13.94 $16.41 $19.23 $23.69 $28.85 183 23 $15.00 $19.23 $24.04 1913 6
2 2 32 $13.46 $15.56 $20.67 $23.94 $29.98 29
59 $12.50 $15.95 $17.79 $21.03 $24.03 45 32 $13.88 $16.41 $19.23 $21.88 $24.76 2323 $18.27 $20.00 $27.04 196 5
1 1 26 $17.84 $20.67 $27.98 25
5 5 1 1
$29,500 $34,600 $40,000 $50,000 $60,000
$28,000 $34,000 $40,000 $46,000 $58,000
$30,000 $35,000 $31,000
$42,000 $38,000
$51,000 $46,300
$61,000
$31,700 $43,000 $50,000
$26,000 $31,000 $33,600 $37,000
$36,000 $40,000 $45,000
$42,400 $47,800 $56,300
$50,200
$38,100 $44,000 $59,700
Note: Results not shown if fewer than 15 valid values; 10th and 90th percentiles not shown if fewer than 30 valid values.
Compensation & Benefits Survey of the Dietetics Profession 2013 72
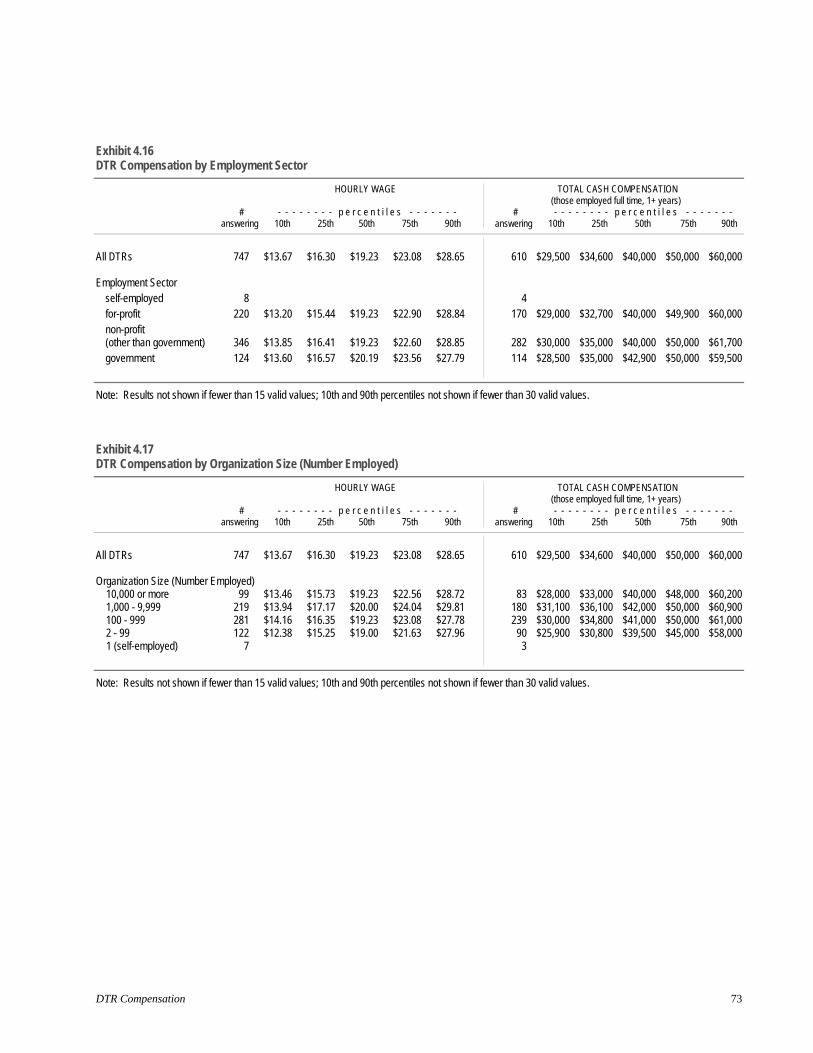
Exhibit 4.16 DTR Compensation by Employment Sector
HOURLY WAGE TOTAL CASH COMPENSATION
# answering
- - - - - p e r c e n t i l e s - - - - - - - 10th 25th 50th 75th 90th
# answering
(those employed full time, 1+ years) - - - - p e r c e n t i l e s - - - -
10th 25th 50th 75th 90th
All DTRs 747 $13.67 $16.30 $19.23 $23.08 $28.65
Employment Sector self-employed 8 for-profit 220 $13.20 $15.44 $19.23 $22.90 $28.84 non-profit (other than government) 346 $13.85 $16.41 $19.23 $22.60 $28.85 government 124 $13.60 $16.57 $20.19 $23.56 $27.79
610 $29,500 $34,600 $40,000 $50,000 $60,000
4 170 $29,000 $32,700 $40,000 $49,900 $60,000
282 $30,000 $35,000 $40,000 $50,000 $61,700 114 $28,500 $35,000 $42,900 $50,000 $59,500
Note: Results not shown if fewer than 15 valid values; 10th and 90th percentiles not shown if fewer than 30 valid values.
Exhibit 4.17 DTR Compensation by Organization Size (Number Employed)
HOURLY WAGE TOTAL CASH COMPENSATION (those employed full time, 1+ years)
# - - - - - - - - p e r c e n t i l e s - - - - - - # - - - - - - - - p e r c e n t i l e s - - - - - - - answering 10th 25th 50th 75th 90th answering 10th 25th 50th 75th 90th
All DTRs 747 $13.67 $16.30 $19.23 $23.08 $28.65 610 $29,500 $34,600 $40,000 $50,000 $60,000
Organization Size (Number Employed) 10,000 or more 99 $13.46 $15.73 $19.23 $22.56 $28.72 83 $28,000 $33,000 $40,000 $48,000 $60,200
1,000 - 9,999 219 $13.94 $17.17 $20.00 $24.04 $29.81 180 $31,100 $36,100 $42,000 $50,000 $60,900 100 - 999 281 $14.16 $16.35 $19.23 $23.08 $27.78 239 $30,000 $34,800 $41,000 $50,000 $61,000 2 - 99 122 $12.38 $15.25 $19.00 $21.63 $27.96 90 $25,900 $30,800 $39,500 $45,000 $58,000 1 (self-employed) 7 3
Note: Results not shown if fewer than 15 valid values; 10th and 90th percentiles not shown if fewer than 30 valid values.
DTR Compensation 73
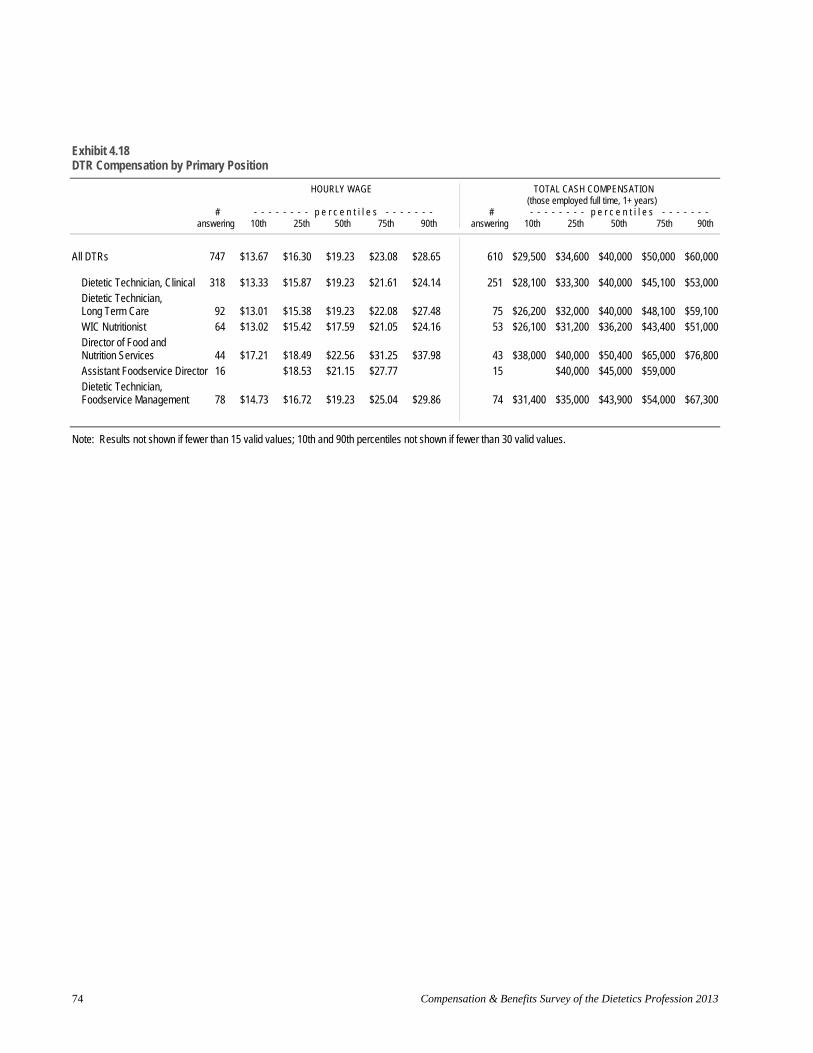
Exhibit 4.18 DTR Compensation by Primary Position
HOURLY WAGE TOTAL CASH COMPENSATION
# answering
- - - - - p e r c e n t i l e s - - - - - - - 10th 25th 50th 75th 90th
# answering
(those employed full time, 1+ years) - - - - p e r c e n t i l e s - - - -
10th 25th 50th 75th 90th
All DTRs 747 $13.67 $16.30 $19.23 $23.08 $28.65 610 $29,500 $34,600 $40,000 $50,000 $60,000
Dietetic Technician, Clinical 318 $13.33 $15.87 $19.23 $21.61 $24.14 251 $28,100 $33,300 $40,000 $45,100 $53,000 Dietetic Technician, Long Term Care 92 $13.01 $15.38 $19.23 $22.08 $27.48 75 $26,200 $32,000 $40,000 $48,100 $59,100 WIC Nutritionist 64 $13.02 $15.42 $17.59 $21.05 $24.16 53 $26,100 $31,200 $36,200 $43,400 $51,000 Director of Food and Nutrition Services 44 $17.21 $18.49 $22.56 $31.25 $37.98 43 $38,000 $40,000 $50,400 $65,000 $76,800 Assistant Foodservice Director 16 $18.53 $21.15 $27.77 15 $40,000 $45,000 $59,000 Dietetic Technician, Foodservice Management 78 $14.73 $16.72 $19.23 $25.04 $29.86 74 $31,400 $35,000 $43,900 $54,000 $67,300
Note: Results not shown if fewer than 15 valid values; 10th and 90th percentiles not shown if fewer than 30 valid values.
Compensation & Benefits Survey of the Dietetics Profession 2013 74

Exhibit 4.19 DTR Compensation by Responsibility Level
HOURLY WAGE TOTAL CASH COMPENSATION
# answering
- - - - - p e r c e n t i l e s - - - - - - - 10th 25th 50th 75th 90th
# answering
(those employed full time, 1+ years) - - - - p e r c e n t i l e s - - - -
10th 25th 50th 75th 90th
All DTRs 747 $13.67 $16.30 $19.23 $23.08 $28.65
Responsibility Level owner or partner 5 executive 4
director or manager 144 $16.45 $19.23 $23.08 $28.85 $33.65 supervisor or coordinator 166 $15.16 $16.84 $19.91 $23.57 $27.49
other 416 $12.78 $15.38 $18.44 $21.03 $24.37
610 $29,500 $34,600 $40,000 $50,000 $60,000
3 3
135 $35,600 $40,000 $50,000 $60,200 $75,000 139 $31,200 $35,400 $42,000 $50,000 $58,000 319 $27,500 $32,000 $38,000 $45,000 $52,000
Note: Results not shown if fewer than 15 valid values; 10th and 90th percentiles not shown if fewer than 30 valid values.
Exhibit 4.20 DTR Compensation by Number Supervised
HOURLY WAGE TOTAL CASH COMPENSATION (those employed full time, 1+ years)
# - - - - - - - - p e r c e n t i l e s - - - - - - # - - - - - - - - p e r c e n t i l e s - - - - - - - answering 10th 25th 50th 75th 90th answering 10th 25th 50th 75th 90th
All DTRs 747 $13.67 $16.30 $19.23 $23.08 $28.65
Number Supervised 100+ 12 50 - 99 28 $19.23 $23.80 $31.27 10 - 49 188 $16.35 $18.30 $21.24 $24.93 $30.82 1 - 9 122 $12.82 $15.87 $19.23 $21.63 $27.82 none 393 $12.82 $15.38 $18.33 $21.35 $24.52
610 $29,500 $34,600 $40,000 $50,000 $60,000
1127 $40,000 $50,000 $65,000
173 $33,800 $38,000 $45,000 $54,000 $65,000 99 $26,200 $33,000 $40,000 $46,000 $54,000
296 $28,000 $32,000 $38,400 $45,000 $52,300
Note: Results not shown if fewer than 15 valid values; 10th and 90th percentiles not shown if fewer than 30 valid values.
DTR Compensation 75

Exhibit 4.21 DTR Compensation by Budget Responsibility
HOURLY WAGE TOTAL CASH COMPENSATION
# answering
- - - - - p e r c e n t i l e s - - - - - - - 10th 25th 50th 75th 90th
# answering
(those employed full time, 1+ years) - - - - p e r c e n t i l e s - - - -
10th 25th 50th 75th 90th
All DTRs 747 $13.67 $16.30 $19.23 $23.08 $28.65 610 $29,500 $34,600 $40,000 $50,000 $60,000
Budget Responsibility $1,000K+ 33 $20.19 $24.28 $32.21 $38.46 $48.51 32 $41,500 $49,300 $62,700 $83,100 $114,900
$500K - $999K 33 $16.83 $20.50 $23.08 $31.25 $37.21 32 $37,700 $42,300 $51,000 $65,000 $80,300 $100K - $499K 69 $15.87 $18.27 $21.63 $26.92 $29.81 65 $33,600 $38,000 $47,000 $57,000 $65,400
< $100K 46 $13.17 $15.38 $18.25 $22.58 $27.50 38 $27,800 $33,100 $39,000 $50,300 $65,000 does not apply 549 $13.22 $15.79 $19.18 $21.63 $25.00 428 $28,000 $33,000 $39,400 $45,000 $52,300
Note: Results not shown if fewer than 15 valid values; 10th and 90th percentiles not shown if fewer than 30 valid values.
Exhibit 4.22 DTR Compensation by Patient/Client Responsibility
HOURLY WAGE TOTAL CASH COMPENSATION (those employed full time, 1+ years)
# - - - - - - - - p e r c e n t i l e s - - - - - - # - - - - - - - - p e r c e n t i l e s - - - - - - - answering 10th 25th 50th 75th 90th answering 10th 25th 50th 75th 90th
All DTRs 747 $13.67 $16.30 $19.23 $23.08 $28.65
Patient/Client Responsibility most patients/clients high risk 110 $13.99 $16.38 $19.23 $23.08 $28.83 most patients/clients < high risk 545 $13.46 $15.93 $19.23 $22.12 $26.92 do not work with patients/clients 80 $14.52 $17.97 $21.75 $28.82 $35.80
610 $29,500 $34,600 $40,000 $50,000 $60,000
91 $30,800 $35,000 $40,500 $50,000 $60,000
438 $28,000 $33,900 $40,000 $48,000 $57,000
72 $33,500 $38,300 $48,000 $63,800 $80,400
Note: Results not shown if fewer than 15 valid values; 10th and 90th percentiles not shown if fewer than 30 valid values.
Compensation & Benefits Survey of the Dietetics Profession 2013 76
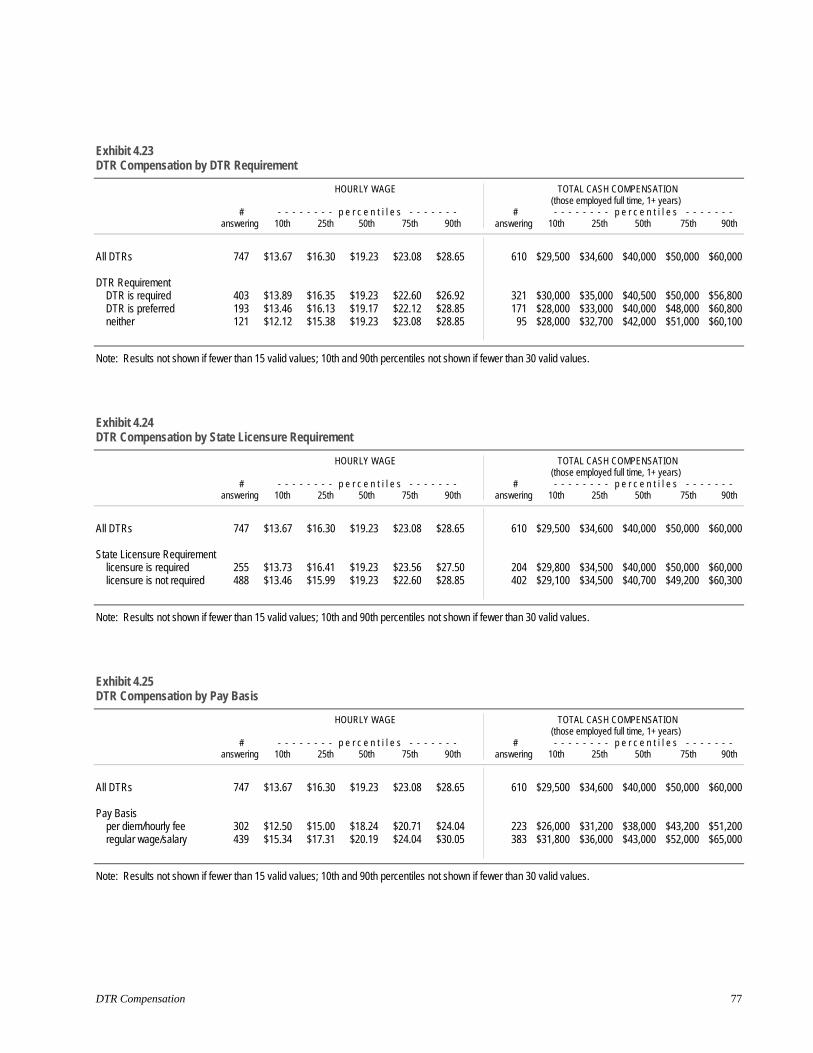
Exhibit 4.23 DTR Compensation by DTR Requirement
HOURLY WAGE TOTAL CASH COMPENSATION (those employed full time, 1+ years)
# - - - - - - - - p e r c e n t i l e s - - - - - - # - - - - - - - - p e r c e n t i l e s - - - - - - - answering 10th 25th 50th 75th 90th answering 10th 25th 50th 75th 90th
All DTRs 747 $13.67 $16.30 $19.23 $23.08 $28.65
DTR Requirement DTR is required 403 $13.89 $16.35 $19.23 $22.60 $26.92 DTR is preferred 193 $13.46 $16.13 $19.17 $22.12 $28.85 neither 121 $12.12 $15.38 $19.23 $23.08 $28.85
610 $29,500 $34,600 $40,000 $50,000 $60,000
321 $30,000 $35,000 $40,500 $50,000 $56,800 171 $28,000 $33,000 $40,000 $48,000 $60,800
95 $28,000 $32,700 $42,000 $51,000 $60,100
Note: Results not shown if fewer than 15 valid values; 10th and 90th percentiles not shown if fewer than 30 valid values.
Exhibit 4.24 DTR Compensation by State Licensure Requirement
HOURLY WAGE TOTAL CASH COMPENSATION (those employed full time, 1+ years)
# - - - - - - - - p e r c e n t i l e s - - - - - - # - - - - - - - - p e r c e n t i l e s - - - - - - - answering 10th 25th 50th 75th 90th answering 10th 25th 50th 75th 90th
All DTRs 747 $13.67 $16.30 $19.23 $23.08 $28.65 610 $29,500 $34,600 $40,000 $50,000 $60,000
State Licensure Requirement licensure is required 255 $13.73 $16.41 $19.23 $23.56 $27.50 204 $29,800 $34,500 $40,000 $50,000 $60,000 licensure is not required 488 $13.46 $15.99 $19.23 $22.60 $28.85 402 $29,100 $34,500 $40,700 $49,200 $60,300
Note: Results not shown if fewer than 15 valid values; 10th and 90th percentiles not shown if fewer than 30 valid values.
Exhibit 4.25 DTR Compensation by Pay Basis
HOURLY WAGE TOTAL CASH COMPENSATION (those employed full time, 1+ years)
# - - - - - - - - p e r c e n t i l e s - - - - - - # - - - - - - - - p e r c e n t i l e s - - - - - - - answering 10th 25th 50th 75th 90th answering 10th 25th 50th 75th 90th
All DTRs 747 $13.67 $16.30 $19.23 $23.08 $28.65
Pay Basis per diem/hourly fee 302 $12.50 $15.00 $18.24 $20.71 $24.04 regular wage/salary 439 $15.34 $17.31 $20.19 $24.04 $30.05
610 $29,500 $34,600 $40,000 $50,000 $60,000
223 $26,000 $31,200 $38,000 $43,200 $51,200 383 $31,800 $36,000 $43,000 $52,000 $65,000
Note: Results not shown if fewer than 15 valid values; 10th and 90th percentiles not shown if fewer than 30 valid values.
DTR Compensation 77

Exhibit 4.26 DTR Compensation by Full Time Status (35+ Hours Per Week, 48+ Weeks Per Year)
HOURLY WAGE TOTAL CASH COMPENSATION (those employed full time, 1+ years)
# - - - - - - - - p e r c e n t i l e s - - - - - - # - - - - - - - - p e r c e n t i l e s - - - - - - - answering 10th 25th 50th 75th 90th answering 10th 25th 50th 75th 90th
All DTRs 747 $13.67 $16.30 $19.23 $23.08 $28.65 610 $29,500 $34,600 $40,000 $50,000 $60,000
Full Time Status working full time 634 $13.94 $16.41 $19.23 $23.08 $28.85 610 $29,500 $34,600 $40,000 $50,000 $60,000 working less 113 $12.08 $14.80 $19.00 $21.09 $27.38
Note: Results not shown if fewer than 15 valid values; 10th and 90th percentiles not shown if fewer than 30 valid values.
Exhibit 4.27 DTR Compensation by Eligibility for Overtime Compensation
HOURLY WAGE TOTAL CASH COMPENSATION (those employed full time, 1+ years)
# - - - - - - - - p e r c e n t i l e s - - - - - - # - - - - - - - - p e r c e n t i l e s - - - - - - - answering 10th 25th 50th 75th 90th answering 10th 25th 50th 75th 90th
All DTRs 747 $13.67 $16.30 $19.23 $23.08 $28.65 610 $29,500 $34,600 $40,000 $50,000 $60,000
Eligibility for Overtime Compensation eligible to receive 364 $13.00 $15.87 $18.75 $21.08 $24.76 300 $28,000 $33,600 $39,000 $45,000 $53,100 not eligible to receive 378 $13.94 $16.90 $20.19 $24.04 $31.30 306 $30,000 $36,000 $43,500 $53,100 $68,300
Note: Results not shown if fewer than 15 valid values; 10th and 90th percentiles not shown if fewer than 30 valid values.
Exhibit 4.28 DTR Compensation by Benefits Level
HOURLY WAGE TOTAL CASH COMPENSATION (those employed full time, 1+ years)
# - - - - - - - - p e r c e n t i l e s - - - - - - # - - - - - - - - p e r c e n t i l e s - - - - - - - answering 10th 25th 50th 75th 90th answering 10th 25th 50th 75th 90th
All DTRs 747 $13.67 $16.30 $19.23 $23.08 $28.65
Benefits Level high 330 $14.42 $17.27 $20.07 $23.59 $28.85 medium 283 $13.58 $16.35 $19.23 $22.12 $26.92 low 133 $12.48 $14.90 $17.63 $21.02 $27.95
610 $29,500 $34,600 $40,000 $50,000 $60,000
286 $30,200 $35,500 $42,000 $50,400 $62,600 245 $29,300 $34,000 $40,000 $48,500 $58,000
79 $27,000 $32,000 $38,000 $46,000 $58,000
Note: Results not shown if fewer than 15 valid values; 10th and 90th percentiles not shown if fewer than 30 valid values.
Compensation & Benefits Survey of the Dietetics Profession 2013 78

Exhibit 4.29 DTR Compensation by Location (Census Division)
HOURLY WAGE TOTAL CASH COMPENSATION
# answering
- - - - - p e r c e n t i l e s - - - - - - - 10th 25th 50th 75th 90th
# answering
(those employed full time, 1+ years) - - - - p e r c e n t i l e s - - - -
10th 25th 50th 75th 90th
All DTRs 747 $13.67 $16.30 $19.23 $23.08 $28.65 610 $29,500 $34,600 $40,000 $50,000 $60,000
Employment Location (Census Division) New England 53 Middle Atlantic 136
$14.94 $13.94
$17.18 $16.37
$19.83 $19.73
$23.32 $23.49
$28.85 $30.27
40113
$30,100 $29,700
$35,000 $33,400
$42,000 $40,000
$53,700 $50,000
$65,000 $61,600
East North Central 215 $13.94 $16.41 $19.23 $21.15 $24.04 172 $30,000 $35,000 $40,000 $45,000 $50,700 West North Central 73 $14.42 $16.25 $18.38 $21.38 $25.96 58 $30,000 $34,800 $39,500 $50,100 $58,100
South Atlantic 74 $12.70 $15.50 $19.86 $24.64 $28.85 63 $27,500 $33,000 $43,500 $54,000 $63,700 East South Central 15 $14.42 $16.11 $19.71 13
West South Central 34 $11.78 $14.78 $16.38 $22.36 $28.02 30 $25,200 $30,800 $34,800 $46,500 $56,800 Mountain 36 $11.25 $13.94 $17.82 $21.23 $26.53 28 $32,500 $36,600 $47,600 Pacific 111 $14.42 $18.97 $21.88 $26.92 $32.07 93 $30,300 $38,200 $47,000 $56,100 $69,200
Note: Results not shown if fewer than 15 valid values; 10th and 90th percentiles not shown if fewer than 30 valid values.
Exhibit 4.30 DTR Compensation by Location (Selected States)
HOURLY WAGE TOTAL CASH COMPENSATION (those employed full time, 1+ years)
# - - - - - - - - p e r c e n t i l e s - - - - - - # - - - - - - - - p e r c e n t i l e s - - - - - - - answering 10th 25th 50th 75th 90th answering 10th 25th 50th 75th 90th
All DTRs 747 $13.67 $16.30 $19.23 $23.08 $28.65 610 $29,500 $34,600 $40,000 $50,000 $60,000
Employment Location (State)
AZ 18 $12.09 $17.31 $21.79 15 $28,000 $36,000 $39,000 CA 78 $14.42 $19.23 $22.60 $27.52 $33.65 67 $30,600 $40,000 $48,000 $60,000 $71,700 FL 43 $12.53 $15.26 $20.67 $25.00 $27.85 37 $26,100 $31,600 $45,000 $52,000 $58,800 IL 18 $17.19 $20.19 $28.75 17 $38,000 $44,000 $58,600 IN 15 $18.46 $20.00 $21.91 12
ME 16 $15.43 $18.98 $20.77 13 MN 45 $14.42 $16.11 $19.23 $21.71 $25.96 32 $30,500 $34,400 $41,300 $52,500 $58,500 NJ 16 $18.29 $20.25 $22.36 10 NY 81 $13.87 $16.20 $19.23 $23.61 $30.63 69 $28,100 $32,400 $40,000 $48,500 $62,000 OH 126 $13.73 $15.87 $18.98 $20.60 $24.04 97 $29,900 $33,800 $39,500 $43,900 $50,000
OR 15 $18.97 $21.30 $25.96 13 PA 39 $13.94 $15.99 $19.74 $23.56 $28.85 34 $29,800 $35,000 $41,500 $50,000 $60,000 TX 18 $12.50 $18.27 $23.32 16 $28,800 $42,100 $49,500 WA 16 $17.27 $19.23 $20.99 11 WI 43 $13.57 $16.83 $19.09 $21.63 $23.37 36 $27,400 $35,300 $39,900 $45,000 $50,400
Note: Results not shown if fewer than 15 valid values; 10th and 90th percentiles not shown if fewer than 30 valid values.
DTR Compensation 79

Exhibit 4.31 DTR Compensation by Location (Selected Metro Areas)
HOURLY WAGE TOTAL CASH COMPENSATION (those employed full time, 1+ years)
# - - - - - - - - p e r c e n t i l e s - - - - - - # - - - - - - - - p e r c e n t i l e s - - - - - - - answering 10th 25th 50th 75th 90th answering 10th 25th 50th 75th 90th
All DTRs 747 $13.67 $16.30 $19.23 $23.08 $28.65
Employment Location (Metropolitan Area)
Buffalo-Niagara Falls NY 22 $15.38 $16.89 $20.51 Chicago-Naperville-Joliet IL-IN-WI 22 $17.31 $20.55 $25.21Cincinnati- Middletown OH-KY-IN 26 $16.27 $19.23 $20.51 Cleveland-Elyria- Mentor OH 17 $15.63 $20.00 $21.30Columbus OH 19 $15.38 $19.23 $20.19
Dayton OH 17 $16.99 $18.96 $22.31 Los Angeles-Long Beach- Santa Ana CA 36 $11.38 $18.65 $21.75 $24.41 $31.97 Miami-Fort Lauderdale- Pompano Beach FL 15 $16.83 $23.08 $25.48 Milwaukee-Waukesha- West Allis WI 21 $17.11 $19.23 $21.88Minneapolis-St. Paul- Bloomington MN-WI 29 $16.11 $19.11 $21.70
New York- Northern New Jersey- Long Island NY-NJ-PA 24 $18.23 $21.84 $29.87Philadelphia-Camden- Wilmington PA-NJ-DE-MD 19 $20.19 $21.60 $23.27
610 $29,500 $34,600 $40,000 $50,000 $60,000
19 $30,000 $34,000 $40,900
20 $39,600 $43,000 $55,400
20 $36,300 $41,400 $45,000
11 17 $33,300 $40,000 $44,400
16 $33,500 $36,500 $45,000
31 $27,100 $40,000 $46,700 $51,000 $69,400
14
17 $36,400 $40,000 $45,000
20 $34,400 $39,000 $50,400
18 $39,000 $47,700 $59,300
15 $41,000 $46,000 $50,000
Note: Results not shown if fewer than 15 valid values; 10th and 90th percentiles not shown if fewer than 30 valid values.
Compensation & Benefits Survey of the Dietetics Profession 2013 80

5. Compensation by Position
Notes
Tables in this section report compensation by position.
Respondents were asked to match their job to one of 59 core position descriptions developed by the Academy, regardless of whether the position title was similar to their own. 93% of responding practitioners selected one of the core positions; thus these data can be thought of as representing the vast majority of dietetics practice.
Sufficient responses were received to report at least minimal compensation data for 49 of the 59 listed positions. The brief description for each position is reproduced at the top of its table. A number of Clinical Dietitian, Specialist positions have been aggregated as Clinical Dietitian, Specialist – Other. Similarly, a number of Outpatient Dietitian, Specialist positions have been aggregated as Outpatient Dietitian, Specialist – Other.
For each position, results are broken out by a number of factors to demonstrate the relative effects on compensation: years in field, years in position, education, credentials held, employment sector, and responsibilities.
Note that all factors are based on respondent self-reports and are thus subject to some variation in how terms were understood.
Two measures are reported: hourly wage and total cash compensation.
In accordance with Bureau of Labor Statistics practice, hourly wage may be converted to an annualized salary by multiplying the wage by 40 hours per week and 52 weeks per year.
Total cash compensation is reported only for practitioners employed or self-employed in the position full time for at least one year, and includes sources of compensation beyond salary/wages, such as bonuses, commissions, on-call pay, etc. Total cash compensation provides a more accurate picture of compensation than wages alone for positions where a significant fraction of compensation does not come from salary (e.g., consultants, salespeople, executives).
In addition to the number answering, three percentile values are reported for each measure: 25% of practitioners earn less than the 25th percentile, 50% earn less than the 50th percentile, and so on. Percentiles are suppressed if there are fewer than 15 valid responses.
The first row of each table shows total 2013 results for that position. It is followed by that same data from the 2011 survey, and the resulting percentage change over two years (where calculable). Note, the lower the tabulation bases, the greater the statistical variability. That is, the results for positions with fewer answering practitioners would be subject to greater influence by very high or very low reports.
Compensation by Position 81

Exhibit 5.1 Compensation: Dietetic Technician, Clinical
Conducts nutrition screening and routine assessments. Coordinates menu selections with diet order. Develops and implements nutrition care plans for assigned patients. Provides individualized or group nutrition education. Monitors quality and accuracy of food served to patients.
HOURLY WAGE TOTAL CASH COMPENSATION
# answering
- - p e r c e n t i l e s25th 50th
- -75th
(those employed full time, 1+ years) # p e r c e n t i l e s - -
answering 25th 50th 75th
TOTAL - 2013 TOTAL - 2011 % change
Years in Field 20+ years 10 - 19 years 5 - 9 years 1 - 4 years < 1 year NET: < 5 years
Years in Position 10+ years 5 - 9 years < 5 years
Education (Highest Degree) doctoral degree master's degree
bachelor's degree associate's degree
Credentials Held RD DTR
state license/certification specialty certification(s)
Employment Sector self-employed for-profit
non-profit (other than government) government
Responsibilities director, manager or higher supervisor, coordinator, staff
supervise 1+ employees supervise none
have budget responsibility no budget responsibility
most patients/clients high risk most patients/clients < high risk
do not work with patients/clients
326341
169 78 19 50 4
54
195 49 80
11 106 209
6 318
1717
2 98
16539
25296
101 225
28 295
40280
4
$15.87 $16.45
-3.5%
$18.27 $15.89 $15.00 $12.50
$13.12
$17.44 $15.38 $13.78
$15.38 $15.94
$15.87 $15.48
$17.20
$14.93 $15.95
$18.27
$19.00 $15.64
$16.83$15.38
$16.51$15.75
$17.08 $15.69
$19.23 $18.46
4.2%
$20.00 $19.23 $17.62 $15.00
$15.00
$19.71 $19.23 $15.87
$19.23 $19.23
$19.23 $18.75 $19.18
$19.07 $19.23
$21.15
$20.67 $19.23
$19.23$19.23
$19.23 $19.23
$19.23 $19.23
$21.63 $21.63
0.0%
$22.12 $21.41 $21.63 $18.01
$18.01
$21.91 $22.36 $19.23
$21.63 $21.60
$21.61 $19.71 $22.59
$21.22 $21.15
$23.56
$25.96 $21.38
$22.12 $21.35
$23.08 $21.60
$23.08 $21.43
253275
1356615311
32
1614250
9 72
172
2 251
1515
63135
38
21 228
82 171
24 226
29218
4
$33,400 $40,000 $45,100 $34,000 $38,400 $45,800
-1.8% 4.2% -1.5%
$38,000 $42,000 $49,000 $31,900 $38,000 $43,700 $33,000 $39,000 $49,900 $26,000 $31,200 $34,600
$26,500 $30,600 $34,500
$36,000 $41,000 $48,000 $32,600 $39,500 $45,000 $28,900 $33,000 $37,900
$32,000 $37,700 $45,000 $34,000 $40,000 $45,000
$33,300 $40,000 $45,100 $34,400 $40,000 $42,000
$32,200 $39,000 $48,000
$31,000 $39,000 $45,000 $33,900 $40,000 $45,000
$38,000 $44,500 $49,200
$39,300 $44,900 $54,800 $33,000 $39,500 $45,000
$35,000 $40,000 $49,900 $32,000 $39,000 $45,000
$34,800 $41,000 $50,000 $33,000 $39,800 $45,000
$35,200 $40,500 $50,700 $33,000 $39,900 $45,000
Note: Results not shown if fewer than 15 valid values.
Compensation & Benefits Survey of the Dietetics Profession 2013 82

Exhibit 5.2 Compensation: Clinical Dietitian
Performs comprehensive nutrition assessments. Develops and implements nutrition care plans. Provides medical nutrition therapy and nutrition education. May coordinate and supervise activities of DTRs and students.
HOURLY WAGE TOTAL CASH COMPENSATION
# answering
- - p e r c e n t i l e s25th 50th
- -75th
(those employed full time, 1+ years) # p e r c e n t i l e s - -
answering 25th 50th 75th
TOTAL - 2013 TOTAL - 2011 % change
Years in Field 20+ years 10 - 19 years 5 - 9 years 1 - 4 years < 1 year NET: < 5 years
Years in Position 10+ years 5 - 9 years < 5 years
Education (Highest Degree) doctoral degree
master's degree bachelor's degree
associate's degree
Credentials Held RD DTR
state license/certification specialty certification(s)
Employment Sector self-employed
for-profit non-profit (other than government) government
Responsibilities director, manager or higher supervisor, coordinator, staff
supervise 1+ employees supervise none
have budget responsibility no budget responsibility
most patients/clients high risk most patients/clients < high risk
do not work with patients/clients
967 952
328 227 166 230
6 236
348 198 417
9 380 574
3
956 5
471149
19 315 499
74
108848
288 677
69 888
311650
2
$22.12 $21.15
4.6%
$25.69 $24.37 $21.63 $19.99
$19.96
$25.24 $22.60 $20.55
$22.46 $22.00
$22.24
$22.27$24.63
$23.21 $22.12
$22.12$22.79
$23.20 $22.12
$24.19$21.63
$23.08$22.12
$22.12 $22.12
$25.96 $24.55
5.7%
$28.85 $27.43 $24.20 $21.63
$21.63
$28.85 $25.96 $23.21
$26.26 $25.48
$25.96
$25.64 $28.19
$31.65 $25.64
$25.74$27.81
$27.38 $25.64
$27.88$25.00
$28.80 $25.64
$26.20 $25.73
$30.29 $28.85
5.0%
$32.99 $32.69 $28.13 $24.04
$24.04
$33.12 $29.81 $27.57
$30.23 $30.24
$30.34
$29.71 $32.97
$40.38 $29.81
$29.81 $31.85
$32.90 $29.92
$32.69 $29.32
$34.71 $29.99
$30.77 $30.05
671668
226144117177
177
251141279
6 271391
2
664 2
322112
7 207346
67
93 570
223 446
62 601
218449
1
$45,400 $53,400 $62,000 $43,000 $50,900 $60,000
5.6% 4.9% 3.3%
$54,000 $60,200 $70,000 $49,900 $56,800 $66,300 $44,300 $50,000 $56,500 $41,800 $45,000 $49,700
$41,800 $45,000 $49,700
$53,000 $60,000 $70,000 $47,000 $54,000 $62,000 $42,000 $47,000 $54,100
$46,500 $55,000 $62,400 $45,000 $52,000 $61,200
$45,400 $53,500 $62,000
$45,700 $53,100 $61,800 $50,500 $59,300 $68,800
$45,000 $52,000 $60,000 $45,300 $53,000 $61,800
$47,000 $57,000 $66,500
$47,800 $58,000 $69,300 $45,200 $52,800 $61,000
$50,000 $57,300 $67,000 $45,000 $50,600 $60,500
$49,500 $60,000 $70,500 $45,000 $52,900 $61,000
$45,000 $53,700 $62,100 $45,500 $53,000 $62,000
Note: Results not shown if fewer than 15 valid values.
Compensation by Position 83
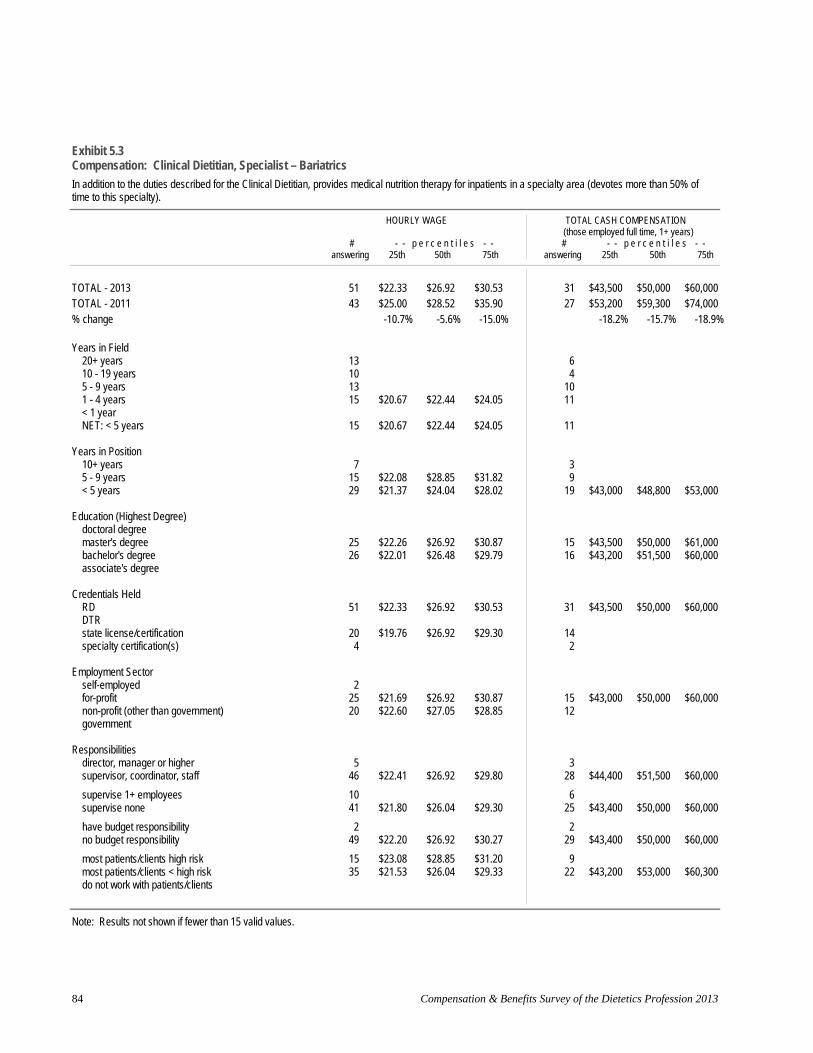
Exhibit 5.3 Compensation: Clinical Dietitian, Specialist – Bariatrics
In addition to the duties described for the Clinical Dietitian, provides medical nutrition therapy for inpatients in a specialty area (devotes more than 50% of time to this specialty).
HOURLY WAGE TOTAL CASH COMPENSATION
# answering
- - p e r c e n t i l e s25th 50th
- -75th
(those employed full time, 1+ years) # p e r c e n t i l e s - -
answering 25th 50th 75th
TOTAL - 2013 TOTAL - 2011 % change
Years in Field 20+ years 10 - 19 years 5 - 9 years 1 - 4 years < 1 year NET: < 5 years
Years in Position 10+ years 5 - 9 years < 5 years
Education (Highest Degree) doctoral degree
master's degree bachelor's degree
associate's degree
Credentials Held RD DTR
state license/certification specialty certification(s)
Employment Sector self-employed for-profit
non-profit (other than government) government
Responsibilities director, manager or higher supervisor, coordinator, staff
supervise 1+ employees supervise none
have budget responsibility no budget responsibility
most patients/clients high risk most patients/clients < high risk
do not work with patients/clients
51 $22.33 $26.92 $30.53 31 $43,500 $50,000 $60,000 43 $25.00 $28.52 $35.90 27 $53,200 $59,300 $74,000
-10.7% -5.6% -15.0% -18.2% -15.7% -18.9%
13 6 10 4 13 1015 $20.67 $22.44 $24.05 11
15 $20.67 $22.44 $24.05 11
7 3 15 $22.08 $28.85 $31.82 9 29 $21.37 $24.04 $28.02 19 $43,000 $48,800 $53,000
25 $22.26 $26.92 $30.87 15 $43,500 $50,000 $61,000 26 $22.01 $26.48 $29.79 16 $43,200 $51,500 $60,000
51 $22.33 $26.92 $30.53 31 $43,500 $50,000 $60,000
20 $19.76 $26.92 $29.30 14 4 2
2 25 $21.69 $26.92 $30.87 15 $43,000 $50,000 $60,000 20 $22.60 $27.05 $28.85 12
5 3 46 $22.41 $26.92 $29.80 28 $44,400 $51,500 $60,000
10 6 41 $21.80 $26.04 $29.30 25 $43,400 $50,000 $60,000
2 2 49 $22.20 $26.92 $30.27 29 $43,400 $50,000 $60,000
15 $23.08 $28.85 $31.20 9 35 $21.53 $26.04 $29.33 22 $43,200 $53,000 $60,300
Note: Results not shown if fewer than 15 valid values.
Compensation & Benefits Survey of the Dietetics Profession 2013 84
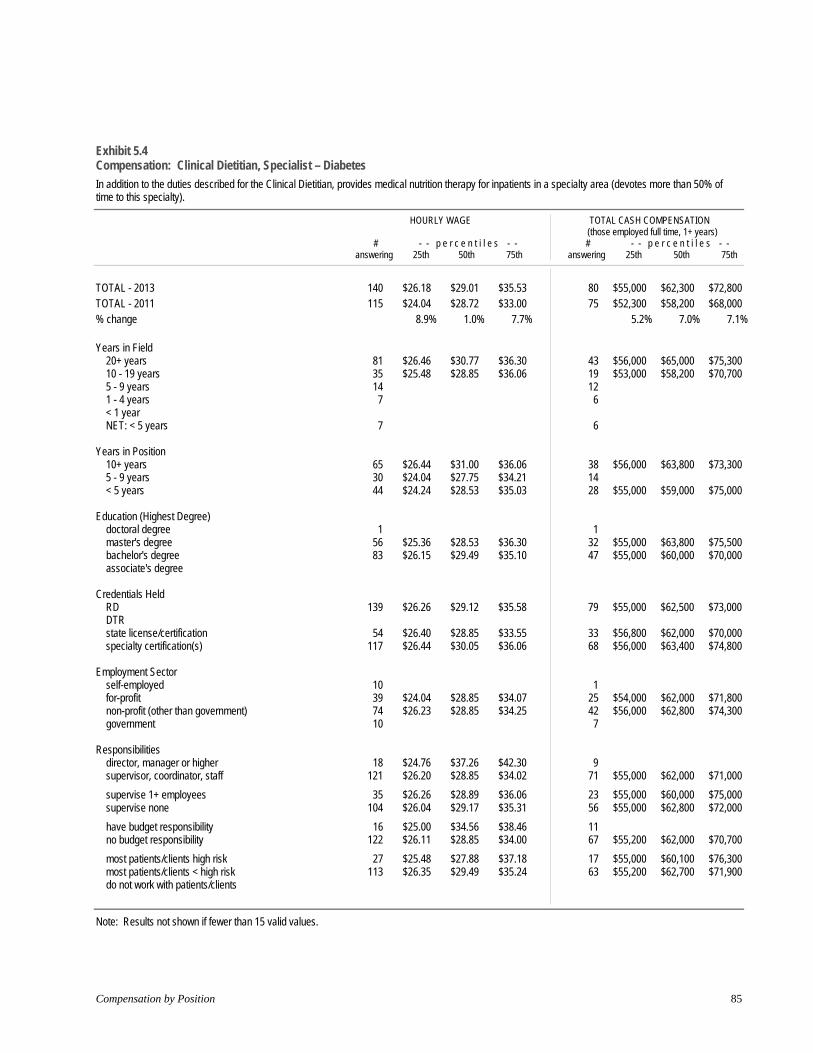
Exhibit 5.4 Compensation: Clinical Dietitian, Specialist – Diabetes
In addition to the duties described for the Clinical Dietitian, provides medical nutrition therapy for inpatients in a specialty area (devotes more than 50% of time to this specialty).
HOURLY WAGE TOTAL CASH COMPENSATION
# answering
- - p e r c e n t i l e s25th 50th
- -75th
(those employed full time, 1+ years) # p e r c e n t i l e s - -
answering 25th 50th 75th
TOTAL - 2013 TOTAL - 2011 % change
Years in Field 20+ years 10 - 19 years 5 - 9 years 1 - 4 years < 1 year NET: < 5 years
Years in Position 10+ years 5 - 9 years < 5 years
Education (Highest Degree) doctoral degree
master's degree bachelor's degree
associate's degree
Credentials Held RD DTR
state license/certification specialty certification(s)
Employment Sector self-employed for-profit
non-profit (other than government) government
Responsibilities director, manager or higher supervisor, coordinator, staff
supervise 1+ employees supervise none
have budget responsibility no budget responsibility
most patients/clients high risk most patients/clients < high risk
do not work with patients/clients
140 $26.18 $29.01 $35.53 80 $55,000 $62,300 $72,800 115 $24.04 $28.72 $33.00 75 $52,300 $58,200 $68,000
8.9% 1.0% 7.7% 5.2% 7.0% 7.1%
81 $26.46 $30.77 $36.30 43 $56,000 $65,000 $75,300 35 $25.48 $28.85 $36.06 19 $53,000 $58,200 $70,700 14 127 6
7 6
65 $26.44 $31.00 $36.06 38 $56,000 $63,800 $73,300 30 $24.04 $27.75 $34.21 1444 $24.24 $28.53 $35.03 28 $55,000 $59,000 $75,000
1 1 56 $25.36 $28.53 $36.30 32 $55,000 $63,800 $75,500 83 $26.15 $29.49 $35.10 47 $55,000 $60,000 $70,000
139 $26.26 $29.12 $35.58 79 $55,000 $62,500 $73,000
54 $26.40 $28.85 $33.55 33 $56,800 $62,000 $70,000 117 $26.44 $30.05 $36.06 68 $56,000 $63,400 $74,800
10 1 39 $24.04 $28.85 $34.07 25 $54,000 $62,000 $71,800 74 $26.23 $28.85 $34.25 42 $56,000 $62,800 $74,300 10 7
18 $24.76 $37.26 $42.30 9 121 $26.20 $28.85 $34.02 71 $55,000 $62,000 $71,000
35 $26.26 $28.89 $36.06 23 $55,000 $60,000 $75,000 104 $26.04 $29.17 $35.31 56 $55,000 $62,800 $72,000
16 $25.00 $34.56 $38.46 11122 $26.11 $28.85 $34.00 67 $55,200 $62,000 $70,700
27 $25.48 $27.88 $37.18 17 $55,000 $60,100 $76,300 113 $26.35 $29.49 $35.24 63 $55,200 $62,700 $71,900
Note: Results not shown if fewer than 15 valid values.
Compensation by Position 85

Exhibit 5.5 Compensation: Clinical Dietitian, Specialist – Eating Disorders
In addition to the duties described for the Clinical Dietitian, provides medical nutrition therapy for inpatients in a specialty area (devotes more than 50% of time to this specialty).
HOURLY WAGE TOTAL CASH COMPENSATION
# answering
- - p e r c e n t i l e s25th 50th
- -75th
(those employed full time, 1+ years) # p e r c e n t i l e s - -
answering 25th 50th 75th
TOTAL - 2013 TOTAL - 2011 % change
Years in Field 20+ years 10 - 19 years 5 - 9 years 1 - 4 years < 1 year NET: < 5 years
Years in Position 10+ years 5 - 9 years < 5 years
Education (Highest Degree) doctoral degree
master's degree bachelor's degree
associate's degree
Credentials Held RD DTR
state license/certification specialty certification(s)
Employment Sector self-employed for-profit
non-profit (other than government) government
Responsibilities director, manager or higher supervisor, coordinator, staff
supervise 1+ employees supervise none
have budget responsibility no budget responsibility
most patients/clients high risk most patients/clients < high risk do not work with patients/clients
36 $22.54 $25.36 $38.22 27 $22.60 $25.48 $38.46
-0.3% -0.5% -0.6%
9 6 9
12
12
7 9
19 $23.08 $25.48 $34.62
20 $24.04 $28.73 $39.86 16 $21.72 $23.80 $29.52
34 $23.37 $25.48 $38.70 1
14 5
8 18 $22.27 $25.12 $38.84 9
10 26 $22.90 $25.00 $35.21
14 20 $22.09 $24.04 $35.68
8 27 $23.46 $25.48 $39.42
17 $23.80 $25.24 $37.02 19 $21.63 $25.48 $38.46
26 $48,600 $54,100 $75,000 18 $47,300 $52,500 $63,900
2.7% 3.0% 17.4%
5 5 7 9
9
5 8
13
1313
24 $50,100 $55,500 $77,000 1 8 4
5 147
7 19 $48,000 $51,500 $61,000
1213
6 19 $48,800 $53,100 $71,000
1214
Note: Results not shown if fewer than 15 valid values.
Compensation & Benefits Survey of the Dietetics Profession 2013 86
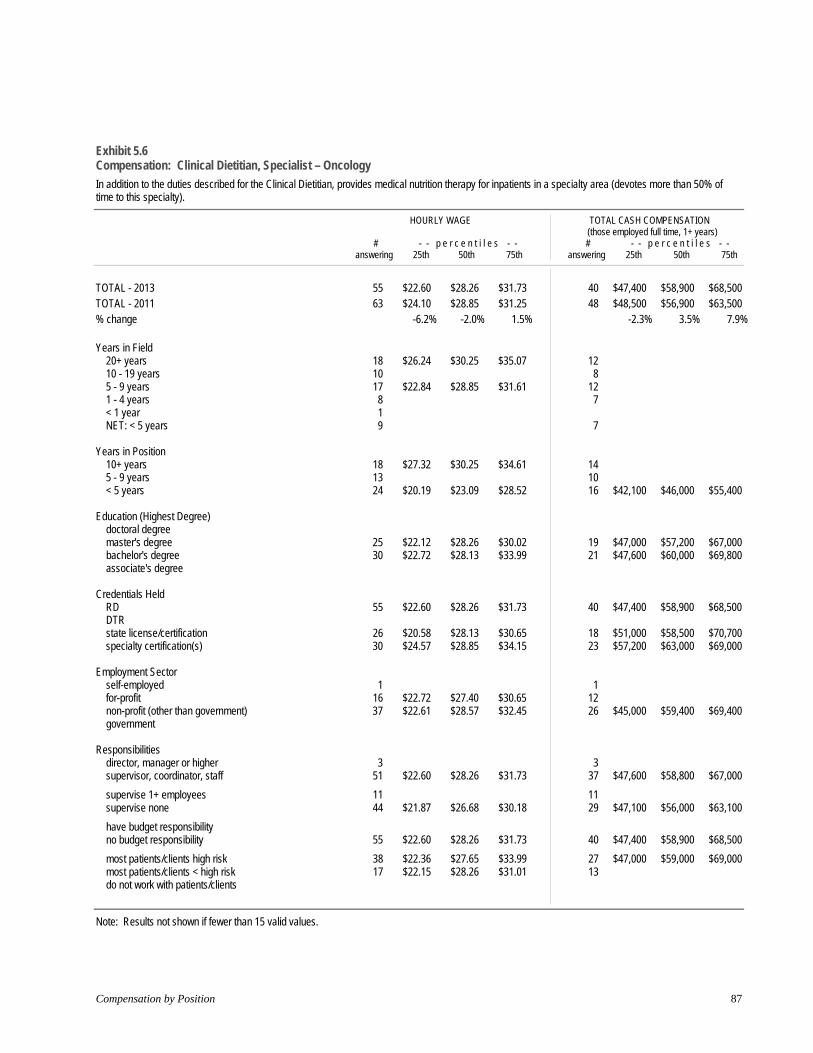
Exhibit 5.6 Compensation: Clinical Dietitian, Specialist – Oncology
In addition to the duties described for the Clinical Dietitian, provides medical nutrition therapy for inpatients in a specialty area (devotes more than 50% of time to this specialty).
HOURLY WAGE TOTAL CASH COMPENSATION
# answering
- - p e r c e n t i l e s25th 50th
- -75th
(those employed full time, 1+ years) # p e r c e n t i l e s - -
answering 25th 50th 75th
TOTAL - 2013 TOTAL - 2011 % change
Years in Field 20+ years 10 - 19 years 5 - 9 years 1 - 4 years < 1 year NET: < 5 years
Years in Position 10+ years 5 - 9 years < 5 years
Education (Highest Degree) doctoral degree
master's degree bachelor's degree
associate's degree
Credentials Held RD DTR
state license/certification specialty certification(s)
Employment Sector self-employed for-profit
non-profit (other than government) government
Responsibilities director, manager or higher supervisor, coordinator, staff
supervise 1+ employees supervise none
have budget responsibility no budget responsibility
most patients/clients high risk most patients/clients < high risk do not work with patients/clients
55 $22.60 $28.26 $31.73 40 $47,400 $58,900 $68,500 63 $24.10 $28.85 $31.25 48 $48,500 $56,900 $63,500
-6.2% -2.0% 1.5% -2.3% 3.5% 7.9%
18 $26.24 $30.25 $35.07 1210 8 17 $22.84 $28.85 $31.61 128 7 1 9 7
18 $27.32 $30.25 $34.61 1413 1024 $20.19 $23.09 $28.52 16 $42,100 $46,000 $55,400
25 $22.12 $28.26 $30.02 19 $47,000 $57,200 $67,000 30 $22.72 $28.13 $33.99 21 $47,600 $60,000 $69,800
55 $22.60 $28.26 $31.73 40 $47,400 $58,900 $68,500
26 $20.58 $28.13 $30.65 18 $51,000 $58,500 $70,700 30 $24.57 $28.85 $34.15 23 $57,200 $63,000 $69,000
1 1 16 $22.72 $27.40 $30.65 1237 $22.61 $28.57 $32.45 26 $45,000 $59,400 $69,400
3 3 51 $22.60 $28.26 $31.73 37 $47,600 $58,800 $67,000
11 1144 $21.87 $26.68 $30.18 29 $47,100 $56,000 $63,100
55 $22.60 $28.26 $31.73 40 $47,400 $58,900 $68,500
38 $22.36 $27.65 $33.99 27 $47,000 $59,000 $69,000 17 $22.15 $28.26 $31.01 13
Note: Results not shown if fewer than 15 valid values.
Compensation by Position 87

Exhibit 5.7 Compensation: Clinical Dietitian, Specialist – Psychiatric
In addition to the duties described for the Clinical Dietitian, provides medical nutrition therapy for inpatients in a specialty area (devotes more than 50% of time to this specialty).
HOURLY WAGE TOTAL CASH COMPENSATION
# answering
- - p e r c e n t i l e s25th 50th
- -75th
(those employed full time, 1+ years) # p e r c e n t i l e s - -
answering 25th 50th 75th
TOTAL - 2013 TOTAL - 2011 % change
Years in Field 20+ years 10 - 19 years 5 - 9 years 1 - 4 years < 1 year NET: < 5 years
Years in Position 10+ years 5 - 9 years < 5 years
Education (Highest Degree) doctoral degree master's degree
bachelor's degree associate's degree
Credentials Held RD DTR
state license/certification specialty certification(s)
Employment Sector self-employed for-profit
non-profit (other than government) government
Responsibilities director, manager or higher supervisor, coordinator, staff
supervise 1+ employees supervise none
have budget responsibility no budget responsibility
most patients/clients high risk most patients/clients < high risk
do not work with patients/clients
37 $22.60 $25.48 $29.93 28 $49,900 $53,000 $59,800 23 $21.63 $25.13 $31.25 19 $43,500 $50,000 $62,000
4.5% 1.4% -4.2% 14.7% 6.0% -3.5%
12 8 15 $25.00 $26.78 $32.07 112 1 7 7
7 7
11 108 5
17 $22.60 $25.00 $30.46 13
13 1224 $22.20 $25.24 $29.99 16 $44,000 $52,000 $55,700
37 $22.60 $25.48 $29.93 28 $49,900 $53,000 $59,800
14 11 2 2
1 1 7 4 7 4
21 $23.31 $25.48 $28.31 18 $50,800 $54,000 $58,600
4 4 33 $22.60 $25.48 $29.93 24 $49,900 $53,000 $59,800
15 $24.04 $26.67 $33.51 1322 $21.80 $25.24 $28.88 15 $47,000 $52,000 $55,700
3 3 34 $22.56 $25.48 $29.87 25 $48,500 $53,000 $59,700
1 1 36 $22.60 $25.48 $29.50 27 $49,900 $53,000 $59,400
Note: Results not shown if fewer than 15 valid values.
Compensation & Benefits Survey of the Dietetics Profession 2013 88

Exhibit 5.8 Compensation: Clinical Dietitian, Specialist – Renal
In addition to the duties described for the Clinical Dietitian, provides medical nutrition therapy for inpatients in a specialty area (devotes more than 50% of time to this specialty).
HOURLY WAGE TOTAL CASH COMPENSATION
# answering
- - p e r c e n t i l e s25th 50th
- -75th
(those employed full time, 1+ years) # p e r c e n t i l e s - -
answering 25th 50th 75th
TOTAL - 2013 TOTAL - 2011 % change
Years in Field 20+ years 10 - 19 years 5 - 9 years 1 - 4 years < 1 year NET: < 5 years
Years in Position 10+ years 5 - 9 years < 5 years
Education (Highest Degree) doctoral degree
master's degree bachelor's degree
associate's degree
Credentials Held RD DTR
state license/certification specialty certification(s)
Employment Sector self-employed for-profit
non-profit (other than government) government
Responsibilities director, manager or higher supervisor, coordinator, staff
supervise 1+ employees supervise none
have budget responsibility no budget responsibility
most patients/clients high risk most patients/clients < high risk
do not work with patients/clients
201 215
97 56 31 15
15
83 54 64
79 122
200
8841
1 143 367
13 186
33 168
6 195
96105
$25.00 $28.21 $31.49 149 $52,000 $60,000 $67,900 $24.62 $27.53 $30.77 150 $50,000 $57,300 $66,000
1.5% 2.5% 2.3% 4.0% 4.7% 2.9%
$26.74 $29.00 $33.17 75 $57,500 $62,500 $69,200 $25.64 $28.46 $31.85 41 $53,000 $62,500 $70,500 $23.08 $25.00 $28.37 21 $47,600 $52,000 $58,900 $20.19 $23.56 $25.00 11
$20.19 $23.56 $25.00 11
$26.44 $29.07 $32.09 66 $57,900 $62,800 $69,400 $24.82 $26.92 $30.04 43 $52,000 $58,000 $65,000 $24.01 $26.45 $31.85 40 $48,700 $53,500 $67,700
$25.96 $28.40 $31.25 55 $56,500 $62,000 $69,000 $24.22 $28.04 $32.06 94 $51,100 $58,300 $66,900
$25.00 $28.17 $31.61 148 $52,000 $60,000 $67,700
$25.00 $28.06 $31.97 62 $52,000 $59,000 $68,700 $26.16 $29.09 $33.65 37 $57,200 $62,500 $71,000
$25.00 $28.00 $30.77 103 $52,000 $59,000 $65,000 $25.13 $28.30 $33.63 30 $51,100 $60,200 $70,600
7
8 $25.00 $28.04 $31.25 140 $52,000 $59,700 $67,400
$25.06 $29.07 $33.65 28 $54,300 $63,500 $69,900 $25.00 $28.04 $31.13 121 $51,400 $60,000 $66,900
6 $25.00 $28.13 $31.25 143 $52,000 $60,000 $67,700
$25.00 $27.88 $31.19 72 $52,000 $59,000 $65,000 $25.04 $28.85 $32.07 77 $51,700 $62,000 $68,700
Note: Results not shown if fewer than 15 valid values.
Compensation by Position 89
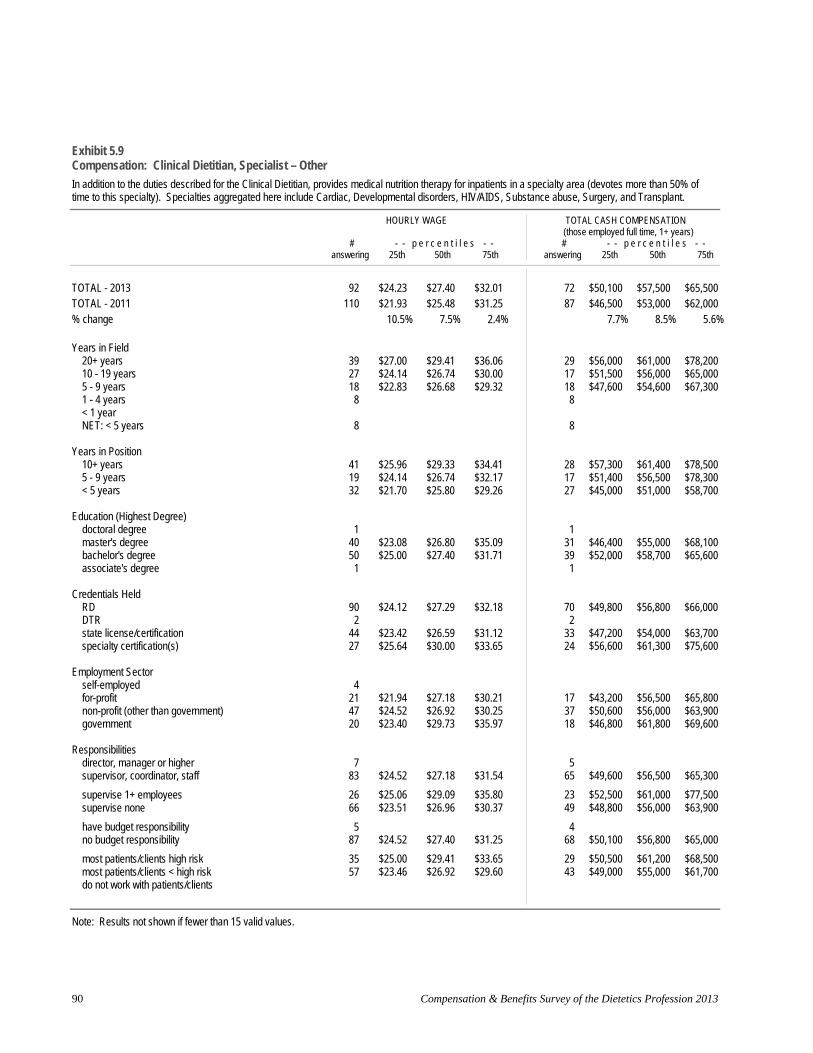
Exhibit 5.9 Compensation: Clinical Dietitian, Specialist – Other
In addition to the duties described for the Clinical Dietitian, provides medical nutrition therapy for inpatients in a specialty area (devotes more than 50% of time to this specialty). Specialties aggregated here include Cardiac, Developmental disorders, HIV/AIDS, Substance abuse, Surgery, and Transplant.
HOURLY WAGE TOTAL CASH COMPENSATION
# answering
- - p e r c e n t i l e s25th 50th
- -75th
(those employed full time, 1+ years) # p e r c e n t i l e s - -
answering 25th 50th 75th
TOTAL - 2013 TOTAL - 2011 % change
Years in Field 20+ years 10 - 19 years 5 - 9 years 1 - 4 years < 1 year NET: < 5 years
Years in Position 10+ years 5 - 9 years < 5 years
Education (Highest Degree) doctoral degree
master's degree bachelor's degree
associate's degree
Credentials Held RD DTR
state license/certification specialty certification(s)
Employment Sector self-employed for-profit
non-profit (other than government) government
Responsibilities director, manager or higher supervisor, coordinator, staff
supervise 1+ employees supervise none
have budget responsibility no budget responsibility
most patients/clients high risk most patients/clients < high risk
do not work with patients/clients
92110
39 27 18 8
8
41 19 32
1 40 50 1
90 2
4427
4 21 4720
7 83
26 66
5 87
3557
$24.23 $27.40 $32.01 72 $50,100 $57,500 $65,500 $21.93 $25.48 $31.25 87 $46,500 $53,000 $62,000
10.5% 7.5% 2.4% 7.7% 8.5% 5.6%
$27.00 $29.41 $36.06 29 $56,000 $61,000 $78,200 $24.14 $26.74 $30.00 17 $51,500 $56,000 $65,000 $22.83 $26.68 $29.32 18 $47,600 $54,600 $67,300
8
8
$25.96 $29.33 $34.41 28 $57,300 $61,400 $78,500 $24.14 $26.74 $32.17 17 $51,400 $56,500 $78,300 $21.70 $25.80 $29.26 27 $45,000 $51,000 $58,700
1 $23.08 $26.80 $35.09 31 $46,400 $55,000 $68,100 $25.00 $27.40 $31.71 39 $52,000 $58,700 $65,600
1
$24.12 $27.29 $32.18 70 $49,800 $56,800 $66,000 2
$23.42 $26.59 $31.12 33 $47,200 $54,000 $63,700 $25.64 $30.00 $33.65 24 $56,600 $61,300 $75,600
$21.94 $27.18 $30.21 17 $43,200 $56,500 $65,800 $24.52 $26.92 $30.25 37 $50,600 $56,000 $63,900
$23.40 $29.73 $35.97 18 $46,800 $61,800 $69,600
5 $24.52 $27.18 $31.54 65 $49,600 $56,500 $65,300
$25.06 $29.09 $35.80 23 $52,500 $61,000 $77,500 $23.51 $26.96 $30.37 49 $48,800 $56,000 $63,900
4 $24.52 $27.40 $31.25 68 $50,100 $56,800 $65,000
$25.00 $29.41 $33.65 29 $50,500 $61,200 $68,500 $23.46 $26.92 $29.60 43 $49,000 $55,000 $61,700
Note: Results not shown if fewer than 15 valid values.
Compensation & Benefits Survey of the Dietetics Profession 2013 90
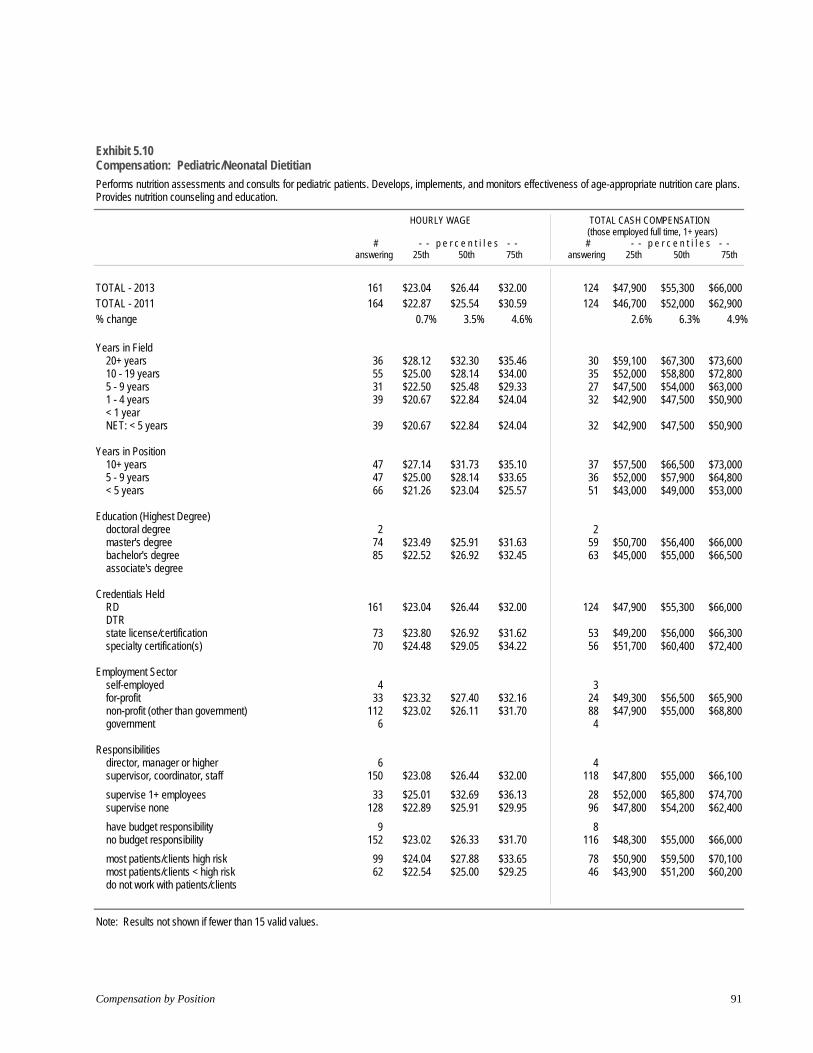
Exhibit 5.10 Compensation: Pediatric/Neonatal Dietitian
Performs nutrition assessments and consults for pediatric patients. Develops, implements, and monitors effectiveness of age-appropriate nutrition care plans. Provides nutrition counseling and education.
HOURLY WAGE TOTAL CASH COMPENSATION
# answering
- - p e r c e n t i l e s25th 50th
- -75th
(those employed full time, 1+ years) # p e r c e n t i l e s - -
answering 25th 50th 75th
TOTAL - 2013 TOTAL - 2011 % change
Years in Field 20+ years 10 - 19 years 5 - 9 years 1 - 4 years < 1 year NET: < 5 years
Years in Position 10+ years 5 - 9 years < 5 years
Education (Highest Degree) doctoral degree
master's degree bachelor's degree
associate's degree
Credentials Held RD DTR
state license/certification specialty certification(s)
Employment Sector self-employed for-profit
non-profit (other than government) government
Responsibilities director, manager or higher supervisor, coordinator, staff
supervise 1+ employees supervise none
have budget responsibility no budget responsibility
most patients/clients high risk most patients/clients < high risk
do not work with patients/clients
161 164
36 55 31 39
39
47 47 66
2 74 85
161
7370
4 33
1126
6 150
33 128
9 152
9962
$23.04 $22.87
0.7%
$28.12 $25.00 $22.50 $20.67
$20.67
$27.14 $25.00 $21.26
$23.49 $22.52
$23.04
$23.80$24.48
$23.32 $23.02
$23.08
$25.01$22.89
$23.02
$24.04 $22.54
$26.44 $25.54
3.5%
$32.30 $28.14 $25.48 $22.84
$22.84
$31.73 $28.14 $23.04
$25.91 $26.92
$26.44
$26.92 $29.05
$27.40 $26.11
$26.44
$32.69$25.91
$26.33
$27.88 $25.00
$32.00 $30.59
4.6%
$35.46 $34.00 $29.33 $24.04
$24.04
$35.10 $33.65 $25.57
$31.63 $32.45
$32.00
$31.62 $34.22
$32.16 $31.70
$32.00
$36.13 $29.95
$31.70
$33.65 $29.25
124124
30352732
32
373651
2 5963
124
5356
3 2488 4
4 118
28 96
8 116
7846
$47,900 $55,300 $66,000 $46,700 $52,000 $62,900
2.6% 6.3% 4.9%
$59,100 $67,300 $73,600 $52,000 $58,800 $72,800 $47,500 $54,000 $63,000 $42,900 $47,500 $50,900
$42,900 $47,500 $50,900
$57,500 $66,500 $73,000 $52,000 $57,900 $64,800 $43,000 $49,000 $53,000
$50,700 $56,400 $66,000 $45,000 $55,000 $66,500
$47,900 $55,300 $66,000
$49,200 $56,000 $66,300 $51,700 $60,400 $72,400
$49,300 $56,500 $65,900 $47,900 $55,000 $68,800
$47,800 $55,000 $66,100
$52,000 $65,800 $74,700 $47,800 $54,200 $62,400
$48,300 $55,000 $66,000
$50,900 $59,500 $70,100 $43,900 $51,200 $60,200
Note: Results not shown if fewer than 15 valid values.
Compensation by Position 91
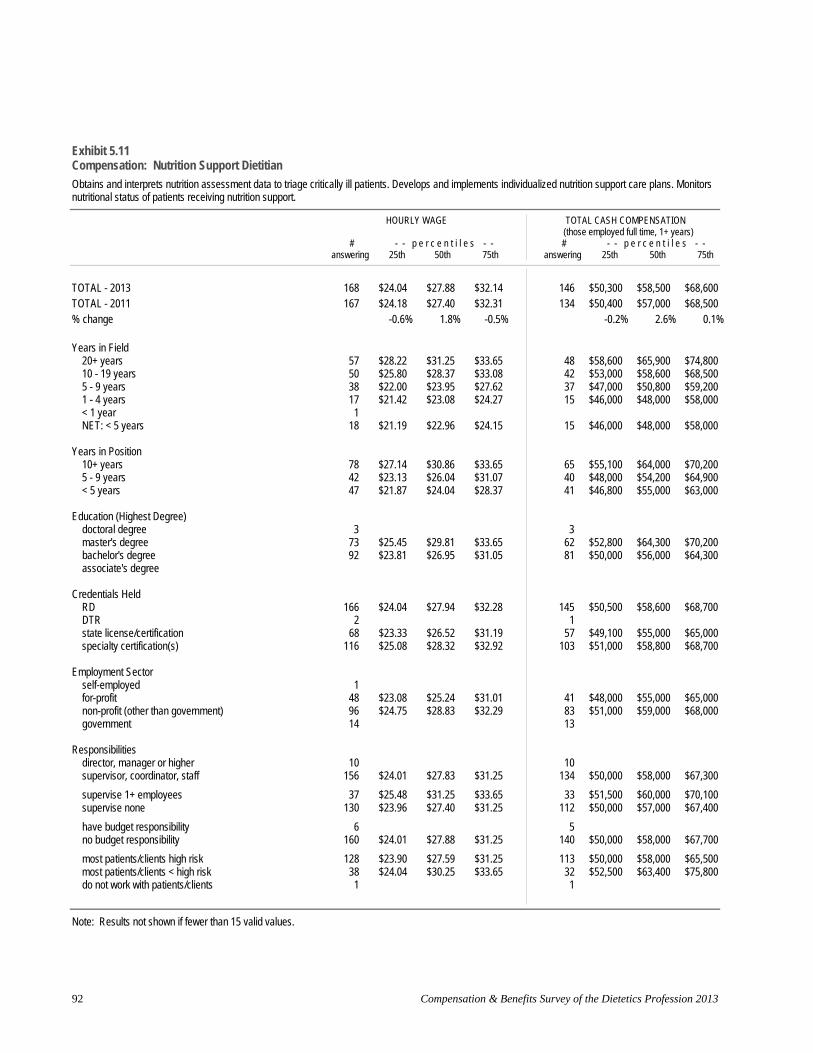
Exhibit 5.11 Compensation: Nutrition Support Dietitian
Obtains and interprets nutrition assessment data to triage critically ill patients. Develops and implements individualized nutrition support care plans. Monitors nutritional status of patients receiving nutrition support.
HOURLY WAGE TOTAL CASH COMPENSATION
# answering
- - p e r c e n t i l e s25th 50th
- -75th
(those employed full time, 1+ years) # p e r c e n t i l e s - -
answering 25th 50th 75th
TOTAL - 2013 TOTAL - 2011 % change
Years in Field 20+ years 10 - 19 years 5 - 9 years 1 - 4 years < 1 year NET: < 5 years
Years in Position 10+ years 5 - 9 years < 5 years
Education (Highest Degree) doctoral degree
master's degree bachelor's degree
associate's degree
Credentials Held RD DTR
state license/certification specialty certification(s)
Employment Sector self-employed for-profit
non-profit (other than government) government
Responsibilities director, manager or higher supervisor, coordinator, staff
supervise 1+ employees supervise none
have budget responsibility no budget responsibility
most patients/clients high risk most patients/clients < high risk
do not work with patients/clients
168 $24.04 $27.88 $32.14 146 $50,300 $58,500 $68,600 167 $24.18 $27.40 $32.31 134 $50,400 $57,000 $68,500
-0.6% 1.8% -0.5% -0.2% 2.6% 0.1%
57 $28.22 $31.25 $33.65 48 $58,600 $65,900 $74,800 50 $25.80 $28.37 $33.08 42 $53,000 $58,600 $68,500 38 $22.00 $23.95 $27.62 37 $47,000 $50,800 $59,200 17 $21.42 $23.08 $24.27 15 $46,000 $48,000 $58,000 1
18 $21.19 $22.96 $24.15 15 $46,000 $48,000 $58,000
78 $27.14 $30.86 $33.65 65 $55,100 $64,000 $70,200 42 $23.13 $26.04 $31.07 40 $48,000 $54,200 $64,900 47 $21.87 $24.04 $28.37 41 $46,800 $55,000 $63,000
3 3 73 $25.45 $29.81 $33.65 62 $52,800 $64,300 $70,200 92 $23.81 $26.95 $31.05 81 $50,000 $56,000 $64,300
166 $24.04 $27.94 $32.28 145 $50,500 $58,600 $68,700 2 1
68 $23.33 $26.52 $31.19 57 $49,100 $55,000 $65,000 116 $25.08 $28.32 $32.92 103 $51,000 $58,800 $68,700
1 48 $23.08 $25.24 $31.01 41 $48,000 $55,000 $65,000 96 $24.75 $28.83 $32.29 83 $51,000 $59,000 $68,000 14 13
10 10156 $24.01 $27.83 $31.25 134 $50,000 $58,000 $67,300
37 $25.48 $31.25 $33.65 33 $51,500 $60,000 $70,100 130 $23.96 $27.40 $31.25 112 $50,000 $57,000 $67,400
6 5 160 $24.01 $27.88 $31.25 140 $50,000 $58,000 $67,700
128 $23.90 $27.59 $31.25 113 $50,000 $58,000 $65,500 38 $24.04 $30.25 $33.65 32 $52,500 $63,400 $75,800 1 1
Note: Results not shown if fewer than 15 valid values.
Compensation & Benefits Survey of the Dietetics Profession 2013 92

Exhibit 5.12 Compensation: Outpatient Dietitian, General
Assesses the nutritional health of outpatients. Develops and implements individualized care plans. Provides nutrition education to individuals and groups.
HOURLY WAGE TOTAL CASH COMPENSATION (those employed full time, 1+ years)
# - - p e r c e n t i l e s - - # - - p e r c e n t i l e s - - answering 25th 50th 75th answering 25th 50th 75th
TOTAL - 2013 TOTAL - 2011 % change
Years in Field 20+ years 10 - 19 years 5 - 9 years 1 - 4 years < 1 year NET: < 5 years
Years in Position 10+ years 5 - 9 years < 5 years
Education (Highest Degree) doctoral degree
master's degree bachelor's degree
associate's degree
Credentials Held RD DTR
state license/certification specialty certification(s)
Employment Sector self-employed for-profit
non-profit (other than government) government
Responsibilities director, manager or higher supervisor, coordinator, staff
supervise 1+ employees supervise none
have budget responsibility no budget responsibility
most patients/clients high risk most patients/clients < high risk
do not work with patients/clients
256 276
92 70 46 42 4
46
85 57
114
135 119
2
248 4
10667
14 58
11165
29223
48 208
23 233
32221
1
$23.57 $28.70 $33.14 151 $49,000 $60,400 $70,000 $23.08 $27.41 $32.87 166 $49,000 $57,300 $68,000
2.1% 4.7% 0.8% 0.0% 5.4% 2.9%
$26.92 $31.43 $36.38 54 $56,200 $66,100 $74,200 $24.80 $28.85 $33.69 33 $58,100 $66,000 $80,200 $21.63 $27.16 $30.81 32 $43,500 $57,500 $65,900 $20.92 $23.20 $27.18 29 $43,000 $48,000 $56,400
1 $20.67 $23.04 $26.95 30 $42,800 $48,000 $56,300
$27.08 $31.73 $37.27 46 $58,000 $68,700 $79,100 $23.32 $28.37 $31.87 37 $46,600 $61,300 $69,300 $22.60 $26.13 $30.17 68 $47,000 $55,600 $64,100
$24.23 $28.85 $33.00 82 $50,000 $61,700 $70,000 $23.08 $28.31 $33.17 68 $48,000 $60,100 $70,000
1
$24.04 $28.85 $33.17 146 $50,000 $61,000 $70,000 2
$23.56 $28.25 $32.00 68 $49,300 $59,100 $68,500 $28.85 $32.00 $37.50 45 $60,000 $65,700 $78,900
3 $22.90 $27.22 $30.59 34 $42,400 $55,100 $64,400
$23.08 $27.24 $32.69 58 $49,000 $59,100 $70,000 $27.74 $31.25 $34.49 52 $58,000 $65,600 $73,500
$24.04 $32.05 $40.87 16 $49,800 $73,000 $85,000 $23.56 $28.31 $32.21 132 $49,200 $60,000 $68,700
$23.31 $30.47 $38.17 36 $44,500 $64,500 $80,700 $23.57 $28.34 $32.21 115 $50,000 $60,000 $68,300
$23.56 $30.57 $38.46 16 $46,400 $60,700 $74,000 $23.77 $28.50 $32.76 135 $50,000 $60,200 $70,000
$23.67 $26.79 $33.65 19 $49,000 $55,000 $80,500 $23.77 $28.85 $33.02 131 $49,000 $61,000 $70,000
1
Note: Results not shown if fewer than 15 valid values.
Compensation by Position 93

Exhibit 5.13 Compensation: Outpatient Dietitian, Specialist – Diabetes
In addition to the duties described for the Outpatient Dietitian, provides medical nutrition therapy for outpatients in a specialty area (devotes more than 50% of time to this specialty).
HOURLY WAGE TOTAL CASH COMPENSATION
# answering
- - p e r c e n t i l e s25th 50th
- -75th
(those employed full time, 1+ years) # p e r c e n t i l e s - -
answering 25th 50th 75th
TOTAL - 2013 TOTAL - 2011 % change
Years in Field 20+ years 10 - 19 years 5 - 9 years 1 - 4 years < 1 year NET: < 5 years
Years in Position 10+ years 5 - 9 years < 5 years
Education (Highest Degree) doctoral degree
master's degree bachelor's degree
associate's degree
Credentials Held RD DTR
state license/certification specialty certification(s)
Employment Sector self-employed for-profit
non-profit (other than government) government
Responsibilities director, manager or higher supervisor, coordinator, staff
supervise 1+ employees supervise none
have budget responsibility no budget responsibility
most patients/clients high risk most patients/clients < high risk
do not work with patients/clients
276 $25.63 $29.81 $34.22 187 $53,300 $63,000 $72,500 270 $24.52 $28.66 $33.65 169 $51,300 $60,000 $72,000
4.5% 4.0% 1.7% 3.9% 5.0% 0.7%
143 $27.88 $31.25 $35.23 97 $60,000 $65,000 $75,000 71 $25.64 $29.81 $34.62 49 $53,500 $64,900 $75,700 38 $23.53 $28.43 $32.10 23 $48,000 $58,200 $63,000 24 $20.36 $22.58 $26.59 18 $41,900 $45,600 $52,300
24 $20.36 $22.58 $26.59 18 $41,900 $45,600 $52,300
113 $27.43 $31.25 $35.26 79 $60,000 $66,900 $75,000 76 $25.64 $29.80 $33.91 48 $51,300 $62,000 $70,300 85 $23.90 $28.85 $32.57 60 $48,000 $58,800 $66,100
2 1 134 $26.18 $30.67 $35.56 92 $56,300 $63,000 $73,300 140 $25.00 $29.61 $33.16 94 $50,500 $63,000 $72,100
276 $25.63 $29.81 $34.22 187 $53,300 $63,000 $72,500
140 $25.36 $29.67 $33.65 97 $52,200 $62,000 $70,400 241 $26.44 $30.29 $34.86 164 $56,800 $64,700 $73,000
4 75 $26.30 $30.19 $35.40 54 $55,700 $65,000 $72,800
166 $25.00 $29.57 $33.69 107 $50,700 $61,100 $71,000 22 $28.61 $33.84 $36.60 19 $60,000 $67,000 $76,000
19 $27.76 $35.58 $40.24 14256 $25.59 $29.73 $33.75 173 $52,700 $62,000 $71,100
68 $25.59 $31.49 $36.06 53 $52,800 $66,000 $76,500 208 $25.64 $29.33 $33.65 134 $53,700 $61,800 $71,000
36 $27.13 $34.94 $39.66 26 $60,300 $71,200 $89,200 239 $25.48 $29.65 $33.65 161 $52,700 $62,000 $70,900
51 $25.00 $28.85 $38.94 37 $50,000 $61,000 $81,500 224 $25.69 $29.81 $33.75 149 $54,400 $63,000 $70,900
Note: Results not shown if fewer than 15 valid values.
Compensation & Benefits Survey of the Dietetics Profession 2013 94

Exhibit 5.14 Compensation: Outpatient Dietitian, Specialist – Oncology
In addition to the duties described for the Outpatient Dietitian, provides medical nutrition therapy for outpatients in a specialty area (devotes more than 50% of time to this specialty).
HOURLY WAGE TOTAL CASH COMPENSATION
# answering
- - p e r c e n t i l e s25th 50th
- -75th
(those employed full time, 1+ years) # p e r c e n t i l e s - -
answering 25th 50th 75th
TOTAL - 2013 TOTAL - 2011 % change
Years in Field 20+ years 10 - 19 years 5 - 9 years 1 - 4 years < 1 year NET: < 5 years
Years in Position 10+ years 5 - 9 years < 5 years
Education (Highest Degree) doctoral degree master's degree
bachelor's degree associate's degree
Credentials Held RD DTR
state license/certification specialty certification(s)
Employment Sector self-employed
for-profit non-profit (other than government)
government
Responsibilities director, manager or higher supervisor, coordinator, staff
supervise 1+ employees supervise none
have budget responsibility no budget responsibility
most patients/clients high risk most patients/clients < high risk
do not work with patients/clients
36 $24.22 $27.58 $30.43 44 $22.27 $25.68 $29.99
8.8% 7.4% 1.5%
9 10 8 9
9
9 10 17 $21.88 $26.44 $29.81
9 27 $22.12 $25.96 $28.85
36 $24.22 $27.58 $30.43
12 21 $25.55 $28.37 $30.67
18 $21.15 $25.24 $28.84 16 $26.25 $28.85 $30.72
3 33 $24.40 $27.69 $30.29
7 29 $24.52 $27.69 $30.38
2 34 $24.58 $27.58 $30.14
25 $25.06 $28.46 $30.67 11
28 $50,500 $55,500 $63,000 27 $48,400 $54,200 $62,300
4.3% 2.4% 1.1%
4 107 7
7
7 7
14
4 24 $50,500 $55,000 $60,000
28 $50,500 $55,500 $63,000
9 18 $53,700 $58,000 $64,900
15 $44,600 $52,000 $61,000 12
3 25 $52,000 $56,000 $62,400
7 21 $49,000 $56,000 $62,400
2 26 $50,000 $55,500 $61,700
19 $52,900 $58,000 $64,000 9
Note: Results not shown if fewer than 15 valid values.
Compensation by Position 95
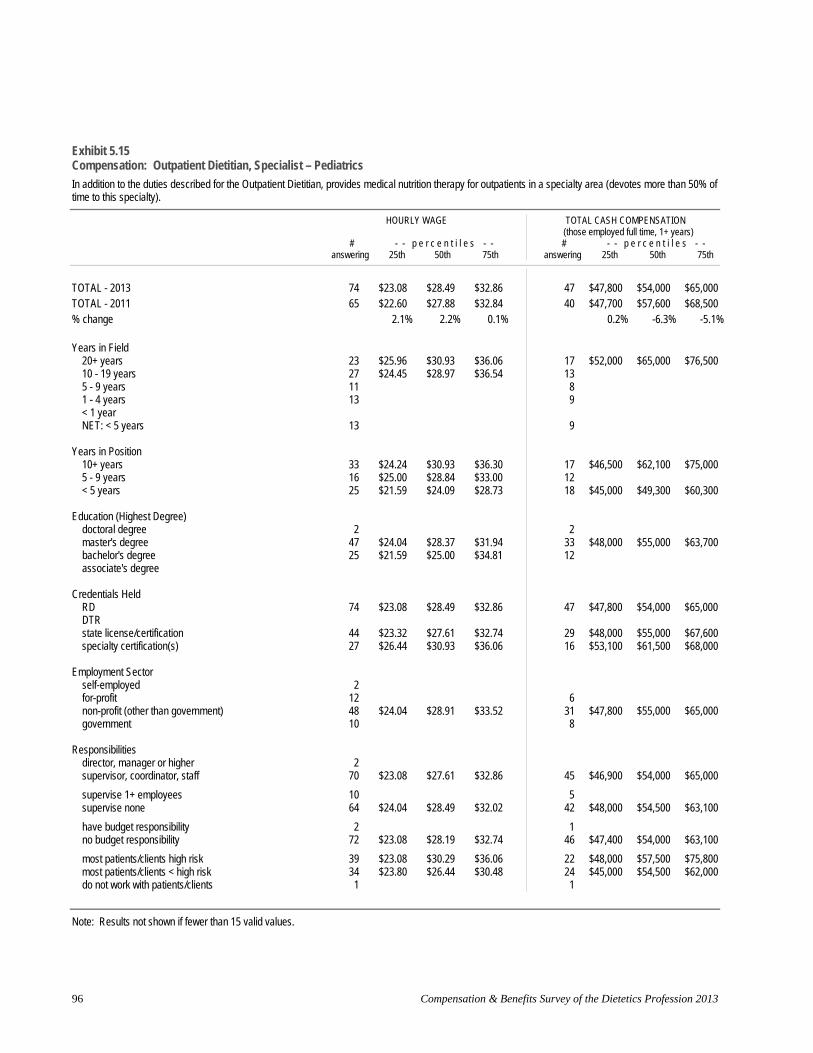
Exhibit 5.15 Compensation: Outpatient Dietitian, Specialist – Pediatrics
In addition to the duties described for the Outpatient Dietitian, provides medical nutrition therapy for outpatients in a specialty area (devotes more than 50% of time to this specialty).
HOURLY WAGE TOTAL CASH COMPENSATION
# answering
- - p e r c e n t i l e s25th 50th
- -75th
(those employed full time, 1+ years) # p e r c e n t i l e s - -
answering 25th 50th 75th
TOTAL - 2013 TOTAL - 2011 % change
Years in Field 20+ years 10 - 19 years 5 - 9 years 1 - 4 years < 1 year NET: < 5 years
Years in Position 10+ years 5 - 9 years < 5 years
Education (Highest Degree) doctoral degree
master's degree bachelor's degree
associate's degree
Credentials Held RD DTR
state license/certification specialty certification(s)
Employment Sector self-employed for-profit
non-profit (other than government) government
Responsibilities director, manager or higher supervisor, coordinator, staff
supervise 1+ employees supervise none
have budget responsibility no budget responsibility
most patients/clients high risk most patients/clients < high risk
do not work with patients/clients
74 $23.08 $28.49 $32.86 47 $47,800 $54,000 $65,000 65 $22.60 $27.88 $32.84 40 $47,700 $57,600 $68,500
2.1% 2.2% 0.1% 0.2% -6.3% -5.1%
23 $25.96 $30.93 $36.06 17 $52,000 $65,000 $76,500 27 $24.45 $28.97 $36.54 1311 8 13 9
13 9
33 $24.24 $30.93 $36.30 17 $46,500 $62,100 $75,000 16 $25.00 $28.84 $33.00 1225 $21.59 $24.09 $28.73 18 $45,000 $49,300 $60,300
2 2 47 $24.04 $28.37 $31.94 33 $48,000 $55,000 $63,700 25 $21.59 $25.00 $34.81 12
74 $23.08 $28.49 $32.86 47 $47,800 $54,000 $65,000
44 $23.32 $27.61 $32.74 29 $48,000 $55,000 $67,600 27 $26.44 $30.93 $36.06 16 $53,100 $61,500 $68,000
2 12 6 48 $24.04 $28.91 $33.52 31 $47,800 $55,000 $65,000 10 8
2 70 $23.08 $27.61 $32.86 45 $46,900 $54,000 $65,000
10 5 64 $24.04 $28.49 $32.02 42 $48,000 $54,500 $63,100
2 1 72 $23.08 $28.19 $32.74 46 $47,400 $54,000 $63,100
39 $23.08 $30.29 $36.06 22 $48,000 $57,500 $75,800 34 $23.80 $26.44 $30.48 24 $45,000 $54,500 $62,000 1 1
Note: Results not shown if fewer than 15 valid values.
Compensation & Benefits Survey of the Dietetics Profession 2013 96
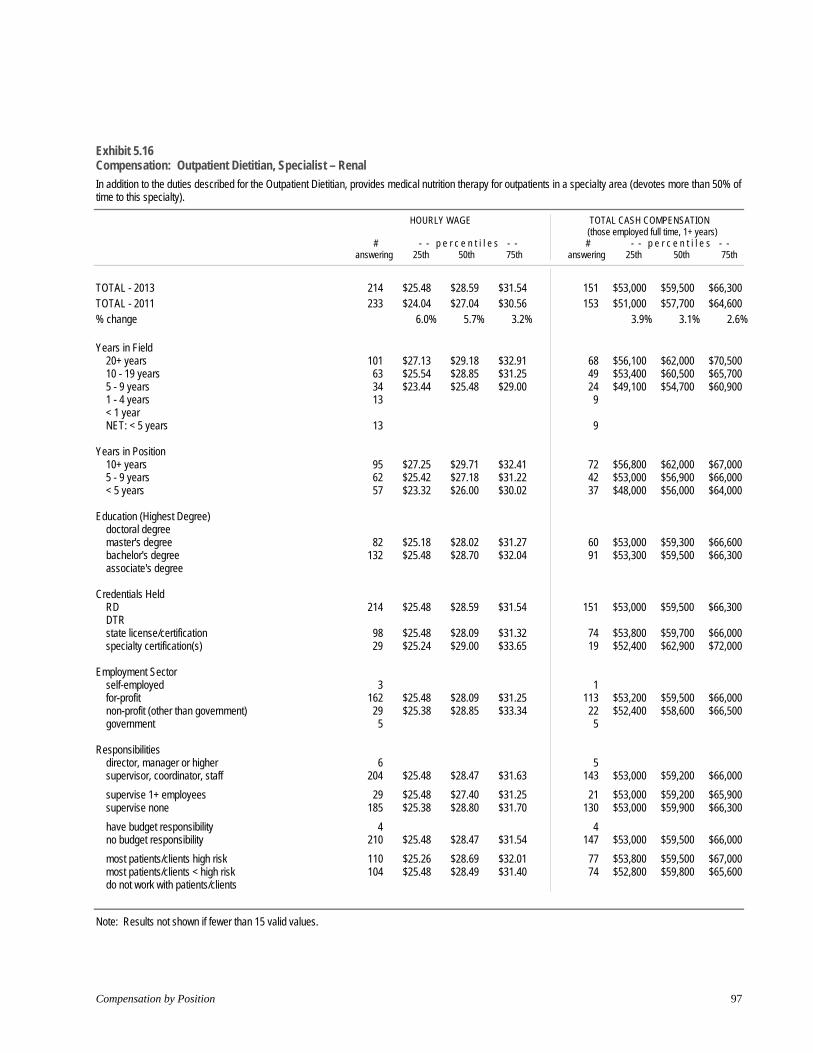
Exhibit 5.16 Compensation: Outpatient Dietitian, Specialist – Renal
In addition to the duties described for the Outpatient Dietitian, provides medical nutrition therapy for outpatients in a specialty area (devotes more than 50% of time to this specialty).
HOURLY WAGE TOTAL CASH COMPENSATION
# answering
- - p e r c e n t i l e s25th 50th
- -75th
(those employed full time, 1+ years) # p e r c e n t i l e s - -
answering 25th 50th 75th
TOTAL - 2013 TOTAL - 2011 % change
Years in Field 20+ years 10 - 19 years 5 - 9 years 1 - 4 years < 1 year NET: < 5 years
Years in Position 10+ years 5 - 9 years < 5 years
Education (Highest Degree) doctoral degree
master's degree bachelor's degree
associate's degree
Credentials Held RD DTR
state license/certification specialty certification(s)
Employment Sector self-employed for-profit
non-profit (other than government) government
Responsibilities director, manager or higher supervisor, coordinator, staff
supervise 1+ employees supervise none
have budget responsibility no budget responsibility
most patients/clients high risk most patients/clients < high risk
do not work with patients/clients
214 $25.48 $28.59 $31.54 151 $53,000 $59,500 $66,300 233 $24.04 $27.04 $30.56 153 $51,000 $57,700 $64,600
6.0% 5.7% 3.2% 3.9% 3.1% 2.6%
101 $27.13 $29.18 $32.91 68 $56,100 $62,000 $70,500 63 $25.54 $28.85 $31.25 49 $53,400 $60,500 $65,700 34 $23.44 $25.48 $29.00 24 $49,100 $54,700 $60,900 13 9
13 9
95 $27.25 $29.71 $32.41 72 $56,800 $62,000 $67,000 62 $25.42 $27.18 $31.22 42 $53,000 $56,900 $66,000 57 $23.32 $26.00 $30.02 37 $48,000 $56,000 $64,000
82 $25.18 $28.02 $31.27 60 $53,000 $59,300 $66,600 132 $25.48 $28.70 $32.04 91 $53,300 $59,500 $66,300
214 $25.48 $28.59 $31.54 151 $53,000 $59,500 $66,300
98 $25.48 $28.09 $31.32 74 $53,800 $59,700 $66,000 29 $25.24 $29.00 $33.65 19 $52,400 $62,900 $72,000
3 1 162 $25.48 $28.09 $31.25 113 $53,200 $59,500 $66,000 29 $25.38 $28.85 $33.34 22 $52,400 $58,600 $66,500
5 5
6 5 204 $25.48 $28.47 $31.63 143 $53,000 $59,200 $66,000
29 $25.48 $27.40 $31.25 21 $53,000 $59,200 $65,900 185 $25.38 $28.80 $31.70 130 $53,000 $59,900 $66,300
4 4 210 $25.48 $28.47 $31.54 147 $53,000 $59,500 $66,000
110 $25.26 $28.69 $32.01 77 $53,800 $59,500 $67,000 104 $25.48 $28.49 $31.40 74 $52,800 $59,800 $65,600
Note: Results not shown if fewer than 15 valid values.
Compensation by Position 97

Exhibit 5.17 Compensation: Outpatient Dietitian, Specialist – Weight Management
In addition to the duties described for the Outpatient Dietitian, provides medical nutrition therapy for outpatients in a specialty area (devotes more than 50% of time to this specialty).
HOURLY WAGE TOTAL CASH COMPENSATION
# answering
- - p e r c e n t i l e s25th 50th
- -75th
(those employed full time, 1+ years) # p e r c e n t i l e s - -
answering 25th 50th 75th
TOTAL - 2013 TOTAL - 2011 % change
Years in Field 20+ years 10 - 19 years 5 - 9 years 1 - 4 years < 1 year NET: < 5 years
Years in Position 10+ years 5 - 9 years < 5 years
Education (Highest Degree) doctoral degree
master's degree bachelor's degree
associate's degree
Credentials Held RD DTR
state license/certification specialty certification(s)
Employment Sector self-employed for-profit
non-profit (other than government) government
Responsibilities director, manager or higher supervisor, coordinator, staff
supervise 1+ employees supervise none
have budget responsibility no budget responsibility
most patients/clients high risk most patients/clients < high risk
do not work with patients/clients
94 $22.00 $28.31 $32.62 92 $22.03 $25.72 $31.93
-0.1% 10.1% 2.2%
24 $26.27 $29.64 $33.48 23 $25.00 $30.77 $36.06 20 $18.96 $26.23 $32.23 26 $20.19 $22.30 $26.55
26 $20.19 $22.30 $26.55
15 $25.11 $32.69 $34.36 27 $24.04 $31.25 $36.06 52 $20.31 $24.43 $29.95
1 48 $24.04 $28.99 $33.41 45 $21.81 $24.21 $32.15
93 $22.02 $28.37 $32.64 1
43 $20.31 $28.25 $32.59 12
5 28 $20.91 $24.43 $31.92 38 $21.79 $26.92 $31.25 19 $30.29 $32.69 $35.10
8 84 $22.70 $28.85 $32.66
22 $23.80 $29.12 $32.62 71 $22.00 $27.40 $32.69
8 86 $22.00 $27.88 $31.94
19 $20.19 $27.40 $31.73 75 $22.00 $28.85 $32.69
69 $47,000 $57,000 $67,400 53 $46,500 $54,000 $67,600
1.1% 5.6% -0.3%
17 $55,000 $65,000 $69,200 1417 $42,100 $55,000 $65,100 21 $42,000 $48,400 $55,100
21 $42,000 $48,400 $55,100
1220 $52,000 $65,600 $74,900 37 $42,500 $50,000 $61,400
1 36 $51,600 $62,300 $67,900 32 $42,400 $50,200 $65,600
68 $47,200 $58,500 $67,600 1
35 $42,200 $60,300 $67,800 9
2 18 $42,000 $47,700 $54,100 29 $49,500 $57,000 $65,400 18 $63,500 $70,400 $73,600
6 63 $47,800 $60,100 $67,800
19 $51,000 $63,000 $73,000 49 $46,400 $55,000 $65,600
6 63 $47,000 $57,000 $65,800
15 $47,000 $55,000 $65,500 54 $46,700 $60,100 $68,700
Note: Results not shown if fewer than 15 valid values.
Compensation & Benefits Survey of the Dietetics Profession 2013 98

Exhibit 5.18 Compensation: Outpatient Dietitian, Specialist – Other
In addition to the duties described for the Outpatient Dietitian, provides medical nutrition therapy for outpatients in a specialty area (devotes more than 50% of time to this specialty). Specialties aggregated here include Allergy, Cardiac rehabilitation, and Eating disorders.
HOURLY WAGE TOTAL CASH COMPENSATION
# answering
- - p e r c e n t i l e s25th 50th
- -75th
(those employed full time, 1+ years) # p e r c e n t i l e s - -
answering 25th 50th 75th
TOTAL - 2013 TOTAL - 2011 % change
Years in Field 20+ years 10 - 19 years 5 - 9 years 1 - 4 years < 1 year NET: < 5 years
Years in Position 10+ years 5 - 9 years < 5 years
Education (Highest Degree) doctoral degree
master's degree bachelor's degree
associate's degree
Credentials Held RD DTR
state license/certification specialty certification(s)
Employment Sector self-employed for-profit
non-profit (other than government) government
Responsibilities director, manager or higher supervisor, coordinator, staff
supervise 1+ employees supervise none
have budget responsibility no budget responsibility
most patients/clients high risk most patients/clients < high risk do not work with patients/clients
43 $24.04 $27.40 $32.05 17 $54,300 $62,400 $75,700 39 $23.08 $26.44 $32.31 23 $45,000 $52,000 $70,000
4.2% 3.6% -0.8% 20.7% 20.0% 8.1%
16 $27.52 $29.91 $37.14 8 11 6 104 2
4 2
16 $27.52 $31.41 $37.26 9 13 5 14 3
1 25 $25.32 $28.85 $33.17 9 17 $21.84 $25.32 $29.33 8
43 $24.04 $27.40 $32.05 17 $54,300 $62,400 $75,700
20 $24.04 $27.16 $30.58 12 7 3
7 1 12 5 20 $23.32 $26.27 $30.34 9 1
9 3 33 $23.56 $26.92 $30.23 14
6 4 37 $23.08 $26.92 $32.05 13
5 3 38 $23.08 $26.92 $30.53 14
11 5 32 $24.28 $27.64 $31.73 12
Note: Results not shown if fewer than 15 valid values.
Compensation by Position 99

Exhibit 5.19 Compensation: Home Care Dietitian
Provides nutrition services to patients in a home care setting. Consults with case managers and physicians on screening and assessment of patients. Monitors and evaluates nutrition care of high-risk patients.
HOURLY WAGE TOTAL CASH COMPENSATION
# answering
- - p e r c e n t i l e s25th 50th
- -75th
(those employed full time, 1+ years) # p e r c e n t i l e s - -
answering 25th 50th 75th
TOTAL - 2013 TOTAL - 2011 % change
Years in Field 20+ years 10 - 19 years 5 - 9 years 1 - 4 years < 1 year NET: < 5 years
Years in Position 10+ years 5 - 9 years < 5 years
Education (Highest Degree) doctoral degree
master's degree bachelor's degree
associate's degree
Credentials Held RD DTR
state license/certification specialty certification(s)
Employment Sector self-employed for-profit
non-profit (other than government) government
Responsibilities director, manager or higher supervisor, coordinator, staff
supervise 1+ employees supervise none
have budget responsibility no budget responsibility
most patients/clients high risk most patients/clients < high risk
do not work with patients/clients
58 $26.13 $31.09 $35.22 39 $57,700 $65,100 $74,600 60 $23.68 $26.96 $33.20 40 $50,200 $58,000 $70,000
10.3% 15.3% 6.1% 14.9% 12.2% 6.6%
21 $27.95 $32.21 $36.06 1119 $28.85 $31.25 $37.26 1211 107 6
7 6
21 $26.80 $31.67 $37.26 128 5
29 $26.04 $29.81 $32.98 22 $57,300 $63,700 $70,000
20 $27.91 $31.73 $38.46 1438 $25.15 $30.29 $34.71 25 $55,500 $66,200 $74,800
58 $26.13 $31.09 $35.22 39 $57,700 $65,100 $74,600
30 $25.16 $28.95 $33.99 21 $52,000 $65,000 $71,600 22 $28.99 $32.39 $36.36 16 $62,700 $72,700 $81,100
3 25 $24.96 $30.28 $37.26 17 $55,500 $70,000 $78,100 13 8 16 $29.93 $31.25 $34.50 14
3 1 55 $26.22 $30.92 $34.62 38 $57,600 $65,000 $73,300
10 7 48 $25.47 $30.29 $34.50 32 $57,500 $65,000 $72,400
58 $26.13 $31.09 $35.22 39 $57,700 $65,100 $74,600
19 $27.17 $31.25 $37.26 1139 $25.85 $30.92 $34.62 28 $57,500 $65,000 $72,400
Note: Results not shown if fewer than 15 valid values.
Compensation & Benefits Survey of the Dietetics Profession 2013 100

Exhibit 5.20 Compensation: Clinical Dietitian, Long Term Care
Develops and implements nutrition care plans for residents. Documents progress and recommendations. Provides nutrition education for residents, families, and staff. May consult with foodservice staff on food preparation, service, and delivery. May provide services as a consultant to more than one facility or be employed by single facility.
HOURLY WAGE TOTAL CASH COMPENSATION
# answering
- - p e r c e n t i l e s25th 50th
- -75th
(those employed full time, 1+ years) # p e r c e n t i l e s - -
answering 25th 50th 75th
TOTAL - 2013 TOTAL - 2011 % change
Years in Field 20+ years 10 - 19 years 5 - 9 years 1 - 4 years < 1 year NET: < 5 years
Years in Position 10+ years 5 - 9 years < 5 years
Education (Highest Degree) doctoral degree
master's degree bachelor's degree
associate's degree
Credentials Held RD DTR
state license/certification specialty certification(s)
Employment Sector self-employed
for-profit non-profit (other than government) government
Responsibilities director, manager or higher supervisor, coordinator, staff
supervise 1+ employees supervise none
have budget responsibility no budget responsibility
most patients/clients high risk most patients/clients < high risk
do not work with patients/clients
497 615
211 135
67 75 5
80
191 125 181
2 181 308
6
484 8
23848
92 241 109
36
170325
273 222
75 417
150344
1
$24.04 $23.08
4.2%
$25.00 $24.38 $24.00 $20.67
$20.67
$24.95 $24.80 $22.84
$24.04 $24.04
$24.04
$24.04$25.30
$26.71 $24.04
$24.00$21.72
$24.04 $24.00
$24.04$24.03
$24.04$24.02
$24.04 $24.04
$28.00 $27.40
2.2%
$30.77 $28.84 $26.44 $24.04
$24.04
$31.55 $28.85 $25.48
$29.17 $27.88
$28.34
$28.00 $30.08
$32.48 $27.88
$26.44$25.38
$27.88 $28.13
$27.88$28.54
$27.88 $28.00
$28.29 $27.88
$34.62 $32.69
5.9%
$38.46 $34.62 $31.50 $26.15
$26.10
$38.46 $33.65 $29.81
$35.82 $33.91
$34.62
$34.62 $35.80
$44.87 $33.65
$29.81 $34.38
$36.06 $33.61
$33.89 $34.97
$34.62 $34.62
$34.68 $34.62
312374
118865253
53
11984
109
110197
5
302 7
14733
22169
77 35
128 184
199 111
66 242
102207
1
$50,000 $58,000 $70,000 $47,000 $54,400 $65,000
6.4% 6.6% 7.7%
$53,000 $65,500 $76,900 $51,500 $62,000 $68,400 $46,400 $54,700 $61,000 $42,600 $50,000 $54,500
$42,600 $50,000 $54,500
$52,000 $63,000 $78,000 $52,000 $62,000 $69,800 $45,000 $52,000 $60,300
$50,000 $60,000 $71,500 $50,000 $58,000 $70,000
$50,000 $58,100 $70,000
$50,000 $58,000 $70,000 $52,500 $64,000 $75,300
$58,900 $78,000 $104,800 $50,000 $58,000 $70,000
$50,000 $56,000 $66,300 $46,200 $56,200 $70,000
$50,000 $57,500 $72,800 $48,500 $58,300 $68,900
$50,000 $59,500 $70,000 $48,400 $56,000 $68,500
$51,000 $60,600 $75,400 $49,000 $58,000 $70,000
$50,000 $60,000 $71,000 $50,000 $56,300 $70,000
Note: Results not shown if fewer than 15 valid values.
Compensation by Position 101

Exhibit 5.21 Compensation: Dietetic Technician, Long Term Care
Performs nutrition screening and routine assessments, and provides basic nutrition care. Monitors resident satisfaction and tolerance of meals. May monitor food production and meal service.
HOURLY WAGE TOTAL CASH COMPENSATION
# answering
- - p e r c e n t i l e s25th 50th
- -75th
(those employed full time, 1+ years) # p e r c e n t i l e s - -
answering 25th 50th 75th
TOTAL - 2013 TOTAL - 2011 % change
Years in Field 20+ years 10 - 19 years 5 - 9 years 1 - 4 years < 1 year NET: < 5 years
Years in Position 10+ years 5 - 9 years < 5 years
Education (Highest Degree) doctoral degree master's degree
bachelor's degree associate's degree
Credentials Held RD DTR
state license/certification specialty certification(s)
Employment Sector self-employed
for-profit non-profit (other than government)
government
Responsibilities director, manager or higher supervisor, coordinator, staff
supervise 1+ employees supervise none
have budget responsibility no budget responsibility
most patients/clients high risk most patients/clients < high risk
do not work with patients/clients
95 $15.38 $19.23 $22.60 100 $16.36 $19.23 $22.94
-6.0% 0.0% -1.5%
33 $17.97 $20.51 $24.10 30 $15.75 $19.41 $22.01 11 19 $12.31 $14.86 $16.03 2
21 $12.31 $14.86 $16.77
41 $18.13 $21.00 $24.10 18 $17.55 $19.71 $21.87 36 $13.87 $15.38 $18.20
5 25 $15.38 $20.00 $24.02 65 $15.38 $17.79 $20.84
2 92 $15.38 $19.23 $22.08 6
13
48 $15.50 $19.23 $23.08 35 $14.86 $19.23 $20.51 4
20 $19.89 $23.08 $28.85 73 $15.19 $17.79 $20.47
51 $16.41 $19.71 $23.44 43 $14.90 $17.50 $20.88
22 $18.99 $21.31 $24.52 71 $15.00 $17.98 $20.88
30 $15.72 $19.08 $23.59 62 $15.38 $19.23 $22.01 1
77 $32,000 $40,600 $49,200 72 $35,000 $40,800 $47,700
-8.6% -0.5% 3.1%
32 $36,600 $43,500 $55,300 25 $32,500 $41,000 $48,000 8
12
12
37 $37,500 $45,000 $51,900 16 $36,300 $41,000 $46,500 24 $27,500 $31,800 $40,700
5 18 $40,300 $46,000 $60,000 54 $31,600 $37,000 $45,300
2 75 $32,000 $40,000 $48,100
5 11
40 $32,300 $42,300 $49,400 27 $31,500 $40,000 $47,800 4
19 $43,700 $50,000 $65,000 56 $31,800 $37,500 $44,600
48 $33,900 $41,500 $52,600 28 $31,600 $37,500 $46,500
20 $41,300 $50,000 $55,900 55 $31,700 $38,000 $45,000
25 $32,500 $40,600 $52,900 49 $32,500 $41,000 $48,000 1
Note: Results not shown if fewer than 15 valid values.
Compensation & Benefits Survey of the Dietetics Profession 2013 102
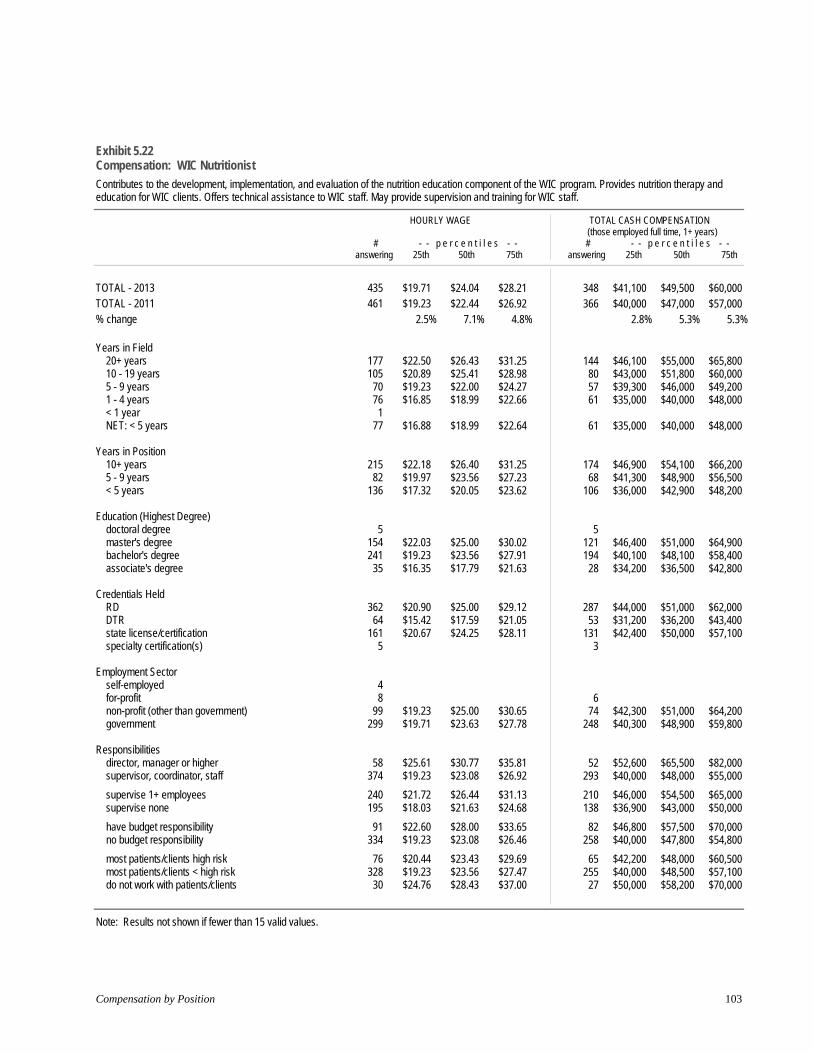
Exhibit 5.22 Compensation: WIC Nutritionist
Contributes to the development, implementation, and evaluation of the nutrition education component of the WIC program. Provides nutrition therapy and education for WIC clients. Offers technical assistance to WIC staff. May provide supervision and training for WIC staff.
HOURLY WAGE TOTAL CASH COMPENSATION
# answering
- - p e r c e n t i l e s25th 50th
- -75th
(those employed full time, 1+ years) # p e r c e n t i l e s - -
answering 25th 50th 75th
TOTAL - 2013 TOTAL - 2011 % change
Years in Field 20+ years 10 - 19 years 5 - 9 years 1 - 4 years < 1 year NET: < 5 years
Years in Position 10+ years 5 - 9 years < 5 years
Education (Highest Degree) doctoral degree
master's degree bachelor's degree associate's degree
Credentials Held RD DTR
state license/certification specialty certification(s)
Employment Sector self-employed for-profit
non-profit (other than government) government
Responsibilities director, manager or higher supervisor, coordinator, staff
supervise 1+ employees supervise none
have budget responsibility no budget responsibility
most patients/clients high risk most patients/clients < high risk
do not work with patients/clients
435 461
177 105
70 76 1
77
215 82
136
5 154 241
35
362 64
1615
4 8
99299
58374
240 195
91 334
76328
30
$19.71 $19.23
2.5%
$22.50 $20.89 $19.23 $16.85
$16.88
$22.18 $19.97 $17.32
$22.03 $19.23$16.35
$20.90 $15.42
$20.67
$19.23$19.71
$25.61 $19.23
$21.72$18.03
$22.60$19.23
$20.44 $19.23 $24.76
$24.04 $22.44
7.1%
$26.43 $25.41 $22.00 $18.99
$18.99
$26.40 $23.56 $20.05
$25.00 $23.56 $17.79
$25.00 $17.59
$24.25
$25.00$23.63
$30.77 $23.08
$26.44$21.63
$28.00 $23.08
$23.43 $23.56 $28.43
$28.21 $26.92
4.8%
$31.25 $28.98 $24.27 $22.66
$22.64
$31.25 $27.23 $23.62
$30.02 $27.91 $21.63
$29.12 $21.05
$28.11
$30.65 $27.78
$35.81 $26.92
$31.13 $24.68
$33.65 $26.46
$29.69 $27.47 $37.00
348366
144805761
61
17468
106
5 121194
28
287 53
1313
6 74
248
52 293
210 138
82 258
65255
27
$41,100 $49,500 $60,000 $40,000 $47,000 $57,000
2.8% 5.3% 5.3%
$46,100 $55,000 $65,800 $43,000 $51,800 $60,000 $39,300 $46,000 $49,200 $35,000 $40,000 $48,000
$35,000 $40,000 $48,000
$46,900 $54,100 $66,200 $41,300 $48,900 $56,500 $36,000 $42,900 $48,200
$46,400 $51,000 $64,900 $40,100 $48,100 $58,400 $34,200 $36,500 $42,800
$44,000 $51,000 $62,000 $31,200 $36,200 $43,400
$42,400 $50,000 $57,100
$42,300 $51,000 $64,200 $40,300 $48,900 $59,800
$52,600 $65,500 $82,000 $40,000 $48,000 $55,000
$46,000 $54,500 $65,000 $36,900 $43,000 $50,000
$46,800 $57,500 $70,000 $40,000 $47,800 $54,800
$42,200 $48,000 $60,500 $40,000 $48,500 $57,100 $50,000 $58,200 $70,000
Note: Results not shown if fewer than 15 valid values.
Compensation by Position 103
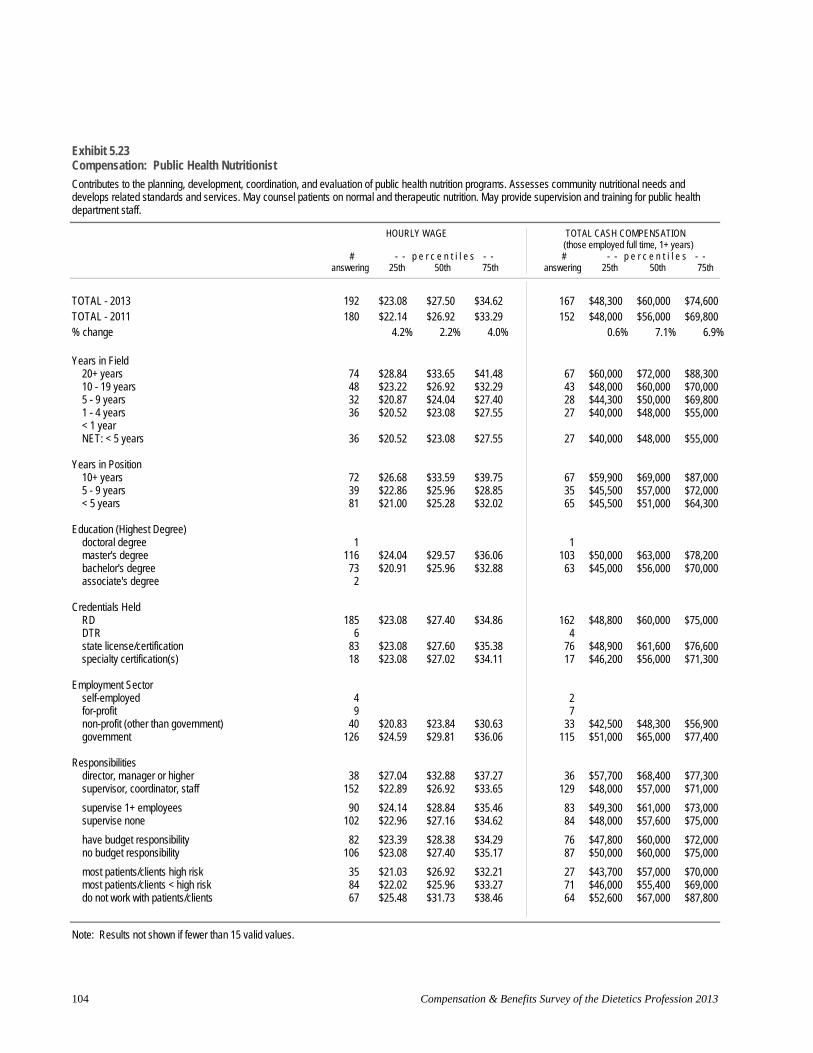
Exhibit 5.23 Compensation: Public Health Nutritionist
Contributes to the planning, development, coordination, and evaluation of public health nutrition programs. Assesses community nutritional needs and develops related standards and services. May counsel patients on normal and therapeutic nutrition. May provide supervision and training for public health department staff.
HOURLY WAGE TOTAL CASH COMPENSATION
# answering
- - p e r c e n t i l e s25th 50th
- -75th
(those employed full time, 1+ years) # p e r c e n t i l e s - -
answering 25th 50th 75th
TOTAL - 2013 TOTAL - 2011 % change
Years in Field 20+ years 10 - 19 years 5 - 9 years 1 - 4 years < 1 year NET: < 5 years
Years in Position 10+ years 5 - 9 years < 5 years
Education (Highest Degree) doctoral degree
master's degree bachelor's degree
associate's degree
Credentials Held RD DTR
state license/certification specialty certification(s)
Employment Sector self-employed for-profit
non-profit (other than government) government
Responsibilities director, manager or higher supervisor, coordinator, staff
supervise 1+ employees supervise none
have budget responsibility no budget responsibility
most patients/clients high risk most patients/clients < high risk
do not work with patients/clients
192180
74 48 32 36
36
72 39 81
1 116 73 2
185 6
8318
4 9
40126
38152
90 102
82 106
358467
$23.08 $22.14
4.2%
$28.84 $23.22 $20.87 $20.52
$20.52
$26.68 $22.86 $21.00
$24.04 $20.91
$23.08
$23.08$23.08
$20.83$24.59
$27.04 $22.89
$24.14$22.96
$23.39$23.08
$21.03 $22.02 $25.48
$27.50 $26.92
2.2%
$33.65 $26.92 $24.04 $23.08
$23.08
$33.59 $25.96 $25.28
$29.57 $25.96
$27.40
$27.60 $27.02
$23.84$29.81
$32.88 $26.92
$28.84$27.16
$28.38 $27.40
$26.92 $25.96 $31.73
$34.62 $33.29
4.0%
$41.48 $32.29 $27.40 $27.55
$27.55
$39.75 $28.85 $32.02
$36.06 $32.88
$34.86
$35.38 $34.11
$30.63 $36.06
$37.27 $33.65
$35.46 $34.62
$34.29 $35.17
$32.21 $33.27 $38.46
167152
67432827
27
673565
1 103
63
162 4
7617
2 7
33 115
36 129
83 84
76 87
277164
$48,300 $60,000 $74,600 $48,000 $56,000 $69,800
0.6% 7.1% 6.9%
$60,000 $72,000 $88,300 $48,000 $60,000 $70,000 $44,300 $50,000 $69,800 $40,000 $48,000 $55,000
$40,000 $48,000 $55,000
$59,900 $69,000 $87,000 $45,500 $57,000 $72,000 $45,500 $51,000 $64,300
$50,000 $63,000 $78,200 $45,000 $56,000 $70,000
$48,800 $60,000 $75,000
$48,900 $61,600 $76,600 $46,200 $56,000 $71,300
$42,500 $48,300 $56,900 $51,000 $65,000 $77,400
$57,700 $68,400 $77,300 $48,000 $57,000 $71,000
$49,300 $61,000 $73,000 $48,000 $57,600 $75,000
$47,800 $60,000 $72,000 $50,000 $60,000 $75,000
$43,700 $57,000 $70,000 $46,000 $55,400 $69,000 $52,600 $67,000 $87,800
Note: Results not shown if fewer than 15 valid values.
Compensation & Benefits Survey of the Dietetics Profession 2013 104

Exhibit 5.24 Compensation: Cooperative Extension Educator/Specialist
Develops, implements, and evaluates educational programs and materials addressing family and community needs. Conducts family and consumer educational programs. Responds to general, family, consumer, food safety, food, and nutrition questions. May involve a faculty appointment to an affiliated university.
HOURLY WAGE TOTAL CASH COMPENSATION
# answering
- - p e r c e n t i l e s25th 50th
- -75th
(those employed full time, 1+ years) # p e r c e n t i l e s - -
answering 25th 50th 75th
TOTAL - 2013 TOTAL - 2011 % change
Years in Field 20+ years 10 - 19 years 5 - 9 years 1 - 4 years < 1 year NET: < 5 years
Years in Position 10+ years 5 - 9 years < 5 years
Education (Highest Degree) doctoral degree
master's degree bachelor's degree associate's degree
Credentials Held RD DTR
state license/certification specialty certification(s)
Employment Sector self-employed for-profit
non-profit (other than government) government
Responsibilities director, manager or higher supervisor, coordinator, staff
supervise 1+ employees supervise none
have budget responsibility no budget responsibility
most patients/clients high risk most patients/clients < high risk
do not work with patients/clients
66 $20.09 $25.00 $31.45 51 $41,000 $54,500 $70,000 70 $19.23 $24.40 $28.85 58 $42,500 $50,000 $60,000
4.5% 2.5% 9.0% -3.5% 9.0% 16.7%
25 $22.96 $28.85 $36.89 21 $49,800 $60,000 $75,600 18 $19.59 $25.40 $29.29 1410 6 11 9
11 9
25 $21.15 $28.37 $34.56 22 $48,800 $62,500 $73,600 16 $20.07 $25.60 $27.62 16 $41,800 $53,300 $67,500 24 $18.87 $21.94 $27.32 13
6 5 40 $21.92 $26.44 $30.01 35 $44,900 $55,000 $65,000 13 8 7 3
56 $20.79 $26.44 $33.39 45 $42,500 $55,000 $70,700 8 4
20 $19.83 $24.52 $30.65 18 $40,800 $53,500 $66,300 4 2
2
24 $18.65 $25.00 $27.76 20 $39,800 $54,800 $63,300 31 $20.19 $24.04 $33.65 25 $41,500 $48,700 $70,500
9 6 57 $19.75 $24.36 $28.61 45 $40,000 $50,000 $62,500
38 $22.63 $27.64 $33.77 34 $46,800 $57,500 $73,400 28 $18.58 $20.81 $25.00 17 $37,900 $42,000 $53,500
37 $24.04 $27.88 $33.89 32 $50,500 $58,500 $74,600 29 $18.39 $20.67 $24.68 19 $37,800 $41,000 $47,500
5 4 33 $19.40 $24.04 $28.12 24 $39,100 $47,500 $59,800 26 $21.83 $26.59 $35.38 21 $43,000 $52,000 $74,400
Note: Results not shown if fewer than 15 valid values.
Compensation by Position 105
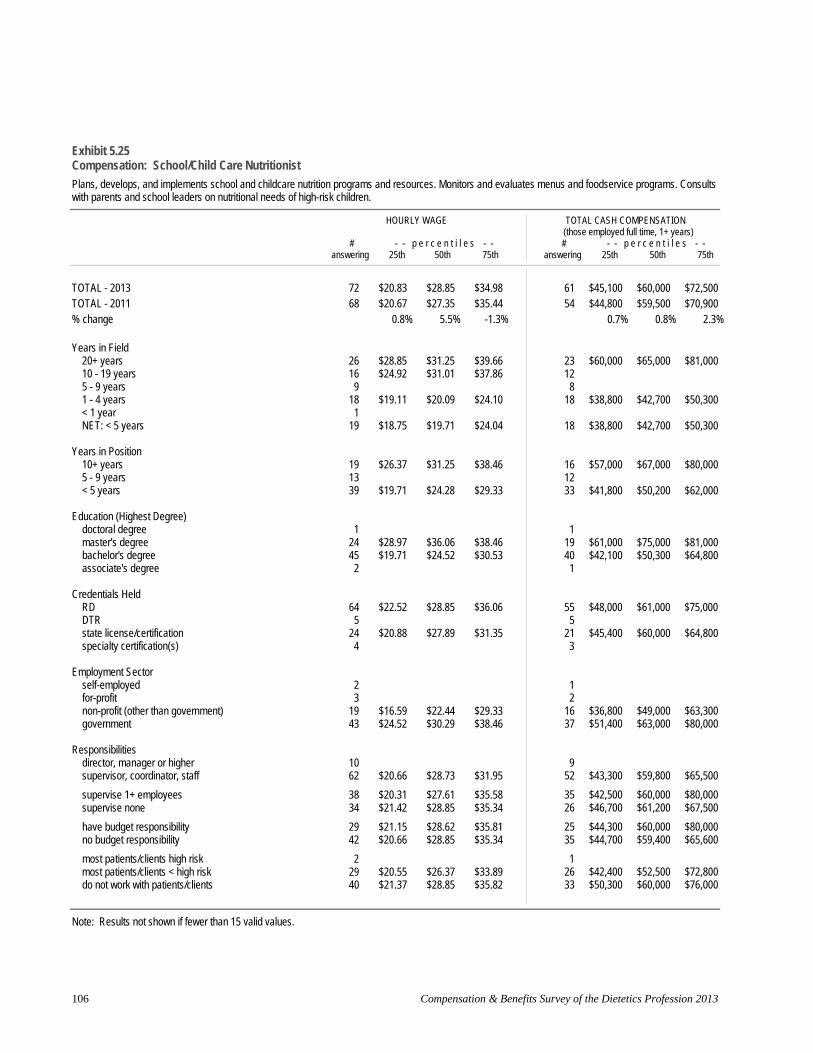
Exhibit 5.25 Compensation: School/Child Care Nutritionist
Plans, develops, and implements school and childcare nutrition programs and resources. Monitors and evaluates menus and foodservice programs. Consults with parents and school leaders on nutritional needs of high-risk children.
HOURLY WAGE TOTAL CASH COMPENSATION
# answering
- - p e r c e n t i l e s25th 50th
- -75th
(those employed full time, 1+ years) # p e r c e n t i l e s - -
answering 25th 50th 75th
TOTAL - 2013 TOTAL - 2011 % change
Years in Field 20+ years 10 - 19 years 5 - 9 years 1 - 4 years < 1 year NET: < 5 years
Years in Position 10+ years 5 - 9 years < 5 years
Education (Highest Degree) doctoral degree
master's degree bachelor's degree
associate's degree
Credentials Held RD DTR
state license/certification specialty certification(s)
Employment Sector self-employed for-profit
non-profit (other than government) government
Responsibilities director, manager or higher supervisor, coordinator, staff
supervise 1+ employees supervise none
have budget responsibility no budget responsibility
most patients/clients high risk most patients/clients < high risk
do not work with patients/clients
72 $20.83 $28.85 $34.98 68 $20.67 $27.35 $35.44
0.8% 5.5% -1.3%
26 $28.85 $31.25 $39.66 16 $24.92 $31.01 $37.86 9
18 $19.11 $20.09 $24.10 1
19 $18.75 $19.71 $24.04
19 $26.37 $31.25 $38.46 13 39 $19.71 $24.28 $29.33
1 24 $28.97 $36.06 $38.46 45 $19.71 $24.52 $30.53 2
64 $22.52 $28.85 $36.06 5
24 $20.88 $27.89 $31.35 4
2 3
19 $16.59 $22.44 $29.33 43 $24.52 $30.29 $38.46
10 62 $20.66 $28.73 $31.95
38 $20.31 $27.61 $35.58 34 $21.42 $28.85 $35.34
29 $21.15 $28.62 $35.81 42 $20.66 $28.85 $35.34
2 29 $20.55 $26.37 $33.89 40 $21.37 $28.85 $35.82
61 $45,100 $60,000 $72,500 54 $44,800 $59,500 $70,900
0.7% 0.8% 2.3%
23 $60,000 $65,000 $81,000 128
18 $38,800 $42,700 $50,300
18 $38,800 $42,700 $50,300
16 $57,000 $67,000 $80,000 1233 $41,800 $50,200 $62,000
1 19 $61,000 $75,000 $81,000 40 $42,100 $50,300 $64,800 1
55 $48,000 $61,000 $75,000 5
21 $45,400 $60,000 $64,800 3
1 2
16 $36,800 $49,000 $63,300 37 $51,400 $63,000 $80,000
9 52 $43,300 $59,800 $65,500
35 $42,500 $60,000 $80,000 26 $46,700 $61,200 $67,500
25 $44,300 $60,000 $80,000 35 $44,700 $59,400 $65,600
1 26 $42,400 $52,500 $72,800 33 $50,300 $60,000 $76,000
Note: Results not shown if fewer than 15 valid values.
Compensation & Benefits Survey of the Dietetics Profession 2013 106
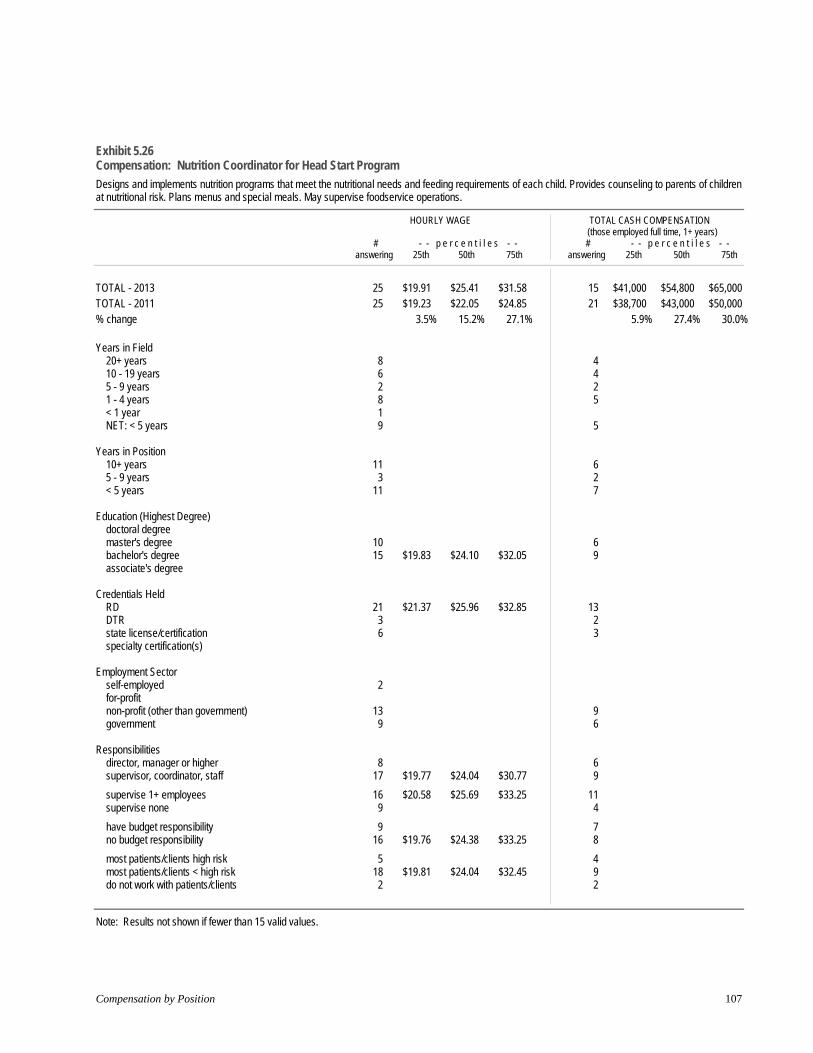
Exhibit 5.26 Compensation: Nutrition Coordinator for Head Start Program
Designs and implements nutrition programs that meet the nutritional needs and feeding requirements of each child. Provides counseling to parents of children at nutritional risk. Plans menus and special meals. May supervise foodservice operations.
HOURLY WAGE TOTAL CASH COMPENSATION
# answering
- - p e r c e n t i l e s25th 50th
- -75th
(those employed full time, 1+ years) # p e r c e n t i l e s - -
answering 25th 50th 75th
TOTAL - 2013 TOTAL - 2011 % change
Years in Field 20+ years 10 - 19 years 5 - 9 years 1 - 4 years < 1 year NET: < 5 years
Years in Position 10+ years 5 - 9 years < 5 years
Education (Highest Degree) doctoral degree master's degree
bachelor's degree associate's degree
Credentials Held RD DTR
state license/certification specialty certification(s)
Employment Sector self-employed for-profit
non-profit (other than government) government
Responsibilities director, manager or higher supervisor, coordinator, staff
supervise 1+ employeessupervise none
have budget responsibility no budget responsibility
most patients/clients high risk most patients/clients < high risk do not work with patients/clients
25 $19.91 $25.41 $31.58 25 $19.23 $22.05 $24.85
3.5% 15.2% 27.1%
8 6 2 8 1 9
11 3
11
10 15 $19.83 $24.10 $32.05
21 $21.37 $25.96 $32.85 3 6
2
13 9
8 17 $19.77 $24.04 $30.77
16 $20.58 $25.69 $33.25 9
9 16 $19.76 $24.38 $33.25
5 18 $19.81 $24.04 $32.45 2
15 $41,000 $54,800 $65,000 21 $38,700 $43,000 $50,000
5.9% 27.4% 30.0%
4 4 2 5
5
6 2 7
6 9
13 2 3
9 6
6 9
11 4
7 8
4 9 2
Note: Results not shown if fewer than 15 valid values.
Compensation by Position 107
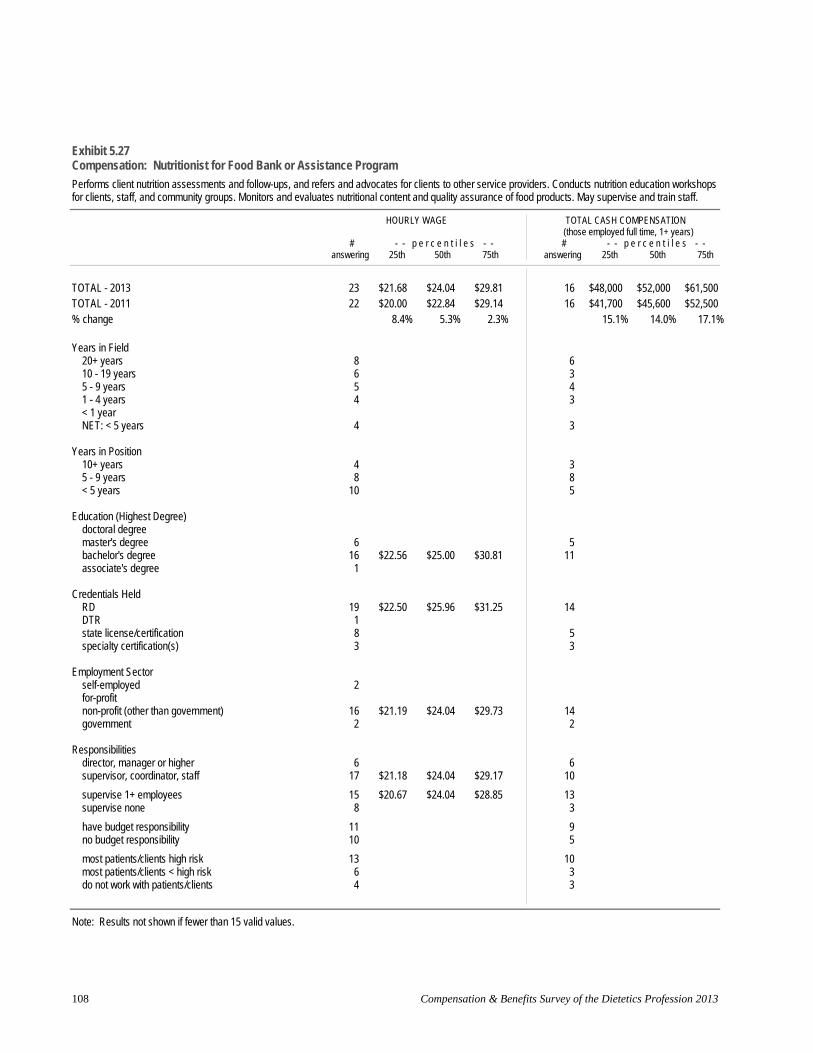
Exhibit 5.27 Compensation: Nutritionist for Food Bank or Assistance Program
Performs client nutrition assessments and follow-ups, and refers and advocates for clients to other service providers. Conducts nutrition education workshops for clients, staff, and community groups. Monitors and evaluates nutritional content and quality assurance of food products. May supervise and train staff.
HOURLY WAGE TOTAL CASH COMPENSATION (those employed full time, 1+ years)
# - - p e r c e n t i l e s - - # - - p e r c e n t i l e s - - answering 25th 50th 75th answering 25th 50th 75th
TOTAL - 2013 TOTAL - 2011 % change
Years in Field 20+ years 10 - 19 years 5 - 9 years 1 - 4 years < 1 year NET: < 5 years
Years in Position 10+ years 5 - 9 years < 5 years
Education (Highest Degree) doctoral degree master's degree
bachelor's degree associate's degree
Credentials Held RD DTR
state license/certification specialty certification(s)
Employment Sector self-employed for-profit
non-profit (other than government) government
Responsibilities director, manager or higher supervisor, coordinator, staff
supervise 1+ employeessupervise none
have budget responsibility no budget responsibility
most patients/clients high risk most patients/clients < high risk
do not work with patients/clients
23 $21.68 $24.04 $29.81 22 $20.00 $22.84 $29.14
8.4% 5.3% 2.3%
8 6 5 4
4
4 8
10
6 16 $22.56 $25.00 $30.81 1
19 $22.50 $25.96 $31.25 18 3
2
16 $21.19 $24.04 $29.73 2
6 17 $21.18 $24.04 $29.17
15 $20.67 $24.04 $28.85 8
11 10
13 6 4
16 $48,000 $52,000 $61,500 16 $41,700 $45,600 $52,500
15.1% 14.0% 17.1%
6 3 4 3
3
3 8 5
5 11
14
5 3
14 2
6 10
13 3
9 5
103 3
Note: Results not shown if fewer than 15 valid values.
Compensation & Benefits Survey of the Dietetics Profession 2013 108

Exhibit 5.28 Compensation: Executive-level Professional
Plans, controls, and directs services/operations for multiple departments, product lines, or facilities. Accountable for quality of services, financial results, and achievement of organizational objectives.
HOURLY WAGE TOTAL CASH COMPENSATION
# answering
- - p e r c e n t i l e s25th 50th
- -75th
(those employed full time, 1+ years) # p e r c e n t i l e s - -
answering 25th 50th 75th
TOTAL - 2013 TOTAL - 2011 % change
Years in Field 20+ years 10 - 19 years 5 - 9 years 1 - 4 years < 1 year NET: < 5 years
Years in Position 10+ years 5 - 9 years < 5 years
Education (Highest Degree) doctoral degree
master's degree bachelor's degree
associate's degree
Credentials Held RD DTR
state license/certification specialty certification(s)
Employment Sector self-employed
for-profit non-profit (other than government) government
Responsibilities director, manager or higher supervisor, coordinator, staff
supervise 1+ employeessupervise none
have budget responsibility no budget responsibility
most patients/clients high risk most patients/clients < high risk
do not work with patients/clients
70 106
52 14 1 2
2
43 13 14
4 40 25 1
66 2
266
31 17 18
63 7
65 5
60 10
6 13 50
$37.50 $44.23 $55.56 66 $78,000 $97,500 $125,500 $33.65 $41.95 $52.16 103 $73,000 $100,000 $119,000
11.4% 5.4% 6.5% 6.8% -2.5% 5.5%
$38.46 $47.84 $57.69 48 $80,100 $102,000 $133,000 141 2
2
$35.10 $41.67 $55.54 41 $75,300 $90,000 $124,400 1312
4 $38.10 $47.11 $57.69 38 $80,000 $100,000 $131,000 $37.98 $44.23 $52.77 23 $78,000 $97,000 $125,000
1
$38.34 $44.47 $56.15 63 $80,000 $98,000 $127,000 2
$36.31 $40.38 $51.08 24 $75,600 $87,500 $118,300 5
$38.46 $49.52 $57.69 30 $83,000 $110,500 $141,400 $39.70 $44.71 $58.89 15 $84,000 $100,000 $150,000 $30.37 $37.98 $47.11 17 $62,900 $78,000 $99,500
$38.46 $44.71 $57.69 61 $80,000 $99,000 $128,500 5
$37.74 $44.23 $55.41 62 $79,500 $97,500 $125,500 4
$38.46 $45.43 $57.69 58 $80,000 $99,500 $127,800 8
5 13
$40.19 $49.04 $59.68 47 $80,400 $100,000 $145,500
Note: Results not shown if fewer than 15 valid values.
Compensation by Position 109
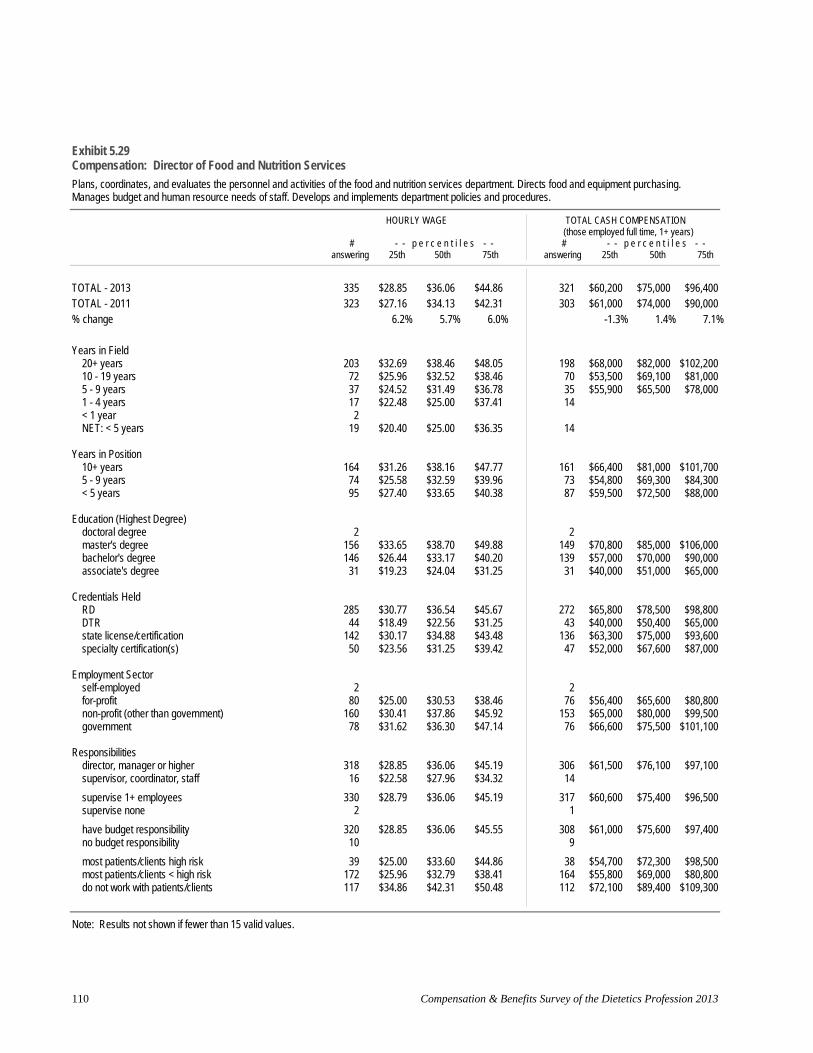
Exhibit 5.29 Compensation: Director of Food and Nutrition Services
Plans, coordinates, and evaluates the personnel and activities of the food and nutrition services department. Directs food and equipment purchasing. Manages budget and human resource needs of staff. Develops and implements department policies and procedures.
HOURLY WAGE TOTAL CASH COMPENSATION
# answering
- - p e r c e n t i l e s25th 50th
- -75th
(those employed full time, 1+ years) # p e r c e n t i l e s - -
answering 25th 50th 75th
TOTAL - 2013 TOTAL - 2011 % change
Years in Field 20+ years 10 - 19 years 5 - 9 years 1 - 4 years < 1 year NET: < 5 years
Years in Position 10+ years 5 - 9 years < 5 years
Education (Highest Degree) doctoral degree
master's degree bachelor's degree associate's degree
Credentials Held RD DTR
state license/certification specialty certification(s)
Employment Sector self-employed for-profit
non-profit (other than government) government
Responsibilities director, manager or higher supervisor, coordinator, staff
supervise 1+ employeessupervise none
have budget responsibility no budget responsibility
most patients/clients high risk most patients/clients < high risk
do not work with patients/clients
335 $28.85 $36.06 $44.86 321 $60,200 $75,000 $96,400 323 $27.16 $34.13 $42.31 303 $61,000 $74,000 $90,000
6.2% 5.7% 6.0% -1.3% 1.4% 7.1%
203 $32.69 $38.46 $48.05 198 $68,000 $82,000 $102,200 72 $25.96 $32.52 $38.46 70 $53,500 $69,100 $81,000 37 $24.52 $31.49 $36.78 35 $55,900 $65,500 $78,000 17 $22.48 $25.00 $37.41 142
19 $20.40 $25.00 $36.35 14
164 $31.26 $38.16 $47.77 161 $66,400 $81,000 $101,700 74 $25.58 $32.59 $39.96 73 $54,800 $69,300 $84,300 95 $27.40 $33.65 $40.38 87 $59,500 $72,500 $88,000
2 2 156 $33.65 $38.70 $49.88 149 $70,800 $85,000 $106,000 146 $26.44 $33.17 $40.20 139 $57,000 $70,000 $90,000
31 $19.23 $24.04 $31.25 31 $40,000 $51,000 $65,000
285 $30.77 $36.54 $45.67 272 $65,800 $78,500 $98,800 44 $18.49 $22.56 $31.25 43 $40,000 $50,400 $65,000
142 $30.17 $34.88 $43.48 136 $63,300 $75,000 $93,600 50 $23.56 $31.25 $39.42 47 $52,000 $67,600 $87,000
2 2 80 $25.00 $30.53 $38.46 76 $56,400 $65,600 $80,800
160 $30.41 $37.86 $45.92 153 $65,000 $80,000 $99,500 78 $31.62 $36.30 $47.14 76 $66,600 $75,500 $101,100
318 $28.85 $36.06 $45.19 306 $61,500 $76,100 $97,100 16 $22.58 $27.96 $34.32 14
330 $28.79 $36.06 $45.19 317 $60,600 $75,400 $96,500 2 1
320 $28.85 $36.06 $45.55 308 $61,000 $75,600 $97,400 10 9
39 $25.00 $33.60 $44.86 38 $54,700 $72,300 $98,500 172 $25.96 $32.79 $38.41 164 $55,800 $69,000 $80,800 117 $34.86 $42.31 $50.48 112 $72,100 $89,400 $109,300
Note: Results not shown if fewer than 15 valid values.
Compensation & Benefits Survey of the Dietetics Profession 2013 110

Exhibit 5.30 Compensation: Director of Clinical Nutrition Directs administrative and clinical operations of the clinical nutrition services department, providing leadership and oversight to ensure quality and effective clinical nutrition services. Directs the activities of all departmental personnel and programs. Determines resource needs and oversees departmental operational and capital budgets. Oversees department's performance improvement activities in accordance with organizational and regulatory agency requirements.
HOURLY WAGE TOTAL CASH COMPENSATION
# answering
- - p e r c e n t i l e s25th 50th
- -75th
(those employed full time, 1+ years) # p e r c e n t i l e s - -
answering 25th 50th 75th
TOTAL - 2013 TOTAL - 2011 % change
Years in Field 20+ years 10 - 19 years 5 - 9 years 1 - 4 years < 1 year NET: < 5 years
Years in Position 10+ years 5 - 9 years < 5 years
Education (Highest Degree) doctoral degree
master's degree bachelor's degree
associate's degree
Credentials Held RD DTR
state license/certification specialty certification(s)
Employment Sector self-employed for-profit
non-profit (other than government) government
Responsibilities director, manager or higher supervisor, coordinator, staff
supervise 1+ employeessupervise none
have budget responsibility no budget responsibility
most patients/clients high risk most patients/clients < high risk
do not work with patients/clients
46 $28.85 $36.06 $45.25 74 $31.13 $34.25 $43.27
-7.3% 5.3% 4.6%
29 $33.27 $40.87 $46.98 9 7 1
1
24 $30.95 $39.71 $45.29 13 9
1 27 $34.62 $40.00 $45.19 16 $27.04 $30.53 $43.93 2
44 $30.29 $36.54 $45.37 2
25 $29.58 $36.06 $43.80 14
13 23 $34.62 $40.87 $45.91 8
40 $30.42 $38.22 $45.79 6
43 $28.85 $36.06 $45.19 2
30 $28.85 $39.95 $46.09 13
15 $30.29 $34.62 $45.43 15 $24.04 $28.85 $37.02 16 $36.90 $42.00 $46.27
42 $61,500 $75,000 $95,900 71 $66,000 $73,000 $93,000
-6.8% 2.7% 3.1%
27 $72,000 $87,700 $100,500 8 6 1
1
22 $67,700 $83,600 $97,400 137
1 24 $72,000 $81,400 $95,500 15 $56,000 $63,000 $97,000 2
40 $63,300 $75,000 $96,600 2
24 $60,500 $74,500 $100,300 14
1220 $74,300 $86,500 $101,300 8
37 $63,500 $75,000 $97,700 5
40 $62,300 $75,000 $96,600 1
28 $64,400 $85,200 $99,900 11
1315 $55,000 $60,000 $77,600 14
Note: Results not shown if fewer than 15 valid values.
Compensation by Position 111

Exhibit 5.31 Compensation: Clinical Nutrition Manager
Plans, organizes, and manages clinical nutrition services. Recruits, trains, supervises, and evaluates clinical nutrition staff. Develops and implements policies and procedures. Manages human resources and budget. May also perform duties of a patient services manager.
HOURLY WAGE TOTAL CASH COMPENSATION
# answering
- - p e r c e n t i l e s25th 50th
- -75th
(those employed full time, 1+ years) # p e r c e n t i l e s - -
answering 25th 50th 75th
TOTAL - 2013 TOTAL - 2011 % change
Years in Field 20+ years 10 - 19 years 5 - 9 years 1 - 4 years < 1 year NET: < 5 years
Years in Position 10+ years 5 - 9 years < 5 years
Education (Highest Degree) doctoral degree
master's degree bachelor's degree
associate's degree
Credentials Held RD DTR
state license/certification specialty certification(s)
Employment Sector self-employed for-profit
non-profit (other than government) government
Responsibilities director, manager or higher supervisor, coordinator, staff
supervise 1+ employeessupervise none
have budget responsibility no budget responsibility
most patients/clients high risk most patients/clients < high risk
do not work with patients/clients
202220
85 66 34 14
14
89 52 61
1 127 74
200
9433
1 60
11622
16238
198 3
95 104
52103
45
$28.85 $33.65 $38.46 188 $60,000 $72,000 $80,500 $28.85 $32.75 $36.54 201 $60,000 $70,000 $79,300
0.0% 2.7% 5.3% 0.0% 2.9% 1.5%
$32.81 $36.15 $41.16 78 $69,600 $76,800 $85,300 $28.73 $34.13 $37.98 64 $59,400 $73,100 $80,000 $26.44 $28.68 $32.69 32 $53,500 $60,800 $69,500
11
11
$32.41 $36.80 $40.87 84 $70,000 $77,300 $85,000 $28.24 $33.29 $36.59 49 $59,600 $70,000 $78,800 $25.54 $29.33 $34.38 55 $53,000 $62,000 $72,500
1 $29.25 $34.62 $38.94 119 $62,000 $74,000 $83,000 $26.80 $32.21 $36.49 68 $56,300 $69,000 $78,400
$28.85 $33.65 $38.02 187 $60,000 $72,000 $80,300
$28.37 $33.33 $37.56 87 $59,200 $72,000 $80,000 $32.05 $35.73 $38.70 32 $67,700 $74,700 $81,500
$25.90 $30.09 $34.98 55 $56,000 $65,000 $76,000 $28.95 $34.62 $38.46 108 $60,400 $73,000 $81,000
$34.38 $37.98 $42.79 22 $72,900 $79,800 $91,100
$28.85 $34.06 $38.46 152 $61,200 $72,500 $81,900 $25.10 $30.29 $36.06 34 $51,800 $65,500 $75,000
$28.85 $33.65 $38.46 186 $60,000 $72,000 $80,400 1
$31.25 $35.73 $38.94 90 $65,000 $75,000 $83,300 $26.93 $31.73 $37.22 95 $58,000 $68,000 $79,900
$29.39 $33.98 $37.98 50 $64,800 $73,300 $79,900 $26.44 $31.73 $36.15 93 $56,000 $68,000 $76,300 $32.68 $36.97 $43.17 44 $70,100 $79,300 $91,000
Note: Results not shown if fewer than 15 valid values.
Compensation & Benefits Survey of the Dietetics Profession 2013 112

Exhibit 5.32 Compensation: Assistant Foodservice Director
Manages daily operations of foodservice department. Directs and supervises the preparation and service of food. Recruits, trains, supervises, and evaluates foodservice staff. Assists in managing budget.
HOURLY WAGE TOTAL CASH COMPENSATION
# answering
- - p e r c e n t i l e s25th 50th
- -75th
(those employed full time, 1+ years) # p e r c e n t i l e s - -
answering 25th 50th 75th
TOTAL - 2013 TOTAL - 2011 % change
Years in Field 20+ years 10 - 19 years 5 - 9 years 1 - 4 years < 1 year NET: < 5 years
Years in Position 10+ years 5 - 9 years < 5 years
Education (Highest Degree) doctoral degree
master's degree bachelor's degree
associate's degree
Credentials Held RD DTR
state license/certification specialty certification(s)
Employment Sector self-employed
for-profit non-profit (other than government) government
Responsibilities director, manager or higher supervisor, coordinator, staff
supervise 1+ employeessupervise none
have budget responsibility no budget responsibility
most patients/clients high risk most patients/clients < high risk
do not work with patients/clients
112 87
47 23 17 23
23
45 24 42
43 64 5
94 16 3713
23 5331
7437
107 5
68 40
12 3758
$23.08 $24.04
-4.0%
$30.29 $25.00 $22.66 $19.23
$19.23
$28.85 $24.61 $20.13
$28.85 $21.63
$24.79 $18.53
$24.04
$20.19 $23.08
$27.32
$24.52 $20.07
$23.08
$27.67$20.01
$22.42 $22.60
$30.29 $29.81
1.6%
$36.06 $30.29 $26.44 $20.67
$20.67
$34.38 $30.29 $23.13
$35.10 $28.16
$32.35 $21.15
$29.81
$24.52 $30.29
$33.65
$31.97 $27.47
$30.29
$32.55 $23.32
$28.26 $32.28
$36.90 $36.06
2.3%
$40.87 $36.54 $34.04 $25.79
$25.79
$40.38 $35.82 $31.31
$40.87 $33.65
$38.46 $27.77
$35.22
$31.73 $37.26
$38.46
$37.74 $34.74
$36.54
$39.18 $32.97
$35.82 $37.50
10881
45221722
22
442341
4261 5
91 15 3613
2251 30
72 35
104 4
66 38
123556
$47,400 $66,000 $78,000 $51,700 $63,500 $75,600
-8.3% 3.9% 3.2%
$65,000 $75,000 $90,000 $51,800 $65,800 $76,300 $47,100 $60,800 $73,000 $40,000 $43,500 $50,700
$40,000 $43,500 $50,700
$59,300 $72,800 $82,000 $52,000 $69,100 $78,000 $42,000 $48,200 $66,500
$59,700 $75,000 $86,700 $44,800 $59,000 $73,500
$51,000 $69,100 $80,500 $40,000 $45,000 $59,000
$49,300 $63,300 $77,800
$43,500 $54,400 $66,600 $47,000 $67,000 $79,000
$50,200 $70,000 $81,300
$51,300 $68,700 $80,700 $42,000 $51,700 $71,500
$48,000 $66,000 $78,000
$56,500 $69,600 $82,000 $42,000 $48,500 $70,000
$47,300 $58,800 $78,000 $47,000 $67,600 $77,800
Note: Results not shown if fewer than 15 valid values.
Compensation by Position 113

Exhibit 5.33 Compensation: School Foodservice Director
Develops, implements, and maintains the foodservice program in a school setting. Directs and monitors food procurement and storage, and food production, assembly, and service to students. Plans menus to meet required nutritional standards and student acceptance.
HOURLY WAGE TOTAL CASH COMPENSATION
# answering
- - p e r c e n t i l e s25th 50th
- -75th
(those employed full time, 1+ years) # p e r c e n t i l e s - -
answering 25th 50th 75th
TOTAL - 2013 TOTAL - 2011 % change
Years in Field 20+ years 10 - 19 years 5 - 9 years 1 - 4 years < 1 year NET: < 5 years
Years in Position 10+ years 5 - 9 years < 5 years
Education (Highest Degree) doctoral degree
master's degree bachelor's degree
associate's degree
Credentials Held RD DTR
state license/certification specialty certification(s)
Employment Sector self-employed for-profit
non-profit (other than government) government
Responsibilities director, manager or higher supervisor, coordinator, staff
supervise 1+ employeessupervise none
have budget responsibility no budget responsibility
most patients/clients high risk most patients/clients < high risk
do not work with patients/clients
56 $24.22 $31.87 $40.96 67 $24.52 $28.85 $35.10
-1.2% 10.5% 16.7%
32 $31.25 $36.64 $45.09 15 $21.15 $28.85 $32.69 6 3
3
31 $31.25 $36.25 $44.23 16 $22.23 $29.57 $32.48 9
1 23 $31.25 $33.65 $47.12 26 $23.08 $29.09 $39.90 6
48 $26.80 $32.28 $42.26 7
23 $28.85 $33.65 $42.56 1
2
23 $21.63 $31.25 $41.15 25 $26.57 $31.87 $40.06
42 $24.46 $33.17 $41.20 14
54 $24.46 $31.87 $40.57 2
50 $23.92 $32.28 $41.20 6
17 $24.52 $33.65 $39.33 34 $21.63 $31.25 $39.90
52 $54,300 $69,000 $85,500 63 $52,000 $62,000 $77,000
4.4% 11.3% 11.0%
31 $66,300 $77,500 $94,400 145 2
2
30 $65,900 $77,800 $94,500 16 $50,500 $58,500 $73,300 6
1 21 $62,500 $70,000 $95,000 24 $52,500 $63,800 $83,400 6
44 $58,300 $70,000 $88,200 7
21 $58,500 $70,000 $87,200 1
1
20 $52,500 $70,000 $85,900 25 $54,800 $63,000 $81,400
40 $54,300 $71,500 $85,900 12
51 $55,000 $70,000 $85,600 1
48 $55,000 $70,000 $85,900 4
17 $51,000 $70,000 $82,800 30 $53,400 $65,600 $79,800
Note: Results not shown if fewer than 15 valid values.
Compensation & Benefits Survey of the Dietetics Profession 2013 114
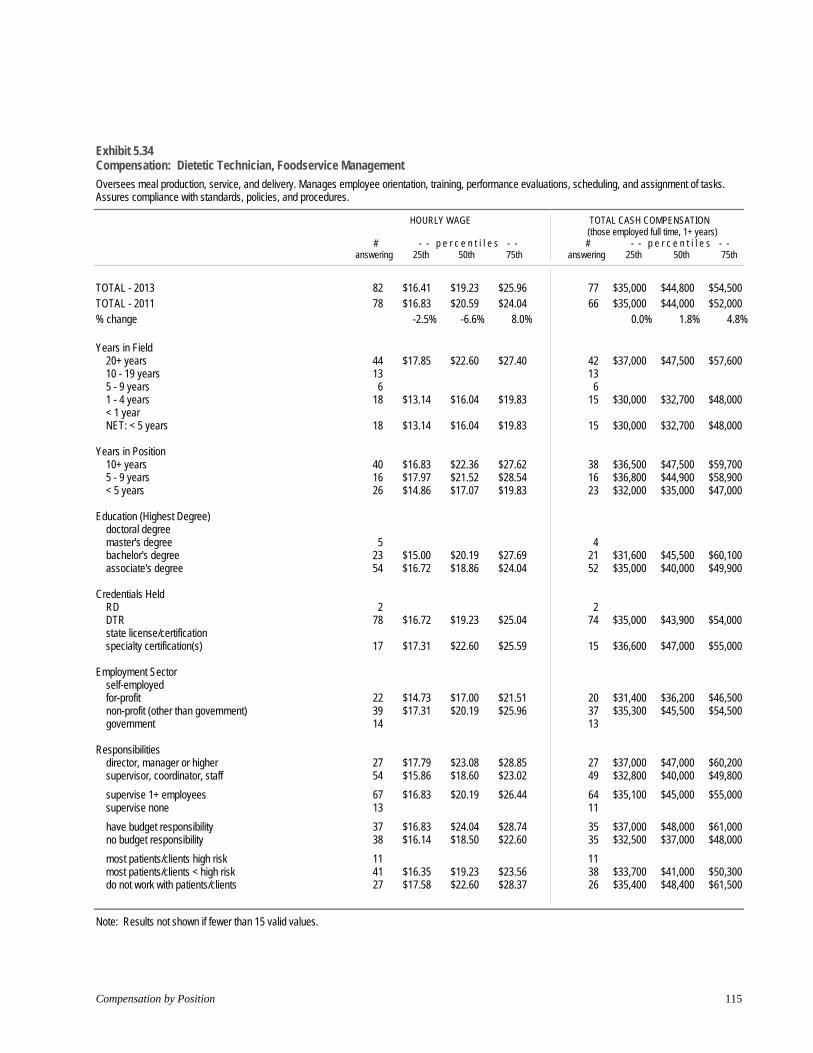
Exhibit 5.34 Compensation: Dietetic Technician, Foodservice Management
Oversees meal production, service, and delivery. Manages employee orientation, training, performance evaluations, scheduling, and assignment of tasks. Assures compliance with standards, policies, and procedures.
HOURLY WAGE TOTAL CASH COMPENSATION
# answering
- - p e r c e n t i l e s25th 50th
- -75th
(those employed full time, 1+ years) # p e r c e n t i l e s - -
answering 25th 50th 75th
TOTAL - 2013 TOTAL - 2011 % change
Years in Field 20+ years 10 - 19 years 5 - 9 years 1 - 4 years < 1 year NET: < 5 years
Years in Position 10+ years 5 - 9 years < 5 years
Education (Highest Degree) doctoral degree master's degree
bachelor's degree associate's degree
Credentials Held RD DTR state license/certification
specialty certification(s)
Employment Sector self-employed
for-profit non-profit (other than government)
government
Responsibilities director, manager or higher supervisor, coordinator, staff
supervise 1+ employeessupervise none
have budget responsibility no budget responsibility
most patients/clients high risk most patients/clients < high risk
do not work with patients/clients
82 $16.41 $19.23 $25.96 77 $35,000 $44,800 $54,500 78 $16.83 $20.59 $24.04 66 $35,000 $44,000 $52,000
-2.5% -6.6% 8.0% 0.0% 1.8% 4.8%
44 $17.85 $22.60 $27.40 42 $37,000 $47,500 $57,600 13 136 6
18 $13.14 $16.04 $19.83 15 $30,000 $32,700 $48,000
18 $13.14 $16.04 $19.83 15 $30,000 $32,700 $48,000
40 $16.83 $22.36 $27.62 38 $36,500 $47,500 $59,700 16 $17.97 $21.52 $28.54 16 $36,800 $44,900 $58,900 26 $14.86 $17.07 $19.83 23 $32,000 $35,000 $47,000
5 4 23 $15.00 $20.19 $27.69 21 $31,600 $45,500 $60,100 54 $16.72 $18.86 $24.04 52 $35,000 $40,000 $49,900
2 2 78 $16.72 $19.23 $25.04 74 $35,000 $43,900 $54,000
17 $17.31 $22.60 $25.59 15 $36,600 $47,000 $55,000
22 $14.73 $17.00 $21.51 20 $31,400 $36,200 $46,500 39 $17.31 $20.19 $25.96 37 $35,300 $45,500 $54,500 14 13
27 $17.79 $23.08 $28.85 27 $37,000 $47,000 $60,200 54 $15.86 $18.60 $23.02 49 $32,800 $40,000 $49,800
67 $16.83 $20.19 $26.44 64 $35,100 $45,000 $55,000 13 11
37 $16.83 $24.04 $28.74 35 $37,000 $48,000 $61,000 38 $16.14 $18.50 $22.60 35 $32,500 $37,000 $48,000
11 1141 $16.35 $19.23 $23.56 38 $33,700 $41,000 $50,300 27 $17.58 $22.60 $28.37 26 $35,400 $48,400 $61,500
Note: Results not shown if fewer than 15 valid values.
Compensation by Position 115
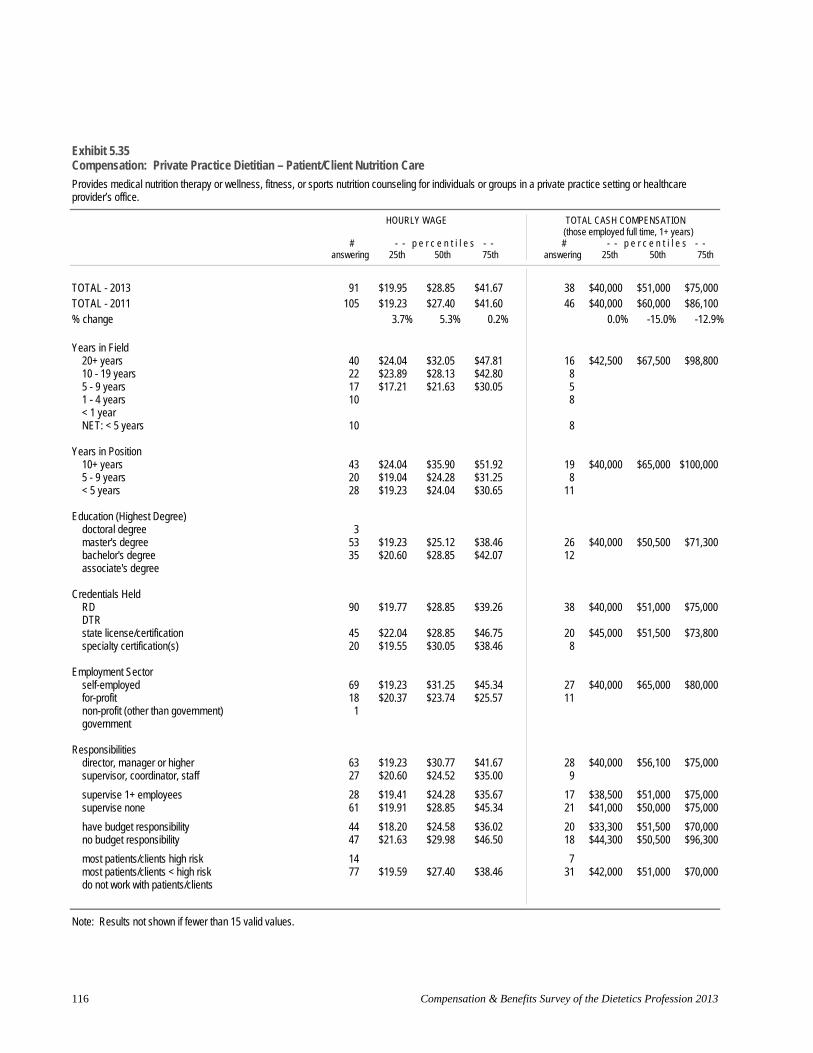
Exhibit 5.35 Compensation: Private Practice Dietitian – Patient/Client Nutrition Care
Provides medical nutrition therapy or wellness, fitness, or sports nutrition counseling for individuals or groups in a private practice setting or healthcare provider’s office.
HOURLY WAGE TOTAL CASH COMPENSATION
# answering
- - p e r c e n t i l e s25th 50th
- -75th
(those employed full time, 1+ years) # p e r c e n t i l e s - -
answering 25th 50th 75th
TOTAL - 2013 TOTAL - 2011 % change
Years in Field 20+ years 10 - 19 years 5 - 9 years 1 - 4 years < 1 year NET: < 5 years
Years in Position 10+ years 5 - 9 years < 5 years
Education (Highest Degree) doctoral degree
master's degree bachelor's degree
associate's degree
Credentials Held RD DTR
state license/certification specialty certification(s)
Employment Sector self-employed
for-profit non-profit (other than government)
government
Responsibilities director, manager or higher supervisor, coordinator, staff
supervise 1+ employees supervise none
have budget responsibility no budget responsibility
most patients/clients high risk most patients/clients < high risk
do not work with patients/clients
91 $19.95 $28.85 $41.67 38 $40,000 $51,000 $75,000 105 $19.23 $27.40 $41.60 46 $40,000 $60,000 $86,100
3.7% 5.3% 0.2% 0.0% -15.0% -12.9%
40 $24.04 $32.05 $47.81 16 $42,500 $67,500 $98,800 22 $23.89 $28.13 $42.80 8 17 $17.21 $21.63 $30.05 5 10 8
10 8
43 $24.04 $35.90 $51.92 19 $40,000 $65,000 $100,000 20 $19.04 $24.28 $31.25 8 28 $19.23 $24.04 $30.65 11
3 53 $19.23 $25.12 $38.46 26 $40,000 $50,500 $71,300 35 $20.60 $28.85 $42.07 12
90 $19.77 $28.85 $39.26 38 $40,000 $51,000 $75,000
45 $22.04 $28.85 $46.75 20 $45,000 $51,500 $73,800 20 $19.55 $30.05 $38.46 8
69 $19.23 $31.25 $45.34 27 $40,000 $65,000 $80,000 18 $20.37 $23.74 $25.57 111
63 $19.23 $30.77 $41.67 28 $40,000 $56,100 $75,000 27 $20.60 $24.52 $35.00 9
28 $19.41 $24.28 $35.67 17 $38,500 $51,000 $75,000 61 $19.91 $28.85 $45.34 21 $41,000 $50,000 $75,000
44 $18.20 $24.58 $36.02 20 $33,300 $51,500 $70,000 47 $21.63 $29.98 $46.50 18 $44,300 $50,500 $96,300
14 7 77 $19.59 $27.40 $38.46 31 $42,000 $51,000 $70,000
Note: Results not shown if fewer than 15 valid values.
Compensation & Benefits Survey of the Dietetics Profession 2013 116

Exhibit 5.36 Compensation: Consultant – Community and/or Corporate Programs
Provides food and nutrition consultation services for community-based programs, such as meal programs, day care centers, or group homes. Develops and implements wellness events and programs for communities and/or corporations.
HOURLY WAGE TOTAL CASH COMPENSATION
# answering
- - p e r c e n t i l e s25th 50th
- -75th
(those employed full time, 1+ years) # p e r c e n t i l e s - -
answering 25th 50th 75th
TOTAL - 2013 TOTAL - 2011 % change
Years in Field 20+ years 10 - 19 years 5 - 9 years 1 - 4 years < 1 year NET: < 5 years
Years in Position 10+ years 5 - 9 years < 5 years
Education (Highest Degree) doctoral degree
master's degree bachelor's degree
associate's degree
Credentials Held RD DTR
state license/certification specialty certification(s)
Employment Sector self-employed
for-profit non-profit (other than government)
government
Responsibilities director, manager or higher supervisor, coordinator, staff
supervise 1+ employees supervise none
have budget responsibility no budget responsibility
most patients/clients high risk most patients/clients < high risk
do not work with patients/clients
104 71
40 24 15 23
23
27 25 52
1 46 57
98 4
4914
43 27 188
4063
32 70
34 70
156324
$24.04 $29.21 $38.46 57 $50,500 $62,000 $84,000 $23.08 $25.64 $32.05 22 $43,800 $52,000 $62,600
4.2% 13.9% 20.0% 15.3% 19.2% 34.2%
$24.96 $33.13 $41.25 15 $55,000 $70,000 $90,000 $29.63 $32.85 $40.99 17 $63,500 $70,000 $92,500 $24.04 $28.85 $38.46 9 $20.00 $25.00 $28.85 14
$20.00 $25.00 $28.85 14
$25.64 $33.08 $43.27 13$25.56 $31.25 $40.44 16 $59,300 $63,500 $85,500 $22.72 $28.70 $35.20 28 $41,800 $57,500 $65,700
1 $25.48 $31.65 $37.74 23 $57,000 $65,000 $81,000 $22.43 $28.21 $40.38 33 $44,500 $60,000 $85,000
$24.04 $29.91 $39.78 52 $55,000 $64,800 $87,300 3
$23.26 $28.55 $34.09 28 $46,600 $60,100 $68,000 10
$24.73 $32.05 $50.00 16 $47,500 $71,000 $100,000 $24.04 $28.37 $30.29 21 $47,000 $59,000 $63,800
$23.68 $28.53 $36.30 9 5
$27.54 $33.13 $46.88 26 $58,800 $69,500 $97,000 $23.08 $28.55 $35.90 31 $42,500 $59,000 $65,700
$25.52 $33.13 $39.42 23 $57,000 $69,000 $90,000 $23.08 $28.85 $38.82 33 $43,300 $60,100 $76,000
$25.24 $32.56 $43.27 25 $54,100 $68,000 $98,000 $22.76 $28.85 $35.90 32 $42,900 $60,000 $70,000
$20.51 $25.85 $35.90 8 $25.00 $29.81 $37.50 33 $53,000 $62,000 $76,000 $23.59 $29.93 $46.88 15 $47,000 $64,500 $100,000
Note: Results not shown if fewer than 15 valid values.
Compensation by Position 117

Exhibit 5.37 Compensation: Consultant – Communications
Develops food and nutrition-related communications for consumer and/or professional audiences. May include writing speeches and presentations, developing nutrition education materials, programs, and nutrition content for Web sites, recipe development; and public speaking to consumer and health professional audiences.
HOURLY WAGE TOTAL CASH COMPENSATION (those employed full time, 1+ years)
# - - p e r c e n t i l e s - - # - - p e r c e n t i l e s - - answering 25th 50th 75th answering 25th 50th 75th
TOTAL - 2013 18 $24.36 $33.30 $46.63 TOTAL - 2011 45 $21.76 $31.28 $44.90 % change 11.9% 6.5% 3.9%
Years in Field 20+ years 7 10 - 19 years 7 5 - 9 years 2 1 - 4 years 2 < 1 year NET: < 5 years 2
Years in Position 10+ years 7 5 - 9 years 5 < 5 years 6
Education (Highest Degree) doctoral degree master's degree 14 bachelor's degree 4 associate's degree
Credentials Held RD 17 $26.93 $35.34 $47.11 DTR 1
state license/certification 4 specialty certification(s) 5
Employment Sector self-employed 14 for-profit 2
non-profit (other than government) 1 government
Responsibilities director, manager or higher 14 supervisor, coordinator, staff 4
supervise 1+ employees 3 supervise none 14
have budget responsibility 5 no budget responsibility 13
most patients/clients high risk most patients/clients < high risk 7
do not work with patients/clients 11
7 24 $56,500 $68,500 $96,800
2 4
1
1
3 3 1
4 3
7
1 2
5
1
6 1
3 3
1 6
3 4
Note: Results not shown if fewer than 15 valid values.
Compensation & Benefits Survey of the Dietetics Profession 2013 118

Exhibit 5.38 Compensation: Sales Representative
Sells product and/or service. Establishes and maintains accounts with clients. Employed by pharmaceutical, medical/nutritional, food, or foodservice equipment or supplies company.
HOURLY WAGE TOTAL CASH COMPENSATION
# answering
- - p e r c e n t i l e s25th 50th
- -75th
(those employed full time, 1+ years) # p e r c e n t i l e s - -
answering 25th 50th 75th
TOTAL - 2013 TOTAL - 2011 % change
Years in Field 20+ years 10 - 19 years 5 - 9 years 1 - 4 years < 1 year NET: < 5 years
Years in Position 10+ years 5 - 9 years < 5 years
Education (Highest Degree) doctoral degree
master's degree bachelor's degree
associate's degree
Credentials Held RD DTR
state license/certification specialty certification(s)
Employment Sector self-employed for-profit
non-profit (other than government) government
Responsibilities director, manager or higher supervisor, coordinator, staff
supervise 1+ employees supervise none
have budget responsibility no budget responsibility
most patients/clients high risk most patients/clients < high risk
do not work with patients/clients
56 $31.25 $36.06 $43.15 47 $79,000 $93,500 $115,000 84 $31.25 $36.06 $42.91 76 $77,100 $90,000 $109,800
0.0% 0.0% 0.6% 2.5% 3.9% 4.7%
22 $33.65 $39.18 $49.66 19 $79,000 $98,000 $120,000 19 $31.25 $37.50 $42.79 16 $83,500 $96,800 $118,800 8 5 7 7
7 7
10 8 15 $34.62 $38.46 $43.27 1331 $30.29 $35.58 $43.27 26 $74,500 $85,000 $100,000
2 2 31 $32.69 $35.58 $45.91 29 $77,500 $88,000 $111,500 22 $29.71 $37.98 $43.27 16 $80,300 $94,000 $116,300 1
55 $31.25 $36.06 $43.27 47 $79,000 $93,500 $115,000 1
23 $31.25 $35.58 $40.87 21 $75,500 $85,000 $98,500 13 13
5 1 48 $31.61 $36.06 $40.87 45 $78,700 $90,000 $104,000 1 1 1
22 $30.65 $39.18 $51.80 18 $83,000 $97,300 $131,300 34 $32.33 $36.06 $40.87 29 $75,500 $88,000 $101,500
11 1145 $30.53 $35.34 $40.87 36 $76,600 $86,500 $100,000
28 $30.53 $36.06 $42.31 24 $79,800 $94,000 $120,800 28 $31.61 $37.26 $43.27 23 $78,400 $93,500 $115,000
7 7 14 1132 $31.61 $36.78 $40.87 27 $75,000 $95,500 $105,000
Note: Results not shown if fewer than 15 valid values.
Compensation by Position 119

Exhibit 5.39 Compensation: Public Relations and/or Marketing Professional
Provides food and nutrition expertise in researching, designing, developing, implementing, and managing public relations and/or marketing programs for clients. May serve as a consultant or be employed by a PR agency, association, industry, or other organization/agency.
HOURLY WAGE TOTAL CASH COMPENSATION (those employed full time, 1+ years)
# - - p e r c e n t i l e s - - # - - p e r c e n t i l e s - - answering 25th 50th 75th answering 25th 50th 75th
TOTAL - 2013 19 $24.04 $29.57 $39.66 TOTAL - 2011 16 $19.83 $41.46 $53.61 % change 21.2% -28.7% -26.0%
Years in Field 20+ years 5 10 - 19 years 6 5 - 9 years 3 1 - 4 years 5 < 1 year NET: < 5 years 5
Years in Position 10+ years 7 5 - 9 years 4 < 5 years 8
Education (Highest Degree) doctoral degree master's degree 10 bachelor's degree 9 associate's degree
Credentials Held RD 18 $23.64 $29.69 $40.08 DTR
state license/certification 3 specialty certification(s) 1
Employment Sector self-employed 2 for-profit 11
non-profit (other than government) 4 government 1
Responsibilities director, manager or higher 10 supervisor, coordinator, staff 9
supervise 1+ employees 11supervise none 8
have budget responsibility 13 no budget responsibility 6
most patients/clients high risk 2 most patients/clients < high risk 2
do not work with patients/clients 15 $24.04 $29.57 $39.66
17 $52,700 $80,500 $93,000 15 $45,000 $93,000 $139,000
17.1% -13.4% -33.1%
5 5 3 4
4
7 3 7
8 9
17 $52,700 $80,500 $93,000
3 1
1 104 1
9 8
9 8
125
2 2
13
Note: Results not shown if fewer than 15 valid values.
Compensation & Benefits Survey of the Dietetics Profession 2013 120
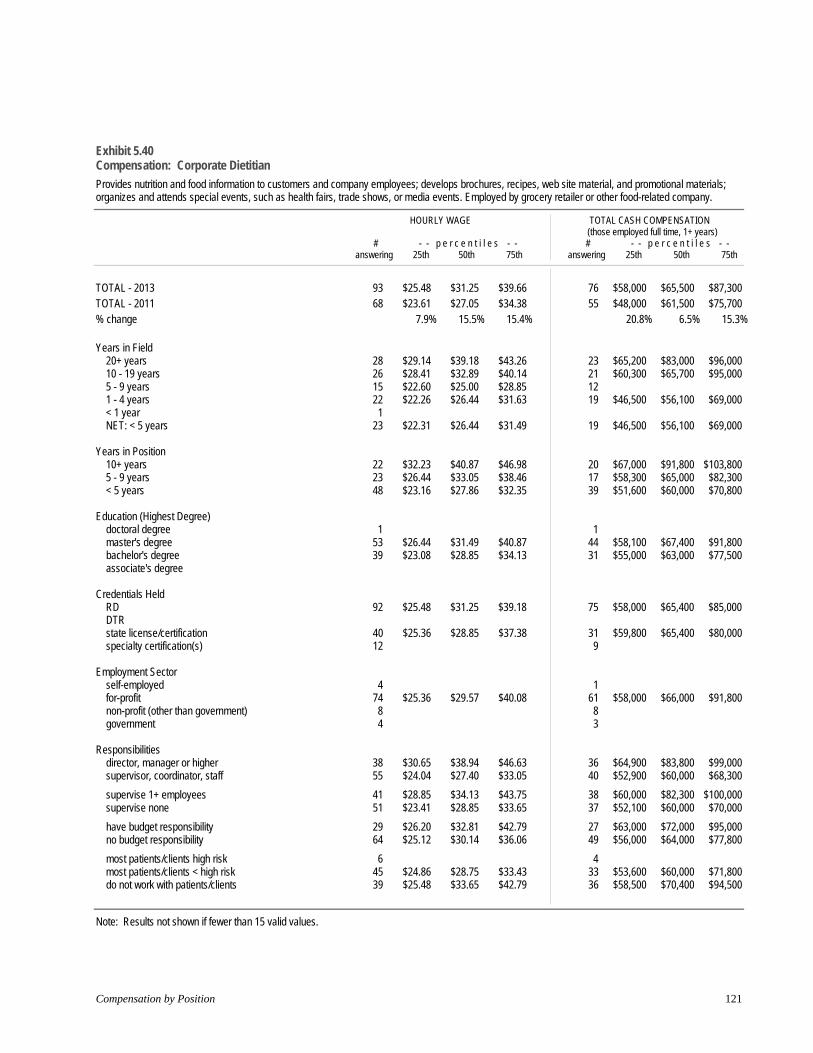
Exhibit 5.40 Compensation: Corporate Dietitian
Provides nutrition and food information to customers and company employees; develops brochures, recipes, web site material, and promotional materials; organizes and attends special events, such as health fairs, trade shows, or media events. Employed by grocery retailer or other food-related company.
HOURLY WAGE TOTAL CASH COMPENSATION
# answering
- - p e r c e n t i l e s25th 50th
- -75th
(those employed full time, 1+ years) # p e r c e n t i l e s - -
answering 25th 50th 75th
TOTAL - 2013 TOTAL - 2011 % change
Years in Field 20+ years 10 - 19 years 5 - 9 years 1 - 4 years < 1 year NET: < 5 years
Years in Position 10+ years 5 - 9 years < 5 years
Education (Highest Degree) doctoral degree
master's degree bachelor's degree
associate's degree
Credentials Held RD DTR
state license/certification specialty certification(s)
Employment Sector self-employed for-profit
non-profit (other than government) government
Responsibilities director, manager or higher supervisor, coordinator, staff
supervise 1+ employees supervise none
have budget responsibility no budget responsibility
most patients/clients high risk most patients/clients < high risk
do not work with patients/clients
93 $25.48 $31.25 $39.66 76 $58,000 $65,500 $87,300 68 $23.61 $27.05 $34.38 55 $48,000 $61,500 $75,700
7.9% 15.5% 15.4% 20.8% 6.5% 15.3%
28 $29.14 $39.18 $43.26 23 $65,200 $83,000 $96,000 26 $28.41 $32.89 $40.14 21 $60,300 $65,700 $95,000 15 $22.60 $25.00 $28.85 1222 $22.26 $26.44 $31.63 19 $46,500 $56,100 $69,000 1
23 $22.31 $26.44 $31.49 19 $46,500 $56,100 $69,000
22 $32.23 $40.87 $46.98 20 $67,000 $91,800 $103,800 23 $26.44 $33.05 $38.46 17 $58,300 $65,000 $82,300 48 $23.16 $27.86 $32.35 39 $51,600 $60,000 $70,800
1 1 53 $26.44 $31.49 $40.87 44 $58,100 $67,400 $91,800 39 $23.08 $28.85 $34.13 31 $55,000 $63,000 $77,500
92 $25.48 $31.25 $39.18 75 $58,000 $65,400 $85,000
40 $25.36 $28.85 $37.38 31 $59,800 $65,400 $80,000 12 9
4 1 74 $25.36 $29.57 $40.08 61 $58,000 $66,000 $91,800 8 8 4 3
38 $30.65 $38.94 $46.63 36 $64,900 $83,800 $99,000 55 $24.04 $27.40 $33.05 40 $52,900 $60,000 $68,300
41 $28.85 $34.13 $43.75 38 $60,000 $82,300 $100,000 51 $23.41 $28.85 $33.65 37 $52,100 $60,000 $70,000
29 $26.20 $32.81 $42.79 27 $63,000 $72,000 $95,000 64 $25.12 $30.14 $36.06 49 $56,000 $64,000 $77,800
6 4 45 $24.86 $28.75 $33.43 33 $53,600 $60,000 $71,800 39 $25.48 $33.65 $42.79 36 $58,500 $70,400 $94,500
Note: Results not shown if fewer than 15 valid values.
Compensation by Position 121

Exhibit 5.41 Compensation: Research & Development Nutritionist
Develops recipes/products and marketing materials related to products; advises on Nutrition Facts panels and nutrient content/health claims; provides technical and written resources; designs research studies; analyzes and interprets nutrient research. May serve as a consultant or be employed by food, commodity, or medical/nutritional industry.
HOURLY WAGE TOTAL CASH COMPENSATION
# answering
- - p e r c e n t i l e s25th 50th
- -75th
(those employed full time, 1+ years) # p e r c e n t i l e s - -
answering 25th 50th 75th
TOTAL - 2013 TOTAL - 2011 % change
Years in Field 20+ years 10 - 19 years 5 - 9 years 1 - 4 years < 1 year NET: < 5 years
Years in Position 10+ years 5 - 9 years < 5 years
Education (Highest Degree) doctoral degree master's degree bachelor's degree associate's degree
Credentials Held RD DTR
state license/certification specialty certification(s)
Employment Sector self-employed for-profit
non-profit (other than government) government
Responsibilities director, manager or higher supervisor, coordinator, staff
supervise 1+ employeessupervise none
have budget responsibility no budget responsibility
most patients/clients high risk most patients/clients < high risk
do not work with patients/clients
24 $31.58 $38.46 $48.56 23 $68,700 $83,000 $125,000 30 $26.32 $33.22 $46.27 26 $53,800 $75,900 $105,400
20.0% 15.8% 4.9% 27.7% 9.4% 18.6%
5 5 9 8 2 2 7 7
7 7
5 5 6 5
13 13
6 6 10 10 8 7
21 $31.91 $38.46 $45.19 20 $68,900 $81,700 $113,600 1 1 6 5 1 1
1 17 $33.60 $40.38 $52.88 17 $70,800 $92,000 $134,500 2 2 2 2
7 6 17 $30.05 $37.50 $42.74 17 $65,100 $80,000 $98,900
12 12 12 11
9 9 15 $27.64 $38.46 $49.52 14
1 1 2 2
20 $33.09 $39.90 $50.24 19 $69,500 $92,000 $129,000
Note: Results not shown if fewer than 15 valid values.
Compensation & Benefits Survey of the Dietetics Profession 2013 122

Exhibit 5.42 Compensation: Director of Nutrition
Responsibilities may include developing and executing the nutritional strategy of the company; tracking nutrition trends; identifying business opportunities; serving as company-wide resource on issues related to nutrition; representing the organization on nutritional and health committees and at meetings; managing a budget and staff.
HOURLY WAGE TOTAL CASH COMPENSATION
# answering
- - p e r c e n t i l e s25th 50th
- -75th
(those employed full time, 1+ years) # p e r c e n t i l e s - -
answering 25th 50th 75th
TOTAL - 2013 TOTAL - 2011 % change
Years in Field 20+ years 10 - 19 years 5 - 9 years 1 - 4 years < 1 year NET: < 5 years
Years in Position 10+ years 5 - 9 years < 5 years
Education (Highest Degree) doctoral degree
master's degree bachelor's degree associate's degree
Credentials Held RD DTR
state license/certification specialty certification(s)
Employment Sector self-employed for-profit
non-profit (other than government) government
Responsibilities director, manager or higher supervisor, coordinator, staff
supervise 1+ employeessupervise none
have budget responsibility no budget responsibility
most patients/clients high risk most patients/clients < high risk
do not work with patients/clients
42 $28.85 $33.53 $40.62 48 $29.09 $35.34 $48.08
-0.8% -5.1% -15.5%
24 $33.47 $37.26 $57.09 10 3 5
5
19 $28.85 $33.41 $40.38 9
14
1 28 $28.85 $30.05 $39.90 13
39 $28.85 $33.41 $40.24 1
21 $28.85 $33.41 $39.66 11
2 15 $27.16 $33.65 $66.35 14 9
37 $28.85 $33.65 $43.51 5
34 $28.61 $31.49 $40.52 7
30 $28.85 $33.05 $40.62 11
4 17 $27.65 $29.81 $35.34 21 $29.04 $33.65 $56.49
38 $60,000 $69,800 $96,500 46 $62,800 $82,300 $116,600
-4.5% -15.2% -17.2%
21 $66,500 $80,000 $127,500 9 3 5
5
18 $62,300 $75,000 $101,300 9
11
1 25 $60,000 $63,500 $83,500 12
35 $60,000 $69,500 $87,000 1
19 $57,000 $69,500 $101,000 10
2 1313 8
34 $60,800 $70,500 $105,800 4
33 $60,000 $68,000 $89,400 4
28 $60,300 $69,800 $99,500 9
2 16 $56,300 $63,300 $78,800 20 $61,500 $75,500 $124,800
Note: Results not shown if fewer than 15 valid values.
Compensation by Position 123
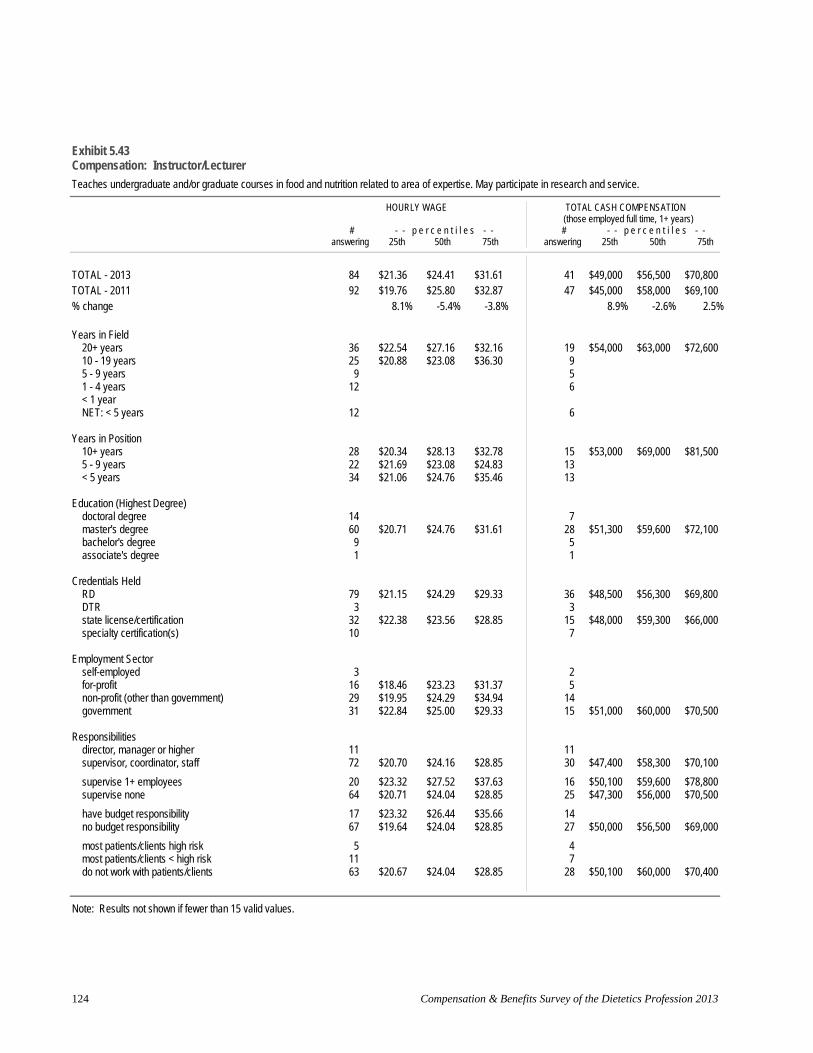
Exhibit 5.43 Compensation: Instructor/Lecturer
Teaches undergraduate and/or graduate courses in food and nutrition related to area of expertise. May participate in research and service.
HOURLY WAGE TOTAL CASH COMPENSATION
# answering
- - p e r c e n t i l e s25th 50th
- -75th
(those employed full time, 1+ years) # p e r c e n t i l e s - -
answering 25th 50th 75th
TOTAL - 2013 TOTAL - 2011 % change
Years in Field 20+ years 10 - 19 years 5 - 9 years 1 - 4 years < 1 year NET: < 5 years
Years in Position 10+ years 5 - 9 years < 5 years
Education (Highest Degree) doctoral degree
master's degree bachelor's degree associate's degree
Credentials Held RD DTR
state license/certification specialty certification(s)
Employment Sector self-employed for-profit
non-profit (other than government) government
Responsibilities director, manager or higher supervisor, coordinator, staff
supervise 1+ employees supervise none
have budget responsibility no budget responsibility
most patients/clients high risk most patients/clients < high risk
do not work with patients/clients
84 $21.36 $24.41 $31.61 41 $49,000 $56,500 $70,800 92 $19.76 $25.80 $32.87 47 $45,000 $58,000 $69,100
8.1% -5.4% -3.8% 8.9% -2.6% 2.5%
36 $22.54 $27.16 $32.16 19 $54,000 $63,000 $72,600 25 $20.88 $23.08 $36.30 9 9 5
12 6
12 6
28 $20.34 $28.13 $32.78 15 $53,000 $69,000 $81,500 22 $21.69 $23.08 $24.83 1334 $21.06 $24.76 $35.46 13
14 7 60 $20.71 $24.76 $31.61 28 $51,300 $59,600 $72,100 9 5 1 1
79 $21.15 $24.29 $29.33 36 $48,500 $56,300 $69,800 3 3
32 $22.38 $23.56 $28.85 15 $48,000 $59,300 $66,000 10 7
3 2 16 $18.46 $23.23 $31.37 5 29 $19.95 $24.29 $34.94 1431 $22.84 $25.00 $29.33 15 $51,000 $60,000 $70,500
11 1172 $20.70 $24.16 $28.85 30 $47,400 $58,300 $70,100
20 $23.32 $27.52 $37.63 16 $50,100 $59,600 $78,800 64 $20.71 $24.04 $28.85 25 $47,300 $56,000 $70,500
17 $23.32 $26.44 $35.66 1467 $19.64 $24.04 $28.85 27 $50,000 $56,500 $69,000
5 4 11 7 63 $20.67 $24.04 $28.85 28 $50,100 $60,000 $70,400
Note: Results not shown if fewer than 15 valid values.
Compensation & Benefits Survey of the Dietetics Profession 2013 124
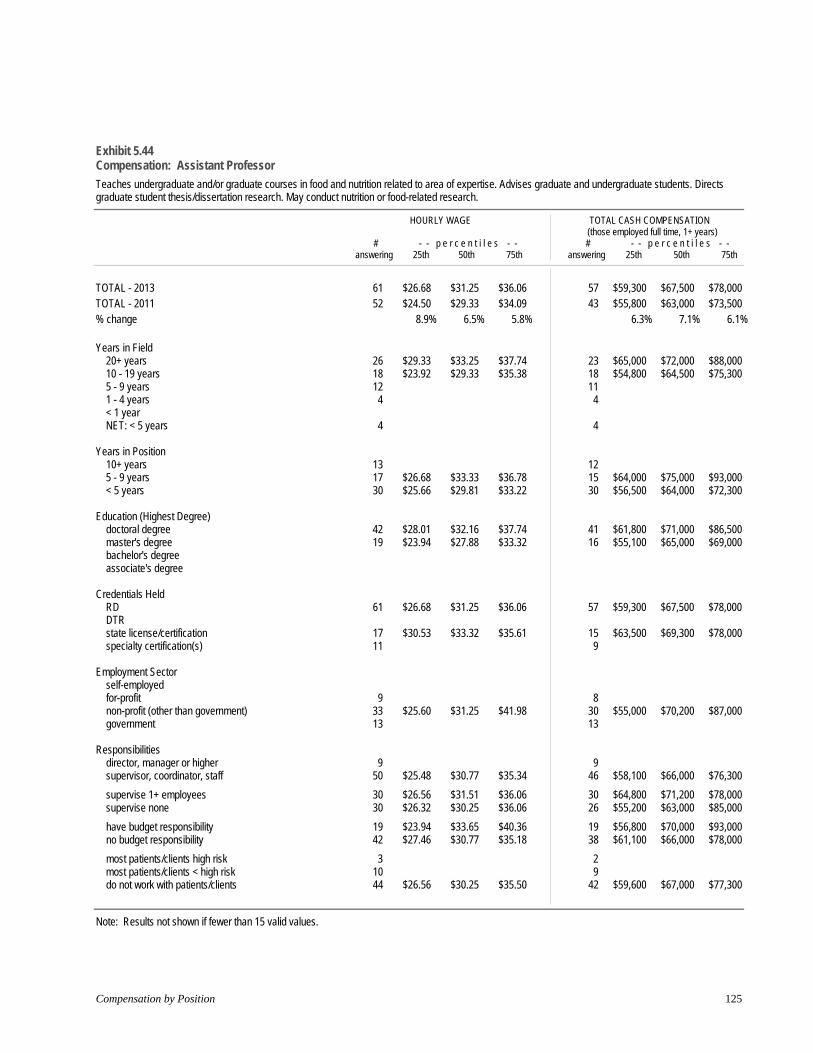
Exhibit 5.44 Compensation: Assistant Professor
Teaches undergraduate and/or graduate courses in food and nutrition related to area of expertise. Advises graduate and undergraduate students. Directs graduate student thesis/dissertation research. May conduct nutrition or food-related research.
HOURLY WAGE TOTAL CASH COMPENSATION
# answering
- - p e r c e n t i l e s25th 50th
- -75th
(those employed full time, 1+ years) # p e r c e n t i l e s - -
answering 25th 50th 75th
TOTAL - 2013 TOTAL - 2011 % change
Years in Field 20+ years 10 - 19 years 5 - 9 years 1 - 4 years < 1 year NET: < 5 years
Years in Position 10+ years 5 - 9 years < 5 years
Education (Highest Degree) doctoral degree master's degree
bachelor's degree associate's degree
Credentials Held RD DTR
state license/certification specialty certification(s)
Employment Sector self-employed for-profit
non-profit (other than government) government
Responsibilities director, manager or higher supervisor, coordinator, staff
supervise 1+ employees supervise none
have budget responsibility no budget responsibility
most patients/clients high risk most patients/clients < high risk
do not work with patients/clients
61 $26.68 $31.25 $36.06 57 $59,300 $67,500 $78,000 52 $24.50 $29.33 $34.09 43 $55,800 $63,000 $73,500
8.9% 6.5% 5.8% 6.3% 7.1% 6.1%
26 $29.33 $33.25 $37.74 23 $65,000 $72,000 $88,000 18 $23.92 $29.33 $35.38 18 $54,800 $64,500 $75,300 12 114 4
4 4
13 1217 $26.68 $33.33 $36.78 15 $64,000 $75,000 $93,000 30 $25.66 $29.81 $33.22 30 $56,500 $64,000 $72,300
42 $28.01 $32.16 $37.74 41 $61,800 $71,000 $86,500 19 $23.94 $27.88 $33.32 16 $55,100 $65,000 $69,000
61 $26.68 $31.25 $36.06 57 $59,300 $67,500 $78,000
17 $30.53 $33.32 $35.61 15 $63,500 $69,300 $78,000 11 9
9 8 33 $25.60 $31.25 $41.98 30 $55,000 $70,200 $87,000 13 13
9 9 50 $25.48 $30.77 $35.34 46 $58,100 $66,000 $76,300
30 $26.56 $31.51 $36.06 30 $64,800 $71,200 $78,000 30 $26.32 $30.25 $36.06 26 $55,200 $63,000 $85,000
19 $23.94 $33.65 $40.36 19 $56,800 $70,000 $93,000 42 $27.46 $30.77 $35.18 38 $61,100 $66,000 $78,000
3 2 10 9 44 $26.56 $30.25 $35.50 42 $59,600 $67,000 $77,300
Note: Results not shown if fewer than 15 valid values.
Compensation by Position 125
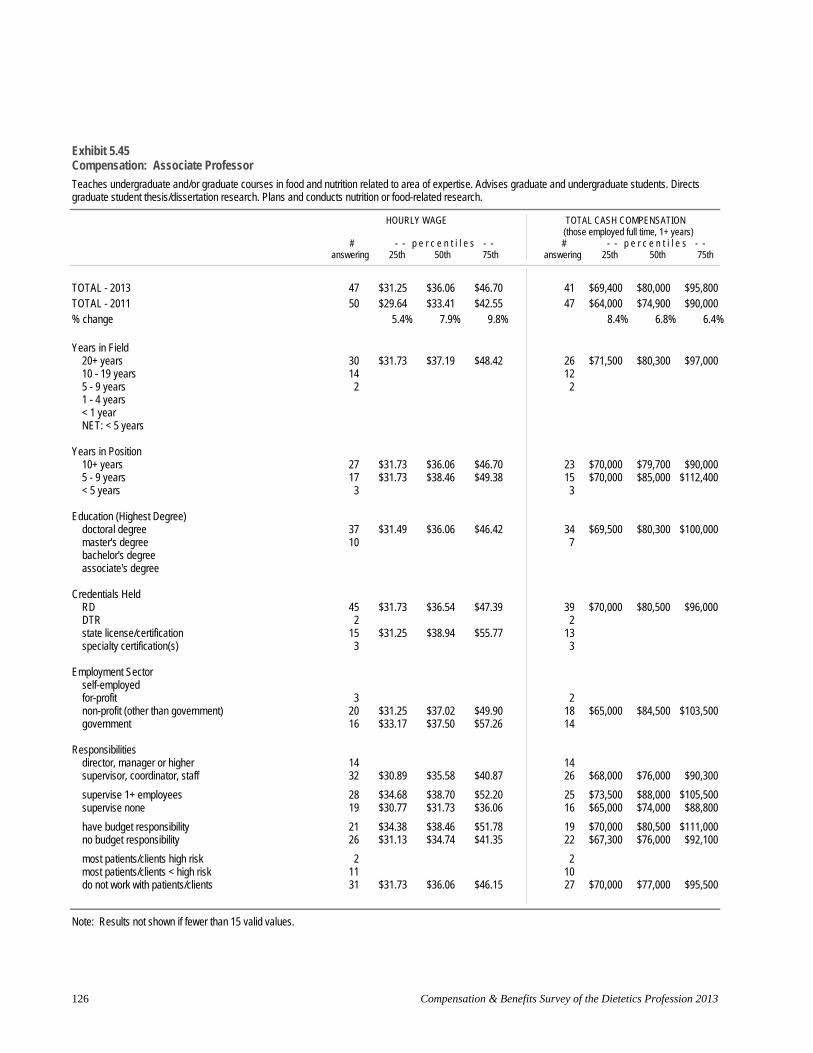
Exhibit 5.45 Compensation: Associate Professor
Teaches undergraduate and/or graduate courses in food and nutrition related to area of expertise. Advises graduate and undergraduate students. Directs graduate student thesis/dissertation research. Plans and conducts nutrition or food-related research.
HOURLY WAGE TOTAL CASH COMPENSATION
# answering
- - p e r c e n t i l e s25th 50th
- -75th
(those employed full time, 1+ years) # p e r c e n t i l e s - -
answering 25th 50th 75th
TOTAL - 2013 TOTAL - 2011 % change
Years in Field 20+ years 10 - 19 years 5 - 9 years 1 - 4 years < 1 year NET: < 5 years
Years in Position 10+ years 5 - 9 years < 5 years
Education (Highest Degree) doctoral degree
master's degree bachelor's degree associate's degree
Credentials Held RD DTR
state license/certification specialty certification(s)
Employment Sector self-employed for-profit
non-profit (other than government) government
Responsibilities director, manager or higher supervisor, coordinator, staff
supervise 1+ employees supervise none
have budget responsibility no budget responsibility
most patients/clients high risk most patients/clients < high risk
do not work with patients/clients
47 $31.25 $36.06 $46.70 41 $69,400 $80,000 $95,800 50 $29.64 $33.41 $42.55 47 $64,000 $74,900 $90,000
5.4% 7.9% 9.8% 8.4% 6.8% 6.4%
30 $31.73 $37.19 $48.42 26 $71,500 $80,300 $97,000 14 122 2
27 $31.73 $36.06 $46.70 23 $70,000 $79,700 $90,000 17 $31.73 $38.46 $49.38 15 $70,000 $85,000 $112,400 3 3
37 $31.49 $36.06 $46.42 34 $69,500 $80,300 $100,000 10 7
45 $31.73 $36.54 $47.39 39 $70,000 $80,500 $96,000 2 2
15 $31.25 $38.94 $55.77 13 3 3
3 2 20 $31.25 $37.02 $49.90 18 $65,000 $84,500 $103,500 16 $33.17 $37.50 $57.26 14
14 1432 $30.89 $35.58 $40.87 26 $68,000 $76,000 $90,300
28 $34.68 $38.70 $52.20 25 $73,500 $88,000 $105,500 19 $30.77 $31.73 $36.06 16 $65,000 $74,000 $88,800
21 $34.38 $38.46 $51.78 19 $70,000 $80,500 $111,000 26 $31.13 $34.74 $41.35 22 $67,300 $76,000 $92,100
2 2 11 1031 $31.73 $36.06 $46.15 27 $70,000 $77,000 $95,500
Note: Results not shown if fewer than 15 valid values.
Compensation & Benefits Survey of the Dietetics Profession 2013 126

Exhibit 5.46 Compensation: Professor
Teaches undergraduate and/or graduate courses in food and nutrition related to area of expertise. Advises graduate and undergraduate students. Directs graduate student thesis/dissertation research. Establishes a nutrition or food-related research program.
HOURLY WAGE TOTAL CASH COMPENSATION
# answering
- - p e r c e n t i l e s25th 50th
- -75th
(those employed full time, 1+ years) # p e r c e n t i l e s - -
answering 25th 50th 75th
TOTAL - 2013 TOTAL - 2011 % change
Years in Field 20+ years 10 - 19 years 5 - 9 years 1 - 4 years < 1 year NET: < 5 years
Years in Position 10+ years 5 - 9 years < 5 years
Education (Highest Degree) doctoral degree
master's degree bachelor's degree associate's degree
Credentials Held RD DTR
state license/certification specialty certification(s)
Employment Sector self-employed for-profit
non-profit (other than government) government
Responsibilities director, manager or higher supervisor, coordinator, staff
supervise 1+ employeessupervise none
have budget responsibility no budget responsibility
most patients/clients high risk most patients/clients < high risk
do not work with patients/clients
36 $39.66 $49.28 $62.02 35 $80,000 $110,000 $140,000 44 $36.68 $47.70 $55.05 40 $81,300 $103,200 $119,800
8.1% 3.3% 12.7% -1.6% 6.6% 16.9%
35 $43.27 $50.48 $62.50 34 $87,500 $110,500 $140,000
33 $38.46 $48.08 $61.54 32 $80,000 $107,500 $138,000 2 2 1 1
31 $43.27 $50.96 $63.46 31 $90,000 $112,000 $140,000 5 4
32 $39.66 $49.28 $59.29 31 $80,000 $110,000 $140,000
11 10 1 1
1 1 19 $44.87 $52.88 $84.13 18 $98,500 $114,400 $175,500 13 13
13 1322 $42.07 $48.08 $53.52 22 $87,500 $105,000 $119,900
25 $44.23 $52.88 $65.39 25 $93,500 $116,000 $174,000 11 10
19 $48.08 $53.01 $84.13 19 $101,000 $117,800 $175,000 17 $34.53 $43.27 $49.28 16 $70,000 $91,500 $115,400
2 2 4 4
29 $38.46 $48.08 $52.95 28 $80,000 $103,000 $118,400
Note: Results not shown if fewer than 15 valid values.
Compensation by Position 127

Exhibit 5.47 Compensation: Didactic Program Director
Assesses, plans, implements, and evaluates dietetics curriculum to meet and maintain CADE standards. Develops program information for potential and current students. Assures that educational competencies are included in appropriate courses. Recruits, advises, and counsels dietetic students. May teach undergraduate and graduate courses.
HOURLY WAGE TOTAL CASH COMPENSATION (those employed full time, 1+ years)
# - - p e r c e n t i l e s - - # - - p e r c e n t i l e s - - answering 25th 50th 75th answering 25th 50th 75th
TOTAL - 2013 20 $26.44 $31.63 $35.94 TOTAL - 2011 36 $25.37 $28.97 $33.05 % change 4.2% 9.2% 8.7%
Years in Field 20+ years 11 10 - 19 years 8 5 - 9 years 1 1 - 4 years < 1 year NET: < 5 years
Years in Position 10+ years 10 5 - 9 years 6 < 5 years 4
Education (Highest Degree) doctoral degree 9 master's degree 11 bachelor's degree associate's degree
Credentials Held RD 20 $26.44 $31.63 $35.94 DTR
state license/certification 10 specialty certification(s) 3
Employment Sector self-employed for-profit 1
non-profit (other than government) 10 government 8
Responsibilities director, manager or higher 14 supervisor, coordinator, staff 6
supervise 1+ employees 13supervise none 7
have budget responsibility 9 no budget responsibility 11
most patients/clients high risk most patients/clients < high risk 1
do not work with patients/clients 18 $26.44 $31.63 $36.72
19 $55,000 $68,000 $86,000 34 $56,400 $62,500 $77,500
-2.5% 8.8% 11.0%
108 1
9 6 4
9 10
19 $55,000 $68,000 $86,000
9 3
1 10 7
145
12 7
8 11
1 17 $55,000 $68,000 $86,500
Note: Results not shown if fewer than 15 valid values.
Compensation & Benefits Survey of the Dietetics Profession 2013 128

Exhibit 5.48 Compensation: Dietetic Internship Director
Assesses, plans, implements, and evaluates dietetic internship program to meet and maintain CADE standards. Coordinates and directs staff involved in the program. Plans and coordinates class and rotation schedules with staff and affiliation sites. May teach classes or perform other responsibilities separate from internship program.
HOURLY WAGE TOTAL CASH COMPENSATION
# answering
- - p e r c e n t i l e s25th 50th
- -75th
(those employed full time, 1+ years) # p e r c e n t i l e s - -
answering 25th 50th 75th
TOTAL - 2013 TOTAL - 2011 % change
Years in Field 20+ years 10 - 19 years 5 - 9 years 1 - 4 years < 1 year NET: < 5 years
Years in Position 10+ years 5 - 9 years < 5 years
Education (Highest Degree) doctoral degree
master's degree bachelor's degree associate's degree
Credentials Held RD DTR
state license/certification specialty certification(s)
Employment Sector self-employed for-profit
non-profit (other than government) government
Responsibilities director, manager or higher supervisor, coordinator, staff
supervise 1+ employeessupervise none
have budget responsibility no budget responsibility
most patients/clients high risk most patients/clients < high risk
do not work with patients/clients
27 $27.16 $31.87 $35.82 23 $58,000 $69,500 $82,000 38 $25.99 $31.25 $37.75 31 $55,800 $63,500 $83,000
4.5% 2.0% -5.1% 3.9% 9.4% -1.2%
12 1011 103 2 1 1
1 1
12 106 6 9 7
3 3 23 $27.16 $31.87 $35.82 20 $58,100 $70,300 $80,300 1
27 $27.16 $31.87 $35.82 23 $58,000 $69,500 $82,000
15 $27.16 $31.25 $35.10 13 1 1
4 4 10 9 10 8
16 $29.34 $32.55 $35.82 1410 8
17 $28.44 $33.00 $38.22 16 $64,300 $73,300 $83,500 9 6
14 1212 10
1 1 3 3
21 $25.24 $30.80 $33.75 17 $53,300 $65,000 $74,600
Note: Results not shown if fewer than 15 valid values.
Compensation by Position 129
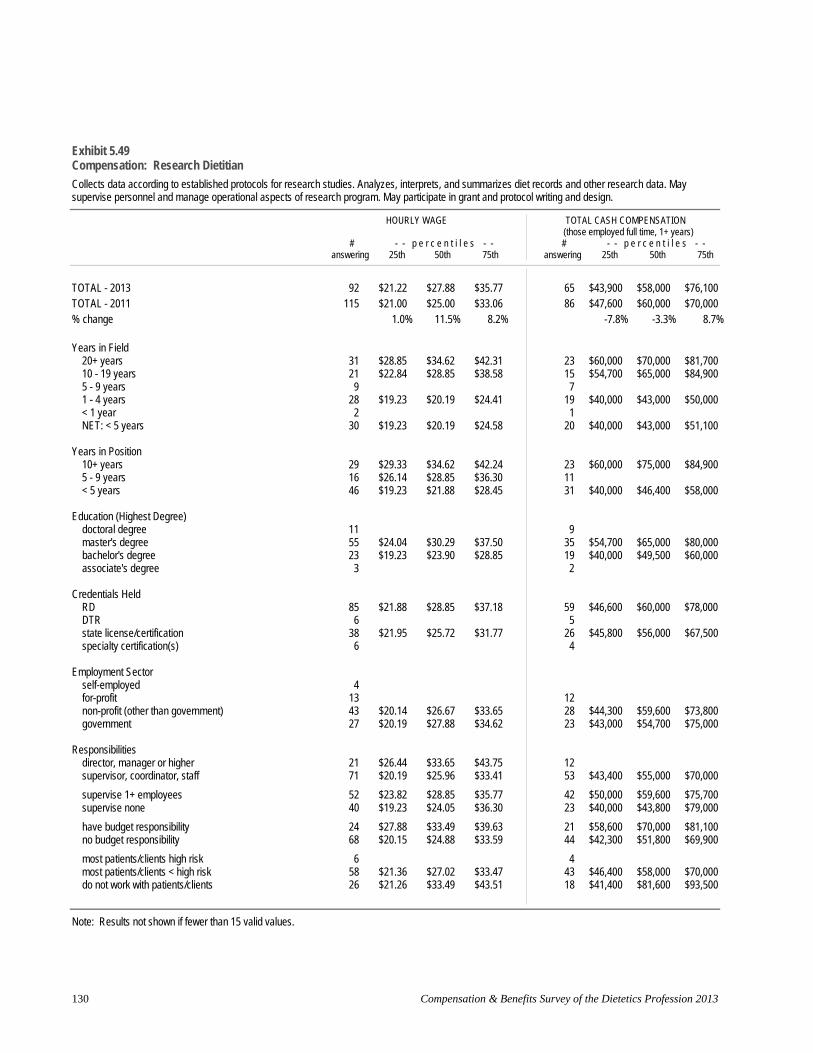
Exhibit 5.49 Compensation: Research Dietitian
Collects data according to established protocols for research studies. Analyzes, interprets, and summarizes diet records and other research data. May supervise personnel and manage operational aspects of research program. May participate in grant and protocol writing and design.
HOURLY WAGE TOTAL CASH COMPENSATION
# answering
- - p e r c e n t i l e s25th 50th
- -75th
(those employed full time, 1+ years) # p e r c e n t i l e s - -
answering 25th 50th 75th
TOTAL - 2013 TOTAL - 2011 % change
Years in Field 20+ years 10 - 19 years 5 - 9 years 1 - 4 years < 1 year NET: < 5 years
Years in Position 10+ years 5 - 9 years < 5 years
Education (Highest Degree) doctoral degree
master's degree bachelor's degree
associate's degree
Credentials Held RD DTR
state license/certification specialty certification(s)
Employment Sector self-employed for-profit
non-profit (other than government) government
Responsibilities director, manager or higher supervisor, coordinator, staff
supervise 1+ employees supervise none
have budget responsibility no budget responsibility
most patients/clients high risk most patients/clients < high risk
do not work with patients/clients
92 $21.22 $27.88 $35.77 65 $43,900 $58,000 $76,100 115 $21.00 $25.00 $33.06 86 $47,600 $60,000 $70,000
1.0% 11.5% 8.2% -7.8% -3.3% 8.7%
31 $28.85 $34.62 $42.31 23 $60,000 $70,000 $81,700 21 $22.84 $28.85 $38.58 15 $54,700 $65,000 $84,900 9 7
28 $19.23 $20.19 $24.41 19 $40,000 $43,000 $50,000 2 1
30 $19.23 $20.19 $24.58 20 $40,000 $43,000 $51,100
29 $29.33 $34.62 $42.24 23 $60,000 $75,000 $84,900 16 $26.14 $28.85 $36.30 1146 $19.23 $21.88 $28.45 31 $40,000 $46,400 $58,000
11 9 55 $24.04 $30.29 $37.50 35 $54,700 $65,000 $80,000 23 $19.23 $23.90 $28.85 19 $40,000 $49,500 $60,000 3 2
85 $21.88 $28.85 $37.18 59 $46,600 $60,000 $78,000 6 5
38 $21.95 $25.72 $31.77 26 $45,800 $56,000 $67,500 6 4
4 13 1243 $20.14 $26.67 $33.65 28 $44,300 $59,600 $73,800 27 $20.19 $27.88 $34.62 23 $43,000 $54,700 $75,000
21 $26.44 $33.65 $43.75 1271 $20.19 $25.96 $33.41 53 $43,400 $55,000 $70,000
52 $23.82 $28.85 $35.77 42 $50,000 $59,600 $75,700 40 $19.23 $24.05 $36.30 23 $40,000 $43,800 $79,000
24 $27.88 $33.49 $39.63 21 $58,600 $70,000 $81,100 68 $20.15 $24.88 $33.59 44 $42,300 $51,800 $69,900
6 4 58 $21.36 $27.02 $33.47 43 $46,400 $58,000 $70,000 26 $21.26 $33.49 $43.51 18 $41,400 $81,600 $93,500
Note: Results not shown if fewer than 15 valid values.
Compensation & Benefits Survey of the Dietetics Profession 2013 130
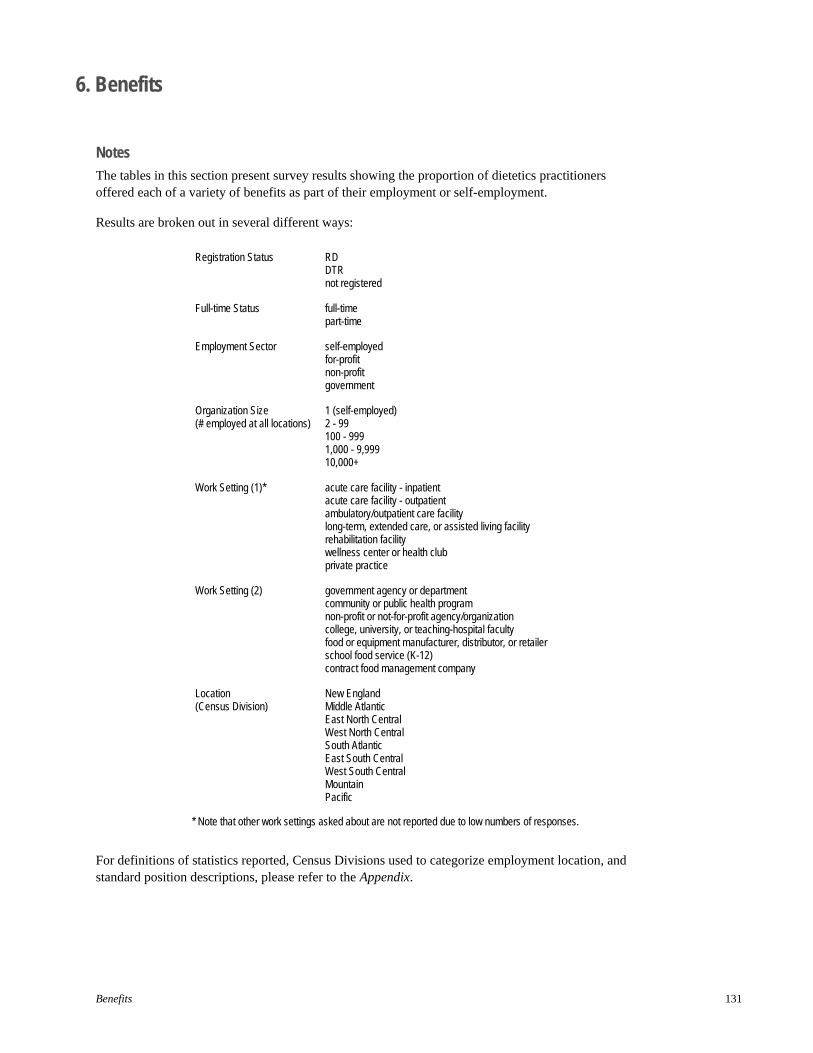
6. Benefits
Notes
The tables in this section present survey results showing the proportion of dietetics practitioners offered each of a variety of benefits as part of their employment or self-employment.
Results are broken out in several different ways:
Registration Status RD DTR not registered
Full-time Status full-time part-time
Employment Sector self-employed for-profit non-profit government
Organization Size 1 (self-employed) (# employed at all locations) 2 - 99
100 - 999 1,000 - 9,999 10,000+
Work Setting (1)* acute care facility - inpatient acute care facility - outpatient ambulatory/outpatient care facility long-term, extended care, or assisted living facility rehabilitation facility wellness center or health club private practice
Work Setting (2) government agency or department community or public health program non-profit or not-for-profit agency/organization college, university, or teaching-hospital faculty food or equipment manufacturer, distributor, or retailer school food service (K-12) contract food management company
Location New England (Census Division) Middle Atlantic
East North Central West North CentralSouth Atlantic East South CentralWest South CentralMountain Pacific
* Note that other work settings asked about are not reported due to low numbers of responses.
For definitions of statistics reported, Census Divisions used to categorize employment location, and standard position descriptions, please refer to the Appendix.
Benefits 131

Exhibit 6.1a Retirement Benefits by Registration Status and Full-Time Status
As of April 1, 2013, what retirement benefits (if any) were offered as a part of your employment/self-employment in this position (whether you took advantage of them or not)?
all practitioners
REGISTRATION STATUS
RD DTR not
FULL TIME?
yes no
base: practitioners* (multiple answers)
7469100%
6523 100%
866 100%
80 100%
5329 1543 100% 100%
defined benefit plan (pension) 1883 25%
1625 25%
235 27%
23 29%
1565 226 29% 15%
NET: defined contribution plan 5389 72%
4734 73%
608 70%
47 59%
4300 851 81% 55%
defined contribution plan (e.g., 401(k)),
employer contributes 4630
62% 4050
62% 535
62% 45 56%
3717 704 70% 46%
defined contribution plan, employer does NOT contribute
759 10%
684 10%
73 8%
2 3%
583 147 11% 10%
indicated one or more 6216 83%
5434 83%
721 83%
61 76%
4977 953 93% 62%
no retirement benefit offered 1170 16%
1025 16%
128 15%
17 21%
315 564 6% 37%
no answer 831%
64 1%
17 2%
2 3%
37 26 1% 2%
* "practitioners" excludes those not currently in dietetics NET indicates selection of one or more items in category
Compensation & Benefits Survey of the Dietetics Profession 2013 132

Exhibit 6.1b Retirement Benefits by Employment Sector and Organization Size
As of April 1, 2013, what retirement benefits (if any) were offered as a part of your employment/self-employment in this position (whether you took advantage of them or not)?
all practitioners
EMPLOYMENT SECTOR self- for non-
employed profit profit govt
# OF EMPLOYEES (ALL LOCATIONS) 100 1,000 -
1 2 – 99 999 9,999 10,000+
base: practitioners* (multiple answers)
7469 100%
533100%
2258 100%
2863 100%
1400 100%
434100%
1131 1936 2350 1425 100% 100% 100% 100%
defined benefit plan (pension) 1883 25%
6 1%
2039%
753 26%
812 58%
5 1%
255 494 725 360 23% 26% 31% 25%
NET: defined contribution plan 5389 72%
5811%
1818 81%
2377 83%
843 60%
50 12%
644 1409 1918 1243 57% 73% 82% 87%
defined contribution plan (e.g., 401(k)), employer contributes
4630 62%
43 8%
1536 68%
2095 73%
709 51%
40 9%
535 1198 1689 1061 47% 62% 72% 74%
defined contribution plan, employer does NOT contribute
759 10%
153%
282 12%
282 10%
134 10%
102%
109 211 229 182 10% 11% 10% 13%
indicated one or more 6216 83%
6111%
1868 83%
2624 92%
1320 94%
52 12%
791 1687 2191 1348 70% 87% 93% 95%
no retirement benefit offered 1170 16%
46587%
36116%
217 8%
63 5%
38188%
325 218 140 70 29% 11% 6% 5%
no answer 83 1%
7 1%
29 1%
22 1%
17 1%
1 0%
15 31 19 7 1% 2% 1% 0%
* "practitioners" excludes those not currently in dietetics
Benefits 133
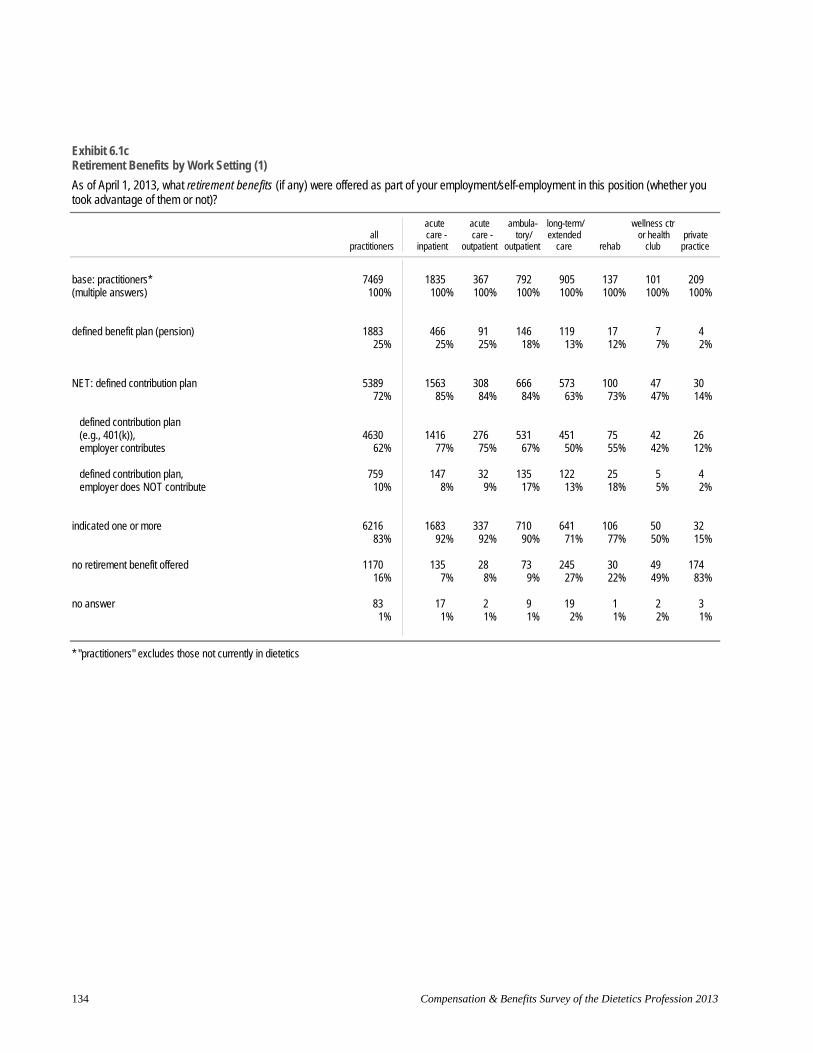
Exhibit 6.1c Retirement Benefits by Work Setting (1)
As of April 1, 2013, what retirement benefits (if any) were offered as part of your employment/self-employment in this position (whether you took advantage of them or not)?
all practitioners
acute care -
inpatient
acute ambula- care - tory/
outpatient outpatient
long-term/ extended
care
wellness ctr or health
rehab club private
practice
base: practitioners* (multiple answers)
7469 100%
1835100%
367 100%
792 100%
905 100%
137 101 100% 100%
209 100%
defined benefit plan (pension) 1883 25%
466 25%
91 25%
146 18%
119 13%
17 7 12% 7%
4 2%
NET: defined contribution plan 5389 72%
156385%
308 84%
666 84%
573 63%
100 47 73% 47%
30 14%
defined contribution plan (e.g., 401(k)), employer contributes
4630 62%
1416 77%
276 75%
531 67%
451 50%
75 42 55% 42%
26 12%
defined contribution plan, employer does NOT contribute
759 10%
147 8%
32 9%
135 17%
122 13%
25 5 18% 5%
4 2%
indicated one or more 6216 83%
168392%
337 92%
710 90%
641 71%
106 50 77% 50%
32 15%
no retirement benefit offered 1170 16%
1357%
288%
73 9%
245 27%
30 49 22% 49%
174 83%
no answer 83 1%
171% 2
1%9 1%
19 2%
1 2 1% 2%
3 1%
* "practitioners" excludes those not currently in dietetics
Compensation & Benefits Survey of the Dietetics Profession 2013 134
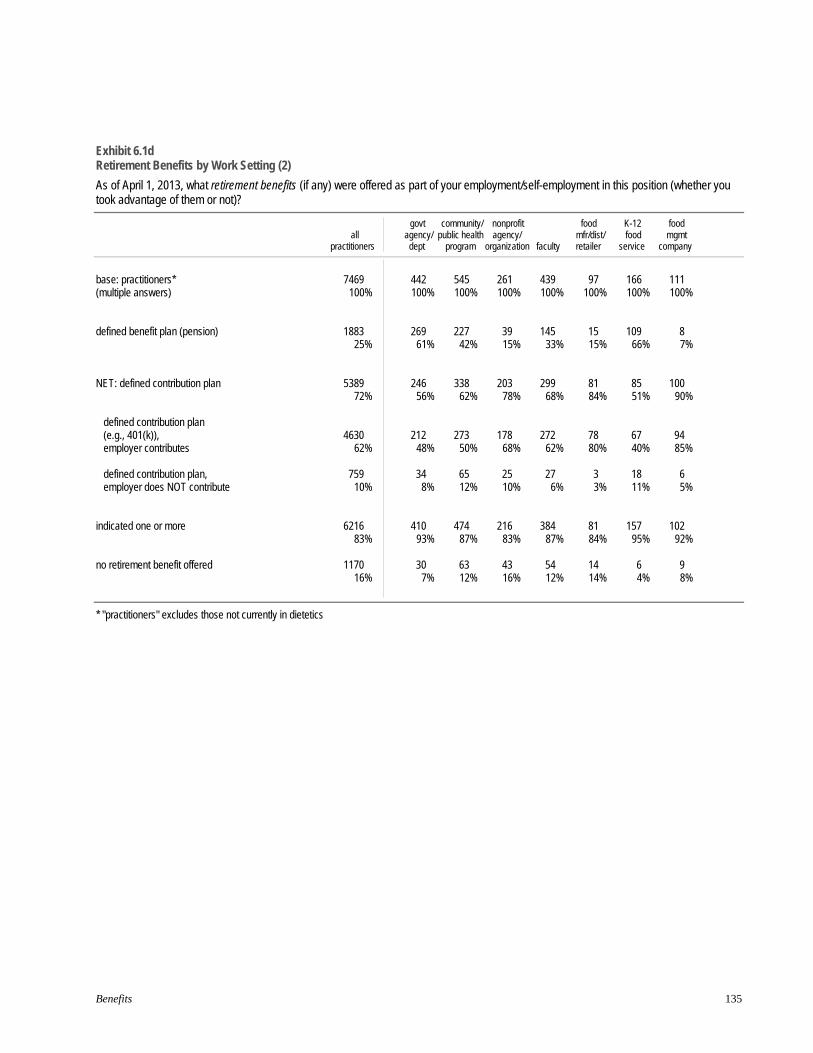
Exhibit 6.1d Retirement Benefits by Work Setting (2)
As of April 1, 2013, what retirement benefits (if any) were offered as part of your employment/self-employment in this position (whether you took advantage of them or not)?
all practitioners
govt community/ nonprofit agency/ public health agency/ dept program organization faculty
foodmfr/dist/ retailer
K-12 food
service
food mgmt
company
base: practitioners* (multiple answers)
7469 100%
442100%
545 100%
261 100%
439 100%
97 100%
166 100%
111 100%
defined benefit plan (pension) 1883 25%
269 61%
227 42%
39 15%
145 33%
15 15%
109 66%
8 7%
NET: defined contribution plan 5389 72%
246 56%
338 62%
203 78%
299 68%
81 84%
85 51%
100 90%
defined contribution plan (e.g., 401(k)), employer contributes
4630 62%
212 48%
273 50%
178 68%
272 62%
78 80%
67 40%
94 85%
defined contribution plan, employer does NOT contribute
759 10%
34 8%
65 12%
25 10%
27 6%
3 3%
18 11%
6 5%
indicated one or more 6216 83%
41093%
474 87%
216 83%
384 87%
81 84%
157 95%
102 92%
no retirement benefit offered 1170 16%
307% 63
12% 43
16% 54
12% 14
14% 6 4%
9 8%
* "practitioners" excludes those not currently in dietetics
Benefits 135
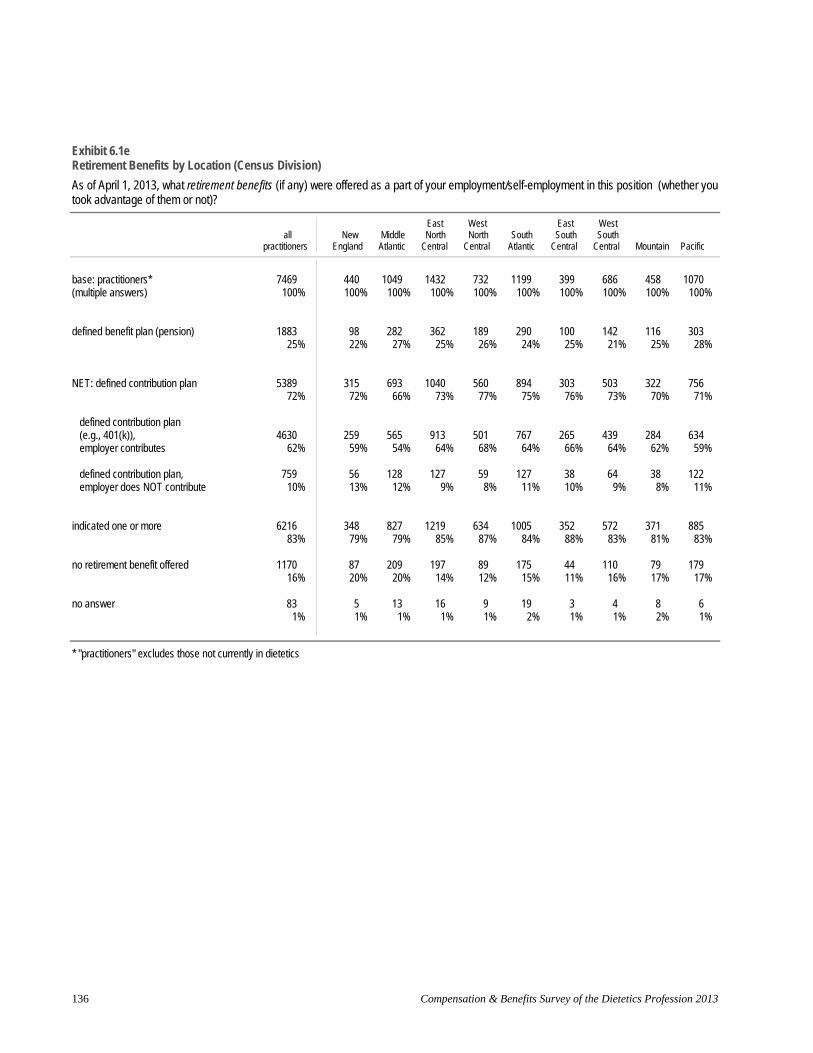
Exhibit 6.1e Retirement Benefits by Location (Census Division)
As of April 1, 2013, what retirement benefits (if any) were offered as a part of your employment/self-employment in this position (whether you took advantage of them or not)?
all practitioners
New England
Middle Atlantic
East North
Central
West North
Central South Atlantic
East South Central
West South
Central Mountain Pacific
base: practitioners* (multiple answers)
7469 100%
440 100%
1049 100%
1432 100%
732 100%
1199 100%
399 100%
686 100%
458 100%
1070 100%
defined benefit plan (pension) 1883 25%
9822%
282 27%
362 25%
189 26%
290 24%
100 25%
142 21%
116 25%
303 28%
NET: defined contribution plan 5389 72%
31572%
693 66%
1040 73%
560 77%
894 75%
303 76%
503 73%
322 70%
756 71%
defined contribution plan (e.g., 401(k)), employer contributes
4630 62%
25959%
565 54%
913 64%
501 68%
767 64%
265 66%
439 64%
284 62%
634 59%
defined contribution plan, employer does NOT contribute
759 10%
56 13%
128 12%
127 9%
59 8%
127 11%
38 10%
64 9%
38 8%
122 11%
indicated one or more 6216 83%
34879%
827 79%
1219 85%
634 87%
1005 84%
352 88%
572 83%
371 81%
885 83%
no retirement benefit offered 1170 16%
8720%
209 20%
197 14%
89 12%
175 15%
44 11%
110 16%
79 17%
179 17%
no answer 83 1%
5 1%
13 1%
16 1%
9 1%
19 2%
3 1%
4 1%
8 2%
6 1%
* "practitioners" excludes those not currently in dietetics
Compensation & Benefits Survey of the Dietetics Profession 2013 136
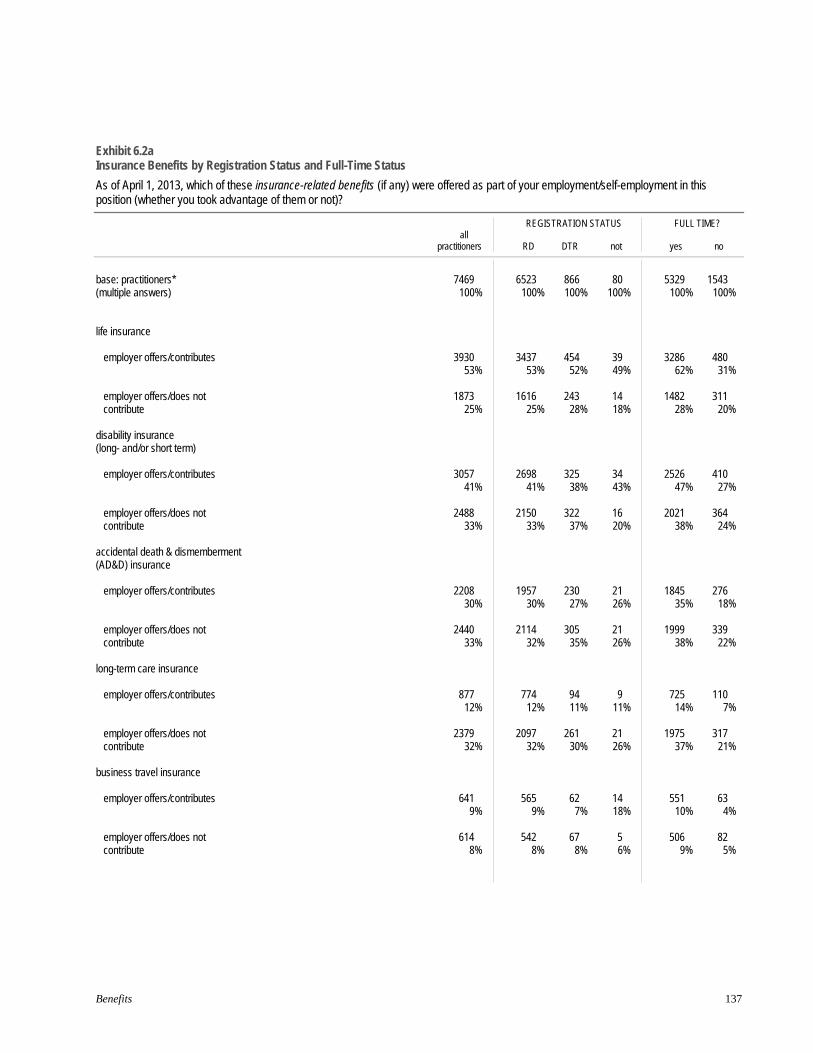
Exhibit 6.2a Insurance Benefits by Registration Status and Full-Time Status
As of April 1, 2013, which of these insurance-related benefits (if any) were offered as part of your employment/self-employment in this position (whether you took advantage of them or not)?
all practitioners RD
REGIST ST
DTR
RATION ATUS
not
FULL TIME?
yes no
7469 6523 866 80 5329 1543 100% 100% 100% 100% 100% 100%
3930 3437 454 39 3286 480 53% 53% 52% 49% 62% 31%
1873 1616 243 14 1482 311 25% 25% 28% 18% 28% 20%
3057 2698 325 34 2526 410 41% 41% 38% 43% 47% 27%
2488 2150 322 16 2021 364 33% 33% 37% 20% 38% 24%
2208 1957 230 21 1845 276 30% 30% 27% 26% 35% 18%
2440 2114 305 21 1999 339 33% 32% 35% 26% 38% 22%
877 774 94 9 725 110 12% 12% 11% 11% 14% 7%
2379 2097 261 21 1975 317 32% 32% 30% 26% 37% 21%
641 565 62 14 551 63 9% 9% 7% 18% 10% 4%
614 542 67 5 506 82 8% 8% 8% 6% 9% 5%
base: practitioners* (multiple answers)
life insurance
employer offers/contributes
employer offers/does not contribute
disability insurance (long- and/or short term)
employer offers/contributes
employer offers/does not contribute
accidental death & dismemberment (AD&D) insurance
employer offers/contributes
employer offers/does notcontribute
long-term care insurance
employer offers/contributes
employer offers/does notcontribute
business travel insurance
employer offers/contributes
employer offers/does notcontribute
Benefits 137

Exhibit 6.2a (continued) Insurance Benefits by Registration Status and Full-Time Status
As of April 1, 2013, which of these insurance-related benefits (if any) were offered as part of your employment/self-employment in this position (whether you took advantage of them or not)?
REGISTRATION STATUS FULL TIME? all
practitioners RD DTR not yes no
base: practitioners* 7469 6523 866 80 5329 1543 (multiple answers) 100% 100% 100% 100% 100% 100%
high-deductible medical insurance - for employees
employer offers/contributes 2985 40%
2629 40%
326 38%
30 38%
2464 46%
403 26%
employer offers/does not contribute
1040 14%
878 13%
155 18%
7 9%
814 15%
170 11%
high-deductible medical insurance - for dependents
employer offers/contributes 2710 36%
2396 37%
286 33%
28 35%
2236 42%
368 24%
employer offers/does not contribute
1178 16%
1006 15%
164 19%
8 10%
938 18%
181 12%
lower deductible medical insurance or managed care plan for employees
employer offers/contributes 3916 52%
3485 53%
392 45%
39 49%
3259 61%
511 33%
employer offers/does not 1061 906 147 8 841 173 contribute 14% 14% 17% 10% 16% 11%
lower deductible medical insurance or managed care plan for dependents
employer offers/contributes 3520 47%
3127 48%
360 42%
33 41%
2930 55%
466 30%
employer offers/does not contribute
1252 17%
1091 17%
150 17%
11 14%
1008 19%
191 12%
healthcare reimbursement or flexible spending account
employer offers/contributes 2253 1991 239 23 1866 298 30% 31% 28% 29% 35% 19%
employer offers/does not contribute
2941 39%
2588 40%
333 38%
20 25%
2395 45%
433 28%
Compensation & Benefits Survey of the Dietetics Profession 2013 138
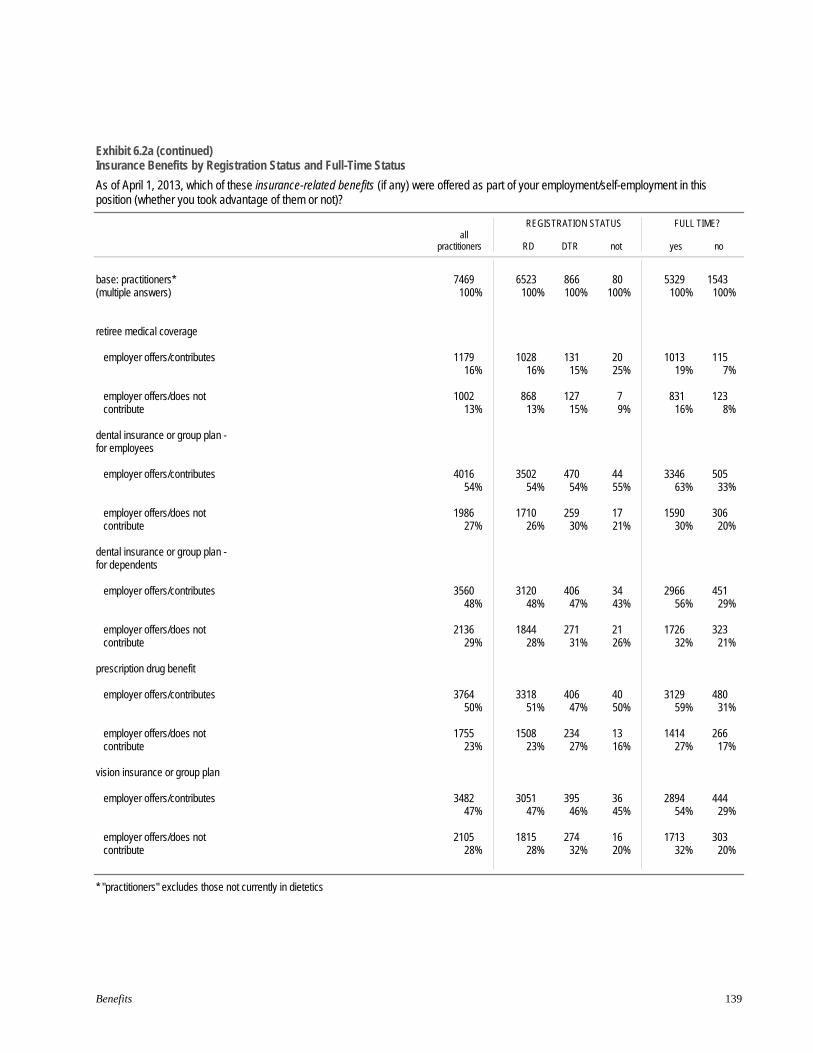
Exhibit 6.2a (continued) Insurance Benefits by Registration Status and Full-Time Status
As of April 1, 2013, which of these insurance-related benefits (if any) were offered as part of your employment/self-employment in this position (whether you took advantage of them or not)?
REGISTRATION STATUS FULL TIME? all
practitioners RD DTR not yes no
base: practitioners* 7469 6523 866 80 5329 1543 (multiple answers) 100% 100% 100% 100% 100% 100%
retiree medical coverage
employer offers/contributes 1179 16%
1028 16%
131 15%
20 25%
1013 115 19% 7%
employer offers/does not 1002 868 127 7 831 123 contribute 13% 13% 15% 9% 16% 8%
dental insurance or group plan for employees
employer offers/contributes 4016 54%
3502 54%
470 54%
44 55%
3346 505 63% 33%
employer offers/does not contribute
1986 27%
1710 26%
259 30%
17 21%
1590 306 30% 20%
dental insurance or group plan for dependents
employer offers/contributes 3560 48%
3120 48%
406 47%
34 43%
2966 451 56% 29%
employer offers/does not contribute
2136 29%
1844 28%
271 31%
21 26%
1726 323 32% 21%
prescription drug benefit
employer offers/contributes 3764 50%
3318 51%
406 47%
40 50%
3129 480 59% 31%
employer offers/does not contribute
1755 23%
1508 23%
234 27%
13 16%
1414 266 27% 17%
vision insurance or group plan
employer offers/contributes 3482 47%
3051 47%
395 46%
36 45%
2894 444 54% 29%
employer offers/does not contribute
2105 28%
1815 28%
274 32%
16 20%
1713 303 32% 20%
* "practitioners" excludes those not currently in dietetics
Benefits 139
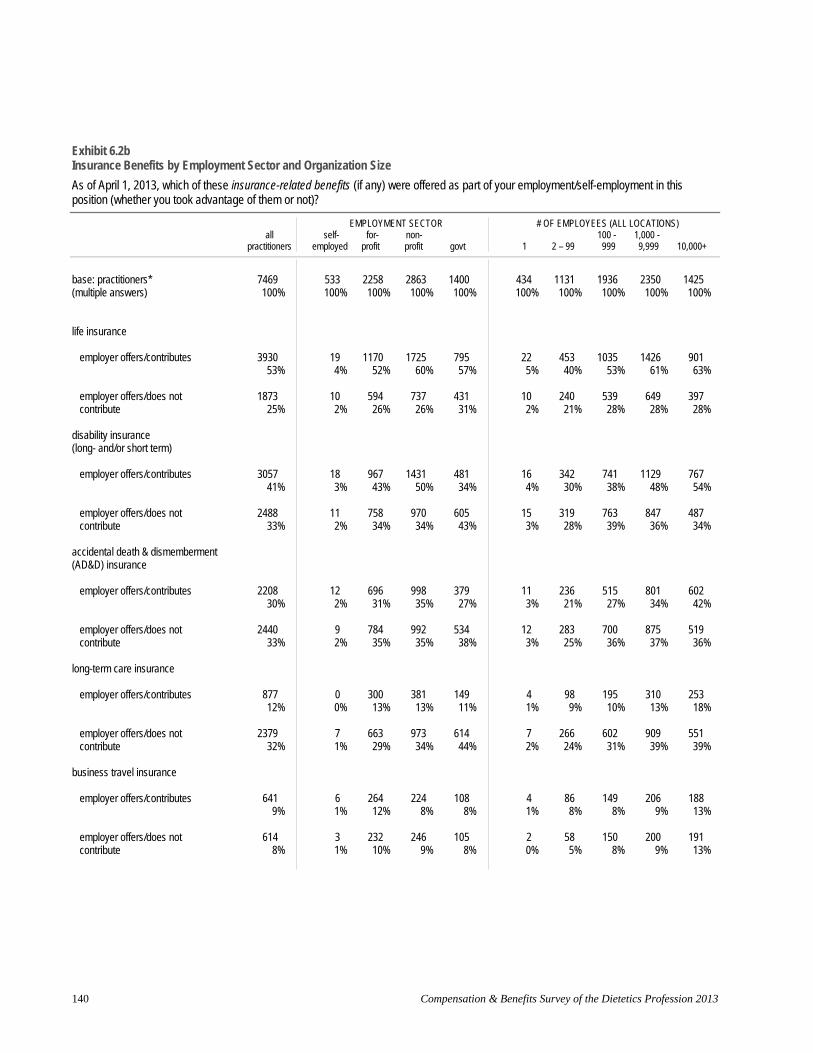
Exhibit 6.2b Insurance Benefits by Employment Sector and Organization Size
As of April 1, 2013, which of these insurance-related benefits (if any) were offered as part of your employment/self-employment in this position (whether you took advantage of them or not)?
all self- EMPLOYMENT SECTOR
for non- # OF EMPLOYEES (ALL LOCATIONS)
100 1,000 - practitioners employed profit profit govt 1 2 – 99 999 9,999 10,000+
base: practitioners* (multiple answers)
life insurance
employer offers/contributes
employer offers/does not contribute
disability insurance (long- and/or short term)
employer offers/contributes
employer offers/does not contribute
accidental death & dismemberment (AD&D) insurance
employer offers/contributes
employer offers/does notcontribute
long-term care insurance
employer offers/contributes
employer offers/does notcontribute
business travel insurance
employer offers/contributes
employer offers/does notcontribute
7469 533 2258 2863 1400 434 1131 1936 2350 1425 100% 100% 100% 100% 100% 100% 100% 100% 100% 100%
3930 19 1170 1725 795 22 453 1035 1426 901 53% 4% 52% 60% 57% 5% 40% 53% 61% 63%
1873 10 594 737 431 10 240 539 649 397 25% 2% 26% 26% 31% 2% 21% 28% 28% 28%
3057 18 967 1431 481 16 342 741 1129 767 41% 3% 43% 50% 34% 4% 30% 38% 48% 54%
2488 11 758 970 605 15 319 763 847 487 33% 2% 34% 34% 43% 3% 28% 39% 36% 34%
2208 12 696 998 379 11 236 515 801 602 30% 2% 31% 35% 27% 3% 21% 27% 34% 42%
2440 9 784 992 534 12 283 700 875 519 33% 2% 35% 35% 38% 3% 25% 36% 37% 36%
877 0 300 381 149 4 98 195 310 253 12% 0% 13% 13% 11% 1% 9% 10% 13% 18%
2379 7 663 973 614 7 266 602 909 551 32% 1% 29% 34% 44% 2% 24% 31% 39% 39%
641 6 264 224 108 4 86 149 206 188 9% 1% 12% 8% 8% 1% 8% 8% 9% 13%
614 3 232 246 105 2 58 150 200 191 8% 1% 10% 9% 8% 0% 5% 8% 9% 13%
Compensation & Benefits Survey of the Dietetics Profession 2013 140
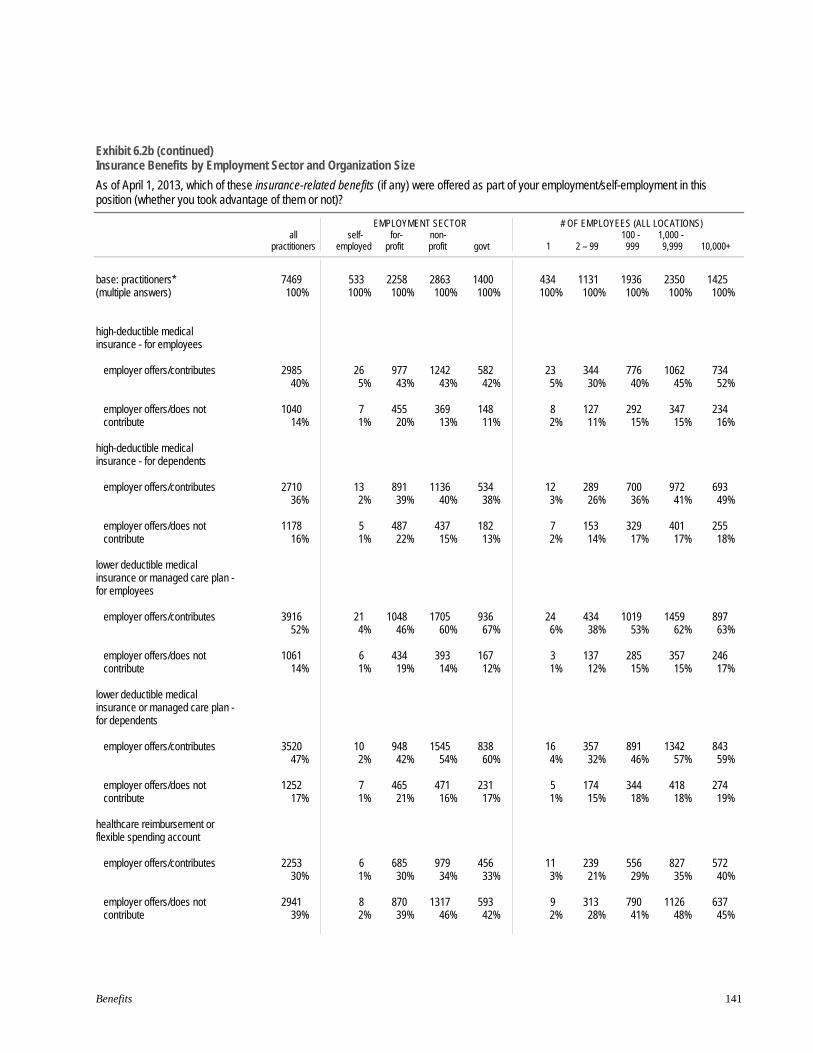
Exhibit 6.2b (continued) Insurance Benefits by Employment Sector and Organization Size
As of April 1, 2013, which of these insurance-related benefits (if any) were offered as part of your employment/self-employment in this position (whether you took advantage of them or not)?
all self- EMPLOYMENT SECTOR
for non- # OF EMPLOYEES (ALL LOCATIONS)
100 1,000 - practitioners employed profit profit govt 1 2 – 99 999 9,999 10,000+
base: practitioners* 7469 533 2258 2863 1400 434 1131 1936 2350 1425 (multiple answers) 100% 100% 100% 100% 100% 100% 100% 100% 100% 100%
high-deductible medical insurance - for employees
employer offers/contributes 2985 40%
265%
977 43%
1242 43%
582 42%
235%
344 30%
776 40%
1062 45%
734 52%
employer offers/does not contribute
1040 14%
7 1%
455 20%
369 13%
148 11%
8 2%
127 11%
292 15%
347 15%
234 16%
high-deductible medical insurance - for dependents
employer offers/contributes 2710 36%
132%
891 39%
1136 40%
534 38%
123%
289 26%
700 36%
972 41%
693 49%
employer offers/does not contribute
1178 16%
5 1%
487 22%
437 15%
182 13%
7 2%
153 14%
329 17%
401 17%
255 18%
lower deductible medical insurance or managed care plan for employees
employer offers/contributes 3916 52%
214%
1048 46%
1705 60%
936 67%
24 6%
434 38%
1019 53%
1459 62%
897 63%
employer offers/does not 1061 6 434 393 167 3 137 285 357 246 contribute 14% 1% 19% 14% 12% 1% 12% 15% 15% 17%
lower deductible medical insurance or managed care plan for dependents
employer offers/contributes 3520 47%
102%
948 42%
1545 54%
838 60%
164%
357 32%
891 46%
1342 57%
843 59%
employer offers/does not contribute
1252 17%
7 1%
465 21%
471 16%
231 17%
5 1%
174 15%
344 18%
418 18%
274 19%
healthcare reimbursement or flexible spending account
employer offers/contributes 2253 6 685 979 456 11 239 556 827 572 30% 1% 30% 34% 33% 3% 21% 29% 35% 40%
employer offers/does not contribute
2941 39%
8 2%
870 39%
1317 46%
593 42%
9 2%
313 28%
790 41%
1126 48%
637 45%
Benefits 141

Exhibit 6.2b (continued) Insurance Benefits by Employment Sector and Organization Size
As of April 1, 2013, which of these insurance-related benefits (if any) were offered as part of your employment/self-employment in this position (whether you took advantage of them or not)?
EMPLOYMENT SECTOR # OF EMPLOYEES (ALL LOCATIONS) all self- for non- 100 1,000 -
practitioners employed profit profit govt 1 2 – 99 999 9,999 10,000+
base: practitioners* 7469 533 2258 2863 1400 434 1131 1936 2350 1425 (multiple answers) 100% 100% 100% 100% 100% 100% 100% 100% 100% 100%
retiree medical coverage
employer offers/contributes 1179 16%
1 0%
1949%
370 13%
554 40%
6 1%
149 289 414 298 13% 15% 18% 21%
employer offers/does not 1002 2 249 376 324 2 116 246 402 221 contribute 13% 0% 11% 13% 23% 0% 10% 13% 17% 16%
dental insurance or group plan for employees
employer offers/contributes 4016 54%
234%
1137 50%
1784 62%
842 60%
26 6%
497 1070 1429 907 44% 55% 61% 64%
employer offers/does not contribute
1986 27%
112%
704 31%
756 26%
414 30%
143%
247 580 697 401 22% 30% 30% 28%
dental insurance or group plan for dependents
employer offers/contributes 3560 48%
12 2%
1018 45%
1587 55%
742 53%
15 3%
405 922 1294 848 36% 48% 55% 60%
employer offers/does not contribute
2136 29%
9 2%
717 32%
838 29%
461 33%
133%
270 639 748 414 24% 33% 32% 29%
prescription drug benefit
employer offers/contributes 3764 50%
22 4%
1045 46%
1642 57%
841 60%
25 6%
454 985 1360 865 40% 51% 58% 61%
employer offers/does not contribute
1755 23%
7 1%
620 27%
720 25%
318 23%
9 2%
211 490 628 375 19% 25% 27% 26%
vision insurance or group plan
employer offers/contributes 3482 47%
17 3%
1021 45%
1520 53%
727 52%
21 5%
417 884 1260 830 37% 46% 54% 58%
employer offers/does not contribute
2105 28%
7 1%
701 31%
851 30%
440 31%
123%
248 595 759 439 22% 31% 32% 31%
* "practitioners" excludes those not currently in dietetics
Compensation & Benefits Survey of the Dietetics Profession 2013 142
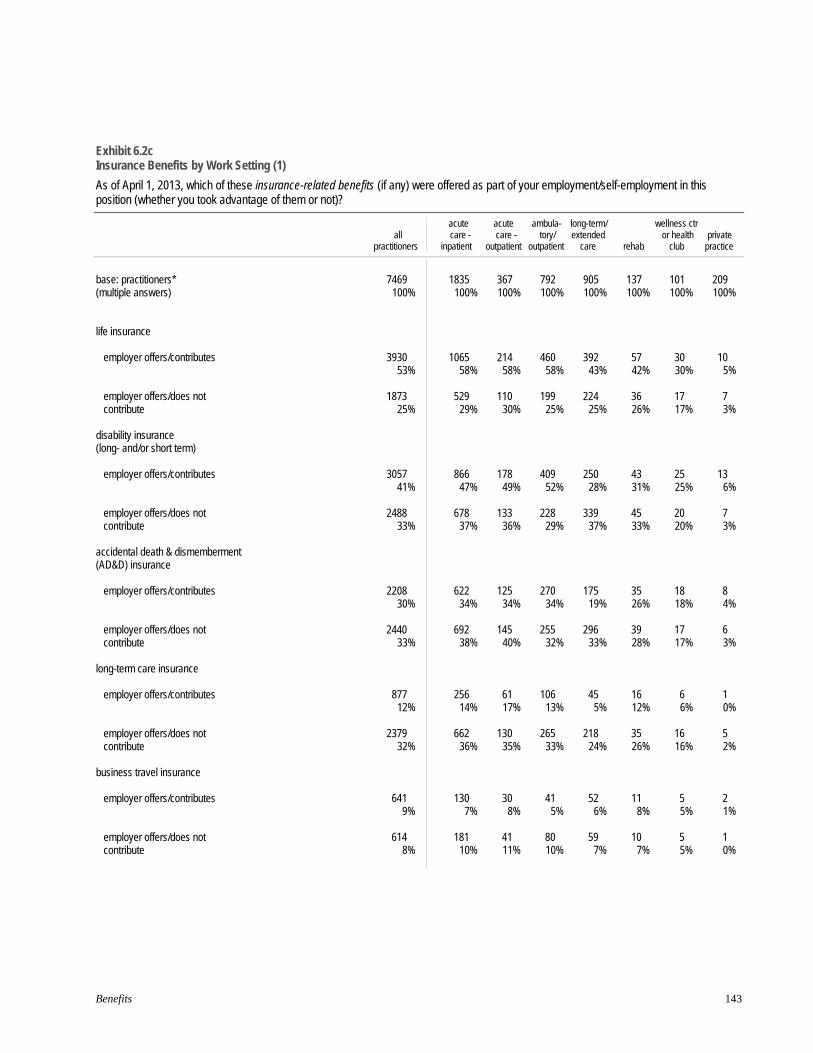
Exhibit 6.2c Insurance Benefits by Work Setting (1)
As of April 1, 2013, which of these insurance-related benefits (if any) were offered as part of your employment/self-employment in this position (whether you took advantage of them or not)?
acute acute ambula- long-term/ wellness ctr all care - care - tory/ extended or health private
practitioners inpatient outpatient outpatient care rehab club practice
base: practitioners* (multiple answers)
life insurance
employer offers/contributes
employer offers/does not contribute
disability insurance (long- and/or short term)
employer offers/contributes
employer offers/does not contribute
accidental death & dismemberment (AD&D) insurance
employer offers/contributes
employer offers/does notcontribute
long-term care insurance
employer offers/contributes
employer offers/does notcontribute
business travel insurance
employer offers/contributes
employer offers/does not contribute
7469 1835 367 792 905 137 101 209 100% 100% 100% 100% 100% 100% 100% 100%
3930 1065 214 460 392 57 30 10 53% 58% 58% 58% 43% 42% 30% 5%
1873 529 110 199 224 36 17 7 25% 29% 30% 25% 25% 26% 17% 3%
3057 866 178 409 250 43 25 13 41% 47% 49% 52% 28% 31% 25% 6%
2488 678 133 228 339 45 20 7 33% 37% 36% 29% 37% 33% 20% 3%
2208 622 125 270 175 35 18 8 30% 34% 34% 34% 19% 26% 18% 4%
2440 692 145 255 296 39 17 6 33% 38% 40% 32% 33% 28% 17% 3%
877 256 61 106 45 16 6 1 12% 14% 17% 13% 5% 12% 6% 0%
2379 662 130 265 218 35 16 5 32% 36% 35% 33% 24% 26% 16% 2%
641 130 30 41 52 11 5 2 9% 7% 8% 5% 6% 8% 5% 1%
614 181 41 80 59 10 5 1 8% 10% 11% 10% 7% 7% 5% 0%
Benefits 143

Exhibit 6.2c (continued) Insurance Benefits by Work Setting (1)
As of April 1, 2013, which of these insurance-related benefits (if any) were offered as part of your employment/self-employment in this position (whether you took advantage of them or not)?
acute acute ambula- long-term/ wellness ctr all care - care - tory/ extended or health private
practitioners inpatient outpatient outpatient care rehab club practice
base: practitioners* 7469 1835 367 792 905 137 101 209 (multiple answers) 100% 100% 100% 100% 100% 100% 100% 100%
high-deductible medical insurance - for employees
employer offers/contributes 2985 40%
790 43%
163 44%
366 46%
327 36%
50 36%
27 27%
15 7%
employer offers/does not contribute
1040 14%
322 18%
50 14%
114 14%
142 16%
31 23%
10 10%
4 2%
high-deductible medical insurance - for dependents
employer offers/contributes 2710 36%
743 40%
150 41%
346 44%
287 32%
46 34%
22 22%
11 5%
employer offers/does not contribute
1178 16%
348 19%
57 16%
118 15%
154 17%
33 24%
11 11%
2 1%
lower deductible medical insurance or managed care plan for employees
employer offers/contributes 3916 52%
1048 57%
224 61%
457 58%
352 39%
55 40%
28 28%
9 4%
employer offers/does not 1061 318 51 122 141 30 13 3 contribute 14% 17% 14% 15% 16% 22% 13% 1%
lower deductible medical insurance or managed care plan for dependents
employer offers/contributes 3520 47%
971 53%
208 57%
424 54%
310 34%
48 35%
25 25%
5 2%
employer offers/does not contribute
1252 17%
359 20%
57 16%
134 17%
142 16%
30 22%
13 13%
3 1%
healthcare reimbursement or flexible spending account
employer offers/contributes 2253 608 131 273 170 39 21 3 30% 33% 36% 34% 19% 28% 21% 1%
employer offers/does not contribute
2941 39%
909 50%
170 46%
346 44%
286 32%
44 32%
20 20%
4 2%
Compensation & Benefits Survey of the Dietetics Profession 2013 144

Exhibit 6.2c (continued) Insurance Benefits by Work Setting (1)
As of April 1, 2013, which of these insurance-related benefits (if any) were offered as part of your employment/self-employment in this position (whether you took advantage of them or not)?
acute acute ambula- long-term/ wellness ctr all
practitioners care -
inpatient care - tory/
outpatient outpatient extended
care or health
rehab club private
practice
base: practitioners* 7469 1835 367 792 905 137 101 209 (multiple answers) 100% 100% 100% 100% 100% 100% 100% 100%
retiree medical coverage
employer offers/contributes 1179 16%
229 12%
53 14%
106 13%
76 8%
12 8 9% 8%
2 1%
employer offers/does not 1002 251 51 106 70 18 7 1 contribute 13% 14% 14% 13% 8% 13% 7% 0%
dental insurance or group plan for employees
employer offers/contributes 4016 54%
1053 57%
222 60%
453 57%
391 43%
64 33 47% 33%
11 5%
employer offers/does not contribute
1986 27%
576 31%
97 26%
222 28%
267 30%
45 19 33% 19%
5 2%
dental insurance or group plan for dependents
employer offers/contributes 3560 48%
956 52%
199 54%
420 53%
332 37%
59 31 43% 31%
6 3%
employer offers/does not contribute
2136 29%
603 33%
108 29%
227 29%
278 31%
43 18 31% 18%
4 2%
prescription drug benefit
employer offers/contributes 3764 50%
976 53%
206 56%
451 57%
353 39%
59 26 43% 26%
11 5%
employer offers/does not contribute
1755 23%
553 30%
96 26%
181 23%
209 23%
42 17 31% 17%
3 1%
vision insurance or group plan
employer offers/contributes 3482 47%
927 51%
188 51%
420 53%
332 37%
54 30 39% 30%
9 4%
employer offers/does not contribute
2105 28%
634 35%
115 31%
221 28%
248 27%
42 18 31% 18%
3 1%
* "practitioners" excludes those not currently in dietetics
Benefits 145

Exhibit 6.2d Insurance Benefits by Work Setting (2)
As of April 1, 2013, which of these insurance-related benefits (if any) were offered as part of your employment/self-employment in this position (whether you took advantage of them or not)?
all practitioners
govt c agency/ pu dept
ommunity/ blic health program
nonprofit agency/
organization faculty
foodmfr/dist/ retailer
K-12 food
service
food mgmt
company
7469 442 545 261 439 97 166 111 100% 100% 100% 100% 100% 100% 100% 100%
3930 243 293 147 243 53 109 77 53% 55% 54% 56% 55% 55% 66% 69%
1873 133 146 57 102 28 36 24 25% 30% 27% 22% 23% 29% 22% 22%
3057 131 192 134 196 50 69 59 41% 30% 35% 51% 45% 52% 42% 53%
2488 193 217 70 137 27 67 41 33% 44% 40% 27% 31% 28% 40% 37%
2208 116 118 84 157 40 54 54 30% 26% 22% 32% 36% 41% 33% 49%
2440 167 209 70 135 31 51 42 33% 38% 38% 27% 31% 32% 31% 38%
877 47 56 32 60 16 12 19 12% 11% 10% 12% 14% 16% 7% 17%
2379 194 187 65 172 29 64 28 32% 44% 34% 25% 39% 30% 39% 25%
641 38 37 27 62 27 6 31 9% 9% 7% 10% 14% 28% 4% 28%
614 27 40 13 46 12 15 15 8% 6% 7% 5% 10% 12% 9% 14%
base: practitioners* (multiple answers)
life insurance
employer offers/contributes
employer offers/does not contribute
disability insurance (long- and/or short term)
employer offers/contributes
employer offers/does not contribute
accidental death & dismemberment (AD&D) insurance
employer offers/contributes
employer offers/does notcontribute
long-term care insurance
employer offers/contributes
employer offers/does notcontribute
business travel insurance
employer offers/contributes
employer offers/does notcontribute
Compensation & Benefits Survey of the Dietetics Profession 2013 146
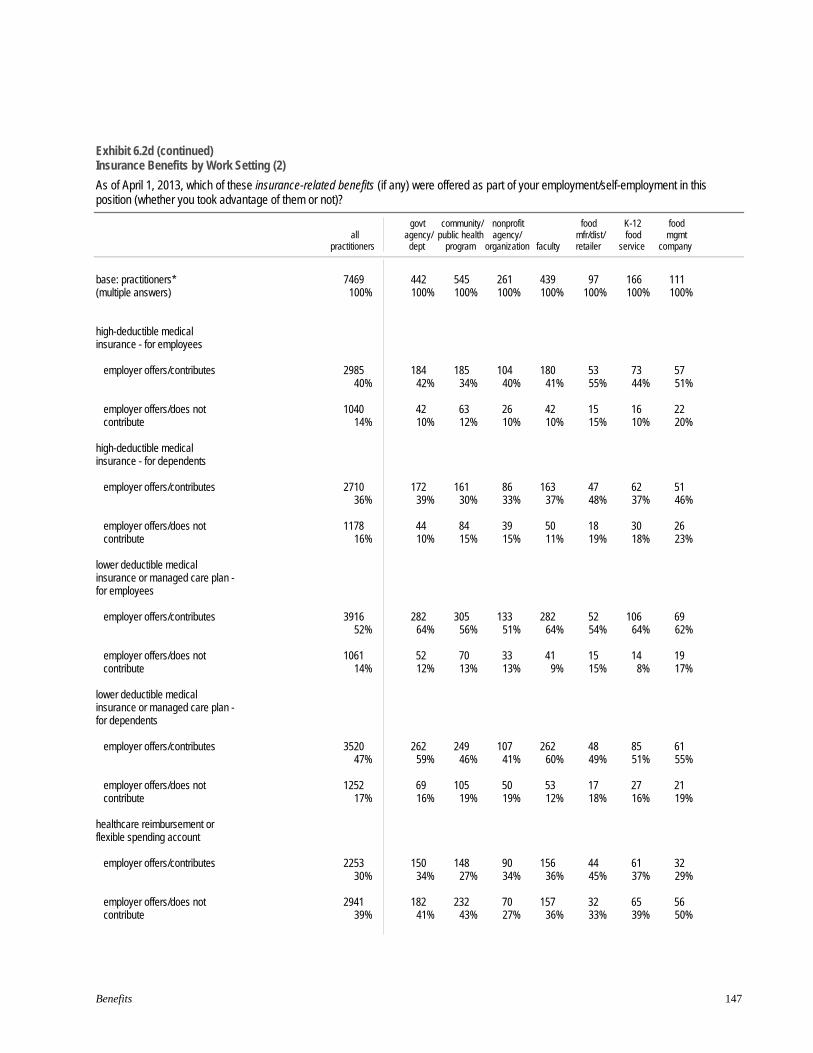
Exhibit 6.2d (continued) Insurance Benefits by Work Setting (2)
As of April 1, 2013, which of these insurance-related benefits (if any) were offered as part of your employment/self-employment in this position (whether you took advantage of them or not)?
all
practitioners
govt c agency/ pu dept
ommunity/ blic health program
nonprofit agency/
organization faculty
foodmfr/dist/ retailer
K-12 food
service
food mgmt
company
base: practitioners* 7469 442 545 261 439 97 166 111 (multiple answers) 100% 100% 100% 100% 100% 100% 100% 100%
high-deductible medical insurance - for employees
employer offers/contributes 2985 40%
184 42%
185 34%
104 40%
180 41%
53 55%
73 44%
57 51%
employer offers/does not contribute
1040 14%
4210%
63 12%
26 10%
42 10%
15 15%
16 10%
22 20%
high-deductible medical insurance - for dependents
employer offers/contributes 2710 36%
172 39%
161 30%
86 33%
163 37%
47 48%
62 37%
51 46%
employer offers/does not contribute
1178 16%
4410%
84 15%
39 15%
50 11%
18 19%
30 18%
26 23%
lower deductible medical insurance or managed care plan for employees
employer offers/contributes 3916 52%
28264%
305 56%
133 51%
282 64%
52 54%
106 64%
69 62%
employer offers/does not 1061 52 70 33 41 15 14 19 contribute 14% 12% 13% 13% 9% 15% 8% 17%
lower deductible medical insurance or managed care plan for dependents
employer offers/contributes 3520 47%
262 59%
249 46%
107 41%
262 60%
48 49%
85 51%
61 55%
employer offers/does not contribute
1252 17%
69 16%
105 19%
50 19%
53 12%
17 18%
27 16%
21 19%
healthcare reimbursement or flexible spending account
employer offers/contributes 2253 150 148 90 156 44 61 32 30% 34% 27% 34% 36% 45% 37% 29%
employer offers/does not contribute
2941 39%
182 41%
232 43%
70 27%
157 36%
32 33%
65 39%
56 50%
Benefits 147

Exhibit 6.2d (continued) Insurance Benefits by Work Setting (2)
As of April 1, 2013, which of these insurance-related benefits (if any) were offered as part of your employment/self-employment in this position (whether you took advantage of them or not)?
govt community/ nonprofit food K-12 food all
practitioners agency/ public health agency/ dept program organization faculty
mfr/dist/ retailer
food service
mgmt company
base: practitioners* 7469 442 545 261 439 97 166 111 (multiple answers) 100% 100% 100% 100% 100% 100% 100% 100%
retiree medical coverage
employer offers/contributes 1179 16%
175 40%
132 24%
19 7%
127 29%
16 16%
52 31%
5 5%
employer offers/does not 1002 100 89 24 94 18 40 10 contribute 13% 23% 16% 9% 21% 19% 24% 9%
dental insurance or group plan for employees
employer offers/contributes 4016 54%
26961%
309 57%
150 57%
258 59%
58 60%
110 66%
69 62%
employer offers/does not contribute
1986 27%
128 29%
146 27%
59 23%
95 22%
22 23%
41 25%
33 30%
dental insurance or group plan for dependents
employer offers/contributes 3560 48%
236 53%
247 45%
121 46%
241 55%
53 55%
92 55%
63 57%
employer offers/does not contribute
2136 29%
134 30%
179 33%
78 30%
104 24%
23 24%
50 30%
38 34%
prescription drug benefit
employer offers/contributes 3764 50%
25457%
296 54%
126 48%
258 59%
54 56%
108 65%
63 57%
employer offers/does not contribute
1755 23%
95 21%
127 23%
52 20%
78 18%
22 23%
31 19%
37 33%
vision insurance or group plan
employer offers/contributes 3482 47%
226 51%
260 48%
126 48%
214 49%
53 55%
87 52%
66 59%
employer offers/does not contribute
2105 28%
138 31%
159 29%
65 25%
109 25%
24 25%
45 27%
36 32%
* "practitioners" excludes those not currently in dietetics
Compensation & Benefits Survey of the Dietetics Profession 2013 148
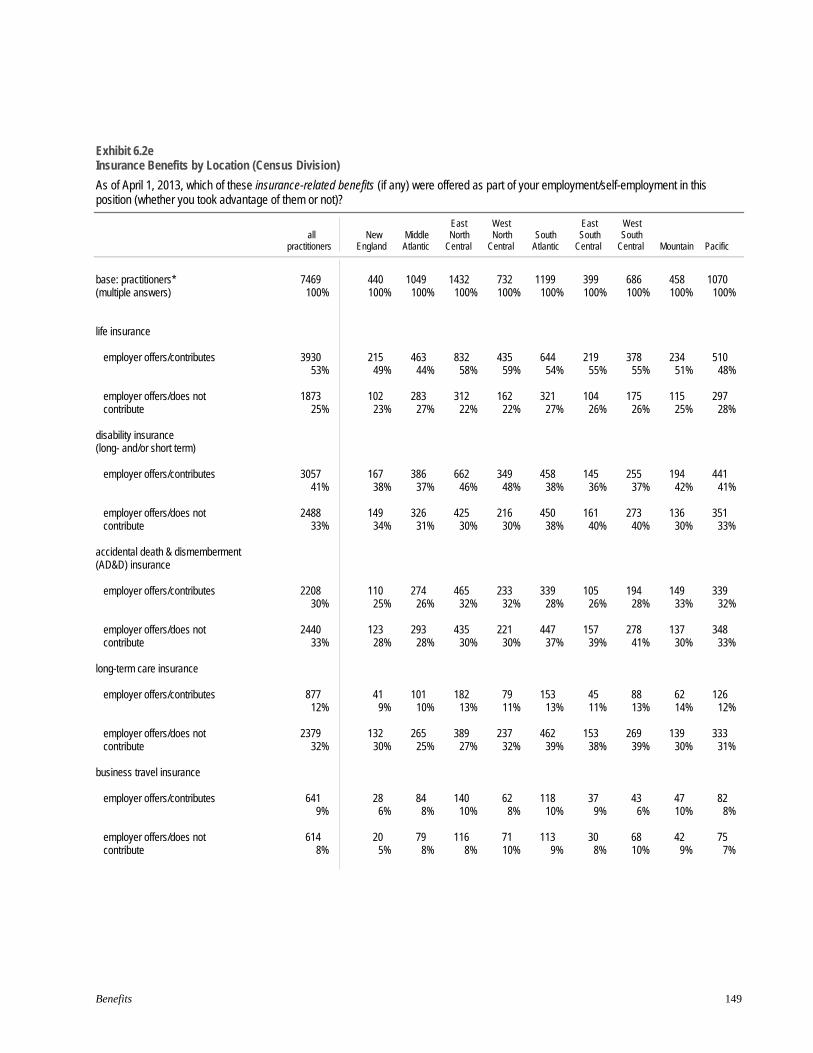
Exhibit 6.2e Insurance Benefits by Location (Census Division)
As of April 1, 2013, which of these insurance-related benefits (if any) were offered as part of your employment/self-employment in this position (whether you took advantage of them or not)?
all practitioners
New England
Middle Atlantic
East North
Central
West North
Central South Atlantic
East South Central
West South
Central Mountain Pacific
7469 440 1049 1432 732 1199 399 686 458 1070 100% 100% 100% 100% 100% 100% 100% 100% 100% 100%
3930 215 463 832 435 644 219 378 234 510 53% 49% 44% 58% 59% 54% 55% 55% 51% 48%
1873 102 283 312 162 321 104 175 115 297 25% 23% 27% 22% 22% 27% 26% 26% 25% 28%
3057 167 386 662 349 458 145 255 194 441 41% 38% 37% 46% 48% 38% 36% 37% 42% 41%
2488 149 326 425 216 450 161 273 136 351 33% 34% 31% 30% 30% 38% 40% 40% 30% 33%
2208 110 274 465 233 339 105 194 149 339 30% 25% 26% 32% 32% 28% 26% 28% 33% 32%
2440 123 293 435 221 447 157 278 137 348 33% 28% 28% 30% 30% 37% 39% 41% 30% 33%
877 41 101 182 79 153 45 88 62 126 12% 9% 10% 13% 11% 13% 11% 13% 14% 12%
2379 132 265 389 237 462 153 269 139 333 32% 30% 25% 27% 32% 39% 38% 39% 30% 31%
641 28 84 140 62 118 37 43 47 82 9% 6% 8% 10% 8% 10% 9% 6% 10% 8%
614 20 79 116 71 113 30 68 42 75 8% 5% 8% 8% 10% 9% 8% 10% 9% 7%
base: practitioners* (multiple answers)
life insurance
employer offers/contributes
employer offers/does not contribute
disability insurance (long- and/or short term)
employer offers/contributes
employer offers/does not contribute
accidental death & dismemberment (AD&D) insurance
employer offers/contributes
employer offers/does notcontribute
long-term care insurance
employer offers/contributes
employer offers/does notcontribute
business travel insurance
employer offers/contributes
employer offers/does notcontribute
Benefits 149

Exhibit 6.2e (continued) Insurance Benefits by Location (Census Division)
As of April 1, 2013, which of these insurance-related benefits (if any) were offered as part of your employment/self-employment in this position (whether you took advantage of them or not)?
all
practitioners New
England Middle
Atlantic
East North
Central
West North
Central South Atlantic
East South Central
West South
Central Mountain Pacific
base: practitioners* 7469 440 1049 1432 732 1199 399 686 458 1070 (multiple answers) 100% 100% 100% 100% 100% 100% 100% 100% 100% 100%
high-deductible medical insurance - for employees
employer offers/contributes 2985 40%
16638%
323 31%
610 43%
326 45%
508 42%
156 39%
283 41%
214 47%
399 37%
employer offers/does not contribute
1040 14%
54 12%
160 15%
184 13%
99 14%
200 17%
69 17%
112 16%
60 13%
102 10%
high-deductible medical insurance - for dependents
employer offers/contributes 2710 36%
15736%
296 28%
573 40%
293 40%
456 38%
136 34%
246 36%
193 42%
360 34%
employer offers/does not contribute
1178 16%
5112%
157 15%
190 13%
121 17%
229 19%
81 20%
141 21%
72 16%
136 13%
lower deductible medical insurance or managed care plan for employees
employer offers/contributes 3916 52%
21148%
492 47%
748 52%
422 58%
612 51%
201 50%
342 50%
247 54%
639 60%
employer offers/does not 1061 56 155 186 93 210 77 118 58 108 contribute 14% 13% 15% 13% 13% 18% 19% 17% 13% 10%
lower deductible medical insurance or managed care plan for dependents
employer offers/contributes 3520 47%
20246%
459 44%
682 48%
374 51%
547 46%
177 44%
301 44%
224 49%
553 52%
employer offers/does not contribute
1252 17%
5913%
150 14%
202 14%
128 17%
240 20%
90 23%
151 22%
75 16%
156 15%
healthcare reimbursement or flexible spending account
employer offers/contributes 2253 120 251 490 257 362 115 162 161 335 30% 27% 24% 34% 35% 30% 29% 24% 35% 31%
employer offers/does not contribute
2941 39%
18141%
400 38%
538 38%
299 41%
494 41%
172 43%
296 43%
157 34%
404 38%
Compensation & Benefits Survey of the Dietetics Profession 2013 150
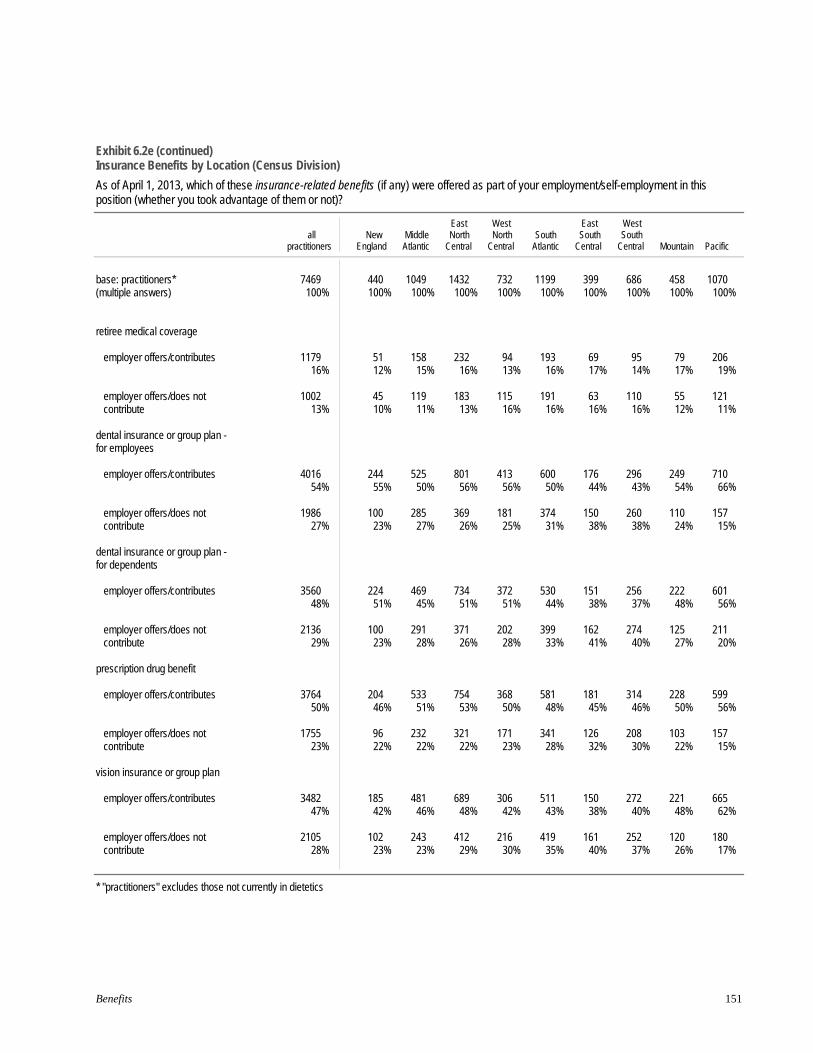
Exhibit 6.2e (continued) Insurance Benefits by Location (Census Division)
As of April 1, 2013, which of these insurance-related benefits (if any) were offered as part of your employment/self-employment in this position (whether you took advantage of them or not)?
East West East West all New Middle North North South South South
practitioners England Atlantic Central Central Atlantic Central Central Mountain Pacific
base: practitioners* 7469 440 1049 1432 732 1199 399 686 458 1070 (multiple answers) 100% 100% 100% 100% 100% 100% 100% 100% 100% 100%
retiree medical coverage
employer offers/contributes 1179 16%
51 12%
158 15%
232 16%
94 13%
193 16%
69 17%
95 14%
79 17%
206 19%
employer offers/does not 1002 45 119 183 115 191 63 110 55 121 contribute 13% 10% 11% 13% 16% 16% 16% 16% 12% 11%
dental insurance or group plan for employees
employer offers/contributes 4016 54%
24455%
525 50%
801 56%
413 56%
600 50%
176 44%
296 43%
249 54%
710 66%
employer offers/does not contribute
1986 27%
10023%
285 27%
369 26%
181 25%
374 31%
150 38%
260 38%
110 24%
157 15%
dental insurance or group plan for dependents
employer offers/contributes 3560 48%
22451%
469 45%
734 51%
372 51%
530 44%
151 38%
256 37%
222 48%
601 56%
employer offers/does not contribute
2136 29%
10023%
291 28%
371 26%
202 28%
399 33%
162 41%
274 40%
125 27%
211 20%
prescription drug benefit
employer offers/contributes 3764 50%
20446%
533 51%
754 53%
368 50%
581 48%
181 45%
314 46%
228 50%
599 56%
employer offers/does not contribute
1755 23%
9622%
232 22%
321 22%
171 23%
341 28%
126 32%
208 30%
103 22%
157 15%
vision insurance or group plan
employer offers/contributes 3482 47%
18542%
481 46%
689 48%
306 42%
511 43%
150 38%
272 40%
221 48%
665 62%
employer offers/does not contribute
2105 28%
10223%
243 23%
412 29%
216 30%
419 35%
161 40%
252 37%
120 26%
180 17%
* "practitioners" excludes those not currently in dietetics
Benefits 151

Exhibit 6.3a Other Benefits by Registration Status and Full-Time Status
As of April 1, 2013, which of these other benefits were offered as part of your employment/self-employment in this position (whether you took advantage of them or not)?
all practitioners RD
REGIST ST
DTR
RATION ATUS
not
FULL TIME?
yes no
7469 6523 866 80 5329 1543 100% 100% 100% 100% 100% 100%
6337 5496 776 65 5114 932 85% 84% 90% 81% 96% 60%
6132 5325 750 57 4974 892 82% 82% 87% 71% 93% 58%
5378 4647 669 62 4429 705 72% 71% 77% 78% 83% 46%
5106 4433 614 59 4218 670 68% 68% 71% 74% 79% 43%
5446 4810 585 51 4378 825 73% 74% 68% 64% 82% 53%
4078 3667 372 39 3313 600 55% 56% 43% 49% 62% 39%
3441 3011 398 32 2850 451 46% 46% 46% 40% 53% 29%
2328 2095 207 26 1920 310 31% 32% 24% 33% 36% 20%
1472 1370 82 20 1239 174 20% 21% 9% 25% 23% 11%
409 361 43 5 347 48 5% 6% 5% 6% 7% 3%
182 154 26 2 160 10 2% 2% 3% 3% 3% 1%
6564 5729 769 66 5060 1155 88% 88% 89% 83% 95% 75%
4645 4034 572 39 3601 798 62% 62% 66% 49% 68% 52%
3990 3525 440 25 3253 584 53% 54% 51% 31% 61% 38%
base: practitioners* (multiple answers)
NET: paid time off
paid vacation, personal time off
paid holidays
paid sick days
NET: professional/career development
funding/time off for professional development (conferences, seminars, etc.)
college tuition assistance for employees
professional registration or licensure fees
professional society dues
sign-on bonuses
paid dietetic internship
NET: quality of work life
on-site parking
employee assistance program
Compensation & Benefits Survey of the Dietetics Profession 2013 152

Exhibit 6.3a (continued) Other Benefits by Registration Status and Full-Time Status
As of April 1, 2013, which of these other benefits were offered as part of your employment/self-employment in this position (whether you took advantage of them or not)?
all practitioners RD
REGIST ST
DTR
RATION ATUS
not
FULL TIME?
yes no
7469 6523 866 80 5329 1543 100% 100% 100% 100% 100% 100%
3795 3311 447 37 3012 619 51% 51% 52% 46% 57% 40%
3678 3196 450 32 2986 532 49% 49% 52% 40% 56% 34%
3157 2787 344 26 2531 482 42% 43% 40% 33% 47% 31%
3004 2707 275 22 2491 408 40% 41% 32% 28% 47% 26%
2991 2585 368 38 2483 386 40% 40% 42% 48% 47% 25%
2575 2257 288 30 2054 410 34% 35% 33% 38% 39% 27%
2399 2097 276 26 1947 339 32% 32% 32% 33% 37% 22%
1755 1554 186 15 1446 245 23% 24% 21% 19% 27% 16%
943 873 58 12 757 141 13% 13% 7% 15% 14% 9%
718 622 89 7 579 100 10% 10% 10% 9% 11% 6%
686 615 67 4 575 83 9% 9% 8% 5% 11% 5%
611 556 53 2 505 73 8% 9% 6% 3% 9% 5%
593 527 61 5 506 62 8% 8% 7% 6% 9% 4%
577 503 68 6 466 93 8% 8% 8% 8% 9% 6%
base: practitioners* (multiple answers)
unpaid personal leave
wellness program
fitness benefit (e.g., discounted health club membership,
on-site facilities)
tax-advantaged dependent care reimbursement or flexible spending account
extended and/or paid parental leave
car allowance, mileage, orcommuting subsidy
comp time or flex time
financial planning assistance
telecommuting
child care subsidy or on-site facility
adoption assistance
tuition assistance - for dependents
stock options, ESOP (Employee Stock Ownership Plan)
profit sharing
Benefits 153

Exhibit 6.3a (continued) Other Benefits by Registration Status and Full-Time Status
As of April 1, 2013, which of these other benefits were offered as part of your employment/self-employment in this position (whether you took advantage of them or not)?
all practitioners RD
REGIST ST
DTR
RATION ATUS
not
FULL TIME?
yes no
base: practitioners* (multiple answers)
7469100%
6523 100%
866 100%
80 100%
5329 100%
1543 100%
other 96 1%
911% 3
0%2 3%
71 1%
18 1%
indicated one or more 6844 92%
5954 91%
818 94%
72 90%
5229 98%
1229 80%
no benefits 535 7%
490 8%
39 5%
6 8%
75 1%
287 19%
no answer 90 1%
791% 9
1%2 3%
25 0%
27 2%
* "practitioners" excludes those not currently in dietetics
Compensation & Benefits Survey of the Dietetics Profession 2013 154
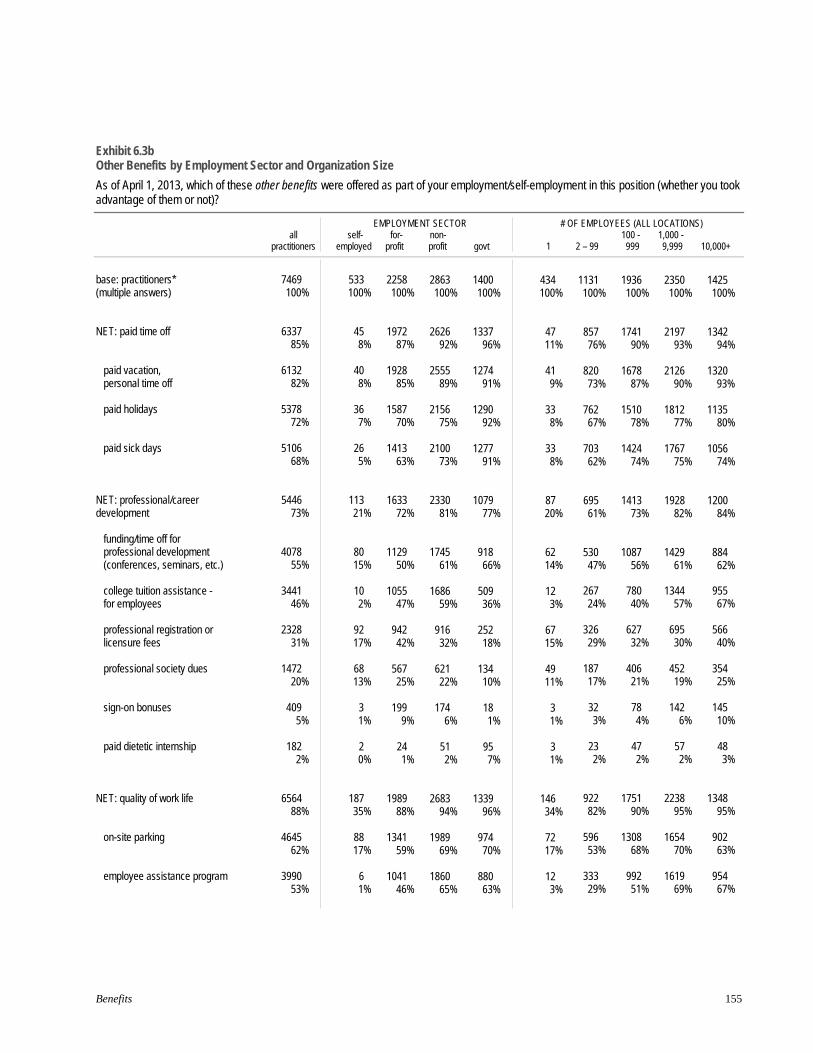
Exhibit 6.3b Other Benefits by Employment Sector and Organization Size
As of April 1, 2013, which of these other benefits were offered as part of your employment/self-employment in this position (whether you took advantage of them or not)?
all self- EMPLOYMENT SECTOR
for non- # OF EMPLOYEES (ALL LOCATIONS)
100 1,000 - practitioners employed profit profit govt 1 2 – 99 999 9,999 10,000+
base: practitioners* (multiple answers)
NET: paid time off
paid vacation, personal time off
paid holidays
paid sick days
NET: professional/career development
funding/time off for professional development
(conferences, seminars, etc.)
college tuition assistance for employees
professional registration or licensure fees
professional society dues
sign-on bonuses
paid dietetic internship
NET: quality of work life
on-site parking
employee assistance program
7469 100%
6337 85%
6132 82%
5378 72%
5106 68%
5446 73%
4078 55%
3441 46%
2328 31%
1472 20%
409 5%
182 2%
6564 88%
4645 62%
3990 53%
533100%
458%
408%
367%
26 5%
11321%
80 15%
10 2%
9217%
6813%
3 1%
2 0%
18735%
88 17%
6 1%
2258 100%
1972 87%
1928 85%
1587 70%
1413 63%
1633 72%
1129 50%
1055 47%
942 42%
567 25%
199 9%
24 1%
1989 88%
1341 59%
1041 46%
2863 100%
2626 92%
2555 89%
2156 75%
2100 73%
2330 81%
1745 61%
1686 59%
916 32%
621 22%
174 6%
51 2%
2683 94%
1989 69%
1860 65%
1400 100%
1337 96%
1274 91%
1290 92%
1277 91%
1079 77%
918 66%
509 36%
252 18%
134 10%
18 1%
95 7%
1339 96%
974 70%
880 63%
434100%
47 11%
41 9%
33 8%
33 8%
87 20%
62 14%
12 3%
6715%
4911%
3 1%
3 1%
146 34%
72 17%
12 3%
1131 1936 2350 1425 100% 100% 100% 100%
857 1741 2197 1342 76% 90% 93% 94%
820 1678 2126 1320 73% 87% 90% 93%
762 1510 1812 1135 67% 78% 77% 80%
703 1424 1767 1056 62% 74% 75% 74%
695 1413 1928 1200 61% 73% 82% 84%
530 1087 1429 884 47% 56% 61% 62%
267 780 1344 955 24% 40% 57% 67%
326 627 695 566 29% 32% 30% 40%
187 406 452 354 17% 21% 19% 25%
32 78 142 145 3% 4% 6% 10%
23 47 57 48 2% 2% 2% 3%
922 1751 2238 1348 82% 90% 95% 95%
596 1308 1654 902 53% 68% 70% 63%
333 992 1619 954 29% 51% 69% 67%
Benefits 155
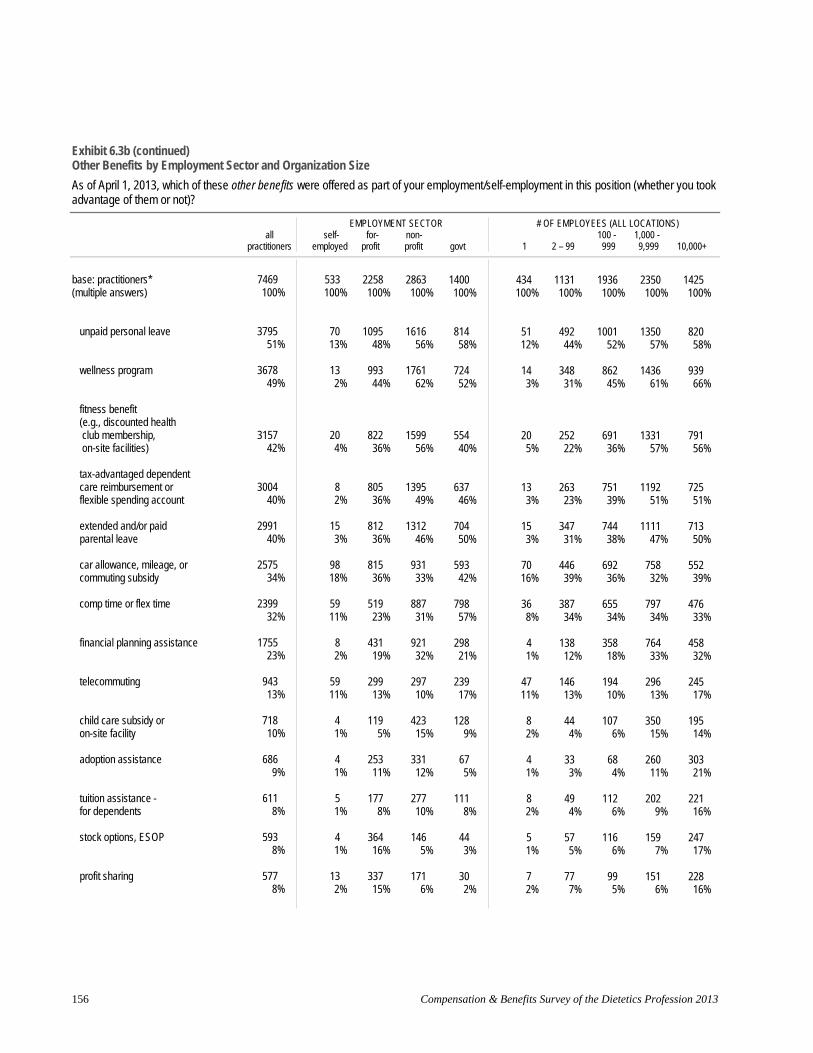
Exhibit 6.3b (continued) Other Benefits by Employment Sector and Organization Size
As of April 1, 2013, which of these other benefits were offered as part of your employment/self-employment in this position (whether you took advantage of them or not)?
all self- EMPLOYMENT SECTOR
for non- # OF EMPLOYEES (ALL LOCATIONS)
100 1,000 - practitioners employed profit profit govt 1 2 – 99 999 9,999 10,000+
base: practitioners* 7469 (multiple answers) 100%
unpaid personal leave 3795 51%
wellness program 3678 49%
fitness benefit (e.g., discounted health
club membership, 3157 on-site facilities) 42%
tax-advantaged dependent care reimbursement or 3004
flexible spending account 40%
extended and/or paid 2991 parental leave 40%
car allowance, mileage, or 2575 commuting subsidy 34%
comp time or flex time 2399 32%
financial planning assistance 1755 23%
telecommuting 943 13%
child care subsidy or 718 on-site facility 10%
adoption assistance 686 9%
tuition assistance - 611 for dependents 8%
stock options, ESOP 593 8%
profit sharing 577 8%
533100%
70 13%
13 2%
20 4%
8 2%
15 3%
98 18%
59 11%
8 2%
5911%
4 1%
4 1%
5 1%
4 1%
13 2%
2258 100%
1095 48%
993 44%
822 36%
805 36%
812 36%
815 36%
519 23%
431 19%
299 13%
119 5%
253 11%
177 8%
364 16%
337 15%
2863 100%
1616 56%
1761 62%
1599 56%
1395 49%
1312 46%
931 33%
887 31%
921 32%
297 10%
423 15%
331 12%
27710%
146 5%
171 6%
1400 100%
814 58%
724 52%
554 40%
637 46%
704 50%
593 42%
798 57%
298 21%
239 17%
128 9%
67 5%
111 8%
44 3%
30 2%
434100%
51 12%
14 3%
20 5%
13 3%
15 3%
70 16%
36 8%
4 1%
4711%
8 2%
4 1%
8 2%
5 1%
7 2%
1131 1936 2350 1425 100% 100% 100% 100%
492 1001 1350 820 44% 52% 57% 58%
348 862 1436 939 31% 45% 61% 66%
252 691 1331 791 22% 36% 57% 56%
263 751 1192 725 23% 39% 51% 51%
347 744 1111 713 31% 38% 47% 50%
446 692 758 552 39% 36% 32% 39%
387 655 797 476 34% 34% 34% 33%
138 358 764 458 12% 18% 33% 32%
146 194 296 245 13% 10% 13% 17%
44 107 350 195 4% 6% 15% 14%
33 68 260 303 3% 4% 11% 21%
49 112 202 221 4% 6% 9% 16%
57 116 159 247 5% 6% 7% 17%
77 99 151 228 7% 5% 6% 16%
Compensation & Benefits Survey of the Dietetics Profession 2013 156

Exhibit 6.3b (continued) Other Benefits by Employment Sector and Organization Size
As of April 1, 2013, which of these other benefits were offered as part of your employment/self-employment in this position (whether you took advantage of them or not)?
all practitioners
self-employed
EMPLOYMENT for
profit
SECTOR non-
profit govt
# O
1
F EMPLOY
2 – 99
EES (ALL LOCATIONS) 100 999
1,000 - 9,999 10,000+
base: practitioners* (multiple answers)
7469 100%
533100%
2258 100%
2863 100%
1400 100%
434100%
1131 100%
1936 100%
2350 100%
1425 100%
other 96 1%
4 1%
43 2%
30 1%
11 1%
5 1%
18 2%
26 1%
25 1%
20 1%
indicated one or more 6844 92%
21340%
2119 94%
2760 96%
1374 98%
172 40%
990 88%
1837 95%
2294 98%
1383 97%
no benefits 535 7%
298 56%
112 5%
75 3%
19 1%
244 56%
12311%
71 4%
45 2%
34 2%
no answer 90 1%
224%
27 1%
28 1%
7 1%
184%
18 2%
28 1%
11 0%
8 1%
* "practitioners" excludes those not currently in dietetics
Benefits 157

Exhibit 6.3c Other Benefits by Work Setting (1)
As of April 1, 2013, which of these other benefits were offered as part of your employment/self-employment in this position (whether you took advantage of them or not)?
acute acute ambula- long-term/ wellness ctr all care - care - tory/ extended or health private
practitioners inpatient outpatient outpatient care rehab club practice
base: practitioners* (multiple answers)
NET: paid time off
paid vacation, personal time off
paid holidays
paid sick days
NET: professional/career development
funding/time off for professional development (conferences, seminars, etc.)
college tuition assistance for employees
professional registration or licensure fees
professional society dues
sign-on bonuses
paid dietetic internship
NET: quality of work life
on-site parking
employee assistance program
7469 100%
6337 85%
6132 82%
5378 72%
5106 68%
5446 73%
4078 55%
3441 46%
2328 31%
1472 20%
409 5%
182 2%
6564 88%
4645 62%
3990 53%
1835100%
167291%
1643 90%
1270 69%
1273 69%
146480%
1036 56%
1112 61%
587 32%
417 23%
133 7%
47 3%
1694 92%
1280 70%
1203 66%
367 100%
336 92%
331 90%
264 72%
256 70%
298 81%
210 57%
224 61%
104 28%
61 17%
24 7%
8 2%
349 95%
256 70%
247 67%
792 100%
725 92%
713 90%
568 72%
531 67%
634 80%
483 61%
439 55%
267 34%
131 17%
84 11%
13 2%
728 92%
545 69%
496 63%
905 137 101 209 100% 100% 100% 100%
715 113 60 32 79% 82% 59% 15%
701 112 55 27 77% 82% 54% 13%
616 98 48 26 68% 72% 48% 12%
556 87 40 18 61% 64% 40% 9%
541 76 43 64 60% 55% 43% 31%
392 54 29 44 43% 39% 29% 21%
286 45 17 4 32% 33% 17% 2%
282 34 19 53 31% 25% 19% 25%
153 18 7 41 17% 13% 7% 20%
42 7 2 1 5% 5% 2% 0%
7 3 0 1 1% 2% 0% 0%
720 109 69 80 80% 80% 68% 38%
496 76 53 43 55% 55% 52% 21%
321 50 23 1 35% 36% 23% 0%
Compensation & Benefits Survey of the Dietetics Profession 2013 158
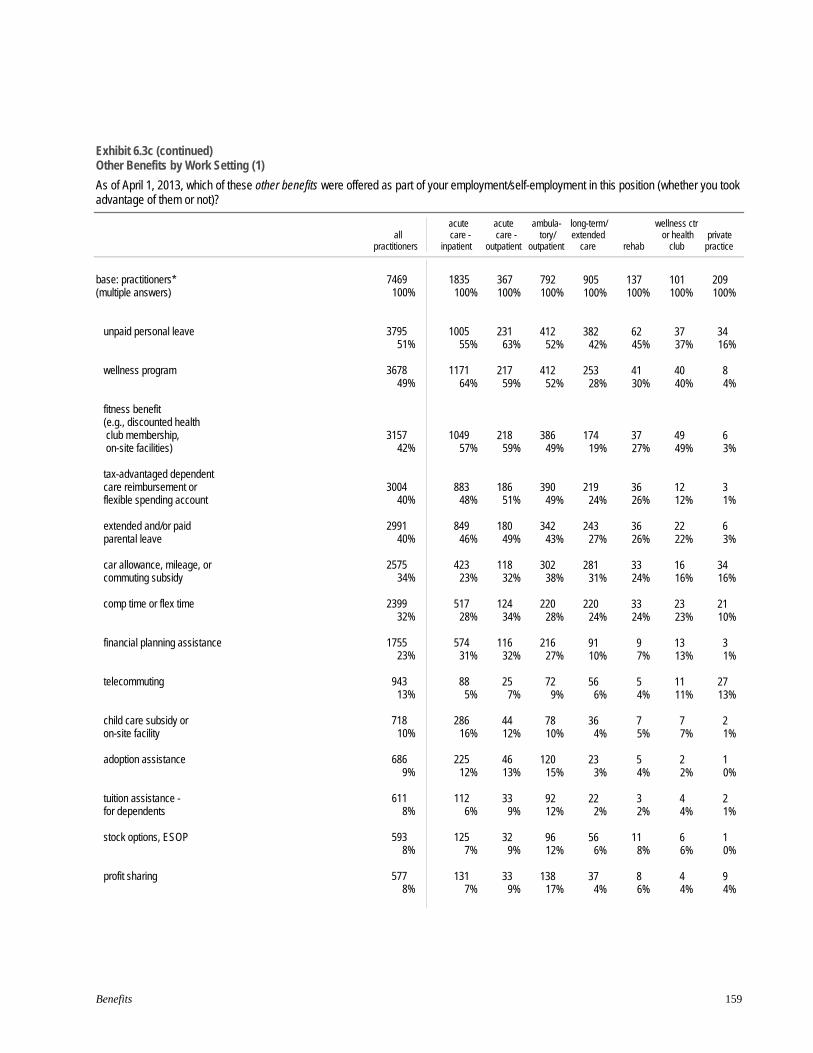
Exhibit 6.3c (continued) Other Benefits by Work Setting (1)
As of April 1, 2013, which of these other benefits were offered as part of your employment/self-employment in this position (whether you took advantage of them or not)?
acute acute ambula- long-term/ wellness ctr all care - care - tory/ extended or health private
practitioners inpatient outpatient outpatient care rehab club practice
base: practitioners* 7469 (multiple answers) 100%
unpaid personal leave 3795 51%
wellness program 3678 49%
fitness benefit (e.g., discounted health
club membership, 3157 on-site facilities) 42%
tax-advantaged dependent care reimbursement or 3004
flexible spending account 40%
extended and/or paid 2991 parental leave 40%
car allowance, mileage, or 2575 commuting subsidy 34%
comp time or flex time 2399 32%
financial planning assistance 1755 23%
telecommuting 943 13%
child care subsidy or 718 on-site facility 10%
adoption assistance 686 9%
tuition assistance - 611 for dependents 8%
stock options, ESOP 593 8%
profit sharing 577 8%
1835100%
1005 55%
1171 64%
1049 57%
883 48%
849 46%
423 23%
517 28%
574 31%
885%
286 16%
225 12%
112 6%
125 7%
131 7%
367 100%
231 63%
217 59%
218 59%
186 51%
180 49%
118 32%
124 34%
116 32%
25 7%
44 12%
46 13%
33 9%
32 9%
33 9%
792 100%
412 52%
412 52%
386 49%
390 49%
342 43%
302 38%
220 28%
216 27%
72 9%
78 10%
120 15%
92 12%
96 12%
138 17%
905 137 101 209 100% 100% 100% 100%
382 62 37 34 42% 45% 37% 16%
253 41 40 8 28% 30% 40% 4%
174 37 49 6 19% 27% 49% 3%
219 36 12 3 24% 26% 12% 1%
243 36 22 6 27% 26% 22% 3%
281 33 16 34 31% 24% 16% 16%
220 33 23 21 24% 24% 23% 10%
91 9 13 3 10% 7% 13% 1%
56 5 11 27 6% 4% 11% 13%
36 7 7 2 4% 5% 7% 1%
23 5 2 1 3% 4% 2% 0%
22 3 4 2 2% 2% 4% 1%
56 11 6 1 6% 8% 6% 0%
37 8 4 9 4% 6% 4% 4%
Benefits 159

Exhibit 6.3c (continued) Other Benefits by Work Setting (1)
As of April 1, 2013, which of these other benefits were offered as part of your employment/self-employment in this position (whether you took advantage of them or not)?
all practitioners
acute care -
inpatient
acute ambula- care - tory/
outpatient outpatient
long-term/ extended
care
wellness ctr or health
rehab club private
practice
base: practitioners* (multiple answers)
7469 100%
1835100%
367 100%
792 100%
905 100%
137 101 100% 100%
209 100%
other 96 1%
191% 0
0%9 1%
9 1%
4 1 3% 1%
3 1%
indicated one or more 6844 92%
175796%
354 96%
761 96%
788 87%
119 78 87% 77%
92 44%
no benefits 535 7%
55 3%
9 2%
28 4%
104 11%
17 20 12% 20%
105 50%
no answer 90 1%
231% 4
1%3 0%
13 1%
1 3 1% 3%
12 6%
* "practitioners" excludes those not currently in dietetics
Compensation & Benefits Survey of the Dietetics Profession 2013 160

Exhibit 6.3d Other Benefits by Work Setting (2)
As of April 1, 2013, which of these other benefits were offered as part of your employment/self-employment in this position (whether you took advantage of them or not)?
all practitioners
govt c agency/ pu dept
ommunity/ blic health program
nonprofit agency/
organization faculty
foodmfr/dist/ retailer
K-12 food
service
food mgmt
company
7469 442 545 261 439 97 166 111 100% 100% 100% 100% 100% 100% 100% 100%
6337 422 485 229 351 84 159 105 85% 95% 89% 88% 80% 87% 96% 95%
6132 410 477 222 290 84 144 105 82% 93% 88% 85% 66% 87% 87% 95%
5378 418 475 212 314 82 137 92 72% 95% 87% 81% 72% 85% 83% 83%
5106 402 449 193 310 63 155 84 68% 91% 82% 74% 71% 65% 93% 76%
5446 336 396 198 345 81 133 102 73% 76% 73% 76% 79% 84% 80% 92%
4078 287 323 156 262 68 118 84 55% 65% 59% 60% 60% 70% 71% 76%
3441 158 165 104 270 53 32 75 46% 36% 30% 40% 62% 55% 19% 68%
2328 76 122 92 79 69 79 95 31% 17% 22% 35% 18% 71% 48% 86%
1472 35 41 68 70 54 54 70 20% 8% 8% 26% 16% 56% 33% 63%
409 4 3 11 6 8 1 23 5% 1% 1% 4% 1% 8% 1% 21%
182 33 42 3 7 2 0 3 2% 7% 8% 1% 2% 2% 0% 3%
6564 423 501 235 394 91 158 102 88% 96% 92% 90% 90% 94% 95% 92%
4645 307 371 162 197 73 128 64 62% 69% 68% 62% 45% 75% 77% 58%
3990 306 269 115 230 54 89 68 53% 69% 49% 44% 52% 56% 54% 61%
base: practitioners* (multiple answers)
NET: paid time off
paid vacation, personal time off
paid holidays
paid sick days
NET: professional/career development
funding/time off for professional development (conferences, seminars, etc.)
college tuition assistance for employees
professional registration or licensure fees
professional society dues
sign-on bonuses
paid dietetic internship
NET: quality of work life
on-site parking
employee assistance program
Benefits 161
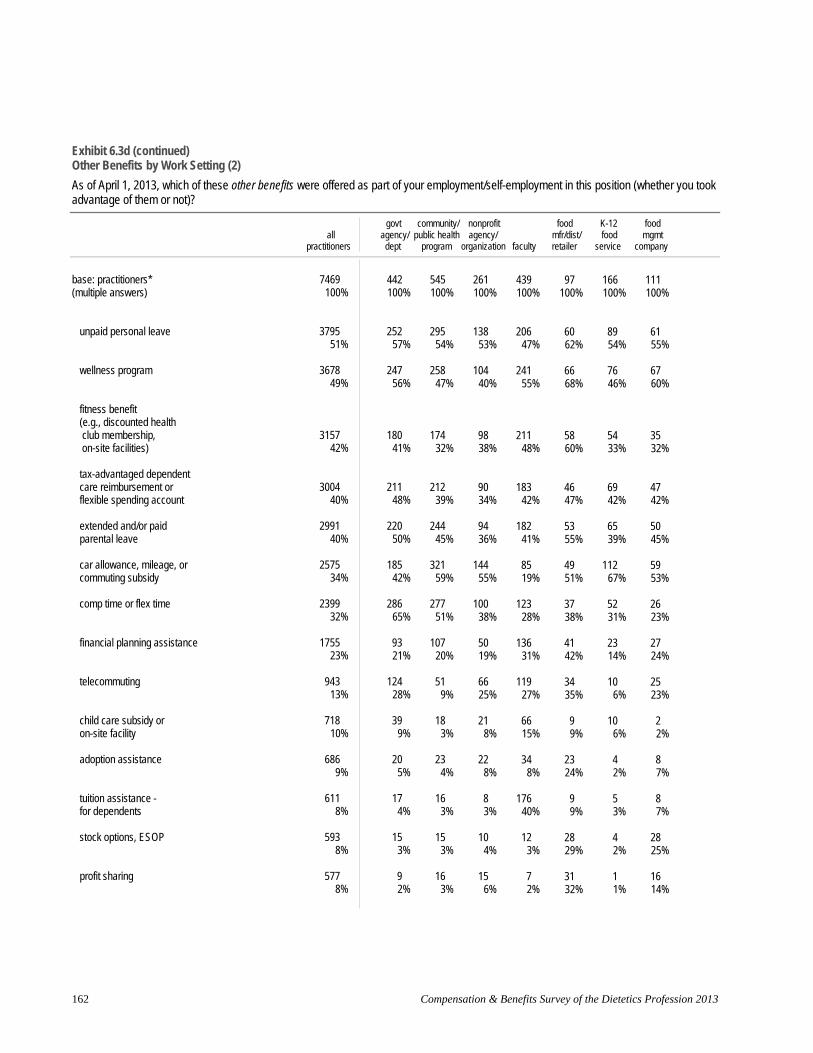
Exhibit 6.3d (continued) Other Benefits by Work Setting (2)
As of April 1, 2013, which of these other benefits were offered as part of your employment/self-employment in this position (whether you took advantage of them or not)?
govt community/ nonprofit food K-12 food all agency/ public health agency/ mfr/dist/ food mgmt
practitioners dept program organization faculty retailer service company
base: practitioners* 7469 (multiple answers) 100%
unpaid personal leave 3795 51%
wellness program 3678 49%
fitness benefit (e.g., discounted health
club membership, 3157 on-site facilities) 42%
tax-advantaged dependent care reimbursement or 3004
flexible spending account 40%
extended and/or paid 2991 parental leave 40%
car allowance, mileage, or 2575 commuting subsidy 34%
comp time or flex time 2399 32%
financial planning assistance 1755 23%
telecommuting 943 13%
child care subsidy or 718 on-site facility 10%
adoption assistance 686 9%
tuition assistance - 611 for dependents 8%
stock options, ESOP 593 8%
profit sharing 577 8%
442100%
252 57%
247 56%
180 41%
211 48%
220 50%
185 42%
286 65%
93 21%
12428%
39 9%
205%
17 4%
15 3%
9 2%
545 100%
295 54%
258 47%
174 32%
212 39%
244 45%
321 59%
277 51%
107 20%
519%
18 3%
23 4%
16 3%
15 3%
16 3%
261 100%
138 53%
104 40%
98 38%
90 34%
94 36%
144 55%
100 38%
50 19%
66 25%
21 8%
22 8%
8 3%
10 4%
15 6%
439 100%
206 47%
241 55%
211 48%
183 42%
182 41%
85 19%
123 28%
136 31%
119 27%
66 15%
34 8%
176 40%
12 3%
7 2%
97 166 111 100% 100% 100%
60 89 61 62% 54% 55%
66 76 67 68% 46% 60%
58 54 35 60% 33% 32%
46 69 47 47% 42% 42%
53 65 50 55% 39% 45%
49 112 59 51% 67% 53%
37 52 26 38% 31% 23%
41 23 27 42% 14% 24%
34 10 25 35% 6% 23%
9 10 2 9% 6% 2%
23 4 8 24% 2% 7%
9 5 8 9% 3% 7%
28 4 28 29% 2% 25%
31 1 16 32% 1% 14%
Compensation & Benefits Survey of the Dietetics Profession 2013 162
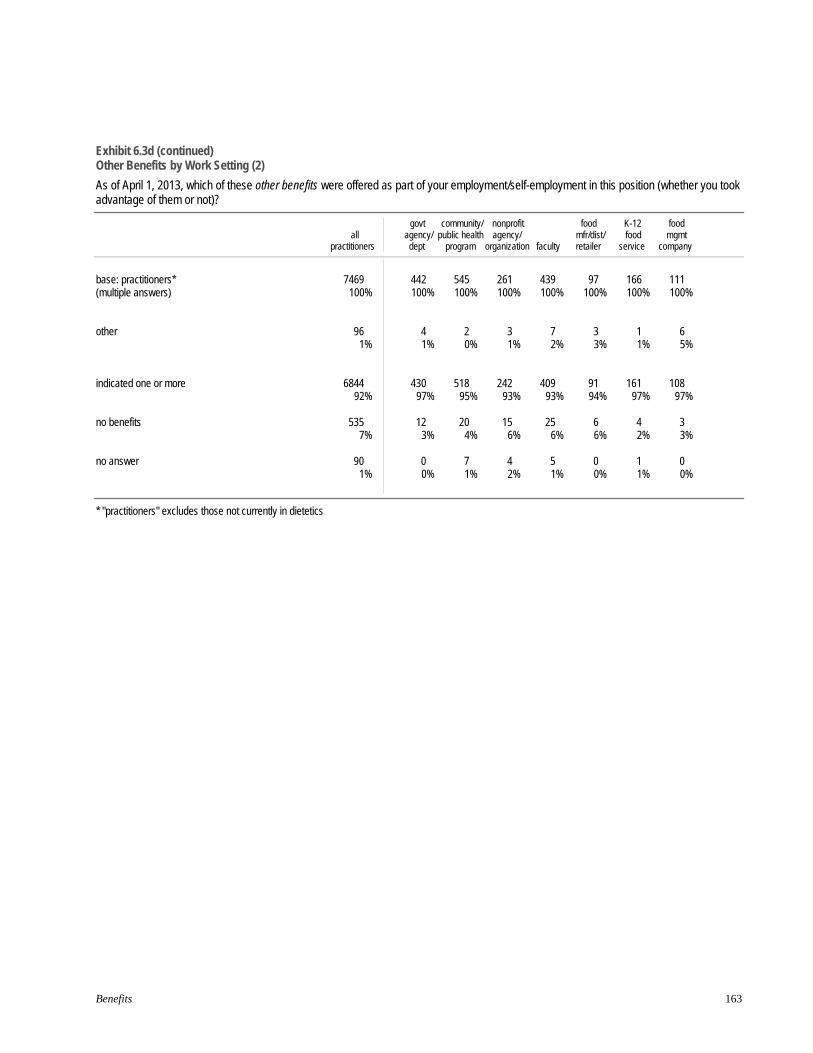
Exhibit 6.3d (continued) Other Benefits by Work Setting (2)
As of April 1, 2013, which of these other benefits were offered as part of your employment/self-employment in this position (whether you took advantage of them or not)?
all practitioners
govt community/ nonprofit agency/ public health agency/ dept program organization faculty
foodmfr/dist/ retailer
K-12 food
service
food mgmt
company
base: practitioners* (multiple answers)
7469 100%
442100%
545 100%
261 100%
439 100%
97 100%
166 100%
111 100%
other 96 1%
4 1%
2 0%
3 1%
7 2%
3 3%
1 1%
6 5%
indicated one or more 6844 92%
43097%
518 95%
242 93%
409 93%
91 94%
161 97%
108 97%
no benefits 535 7%
123% 20
4% 15
6% 25
6%6 6%
4 2%
3 3%
no answer 90 1%
0 0%
7 1%
4 2%
5 1%
0 0%
1 1%
0 0%
* "practitioners" excludes those not currently in dietetics
Benefits 163
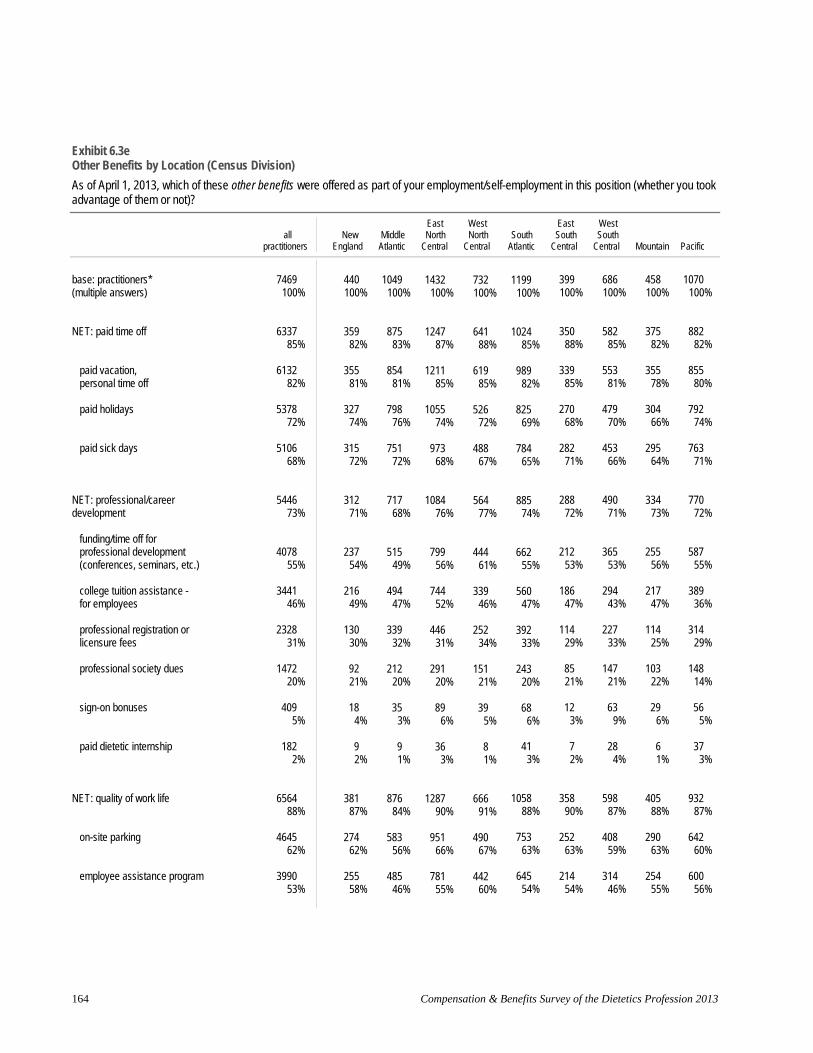
Exhibit 6.3e Other Benefits by Location (Census Division)
As of April 1, 2013, which of these other benefits were offered as part of your employment/self-employment in this position (whether you took advantage of them or not)?
East West East West all New Middle North North South South South
practitioners England Atlantic Central Central Atlantic Central Central Mountain Pacific
base: practitioners* (multiple answers)
NET: paid time off
paid vacation, personal time off
paid holidays
paid sick days
NET: professional/career development
funding/time off for professional development (conferences, seminars, etc.)
college tuition assistance for employees
professional registration or licensure fees
professional society dues
sign-on bonuses
paid dietetic internship
NET: quality of work life
on-site parking
employee assistance program
7469 100%
6337 85%
6132 82%
5378 72%
5106 68%
5446 73%
4078 55%
3441 46%
2328 31%
1472 20%
409 5%
182 2%
6564 88%
4645 62%
3990 53%
440 100%
35982%
35581%
32774%
31572%
31271%
23754%
21649%
13030%
9221%
184%
9 2%
38187%
27462%
25558%
1049 100%
875 83%
854 81%
798 76%
751 72%
717 68%
515 49%
494 47%
339 32%
212 20%
35 3%
9 1%
876 84%
583 56%
485 46%
1432 100%
1247 87%
1211 85%
1055 74%
973 68%
1084 76%
799 56%
744 52%
446 31%
291 20%
89 6%
36 3%
1287 90%
951 66%
781 55%
732 100%
641 88%
619 85%
526 72%
488 67%
564 77%
444 61%
339 46%
252 34%
151 21%
39 5%
8 1%
666 91%
490 67%
442 60%
1199 100%
1024 85%
989 82%
825 69%
784 65%
885 74%
662 55%
560 47%
392 33%
243 20%
68 6%
41 3%
1058 88%
753 63%
645 54%
399 686 458 1070 100% 100% 100% 100%
350 582 375 882 88% 85% 82% 82%
339 553 355 855 85% 81% 78% 80%
270 479 304 792 68% 70% 66% 74%
282 453 295 763 71% 66% 64% 71%
288 490 334 770 72% 71% 73% 72%
212 365 255 587 53% 53% 56% 55%
186 294 217 389 47% 43% 47% 36%
114 227 114 314 29% 33% 25% 29%
85 147 103 148 21% 21% 22% 14%
12 63 29 56 3% 9% 6% 5%
7 28 6 37 2% 4% 1% 3%
358 598 405 932 90% 87% 88% 87%
252 408 290 642 63% 59% 63% 60%
214 314 254 600 54% 46% 55% 56%
Compensation & Benefits Survey of the Dietetics Profession 2013 164

Exhibit 6.3e (continued) Other Benefits by Location (Census Division)
As of April 1, 2013, which of these other benefits were offered as part of your employment/self-employment in this position (whether you took advantage of them or not)?
East West East West all New Middle North North South South South
practitioners England Atlantic Central Central Atlantic Central Central Mountain Pacific
base: practitioners* 7469 (multiple answers) 100%
unpaid personal leave 3795 51%
wellness program 3678 49%
fitness benefit (e.g., discounted health club membership, 3157 on-site facilities) 42%
tax-advantaged dependent care reimbursement or 3004 flexible spending account 40%
extended and/or paid 2991 parental leave 40%
car allowance, mileage, or 2575 commuting subsidy 34%
comp time or flex time 2399 32%
financial planning assistance 1755 23%
telecommuting 943 13%
child care subsidy or 718 on-site facility 10%
adoption assistance 686 9%
tuition assistance - 611 for dependents 8%
stock options, ESOP 593 8%
profit sharing 577 8%
440 100%
22952%
21248%
18843%
17540%
18342%
13631%
123 28%
11927%
6014%
46 10%
358%
358%
22 5%
164%
1049 100%
489 47%
417 40%
358 34%
366 35%
380 36%
291 28%
307 29%
218 21%
111 11%
103 10%
79 8%
90 9%
71 7%
57 5%
1432 100%
756 53%
778 54%
634 44%
605 42%
577 40%
572 40%
483 34%
351 25%
167 12%
132 9%
18913%
118 8%
126 9%
130 9%
732 100%
399 55%
407 56%
356 49%
376 51%
319 44%
275 38%
246 34%
192 26%
115 16%
97 13%
83 11%
73 10%
54 7%
58 8%
1199 100%
570 48%
571 48%
487 41%
478 40%
426 36%
411 34%
443 37%
270 23%
182 15%
130 11%
109 9%
101 8%
114 10%
100 8%
399 686 458 1070 100% 100% 100% 100%
180 329 243 600 45% 48% 53% 56%
217 319 240 516 54% 47% 52% 48%
168 299 198 467 42% 44% 43% 44%
165 249 179 411 41% 36% 39% 38%
149 241 190 525 37% 35% 41% 49%
147 243 150 348 37% 35% 33% 33%
126 182 142 347 32% 27% 31% 32%
92 145 110 258 23% 21% 24% 24%
35 80 68 125 9% 12% 15% 12%
42 45 41 82 11% 7% 9% 8%
36 57 37 61 9% 8% 8% 6%
56 34 46 58 14% 5% 10% 5%
36 59 41 70 9% 9% 9% 7%
30 70 32 84 8% 10% 7% 8%
Benefits 165
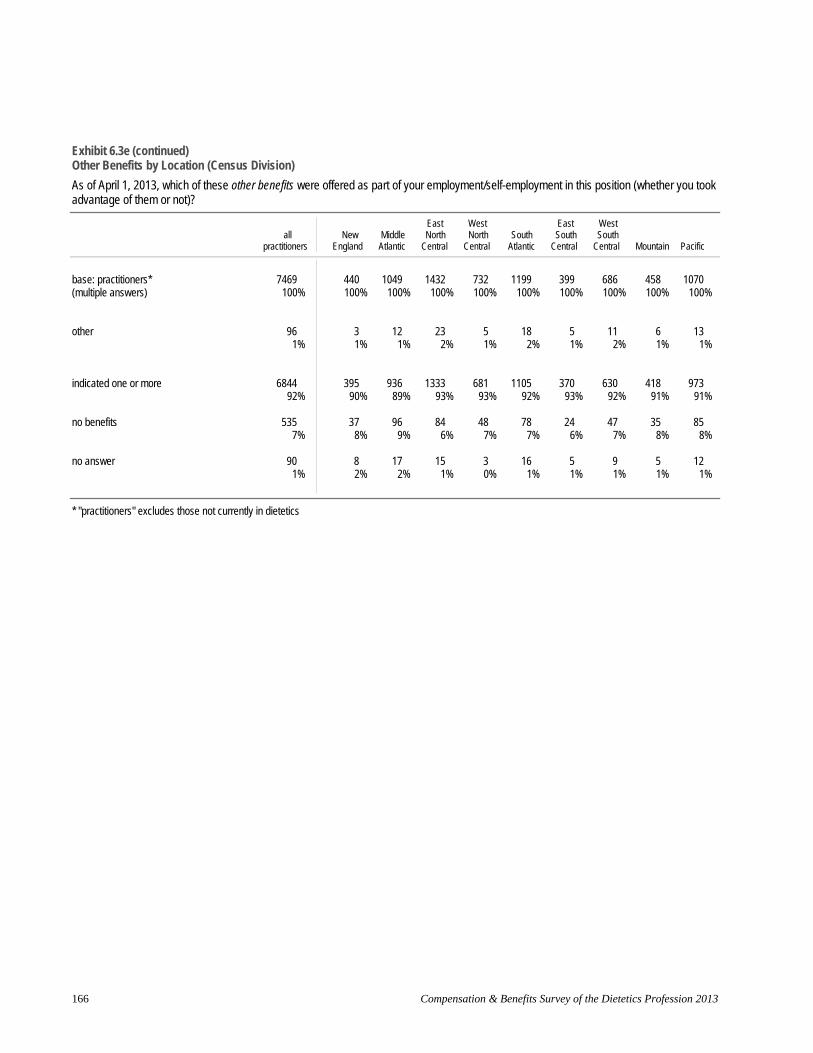
Exhibit 6.3e (continued) Other Benefits by Location (Census Division)
As of April 1, 2013, which of these other benefits were offered as part of your employment/self-employment in this position (whether you took advantage of them or not)?
all practitioners
New England
Middle Atlantic
East North
Central
West North
Central South Atlantic
East South Central
West South
Central Mountain Pacific
base: practitioners* (multiple answers)
7469 100%
440 100%
1049 100%
1432 100%
732 100%
1199 100%
399 100%
686 100%
458 100%
1070 100%
other 96 1%
3 1%
12 1%
23 2%
5 1%
18 2%
5 1%
11 2%
6 1%
13 1%
indicated one or more 6844 92%
39590%
936 89%
1333 93%
681 93%
1105 92%
370 93%
630 92%
418 91%
973 91%
no benefits 535 7%
378% 96
9% 84
6% 48
7% 78
7% 24
6% 47
7% 35
8%85
8%
no answer 90 1%
8 2%
17 2%
15 1%
3 0%
16 1%
5 1%
9 1%
5 1%
12 1%
* "practitioners" excludes those not currently in dietetics
Compensation & Benefits Survey of the Dietetics Profession 2013 166

Exhibit 6.4a Benefits Level by Registration Status and Full-Time Status
As of April 1, 2013, what retirement benefits (if any) were offered as part of your employment/self-employment in this position (whether you took advantage of them or not)? Which of these insurance-related benefits?
REGISTRATION STATUS FULL TIME? all
practitioners RD DTR not yes no
LEVEL DETERMINED BY COUNT OF RETIREMENT AND INSURANCE BENEFITS
base: practitioners* 7469100%
6523 100%
866 100%
80 100%
5329 1543 100% 100%
high employer offers/contributes to 8+ of the 16 retirement and insurance-related 3387 2997 356 34 2843 416 benefits asked about 45% 46% 41% 43% 53% 27%
medium employer offers 8+ of the 16 retirement and insurance-related benefits asked about, 2333 2002 309 22 1878 357 contributes to fewer than 8 31% 31% 36% 28% 35% 23%
low 1733 1511 199 23 606 764 all others 23% 23% 23% 29% 11% 50%
no answer 16 13 2 1 2 6 0% 0% 0% 1% 0% 0%
* "practitioners" excludes those not currently in dietetics
Benefits 167

Exhibit 6.4b Benefits Level by Employment Sector and Organization Size
As of April 1, 2013, what retirement benefits (if any) were offered as part of your employment/self-employment in this position (whether you took advantage of them or not)? Which of these insurance-related benefits?
EMPLOYMENT SECTOR # OF EMPLOYEES (ALL LOCATIONS) all self- for non- 100 1,000 -
practitioners employed profit profit govt 1 2 – 99 999 9,999 10,000+
LEVEL DETERMINED BY COUNT OF RETIREMENT AND INSURANCE BENEFITS
base: practitioners* 7469 100%
533100%
2258 100%
2863 100%
1400 100%
434100%
1131 1936 2350 1425 100% 100% 100% 100%
high employer offers/contributes
to 8+ of the 16 retirement and insurance-related 3387 8 948 1496 741 14 356 824 1284 842
benefits asked about 45% 2% 42% 52% 53% 3% 31% 43% 55% 59%
medium employer offers
8+ of the 16 retirement and insurance-related benefits asked about, 2333 7 773 951 485 10 303 731 785 443
contributes to fewer than 8 31% 1% 34% 33% 35% 2% 27% 38% 33% 31%
low 1733 514 533 413 169 409 468 373 280 140 all others 23% 96% 24% 14% 12% 94% 41% 19% 12% 10%
no answer 16 4 4 3 5 1 4 8 1 0 0% 1% 0% 0% 0% 0% 0% 0% 0% 0%
* "practitioners" excludes those not currently in dietetics
Compensation & Benefits Survey of the Dietetics Profession 2013 168
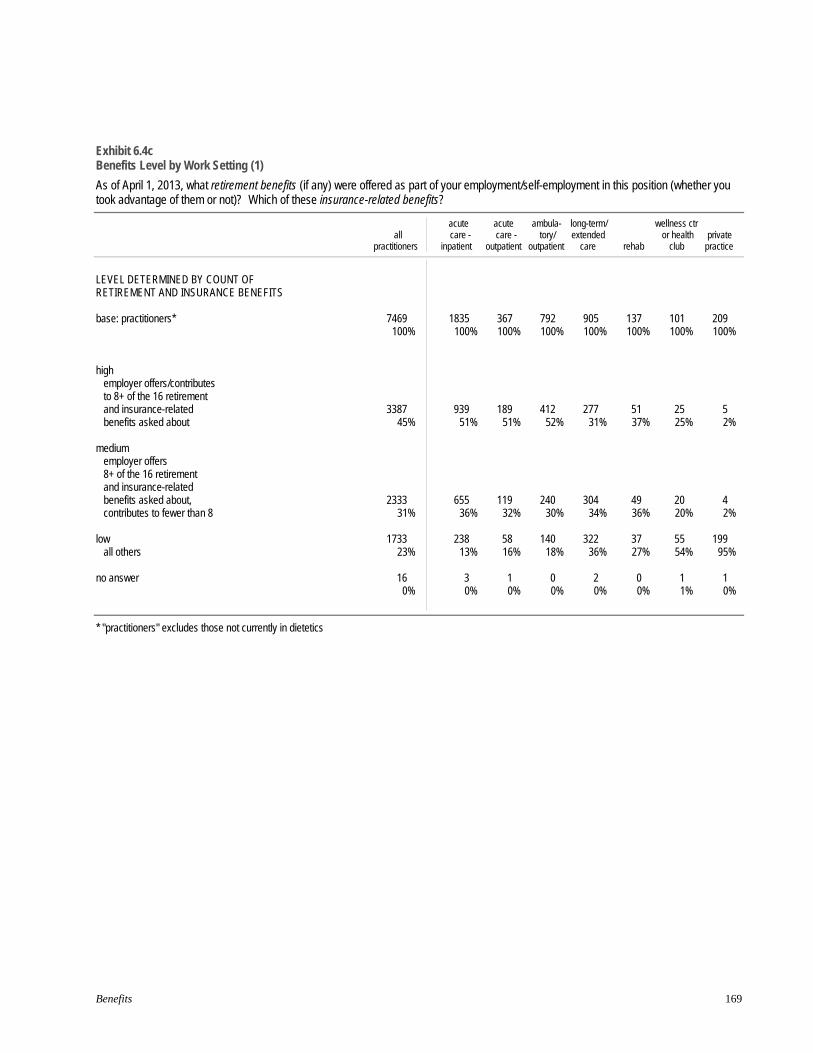
Exhibit 6.4c Benefits Level by Work Setting (1)
As of April 1, 2013, what retirement benefits (if any) were offered as part of your employment/self-employment in this position (whether you took advantage of them or not)? Which of these insurance-related benefits?
acute acute ambula- long-term/ wellness ctr all
practitioners care -
inpatient care - tory/
outpatient outpatient extended
care or health
rehab club private
practice
LEVEL DETERMINED BY COUNT OF RETIREMENT AND INSURANCE BENEFITS
base: practitioners* 7469 100%
1835100%
367 100%
792 100%
905 100%
137 101 100% 100%
209 100%
high employer offers/contributes
to 8+ of the 16 retirement and insurance-related 3387 939 189 412 277 51 25 5 benefits asked about 45% 51% 51% 52% 31% 37% 25% 2%
medium employer offers
8+ of the 16 retirement and insurance-related
benefits asked about, 2333 655 119 240 304 49 20 4 contributes to fewer than 8 31% 36% 32% 30% 34% 36% 20% 2%
low 1733 238 58 140 322 37 55 199 all others 23% 13% 16% 18% 36% 27% 54% 95%
no answer 16 3 1 0 2 0 1 1 0% 0% 0% 0% 0% 0% 1% 0%
* "practitioners" excludes those not currently in dietetics
Benefits 169

Exhibit 6.4d Benefits Level by Work Setting (2)
As of April 1, 2013, what retirement benefits (if any) were offered as part of your employment/self-employment in this position (whether you took advantage of them or not)? Which of these insurance-related benefits?
govt community/ nonprofit food K-12 food all
practitioners agency/ public health agency/ dept program organization faculty
mfr/dist/ retailer
food service
mgmt company
LEVEL DETERMINED BY COUNT OF RETIREMENT AND INSURANCE BENEFITS
base: practitioners* 7469 100%
442100%
545 100%
261 100%
439 100%
97 100%
166 100%
111 100%
high employer offers/contributes
to 8+ of the 16 retirement and insurance-related 3387 234 224 117 243 52 88 63 benefits asked about 45% 53% 41% 45% 55% 54% 53% 57%
medium employer offers
8+ of the 16 retirement and insurance-related
benefits asked about, 2333 143 213 78 106 26 55 39 contributes to fewer than 8 31% 32% 39% 30% 24% 27% 33% 35%
low 1733 65 106 66 90 19 22 9 all others 23% 15% 19% 25% 21% 20% 13% 8%
no answer 16 0 2 0 0 0 1 0 0% 0% 0% 0% 0% 0% 1% 0%
* "practitioners" excludes those not currently in dietetics
Compensation & Benefits Survey of the Dietetics Profession 2013 170

Exhibit 6.4e Benefits Level by Location (Census Division)
As of April 1, 2013, what retirement benefits (if any) were offered as part of your employment/self-employment in this position (whether you took advantage of them or not)? Which of these insurance-related benefits?
East West East West all New Middle North North South South South
practitioners England Atlantic Central Central Atlantic Central Central Mountain Pacific
LEVEL DETERMINED BY COUNT OF RETIREMENT AND INSURANCE BENEFITS
base: practitioners* 7469 100%
440 100%
1049 100%
1432 100%
732 100%
1199 100%
399 100%
686 100%
458 100%
1070 100%
high employer offers/contributes
to 8+ of the 16 retirement and insurance-related 3387 192 432 689 357 521 164 264 218 549 benefits asked about 45% 44% 41% 48% 49% 43% 41% 38% 48% 51%
medium employer offers 8+ of the 16 retirement and insurance-related benefits asked about, 2333 125 314 428 221 417 155 271 124 277
contributes to fewer than 8 31% 28% 30% 30% 30% 35% 39% 40% 27% 26%
low 1733 122 300 314 154 256 79 149 113 244 all others 23% 28% 29% 22% 21% 21% 20% 22% 25% 23%
no answer 16 1 3 1 0 5 1 2 3 0 0% 0% 0% 0% 0% 0% 0% 0% 1% 0%
* "practitioners" excludes those not currently in dietetics
Benefits 171


7. Respondent Profile
Notes
The tables in this section present survey results profiling dietetics practitioners and their employment situations. Results to some questions are also shown for professionals not currently working in dietetics.
Included are tables describing employment status, demographic characteristics, professional qualifications, employment situations, and positions held. The first tables are based on all 9,058 survey respondents; most remaining tables are based on the 7,469 respondents who were employed or self-employed in a dietetics-related position at the time of the survey. Note that respondents were instructed to respond with reference to their primary dietetics-related position if they were employed or self-employed in more than one.
Results are shown for all respondents, all practitioners, as well as those not currently in dietetics. Among respondents and practitioners, further segmentation is done by registration status (RD, DTR, or neither).
The margins of error for percentages in each group are:
MarginSegment Base of Error
ALL RESPONDENTS
total 9,058 ±1.0%
RD 7,783 ±1.1%
DTR 1,142 ±2.5%
not 133 ±8.3%
PRACTITIONERS
total 7,469 ±1.1%
RD 6,523 ±1.2%
DTR 866 ±2.9%
not 80 ±10.7%
not currently in dietetics 1,589 ±2.3%
For definitions of statistics reported, Census Divisions used to categorize employment location, standard position descriptions, and a facsimile of the questionnaire, please refer to the Appendix.
Respondent Profile 173

Exhibit 7.1 Employment Status
Are you currently employed or self-employed in a dietetics-related position?
A L L
total
R E S P O N D E N T SREGISTRATION STATUSRD DTR not
P R A C T I T I O N E R S REGISTRATION STATUS
total RD DTR not
not currently in dietetics
base: all respondents 9058100%
7783 100%
1142 100%
133 100%
7469100%
6523 866 80 100% 100% 100%
1589 100%
yes, I am currently employed or self-employed in a dietetics-related position
7469 82%
6523 84%
866 76%
80 60%
7469 100%
6523 866 80 100% 100% 100%
0 0%
no, but would like to/expect to work in dietetics in the future
936 10%
709 9%
196 17%
31 23%
0 0%
0 0 0 0% 0% 0%
936 59%
no, and do not expect to seek work in dietetics in the future
653 7%
551 7%
80 7%
22 17%
0 0%
0 0 0 0% 0% 0%
653 41%
no answer 0 0%
0 0%
0 0%
0 0%
0 0%
0 0 0 0% 0% 0%
0 0%
Exhibit 7.2 Job Loss
Whether or not you are currently working in a dietetics-related position, have you personally been let go from a dietetics-related job in the past 12 months due to economic conditions (such as staff reductions, facility closings, etc.)?
base: all respondents
yes
no
no answer
A L L R E S P O N D E N T S P R A C T I T I O N E R S not
total REGISTRATION STATUSRD DTR not total
REGISTRATION STATUSRD DTR not
currently in dietetics
9058 7783 1142 133 7469 6523 866 80 1589 100% 100% 100% 100% 100% 100% 100% 100% 100%
385 302 79 4 284 234 48 2 101 4% 4% 7% 3% 4% 4% 6% 3% 6%
8612 7442 1049 121 7135 6253 808 74 1477 95% 96% 92% 91% 96% 96% 93% 93% 93%
61 39 14 8 50 36 10 4 11 1% 1% 1% 6% 1% 1% 1% 5% 1%
Compensation & Benefits Survey of the Dietetics Profession 2013 174

Exhibit 7.3 Reason(s) for Non-Employment in Dietetics
If not currently employed or self-employed in a dietetics-related position, your reason(s)?
A L L R E S P O N D E N T S P R A C T I T I O N E R S not REGISTRATION STATUS REGISTRATION STATUS currently
total RD DTR not total RD DTR not in dietetics
base: those not currently working in dietetics (multiple answers)
1589 100%
1260 100%
276 100%
53 100%
1589 100%
changed career/profession 267 17%
220 17%
41 15%
6 11%
267 17%
found higher-paying job outside 243 200 41 2 243 dietetics 15% 16% 15% 4% 15%
could not find dietetics 228 113 102 13 228 employment 14% 9% 37% 25% 14%
promoted into a non-dietetics related position
97 6%
90 7%
6 2%
1 2%
97 6%
relocated or in the process of relocating
92 6%
74 6%
16 6%
2 4%
92 6%
at home raising a family 433 27%
395 31%
32 12%
6 11%
433 27%
retired 275 232 31 12 275 17% 18% 11% 23% 17%
currently a student 71 4%
37 3%
29 11%
5 9%
71 4%
disability/health problems 58 4%
39 3%
16 6%
3 6%
58 4%
other 161 114 34 13 161 10% 9% 12% 25% 10%
indicated one or more 1571 1248 272 51 1571 99% 99% 99% 96% 99%
no answer 18 12 4 2 18 1% 1% 1% 4% 1%
Respondent Profile 175

Exhibit 7.4 Gender
Your gender?
base: all respondents
female
male
no answer
A L L R E S P O N D E N T S P R A C T I T I O N E R S not REGISTRATION STATUS REGISTRATION STATUS currently
total RD DTR not total RD DTR not in dietetics
9058 7783 1142 133 7469 6523 866 80 1589 100% 100% 100% 100% 100% 100% 100% 100% 100%
8611 7421 1067 123 7087 6200 814 73 1524 95% 95% 93% 92% 95% 95% 94% 91% 96%
315 248 59 8 265 219 40 6 50 3% 3% 5% 6% 4% 3% 5% 8% 3%
132 114 16 2 117 104 12 1 15 1% 1% 1% 2% 2% 2% 1% 1% 1%
Compensation & Benefits Survey of the Dietetics Profession 2013 176
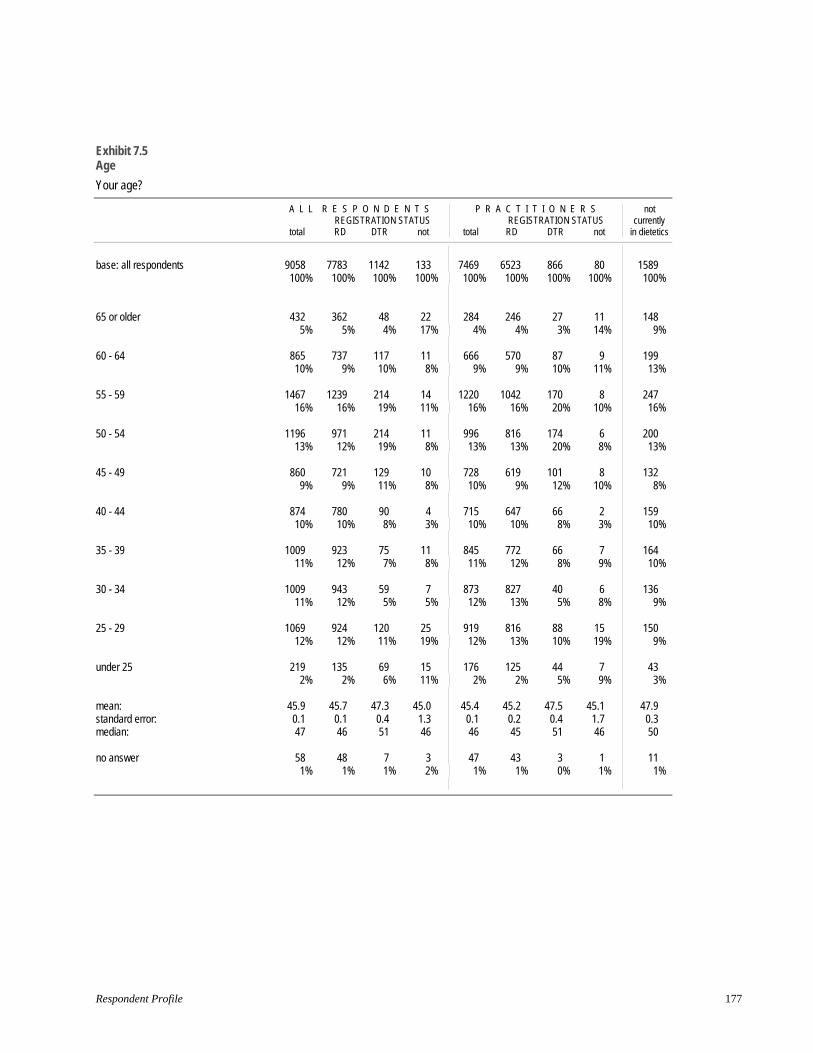
Exhibit 7.5 Age
Your age?
A L L R E S P O N D E N T S P R A C T I T I O N E R S not REGISTRATION STATUS REGISTRATION STATUS currently
total RD DTR not total RD DTR not in dietetics
base: all respondents 9058 7783 1142 133 7469 6523 866 80 1589 100% 100% 100% 100% 100% 100% 100% 100% 100%
65 or older 432 362 48 22 284 246 27 11 148 5% 5% 4% 17% 4% 4% 3% 14% 9%
60 - 64 865 737 117 11 666 570 87 9 199 10% 9% 10% 8% 9% 9% 10% 11% 13%
55 - 59 1467 1239 214 14 1220 1042 170 8 247 16% 16% 19% 11% 16% 16% 20% 10% 16%
50 - 54 1196 971 214 11 996 816 174 6 200 13% 12% 19% 8% 13% 13% 20% 8% 13%
45 - 49 860 721 129 10 728 619 101 8 132 9% 9% 11% 8% 10% 9% 12% 10% 8%
40 - 44 874 780 90 4 715 647 66 2 159 10% 10% 8% 3% 10% 10% 8% 3% 10%
35 - 39 1009 923 75 11 845 772 66 7 164 11% 12% 7% 8% 11% 12% 8% 9% 10%
30 - 34 1009 943 59 7 873 827 40 6 136 11% 12% 5% 5% 12% 13% 5% 8% 9%
25 - 29 1069 924 120 25 919 816 88 15 150 12% 12% 11% 19% 12% 13% 10% 19% 9%
under 25 219 135 69 15 176 125 44 7 43 2% 2% 6% 11% 2% 2% 5% 9% 3%
mean: 45.9 45.7 47.3 45.0 45.4 45.2 47.5 45.1 47.9 standard error: 0.1 0.1 0.4 1.3 0.1 0.2 0.4 1.7 0.3 median: 47 46 51 46 46 45 51 46 50
no answer 58 48 7 3 47 43 3 1 11 1% 1% 1% 2% 1% 1% 0% 1% 1%
Respondent Profile 177
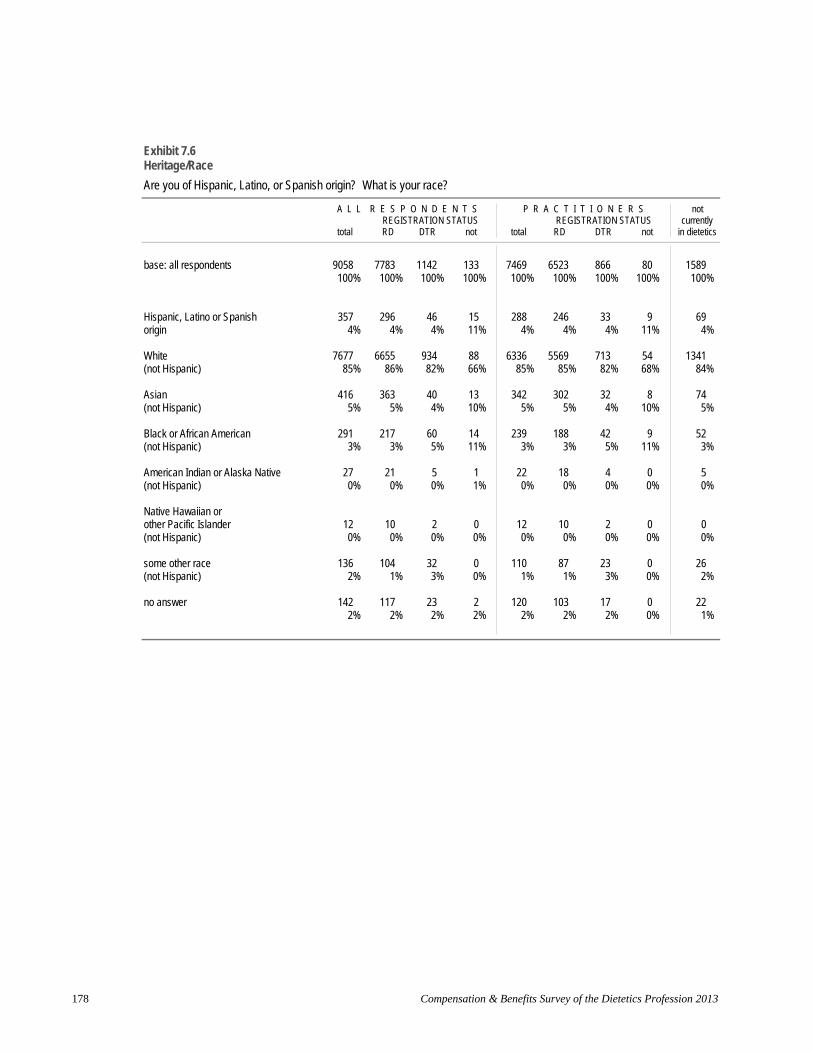
Exhibit 7.6 Heritage/Race
Are you of Hispanic, Latino, or Spanish origin? What is your race?
A L L R E S P O N D E N T S P R A C T I T I O N E R S not REGISTRATION STATUS REGISTRATION STATUS currently
total RD DTR not total RD DTR not in dietetics
base: all respondents 9058 7783 1142 133 7469 6523 866 80 1589 100% 100% 100% 100% 100% 100% 100% 100% 100%
Hispanic, Latino or Spanish 357 296 46 15 288 246 33 9 69 origin 4% 4% 4% 11% 4% 4% 4% 11% 4%
White 7677 6655 934 88 6336 5569 713 54 1341 (not Hispanic) 85% 86% 82% 66% 85% 85% 82% 68% 84%
Asian 416 363 40 13 342 302 32 8 74 (not Hispanic) 5% 5% 4% 10% 5% 5% 4% 10% 5%
Black or African American 291 217 60 14 239 188 42 9 52 (not Hispanic) 3% 3% 5% 11% 3% 3% 5% 11% 3%
American Indian or Alaska Native 27 21 5 1 22 18 4 0 5 (not Hispanic) 0% 0% 0% 1% 0% 0% 0% 0% 0%
Native Hawaiian or other Pacific Islander 12 10 2 0 12 10 2 0 0 (not Hispanic) 0% 0% 0% 0% 0% 0% 0% 0% 0%
some other race 136 104 32 0 110 87 23 0 26 (not Hispanic) 2% 1% 3% 0% 1% 1% 3% 0% 2%
no answer 142 117 23 2 120 103 17 0 22 2% 2% 2% 2% 2% 2% 2% 0% 1%
Compensation & Benefits Survey of the Dietetics Profession 2013 178

Exhibit 7.7 Education (Highest Degree Held)
What degree(s) have you earned?
A L L
total
R E S P O N D E N T SREGISTRATION STATUSRD DTR not
P R A C T I T I O N E R S REGISTRATION STATUS
total RD DTR not
not currently in dietetics
HIGHEST DEGREE HELD
base: all respondents 9058100%
7783 100%
1142 100%
133 100%
7469100%
6523 100%
866 100%
80 100%
1589 100%
doctoral degree 3334%
311 4%
4 0%
18 14%
2533%
240 4%
2 0%
11 14%
80 5%
master's degree 3820 42%
3722 48%
575%
41 31%
3133 42%
3070 47%
344%
29 36%
687 43%
bachelor's degree 422847%
3744 48%
412 36%
72 54%
355348%
3210 49%
305 35%
38 48%
675 42%
associate's degree 6737%
3 0%
66858%
2 2%
5287%
1 0%
52561%
2 3%
145 9%
other 4 0%
3 0%
1 0%
0 0%
2 0%
2 0%
0 0%
0 0%
2 0%
no answer 0 0%
0 0%
0 0%
0 0%
0 0%
0 0%
0 0%
0 0%
0 0%
Respondent Profile 179
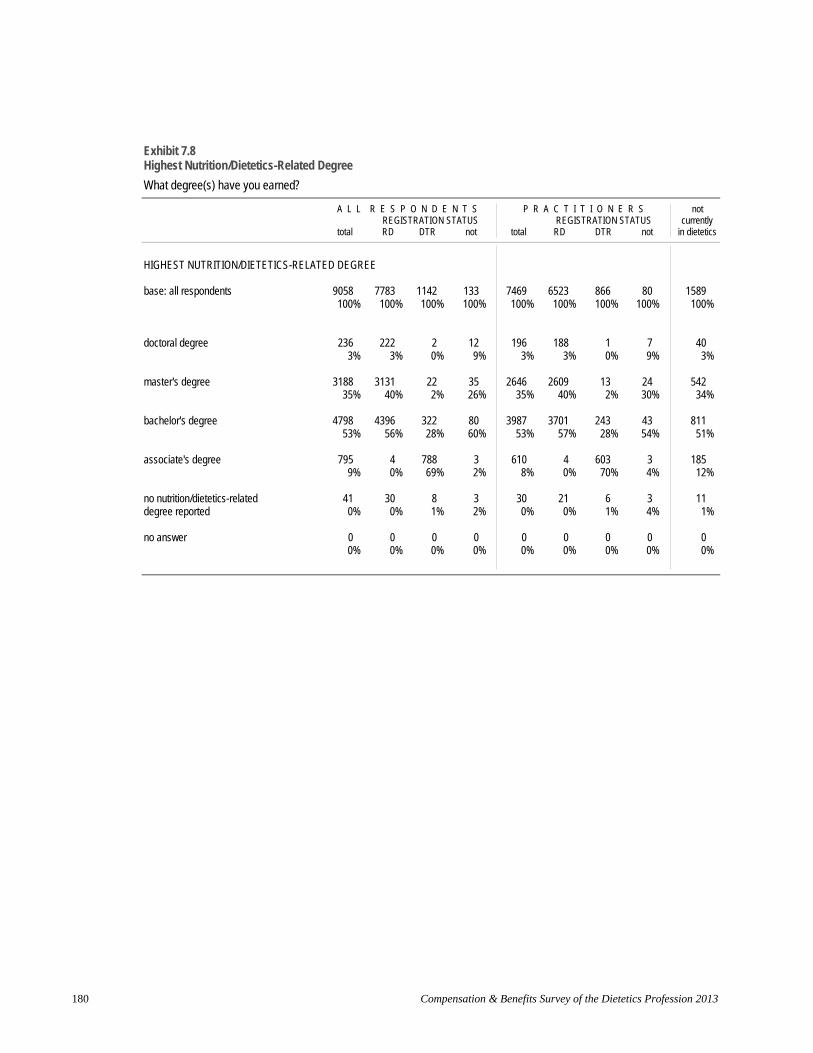
Exhibit 7.8 Highest Nutrition/Dietetics-Related Degree
What degree(s) have you earned?
A L L R E S P O N D E N T S P R A C T I T I O N E R S not REGISTRATION STATUS REGISTRATION STATUS currently
total RD DTR not total RD DTR not in dietetics
HIGHEST NUTRITION/DIETETICS-RELATED DEGREE
base: all respondents 9058 7783100% 100%
1142 100%
133 100%
7469100%
6523 866 80 100% 100% 100%
1589 100%
doctoral degree 236 2223% 3%
2 0%
12 9%
196 3%
188 1 7 3% 0% 9%
40 3%
master's degree 3188 313135% 40%
222%
35 26%
2646 35%
2609 13 24 40% 2% 30%
542 34%
bachelor's degree 4798 4396 322 80 3987 3701 243 43 811 53% 56% 28% 60% 53% 57% 28% 54% 51%
associate's degree 795 4 9% 0%
78869%
3 2%
6108%
4 603 3 0% 70% 4%
185 12%
no nutrition/dietetics-related 41 30degree reported 0% 0%
8 1%
3 2%
30 0%
21 6 3 0% 1% 4%
11 1%
no answer 0 0 0 0 0 0 0 0 0 0% 0% 0% 0% 0% 0% 0% 0% 0%
Compensation & Benefits Survey of the Dietetics Profession 2013 180
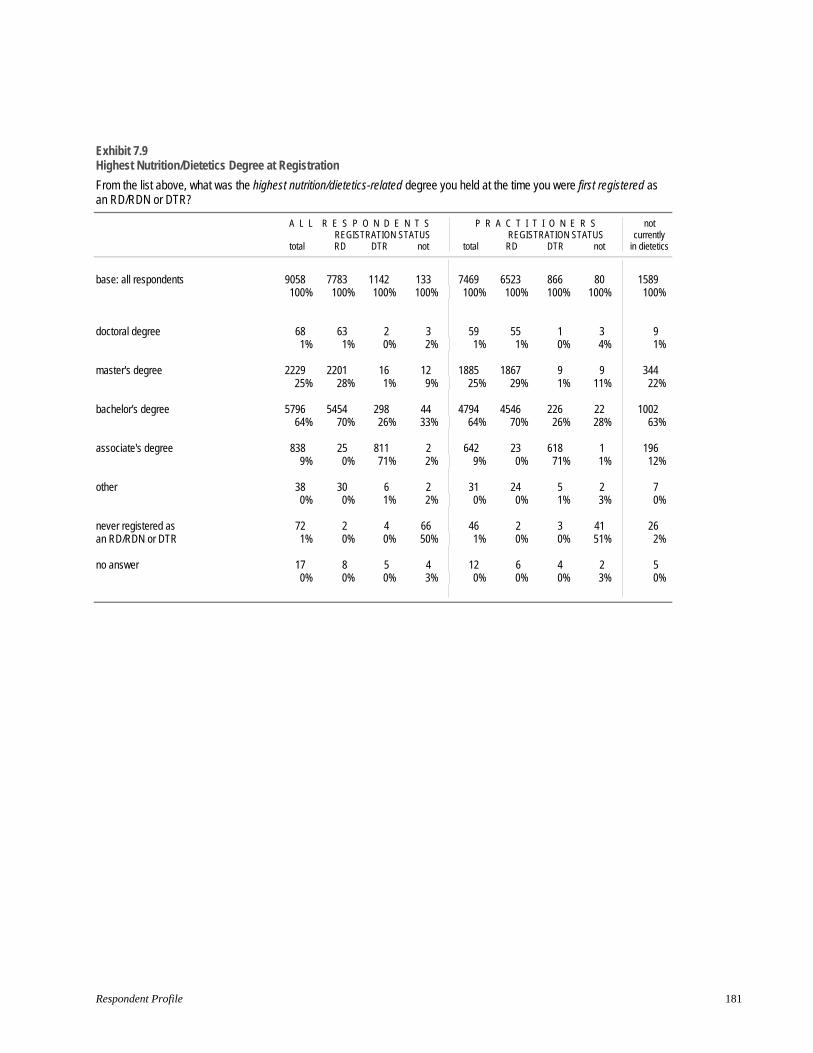
Exhibit 7.9 Highest Nutrition/Dietetics Degree at Registration
From the list above, what was the highest nutrition/dietetics-related degree you held at the time you were first registered as an RD/RDN or DTR?
A L L
total
R E S P O N D E N T SREGISTRATION STATUSRD DTR not
P R A C T I T I O N E R S REGISTRATION STATUS
total RD DTR not
not currently in dietetics
base: all respondents 9058100%
7783 100%
1142 100%
133 100%
7469100%
6523 100%
866 100%
80 100%
1589 100%
doctoral degree 68 1%
63 1%
2 0%
3 2%
59 1%
55 1%
1 0%
3 4%
9 1%
master's degree 2229 25%
2201 28%
161%
12 9%
1885 25%
1867 29%
9 1%
9 11%
344 22%
bachelor's degree 579664%
5454 70%
298 26%
44 33%
479464%
4546 70%
226 26%
22 28%
1002 63%
associate's degree 8389%
25 0%
811 71%
2 2%
6429%
23 0%
618 71%
1 1%
196 12%
other 38 0%
30 0%
6 1%
2 2%
31 0%
24 0%
5 1%
2 3%
7 0%
never registered as an RD/RDN or DTR
721%
2 0%
4 0%
66 50%
461%
2 0%
3 0%
41 51%
26 2%
no answer 170%
8 0%
5 0%
4 3%
120%
6 0%
4 0%
2 3%
5 0%
Respondent Profile 181

Exhibit 7.10 Year of First Employment in Dietetics
In what year did you first begin working in dietetics/nutrition?
A L L R E S P O N D E N T S P R A C T I T I O N E R S not REGISTRATION STATUS REGISTRATION STATUS currently
total RD DTR not total RD DTR not in dietetics
base: all respondents 9058 7783 1142 133 7469 6523 866 80 1589 100% 100% 100% 100% 100% 100% 100% 100% 100%
2010 or later 981 762 191 28 910 724 160 26 71 11% 10% 17% 21% 12% 11% 18% 33% 4%
2005 - 2009 1295 1177 113 5 1136 1042 90 4 159 14% 15% 10% 4% 15% 16% 10% 5% 10%
2000 - 2004 1098 1005 82 11 934 864 63 7 164 12% 13% 7% 8% 13% 13% 7% 9% 10%
1995 - 1999 1054 894 159 1 891 755 135 1 163 12% 11% 14% 1% 12% 12% 16% 1% 10%
1990 - 1994 926 774 142 10 779 656 114 9 147 10% 10% 12% 8% 10% 10% 13% 11% 9%
1985 - 1989 962 826 129 7 795 685 104 6 167 11% 11% 11% 5% 11% 11% 12% 8% 11%
1980 - 1984 1025 898 116 11 844 737 98 9 181 11% 12% 10% 8% 11% 11% 11% 11% 11%
1975 - 1979 962 863 90 9 752 679 70 3 210 11% 11% 8% 7% 10% 10% 8% 4% 13%
before 1975 522 470 33 19 360 331 20 9 162 6% 6% 3% 14% 5% 5% 2% 11% 10%
mean: 1994 1993 1995 1991 1994 1994 1995 1996 1990 standard error: 0 0 0 2 0 0 0 2 0 median: 1995 1995 1995 1992 1995 1996 1995 1999 1989
have not yet begun work in field 157 2%
58 1%
74 6%
25 19%
0 0%
0 0 0 0% 0% 0%
157 10%
no answer 76 56 13 7 68 50 12 6 8 1% 1% 1% 5% 1% 1% 1% 8% 1%
Compensation & Benefits Survey of the Dietetics Profession 2013 182

Exhibit 7.11 Years in Field
Excluding time you might have taken off to return to school, raise a family, or work in other areas, how many total years of work experience do you have in dietetics/nutrition?
A L L
total
R E S P O N D E N T SREGISTRATION STATUSRD DTR not
P R A C T I T I O N E R S REGISTRATION STATUS
total RD DTR not
not currently in dietetics
base: all respondents 9058100%
7783 100%
1142 100%
133 100%
7469100%
6523 100%
866 100%
80 100%
1589 100%
40 years or more 251 3%
226 3%
15 1%
10 8%
196 3%
177 3%
12 1%
7 9%
55 3%
30 - 39 years 1566 17%
1366 18%
180 16%
20 15%
1367 18%
1203 18%
151 17%
13 16%
199 13%
20 - 29 years 1845 20%
1569 20%
254 22%
22 17%
1606 22%
1369 21%
222 26%
15 19%
239 15%
15 - 19 years 101511%
859 11%
152 13%
4 3%
87512%
740 11%
132 15%
3 4%
140 9%
10 - 14 years 1278 14%
1167 15%
101 9%
10 8%
1050 14%
970 15%
74 9%
6 8%
228 14%
5 - 9 years 1373 15%
1247 16%
115 10%
11 8%
1091 15%
1001 15%
84 10%
6 8%
282 18%
3 - 4 years 692 8%
615 8%
72 6%
5 4%
550 7%
494 8%
52 6%
4 5%
142 9%
1 - 2 years 7358%
557 7%
159 14%
19 14%
5898%
459 7%
114 13%
16 20%
146 9%
less than 1 year 1842%
82 1%
757%
27 20%
411%
25 0%
10 1%
6 8%
143 9%
mean: standard error: median:
17.00.115
17.3 0.1 15
15.7 0.4
16
14.9 1.3 10
17.70.116
17.7 0.1 16
17.5 0.4 18
16.7 1.6 16
14.0 0.3 10
no answer 1191%
95 1%
19 2%
5 4%
1041%
85 1%
15 2%
4 5%
15 1%
Respondent Profile 183

Exhibit 7.12 Prior Career
Is dietetics/nutrition a second career for you?
A L L
total
R E S P O N D E N T SREGISTRATION STATUSRD DTR not
P R
total
A C T I T I O N E R S REGISTRATION STATUSRD DTR not
not currently in dietetics
base: all respondents 9058100%
7783 100%
1142 100%
133 100%
7469100%
6523 100%
866 100%
80 100%
1589 100%
yes 128114%
989 13%
271 24%
21 16%
105514%
848 13%
193 22%
14 18%
226 14%
no 7666 85%
6700 86%
85675%
110 83%
6321 85%
5594 86%
663 77%
64 80%
1345 85%
no answer 1111%
94 1%
15 1%
2 2%
931%
81 1%
10 1%
2 3%
18 1%
Exhibit 7.13 Registration Status
Registration Status [file data, not asked on survey]
A L L
total
R E S P O N D E N T SREGISTRATION STATUSRD DTR not
P R A C T I T I O N E R S REGISTRATION STATUS
total RD DTR not
not currently in dietetics
base: all respondents 9058100%
7783 100%
1142 100%
133 100%
7469100%
6523 866 100% 100%
80 100%
1589 100%
RD 7783 86%
7783 100%
0 0%
0 0%
6523 87%
6523 0 100% 0%
0 0%
1260 79%
DTR 114213%
0 0%
1142100%
0 0%
86612%
0 866 0% 100%
0 0%
276 17%
not registered 1331%
0 0%
0 0%
133 100%
801%
0 0 0% 0%
80 100%
53 3%
Compensation & Benefits Survey of the Dietetics Profession 2013 184
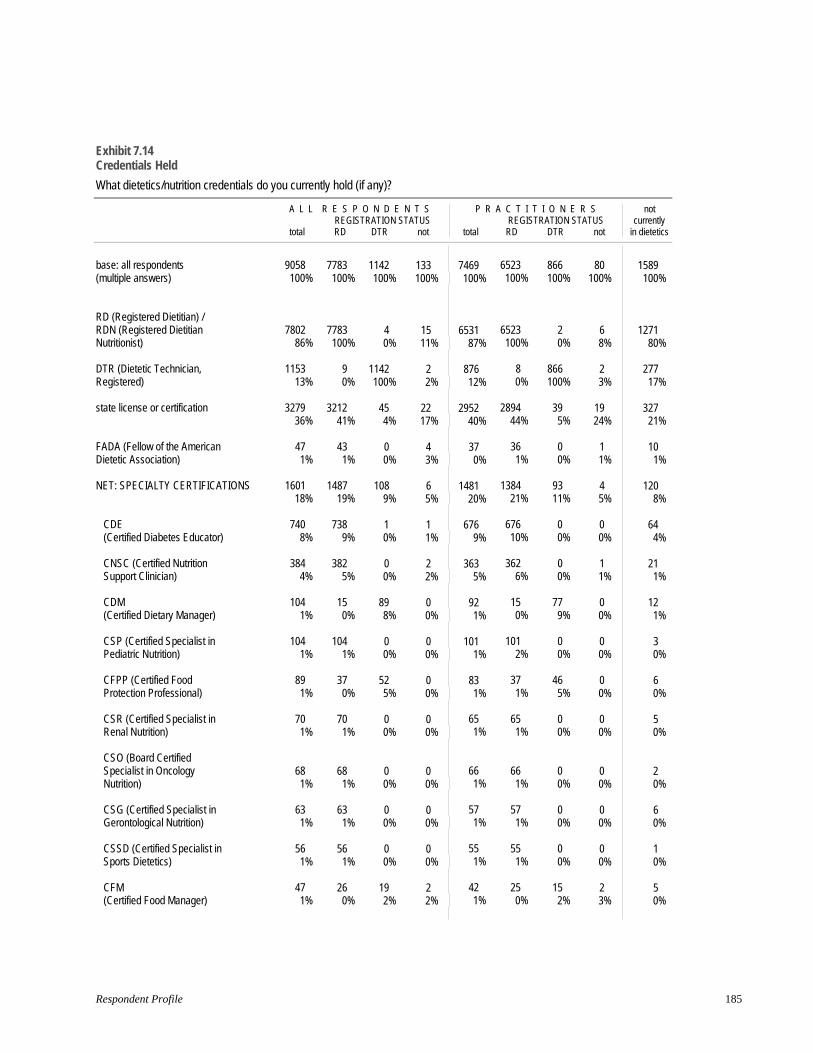
Exhibit 7.14 Credentials Held
What dietetics/nutrition credentials do you currently hold (if any)?
A L L R E S P O N D E N T S P R A C T I T I O N E R S not
total REGISTRATION STATUSRD DTR not total
REGISTRATION STATUSRD DTR not
currently in dietetics
base: all respondents (multiple answers)
RD (Registered Dietitian) / RDN (Registered Dietitian Nutritionist)
DTR (Dietetic Technician, Registered)
state license or certification
FADA (Fellow of the American Dietetic Association)
NET: SPECIALTY CERTIFICATIONS
CDE (Certified Diabetes Educator)
CNSC (Certified Nutrition Support Clinician)
CDM (Certified Dietary Manager)
CSP (Certified Specialist in Pediatric Nutrition)
CFPP (Certified Food Protection Professional)
CSR (Certified Specialist in Renal Nutrition)
CSO (Board Certified Specialist in Oncology
Nutrition)
CSG (Certified Specialist in Gerontological Nutrition)
CSSD (Certified Specialist inSports Dietetics)
CFM (Certified Food Manager)
9058100%
7802 86%
115313%
3279 36%
47 1%
160118%
740 8%
384 4%
1041%
104 1%
89 1%
70 1%
68 1%
63 1%
56 1%
471%
7783 100%
7783 100%
9 0%
3212 41%
43 1%
1487 19%
7389%
382 5%
150%
104 1%
37 0%
70 1%
68 1%
63 1%
56 1%
260%
1142 100%
4 0%
1142100%
454%
0 0%
108 9%
1 0%
0 0%
89 8%
0 0%
52 5%
0 0%
0 0%
0 0%
0 0%
19 2%
133 100%
15 11%
2 2%
22 17%
4 3%
6 5%
1 1%
2 2%
0 0%
0 0%
0 0%
0 0%
0 0%
0 0%
0 0%
2 2%
7469100%
6531 87%
87612%
2952 40%
37 0%
148120%
676 9%
363 5%
921%
101 1%
83 1%
65 1%
66 1%
57 1%
55 1%
421%
6523 100%
6523 100%
8 0%
2894 44%
36 1%
1384 21%
67610%
362 6%
150%
101 2%
37 1%
65 1%
66 1%
57 1%
55 1%
250%
866 100%
2 0%
866100%
395%
0 0%
93 11%
0 0%
0 0%
77 9%
0 0%
46 5%
0 0%
0 0%
0 0%
0 0%
15 2%
80 100%
6 8%
2 3%
19 24%
1 1%
4 5%
0 0%
1 1%
0 0%
0 0%
0 0%
0 0%
0 0%
0 0%
0 0%
2 3%
1589 100%
1271 80%
277 17%
327 21%
10 1%
120 8%
64 4%
21 1%
12 1%
3 0%
6 0%
5 0%
2 0%
6 0%
1 0%
5 0%
Respondent Profile 185

Exhibit 7.14 (continued) Credentials Held
What dietetics/nutrition credentials do you currently hold (if any)?
A L L
total
R E S P O N D E N T SREGISTRATION STATUSRD DTR not
P R A C T I T I O N E R S REGISTRATION STATUS
total RD DTR not
not currently in dietetics
base: all respondents (multiple answers)
9058100%
7783 100%
1142 100%
133 100%
7469100%
6523 866 80 100% 100% 100%
1589 100%
CHES (Certified Health Education Specialist)
17 0%
16 0%
0 0%
1 1%
14 0%
13 0 1 0% 0% 1%
3 0%
CLS (Clinical Lipid Specialist)
2 0%
2 0%
0 0%
0 0%
2 0%
2 0 0 0% 0% 0%
0 0%
CFE (Certified Food Executive)
1 0%
1 0%
0 0%
0 0%
1 0%
1 0 0 0% 0% 0%
0 0%
other: 568 6%
498 6%
555%
15 11%
504 7%
446 48 10 7% 6% 13%
64 4%
lactation certifications (IBCLC, CLC, CLE, CLS, etc.)
1692%
151 2%
18 2%
0 0%
1552%
140 15 0 2% 2% 0%
14 1%
other 399 4%
347 4%
373%
15 11%
349 5%
306 33 10 5% 4% 13%
50 3%
indicated one or more 8977 99%
7783 100%
1142 100%
52 39%
7423 99%
6523 866 34 100% 100% 43%
1554 98%
none of these 641%
0 0%
0 0%
64 48%
370%
0 0 37 0% 0% 46%
27 2%
Compensation & Benefits Survey of the Dietetics Profession 2013 186
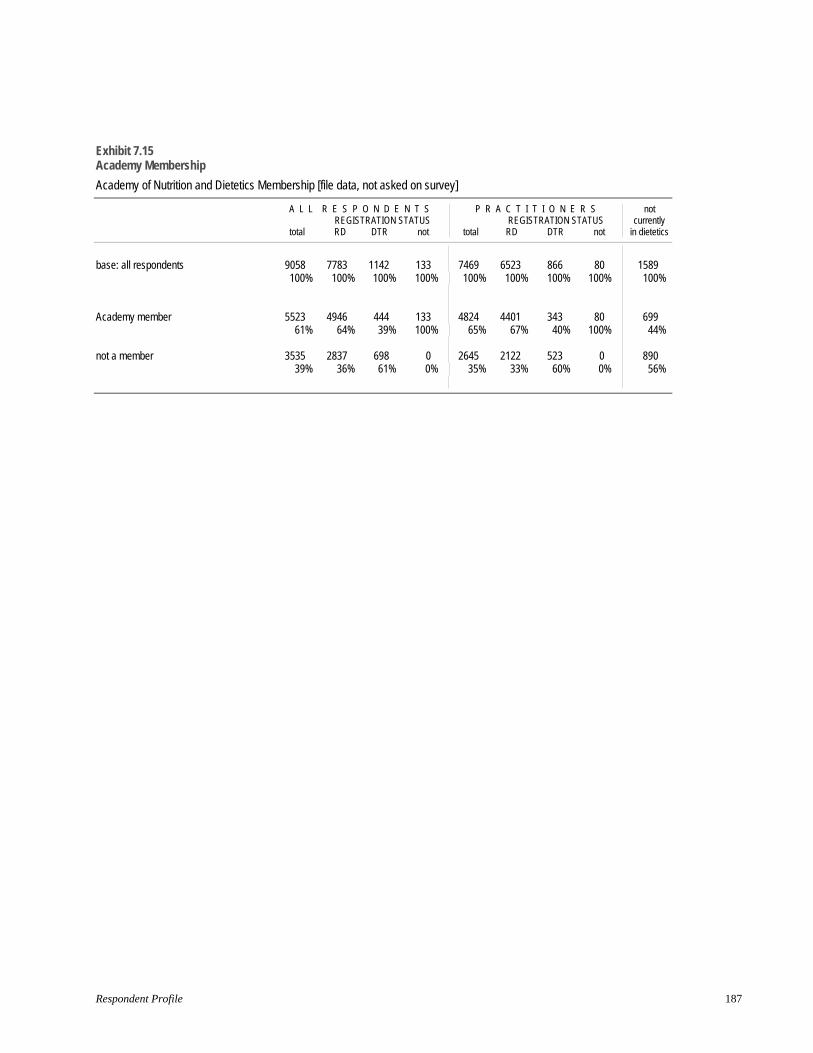
Exhibit 7.15 Academy Membership
Academy of Nutrition and Dietetics Membership [file data, not asked on survey]
A L L
total
R E S P O N D E N T SREGISTRATION STATUSRD DTR not
P R A C T I T I O N E R S REGISTRATION STATUS
total RD DTR not
not currently in dietetics
base: all respondents 9058100%
7783 100%
1142 100%
133 100%
7469100%
6523 100%
866 100%
80 100%
1589 100%
Academy member 5523 61%
4946 64%
44439%
133 100%
4824 65%
4401 67%
343 40%
80 100%
699 44%
not a member 3535 39%
2837 36%
698 61%
0 0%
2645 35%
2122 33%
523 60%
0 0%
890 56%
Respondent Profile 187
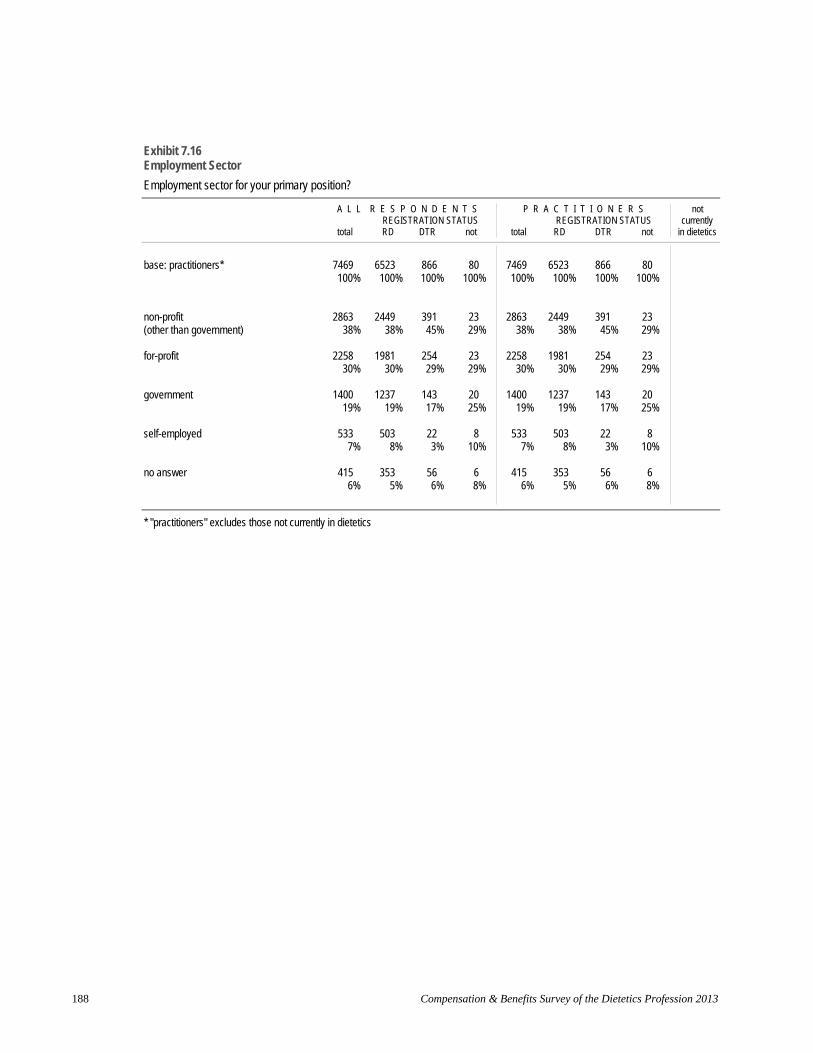
Exhibit 7.16 Employment Sector
Employment sector for your primary position?
A L L
total
R E S P O N D E N T SREGISTRATION STATUSRD DTR not
P R A C T I T I O N E R S REGISTRATION STATUS
total RD DTR not
not currently in dietetics
base: practitioners* 7469100%
6523 100%
866 100%
80 100%
7469100%
6523 866 80 100% 100% 100%
non-profit (other than government)
286338%
2449 38%
391 45%
23 29%
286338%
2449 391 23 38% 45% 29%
for-profit 225830%
1981 30%
254 29%
23 29%
225830%
1981 254 23 30% 29% 29%
government 140019%
1237 19%
143 17%
20 25%
140019%
1237 143 20 19% 17% 25%
self-employed 5337%
503 8%
22 3%
8 10%
5337%
503 22 8 8% 3% 10%
no answer 4156%
353 5%
56 6%
6 8%
4156%
353 56 6 5% 6% 8%
* "practitioners" excludes those not currently in dietetics
Compensation & Benefits Survey of the Dietetics Profession 2013 188

Exhibit 7.17 Work Setting
Which one option best matches where you work in your primary position?
A L L R E S P O N D E N T S P R A C T I T I O N E R S not
total REGISTRATION STATUSRD DTR not total
REGISTRATION STATUSRD DTR not
currently in dietetics
base: practitioners*
acute-care facility - inpatient
long-term, extended care, or assisted living facility (e.g., nursing home)
ambulatory / outpatient care facility (e.g., clinic, physician's office, etc.)
community or public health program
government agency or department
college, university, or teaching-hospital faculty
acute-care facility - outpatient
non-profit or not-for-profit agency / organization
private practice
school food service (K-12)
rehabilitation facility
contract food management company
wellness center or health club
food or equipment manufacturer, distributor, or retailer
7469100%
1835 25%
90512%
792 11%
545 7%
442 6%
439 6%
367 5%
261 3%
209 3%
166 2%
1372%
111 1%
1011%
97 1%
6523 100%
1543 24%
659 10%
78212%
472 7%
391 6%
400 6%
360 6%
216 3%
202 3%
134 2%
109 2%
104 2%
79 1%
84 1%
866 100%
285 33%
236 27%
5 1%
65 8%
405%
32 4%
7 1%
38 4%
3 0%
29 3%
26 3%
7 1%
20 2%
9 1%
80 100%
7 9%
10 13%
5 6%
8 10%
11 14%
7 9%
0 0%
7 9%
4 5%
3 4%
2 3%
0 0%
2 3%
4 5%
7469100%
1835 25%
90512%
792 11%
545 7%
442 6%
439 6%
367 5%
261 3%
209 3%
166 2%
1372%
111 1%
1011%
97 1%
6523 100%
1543 24%
659 10%
78212%
472 7%
391 6%
400 6%
360 6%
216 3%
202 3%
134 2%
109 2%
104 2%
79 1%
84 1%
866 100%
285 33%
236 27%
5 1%
65 8%
40 5%
32 4%
7 1%
38 4%
3 0%
29 3%
26 3%
7 1%
20 2%
9 1%
80 100%
7 9%
10 13%
5 6%
8 10%
11 14%
7 9%
0 0%
7 9%
4 5%
3 4%
2 3%
0 0%
2 3%
4 5%
Respondent Profile 189
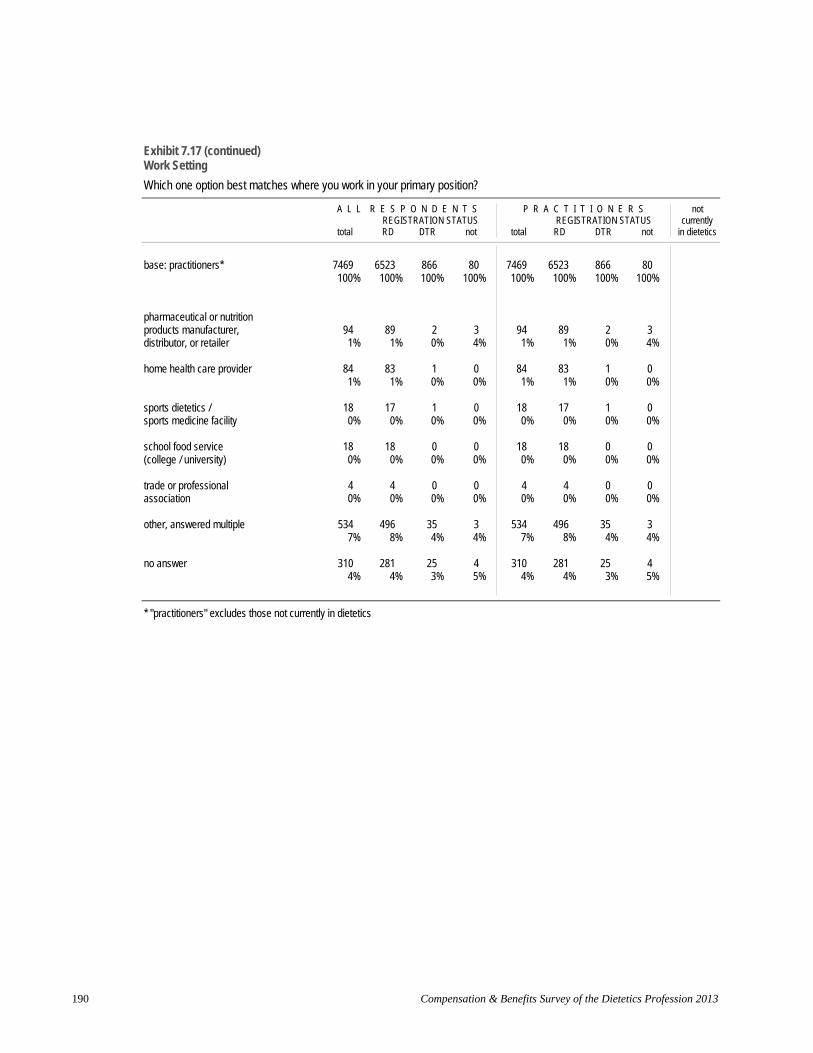
Exhibit 7.17 (continued) Work Setting
Which one option best matches where you work in your primary position?
A L L
total
R E S P O N D E N T SREGISTRATION STATUSRD DTR not
P R A C T I T I O N E R S REGISTRATION STATUS
total RD DTR not
not currently in dietetics
base: practitioners* 7469100%
6523 100%
866 100%
80 100%
7469100%
6523 866 80 100% 100% 100%
pharmaceutical or nutrition products manufacturer, distributor, or retailer
94 1%
89 1%
2 0%
3 4%
94 1%
89 2 3 1% 0% 4%
home health care provider 84 1%
83 1%
1 0%
0 0%
84 1%
83 1 0 1% 0% 0%
sports dietetics / sports medicine facility
18 0%
17 0%
1 0%
0 0%
18 0%
17 1 0 0% 0% 0%
school food service (college / university)
18 0%
18 0%
0 0%
0 0%
18 0%
18 0 0 0% 0% 0%
trade or professional association
4 0%
4 0%
0 0%
0 0%
4 0%
4 0 0 0% 0% 0%
other, answered multiple 534 7%
496 8%
35 4%
3 4%
534 7%
496 35 3 8% 4% 4%
no answer 3104%
281 4%
25 3%
4 5%
3104%
281 25 4 4% 3% 5%
* "practitioners" excludes those not currently in dietetics
Compensation & Benefits Survey of the Dietetics Profession 2013 190

Exhibit 7.18 Work Location (Census Division)
What is the city, state, and ZIP code of your primary work location?
A L L
total
R E S P O N D E N T SREGISTRATION STATUSRD DTR not
P R A C T I T I O N E R S REGISTRATION STATUS
total RD DTR not
not currently in dietetics
base: practitioners* 7469100%
6523 100%
866 100%
80 100%
7469100%
6523 100%
866 100%
80 100%
New England 4406%
372 6%
63 7%
5 6%
4406%
372 6%
63 7%
5 6%
Middle Atlantic 104914%
872 13%
156 18%
21 26%
104914%
872 13%
156 18%
21 26%
East North Central 1432 19%
1170 18%
250 29%
12 15%
1432 19%
1170 18%
250 29%
12 15%
West North Central 732 10%
646 10%
81 9%
5 6%
732 10%
646 10%
81 9%
5 6%
South Atlantic 1199 16%
1103 17%
8610%
10 13%
1199 16%
1103 17%
86 10%
10 13%
East South Central 399 5%
382 6%
15 2%
2 3%
399 5%
382 6%
15 2%
2 3%
West South Central 686 9%
636 10%
405%
10 13%
686 9%
636 10%
405%
10 13%
Mountain 4586%
409 6%
44 5%
5 6%
4586%
409 6%
44 5%
5 6%
Pacific 107014%
929 14%
131 15%
10 13%
107014%
929 14%
131 15%
10 13%
APO/FPO 4 0%
4 0%
0 0%
0 0%
4 0%
4 0%
0 0%
0 0%
no answer 0 0%
0 0%
0 0%
0 0%
0 0%
0 0%
0 0%
0 0%
* "practitioners" excludes those not currently in dietetics
Respondent Profile 191

Exhibit 7.19 Organization Size
Including you, how many people are employed by your organization? By your practice, if self-employed.
A L L R E S P O N D E N T S P R A C T I T I O N E R S not REGISTRATION STATUS REGISTRATION STATUS currently
total RD DTR not total RD DTR not in dietetics
base: practitioners* 7469 6523 866 80 7469 6523 866 80 100% 100% 100% 100% 100% 100% 100% 100%
25,000 or more 852 783 63 6 852 783 63 6 11% 12% 7% 8% 11% 12% 7% 8%
10,000 - 24,999 573 519 47 7 573 519 47 7 8% 8% 5% 9% 8% 8% 5% 9%
5,000 - 9,999 676 598 77 1 676 598 77 1 9% 9% 9% 1% 9% 9% 9% 1%
2,500 - 4,999 738 664 71 3 738 664 71 3 10% 10% 8% 4% 10% 10% 8% 4%
1,000 - 2,499 936 844 86 6 936 844 86 6 13% 13% 10% 8% 13% 13% 10% 8%
500 - 999 653 546 102 5 653 546 102 5 9% 8% 12% 6% 9% 8% 12% 6%
250 - 499 646 542 95 9 646 542 95 9 9% 8% 11% 11% 9% 8% 11% 11%
100 - 249 637 499 123 15 637 499 123 15 9% 8% 14% 19% 9% 8% 14% 19%
50 - 99 351 296 49 6 351 296 49 6 5% 5% 6% 8% 5% 5% 6% 8%
10 - 49 474 404 62 8 474 404 62 8 6% 6% 7% 10% 6% 6% 7% 10%
2 - 9 306 261 42 3 306 261 42 3 4% 4% 5% 4% 4% 4% 5% 4%
1 (yourself only) 434 6%
406 6%
21 2%
7 9%
434 6%
406 6%
21 7 2% 9%
mean: 5,729 5,948 4,213 4,108 5,729 5,948 4,213 4,108 standard error: 99 108 252 911 99 108 252 911 median: 1,219 1,403 631 244 1,219 1,403 631 244
no answer 193 161 28 4 193 161 28 4 3% 2% 3% 5% 3% 2% 3% 5%
* "practitioners" excludes those not currently in dietetics
Compensation & Benefits Survey of the Dietetics Profession 2013 192
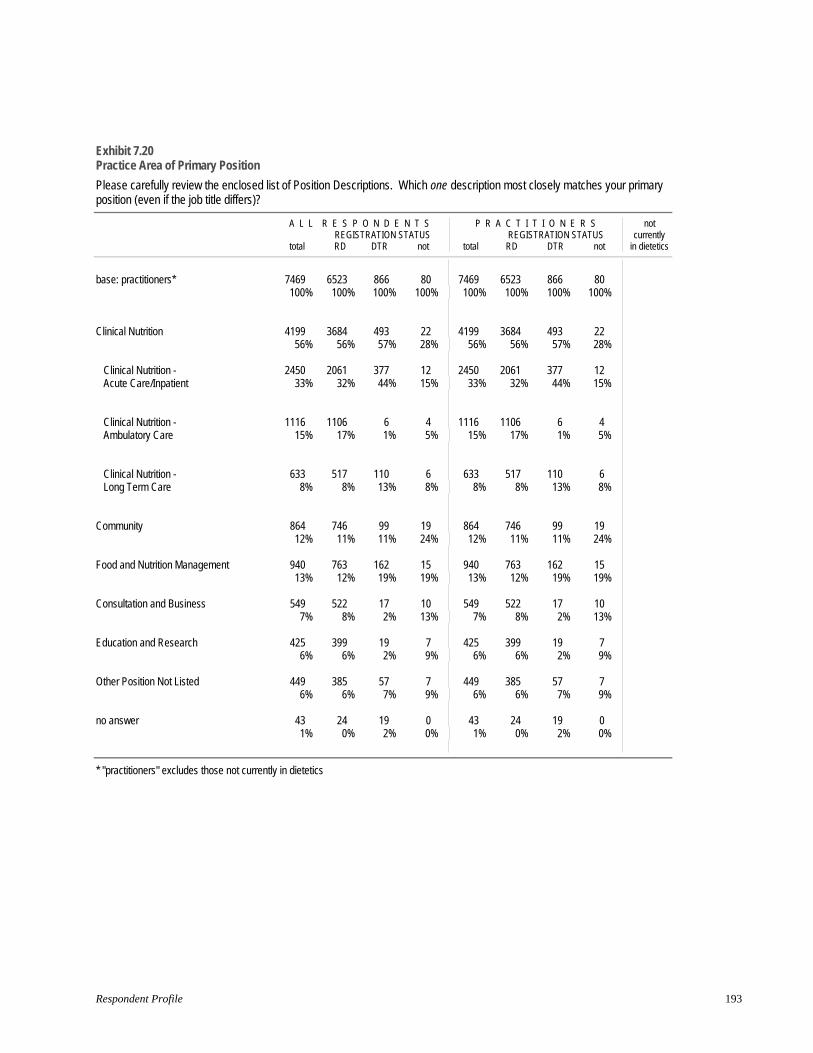
Exhibit 7.20 Practice Area of Primary Position
Please carefully review the enclosed list of Position Descriptions. Which one description most closely matches your primary position (even if the job title differs)?
A L L
total
R E S P O N D E N T SREGISTRATION STATUSRD DTR not
P R A C T I T I O N E R S REGISTRATION STATUS
total RD DTR not
not currently in dietetics
base: practitioners* 7469100%
6523 100%
866 100%
80 100%
7469100%
6523 100%
866 100%
80 100%
Clinical Nutrition 419956%
3684 56%
493 57%
22 28%
419956%
3684 56%
493 57%
22 28%
Clinical Nutrition Acute Care/Inpatient
2450 33%
2061 32%
377 44%
12 15%
2450 33%
2061 32%
377 44%
1215%
Clinical Nutrition Ambulatory Care
1116 15%
1106 17%
6 1%
4 5%
1116 15%
1106 17%
6 1%
4 5%
Clinical Nutrition Long Term Care
633 8%
517 8%
110 13%
6 8%
633 8%
517 8%
110 13%
6 8%
Community 864 12%
746 11%
9911%
19 24%
864 12%
746 11%
99 11%
19 24%
Food and Nutrition Management 94013%
763 12%
162 19%
15 19%
94013%
763 12%
162 19%
15 19%
Consultation and Business 549 7%
522 8%
172%
10 13%
549 7%
522 8%
17 2%
10 13%
Education and Research 425 6%
399 6%
19 2%
7 9%
425 6%
399 6%
19 2%
7 9%
Other Position Not Listed 449 6%
385 6%
57 7%
7 9%
449 6%
385 6%
57 7%
7 9%
no answer 431%
24 0%
19 2%
0 0%
431%
24 0%
19 2%
0 0%
* "practitioners" excludes those not currently in dietetics
Respondent Profile 193
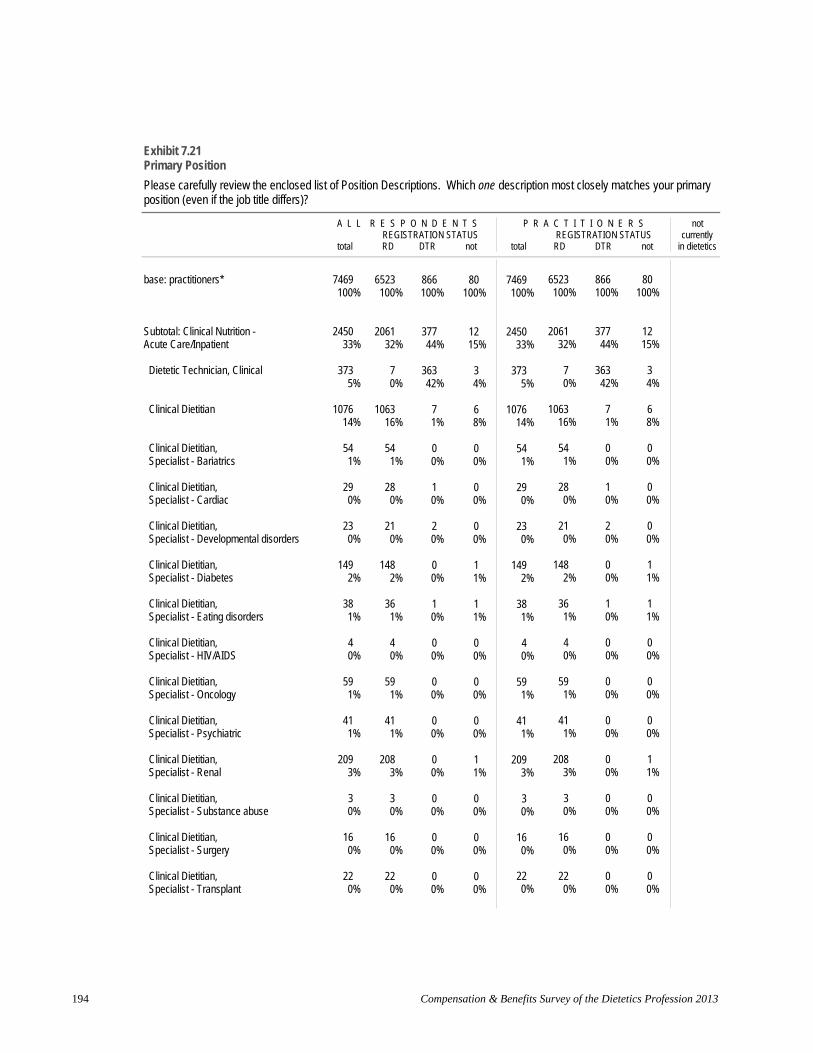
Exhibit 7.21 Primary Position
Please carefully review the enclosed list of Position Descriptions. Which one description most closely matches your primary position (even if the job title differs)?
A L L R E S P O N D E N T S P R A C T I T I O N E R S not REGISTRATION STATUS REGISTRATION STATUS currently
total RD DTR not total RD DTR not in dietetics
base: practitioners*
Subtotal: Clinical Nutrition Acute Care/Inpatient
Dietetic Technician, Clinical
Clinical Dietitian
Clinical Dietitian, Specialist - Bariatrics
Clinical Dietitian, Specialist - Cardiac
Clinical Dietitian, Specialist - Developmental disorders
Clinical Dietitian, Specialist - Diabetes
Clinical Dietitian, Specialist - Eating disorders
Clinical Dietitian, Specialist - HIV/AIDS
Clinical Dietitian, Specialist - Oncology
Clinical Dietitian, Specialist - Psychiatric
Clinical Dietitian, Specialist - Renal
Clinical Dietitian, Specialist - Substance abuse
Clinical Dietitian, Specialist - Surgery
Clinical Dietitian, Specialist - Transplant
7469100%
2450 33%
373 5%
1076 14%
54 1%
29 0%
23 0%
149 2%
38 1%
4 0%
59 1%
41 1%
209 3%
3 0%
16 0%
22 0%
6523 100%
2061 32%
7 0%
1063 16%
541%
280%
210%
1482%
361%
4 0%
591%
41 1%
2083%
3 0%
160%
220%
866 100%
377 44%
363 42%
7 1%
0 0%
1 0%
2 0%
0 0%
1 0%
0 0%
0 0%
0 0%
0 0%
0 0%
0 0%
0 0%
80 100%
12 15%
3 4%
6 8%
0 0%
0 0%
0 0%
1 1%
1 1%
0 0%
0 0%
0 0%
1 1%
0 0%
0 0%
0 0%
7469100%
2450 33%
373 5%
1076 14%
54 1%
29 0%
23 0%
149 2%
38 1%
4 0%
59 1%
41 1%
209 3%
3 0%
16 0%
22 0%
6523 866 80 100% 100% 100%
2061 377 12 32% 44% 15%
7 363 3 0% 42% 4%
1063 7 6 16% 1% 8%
54 0 0 1% 0% 0%
28 1 0 0% 0% 0%
21 2 0 0% 0% 0%
148 0 1 2% 0% 1%
36 1 1 1% 0% 1%
4 0 0 0% 0% 0%
59 0 0 1% 0% 0%
41 0 0 1% 0% 0%
208 0 1 3% 0% 1%
3 0 0 0% 0% 0%
16 0 0 0% 0% 0%
22 0 0 0% 0% 0%
Compensation & Benefits Survey of the Dietetics Profession 2013 194
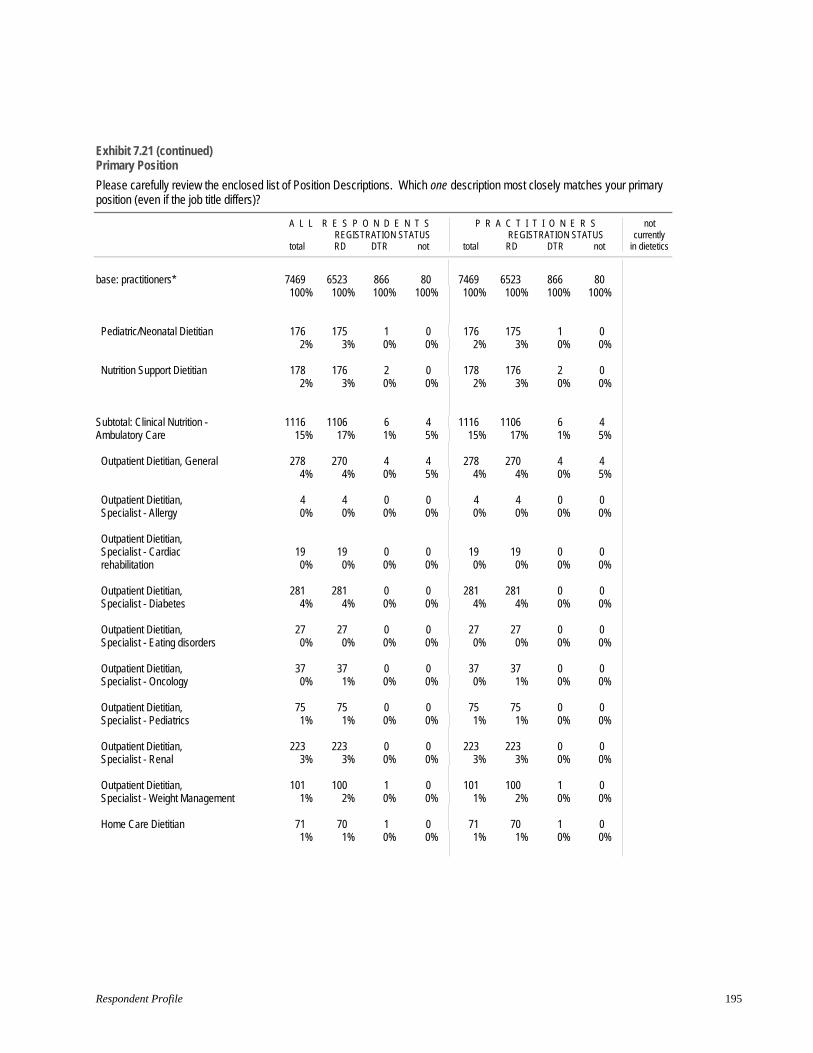
Exhibit 7.21 (continued) Primary Position
Please carefully review the enclosed list of Position Descriptions. Which one description most closely matches your primary position (even if the job title differs)?
A L L R E S P O N D E N T S P R A C T I T I O N E R S not REGISTRATION STATUS REGISTRATION STATUS currently
total RD DTR not total RD DTR not in dietetics
base: practitioners*
Pediatric/Neonatal Dietitian
Nutrition Support Dietitian
Subtotal: Clinical Nutrition Ambulatory Care
Outpatient Dietitian, General
Outpatient Dietitian, Specialist - Allergy
Outpatient Dietitian, Specialist - Cardiac rehabilitation
Outpatient Dietitian, Specialist - Diabetes
Outpatient Dietitian, Specialist - Eating disorders
Outpatient Dietitian, Specialist - Oncology
Outpatient Dietitian, Specialist - Pediatrics
Outpatient Dietitian, Specialist - Renal
Outpatient Dietitian, Specialist - Weight Management
Home Care Dietitian
7469 6523 866 80 7469 6523 866 80 100% 100% 100% 100% 100% 100% 100% 100%
176 175 1 0 176 175 1 0 2% 3% 0% 0% 2% 3% 0% 0%
178 176 2 0 178 176 2 0 2% 3% 0% 0% 2% 3% 0% 0%
1116 1106 6 4 1116 1106 6 4 15% 17% 1% 5% 15% 17% 1% 5%
278 270 4 4 278 270 4 4 4% 4% 0% 5% 4% 4% 0% 5%
4 4 0 0 4 4 0 0 0% 0% 0% 0% 0% 0% 0% 0%
19 19 0 0 19 19 0 0 0% 0% 0% 0% 0% 0% 0% 0%
281 281 0 0 281 281 0 0 4% 4% 0% 0% 4% 4% 0% 0%
27 27 0 0 27 27 0 0 0% 0% 0% 0% 0% 0% 0% 0%
37 37 0 0 37 37 0 0 0% 1% 0% 0% 0% 1% 0% 0%
75 75 0 0 75 75 0 0 1% 1% 0% 0% 1% 1% 0% 0%
223 223 0 0 223 223 0 0 3% 3% 0% 0% 3% 3% 0% 0%
101 100 1 0 101 100 1 0 1% 2% 0% 0% 1% 2% 0% 0%
71 70 1 0 71 70 1 0 1% 1% 0% 0% 1% 1% 0% 0%
Respondent Profile 195

Exhibit 7.21 (continued) Primary Position
Please carefully review the enclosed list of Position Descriptions. Which one description most closely matches your primary position (even if the job title differs)?
A L L R E S P O N D E N T S P R A C T I T I O N E R S not REGISTRATION STATUS REGISTRATION STATUS currently
total RD DTR not total RD DTR not in dietetics
base: practitioners*
Subtotal: Clinical Nutrition Long Term Care
Clinical Dietitian, Long Term Care
Dietetic Technician, Long Term Care
Subtotal: Education and Research
Instructor/Lecturer
Assistant Professor
Associate Professor
Professor
Administrator, Higher Education
Didactic Program Director
Dietetic Internship Director
Research Dietitian
7469 6523 866 80 7469 6523 866 80 100% 100% 100% 100% 100% 100% 100% 100%
633 517 110 6 633 517 110 6 8% 8% 13% 8% 8% 8% 13% 8%
529 515 9 5 529 515 9 5 7% 8% 1% 6% 7% 8% 1% 6%
104 2 101 1 104 2 101 1 1% 0% 12% 1% 1% 0% 12% 1%
425 399 19 7 425 399 19 7 6% 6% 2% 9% 6% 6% 2% 9%
108 97 9 2 108 97 9 2 1% 1% 1% 3% 1% 1% 1% 3%
66 66 0 0 66 66 0 0 1% 1% 0% 0% 1% 1% 0% 0%
51 49 2 0 51 49 2 0 1% 1% 0% 0% 1% 1% 0% 0%
41 36 1 4 41 36 1 4 1% 1% 0% 5% 1% 1% 0% 5%
14 14 0 0 14 14 0 0 0% 0% 0% 0% 0% 0% 0% 0%
20 20 0 0 20 20 0 0 0% 0% 0% 0% 0% 0% 0% 0%
28 28 0 0 28 28 0 0 0% 0% 0% 0% 0% 0% 0% 0%
97 89 7 1 97 89 7 1 1% 1% 1% 1% 1% 1% 1% 1%
Compensation & Benefits Survey of the Dietetics Profession 2013 196
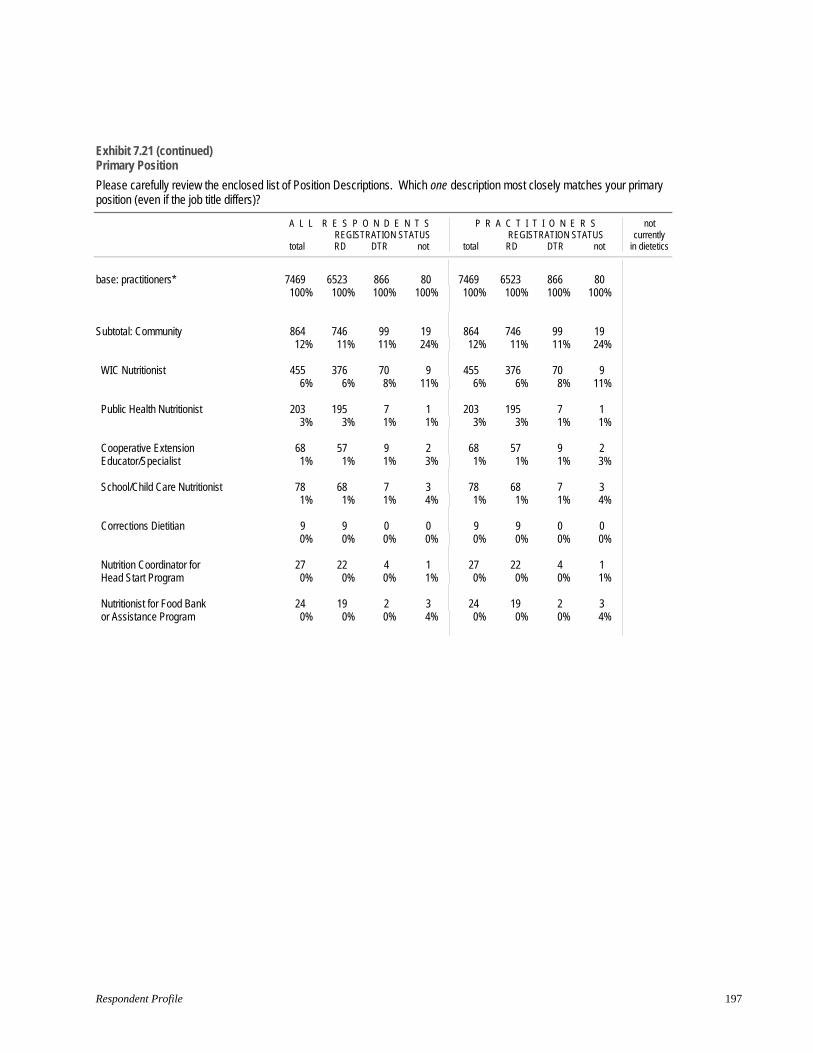
Exhibit 7.21 (continued) Primary Position
Please carefully review the enclosed list of Position Descriptions. Which one description most closely matches your primary position (even if the job title differs)?
A L L
total
R E S P O N D E N T SREGISTRATION STATUSRD DTR not
P R A C T I T I O N E R S REGISTRATION STATUS
total RD DTR not
not currently in dietetics
base: practitioners* 7469100%
Subtotal: Community 864 12%
WIC Nutritionist 455 6%
Public Health Nutritionist 203 3%
Cooperative Extension Educator/Specialist
68 1%
School/Child Care Nutritionist 78 1%
Corrections Dietitian 9 0%
Nutrition Coordinator for Head Start Program
27 0%
Nutritionist for Food Bank or Assistance Program
24 0%
6523 866 80 7469 6523 866 80 100% 100% 100% 100% 100% 100% 100%
746 99 19 864 746 99 19 11% 11% 24% 12% 11% 11% 24%
376 70 9 455 376 70 9 6% 8% 11% 6% 6% 8% 11%
195 7 1 203 195 7 1 3% 1% 1% 3% 3% 1% 1%
57 9 2 68 57 9 2 1% 1% 3% 1% 1% 1% 3%
68 7 3 78 68 7 3 1% 1% 4% 1% 1% 1% 4%
9 0 0 9 9 0 0 0% 0% 0% 0% 0% 0% 0%
22 4 1 27 22 4 1 0% 0% 1% 0% 0% 0% 1%
19 2 3 24 19 2 3 0% 0% 4% 0% 0% 0% 4%
Respondent Profile 197
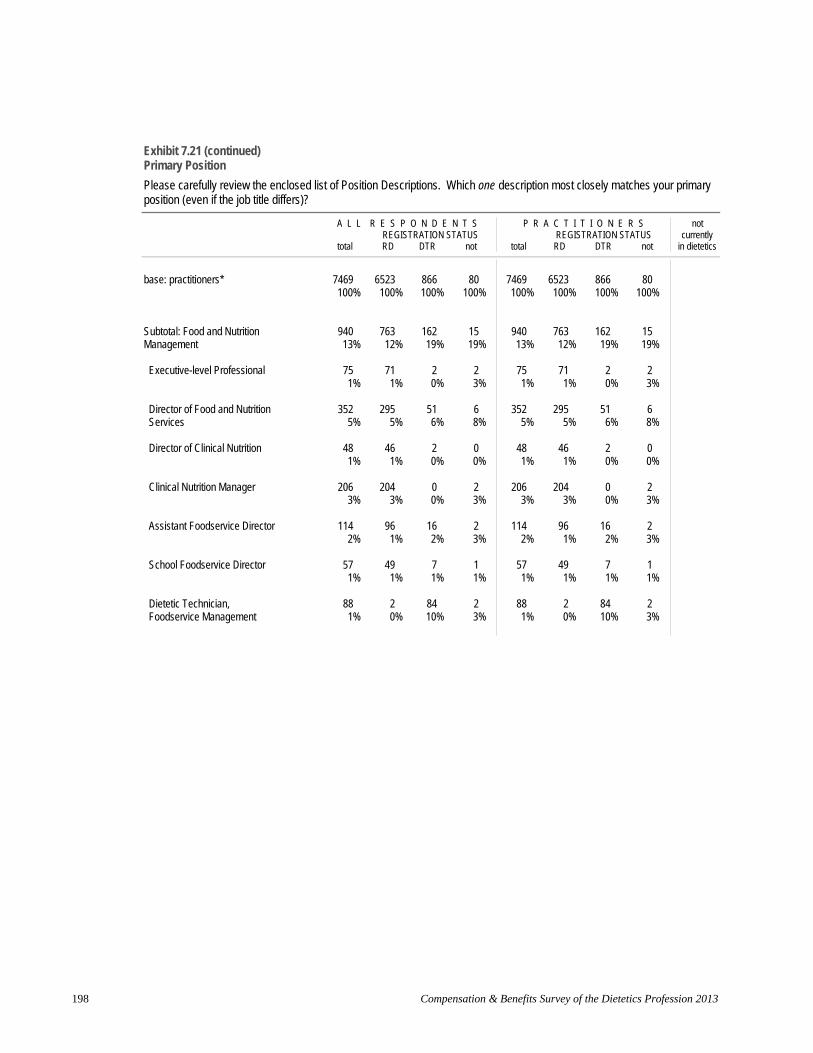
Exhibit 7.21 (continued) Primary Position
Please carefully review the enclosed list of Position Descriptions. Which one description most closely matches your primary position (even if the job title differs)?
A L L R E S P O N D E N T S P R A C T I T I O N E R S not REGISTRATION STATUS REGISTRATION STATUS currently
total RD DTR not total RD DTR not in dietetics
base: practitioners*
Subtotal: Food and Nutrition Management
Executive-level Professional
Director of Food and Nutrition Services
Director of Clinical Nutrition
Clinical Nutrition Manager
Assistant Foodservice Director
School Foodservice Director
Dietetic Technician, Foodservice Management
7469 6523 866 80 7469 6523 866 80 100% 100% 100% 100% 100% 100% 100% 100%
940 763 162 15 940 763 162 15 13% 12% 19% 19% 13% 12% 19% 19%
75 71 2 2 75 71 2 2 1% 1% 0% 3% 1% 1% 0% 3%
352 295 51 6 352 295 51 6 5% 5% 6% 8% 5% 5% 6% 8%
48 46 2 0 48 46 2 0 1% 1% 0% 0% 1% 1% 0% 0%
206 204 0 2 206 204 0 2 3% 3% 0% 3% 3% 3% 0% 3%
114 96 16 2 114 96 16 2 2% 1% 2% 3% 2% 1% 2% 3%
57 49 7 1 57 49 7 1 1% 1% 1% 1% 1% 1% 1% 1%
88 2 84 2 88 2 84 2 1% 0% 10% 3% 1% 0% 10% 3%
Compensation & Benefits Survey of the Dietetics Profession 2013 198
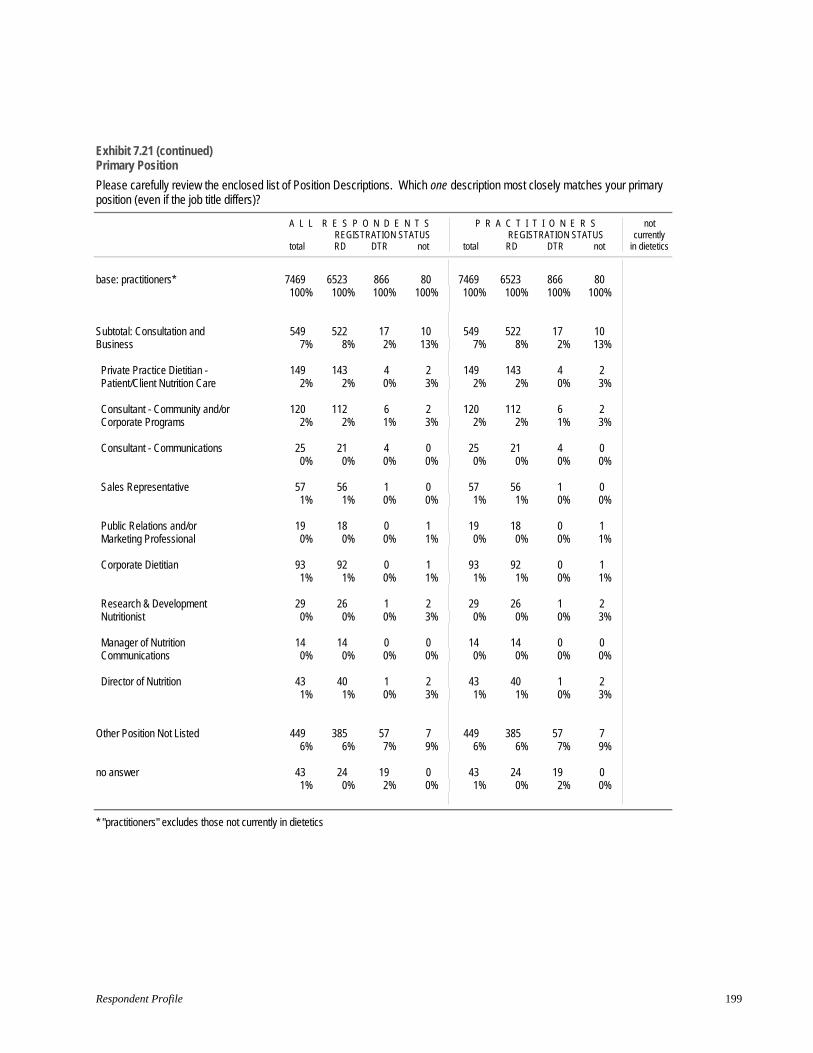
Exhibit 7.21 (continued) Primary Position
Please carefully review the enclosed list of Position Descriptions. Which one description most closely matches your primary position (even if the job title differs)?
A L L R E S P O N D E N T S P R A C T I T I O N E R S not
total REGISTRATION STATUSRD DTR not
REGISTRATION STATUS total RD DTR not
currently in dietetics
base: practitioners* 7469 6523 866 80 7469 6523 866 80 100% 100% 100% 100% 100% 100% 100% 100%
Subtotal: Consultation and 549 522 17 10 549 522 17 10 Business 7% 8% 2% 13% 7% 8% 2% 13%
Private Practice Dietitian 149 143 4 2 149 143 4 2 Patient/Client Nutrition Care 2% 2% 0% 3% 2% 2% 0% 3%
Consultant - Community and/or Corporate Programs
120 2%
112 2%
6 1%
2 3%
120 2%
112 2%
6 1%
2 3%
Consultant - Communications 25 21 4 0 25 21 4 0 0% 0% 0% 0% 0% 0% 0% 0%
Sales Representative 57 1%
56 1%
1 0%
0 0%
57 1%
56 1%
1 0%
0 0%
Public Relations and/or Marketing Professional
19 0%
18 0%
0 0%
1 1%
19 0%
18 0%
0 0%
1 1%
Corporate Dietitian 93 1%
92 1%
0 0%
1 1%
93 1%
92 1%
0 0%
1 1%
Research & Development 29 26 1 2 29 26 1 2 Nutritionist 0% 0% 0% 3% 0% 0% 0% 3%
Manager of Nutrition Communications
14 0%
14 0%
0 0%
0 0%
14 0%
14 0%
0 0%
0 0%
Director of Nutrition 43 40 1 2 43 40 1 2 1% 1% 0% 3% 1% 1% 0% 3%
Other Position Not Listed 449 385 57 7 449 385 57 7 6% 6% 7% 9% 6% 6% 7% 9%
no answer 43 24 19 0 43 24 19 0 1% 0% 2% 0% 1% 0% 2% 0%
* "practitioners" excludes those not currently in dietetics
Respondent Profile 199

Exhibit 7.22 Responsibility Level
What is this position's responsibility level?
A L L
total
R E S P O N D E N T SREGISTRATION STATUSRD DTR not
P R A C T I T I O N E R S REGISTRATION STATUS
total RD DTR not
not currently in dietetics
base: practitioners* 7469100%
6523 100%
866 100%
80 100%
7469100%
6523 866 80 100% 100% 100%
owner or partner 335 4%
312 5%
15 2%
8 10%
335 4%
312 15 8 5% 2% 10%
executive 92 1%
85 1%
5 1%
2 3%
92 1%
85 5 2 1% 1% 3%
director or manager 1563 21%
1383 21%
158 18%
22 28%
1563 21%
1383 158 22 21% 18% 28%
supervisor or coordinator 1396 19%
1190 18%
186 21%
20 25%
1396 19%
1190 186 20 18% 21% 25%
other 399453%
3477 53%
489 56%
28 35%
399453%
3477 489 28 53% 56% 35%
no answer 891%
76 1%
13 2%
0 0%
891%
76 13 0 1% 2% 0%
* "practitioners" excludes those not currently in dietetics
Compensation & Benefits Survey of the Dietetics Profession 2013 200
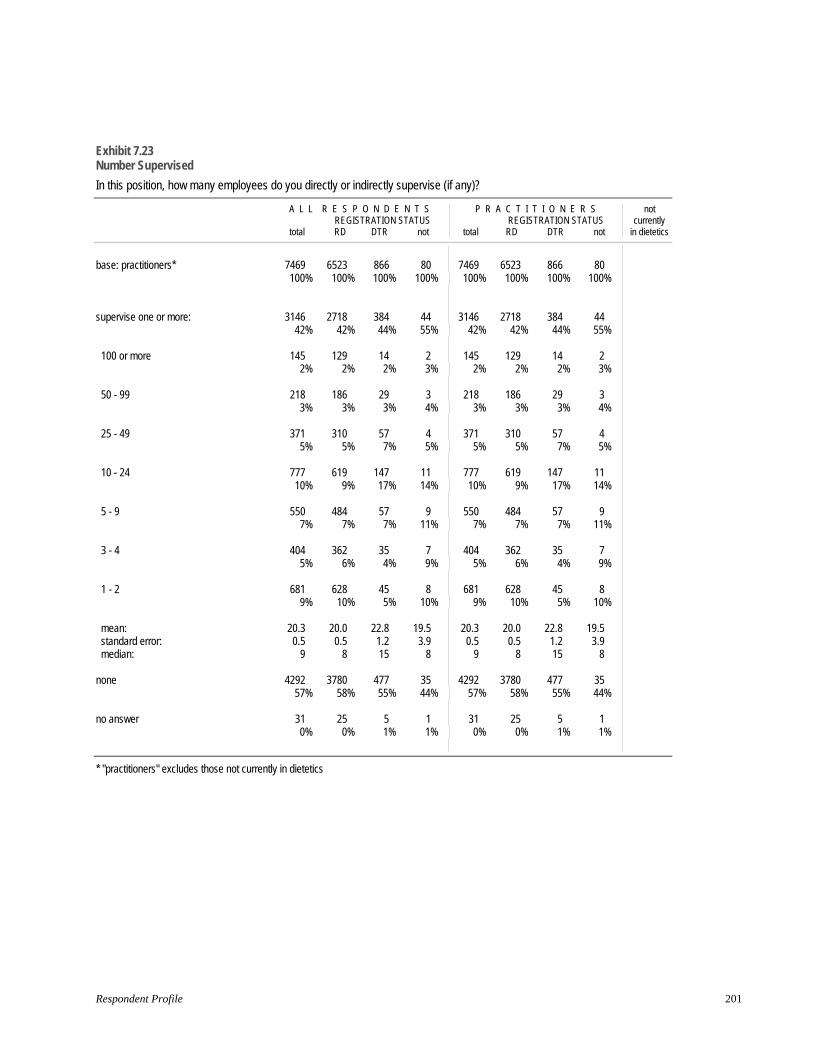
Exhibit 7.23 Number Supervised
In this position, how many employees do you directly or indirectly supervise (if any)?
A L L
total
R E S P O N D E N T SREGISTRATION STATUSRD DTR not
P R
total
A C T I T I O N E R S REGISTRATION STATUSRD DTR not
not currently in dietetics
base: practitioners* 7469100%
6523 100%
866 100%
80 100%
7469100%
6523 100%
866 100%
80 100%
supervise one or more: 3146 42%
2718 42%
384 44%
44 55%
3146 42%
2718 42%
384 44%
44 55%
100 or more 145 2%
129 2%
14 2%
2 3%
145 2%
129 2%
14 2%
2 3%
50 - 99 218 3%
186 3%
29 3%
3 4%
218 3%
186 3%
29 3%
3 4%
25 - 49 371 5%
310 5%
57 7%
4 5%
371 5%
310 5%
57 7%
4 5%
10 - 24 777 10%
619 9%
147 17%
11 14%
777 10%
619 9%
147 17%
11 14%
5 - 9 550 7%
484 7%
57 7%
9 11%
550 7%
484 7%
57 7%
9 11%
3 - 4 404 5%
362 6%
35 4%
7 9%
404 5%
362 6%
35 4%
7 9%
1 - 2 681 9%
628 10%
45 5%
8 10%
681 9%
628 10%
45 5%
8 10%
mean: standard error: median:
20.3 0.5
9
20.0 0.5
8
22.8 1.215
19.5 3.9
8
20.30.5
9
20.0 0.5
8
22.8 1.2
15
19.5 3.9
8
none 429257%
3780 58%
477 55%
35 44%
429257%
3780 58%
477 55%
35 44%
no answer 31 0%
25 0%
5 1%
1 1%
31 0%
25 0%
5 1%
1 1%
* "practitioners" excludes those not currently in dietetics
Respondent Profile 201

Exhibit 7.24 Budget Responsibility
In this position, approximately what is the size of the budget you manage (if applicable)?
A L L
total
R E S P O N D E N T SREGISTRATION STATUSRD DTR not
P R
total
A C T I T I O N E R S REGISTRATION STATUSRD DTR not
not currently in dietetics
base: practitioners* 7469100%
6523 100%
866 100%
80 100%
7469100%
6523 100%
866 100%
80 100%
manage a budget: 1828 24%
1601 25%
198 23%
29 36%
1828 24%
1601 25%
198 23%
29 36%
$1 million or more 544 7%
497 8%
38 4%
9 11%
544 7%
497 8%
38 4%
9 11%
$500,000 - $999,999 230 3%
191 3%
34 4%
5 6%
230 3%
191 3%
34 4%
5 6%
$250,000 - $499,999 261 3%
223 3%
33 4%
5 6%
261 3%
223 3%
33 4%
5 6%
$100,000 - $249,999 267 4%
222 3%
41 5%
4 5%
267 4%
222 3%
41 5%
4 5%
$50,000 - $99,999 142 2%
126 2%
15 2%
1 1%
142 2%
126 2%
15 2%
1 1%
$25,000 - $49,999 123 2%
103 2%
16 2%
4 5%
123 2%
103 2%
16 2%
4 5%
less than $25,000 261 3%
239 4%
21 2%
1 1%
261 3%
239 4%
21 2%
1 1%
mean ($000): standard error: median:
4839
366
48810
374
431 26 293
537 73
500
4839
366
48810
374
431 26 293
537 73
500
does not apply 5561 74%
4861 75%
649 75%
51 64%
5561 74%
4861 75%
649 75%
51 64%
no answer 801%
61 1%
19 2%
0 0%
801%
61 1%
19 2%
0 0%
* "practitioners" excludes those not currently in dietetics
Compensation & Benefits Survey of the Dietetics Profession 2013 202

Exhibit 7.25 Nutritional Risk of Patients/Clients Seen
If you work with patients or clients in this position, how would you characterize the nutritional risk of the majority of your patients?
A L L
total
R E S P O N D E N T SREGISTRATION STATUSRD DTR not
P R A C T I T I O N E R S REGISTRATION STATUS
total RD DTR not
not currently in dietetics
base: practitioners* 7469100%
6523 100%
866 100%
80 100%
7469100%
6523 100%
866 100%
80 100%
low or no risk 71610%
578 9%
134 15%
4 5%
71610%
578 9%
134 15%
4 5%
moderate risk 361448%
3093 47%
486 56%
35 44%
361448%
3093 47%
486 56%
35 44%
high risk 182024%
1673 26%
129 15%
18 23%
182024%
1673 26%
129 15%
18 23%
do not work with patients/clients
1207 16%
1081 17%
103 12%
23 29%
1207 16%
1081 17%
103 12%
23 29%
no answer 1121%
98 2%
14 2%
0 0%
1121%
98 2%
14 2%
0 0%
* "practitioners" excludes those not currently in dietetics
Respondent Profile 203

Exhibit 7.26 Registration Requirements
Is registration as an RD/RDN or DTR a requirement for employment in this position?
A L L
total
R E S P O N D E N T SREGISTRATION STATUSRD DTR not
P R A C T I T I O N E R S REGISTRATION STATUS
total RD DTR not
not currently in dietetics
base: practitioners* (multiple answers)
7469100%
6523 100%
866 100%
80 100%
7469100%
6523 866 80 100% 100% 100%
RD/RDN is required 5487 73%
5438 83%
374%
12 15%
5487 73%
5438 37 12 83% 4% 15%
RD/RDN is preferred but not required
853 11%
767 12%
465%
40 50%
853 11%
767 46 40 12% 5% 50%
RD/RDN makes no difference 348 5%
285 4%
455%
18 23%
348 5%
285 45 18 4% 5% 23%
DTR is required 474 6%
20 0%
454 52%
0 0%
474 6%
20 454 0 0% 52% 0%
DTR is preferred but not required
236 3%
11 0%
222 26%
3 4%
236 3%
11 222 3 0% 26% 4%
DTR makes no difference 2063%
50 1%
14417%
12 15%
2063%
50 144 12 1% 17% 15%
indicated one or more 7424 99%
6492 100%
854 99%
78 98%
7424 99%
6492 854 78 100% 99% 98%
no answer 451%
31 0%
12 1%
2 3%
451%
31 12 2 0% 1% 3%
* "practitioners" excludes those not currently in dietetics
Compensation & Benefits Survey of the Dietetics Profession 2013 204
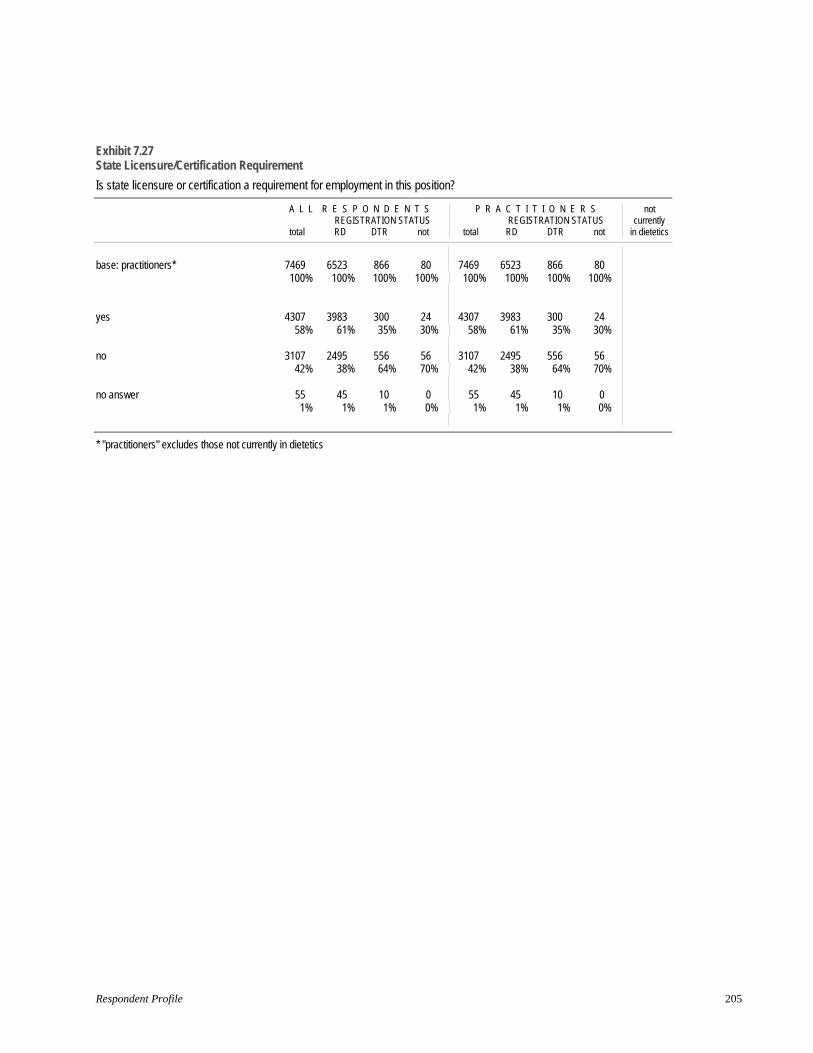
Exhibit 7.27 State Licensure/Certification Requirement
Is state licensure or certification a requirement for employment in this position?
A L L
total
R E S P O N D E N T SREGISTRATION STATUSRD DTR not
P R
total
A C T I T I O N E R S REGISTRATION STATUSRD DTR not
not currently in dietetics
base: practitioners* 7469100%
6523 100%
866 100%
80 100%
7469100%
6523 100%
866 100%
80 100%
yes 430758%
3983 61%
300 35%
24 30%
430758%
3983 61%
300 35%
24 30%
no 310742%
2495 38%
556 64%
56 70%
310742%
2495 38%
556 64%
56 70%
no answer 551%
45 1%
10 1%
0 0%
551%
45 1%
10 1%
0 0%
* "practitioners" excludes those not currently in dietetics
Respondent Profile 205

Exhibit 7.28 Years in Position
How many years have you worked in this primary dietetics-related position?
A L L
total
R E S P O N D E N T SREGISTRATION STATUSRD DTR not
P R A C T I T I O N E R S REGISTRATION STATUS
total RD DTR not
not currently in dietetics
base: practitioners* 7469100%
6523 100%
866 100%
80 100%
7469100%
6523 866 80 100% 100% 100%
30 years or more 388 5%
313 5%
68 8%
7 9%
388 5%
313 68 7 5% 8% 9%
20 - 29 years 86612%
715 11%
138 16%
13 16%
86612%
715 138 13 11% 16% 16%
15 - 19 years 6759%
562 9%
110 13%
3 4%
6759%
562 110 3 9% 13% 4%
10 - 14 years 107414%
945 14%
120 14%
9 11%
107414%
945 120 9 14% 14% 11%
5 - 9 years 1672 22%
1515 23%
145 17%
12 15%
1672 22%
1515 145 12 23% 17% 15%
3 - 4 years 800 11%
742 11%
55 6%
3 4%
800 11%
742 55 3 11% 6% 4%
1 - 2 years 1681 23%
1461 22%
194 22%
26 33%
1681 23%
1461 194 26 22% 22% 33%
less than 1 year 274 4%
238 4%
31 4%
5 6%
274 4%
238 31 5 4% 4% 6%
mean: standard error: median:
9.9 0.1
7
9.6 0.1
7
11.9 0.3
10
11.1 1.3
8
9.9 0.1
7
9.6 11.9 11.1 0.1 0.3 1.3
7 10 8
no answer 39 1%
32 0%
5 1%
2 3%
39 1%
32 5 2 0% 1% 3%
* "practitioners" excludes those not currently in dietetics
Compensation & Benefits Survey of the Dietetics Profession 2013 206

Exhibit 7.29 Eligibility to Receive Overtime Compensation
In this position, are you eligible to receive overtime compensation?
A L L
total
R E S P O N D E N T SREGISTRATION STATUSRD DTR not
P R
total
A C T I T I O N E R S REGISTRATION STATUSRD DTR not
not currently in dietetics
base: practitioners* 7469100%
6523 100%
866 100%
80 100%
7469100%
6523 100%
866 100%
80 100%
yes 156421%
1146 18%
401 46%
17 21%
156421%
1146 18%
401 46%
17 21%
no 582478%
5305 81%
456 53%
63 79%
582478%
5305 81%
456 53%
63 79%
no answer 81 1%
72 1%
9 1%
0 0%
81 1%
72 1%
9 1%
0 0%
* "practitioners" excludes those not currently in dietetics
Respondent Profile 207

Exhibit 7.30 Benefits Level
As of April 1, 2013, what retirement benefits (if any) were offered as part of your employment/self-employment in this position (whether you took advantage of them or not)? Which of these insurance-related benefits?
A L L R E S P O N D E N T S P R A C T I T I O N E R S not
total REGISTRATION STATUSRD DTR not
REGISTRATION STATUS total RD DTR not
currently in dietetics
base: practitioners* 7469 6523 866 80 7469 6523 866 80 100% 100% 100% 100% 100% 100% 100% 100%
high employer offers/contributes
to 8+ of the 16 retirement and insurance-related 3387 2997 356 34 3387 2997 356 34 benefits asked about 45% 46% 41% 43% 45% 46% 41% 43%
medium employer offers
8+ of the 16 retirement and insurance-related
benefits asked about, 2333 2002 309 22 2333 2002 309 22 contributes to fewer than 8 31% 31% 36% 28% 31% 31% 36% 28%
low 1733 1511 199 23 1733 1511 199 23 all others 23% 23% 23% 29% 23% 23% 23% 29%
no answer 16 13 2 1 16 13 2 1 0% 0% 0% 1% 0% 0% 0% 1%
* "practitioners" excludes those not currently in dietetics
Compensation & Benefits Survey of the Dietetics Profession 2013 208
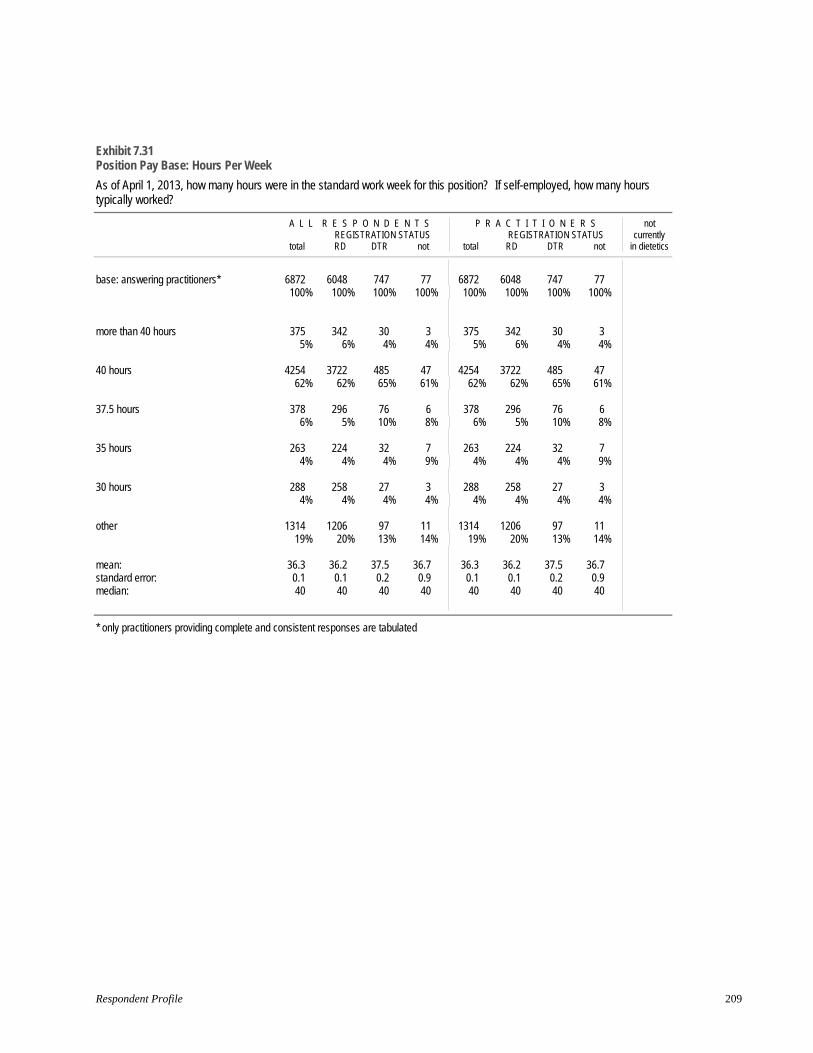
Exhibit 7.31 Position Pay Base: Hours Per Week
As of April 1, 2013, how many hours were in the standard work week for this position? If self-employed, how many hours typically worked?
A L L
total
R E S P O N D E N T SREGISTRATION STATUSRD DTR not
P R A C T I T I O N E R S REGISTRATION STATUS
total RD DTR not
not currently in dietetics
base: answering practitioners* 6872 100%
6048 100%
747 100%
77 100%
6872 100%
6048 100%
747 100%
77 100%
more than 40 hours 375 5%
342 6%
30 4%
3 4%
375 5%
342 6%
30 4%
3 4%
40 hours 425462%
3722 62%
485 65%
47 61%
425462%
3722 62%
485 65%
47 61%
37.5 hours 3786%
296 5%
76 10%
6 8%
3786%
296 5%
76 10%
6 8%
35 hours 2634%
224 4%
32 4%
7 9%
2634%
224 4%
32 4%
7 9%
30 hours 2884%
258 4%
27 4%
3 4%
2884%
258 4%
27 4%
3 4%
other 1314 19%
1206 20%
9713%
11 14%
1314 19%
1206 20%
97 13%
11 14%
mean: standard error: median:
36.30.140
36.2 0.1 40
37.5 0.2
40
36.7 0.9 40
36.30.140
36.2 0.1 40
37.5 0.2 40
36.7 0.9 40
* only practitioners providing complete and consistent responses are tabulated
Respondent Profile 209

Exhibit 7.32 Position Pay Base: Weeks Per Year
Is this a year-round position, or less than year-round (like some teaching jobs)? [IF LESS] How many weeks per year?
A L L
total
R E S P O N D E N T SREGISTRATION STATUSRD DTR not
P R
total
A C T I T I O N E R S REGISTRATION STATUSRD DTR not
not currently in dietetics
base: answering practitioners* 6872 100%
6048 100%
747 100%
77 100%
6872 100%
6048 100%
747 100%
77 100%
52 weeks (year-round) 6840 100%
6017 99%
746 100%
77 100%
6840 100%
6017 99%
746 100%
77 100%
48 - 51 weeks 2 0%
2 0%
0 0%
0 0%
2 0%
2 0%
0 0%
0 0%
44 - 47 weeks 3 0%
3 0%
0 0%
0 0%
3 0%
3 0%
0 0%
0 0%
40 - 43 weeks 3 0%
3 0%
0 0%
0 0%
3 0%
3 0%
0 0%
0 0%
36 - 39 weeks 3 0%
3 0%
0 0%
0 0%
3 0%
3 0%
0 0%
0 0%
32 - 35 weeks 3 0%
3 0%
0 0%
0 0%
3 0%
3 0%
0 0%
0 0%
26 - 31 weeks 5 0%
5 0%
0 0%
0 0%
5 0%
5 0%
0 0%
0 0%
less than 26 weeks 13 0%
12 0%
1 0%
0 0%
13 0%
12 0%
1 0%
0 0%
mean: standard error: median:
51.90.052
51.9 0.0 52
52.0 0.0
52
52.0 0.0 52
51.90.052
51.9 0.0 52
52.0 0.0 52
52.0 0.0 52
* only practitioners providing complete and consistent responses are tabulated
Compensation & Benefits Survey of the Dietetics Profession 2013 210

Exhibit 7.33 Position Pay Base: Hours Per Year
Is this a year-round position, or less than year-round (like some teaching jobs)? [IF LESS] How many weeks per year? As of April 1, 2013, how many hours were in the standard work week for this position? If self-employed, how many hours typically worked?
A L L R E S P O N D E N T S P R A C T I T I O N E R S not
total REGISTRATION STATUSRD DTR not
REGISTRATION STATUS total RD DTR not
currently in dietetics
base: answering practitioners* 6872 100%
6048 100%
747 100%
77 100%
6872 100%
6048 100%
747 100%
77 100%
2080 hours 4622 4057 515 50 4622 4057 515 50 (40 hours x 52 weeks) 67% 67% 69% 65% 67% 67% 69% 65%
1820 - 2079 hours 707 575 119 13 707 575 119 13 (35+ hours x 52 weeks) 10% 10% 16% 17% 10% 10% 16% 17%
1560 - 1819 hours 506 454 49 3 506 454 49 3 (30+ hours x 52 weeks) 7% 8% 7% 4% 7% 8% 7% 4%
1040 - 1559 hours 643 593 42 8 643 593 42 8 (20+ hours x 52 weeks) 9% 10% 6% 10% 9% 10% 6% 10%
520 - 1039 hours 264 245 16 3 264 245 16 3 (10+ hours x 52 weeks) 4% 4% 2% 4% 4% 4% 2% 4%
less than 520 hours 130 124 6 0 130 124 6 0 (<10 hours x 52 weeks) 2% 2% 1% 0% 2% 2% 1% 0%
mean: 1,856 1,846 1,930 1,885 1,856 1,846 1,930 1,885 standard error: 5 6 12 41 5 6 12 41 median: 2,080 2,080 2,080 2,080 2,080 2,080 2,080 2,080
* only practitioners providing complete and consistent responses are tabulated
Respondent Profile 211

Exhibit 7.34 Position Pay Base: Incidence of Full-Time Employment
Is this a year-round position, or less than year-round (like some teaching jobs)? [IF LESS] How many weeks per year? As of April 1, 2013, how many hours were in the standard work week for this position? If self-employed, how many hours typically worked?
A L L
total
R E S P O N D E N T SREGISTRATION STATUSRD DTR not
P R A C T I T I O N E R S REGISTRATION STATUS
total RD DTR not
not currently in dietetics
FULL-TIME EMPLOYMENT 35+ hours per week 48+ weeks per year
base: answering practitioners* 6872 100%
6048 100%
747 100%
77 100%
6872 100%
6048 747 77 100% 100% 100%
employed full time 5329 78%
4632 77%
634 85%
63 82%
5329 78%
4632 634 63 77% 85% 82%
employed less than full time 1543 22%
1416 23%
113 15%
14 18%
1543 22%
1416 113 14 23% 15% 18%
* only practitioners providing complete and consistent responses are tabulated
Compensation & Benefits Survey of the Dietetics Profession 2013 212

8. Appendix
Methodological Notes
Sample Composition and Disposition The survey sample of 30,000 was selected by Readex Research, the survey contractor, in systematic stratified fashion from the population of all domestic active category Academy members (N = 53,113) plus all domestic nonmembers (N = 37,229) maintaining current registration as a Registered Dietitian (RD) or Dietetic Technician, Registered (DTR). Because of their relatively small numbers, the sample was stratified to overrepresent DTRs.
A total of 9,058 responses was received, for a 30% response rate overall. The response rate was highest among RDs (31%), lowest among those not registered (19%). Although a 30% response rate represents a strong showing for a mixed mode (Internet and regular mail) survey of this type, possible effects of nonresponse bias need to be considered in interpreting results.
Most data tables are based on the 7,469 "practitioners" currently working in a dietetics-related position. The margin of error (maximum sampling error for percentages at the 95% confidence level) is ±1.0% overall, 1.1% for all practitioners.
The table below details population, sample, and response by registration status and by Academy membership:
Registration Status RD DTR Not TOTAL
POPULATION53,113
Not Academy members 34,376 2,853 Academy members 49,047 1,666 2,400
37,229
TOTAL 83,423 4,519 2,400 90,342
SAMPLE16,941
Not Academy members 10,206 2,853 Academy members 14,562 1,666 713
13,059
TOTAL 24,768 4,519 713 30,000
RESPONSE5,523
Not Academy members 2,837 698 Academy members 4,946 444 133
3,535
TOTAL 7,783 1,142 133 9,058
30%Response rate 31% 25% 19%
Practitioners (working in dietetics) 6,523 866 80 7,469 Margin of error (practitioners) ±1.2% ±2.9% ±10.7% ±1.1%
Appendix 213
Instrument Design A groundbreaking feature of the initial 2002 Dietetics Compensation & Benefits Survey was the measurement of salary data not only in the context of registration (RD, DTR) or various practice areas, but also in terms of the specific jobs (including nontraditional jobs) held by dietetics practitioners. That approach was carried forward for the Compensation & Benefits Survey of the Dietetics Profession 2013.
The core set of dietetics job titles plus brief position descriptions was developed through an extended process involving Academy member input and expert judgment. In 2013, the 59 positions cover 93% of responding practitioners’ employment situations.
The questionnaire was closely based on the instruments employed since 2002 to facilitate trending. Refinements were developed jointly in response to member input by Academy staff leaders and Readex. For 2013, only minor modifications were made to the 2011 instrument.
Contact Series Production of survey materials, addressing, mailing, development of the survey web site, and broadcast email contacts were all handled by Readex Research.
On June 6, 2013, Readex broadcast initial email invitations (in the name of Academy's president) to the 28,267 sample members with an email address on file, inviting them to participate in the survey by visiting the access-controlled web site hosted by Readex Research. 1,793 of the email addresses (or 6% of the total) returned as undeliverable.
On June 12, reminder emails were sent to the email sample members who had not yet responded (and whose email addresses had not returned as undeliverable). Additional reminder emails were sent to remaining nonrespondents on June 18.
On June 20, Readex sent survey kits via postal mail to the 1,733 sample members who did not have an email address on file, and to the 1,793 individuals from the email sample whose email addresses returned as undeliverable (a total of 3,526). Each kit consisted of a cover letter on Academy letterhead, signed by the association's President (with a survey report order form on the back); a Position Descriptions list; the questionnaire; and a Business Reply envelope addressed to Readex, all in an outgoing Academy envelope.
On July 10, Readex mailed followup survey kits to the postal sample members who had not responded by that time. The followup survey kits were similar to the initial survey kits, with the exception of an updated covering letter.
The survey was closed for tabulation on August 5, 2013. Data entry, verification, cleaning and tabulation were handled by Readex.
Compensation & Benefits Survey of the Dietetics Profession 2013 214
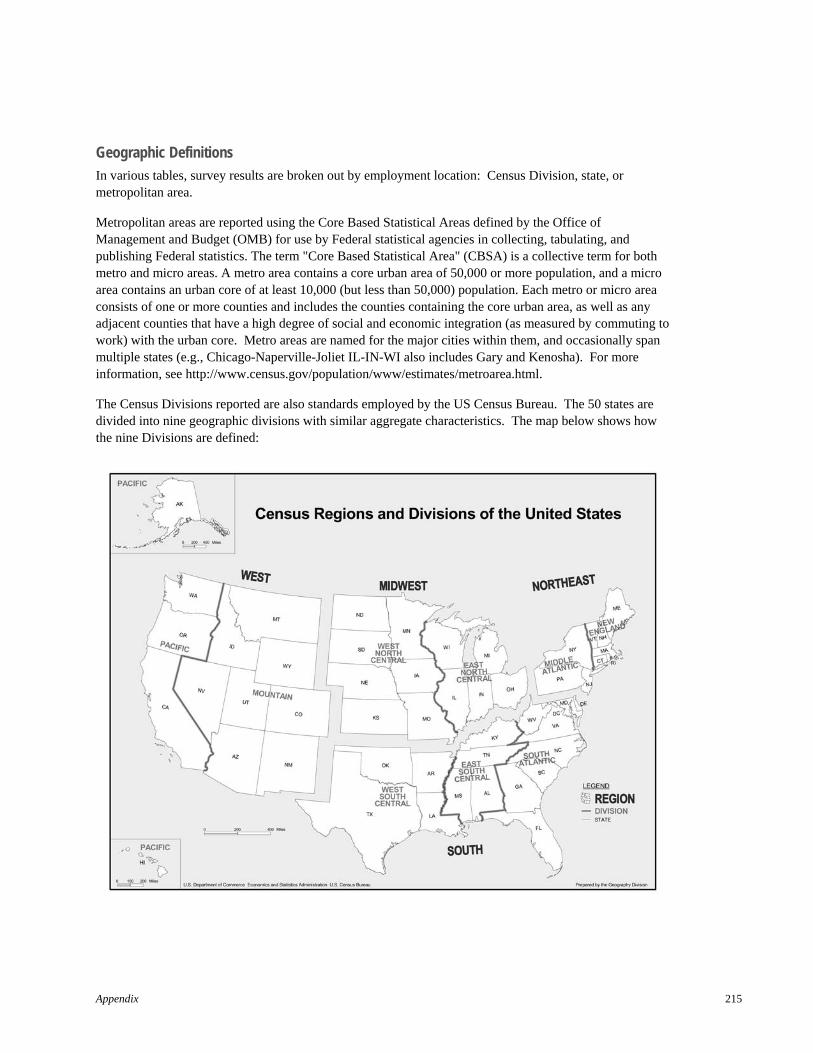
Geographic Definitions
In various tables, survey results are broken out by employment location: Census Division, state, or metropolitan area.
Metropolitan areas are reported using the Core Based Statistical Areas defined by the Office of Management and Budget (OMB) for use by Federal statistical agencies in collecting, tabulating, and publishing Federal statistics. The term "Core Based Statistical Area" (CBSA) is a collective term for both metro and micro areas. A metro area contains a core urban area of 50,000 or more population, and a micro area contains an urban core of at least 10,000 (but less than 50,000) population. Each metro or micro area consists of one or more counties and includes the counties containing the core urban area, as well as any adjacent counties that have a high degree of social and economic integration (as measured by commuting to work) with the urban core. Metro areas are named for the major cities within them, and occasionally span multiple states (e.g., Chicago-Naperville-Joliet IL-IN-WI also includes Gary and Kenosha). For more information, see http://www.census.gov/population/www/estimates/metroarea.html.
The Census Divisions reported are also standards employed by the US Census Bureau. The 50 states are divided into nine geographic divisions with similar aggregate characteristics. The map below shows how the nine Divisions are defined:
Appendix 215
Statistical Glossary
base The divisor in calculations of percentages.
margin of error The maximum sampling error forpercentages at the 95% confidence level. If the margin of error is ±1%, then the expected true population value will be within ±1% of the survey’s estimated value 95 times out of 100.
mean The arithmetic average, calculated by summing all responses and dividing by thenumber of responses. The mean is sometimes strongly influenced by extreme values in the distribution.
median The median is calculated by rank ordering all responses and then selecting (or interpolating) the value below which 50% of all responses lie. It is often thought of as the “typical” value of a variable and is not influenced by extreme values in the distribution.The median is also known as the 50th percentile.
NET In tables where respondents could select more than one answer, a net is sometimes reported, indicating the number of respondentsselecting one or more of the answers beingnetted. Each respondent is counted at most oncein a net.
percentile Percentiles are calculated by rankordering all responses and then selecting (or interpolating) the value below which x% of all responses lie: 10% of all answers lie below the 10th percentile, 25% below the 25th percentile, and so on.
standard error The “margin of error” for estimated means based on survey data. If the standard error for a mean of 2.5 is 0.5, then the expected true population value will be between 2.0 and 3.0 about two times in three. To increase confidence to the 95% level (that is, the true value will be within the range 95 times out of 100), multiply the standard error by 2. In the example given, the 95% confidence interval for a mean of 2.5 is 1.5 to 3.5.
Compensation & Benefits Survey of the Dietetics Profession 2013 216
Title Index: Compensation by Position
Practice Area
Clinical Nutrition – Acute Care/Inpatient......................................................................................... 82-92
Clinical Nutrition – Ambulatory Care ............................................................................................ 93-100
Clinical Nutrition – Long Term Care ........................................................................................... 101-102
Community ................................................................................................................................... 103-108
Consultation and Business............................................................................................................ 116-123
Education and Research ............................................................................................................... 124-130
Food and Nutrition Management.................................................................................................. 109-115
Position Title
Administrator, Higher Education ............................................................. [insufficient data, not reported]
Assistant Foodservice Director ............................................................................................................113
Assistant Professor ...............................................................................................................................125
Associate Professor ..............................................................................................................................126
Clinical Dietitian ....................................................................................................................................83
Clinical Dietitian, Long Term Care ......................................................................................................101
Clinical Dietitian, Specialist – Bariatrics................................................................................................84
Clinical Dietitian, Specialist – Diabetes .................................................................................................85
Clinical Dietitian, Specialist – Eating Disorders ....................................................................................86
Clinical Dietitian, Specialist – Oncology ...............................................................................................87
Clinical Dietitian, Specialist – Other ......................................................................................................90
Clinical Dietitian, Specialist – Psychiatric .............................................................................................88
Clinical Dietitian, Specialist – Renal......................................................................................................89
Clinical Nutrition Manager...................................................................................................................112
Consultant – Communications..............................................................................................................118
Consultant – Community and/or Corporate Programs .........................................................................117
Cooperative Extension Educator/Specialist..........................................................................................105
Corporate Dietitian ...............................................................................................................................121
Corrections Dietitian ................................................................................ [insufficient data, not reported]
Didactic Program Director ...................................................................................................................128
Dietetic Internship Director ..................................................................................................................129
Dietetic Technician, Clinical ..................................................................................................................82
Dietetic Technician, Foodservice Management....................................................................................115
Dietetic Technician, Long Term Care ..................................................................................................102
Director of Clinical Nutrition ...............................................................................................................111
Appendix 217

Title Index: Compensation by Position (continued)
Position Title
Director of Food and Nutrition Services .............................................................................................. 110
Director of Nutrition ............................................................................................................................ 123
Executive-level Professional ................................................................................................................ 109
Home Care Dietitian ............................................................................................................................ 100
Instructor/Lecturer................................................................................................................................ 124
Manager of Nutrition Communications ................................................... [insufficient data, not reported]
Nutrition Coordinator for Head Start Program..................................................................................... 107
Nutrition Support Dietitian..................................................................................................................... 92
Nutritionist for Food Bank or Assistance Program .............................................................................. 108
Outpatient Dietitian, General ................................................................................................................. 93
Outpatient Dietitian, Specialist – Diabetes............................................................................................. 94
Outpatient Dietitian, Specialist – Oncology ........................................................................................... 95
Outpatient Dietitian, Specialist – Other ................................................................................................. 99
Outpatient Dietitian, Specialist – Pediatrics ........................................................................................... 96
Outpatient Dietitian, Specialist – Renal ................................................................................................. 97
Outpatient Dietitian, Specialist – Weight Management ......................................................................... 98
Pediatric/Neonatal Dietitian ................................................................................................................... 91
Private Practice Dietitian – Patient/Client Nutrition Care .................................................................... 116
Professor............................................................................................................................................... 127
Public Health Nutritionist..................................................................................................................... 104
Public Relations and/or Marketing Professional ..................................................................................120
Research & Development Nutritionist ................................................................................................. 122
Research Dietitian ................................................................................................................................ 130
Sales Representative............................................................................................................................. 119
School Foodservice Director ................................................................................................................ 114
School/Child Care Nutritionist ............................................................................................................. 106
WIC Nutritionist................................................................................................................................... 103
Compensation & Benefits Survey of the Dietetics Profession 2013 218
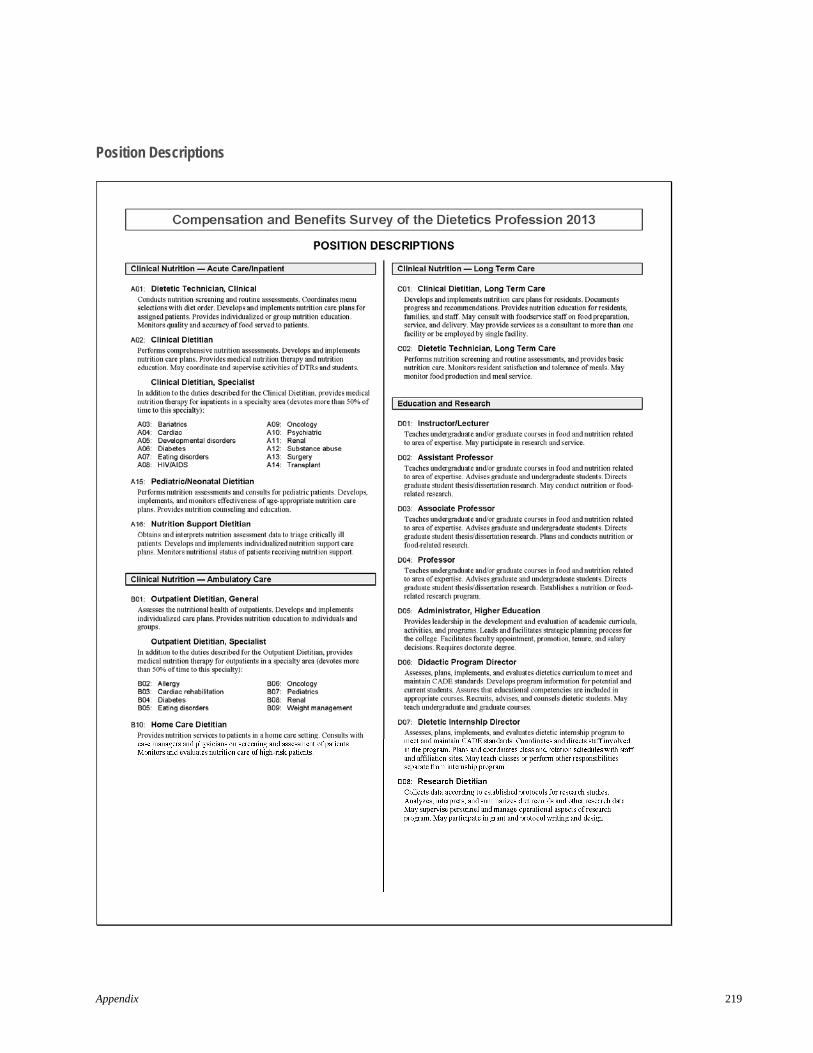
Position Descriptions
Appendix 219

Compensation & Benefits Survey of the Dietetics Profession 2013 220

Questionnaire
Appendix 221

Compensation & Benefits Survey of the Dietetics Profession 2013 222

Appendix 223
Compensation & Benefits Survey of the Dietetics Profession 2013 224

Compensation & Benefits Survey of the Dietetics Profession 2013 RESPONSE FORM
In an effort to provide you with compensation and benefits information that meets your evolving needs as a dietetics professional, please take a moment to provide your comments and suggestions. By answering the following questions, you will help us continue to be your premier source for compensation and benefits information for the dietetics professional.
Did you find the survey results easy to understand? Yes ___ No ___ If no, what changes would make them easier to understand?
Did this survey provide the information you need regarding compensation issues? Yes ___ No ___ If no, what additional information could we provide?
Did this survey provide the information you need regarding benefits issues? Yes ___ No ___ If no, what additional information could we provide?
Any additional comments or suggestions?
(Optional) Name __________________________________________
Organization _____________________________________________
Return by mail, fax or email to: Vice President, Member Services
Academy of Nutrition and Dietetics 120 South Riverside Plaza, Suite 2000, Chicago, IL 60606
Fax: 312-899-5350Email: [email protected]

226 Compensation & Benefits Survey of the Dietetics Profession 2013