Embed Size (px)
DESCRIPTION
Citation preview

Acceleration in Global Equities
Bernard Chua, CFA
Vice President
Client Portfolio Manager
Jamie Downing
Vice President
International
Keith Creveling
Senior Vice President
Senior Portfolio Manager
November 2012

American Century Investments
Founded in 1958
$125 billion in assets
151 investment
professionals
Globally located
– Kansas City
– Mountain View (CA)
– New York
– London
– Hong Kong
– Los Angeles
$7.3 billion in assets for
clients domiciled outside the
U.S.
Data as of 9/30/2012
Focused exclusively on investment management
– All resources are directed to adding value for our clients.
Independent and privately-controlled ownership structure
– Decision making aligns with clients‟ interests.
Fundamentally-driven, risk-adjusted performance
– Alpha is derived through security selection.
Delivering results to our clients has a greater impact
– Through our ownership structure, more than 40% of our profits support the Stowers
Institute for Medical Research.
– This drives a values-based culture that directly benefits our clients.
Foundation for Success
The Stowers Institute
for Medical Research
2 FOR NON-U.S. INSTITUTIONAL USE ONLY
American Century Global Equity Capabilities
Notes We believe that accelerating growth in revenues and earnings results in significant potential for
stock price appreciation.
We focus on inflection points in companies‟ fundamentals because we believe markets are
inefficient at identifying such points.
Our process is designed to uncover stocks that outperform as earnings growth accelerates,
market expectations rise and multiples expand.
Investing With a Time-Tested Growth Philosophy
3
A company’s absolute level of growth
is not as important as . . . . . . its direction of growth.
FOR NON-U.S. INSTITUTIONAL USE ONLY
American Century Global Equity Capabilities

Notes
Identifying Market Inefficiencies
4
Actual company fundamentals
Wall Street consensus expectations
MARKET INEFFICIENCIES
Gro
wth
Rat
e (%
)
Time
Initiate position
Exit position
FOR NON-U.S. INSTITUTIONAL USE ONLY
American Century Global Equity Capabilities

Global Growth (MSCI
World) has delivered
positive alpha in 60 out of 60
rolling five-year periods
(100%)
Global Concentrated Growth
has delivered positive alpha
in 29 out of 29 rolling five-
year periods (100%)
A Record of Delivering Consistent Alpha
5 FOR NON-U.S. INSTITUTIONAL USE ONLY
0%
1%
2%
3%
4%
5%
6%
2007 2008 2009 2011 2012
Ro
llin
g F
ive
-Ye
ar
An
nualize
d A
lph
a
Global Growth (MSCI World) Equity
Global Concentrated Growth Equity
Global Growth (MSCI World) and Global Concentrated Growth Rolling Five-Year Annualized Alpha versus MSCI World IndexFive Years Ending September 30, 2012
Data as of 9/30/2012Source: MSCI, Inc.
American Century Global Equity Capabilities

Notes
Investment Universe Market capitalization > $3B
Sufficient trading liquidity
Step 1: Idea Generation
Identify companies exhibiting accelerating
growth and improving fundamentals
Fundamental information flow
Quantitative screens
Step 2: Fundamental Analysis
Confirm acceleration is genuine and
sustainable
Portfolio 90-110 holdings
Step 3: Portfolio Construction
Focus portfolio on best ideas
Monitor risk controls and guidelines
GLOBAL GROWTH / CONCENTRATED GROWTH
(MSCI WORLD)
Achieving Repeatability
6 FOR NON-U.S. INSTITUTIONAL USE ONLY
American Century Global Equity Capabilities

Initiated position on May 3, 2011
after confirmation of accelerating
sales growth.
Case for sustainability:
– Secular growth in demand for
personal care products in
Asia
– Strategic expansion into
smaller cities in China
– Expansion of product line to
capture market for lower
product price points
– Implementation of plans to
improve margins (e.g. focus
on automation)
Investment Example – Unicharm (Japan)
7
Sales
Growth
Sep
2010
Dec
2010
Mar
2011
Y/Y %Chg 4.2% 3.2% 8.3%
2 Yr %Chg 6.7% 7.3% 11.5
%
2,800
3,000
3,200
3,400
3,600
3,800
4,000
4,200
4,400
4,600
0.0
0.2
0.4
0.6
0.8
1.0
1.2
1.4
Pric
e
Weig
ht H
eld
in P
ort
folio
Unicharm Corp.Global Growth Weight vs. Daily Closing Price (Local)Data from 11/9/2010 to 7/31/2012
Weight Price
Source: FactSet
Unicharm is a Japanese manufacturer of household products such as diapers, cleaning wipes and other hygienic
products. The company also produces pet food and supplies.
References to specific securities are for illustrative purposes only, and are not intended as recommendations to purchase or sell securities. Opinions and estimates offered
constitute our judgment and along with other portfolio data, are subject to change without notice.
FOR NON-U.S. INSTITUTIONAL USE ONLY
American Century Global Equity Capabilities

The initial catalyst for owning
shares of Grifols was an
improving trend in their pricing
dynamics for blood plasma.
Case for sustainable growth:
– Synergies from merger with
Talacris
– Continued improvement in
pricing for plasma
– Market share gain in the U.S.
as competitors face
production challenges
– New indications for certain
plasma components
Investment Example — Grifols SA (Spain)
8
References to specific securities are for illustrative purposes only, and are not intended as recommendations to purchase or sell securities. Opinions and estimates offered
constitute our judgment and along with other portfolio data, are subject to change without notice.
Grifols SA is a Spanish company involved in the manufacturing and marketing of blood plasma derivatives, IV
therapy and diagnostic systems.
American Century Global Equity Capabilities
FOR NON-U.S. INSTITUTIONAL USE ONLY
10
12
14
16
18
20
22
24
26
28
0
1
2
3
4
We
igh
t H
eld
in
Po
rtf
olio
Grifols SAGlobal Concentrated Growth Weight vs. Daily Closing Price (Local)Data from 8/31/2011 to 9/28/2012
Weight Price
Source: FactSetSource: FactSetSource: FactSetSource: FactSetSource: FactSetSource: FactSetSource: FactSetSource: FactSet
Pric
e

Performance
9 FOR NON-U.S. INSTITUTIONAL USE ONLY
Quarter YTD 1 Year 3 Year 5 Year Inception
Global Concentrated Growth 6.77 18.01 28.19 11.82 -0.88 8.02
MSCI World 6.71 13.01 21.59 7.48 -2.15 4.06
Excess Return 0.06 5.00 6.60 4.34 1.27 3.96
Data as of 9/30/2012. Composite returns are gross of fees. Periods greater than one y ear hav e been annualized.
Inception of composite is 6/1/2005.
Source: MSCI Inc.
-5
0
5
10
15
20
25
30
Quarter YTD 1 Year 3 Year 5 Year Inception
Return (%)
Global Concentrated Growth
MSCI World
American Century Global Equity Capabilities
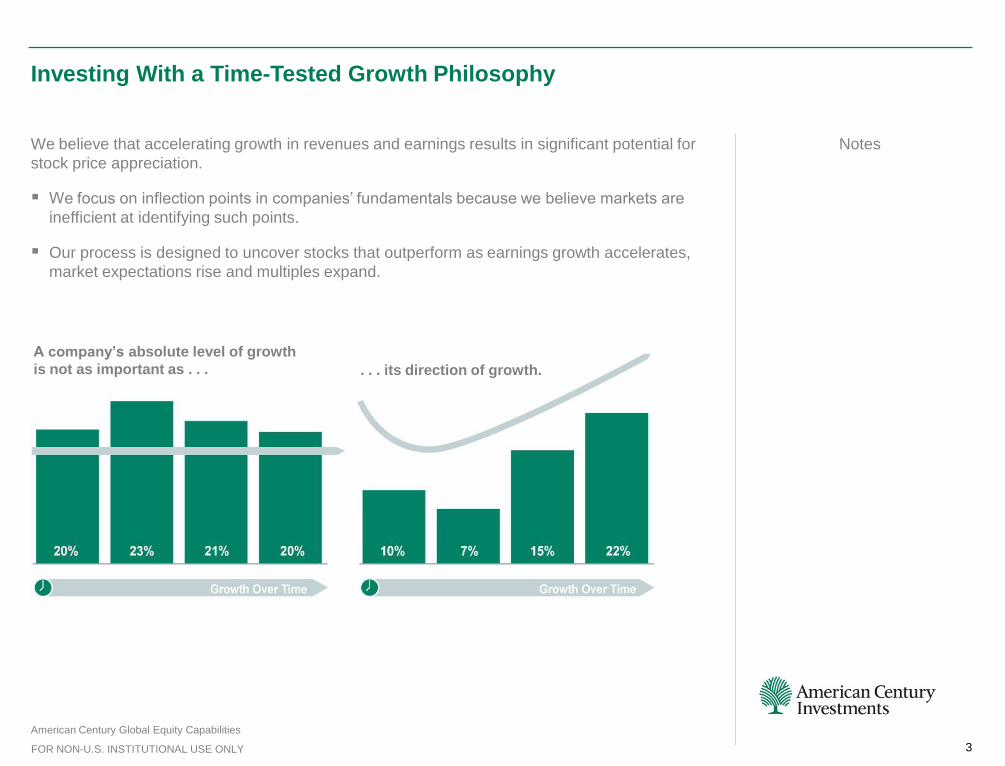
Notes Our growth philosophy
directs us to a different
opportunity set than many
other growth competitors,
allowing us to add value
across diverse market
cycles
We serve as an effective
complement to other global
equity managers, providing
an opportunity to add alpha
while dampening overall
volatility
Complementing Global Value and Core Strategies
10
Correlation of Excess Returns over Last Five Years
Global Growth (MSCI World) versus the five largest global value and core managers by assets*
Manager 1 Manager 2 Manager 3 Manager 4 Manager 5
(Value) (Value) (Value) (Value) (Value)
-0.15 -0.05 0.07 0.29 -0.45
Manager 6 Manager 7 Manager 8 Manager 9 Manager 10
(Core) (Core) (Core) (Core) (Core)
0.00 0.15 -0.01 0.34 0.61
Data as of 6/30/2012
Correlation of ex cess v ersus MSCI World
Source: eVestment Analy tics
*Fiv e largest global v alue and core managers represent nearly 30% of global large and all cap equity institutional assets
as reported to eVestment Analy tics for 6/30/2012.
FOR NON-U.S. INSTITUTIONAL USE ONLY
American Century Global Equity Capabilities

Notes Ownership by Stowers Institute for Medical Research creates a unique drive and environment
Our „acceleration‟ approach has demonstrated it can add significant value in global markets,
even in turbulent conditions
A stable, disciplined process with a low correlation to value managers aiding client portfolio
construction
Conclusion
11 FOR NON-U.S. INSTITUTIONAL USE ONLY
American Century Global Equity Capabilities

Notes Portfolio – Global Growth (MSCI World)
– Performance Attribution
– Portfolio Allocation
Portfolio – Global Concentrated Growth
– Performance
– Performance Attribution
– Portfolio Allocation
Biographies
– Investment Professionals
Performance Disclosures
Appendix
12 FOR NON-U.S. INSTITUTIONAL USE ONLY
American Century Global Equity Capabilities

Firm Asset Distribution
Institutional Client Distribution
Investment Management Capabilities
Six Boutiques – One Global Firm
13
48%
35%
1%
16%
Retirement
Subadvisory and Insurance
Endowment and Foundation
Sovereign Wealth Funds
Data as of 9/30/2012
11%
24%
18%
6%
29%
12%
Global & Non-U.S. U.S. GrowthU.S. Value QuantitativeFixed Income Asset Allocation
*Represents total assets managed in asset allocation products; assets managed in underlying slices are also included elsewhere in the figures above.
Data as of 9/30/2012
Global and
Non-U.S.
Equity
U.S. Growth
Equity
U.S. Value
Equity
Quantitative
Equity Fixed Income
Asset
Allocation
Assets under
Management $15.3 billion $34.4 billion $24.8 billion $ 7.9 billion $40.7 billion $16.6 billion*
Investment
Professionals 27 33 22 12 40 6
Average
Industry
Experience
15 yrs 14 yrs 14 yrs 15 yrs 19 yrs 20 yrs
Discipline
Inception 1991 1971 1993 1990 1972 1988
Investment
Capabilities
Large Cap
Small-Mid Cap
Small Cap
Emerging Mkts
Large Cap
Mid Cap
Small Cap
All Cap
Large Cap
Mid Cap
Small Cap
Real Estate
Large Cap
Market Neutral
Short-Extension
Non-U.S.
U.S. Core Fixed
Non-U.S. Core
Global Core
Inflation-Linked
Target Date
Target Risk
Strategic Inflation
Protection
Primary
Location
New York,
NY
Kansas City,
MO
Kansas City,
MO
Mountain View,
CA
Mountain View,
CA
Mountain View,
CA
FOR NON-U.S. INSTITUTIONAL USE ONLY
American Century Global Equity Capabilities

Collaborative Culture
Single location
Integrated communication
Alignment through
compensation
Singular Focus
Common definition of growth
Dedicated support
Accountability
Experienced Investment Team With a Global Perspective
Average years of experience: 16
Languages/dialects spoken: 20
Mark Kopinski
Chief Investment Officer
Portfolio Managers
Alex Tedder
Rajesh Gandhi, CFA
Non-U.S. Growth
Portfolio Managers
Mark Kopinski
Brian Brady
Non-U.S. Small-Mid Cap
Portfolio Managers
Keith Creveling, CFA
Brent Puff
Global Growth
Portfolio Managers
Mark Kopinski
Trevor Gurwich
Indraneel Das, PhD
Non-U.S. Small Cap
Portfolio Managers
Patricia Ribeiro
Anthony Han, CFA
Emerging Markets
David Choi, CFA
Federico Laffan
Sherwin Soo, CFA
Investment Analysts
Helen O'Donnell Jim Zhao, CFA
Ted Harlan, CFA Hannah Chiang
Joe Kong Sandra Miller, CFA
Alexei Babazadeh, CFA
Investment Analysts
Charlie Kime Vital Magnin, CFA
Indraneel Das, PhD Emily Smith
Pratik Patel
Investment Analysts
Geoffrey Burger, CFA
Quantitative Analyst
Bernard Chua, CFA
Kevin Boreen
Client Portfolio
Managers
Chris Spurlock
Shari Freifield
Jessica Carballal
George Nakos
Non-U.S. Equity Trading
14 FOR NON-U.S. INSTITUTIONAL USE ONLY
American Century Global Equity Capabilities

Notes
Overview of Strategy Capabilities
15
Global Growth
(MSCI World)
Global Growth
(MSCI ACWI)
Global
Concentrated
Growth
Inception date January 1, 1999 July 1, 2010 June 1, 2005
Benchmark MSCI World MSCI ACWI MSCI World
Investment universe Large Cap Large Cap Large Cap
Assets $2.1 billion $6.5 billion $12 million
Institutional assets 77% 100% 100%
Expected excess return 2%-3% 2%-3% 3%-4%
Expected tracking error 3%-5% 3%-5% 5%-7%
Emerging market budget 0 – 10% +/- 10% to benchmark No limit
Data as of 9/30/2012
FOR NON-U.S. INSTITUTIONAL USE ONLY
American Century Global Equity Capabilities

Identify Accelerating Growth and Improving Fundamentals
Fundamental information
flow
– Focus on both financial
and non-financial metrics
– Identify catalyst for
improvement
Quantitative screens
– Produce additional alpha
ideas
– Provide objective
information
Generating Ideas From Multiple Sources
16
Step 1
Step 2
Step 3
Identify accelerating growth
and improving fundamentals
Fundamental Information Flow
Company and industry news
Meetings with company management
Industry/sector conferences
Earnings announcements
Third-party research
Daily research review
Team interactions
Quantitative Screens
Screen for fundamentals,
capitalization and liquidity
Provide a disciplinary backstop
to process
Flag new opportunities
Idea Generation
FOR NON-U.S. INSTITUTIONAL USE ONLY
American Century Global Equity Capabilities

Investment Thesis
Present to Portfolio Management Team
CONFIRMATION OF SUSTAINABLE ACCELERATION
Assess
Financials
Review historical financial statements and company reports
Verify
Potential
Meet with company management
Compare financials within sector
Draw from third-party research
Evaluate
Growth Drivers
Assess quality of earnings
Substantiate financial strength
Quantify Growth
Trends
Use forecast model
Verify forward-looking growth trends
Step 1
Step 2
Step 3
Adding Value Through Fundamental Analysis
17
In-depth security analysis of our holdings and candidates drives more than 80% of our
excess returns.
Identify Accelerating Growth and Improving Fundamentals
FOR NON-U.S. INSTITUTIONAL USE ONLY
American Century Global Equity Capabilities

Building Client Portfolios
18
Step 1
Step 2
Step 3
Portfolio Holdings
Continuous monitoring of portfolio and follow list
Analyst recommendations
based on:
Stage in growth cycle
Conviction in the sustainability of growth
Earnings expectations vs. consensus
Valuation considerations
Macroeconomic factors
Investment Thesis
Present to Portfolio Management Team
Buy decisions are determined by:
Strength of conviction – “best ideas”
Client investment policies
Sell decisions are determined by:
Compromised investment thesis
Valuation considerations
Macroeconomic factors
Potential stronger candidates
FOR NON-U.S. INSTITUTIONAL USE ONLY
American Century Global Equity Capabilities

Annual Performance
19
2007 2008 2009 2010 2011
Global Concentrated Growth 23.67 -45.14 35.01 13.19 -2.65
MSCI World 9.04 -40.71 29.99 11.76 -5.54
Excess Return 14.63 -4.43 5.02 1.43 2.89
Composite returns are gross of fees.
Source: MSCI Inc.
-50
-40
-30
-20
-10
0
10
20
30
40
2007 2008 2009 2010 2011
Return (%)
Global Concentrated Growth
MSCI World
FOR NON-U.S. INSTITUTIONAL USE ONLY
American Century Global Equity Capabilities

Performance Attribution – One Year
20 FOR NON-U.S. INSTITUTIONAL USE ONLY
ONE YEAR ENDING 9/30/2012 1-Year
Return (%)
Portfolio: GLOBAL CONCENTRATED GROWTH Portfolio 28.19
Benchmark: MSCI World Benchmark 21.59
Excess Return 6.59
Data from 9/30/2011 to 9/30/2012. Portfolio performance is gross of fees.
Source: FactSet
-2.0 -1.0 0.0 1.0 2.0 3.0 4.0 5.0 6.0
INDUSTRIALS
CONSUMER STAPLES
TELECOMMUNICATION SERVICES
CONSUMER DISCRETIONARY
MATERIALS
FINANCIALS
UTILITIES
ENERGY
HEALTH CARE
INFORMATION TECHNOLOGY
American Century Global Equity Capabilities

Performance Attribution – One Year
21 FOR NON-U.S. INSTITUTIONAL USE ONLY
ONE YEAR ENDING 9/30/2012 1-Year
Return (%)
Portfolio: GLOBAL CONCENTRATED GROWTH Portfolio 28.19
Benchmark: MSCI World Benchmark 21.59Excess Return 6.59
Data from 9/30/2011 to 9/28/2012. Portfolio performance is gross of fees.
Source: FactSet
-1.5 -1.0 -0.5 0.0 0.5 1.0 1.5 2.0 2.5 3.0 3.5 4.0
CHINA
FRANCE
AUSTRALIA
RUSSIA
GERMANY
PORTUGAL
KOREA
INDONESIA
SWEDEN
HONG KONG
BELGIUM
NORWAY
SINGAPORE
IRELAND
NEW ZEALAND
BRAZIL
AUSTRIA
NETHERLANDS
UNITED KINGDOM
GREECE
ISRAEL
FINLAND
POLAND
SWITZERLAND
CANADA
DENMARK
ITALY
SPAIN
JAPAN
UNITED STATES
American Century Global Equity Capabilities

Notes
Sector Allocation
22 FOR NON-U.S. INSTITUTIONAL USE ONLY
Portfolio: GLOBAL CONCENTRATED GROWTH
Benchmark: MSCI World
Information Technology 25.77 12.62
Consumer Discretionary 14.23 10.66
Industrials 12.63 10.64
Financials 21.00 19.19
Health Care 10.57 10.68
Energy 8.86 10.84
Utilities 0.00 3.55
Telecommunication Services 0.00 4.11
Materials 2.51 6.85
Consumer Staples 4.43 10.87
Data as of 9/30/2012
Source: FactSet
Relative Weight (%) SectorPortfolio Benchmark
Weight (%) Weight (%)
13.15
3.57
1.99
1.81
-0.11
-1.98
-3.55
-4.11
-4.34
-6.44
-10 -5 0 5 10 15
American Century Global Equity Capabilities

Diversifying Across Sectors
23
Portfolio: GLOBAL CONCENTRATED GROWTH
Benchmark: MSCI World
Data as of 9/30/2012
Source: FactSet
0
5
10
15
20
25
Sep-08 Sep-09 Sep-10 Sep-11 Sep-12
Weig
ht (%
)
Sector Weights: Consumer Discretionary
0
2
4
6
8
10
12
14
Sep-08 Sep-09 Sep-10 Sep-11 Sep-12W
eig
ht (%
)
Sector Weights: Consumer Staples
0
5
10
15
20
Sep-08 Sep-09 Sep-10 Sep-11 Sep-12
Weig
ht (%
)
Sector Weights: Energy
0
5
10
15
20
25
Sep-08 Sep-09 Sep-10 Sep-11 Sep-12
Weig
ht (%
)
Sector Weights: Health Care
0
5
10
15
20
25
30
Sep-08 Sep-09 Sep-10 Sep-11 Sep-12
Weig
ht (%
)
Sector Weights: Information Technology
0
2
4
6
8
10
12
Sep-08 Sep-09 Sep-10 Sep-11 Sep-12
Weig
ht (%
)
Sector Weights: Telecommunication Services
0
5
10
15
20
25
30
Sep-08 Sep-09 Sep-10 Sep-11 Sep-12
Weig
ht (%
)
Sector Weights: Financials
0
5
10
15
20
Sep-08 Sep-09 Sep-10 Sep-11 Sep-12
Weig
ht (%
)
Sector Weights: Industrials
0
2
4
6
8
10
12
14
Sep-08 Sep-09 Sep-10 Sep-11 Sep-12
Weig
ht (%
)
Sector Weights: Materials
FOR NON-U.S. INSTITUTIONAL USE ONLY
American Century Global Equity Capabilities

Notes
Regional Weights
24 FOR NON-U.S. INSTITUTIONAL USE ONLY
Portfolio: GLOBAL CONCENTRATED GROWTH
Benchmark: MSCI World
North America 74.34 59.07
Emerging Markets 10.12 0.00
Europe 13.86 26.70
Asia 1.68 14.23
Data as of 9/30/2012
Source: FactSet
Relative Weight (%) RegionWeight (%)
Portfolio Benchmark
Weight (%)
-12.55
-12.84
10.12
15.27
-18.0 -12.0 -6.0 0.0 6.0 12.0 18.0
1
2
3
4
American Century Global Equity Capabilities

Notes
Diversifying Across Regions
25
Portfolio: GLOBAL CONCENTRATED GROWTH
Benchmark: MSCI World
Data as of 9/30/2012
Source: FactSet
0
10
20
30
40
50
60
70
80
90
100
Sep-08 Sep-09 Sep-10 Sep-11 Sep-12
We
igh
t (%
)
Regional Weights: Asia
0
10
20
30
40
50
60
70
80
90
100
Sep-08 Sep-09 Sep-10 Sep-11 Sep-12
We
igh
t (%
)
Regional Weights: Emerging Markets
0
10
20
30
40
50
60
70
80
90
100
Sep-08 Sep-09 Sep-10 Sep-11 Sep-12
We
igh
t (%
)
Regional Weights: Europe
0
10
20
30
40
50
60
70
80
90
100
Sep-08 Sep-09 Sep-10 Sep-11 Sep-12
We
igh
t (%
)
Regional Weights: North America
FOR NON-U.S. INSTITUTIONAL USE ONLY
American Century Global Equity Capabilities

Notes
Top 10 Holdings
26 FOR NON-U.S. INSTITUTIONAL USE ONLY
Portfolio: GLOBAL CONCENTRATED GROWTH
Portfolio
Weight (%)
Apple, Inc. 7.01
Google, Inc. 4.49
Equinix, Inc. 4.15
American Tower Corp. 3.76
Priceline.com, Inc. 3.63
Precision Castparts Corp. 3.50
Union Pacific Corp. 3.48
Saipem SpA 3.44
Danaher Corp. 3.37
Grifols SA 3.31
Portfolio: GLOBAL CONCENTRATED GROWTH
Benchmark: MSCI World
Portfolio Benchmark Overweight
Weight (%) Weight (%) (%)
Apple, Inc. 7.01 2.49 4.52
Equinix, Inc. 4.15 0.04 4.11
Google, Inc. 4.49 0.78 3.71
American Tower Corp. 3.76 0.11 3.65
Priceline.com, Inc. 3.63 0.12 3.51
Precision Castparts Corp. 3.50 0.09 3.41
Saipem SpA 3.44 0.05 3.39
Grifols SA 3.31 0.02 3.29
Baidu, Inc. 3.28 0.00 3.28
Union Pacific Corp. 3.48 0.23 3.25
Data as of 9/30/2012
Source: FactSet
Holdings are subject to change w ithout notice.
Top 10 Weights
Top 10 Overweights
American Century Global Equity Capabilities

Notes
Portfolio Characteristics
27 FOR NON-U.S. INSTITUTIONAL USE ONLY
GLOBAL CONCENTRATED GROWTH
GlobalConcentrated MSCI
Growth World
Weighted Average Market Capitalization $94.9 B $84.3 B
Median Market Capitalization $38.3 B $8.2 B
P/E Ratio, Forecasted 1-Year 19.2x 13.2x
EPS Growth, Forecasted 1-Year 19.0% 12.3%
ROE, Historical 1-Year 19.7% 19.3%
Dividend Yield 0.8% 2.7%
Number of Holdings 37 1623
Turnover 1-Year 37% N/A
Data as of 9/30/2012
Source: FactSet
American Century Global Equity Capabilities

Biographies
28
Global and Non-U.S. Equity
Team Members Education
Began Investment
Career*
Began
At ACI
Former
Affiliations
Mark S. Kopinski
Chief Investment Officer
MA, University of Illinois
BA, Monmouth College
1983 1991 Federated Investors
Salomon Brothers Asia
Sanyo Securities
Alex Tedder
Senior Portfolio Manager
MBA, University of Freiburg, Switzerland
BA, Winchester College, UK
1990 2006 Deutsche Asset Management
Schroder Investment Management
Keith Creveling, CFA
Senior Portfolio Manager
MBA, Stern School of Business,
New York University
BA, Drexel University
1994 1999 Fiduciary Trust Company
Brown Brothers Harriman
Brian Brady
Senior Portfolio Manager
MBA, Columbia University
BS, Georgetown University
1988 1994 Chase Manhattan
Trevor Gurwich
Portfolio Manager
MBA, Columbia University
BA, University of Pennsylvania
1992 1998 Arthur Andersen
Patricia Ribeiro
Portfolio Manager
BS, Rutgers University 1984 2006 Medley Global Advisors
Black Arrow Capital Management
Citigroup Asset Management
JP Morgan Investment Management
Rajesh A. Gandhi, CFA
Portfolio Manager
BBA, University of Wisconsin 1993 2002 Deutsche Asset Management
Credit Suisse Asset Management
FactSet Research Systems
*Includes professional experience in investment-related occupations, such as accounting, financial communications, or professional occupations relating to their industry or
market area.
FOR NON-U.S. INSTITUTIONAL USE ONLY
American Century Global Equity Capabilities

Biographies
29
Global and Non-U.S. Equity
Team Members Education
Began Investment
Career*
Began
At ACI
Former
Affiliations
Brent Puff
Portfolio Manager
MBA, Kellogg School of Management,
Northwestern University
BA, Denison University
1992 2001 Peregrine Investment Holdings
Anthony Han, CFA
Portfolio Manager
MBA, Salem State College
BS, University of Adelaide
1991 2005 Federated Investors
Evergreen Asset Management
The Pioneer Group
MetLife Financial Services
Indraneel Das, PhD
Portfolio Manager
MBA, Columbia University
PhD, Rice University
BA, Hamilton College
1997 2007 United Technologies
Level 3 Communications
ExxonMobil
IBM
Geoffrey A. Burger, CFA
Portfolio Manager
Senior Quantitative Analyst
MA, Pennsylvania State University
BS, University of Missouri-Columbia
1996 2004 Commerce Trust Company
Hammond Associates
Bernard Chua, CFA
Client Portfolio Manager
MA, University of California-Santa Barbara
BA, Ateneo De Manila University
1986 2006 Deutsche Bank Securities
UBS Global Asset Management
American Express Company
Kevin Boreen
Client Portfolio Manager
MPA, Harvard University
BS, United States Naval Academy
1998 2012 AllianceBernstein
The Boeing Company
McKinsey & Company, Inc.
Price Waterhouse, Strategic Consulting
Group
Sandra Miller, CFA
Senior Investment Analyst
MBA, The Wharton School,
University of Pennsylvania
BS, Arizona State University
1997 2011 Axiom International Investors
RH Capital & Associates
John W. Bristol & Co., Inc.
Stock Val, Inc.
*Includes professional experience in investment-related occupations, such as accounting, financial communications, or professional occupations relating to their industry or
market area.
FOR NON-U.S. INSTITUTIONAL USE ONLY
American Century Global Equity Capabilities

Biographies
30
Global and Non-U.S. Equity
Team Members Education
Began Investment
Career*
Began
At ACI
Former
Affiliations
Helen O‟Donnell
Senior Investment Analyst
BA, Fordham University 1986 2000 Mitchell Hutchins Asset Management
PaineWebber
Kidder Peabody
Smith Barney
Jim Zhao, CFA
Senior Investment Analyst
MBA, Carnegie Mellon
MS, Clarkson University
BS, Clarkson University
2000 2009 Oppenheimer Capital
Federated Investors
Morgan Stanley
Pratik Patel
Senior Investment Analyst
BS, New York University 1998 2009 Mackay Shields
Fiduciary Trust Company International
David Choi, CFA
Senior Investment Analyst
BS, Boston College 1997 2010 Federated Investors
Deutsche Bank
Smith Barney
Charles Kime
Senior Investment Analyst
BA, McGill University 1997 2005 Deutsche Bank Securities
Nomura Securities International
Ted Harlan, CFA
Senior Investment Analyst
MBA, Columbia University
BA, Miami University
1998 2007 Griffin Securities
J. Giordano Securities
Federico Laffan
Senior Investment Analyst
MS, London Business School
BA, University of Texas
1990 2011 Ranger International
Axiom International Investors
American Century Investments (2001-2008)
Credit Suisse/Pincus Asset Mgmt
*Includes professional experience in investment-related occupations, such as accounting, financial communications, or professional occupations relating to their industry or
market area.
FOR NON-U.S. INSTITUTIONAL USE ONLY
American Century Global Equity Capabilities

Biographies
31
Global and Non-U.S. Equity
Team Members Education
Began Investment
Career*
Began
At ACI
Former
Affiliations
Vital Magnin, CFA
Senior Investment Analyst
MiS, Ecole Superieure de Commerce, Paris
BS, Externat Sainte-Marie, Lyon
1999 2008 Reach Capital Management
Credit Agricole
Emily Smith
Investment Analyst
MBA, Stern School of Business
New York University
BS, University of Maryland
2003 2009 Sands Capital Management
Cambridge Associates
Joe Kong
Investment Analyst
MBA, Columbia Business School
BS, Cornell University
2001 2009 Accenture
Hannah Chiang
Investment Analyst
MS, University of Colorado-Denver
BS, University of Colorado-Denver
1998 1999
Alexei Babazadeh, CFA
Investment Analyst
MBA, Columbia Business School
BS, University of California, Berkeley
2004 2010 Duff & Phelps
Standard & Poor's
Sherwin Soo, CFA
Investment Analyst
MBA, MIT Sloan School of Management
BS, University of Pennsylvania
1995 2011 Neuberger Berman
William D. Witter
HSBC Asset Management
Salomon Brothers
*Includes professional experience in investment-related occupations, such as accounting, financial communications, or professional occupations relating to their industry or
market area.
FOR NON-U.S. INSTITUTIONAL USE ONLY
American Century Global Equity Capabilities

Composite Performance and Fee Schedule
December 31, 2011
32
Global Concentrated Growth EquityBenchmark: MSCI World Index
Year
Gross Total
Return (%)
Net Total
Return (%)
Benchmark
Return (%)
Composite
Annualized
3-Yr Standard
Deviation (%)
Benchmark
Annualized
3-Yr Standard
Deviation (%)
Number of
Portfolios
Non-Fee
Paying
Portfolios (%)
Composite
Dispersion (%)
Composite
Assets
(in 000s)
Total Firm
Assets
(in 000s)
2005 20.71* 20.71* 11.21* N/A** N/A** Five or Fewer 100.00 N/A $2,514 $100,634,174
2006 22.44 22.44 20.07 N/A** N/A** Five or Fewer 100.00 N/A $3,079 $102,859,418
2007 23.67 23.67 9.04 N/A** N/A** Five or Fewer 100.00 N/A $3,807 $102,528,580
2008 -45.14 -45.32 -40.71 21.54 18.00 Five or Fewer 2.40 N/A $86,586 $70,216,875
2009 35.01 34.36 29.99 23.02 22.12 Five or Fewer 1.90 N/A $147,238 $86,002,779
2010 13.19 12.66 11.76 24.94 24.33 Five or Fewer 1.42 N/A $155,430 $103,557,347
2011 -2.65 -3.09 -5.54 19.88 20.09 Five or Fewer 0.00 N/A $98,913 $109,483,940
*Return is for the period June 1, 2005, inception of composite, through December 31, 2005.
Separate Account
First $25 million: 75 bps
Next $25 million: 65 bps
Next $50 million: 60 bps
Over $100 million: 55 bps
The following fees represent composite performance based on an institutional separate account.
Effective December 1, 2010, the benchmark was changed from the MSCI World Free Index to the MSCI World Index.
**The 3-year standard deviation is not presented because 36 monthly composite and benchmark returns were not available.
FOR NON-U.S. INSTITUTIONAL USE ONLY
American Century Global Equity Capabilities
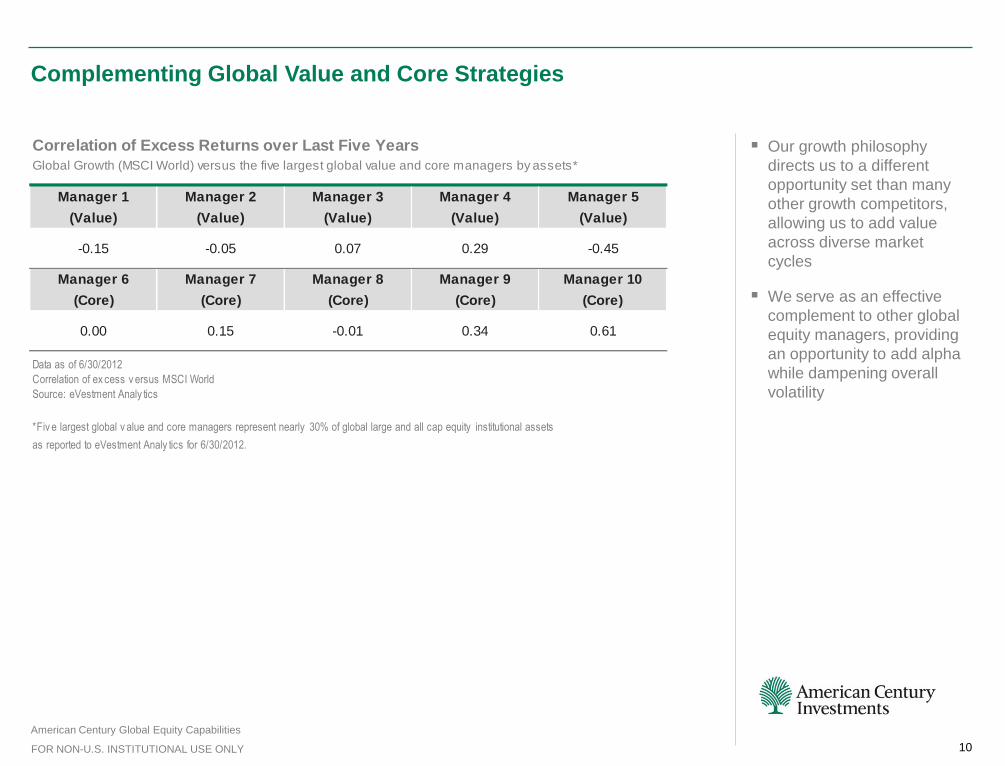
Performance Disclosures December 31, 2011
33
Global Concentrated Growth Equity
For purposes of compliance with the Global Investment Performance Standards (“GIPS® standards”), the Firm is
defined as American Century Investment Management, Inc. (“ACIM”).
American Century Investment Management, Inc. claims compliance with the Global Investment Performance
Standards (GIPS®) and has prepared and presented this report in compliance with the GIPS standards. ACIM has
been independently verified for the periods January 1, 1992 to December 31, 2010.
Verification assesses whether (1) the firm has complied with all the composite construction requirements of the
GIPS standards on a firm-wide basis and (2) the firm’s policies and procedures are designed to calculate and
present performance in compliance with the GIPS standards. The Global Concentrated Growth Equity composite
has been examined for the periods June 1, 2005 to December 31, 2010. The verification and performance
examination reports are available upon request.
Global Concentrated Growth Equity composite includes all portfolios managed using a concentrated growth
investment strategy primarily targeting large U.S. companies and large non-U.S. companies in developed
countries.
Performance results are expressed and calculated in U.S. dollars. The return may increase or decrease as a result
of currency fluctuations.
Consultants and investors supplied with these performance results are advised to use this data in accordance with
guidelines issued by the United States Securities and Exchange Commission. Past performance may not be
indicative of future returns. The value of any investment may rise or fall over time. Principal is not guaranteed and
investors may receive less than the full amount of principal invested at the time of redemption if asset values have
declined.
The performance results for this composite are net of foreign income tax withholding and include the effect of
foreign currency where applicable. The foreign income tax withholding rate varies by country and is recorded at the
tax rate specified by the country’s tax treaty. The composite is not a sub sector of a larger portfolio.
The performance results for the MSCI World Index are net of foreign income tax withholding. The assumed tax
rate varies form 0% to 35%, using the Mon perspective of a Luxembourg holding company. Effective December 1,
2010, the benchmark for this composite was changed from the MSCI World Free Index to the MSCI World Index.
Since 2004 these indices have been identically constructed. This change merely updates the fund’s benchmark to
the more commonly used index. The MSCI World Index is a free float-adjusted market capitalization weighted
index that is designed to measure the equity market performance of developed markets. Benchmark return
information is provided for comparative and referential purposes only. Benchmark information is provided by third
party sources, and is considered to be accurate.
The Composite’s dispersion of annual returns is measured by the asset-weighted standard deviation of individual
portfolio annual returns. Only portfolios that have been managed within the Composite for the full year are
included in the asset-weighted standard deviation calculation. Dispersion is not calculated for composites that
have five or fewer portfolios for the full calendar year.
The Firm utilizes a time-weighted total rate of return methodology to calculate performance. All portfolios are
valued daily based on principal market values plus accrued income. The market value of an account is the sum of
a portfolio’s total assets, including accrued interest and dividends, cash and cash equivalents, short-term
instruments, and securities valued at current market prices. Security transactions are recognized based on trade-
date accounting. Interest is recorded on an accrual basis and dividends are recorded on the ex-dividend date.
Portfolio returns are calculated monthly. For the Firm’s mutual fund accounts, portfolio returns are calculated
monthly using an account’s beginning and ending month-end unitized value and distributions of income and
capital gains, if applicable. For the Firm’s non-mutual fund accounts, portfolio returns are calculated daily using
the change in an account’s market value after taking into account cash flows on the account. All cash flows are
assumed to have been invested at the start of the day they are processed. Daily returns are geometrically linked
to determine the monthly return. Gross-of-fee returns include all trading costs and are calculated before
management fees, administrative fees, custody fees and distribution and service fees, as applicable. Net-of-fee
returns are calculated after all trading costs, actual management fees, custody fees, distribution and services
fees, as applicable. Management fees are based on the pro-rated annual management fee schedule net of
reimbursements. The composite returns are calculated monthly by weighting each account’s monthly return by its
beginning market value as a percent of the composite’s total beginning market value. Quarterly and annual
composite returns are calculated by geometrically linking the monthly composite returns. Policies for valuing
portfolios, calculating performance and preparing compliant presentations are available upon request.
The Firm established a $2 million minimum portfolio size for inclusion in the composite.
New portfolios are generally included in the composite rate of return calculations at the beginning of the month
immediately following the date they were funded. If a portfolio’s funding occurs after the 21st day of a month, the
portfolio is included in performance reporting as of the first day of the second full month after opening. Portfolios
that change investment strategies are transferred between composites in the first full monthly reporting period the
portfolios are managed under the new style. Terminated portfolios are included in the Composite rate of return
calculations through the completion of their last full month under management.
There has been no material change in personnel responsible for investment management. Leverage is not utilized
in this composite. Futures (and currency forwards and futures, where applicable or appropriate) are occasionally
used to manage portfolio risk. Other derivative instruments may be used, as allowed, as part of the investment
strategy.
The creation date for this composite is June 2005.
A complete list of the Firm’s composite descriptions is available upon request.
©2012 American Century Proprietary Holdings, Inc. All rights reserved.
FOR NON-U.S. INSTITUTIONAL USE ONLY
American Century Global Equity Capabilities

Investors in the United Kingdom: This promotion has been approved with limitations, in accordance with Section 21 of the Financial Services and Markets Act, by American Century Investment Management (UK) Limited, which is
authorised and regulated by the Financial Services Authority. This promotion is directed at persons having professional experience of participating in unregulated schemes and units to which the communication relates are available only to
such persons. Persons who do not have professional experience in participating in unregulated schemes should not rely on it.
American Century Investment Management (UK), Ltd., Global Distributor
American Century Investment Management (UK) Limited is registered in England. Registered number: 06520426.
Registered office: 30 Haymarket, London SW1Y 4EX
Investors in Denmark: American Century Investment Management, Inc. is not registered under the Danish Financial Business Act.
Investors in Finland: This presentation has been prepared for private information purposes of interested investors only. It may not be used for and shall not be deemed a public offering of securities. This product cannot be offered or sold in
Finland by means of any other document to any persons other than investors that qualify as "Professional Investors" as defined by the Finnish Mutual Funds Act (Sijoitursrahastolaki, 48/1999), as amended.
Investors in Australia: American Century Investment Management, Inc. is exempt from the requirement to hold an Australian financial services licence under the Corporations Act in respect of the financial services they will provide and it is
regulated by the SEC under US laws, which differ from Australian laws.
Investors in Norway: American Century Investment Management, Inc. is not registered with the Norwegian FSA.
Investors in the Netherlands: American Century Investment Management, Inc. has received an exemption from registration from the Dutch Authority for the Financial Markets to provide investment advice.
Investors in Switzerland: This information is not intended for public distribution and is offered only on a “non public offering basis” in Switzerland pursuant to SESTA/SESTO and/or CISA/CISO.
Investors in Germany: American Century Investment Management, Inc. is not authorised by the German Federal Financial Supervisory Authority (Bundesanstalt für Finanzdienstleistungsaufsicht (BaFin)).
Investors in New Zealand: The investment advisory services referred to in this document are, and will be, only provided in New Zealand to persons who are not members of the public for the purposes of Part 4 of the New Zealand Securities
Markets Act 1988 and who are (or who become) wholesale clients of American Century Investments for the purposes of the New Zealand Financial Advisers Act 2008. If you do not satisfy this criteria, you should return or destroy this
document without reading it.
Investors in Iceland: The shares shall not, whether directly or indirectly, be offered, sold, transferred or delivered in Iceland to any individual or legal entity other than institutional investors within the meaning of Item No. 9 in Article 2,
Paragraph 1, of the Icelandic Act No. 108/2007 on securities transactions (as amended from time to time), cf. Article 13 of Regulation No. 792/2003 on undertakings for collective investment in transferable securities (UCITS) and other funds
for collective investment. The fund has not been and will not be registered with the Icelandic Financial Supervisory Authority. This presentation has been issued to you for your personal use only and exclusively for the purposes of a private
offering. Accordingly, this presentation may not be used for any other purpose nor passed on to any other person in Iceland.
This promotion is not intended for public distribution and may only be distributed on a non-public offering basis.
Important Notes for Non-U.S. Investors
34 FOR NON-U.S. INSTITUTIONAL USE ONLY
American Century Global Equity Capabilities