Embed Size (px)
Citation preview
American Cancer Society, Inc. Management’s Discussion and Analysis and Financial Statements As of and for the Years Ended December 31, 2017 and 2016
Ernst & Young LLP

8
American Cancer Society, Inc. Contents
December 31, 2017 and 2016
Page(s) Management’s discussion and analysis of financial results (unaudited).................................................1-8 Report of Independent Auditors.......................................................................................................................9 Financial Statements Statements of Activities................................................................................................................................10-11 Statements of Functional Expenses.............................................................................................................12-13 Statements of Cash Flows............................................................................................................................14-15 Balance Sheets.................................................................................................................................................16 Stewardship Focused Disclosures...............................................................................................................17-24 Other Required Disclosures.........................................................................................................................25-44

AMERICAN CANCER SOCIETY, INC. MANAGEMENT’S DISCUSSION AND ANALYSIS OF FINANCIAL RESULTS
DECEMBER 31, 2017 (UNAUDITED)
1
Results from operations – expenses Total mission program and support services expenses for the years ended December 31, 2017 and 2016 were as follows (in thousands):
2017 2016
Mission program services:
Patient support 303,838$ 309,772$
Research 145,650 152,514
Prevention 129,155 113,718
Detection/treatment 79,539 88,184
Total mission program services 658,182 664,188
Mission support services:
Management and general 37,896 47,314
Fund-raising 142,343 175,460
Total mission support services 180,239 222,774
Total mission program and mission
support services expenses 838,421$ 886,962$ In 2017, we continued improving operational efficiencies through our strategic growth plan to allow us to have a bigger impact in our mission priority areas. From a mission perspective, we developed platforms to support our Cancer Control Blueprint. The blueprint’s aim is to define the future of cancer control in the United States. It will identify the most promising avenues for research, act on interventions that are proven to work and ensure everyone has an opportunity to benefit. The platforms supporting the blueprint include: research, colorectal cancer, human papilloma virus (“HPV”), access to care, tobacco control, lung cancer, breast cancer, survivorship and healthy communities. We continue to identify and prioritize prevention, early detection, treatment, advocacy and research strategies for every cancer. Expenses associated with our extramural and intramural research programs are included in the research platform and directly support many of the other platforms and strategies. A series of academic articles will be published soon to further support the vision laid out in the blueprint. Total mission services expenses for the year ended December 31, 2017 were $838 million, decreasing $49 million over 2016. We implemented cost reduction strategies to align with the decline in support from the public and to drive our strategic growth initiatives. One of those initiatives involved a review of our staffing structure to ensure we were resourced optimally to execute on our mission. Several staff positions were eliminated as a result of that work. In addition, we continued to reduce travel and meeting expenses by utilizing technology to conduct more virtual meetings. Total mission support services expenses were $180 million for the year ended December 31, 2017, representing 21 percent of total expenses, compared to $223 million for the year ending December 31, 2016, representing 25 percent of total expenses. For the year ended December 31, 2017 patient support expenses were $304 million, a decrease of $6 million compared to 2016, and included work such as the following: our specific assistance to individuals through our access to care and survivorship platforms; our 24 hours a day, 7 days a week, 365 days a year National Cancer Information Center, which provides consistent, unbiased cancer information to constituents, helping them make informed decisions about their health and cancer care; our Patient Navigator Program that helps cancer patients manage their care; and our Hope Lodge® facilities, which provide free, high quality, temporary lodging for patients and their caregivers close to treatment centers, thereby easing the emotional and financial burden of finding affordable lodging.

AMERICAN CANCER SOCIETY, INC. MANAGEMENT’S DISCUSSION AND ANALYSIS OF FINANCIAL RESULTS
DECEMBER 31, 2017 (UNAUDITED)
2
Results from operations – expenses, continued Research expenses were $146 million, a $7 million decrease over 2016, and comprised both our extramural research grants and intramural research program, which includes Cancer Prevention Study-3 (CPS-3), an important, large, prospective study to identify factors that cause or prevent cancer. We nearly completed the consent and collection of medical records and tissue samples from CPS-3 participants who reported a diagnosis of cancers of the breast, ovary, colorectal, prostate, and the hematopoietic system. We have been able to collect tissue specimens for over 1,500 participants. We also completed the first linkage of the CPS-3 study population to the National Death Index to ascertain deaths (and the cause of death), and found that between study enrollment and December 31, 2014 approximately 1000 CPS-3 participants died. Following the completion of the year-long dietary and physical activity/sleep validation sub-studies in 2016, we completed all blood and urine analysis for the CPS-3 dietary validation sub-study in 2017. Our extramural program funded 213 grants with an average value of $425 thousand compared to 241 grants in 2016 with an average value of $396 thousand. We continued our research in the areas of translational research and immunotherapy, among other areas. Our partnership with Stand Up To Cancer®, finishing its third year in 2017, has enabled the work of research groups at eight institutions nationwide. We established a partnership with the Melanoma Research Alliance in 2017 focused on symptom management for patients treated with checkpoint inhibitors, which have severe, treatment limiting side effects for 20-25% of treated patients. Our newly developed partnership with the Global Center for Medical Innovation is focused on development of medical devices and driving them towards use in patients. This partnership includes a joint commitment to raise $5 million to fuel the initiative. We are continuing to develop more partnerships and are anticipating an increased investment in pediatric cancer, melanoma, ovarian cancer and nutrition and physical activity. Prevention expenses were $129 million, a $15 million increase over 2016, and included the work of the Tobacco Free Generation Campus Initiative, a multi-year program started in 2016 intended to accelerate and expand the adoption and implementation of 100% smoke and tobacco free campuses. Additional tobacco control focus is on identifying the right combination of policies and public health interventions to eliminate combustible tobacco in the U.S. and around the world. Our work in promoting the human papillomavirus (HPV) vaccination continued through grants from the U.S. Centers for Disease Control and Prevention. We partnered with health care, immunization, cancer control and other organizations to increase HPV vaccination to prevent certain cancers. Detection/treatment expenses were $80 million, a $8 million decrease compared to 2016, and included our launch of the National Lung Cancer Screening Roundtable, which includes several members made up of clinical professionals, researchers, lung cancer advocates and patients, healthcare organizations and cancer centers, insurers and government agencies. The work of the roundtable will build upon advances in screening and treatment to fuel a rapid reduction in lung cancer mortality rates. We continue to play a critical leadership role in the national campaign to achieve 80 percent colon cancer screening rates of adults aged 50 and older by the end of 2018 (“80 percent by 2018”). 80 percent by 2018, a public health program, which we helped launch, has garnered the support of more than 1,500 diverse organizations who have committed to this shared goal. Management and general expenses were $38 million, a $9 million decrease compared to 2016, but remained relatively consistent compared to total mission services expenses from 2016. The decrease is reflective of our work to gain infrastructure efficiencies to support our mission work. Management and general expenses comprised our general infrastructure costs as well as board governance and oversight and our internal audit function - which provides independent oversight of our accounting and internal control processes. Additionally, efforts directed at these infrastructure efficiencies will continue to produce incremental results over time.

AMERICAN CANCER SOCIETY, INC. MANAGEMENT’S DISCUSSION AND ANALYSIS OF FINANCIAL RESULTS
DECEMBER 31, 2017 (UNAUDITED)
3
Results from operations – expenses, continued
Fundraising costs were $142 million, a decrease of $33 million compared to 2016. Much of the decrease
resulted from our ongoing review of our Relay For Life operating model. We began making changes to
the model in 2016 to help keep our volunteers engaged, strengthen our portfolio of events, and to
improve profitability and thereby have a greater mission impact. In 2017 we continued this work, which
included combining events and sunsetting less profitable events.
Results from operations – revenue
Total revenue, gains, and other support for the years ended December 31, 2017 and 2016 were as follows (in thousands):
2017 2016
Support from the public 736,258$ 779,168$
Investment income 79,480 39,965
Change in value of split-interest agreements 30,570 4,590
Grants and contracts from government agencies 5,784 6,076
Other gains 8,599 11,619
Total revenue, gains, and other support 860,691$ 841,418$ Total revenue for the year ended December 31, 2017 of $861 million increased by $19 million when compared to 2016. Stronger investment market performance accounted for much of the increase. Support from the public in 2017 was $736 million, down $43 million compared to the prior year primarily due to sunsetting of events and steady decline in participation and sponsorships for Relay For Life®. The sunsetting of events is the result of our ongoing review of the operating model mentioned earlier. Support from the public is mostly comprised of Relay For Life®, Making Strides Against Breast Cancer®, other special events, planned giving, contributed services and other in-kind contributions and general contributions from our public constituents through a variety of program channels. Non-public support, which primarily includes investment income, change in value of split-interest agreements and grants and contracts from government agencies was $124 million in 2017, a $62 million increase from 2016. Both investment income and change in value of split-interest agreements were the drivers of the increase as they are subject to the volatility in both interest rates and the equity and fixed income market performance, both domestic and global. In addition to investments and split-interest agreements, we regularly review our real estate footprint by examining conditions in the various markets where we have offices. We implemented strategies in a number of markets to optimize our space needs, which included the sale of some office buildings resulting in a net gain.

AMERICAN CANCER SOCIETY, INC. MANAGEMENT’S DISCUSSION AND ANALYSIS OF FINANCIAL RESULTS
DECEMBER 31, 2017 (UNAUDITED)
4
Results from operations – revenue, continued
Total support from the public for the five most recent fiscal years was as follows (in millions):
2017 2016 2015 2014 2013
Relay For Life 211$ 258$ 287$ 314$ 356$
Other community-based events
(Making Strides Against Breast Cancer,
DetermiNation and others) 77 80 83 82 95
Distinguished events (gala and golf) 59 59 56 56 52
Direct response strategies
(Direct mail, telemarketing) 55 55 54 53 54
Employer-based strategies - independent
payroll deduction campaigns 19 19 20 22 22
Major gifts/campaigns 66 60 61 43 41
Planned giving (legacies and bequests) 136 141 133 139 144
United Way/Combined Federal Campaign 5 7 7 8 10
Memorials 19 19 19 21 23
Contributed services
and other in-kind contributions 66 60 78 71 53
Other 23 21 12 31 35
Total support from the public 736$ 779$ 810$ 840$ 885$
Cost per dollar raised (in dollar) 0.19$ 0.22$ 0.22$ 0.21$ 0.23$
Support from the Public Revenue (in millions)
Within support from the public, special events (Relay For Life, Other community-based and Distinguished events) continue to lead our financial results, representing 47 percent of total support from the public in 2017, a $50 million or 13 percent decline over 2016. Financial results for our signature event, Relay For Life, declined $47 million, more than 18 percent, and accounted for approximately 61 percent of total special events revenue. The Relay For Life revenue base is very broad over a very diverse set of events (over 3,500 in 2017 in the U.S.) and constituents (2 million participants) and is a multi-variant vehicle to build awareness, celebrate our cancer survivors and caregivers, deliver prevention and detection messaging, and develop capacity in the communities that we serve. In 2017, we continued analyzing Relay For Life and implementing changes to our operating model. The changes are the result of extensive analysis of the portfolio and program in response to a market decline in peer to peer fundraising, feedback from participant surveys, and decreasing participation across a crowded event marketplace. The changes included merging or discontinuing underperforming events, rolling out a newly developed volunteer platform used to allow volunteers throughout the country to remain engaged and empower them to support the Society and enhance the Relay For Life experience, and piloting alternative staffing models that better utilize technology to support our events. We began implementing strategies to increase financial performance such as combining events within certain geographical proximity, implementing practices of successful events across certain under-performing events. Our Making Strides Against Breast Cancer program, raising $57 million in 2017, is a special event that raises awareness and funds to fight breast cancer and engages over 1 million participants nationwide. This revenue accounted for approximately 16 percent of special event revenue during 2017 and was down $3 million compared to 2016 due in part to weather issues in the southern parts of the country, fewer sponsors of events and staff turnover. The impact of the decline was lessened by a $1 million increase in the Real Men Wear Pink® initiative, which is a nationwide platform to engage men to support our mission.

AMERICAN CANCER SOCIETY, INC. MANAGEMENT’S DISCUSSION AND ANALYSIS OF FINANCIAL RESULTS
DECEMBER 31, 2017 (UNAUDITED)
5
Results from operations – revenue, continued
Major gifts/campaigns during 2017 were 9 percent of public support, which is consistent with 2016. The past three years were significantly higher than 2014 and prior years mainly due to significant private grants to fund tobacco control and cancer screening programs as well as the launch of successful new and substantial progress on current campaigns as we grow our Hope Lodge program. Our major gifts have seen increases in both volume and size of individual gifts and are a continued focus in our strategic growth plan. Our campaign revenue represents funds raised for our Hope Lodge campaigns, which are geographically determined by utilizing feasibility studies, such as patient needs assessments and market viability analyses supporting any anticipated capital campaign, including expansions or renovations. Employee giving, including United Way and Combined Federal Campaign relationships, comprised more than 3 percent of our public support in 2017. Direct response, both mail and telemarketing, made up about 7 percent of public support in 2017, consistent with 2016. Support from our planned giving program (legacies and bequests) totaled $136 million and, although it can be volatile from year to year, continues to be a material and strong source of revenue. The decrease in planned giving support compared to 2016 was due to a fewer number of significant gifts as well as a reduction in average gift size. The increase in contributed services and other in-kind donations was related to growth in our partnerships in the professional sports industry. Investment income components produced positive results in 2017. Net interest and dividends and realized/unrealized investment gains increased $40 million due to stronger market performance during 2017. Change in value of split-interest agreements was a gain of $31 million, an increase of $26 million over 2016, also driven by the stronger market performance during 2017. These results can be volatile because they are based on significant assumptions of our beneficial interests in trusts (equivalent to deferred gifts). Most of the change in value of split-interest agreements is from gains recognized due to the appreciation in the underlying market value of the assets in the trusts. We are not the trustee of these trusts and therefore do not have control of the investment decisions surrounding these assets, but rather report our proportionate share of the fair value. We evaluate the program based on probate results as well as expectancies, both of which are not as prone to significant fluctuations and provide a more accurate assessment of performance. The Planned Giving management team continues to identify future gifts, although not recognizable under current generally accepted accounting principles but accretive to the significant planned giving pipeline of future revenue.
AMERICAN CANCER SOCIETY, INC. MANAGEMENT’S DISCUSSION AND ANALYSIS OF FINANCIAL RESULTS
DECEMBER 31, 2017 (UNAUDITED)
6
Liquidity and cash flows
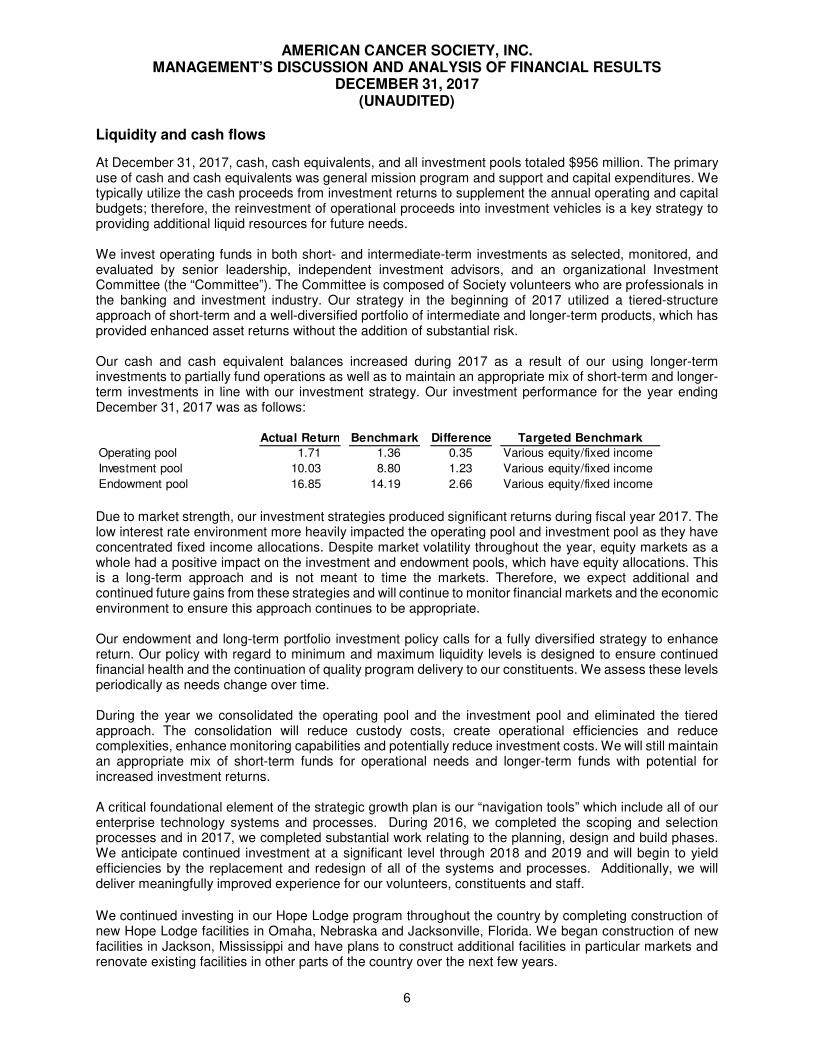
At December 31, 2017, cash, cash equivalents, and all investment pools totaled $956 million. The primary use of cash and cash equivalents was general mission program and support and capital expenditures. We typically utilize the cash proceeds from investment returns to supplement the annual operating and capital budgets; therefore, the reinvestment of operational proceeds into investment vehicles is a key strategy to providing additional liquid resources for future needs. We invest operating funds in both short- and intermediate-term investments as selected, monitored, and evaluated by senior leadership, independent investment advisors, and an organizational Investment Committee (the “Committee”). The Committee is composed of Society volunteers who are professionals in the banking and investment industry. Our strategy in the beginning of 2017 utilized a tiered-structure approach of short-term and a well-diversified portfolio of intermediate and longer-term products, which has provided enhanced asset returns without the addition of substantial risk. Our cash and cash equivalent balances increased during 2017 as a result of our using longer-term investments to partially fund operations as well as to maintain an appropriate mix of short-term and longer-term investments in line with our investment strategy. Our investment performance for the year ending December 31, 2017 was as follows:
Targeted Benchmark
Operating pool 1.71 1.36 0.35 Various equity/fixed income
Investment pool 10.03 8.80 1.23 Various equity/fixed income
Endowment pool 16.85 14.19 2.66 Various equity/fixed income
Actual Return Benchmark Difference
Due to market strength, our investment strategies produced significant returns during fiscal year 2017. The low interest rate environment more heavily impacted the operating pool and investment pool as they have concentrated fixed income allocations. Despite market volatility throughout the year, equity markets as a whole had a positive impact on the investment and endowment pools, which have equity allocations. This is a long-term approach and is not meant to time the markets. Therefore, we expect additional and continued future gains from these strategies and will continue to monitor financial markets and the economic environment to ensure this approach continues to be appropriate. Our endowment and long-term portfolio investment policy calls for a fully diversified strategy to enhance return. Our policy with regard to minimum and maximum liquidity levels is designed to ensure continued financial health and the continuation of quality program delivery to our constituents. We assess these levels periodically as needs change over time. During the year we consolidated the operating pool and the investment pool and eliminated the tiered approach. The consolidation will reduce custody costs, create operational efficiencies and reduce complexities, enhance monitoring capabilities and potentially reduce investment costs. We will still maintain an appropriate mix of short-term funds for operational needs and longer-term funds with potential for increased investment returns. A critical foundational element of the strategic growth plan is our “navigation tools” which include all of our enterprise technology systems and processes. During 2016, we completed the scoping and selection processes and in 2017, we completed substantial work relating to the planning, design and build phases. We anticipate continued investment at a significant level through 2018 and 2019 and will begin to yield efficiencies by the replacement and redesign of all of the systems and processes. Additionally, we will deliver meaningfully improved experience for our volunteers, constituents and staff.
We continued investing in our Hope Lodge program throughout the country by completing construction of new Hope Lodge facilities in Omaha, Nebraska and Jacksonville, Florida. We began construction of new facilities in Jackson, Mississippi and have plans to construct additional facilities in particular markets and renovate existing facilities in other parts of the country over the next few years.
AMERICAN CANCER SOCIETY, INC. MANAGEMENT’S DISCUSSION AND ANALYSIS OF FINANCIAL RESULTS
DECEMBER 31, 2017 (UNAUDITED)
7
Liquidity and cash flows, continued To assist with our Jackson, Mississippi construction, we entered into a New Markets Tax Credit financing arrangement. Under the terms of the arrangement, we expect to hold a note payable for 7 years, which is identical to the investor’s tax credit period. The results of this arrangement will net us approximately $2.5 million in cash at the end of the credit period. During 2017 we executed a lump sum option for our defined benefit plan, whereby a certain population of our terminated, vested participant populations was permitted to elect payout of their benefit in the form of a lump sum. Approximately 34 percent of eligible participants elected the payment option, which represented approximately 10 percent of the assets held in the plan. Approximately 11 percent of the accounting liability of the plan was settled, which will also reduce plan fees, over time, related to servicing the participants who elected the payout.
Looking forward
We believe it is important to discuss our historical results to provide transparency to our decisions and the resulting impact of those decisions, as well as the impact of external pressures such as economic drivers and our response to those drivers. However, we believe it is just as important, if not more so, to provide forward-looking information to illuminate our path.
Our greatest asset is our dedicated team of staff and volunteers throughout the country that carry out our lifesaving mission on a day to day basis. We will conduct follow up engagement surveys and activities to gauge the success and effectiveness of changes we implemented in 2016 aimed at increasing engagement with our staff and volunteers across the organization. We will use that valuable feedback to identify opportunity areas to make improvements with the goal of being a more impactful organization for which to work and volunteer. We continue to analyze our current revenue portfolio and opportunities and in 2018 will continue investing in our comprehensive, integrated, communication and marketing campaign to increase our relevance to our constituents. A significant component of our strategic growth plan in 2018 will be focused on increasing revenues in more diverse and operationally efficient ways. We will seek to build strong corporate partners, increase our online presence as well as our major gifts, and explore new revenue models. We will continue to invest and develop our sports and entertainment platform. Regarding expenditures, our strategic growth plan will continue guiding our mission priorities. We have
committed to doubling our investment in life-saving research over the near term, maintain our work in
prevention and early detection as well as sharpen our focus on patient access to quality healthcare. Our
vision for the future of cancer control is to help build low-cancer burden communities by preventing more
cancers, finding more cancers early, finding new treatments and cures, and advocating for everyone to
benefit equally. Specifically, we will focus on patient transportation, lodging and navigation. Working with
the National Colorectal Cancer Roundtable, we are planning for the next phase of work to increase
colorectal screening beyond 2018. We have many Hope Lodge facilities under construction and planned
for the future and, when complete, we will invest in operating and maintaining those as well as our existing
Hope Lodge no-charge facilities to ease the burden of patient and caregiver lodging during cancer
treatment. Continued investment will be made in support of the CPS-3 as we complete a follow-up survey
to study participants in 2018. We plan to initiate collection of medical records and tissue samples for the
same five cancer sites from the 2015 survey. In addition, numerous other papers are being prepared to
assess the reliability of other information collected such as height, weight, and smoking behaviors. We will
also explore the acceptability of establishing a CPS-3 participant portal for enhancing two-way
communication and moving to real-time data collection, particularly among cancer survivors, through focus
groups qualitative studies.

AMERICAN CANCER SOCIETY, INC. MANAGEMENT’S DISCUSSION AND ANALYSIS OF FINANCIAL RESULTS
DECEMBER 31, 2017 (UNAUDITED)
8
Looking forward, continued In terms of liquidity, we continue to investigate a number of strategies for reducing the impact of market volatility on our funding requirements and financial results related to our defined benefit plan. In 2018, we will continue the work of replacing our core and supplemental financial and constituent management systems, which includes a review and reengineering of our internal operations. This investment will continue through 2019 and will result in efficiencies, which will be a critical aid in driving the success of the enterprise outcomes so that as an organization we are able to support the strategic growth plan objectives both now and well into the future, including a strong focus on our customers. As part of our commitment to expanding research we will begin a program to invest in companies that focus on cancer research aimed at accelerating outcomes to benefit patients. The investments will be funded by a combination of $25 million of cash reserves and new donations solicited specifically for this important program. Returns generated by these investments will be used for funding additional research and other mission programs. Over the next few years, all of the above in combination are expected to close the current operating deficit of expenses over revenue. Management and the Board of Directors are monitoring the progress of the deficit situation closely. Management and the Board of Directors have developed an enterprise risk management framework. In 2018, we will use that framework to better inform and enhance our operational decisions. Such decisions could affect our financial results as it may guide us to new and different opportunities in the future. In 2018, we will be implementing new accounting standards that may impact the format of our financial statements and financial reporting practices as well as our recognition of certain types of revenue. We are also in the process of reviewing the Lease standard to assess the impact, if any, on our financial reporting. Further discussion of our mission, goals, and progress is provided in our Annual Report, which is available on cancer.org. Any questions should be directed to the Chief Financial Officer at 250 Williams Street, Atlanta, GA 30303.
9
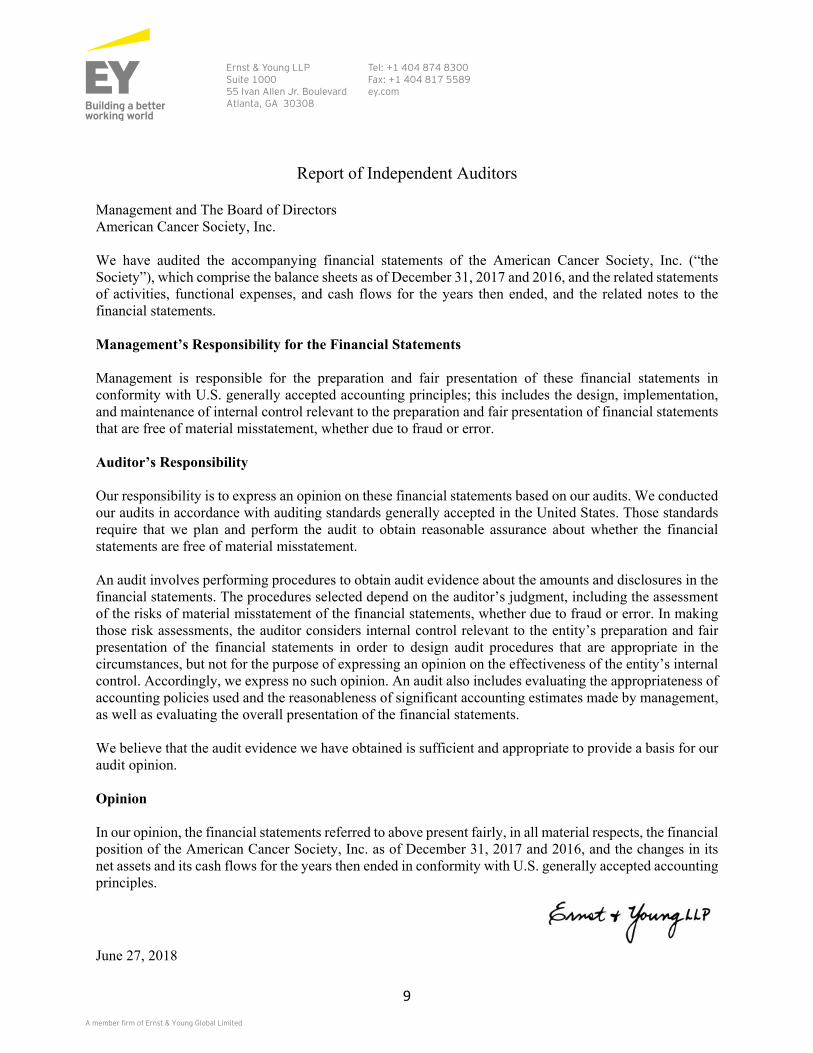
Report of Independent Auditors Management and The Board of Directors American Cancer Society, Inc. We have audited the accompanying financial statements of the American Cancer Society, Inc. (“the Society”), which comprise the balance sheets as of December 31, 2017 and 2016, and the related statements of activities, functional expenses, and cash flows for the years then ended, and the related notes to the financial statements. Management’s Responsibility for the Financial Statements Management is responsible for the preparation and fair presentation of these financial statements in conformity with U.S. generally accepted accounting principles; this includes the design, implementation, and maintenance of internal control relevant to the preparation and fair presentation of financial statements that are free of material misstatement, whether due to fraud or error. Auditor’s Responsibility Our responsibility is to express an opinion on these financial statements based on our audits. We conducted our audits in accordance with auditing standards generally accepted in the United States. Those standards require that we plan and perform the audit to obtain reasonable assurance about whether the financial statements are free of material misstatement. An audit involves performing procedures to obtain audit evidence about the amounts and disclosures in the financial statements. The procedures selected depend on the auditor’s judgment, including the assessment of the risks of material misstatement of the financial statements, whether due to fraud or error. In making those risk assessments, the auditor considers internal control relevant to the entity’s preparation and fair presentation of the financial statements in order to design audit procedures that are appropriate in the circumstances, but not for the purpose of expressing an opinion on the effectiveness of the entity’s internal control. Accordingly, we express no such opinion. An audit also includes evaluating the appropriateness of accounting policies used and the reasonableness of significant accounting estimates made by management, as well as evaluating the overall presentation of the financial statements. We believe that the audit evidence we have obtained is sufficient and appropriate to provide a basis for our audit opinion. Opinion In our opinion, the financial statements referred to above present fairly, in all material respects, the financial position of the American Cancer Society, Inc. as of December 31, 2017 and 2016, and the changes in its net assets and its cash flows for the years then ended in conformity with U.S. generally accepted accounting principles.
June 27, 2018
A member firm of Ernst & Young Global Limited
Ernst & Young LLP Suite 1000 55 Ivan Allen Jr. Boulevard Atlanta, GA 30308
Tel: +1 404 874 8300 Fax: +1 404 817 5589 ey.com

10
Temporarily Permanently
Unrestricted Restricted Restricted Total
Our mission program and mission support expenses were:
Mission program services:
Patient support 303,838$ -$ -$ 303,838$
Research 145,650 145,650
Prevention 129,155 - - 129,155
Detection/treatment 79,539 - - 79,539
Total mission program services 658,182 - - 658,182
Mission support services:
Management and general 37,896 - - 37,896
Fund-raising 142,343 - - 142,343
Total mission support services 180,239 - - 180,239
Total mission program and mission
support services expenses 838,421 - - 838,421
Our mission program and mission support expenses were funded by:
Support from the public:
Special events, including Relay For Life® and Making
Strides Against Breast Cancer® 269,463 74,979 - 344,442
Contributions 122,775 64,288 54 187,117
Bequests 87,823 44,448 816 133,087
Contributed services, merchandise and other
in-kind contributions 24,446 41,861 - 66,307
Other 3,387 1,918 - 5,305
Total support from the public 507,894 227,494 870 736,258
Investment income 57,006 22,472 2 79,480
Change in value of split-interest agreements 5,881 10,150 14,539 30,570
Grants and contracts from government agencies 5,344 440 - 5,784
Other gains (losses) 8,673 (74) - 8,599
Total revenues, gains and other support 584,798 260,482 15,411 860,691
Use of amounts restricted by donors
for specified purpose or time 230,188 (230,747) 559 -
Change in net assets prior to impact
of retirement plan liability (23,435) 29,735 15,970 22,270
Net decrease in retirement plan liability (9,660) - - (9,660)
Change in net assets (13,775) 29,735 15,970 31,930
Net assets, beginning of period 527,859 310,054 285,721 1,123,634
Net assets, end of period 514,084$ 339,789$ 301,691$ 1,155,564$
The notes beginning on page 17 are an integral part of the financial statements.
AMERICAN CANCER SOCIETY, INC.
STATEMENT OF ACTIVITIES
FOR THE YEAR ENDED DECEMBER 31, 2017
(In Thousands)
Donor Restricted

11
Temporarily Permanently
Unrestricted Restricted Restricted Total
Our mission program and mission support expenses were:
Mission program services:
Patient support 309,772$ -$ -$ 309,772$
Research 152,514 152,514
Prevention 113,718 - - 113,718
Detection/treatment 88,184 - - 88,184
Total mission program services 664,188 - - 664,188
Mission support services:
Management and general 47,314 - - 47,314
Fund-raising 175,460 - - 175,460
Total mission support services 222,774 - - 222,774
Total mission program and mission
support services expenses 886,962 - - 886,962
Our mission program and mission support expenses were funded by:
Support from the public:
Special events, including Relay For Life® and Making
Strides Against Breast Cancer® 314,504 78,386 - 392,890
Contributions 116,034 65,298 8 181,340
Bequests 97,466 33,447 7,059 137,972
Contributed services, merchandise and other
in-kind contributions 21,519 38,209 - 59,728
Other 5,371 1,867 - 7,238
Total support from the public 554,894 217,207 7,067 779,168
Investment income 30,539 9,424 2 39,965
Change in value of split-interest agreements 1,830 1,885 875 4,590
Grants and contracts from government agencies 5,620 456 - 6,076
Other gains 10,418 1,201 - 11,619
Total revenues, gains and other support 603,301 230,173 7,944 841,418
Use of amounts restricted by donors
for specified purpose or time 200,589 (199,360) (1,229) -
Change in net assets prior to impact
of retirement plan liability (83,072) 30,813 6,715 (45,544)
Net increase in retirement plan liability 6,206 - - 6,206
Change in net assets (89,278) 30,813 6,715 (51,750)
Net assets, beginning of period 617,137 279,241 279,006 1,175,384
Net assets, end of period 527,859$ 310,054$ 285,721$ 1,123,634$
The notes beginning on page 17 are an integral part of the financial statements.
AMERICAN CANCER SOCIETY, INC.
STATEMENT OF ACTIVITIES
FOR THE YEAR ENDED DECEMBER 31, 2016
(In Thousands)
Donor Restricted

12
Patient
support Research
Prevention
Detection
/ treatment
Management
and general Fund-raising Total
Mission program and mission support expenses
Salaries 130,185$ 24,457$ 52,962$ 35,398$ 17,359$ 68,496$ 328,857$
Employee benefits 29,817 4,350 10,793 7,269 3,650 14,205 70,084
Payroll taxes 9,802 1,767 3,905 2,620 1,287 5,102 24,483
Professional fees 17,854 11,580 9,415 6,069 3,915 9,975 58,808
Grants for mission program services 2,707 90,600 5,423 4,609 - - 103,339
Educational materials 26,929 1,115 21,424 9,107 2,314 15,164 76,053
Direct assistance, including wigs, and Look
Good Feel Better® kits 22,240 - 19 123 - - 22,382
Travel 5,064 1,015 3,527 1,969 562 3,387 15,524
Postage and shipping 3,936 143 3,621 1,186 1,807 2,732 13,425
Meetings and conferences 2,523 621 2,019 1,067 496 1,729 8,455
Community office locations, including rent,
maintenance and utilities 24,012 2,454 5,396 3,747 1,940 7,266 44,815
Technology 8,627 3,075 3,405 1,797 1,490 4,208 22,602
Telecommunications 3,862 1,574 1,645 1,026 436 1,871 10,414
Depreciation and amortization 6,780 1,060 2,245 1,654 866 3,395 16,000
Miscellaneous 9,500 1,839 3,356 1,898 1,774 4,813 23,180
Total mission program and mission support
services expenses 303,838$ 145,650$ 129,155$ 79,539$ 37,896$ 142,343$ 838,421$
The notes beginning on page 17 are an integral part of the financial statements.
AMERICAN CANCER SOCIETY, INC.
STATEMENT OF FUNCTIONAL EXPENSES
FOR THE YEAR ENDED DECEMBER 31, 2017
(In Thousands)
Mission program Mission support
13
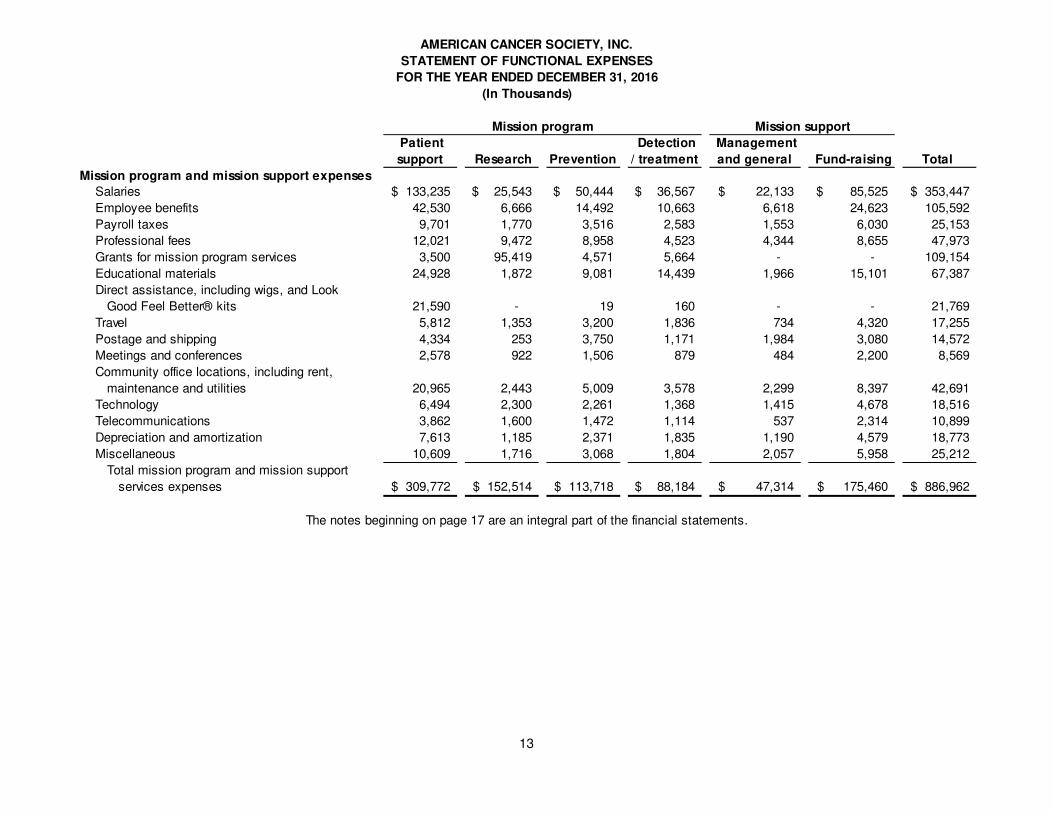
Patient
support Research
Prevention
Detection
/ treatment
Management
and general Fund-raising Total
Mission program and mission support expenses
Salaries 133,235$ 25,543$ 50,444$ 36,567$ 22,133$ 85,525$ 353,447$
Employee benefits 42,530 6,666 14,492 10,663 6,618 24,623 105,592
Payroll taxes 9,701 1,770 3,516 2,583 1,553 6,030 25,153
Professional fees 12,021 9,472 8,958 4,523 4,344 8,655 47,973
Grants for mission program services 3,500 95,419 4,571 5,664 - - 109,154
Educational materials 24,928 1,872 9,081 14,439 1,966 15,101 67,387
Direct assistance, including wigs, and Look
Good Feel Better® kits 21,590 - 19 160 - - 21,769
Travel 5,812 1,353 3,200 1,836 734 4,320 17,255
Postage and shipping 4,334 253 3,750 1,171 1,984 3,080 14,572
Meetings and conferences 2,578 922 1,506 879 484 2,200 8,569
Community office locations, including rent,
maintenance and utilities 20,965 2,443 5,009 3,578 2,299 8,397 42,691
Technology 6,494 2,300 2,261 1,368 1,415 4,678 18,516
Telecommunications 3,862 1,600 1,472 1,114 537 2,314 10,899
Depreciation and amortization 7,613 1,185 2,371 1,835 1,190 4,579 18,773
Miscellaneous 10,609 1,716 3,068 1,804 2,057 5,958 25,212
Total mission program and mission support
services expenses 309,772$ 152,514$ 113,718$ 88,184$ 47,314$ 175,460$ 886,962$
The notes beginning on page 17 are an integral part of the financial statements.
AMERICAN CANCER SOCIETY, INC.
STATEMENT OF FUNCTIONAL EXPENSES
FOR THE YEAR ENDED DECEMBER 31, 2016
(In Thousands)
Mission program Mission support

14
Cash flows from operating activities 2017 2016
Cash received from (paid for):
Special events 389,942$ 441,214$
Contributions 139,963 157,298
Bequests 137,554 100,370
Other support from the public 4,065 7,316
Government grants 7,257 6,196
Interest and dividends on investments, net 22,968 24,968
Other revenue 7,901 9,435
Program services 27,720 29,695
Interest on debt (957) (790)
Employees and suppliers (697,466) (723,380)
Direct assistance (1,009) (3,771)
Retirement plan contributions (32,303) (81,142)
Grants for mission program services (98,481) (103,428)
Net cash paid for operating activities (92,846) (136,019)
Cash flows from investing activities
Purchase of fixed assets (14,810) (12,673)
Proceeds from disposal of fixed assets 19,129 14,801
Support from the public restricted for fixed asset acquisition 28,344 13,118
Purchases of investments (374,175) (174,735)
Proceeds from maturities or sale of investments 432,550 342,015
Net cash received from investing activities 91,038 182,526
Cash flows from financing activities
Payments made to annuitants (2,728) (2,306)
Proceeds from annuitants 555 426
Support from the public restricted for long-term Investment 870 (3,059)
Payments on debt (2,339) 7,067
Proceeds from issuances of debt 9,608 -
Net cash received from financing activities 5,966 2,128
Net change in cash and cash equivalents 4,158 48,635
Cash and cash equivalents, beginning of year 116,400 67,765
Cash and cash equivalents, end of year 120,558$ 116,400$
AMERICAN CANCER SOCIETY, INC.
STATEMENTS OF CASH FLOWS
FOR THE YEARS ENDED DECEMBER 31, 2017 and 2016
(In Thousands)
The notes beginning on page 17 are an integral part of the financial statements.

15
Cash flows from operating activities 2017 2016
Change in net assets 31,930$ (51,750)$
Adjustments to reconcile change in net assets to net
cash paid for operating activities:
Depreciation and amortization 16,023 18,785
Net realized and unrealized investment gains (56,513) (14,997)
Change in value of split-interest agreements (30,570) (4,590)
Gain on disposal of fixed assets (9,192) (8,248)
Net (decrease) increase in retirement plan liability (9,660) 6,206
Support from the public restricted for long-term investment (870) (7,067)
Support from the public restricted for fixed asset acquisition (28,344) (13,118)
Changes in assets and liabilities:
Receivables, net (25,440) (12,714)
Prepaid expenses and other assets 413 (11)
Bequests receivable 13,168 (17,940)
Beneficial interests in trusts (7,602) (12,920)
Research and other program grants payable 4,858 5,727
Accounts payable and other accrued expenses
and employee retirement benefits 3,045 (22,480)
Other liabilities 5,908 (902)
Net cash paid for operating activities (92,846)$ (136,019)$
AMERICAN CANCER SOCIETY, INC.
STATEMENTS OF CASH FLOWS
FOR THE YEARS ENDED DECEMBER 31, 2017 and 2016
(In Thousands)
The notes beginning on page 17 are an integral part of the financial statements.
16
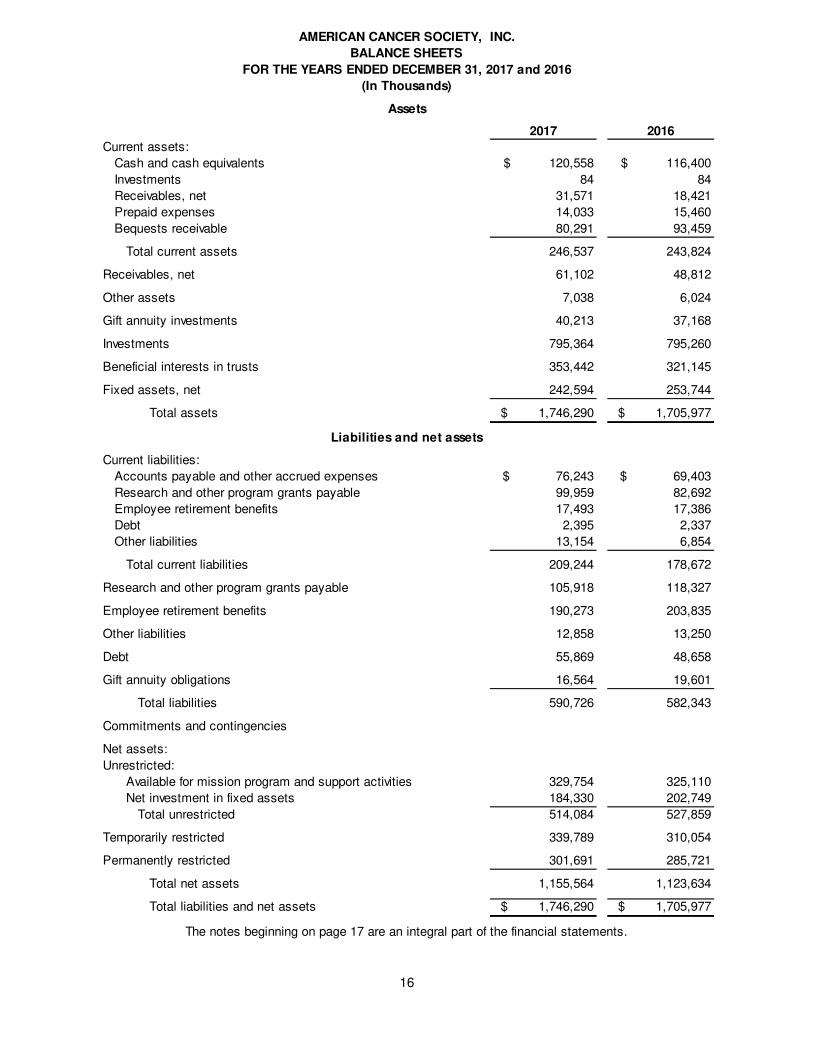
2017 2016
Current assets:
Cash and cash equivalents $ 120,558 $ 116,400
Investments 84 84
Receivables, net 31,571 18,421
Prepaid expenses 14,033 15,460
Bequests receivable 80,291 93,459
Total current assets 246,537 243,824
Receivables, net 61,102 48,812
Other assets 7,038 6,024
Gift annuity investments 40,213 37,168
Investments 795,364 795,260
Beneficial interests in trusts 353,442 321,145
Fixed assets, net 242,594 253,744
Total assets $ 1,746,290 $ 1,705,977
Current liabilities:
Accounts payable and other accrued expenses $ 76,243 $ 69,403
Research and other program grants payable 99,959 82,692
Employee retirement benefits 17,493 17,386
Debt 2,395 2,337
Other liabilities 13,154 6,854
Total current liabilities 209,244 178,672
Research and other program grants payable 105,918 118,327
Employee retirement benefits 190,273 203,835
Other liabilities 12,858 13,250
Debt 55,869 48,658
Gift annuity obligations 16,564 19,601
Total liabilities 590,726 582,343
Commitments and contingencies
Net assets:
Unrestricted:
Available for mission program and support activities 329,754 325,110
Net investment in fixed assets 184,330 202,749
Total unrestricted 514,084 527,859
Temporarily restricted 339,789 310,054
Permanently restricted 301,691 285,721
Total net assets 1,155,564 1,123,634
Total liabilities and net assets $ 1,746,290 $ 1,705,977
Liabilities and net assets
The notes beginning on page 17 are an integral part of the financial statements.
AMERICAN CANCER SOCIETY, INC.
BALANCE SHEETS
FOR THE YEARS ENDED DECEMBER 31, 2017 and 2016
(In Thousands)
Assets
AMERICAN CANCER SOCIETY, INC. NOTES TO FINANCIAL STATEMENTS
DECEMBER 31, 2017 and 2016 (Dollars in thousands)
17
STEWARDSHIP FOCUSED DISCLOSURES
1. Organizational Overview
Our mission The American Cancer Society’s (the "Society") mission is to save lives, celebrate lives, and lead the fight for a world without cancer. The following four broad areas guide our outcomes in the fight against cancer: • Patient support – Programs to assist cancer patients and their families and ease the burden of cancer
for them.
• Research – Support to fund and conduct research into the causes of cancer; how it can be prevented, detected early, and treated successfully; how to improve quality of life for people living with cancer; and to advocate for laws and policies that help further cancer research.
• Prevention – Programs that provide the public and health professionals with information and education to prevent cancer occurrence or to reduce risk of developing cancer.
• Detection/treatment – Programs that are directed at finding cancer before it is clinically apparent and
that provide information and education about cancer treatments for cure, recurrence, symptom management and pain control.
Within these mission activities are certain signature programs that are not replicated in any other voluntary health organization. Our 24 hours a day, 7 days a week, 365 days a year National Cancer Information Center provides consistent, high-quality, unbiased cancer information to constituents, helping them make informed decisions about their health and cancer care. Through our Road To Recovery® program, we provide free transportation to and from cancer treatment. American Cancer Society Hope Lodge facilities provide free, high quality, temporary lodging for patients and their caregivers close to treatment centers, thereby easing the emotional and financial burden of finding affordable lodging. Our award-winning research programs consist of the Extramural Grants department (funding to outside research institutions) as well as the Intramural Research department (research conducted by Society researchers), with programs in epidemiology, surveillance research, health services research, behavioral research, international tobacco control research, and statistics and evaluation.
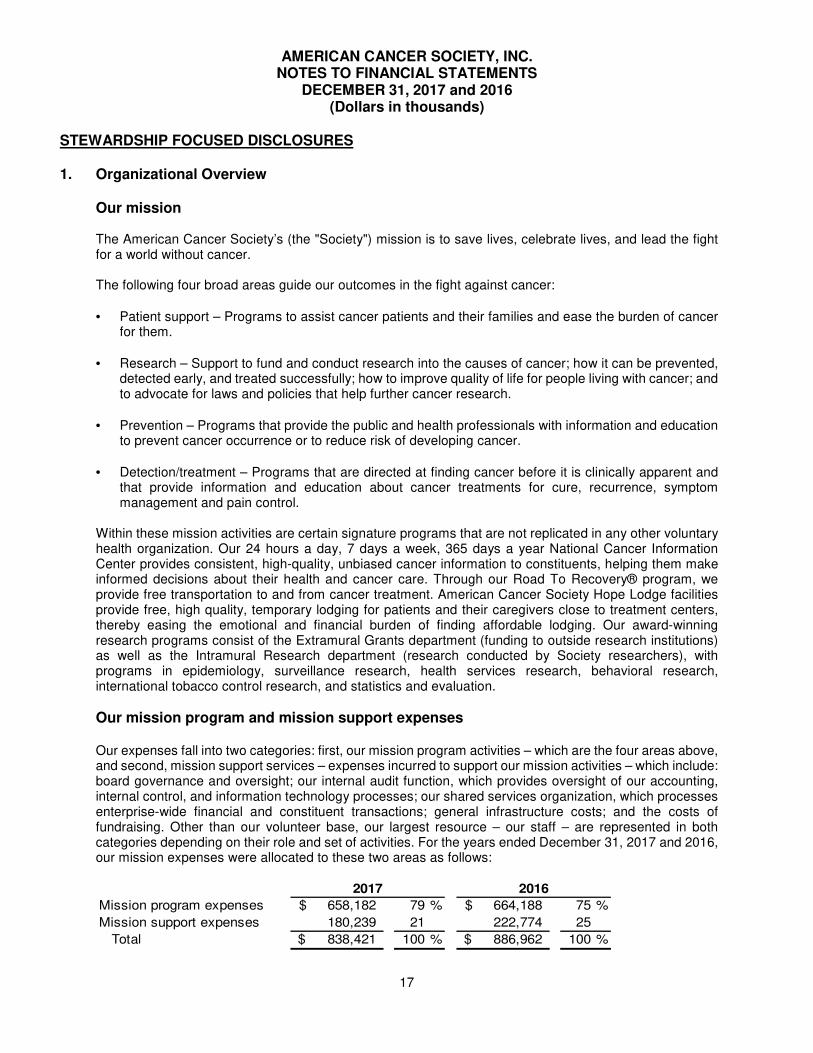
Our mission program and mission support expenses Our expenses fall into two categories: first, our mission program activities – which are the four areas above, and second, mission support services – expenses incurred to support our mission activities – which include: board governance and oversight; our internal audit function, which provides oversight of our accounting, internal control, and information technology processes; our shared services organization, which processes enterprise-wide financial and constituent transactions; general infrastructure costs; and the costs of fundraising. Other than our volunteer base, our largest resource – our staff – are represented in both categories depending on their role and set of activities. For the years ended December 31, 2017 and 2016, our mission expenses were allocated to these two areas as follows:
Mission program expenses 658,182$ 79 % 664,188$ 75 %
Mission support expenses 180,239 21 222,774 25
Total 838,421$ 100 % 886,962$ 100 %
2017 2016
AMERICAN CANCER SOCIETY, INC. NOTES TO FINANCIAL STATEMENTS
DECEMBER 31, 2017 and 2016 (Dollars in thousands)
18
2. Liquidity considerations
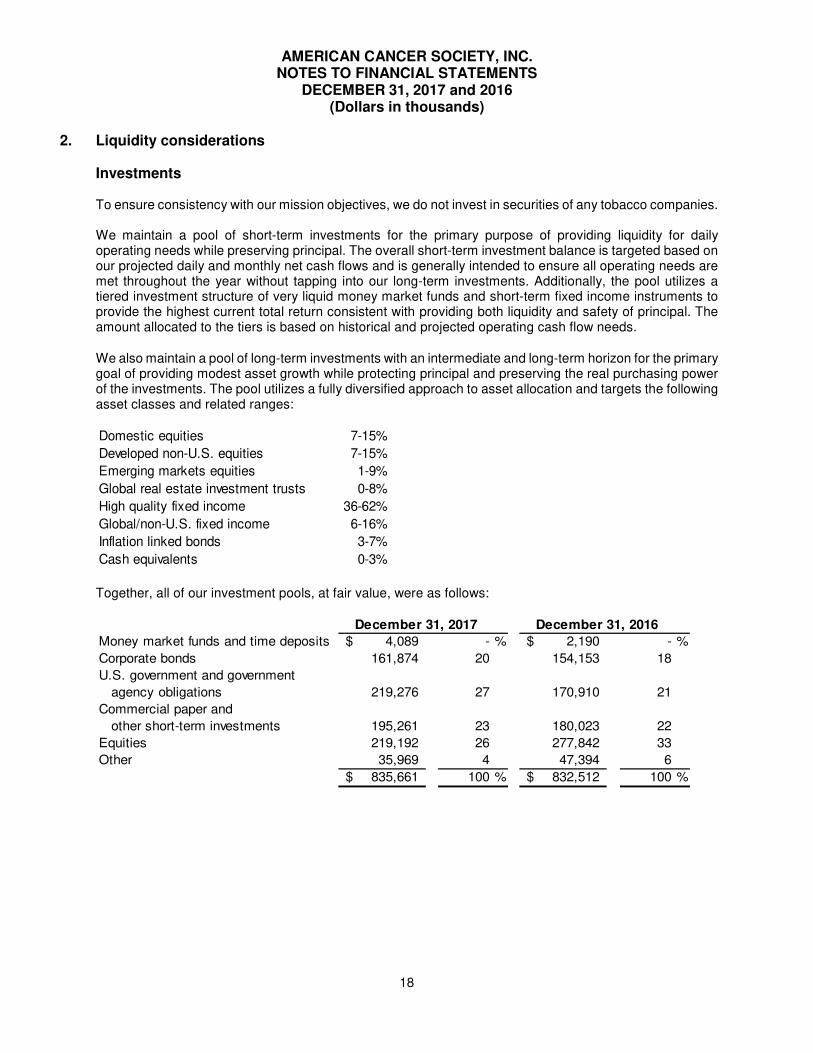
Investments To ensure consistency with our mission objectives, we do not invest in securities of any tobacco companies. We maintain a pool of short-term investments for the primary purpose of providing liquidity for daily operating needs while preserving principal. The overall short-term investment balance is targeted based on our projected daily and monthly net cash flows and is generally intended to ensure all operating needs are met throughout the year without tapping into our long-term investments. Additionally, the pool utilizes a tiered investment structure of very liquid money market funds and short-term fixed income instruments to provide the highest current total return consistent with providing both liquidity and safety of principal. The amount allocated to the tiers is based on historical and projected operating cash flow needs.
We also maintain a pool of long-term investments with an intermediate and long-term horizon for the primary goal of providing modest asset growth while protecting principal and preserving the real purchasing power of the investments. The pool utilizes a fully diversified approach to asset allocation and targets the following asset classes and related ranges:
Domestic equities 7-15%
Developed non-U.S. equities 7-15%
Emerging markets equities 1-9%
Global real estate investment trusts 0-8%
High quality fixed income 36-62%
Global/non-U.S. fixed income 6-16%
Inflation linked bonds 3-7%
Cash equivalents 0-3% Together, all of our investment pools, at fair value, were as follows:
Money market funds and time deposits 4,089$ - % 2,190$ - %
Corporate bonds 161,874 20 154,153 18
U.S. government and government
agency obligations 219,276 27 170,910 21
Commercial paper and
other short-term investments 195,261 23 180,023 22
Equities 219,192 26 277,842 33
Other 35,969 4 47,394 6
835,661$ 100 % 832,512$ 100 %
December 31, 2017 December 31, 2016

AMERICAN CANCER SOCIETY, INC. NOTES TO FINANCIAL STATEMENTS
DECEMBER 31, 2017 and 2016 (Dollars in thousands)
19
2. Liquidity considerations, continued
Investments, continued The components of our investment income were as follows:
Temporarily Permanently
Unrestricted Restricted Restricted Total
Interest and dividends, net 18,295$ 4,670$ 2$ 22,967$
Net realized and unrealized
investment gains 38,711 17,802 - 56,513
Total investment income 57,006$ 22,472$ 2$ 79,480$
Temporarily Permanently
Unrestricted Restricted Restricted Total
Interest and dividends, net 20,618$ 4,348$ 2$ 24,968$
Net realized and unrealized
investment losses 9,921 5,076 - 14,997
Total investment income 30,539$ 9,424$ 2$ 39,965$
Year Ended December 31, 2017
Year Ended December 31, 2016
Interest and dividend income in the statements of activities and above is presented net of fees paid to our investment advisors. Those fees were $2,799 and $2,817 for the years ended December 31, 2017 and 2016, respectively.
Gift annuity investments Sufficient assets are maintained to meet the annuity requirements stipulated by the various state laws. We are required to hold reserves related to our gift annuity program based on the laws in certain states in which we solicit these gifts. Such reserves totaled $23,649 and $17,567 at December 31, 2017 and 2016, respectively, and are included in gift annuity investments in the accompanying balance sheets.
Planned gifts (bequests and beneficial interest in trusts) We are the beneficiary of planned gifts under bequests, other testamentary documents, trusts, and similar deferred contributions. The assets from a bequest or a contribution may be given directly to us, or may be put in the care of a trustee, with the Society being designated as having a full or partial beneficial interest in the trust (“BIT”). Certain gifts are considered split-interest agreements whereby we receive benefits that are shared, or split, with either the donor or third-party beneficiaries. Depending on the number and mortality of any third-party beneficiaries, we may not receive cash for our interest in the BIT’s for a number of years. During the years ended December 31, 2017 and 2016, approximately 61% and 44% of our revenue from bequests was cash and 39% and 56% will be received in future years, respectively.
The management of the assets within the various trusts, including the purchase and sale decisions, is performed by the respective trustee, and we have no ability to control or influence these decisions. Distributions from these trusts are based on the terms of the underlying trust agreement that generally require that the investment income be distributed on at least an annual basis.
AMERICAN CANCER SOCIETY, INC. NOTES TO FINANCIAL STATEMENTS
DECEMBER 31, 2017 and 2016 (Dollars in thousands)
20
2. Liquidity considerations, continued
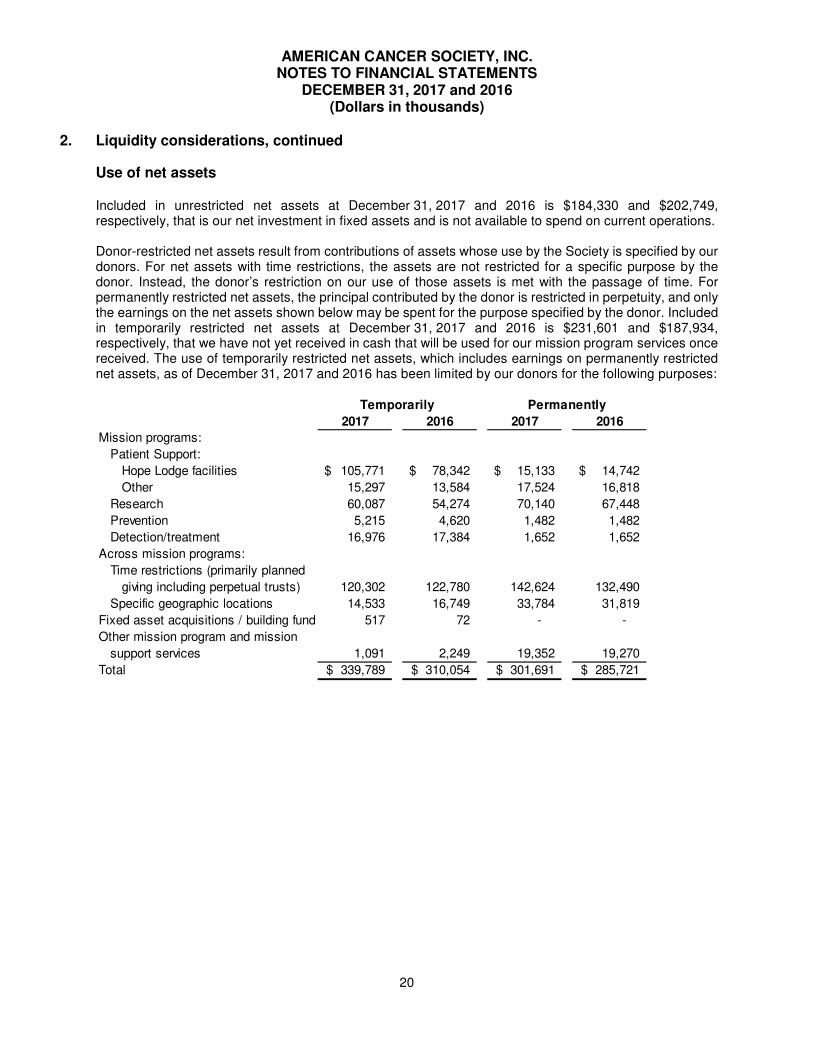
Use of net assets Included in unrestricted net assets at December 31, 2017 and 2016 is $184,330 and $202,749, respectively, that is our net investment in fixed assets and is not available to spend on current operations. Donor-restricted net assets result from contributions of assets whose use by the Society is specified by our donors. For net assets with time restrictions, the assets are not restricted for a specific purpose by the donor. Instead, the donor’s restriction on our use of those assets is met with the passage of time. For permanently restricted net assets, the principal contributed by the donor is restricted in perpetuity, and only the earnings on the net assets shown below may be spent for the purpose specified by the donor. Included in temporarily restricted net assets at December 31, 2017 and 2016 is $231,601 and $187,934, respectively, that we have not yet received in cash that will be used for our mission program services once received. The use of temporarily restricted net assets, which includes earnings on permanently restricted net assets, as of December 31, 2017 and 2016 has been limited by our donors for the following purposes:
2017 2016 2017 2016
Mission programs:
Patient Support:
Hope Lodge facilities 105,771$ 78,342$ 15,133$ 14,742$
Other 15,297 13,584 17,524 16,818
Research 60,087 54,274 70,140 67,448
Prevention 5,215 4,620 1,482 1,482
Detection/treatment 16,976 17,384 1,652 1,652
Across mission programs:
Time restrictions (primarily planned
giving including perpetual trusts) 120,302 122,780 142,624 132,490
Specific geographic locations 14,533 16,749 33,784 31,819
Fixed asset acquisitions / building fund 517 72 - -
Other mission program and mission
support services 1,091 2,249 19,352 19,270
Total 339,789$ 310,054$ 301,691$ 285,721$
Temporarily Permanently
AMERICAN CANCER SOCIETY, INC. NOTES TO FINANCIAL STATEMENTS
DECEMBER 31, 2017 and 2016 (Dollars in thousands)
21
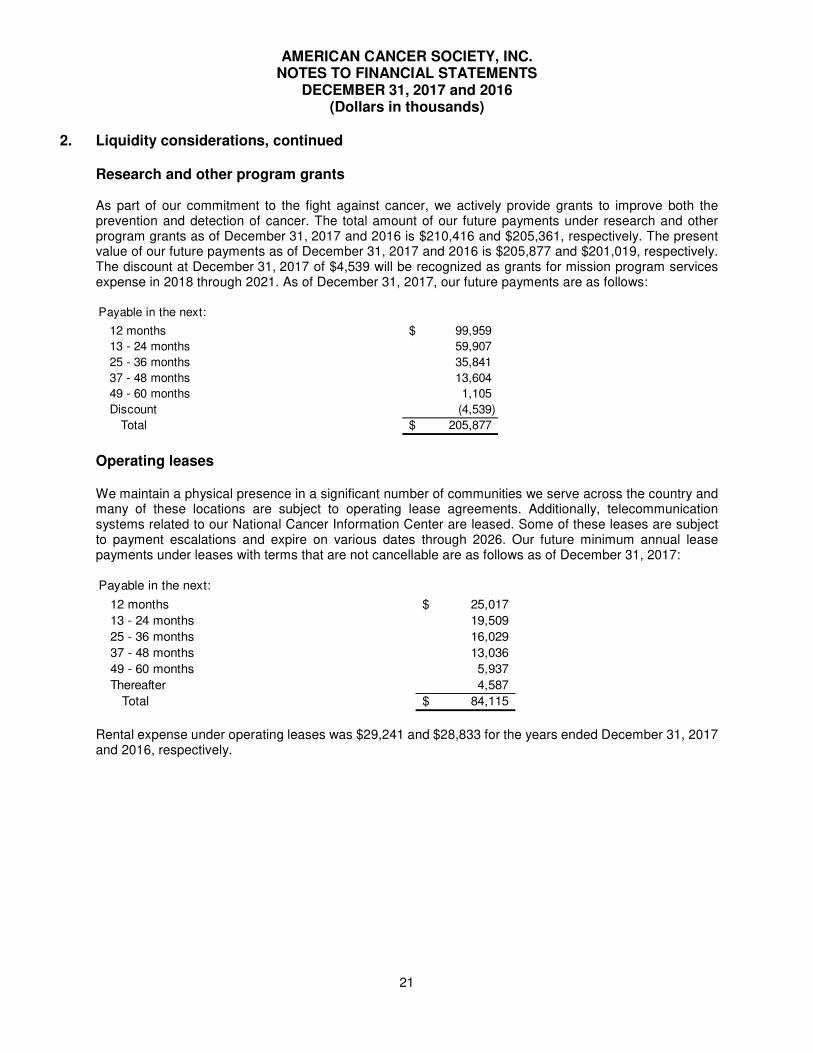
2. Liquidity considerations, continued Research and other program grants As part of our commitment to the fight against cancer, we actively provide grants to improve both the prevention and detection of cancer. The total amount of our future payments under research and other program grants as of December 31, 2017 and 2016 is $210,416 and $205,361, respectively. The present value of our future payments as of December 31, 2017 and 2016 is $205,877 and $201,019, respectively. The discount at December 31, 2017 of $4,539 will be recognized as grants for mission program services expense in 2018 through 2021. As of December 31, 2017, our future payments are as follows: Payable in the next:
12 months 99,959$
13 - 24 months 59,907
25 - 36 months 35,841
37 - 48 months 13,604
49 - 60 months 1,105
Discount (4,539)
Total 205,877$ Operating leases We maintain a physical presence in a significant number of communities we serve across the country and many of these locations are subject to operating lease agreements. Additionally, telecommunication systems related to our National Cancer Information Center are leased. Some of these leases are subject to payment escalations and expire on various dates through 2026. Our future minimum annual lease payments under leases with terms that are not cancellable are as follows as of December 31, 2017: Payable in the next:
12 months 25,017$
13 - 24 months 19,509
25 - 36 months 16,029
37 - 48 months 13,036
49 - 60 months 5,937
Thereafter 4,587
Total 84,115$ Rental expense under operating leases was $29,241 and $28,833 for the years ended December 31, 2017 and 2016, respectively.

AMERICAN CANCER SOCIETY, INC. NOTES TO FINANCIAL STATEMENTS
DECEMBER 31, 2017 and 2016 (Dollars in thousands)
22
2. Liquidity considerations, continued
Debt We have financed certain properties based on market conditions and cash flow needs at the time of financing. Our outstanding debt, subject to certain loan covenants, as of December 31, 2017 and 2016 is as follows:
Type IssuerMaturity
Date
Interest
rate
Balance at
12/31/2017
Balance at
12/31/2016Collateral
Industrial
Revenue
Bonds
Oklahoma
Industries
Authority 2022 0.78% $ 4,055 $ 4,730
Certificates of deposit,
property and letters of
credit, which expire at
various dates through
2020
Note
Payable TD Bank, N.A. 2020
Libor +
0.90% 34,473 36,115
New York City Hope
Lodge facility, net book
value of $29,354 and all
assets constituting
general revenues
Note
Payable
Alliance
Finance Fund 2044 1.00% 9,750 9,750
Salt Lake City Hope
Lodge Facility, net
book value of $13,855
Note
Payable
SCC SUB-
CDE 10, LLC 2047 1.00% 9,603 -
Jackson Hope Lodge
Facility, net book value
of $1,489
Notes
Payable Various Various
2.00% -
5.75% 383 400 Not Applicable
Total $ 58,264 $ 50,995
Our future principal payments are as follows:
Payable in the next:
12 months 2,395$
13 - 24 months 2,425
25 - 36 months 2,470
37 - 48 months 2,521
49 - 60 months 2,576
Thereafter 45,877
Total 58,264$
AMERICAN CANCER SOCIETY, INC. NOTES TO FINANCIAL STATEMENTS
DECEMBER 31, 2017 and 2016 (Dollars in thousands)
23
2. Liquidity considerations, continued Retirement funding We have a variety of retirement benefit strategies that cover nearly all of our employees. We sponsor a defined benefit pension plan (the “Plan”) through which we provide benefits that are based on years of service and certain averages of compensation. We fund the plan on a quarterly basis based on estimates of annual funding levels stated by pension requirements, which are enforced by regulatory agencies. In general, these requirements stipulate that our plan be funded at a level of 60% to continue to pay full benefits to retired individuals. As of January 1, 2018, and 2017, the plan was funded at 100%, based on regulatory funding levels. We anticipate the funding percentage to decrease as the relief provisions provided by the Moving Ahead for Progress in the 21st Century Act expire over the next few years.
We also sponsor a defined contribution plan with benefits based on individual employee salary deferrals and a related matching amount by the Society, subject to a maximum. Our matching amounts totaled $12,294 and $10,148 for the years ended December 31, 2017 and 2016, respectively. As part of the adjustments to our overall retirement benefits package, we made a one-time contribution to our defined contribution plans totaling $25,038 during 2016. We sponsor a Supplemental Executive Retirement Plan (the SERP) for certain participants whose income exceeds the maximum income that can be considered under the defined benefit pension plan. We have segregated short-term investments sufficient for payment of benefits under this plan.
In addition, we have an unfunded postretirement benefit plan for post-retirement medical, dental, and life insurance coverage for certain employees hired prior to 1995, subject to deductibles, co-payment provisions, and other limitations. We paid $2,095 and $2,729 for these benefits from our general assets during the years ended December 31, 2017 and 2016, respectively.
We expect to contribute approximately $17,493, of which $13,000 is being funded at management’s discretion, to all of our defined benefit plans over the next 12 months. Effective July 1, 2016, the Plan and the SERP were frozen to new participants and participants are no longer earning benefits for service under the Plan. See Note 10 for additional information.

AMERICAN CANCER SOCIETY, INC. NOTES TO FINANCIAL STATEMENTS
DECEMBER 31, 2017 and 2016 (Dollars in thousands)
24
3. Contributed services, merchandise, and other in-kind contributions We recorded contributed services related to the communication of mission program and fund-raising messages through various media. We also have valued and recorded contributed services provided by scientific peer reviewers for the extramural research grant process. In addition, we received cosmetic kits that were donated by the Personal Care Products Council for use in the Look Good Feel Better quality of life program and wigs that were donated by Celebrity Signatures International, Inc. We provided the merchandise to patients along with training in the proper application of cosmetics and wigs. Moreover, we received in-kind contributions of advertising production, magazine space, public service announcements, and in-store advertising materials from various retail and professional organizations. Total contributed services, merchandise, and other in-kind contributions for the years ended December 31, 2017 and 2016 are as follows:
2017 2016
Media communication and production services 21,313$ 13,162$
Discovery Shops 22,868 22,528
Cosmetic kits and wigs 13,790 12,955
Guestroom program 4,139 4,938
Peer review services (approximately 504 and 509 volunteers
donated 18,144 and 18,324 hours, respectively) 1,607 1,560
Other in-kind contributions 2,590 4,585
Total contributed services, merchandise, and
other in-kind contributions at fair value 66,307$ 59,728$

AMERICAN CANCER SOCIETY, INC. NOTES TO FINANCIAL STATEMENTS
DECEMBER 31, 2017 and 2016 (Dollars in thousands)
25
OTHER REQUIRED DISCLOSURES
4. Significant accounting policies
Accounting for contributions
Temporarily restricted contributions received in the same year in which the restrictions are met are recorded as an increase to temporarily restricted support at the time of receipt and as net assets released from restrictions.
Contributed merchandise and other in-kind contributions, including merchandise remaining in inventory at year end, are reported as contributions at their estimated fair values when received or when an unconditional promise to give has been made. We do not imply time restrictions on contributions of long-lived assets (or of other assets restricted to the purchase of long-lived assets) received without donor stipulations about how long the contributed assets must be used. As a result, contributions of cash and other assets restricted to the acquisition of long-lived assets are reported as temporarily restricted revenue that increase temporarily restricted net assets; those restrictions expire when we place those long-lived assets in service.
Advertising costs
Our advertising costs are expensed as incurred and were $58,743 and $51,997 for the years ended December 31, 2017 and 2016, respectively.
Bequests receivable
We consider a bequest unconditional when the probate court declares the testamentary instrument valid and the proceeds are measurable.
Beneficial interests in trusts
Nonperpetual BIT’s are initially recognized as temporarily restricted public support (bequest or contribution revenue, depending upon the initial source of the gift) at fair value, based on our interest in the fair value of the underlying trust assets at the time of the gift. Any subsequent adjustments to the nonperpetual BIT’s are recorded as a change in value of split-interest agreements.
Perpetual trusts are initially recorded as permanently restricted public support (bequest or contribution revenue, depending on the initial source of the gift) at fair value, based on our interest in the fair value of the underlying trust assets at the time of the gift. Subsequent changes to the trust’s fair value are reported as permanently restricted net unrealized gains or losses on perpetual trusts and are reported as change in value of split interest agreements in the statements of activities. Income received from the trusts is reported as temporarily restricted or unrestricted investment income, depending on the existence or absence of donor-imposed restrictions.
We also may be the beneficiary of interests in trusts and other assets in situations where we have not been notified of our interest. Our interest may be conditional or revocable, or the value of our interest may not be readily ascertainable. In such circumstances, no revenue has been recorded.
Cash and cash equivalents
We consider all highly liquid investments with an original maturity of three months or less, when purchased, to be cash equivalents - with the exception of cash held for reinvestment - which is included in investments and gift annuity investments, as appropriate.

AMERICAN CANCER SOCIETY, INC. NOTES TO FINANCIAL STATEMENTS
DECEMBER 31, 2017 and 2016 (Dollars in thousands)
26
4. Significant accounting policies, continued
Fair value of financial instruments
The three levels of the fair value hierarchy are described as follows:
Level 1 Inputs to the valuation methodology are unadjusted quoted prices for identical assets or liabilities in active markets that we can access.
Level 2 Inputs to the valuation methodology include:
• Quoted prices for similar assets or liabilities in active markets; • Quoted prices for identical or similar assets or liabilities in inactive markets; • Inputs other than quoted prices that are observable for the asset or liability; or • Inputs that are derived principally from or corroborated by observable market data
by correlation or other means. If the asset or liability has a specified (contractual) term, the Level 2 input must be observable for a substantial portion of the full term of the asset or liability.
Level 3 Inputs to the valuation methodology are unobservable and significant to the fair value
measurement.
Our financial instruments consist of cash and cash equivalents, investments, receivables, gift annuity investments, bequests receivable, beneficial interests in trusts, research and other program grants payable, accounts payable and accrued expenses, gift annuity obligations, and debt. Investments, beneficial interest in trusts, and gift annuity investments and the related obligations are recorded at their fair values.
Fixed assets
Fixed assets are recorded at cost for purchased items and fair value for contributed items. If donors contribute long-lived assets with stipulations as to how long the assets must be used or with any other restrictions, we report those contributions as temporarily restricted support.
Depreciation expense is recognized on a straight-line basis over the estimated useful lives of the assets,
as follows: Buildings 20 to 40 years
Leasehold improvements Lesser of term of the lease or
estimated life of the improvement
Furniture, fixtures, equipment, computer
software, and other capitalized assets 3 to 10 years
Equipment under capital leases Lesser of the term of the lease or
estimated life of the equipment
AMERICAN CANCER SOCIETY, INC. NOTES TO FINANCIAL STATEMENTS
DECEMBER 31, 2017 and 2016 (Dollars in thousands)
27
4. Significant accounting policies, continued
Estimates
The preparation of our financial statements in conformity with accounting principles generally accepted in the United States requires us to make estimates and assumptions that affect the reported amounts of assets and liabilities and disclosure of contingent assets and liabilities at the date of the financial statements, and the reported amounts of revenues and expenditures during the reporting period. Actual results may differ from those estimates.
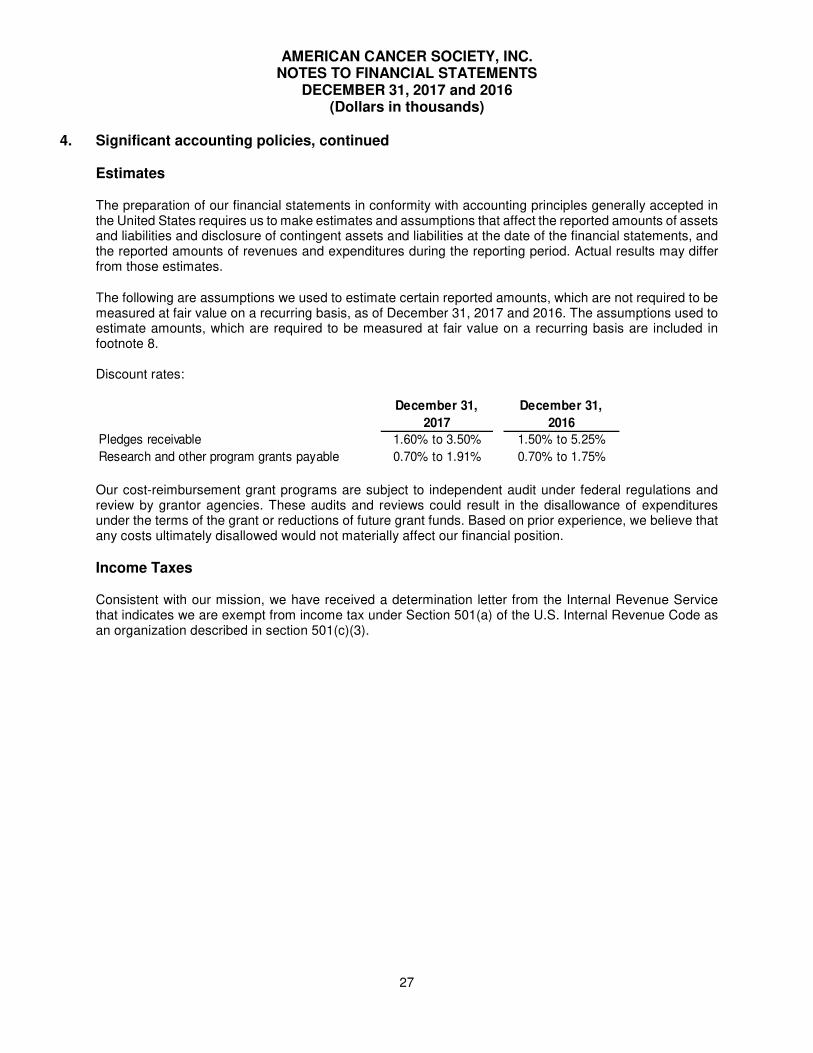
The following are assumptions we used to estimate certain reported amounts, which are not required to be measured at fair value on a recurring basis, as of December 31, 2017 and 2016. The assumptions used to estimate amounts, which are required to be measured at fair value on a recurring basis are included in footnote 8. Discount rates:
December 31,
2017
December 31,
2016
Pledges receivable 1.60% to 3.50% 1.50% to 5.25%
Research and other program grants payable 0.70% to 1.91% 0.70% to 1.75% Our cost-reimbursement grant programs are subject to independent audit under federal regulations and review by grantor agencies. These audits and reviews could result in the disallowance of expenditures under the terms of the grant or reductions of future grant funds. Based on prior experience, we believe that any costs ultimately disallowed would not materially affect our financial position.
Income Taxes
Consistent with our mission, we have received a determination letter from the Internal Revenue Service that indicates we are exempt from income tax under Section 501(a) of the U.S. Internal Revenue Code as an organization described in section 501(c)(3).

AMERICAN CANCER SOCIETY, INC. NOTES TO FINANCIAL STATEMENTS
DECEMBER 31, 2017 and 2016 (Dollars in thousands)
28
4. Significant accounting policies, continued
Adoption of new accounting pronouncements
In May 2014, the Financial Accounting Standards Board (the “FASB”) issued Accounting Standards Update (“ASU”) 2014-09, Revenue from Contracts with Customers (Topic 606), which, when effective, will supersede the guidance in former ASC 605, Revenue Recognition. The new guidance requires entities to recognize revenue based on the transfer of promised goods or services to customers in an amount that reflects the consideration to which the entity expects to be entitled in exchange for those goods or services. Application of the new standard may result in significant changes to current practice. In August 2015, the FASB issued ASU 2015-14 Revenue from Contracts with Customers (Topic 606): Deferral of Effective Date, which provides an optional one-year deferral of the effective date. Therefore, this standard is effective for the year ending December 31, 2018. In August 2016, the FASB issued ASU 2016-14—Not-for-Profit Entities (Topic 958): Presentation of Financial Statements of Not-for-Profit Entities, which makes several improvements to current financial reporting for not-for-profits. The guidance is effective for the year ending December 31, 2018. The most significant provisions of this standard require two classes of net assets, rather than the currently required three classes as well as disclosures about how liquidity is managed. In February 2016, the FASB issued ASU 2016-02, Leases (Topic 842), which when effective will require organizations to recognize assets and liabilities on the balance sheet for the rights and obligations created by the leases. A lessee will be required to recognize assets and liabilities for leases with terms that exceed twelve months. The standard will also require disclosures to help financial statement users better understand the amount, timing and uncertainty of cash flows arising from leases. The disclosures include qualitative and quantitative requirements, providing additional information about the amounts recorded in the financial statements. The guidance is effective for the year ending December 31, 2019 and early adoption is permitted. The impact of these standards on our financial statements is still being evaluated.
5. Activities with joint costs For the years ended December 31, 2017 and 2016, we incurred expenses to conduct activities that had both fundraising appeals, as well as mission program and management and general components (joint activities). Those joint activities included direct mail, telecommunications, and other constituent relationship activities. Our costs of conducting those joint activities were allocated as follows:
2017 2016
Patient support 87,986$ 95,548$
Prevention 32,401 35,630
Detection/treatment 12,144 10,629
Management and general 6,511 8,833
Fundraising 40,443 60,925
Total 179,485$ 211,565$

AMERICAN CANCER SOCIETY, INC. NOTES TO FINANCIAL STATEMENTS
DECEMBER 31, 2017 and 2016 (Dollars in thousands)
29
6. Exchange transactions Exchange transactions are reciprocal transfers in which each party receives and sacrifices something of equal value, as opposed to a nonreciprocal transaction (i.e., a contribution), in which a donor provides resources to support our mission and expects to receive nothing of direct value in exchange. Costs of exchange transactions that benefit the recipient of the exchange and are not directly related to our mission are reported as exchange expenses. Costs related to exchange transactions that directly benefit or support our mission are reported in mission program or mission support expenses.
Exchange transaction income and expenses are netted and included in other gains (losses) in the accompanying statements of activities and are as follows for the years ended December 31, 2017 and 2016:
2017 2016 2017 2016
Special events 45,260$ 49,559$ 45,260$ 49,559$
Discovery Shop 23,733 23,596 36,343 35,818
Sales to third parties 4,955 7,244 7 13
Other 5,254 6,780 36 204
79,202$ 87,179$ 81,646$ 85,594$
Exchange
Income
Exchange
Expenses
As shown in the table above, we conduct special events in which a portion of the gross proceeds paid by the participant represents payment for the direct cost of the benefits received by the participant at the event. Unless a verifiable, objective means exists to demonstrate otherwise, the fair value of meals and entertainment provided at special events is measured at our actual cost. The direct costs of the special events that ultimately benefit the donor, rather than us, are recorded as exchange transaction income and exchange transaction expense. All proceeds received by us in excess of the direct costs are recorded as special events revenue in our statements of activities.
7. Fixed assets
Our fixed assets are as follows as of December 31, 2017 and 2016:
2017 2016
Land 30,701$ 34,057$
Buildings and leasehold improvements 371,461 387,049
Furniture, fixtures, equipment,
and other capitalized assets 46,233 56,452
Computer software 58,664 58,664
Construction in progress 13,448 1,387
Less: accumulated depreciation and amortization (277,913) (283,865)
Net fixed assets 242,594$ 253,744$ Depreciation expense including expenses on assets used in exchange transactions for the years ended December 31, 2017 and 2016 was $16,023 and $18,765, respectively.
AMERICAN CANCER SOCIETY, INC. NOTES TO FINANCIAL STATEMENTS
DECEMBER 31, 2017 and 2016 (Dollars in thousands)
30
8. Fair value
Fair value measurement
Refer to Note 4 for a description of our fair value of financial instrument policy.
The asset’s or liability’s fair value measurement level within the fair value hierarchy is based on the lowest level of any input that is significant to the fair value measurement. Our valuation techniques maximize the use of observable inputs and minimize the use of unobservable inputs.
The availability of observable market data is monitored to assess the appropriate classification of financial instruments within the fair value hierarchy. Changes in economic conditions or model-based valuation techniques may require the transfer of financial instruments from one fair value level to another. In such instances, the transfer is reported at the beginning of the reporting period.
The significance of transfers between levels was evaluated based upon the nature of the financial instrument and size of the transfer relative to total net assets. For the years ended December 31, 2017 and 2016, there were no significant transfers in or out of Levels 1, 2, or 3. Following is a description of the valuation methods we used for assets and liabilities measured at fair value. There have been no changes in the valuation methods. Money market funds are principally valued at the regular trading session closing price on the exchange or market in which such funds are principally traded, on the last business day of each period presented, using the market approach.
United States government and government agency obligations are valued on the basis of evaluated prices provided by independent pricing services when such processes are believed to reflect the fair market value of such securities using the income approach.
Corporate bonds, commercial paper, and other short-term investments are valued on the basis of evaluated prices provided by independent pricing services, when such processes are believed to reflect the fair value of such securities, using the income approach.
Equities, including securities listed on national and international exchanges, are principally valued at the regular trading session closing price on the exchange or market in which such securities are principally traded, on the last business day of each period presented, using the market approach.
Investments in common collective trusts are generally valued using the market approach, on the basis of the relative interest of each participating investor (including each participant), in the fair value of the underlying net assets of each of the respective common collective trusts.
Investments in limited partnerships (see Note 10) are valued using the market approach, on the basis of the relative interests of each participating investor (including each participant), in the fair value of the underlying net assets of each limited partnership.
AMERICAN CANCER SOCIETY, INC. NOTES TO FINANCIAL STATEMENTS
DECEMBER 31, 2017 and 2016 (Dollars in thousands)
31
8. Fair value, continued
Fair value measurement, continued
Nonperpetual trusts, included on the balance sheets as beneficial interest in trusts, are recorded at their estimated fair value based on the present value of our estimated future cash receipts from the trust. Future cash receipts are based on an income approach (present value techniques) using internally developed models. Assumptions are made regarding the expected rate of return on the investments in the trust, the discount rate, and the expected mortality of the individual(s) if the termination of the agreement is dependent on life expectancy. An expected rate of return on the investments in the trusts is estimated using historical investment returns for various relevant market indices for the estimated asset allocation of the nonperpetual trusts. For the years ended December 31, 2017 and 2016, based on then-current financial market conditions, we estimated the present value of nonperpetual trusts using an investment return rate (net of trustee fees and other expenses) of 4.85% and 5.00% respectively, and a discount rate of 4.85% and 5.00%, respectively, commensurate with the risks involved. The expected mortality is estimated using the 1983 Basic Mortality Table. Each of these calculations is based on the fair value of the underlying assets of the trust. As trust statements are not received as of year-end for each trust, the fair value of the underlying assets is adjusted based on changes in the relevant market indices from the date of the trustee statement to year-end that correlate to the estimated asset allocation of the underlying assets. As the fair value of these trusts is derived from internal estimates of the present value of our interest in the underlying assets, incorporating market data when available, the amounts ultimately received could differ from the amounts reflected in the historical financial statements.
Perpetual trusts, included on the balance sheets as beneficial interests in trusts, are recorded at fair value based on our interest in the fair value of the underlying trust assets. As trust statements are not received as of year-end for each trust, the most recent fair value of the underlying assets is adjusted based on changes in the relevant market indices from the date of the trustee statement to year-end that correlate to the estimated asset allocation of the underlying assets.
Our gift annuity obligation is recorded at fair value based on Level 3 inputs and other relevant market data based on the present value of our estimated future cash outflows. For the years ended December 31, 2017 and 2016, the assumptions used in the valuation of the annuity liability include mortality in accordance with the 2012 Individual Annuity Reserving Table and a discount rate of 3.80% and 3.00% for all annuities, compounded annually, net of expenses. These rates are commensurate with the risks associated with the ultimate payment of the obligation. We have elected fair value accounting for our gift annuity obligations.
The preceding valuation methods described may produce a fair value calculation that may not be indicative of net realizable value or reflective of future fair values. Furthermore, while we believe our valuation methods are appropriate and consistent with other market participants, the use of different methodologies or assumptions to determine the fair value of certain financial instruments could result in a different fair value measurement at the reporting date.

AMERICAN CANCER SOCIETY, INC. NOTES TO FINANCIAL STATEMENTS
DECEMBER 31, 2017 and 2016 (Dollars in thousands)
32
8. Fair value, continued
The following tables set forth by level, within the fair value hierarchy, our assets and liabilities measured at fair value on a recurring basis as of December 31, 2017 and 2016. Assets and liabilities are classified in their entirety based on the lowest level of input that is significant to the fair value measurement.
Financial assets and liabilities measured at fair
value as of December 31, 2017
Assets Level 1 Level 2 Level 3 Total
Investments, current
Money market funds and time deposits 84$ -$ -$ 84$
Gift annuity investments, at fair value
Money market funds and time deposits -$ 836$ -$ 836$
Corporate bonds 115 4,123 - 4,238
U.S. government and government
agency obligations 4,632 3,565 - 8,197
Commercial paper and other short-term investments
Mortgage backed 28 99 - 127
Equities
Preferred stocks 25 73 - 98
Domestic 19,316 - - 19,316
International 4,695 - - 4,695
Mutual funds 2,627 - - 2,627
Other - - 79 79
Total gift annuity investments, at fair value 31,438$ 8,696$ 79$ 40,213$
Investments
Money market funds and time deposits 2,527$ 642$ -$ 3,169$
Corporate bonds 14 157,622 - 157,636
U.S. government and government
agency obligations 62 211,017 - 211,079
Commercial paper and other short-term investments
Mortgage backed - 76,862 - 76,862
Asset backed - 74,712 441 75,153
Short-term investments 36,725 6,394 - 43,119
Equities
Preferred stocks 753 - - 753
Domestic 51,173 - 2,236 53,409
International 63,575 71 - 63,646
Common collective trusts measured
at net asset value * 38,441
Limited partnership measured at
net asset value* 36,207
Other 34,021 709 1,160 35,890
Total investments 188,850$ 528,029$ 3,837$ 795,364$
Beneficial interests in trusts -$ -$ 353,442$ 353,442$
Liabilities
Gift annuity obligations -$ -$ 16,564$ 16,564$

AMERICAN CANCER SOCIETY, INC. NOTES TO FINANCIAL STATEMENTS
DECEMBER 31, 2017 and 2016 (Dollars in thousands)
33
8. Fair value, continued
Financial assets and liabilities measured at fair
value as of December 31, 2016
Assets Level 1 Level 2 Level 3 Total
Investments, current
Money market funds and time deposits 84$ -$ -$ 84$
Gift annuity investments, at fair value
Money market funds and time deposits -$ 662$ -$ 662$
Corporate bonds 112 4,680 - 4,792
U.S. government and government
agency obligations 3,501 3,438 - 6,939
Commercial paper and other short-term investments
Mortgage backed 29 199 - 228
Equities
Preferred stocks 20 101 - 121
Domestic 18,757 - - 18,757
International 3,270 - - 3,270
Mutual funds 1,800 - - 1,800
Other - - 599 599
Total gift annuity investments, at fair value 27,489$ 9,080$ 599$ 37,168$
Investments
Money market funds and time deposits 990$ 454$ -$ 1,444$
Corporate bonds 60 149,301 - 149,361
U.S. government and government
agency obligations - 163,971 - 163,971
Commercial paper and other short-term investments
Mortgage backed - 82,325 - 82,325
Asset backed - 71,357 914 72,271
Short-term investments 13,888 11,311 - 25,199
Equities
Preferred stocks 653 - - 653
Domestic 71,135 - 2,073 73,208
International 80,220 9 - 80,229
Common collective trusts measured
at net asset value * 116,387
Other 28,547 667 998 30,212
Total investments 195,493$ 479,395$ 3,985$ 795,260$
Beneficial interests in trusts -$ -$ 321,145$ 321,145$
Liabilities
Gift annuity obligations -$ -$ 19,601$ 19,601$
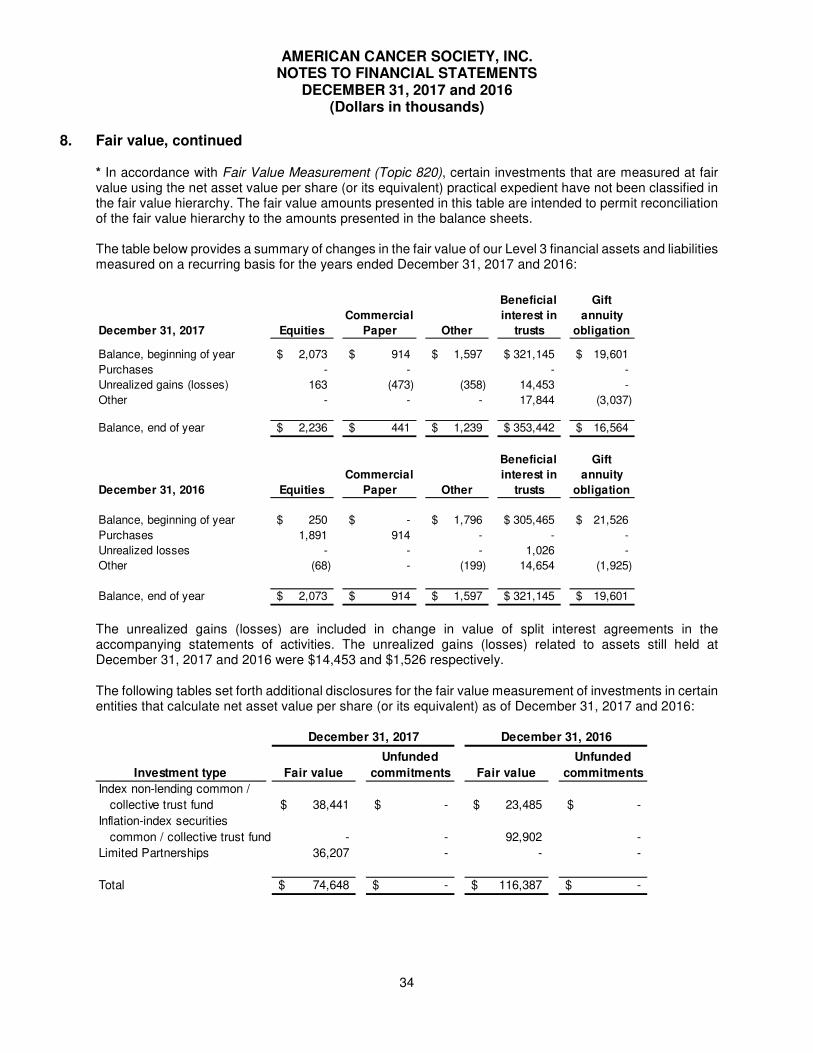
AMERICAN CANCER SOCIETY, INC. NOTES TO FINANCIAL STATEMENTS
DECEMBER 31, 2017 and 2016 (Dollars in thousands)
34
8. Fair value, continued
* In accordance with Fair Value Measurement (Topic 820), certain investments that are measured at fair value using the net asset value per share (or its equivalent) practical expedient have not been classified in the fair value hierarchy. The fair value amounts presented in this table are intended to permit reconciliation of the fair value hierarchy to the amounts presented in the balance sheets. The table below provides a summary of changes in the fair value of our Level 3 financial assets and liabilities measured on a recurring basis for the years ended December 31, 2017 and 2016:
December 31, 2017 Equities
Commercial
Paper Other
Beneficial
interest in
trusts
Gift
annuity
obligation
Balance, beginning of year 2,073$ 914$ 1,597$ 321,145$ 19,601$
Purchases - - - -
Unrealized gains (losses) 163 (473) (358) 14,453 -
Other - - - 17,844 (3,037)
Balance, end of year 2,236$ 441$ 1,239$ 353,442$ 16,564$
December 31, 2016 Equities
Commercial
Paper Other
Beneficial
interest in
trusts
Gift
annuity
obligation
Balance, beginning of year 250$ -$ 1,796$ 305,465$ 21,526$
Purchases 1,891 914 - - -
Unrealized losses - - - 1,026 -
Other (68) - (199) 14,654 (1,925)
Balance, end of year 2,073$ 914$ 1,597$ 321,145$ 19,601$ The unrealized gains (losses) are included in change in value of split interest agreements in the accompanying statements of activities. The unrealized gains (losses) related to assets still held at December 31, 2017 and 2016 were $14,453 and $1,526 respectively.
The following tables set forth additional disclosures for the fair value measurement of investments in certain entities that calculate net asset value per share (or its equivalent) as of December 31, 2017 and 2016:
Investment type Fair value
Unfunded
commitments Fair value
Unfunded
commitments
Index non-lending common /
collective trust fund 38,441$ -$ 23,485$ -$
Inflation-index securities
common / collective trust fund - - 92,902 -
Limited Partnerships 36,207 - - -
Total 74,648$ -$ 116,387$ -$
December 31, 2017 December 31, 2016
AMERICAN CANCER SOCIETY, INC. NOTES TO FINANCIAL STATEMENTS
DECEMBER 31, 2017 and 2016 (Dollars in thousands)
35
8. Fair value, continued
The index non-lending fund was mainly composed of common stocks in various business sectors. The fair values of the investments within the fund are based on the current market prices or quotations readily available on the day of valuation. Requests for common stock redemption may be made on each business day based upon the net asset value per unit and the closing market value on the valuation date of the investments bought or sold. The fund’s investment objective is to approximate as closely as practicable, before expenses, the performance of the Standard & Poor’s 500® Tobacco Free Index over the long term.
The inflation-indexed fund was mainly composed of foreign fixed income securities in various government agencies. The fair values of the investments are based on quotations from the primary market in which they are traded and translated at each valuation date from the local currency into U.S. dollars using the prevailing exchange rates. Securities traded on generally recognized securities exchanges are valued at their closing price. If there are no sales, valuation is at the midpoint between the last recorded bid and ask prices. Securities traded only in over-the-counter markets for which reliable quotations are available are valued at the midpoint between the latest current bid and ask prices. Requests for redemption may only be made on the first business day of each month and must be made at least 10 business days before month-end. The fund investment objective is to achieve favorable income-oriented returns from a globally diversified portfolio of primarily debt or debt-like securities.
The limited partnership (also refer to Note 10) was mainly comprised of private real estate holdings. The private real estate holdings are recorded at net asset value, which approximates fair value as determined by independently conducted appraisals of the properties. The appraisals of the private real estate holdings have been prepared giving consideration to the income, cost and sales comparison approaches of estimating property value. Requests for redemption may be made by delivering a redemption notice at least 45 days in advance. The partnerships investment objective is to give investors a robust core real estate portfolio that provides a diversified portfolio of the highest quality assets, both durable and growing income with highly liquid assets and a conservative risk profile. There are no unfunded commitments.
9. Endowment
Interpretation of relevant law As a New York corporation, we are subject to and have interpreted the New York Prudent Management of Institutional Funds Act (NYPMIFA) as requiring the preservation of the fair value of the original gift as of the gift date of the donor-restricted endowment funds absent explicit donor stipulations to the contrary. As a result of this interpretation, we classify as permanently restricted net assets: (a) the original value of gifts to the permanent endowment, (b) the original value of subsequent gifts to the permanent endowment, and (c) accumulations to the permanent endowment made in accordance with the direction of the applicable donor gift instrument at the time the accumulation is added to the fund. The remaining portion of the donor-restricted endowment fund that is not classified in permanently restricted net assets is classified as temporarily restricted net assets until the donor-stipulated purpose has been fulfilled and/or the required time period has elapsed, and we have appropriated those amounts for expenditure in a manner consistent with the standard of prudence prescribed by NYPMIFA. Endowment assets are included in investments on the balance sheets. Permanently restricted net assets of $301,691 and $285,721 at December 31, 2017 and 2016 on the balance sheets reflect assets to be held in perpetuity such as endowments, which are included in the table below, as well as perpetual trusts.

AMERICAN CANCER SOCIETY, INC. NOTES TO FINANCIAL STATEMENTS
DECEMBER 31, 2017 and 2016 (Dollars in thousands)
36
9. Endowment, continued
Endowment net asset composition by type Temporarily Permanently
and changes in endowments Unrestricted Restricted Restricted Total
Endowment net assets at December 31, 2016 (10)$ 23,822$ 89,737$ 113,549$
Investment income - 1,876 - 1,876
Net appreciation (realized and unrealized) - 16,803 - 16,803
Contributions - - 632 632
Reclassification of restrictions 10 (713) 703 -
Appropriation of endowment
assets for expenditure - (31,707) - (31,707)
Donor restricted endowment net
assets at December 31, 2017 -$ 10,081$ 91,072$ 101,153$
Endowment net asset composition by type Temporarily Permanently
and changes in endowments Unrestricted Restricted Restricted Total
Endowment net assets at December 31, 2015 (36)$ 22,288$ 88,992$ 111,244$
Investment income - 1,869 - 1,869
Net appreciation (realized and unrealized) - 4,823 - 4,823
Contributions - - 648 648
Reclassification of restrictions 26 (123) 97 -
Appropriation of endowment
assets for expenditure - (5,035) - (5,035)
Donor restricted endowment net
assets at December 31, 2016 (10)$ 23,822$ 89,737$ 113,549$
Funds with deficiencies From time to time, due to adverse market conditions, the fair value of assets associated with individual donor-restricted endowment funds may fall below the level that the donor or relevant law requires us to retain as a fund of perpetual duration. Deficiencies of this nature are reported in temporarily restricted net assets, to the extent there are accumulated gains available to absorb such loss, or otherwise in unrestricted net assets. Deficiencies of this nature that are reported in unrestricted net assets were $0 and $10 as of December 31, 2017 and 2016, respectively. These deficiencies resulted from unfavorable market fluctuations that occurred after the investment of new contributions and continued appropriation for certain programs that we deemed prudent. Subsequent gains that restore the fair value of the assets of the endowment fund up to the required level will be classified as an increase in unrestricted net assets.
Return objectives and risk parameters We have adopted investment and spending policies for endowment assets that attempt to provide a predictable stream of funding to programs supported by its endowment, while seeking to maintain the purchasing power of the endowment assets. Under this policy, the endowment assets are invested in a manner that is intended to produce results that exceed the price and yield results of relevant market indices while assuming a moderate level of investment risk.

AMERICAN CANCER SOCIETY, INC. NOTES TO FINANCIAL STATEMENTS
DECEMBER 31, 2017 and 2016 (Dollars in thousands)
37
9. Endowment, continued
Spending policy We considered the following factors in developing our spending policy with regard to donor-restricted endowment funds: (1) the duration and preservation of the various funds, (2) our mission and donor-restricted endowment funds, (3) general economic conditions, (4) the possible effect of inflation and deflation, (5) the expected total return from income and appreciation of investments, (6) our other resources, (7) our investment policies, and (8) where appropriate, alternatives to spending from the donor-restricted funds and the possible effects of those alternatives. Unless the donor has specified otherwise, 4% of the three year rolling average fair value of an endowment is available for spending each year, to the extent of a permanently restricted endowment’s cumulative undistributed earnings. In addition, the difference between the actual total return each year and the spending percentage is charged or credited to unrestricted or temporarily restricted net assets (depending on the donor's instructions regarding the use of investment income or relevant law). We believe a spending policy is necessary to carry out the statutorily prescribed standard of ordinary business care and prudence and uses a spending rate of 4% in order to maintain the purchasing power of the endowment. Endowment assets consist of:
Target Range
Equity securities 53 % 60 % 35-61%
Debt securities 42 40 37-71%
Cash and cash equivalents 5 0 0-5%
100 % 100 %
Percent of Fair Value
20162017
10. Employee retirement benefit plans
We maintain a noncontributory defined benefit pension plan that previously covered nearly all of our employees. The current strategic mix for the Plan’s assets is a blended exposure to equity and debt market risk. The Plan employs an active management strategy that has historically generated returns in excess of established benchmarks and places greater emphasis on manager skills to produce excess return while employing various risk mitigation strategies to reduce volatility. The Plan’s assets at December 31, consist of:
Target Range
Equity securities 62 % 65 % 41-97%
Debt securities 36 34 15-68%
Cash and cash equivalents 2 1 1-5%
100 % 100 %
Percent of Fair Value
2017 2016

AMERICAN CANCER SOCIETY, INC. NOTES TO FINANCIAL STATEMENTS
DECEMBER 31, 2017 and 2016 (Dollars in thousands)
38
10. Employee retirement benefit plans, continued
We employ a “building block approach” in determining the long-term rate of return for plan assets. Historical markets are studied and long-term historical relationships between equities and debt are preserved, consistent with the widely accepted capital market principle that assets with higher volatility generate a greater return over the long run. Current market factors such as inflation and interest rates are evaluated before long-term capital market assumptions are determined. The long-term portfolio return is established with proper consideration of diversification and rebalancing. Peer data and historical returns are reviewed to check for reasonability and appropriateness. While the approach gives appropriate consideration to recent fund performance and historical returns, the assumption is primarily a long-term, prospective rate. We also maintain a nonqualified and unfunded Supplemental Executive Retirement Plan for certain participants whose income exceeds the maximum income that can be considered under the Plan. Effective July 1, 2016, the Plan and SERP were frozen to new participants and participants are no longer earning benefits for service performed under the Plan and SERP. We enhanced potential benefits available to our employees through our defined contribution plan, including a one-time contribution totaling $25,038 made in 2016. We accrue the cost of providing postretirement benefits for medical, dental, and life insurance coverage over the active service period of employees and are amortizing the unrecognized transition obligation over 20 years. Medical trend rates do not apply as the plans are on fixed payment amounts. Beginning in 2017, we moved from utilizing a weighted average discount rate, which was derived from the yield curve used to measure the obligation at the beginning of the period, to a spot rate yield curve to estimate the pension benefit obligation and net periodic benefit costs. The change in accounting provides a more accurate measurement of interest costs by applying the spot rate that could be used to settle each projected cash flow individually. The change in accounting did not to have a material impact on net periodic benefit costs for the year ended December 31, 2017. Information related to our Plan, SERP, and postretirement benefit plan at December 31, 2017 and 2016 and the related changes during the years then ended are as follows:

AMERICAN CANCER SOCIETY, INC. NOTES TO FINANCIAL STATEMENTS
DECEMBER 31, 2017 and 2016 (Dollars in thousands)
39
10. Employee retirement benefit plans, continued
Supplemental Total Postretirement
Retirement Retirement Retirement Nonpension
December 31, 2017 Benefits Benefits Benefits Benefits
Change in benefit obligation
Benefit obligation at beginning of year 732,605$ 6,419$ 739,024$ 40,926$
Service cost - - - 180
Interest cost 25,783 85 25,868 1,373
Actuarial loss 76,970 1,067 78,037 1,846
Plan participant contributions - - - 765
Benefits paid (110,817) (4,799) (115,616) (3,038)
Retiree drug subsidy reimbursement - - - 178
Benefit obligation at end of year 724,541$ 2,772$ 727,313$ 42,230$
Change in plan assets
Fair value of plan assets at beginning of year 558,729$ -$ 558,729$ -$
Actual expenses paid (5,283) - (5,283) -
Actual return on plan assets 106,148 - 106,148 -
Employer contributions 13,000 4,799 17,799 2,095
Retiree drug subsidy reimbursement - - - 178
Plan participant contributions - - - 765
Benefits paid (110,817) (4,799) (115,616) (3,038)
Fair value of plan assets at end of year 561,777$ -$ 561,777$ -$
Funded status and amounts recognized
in our balance sheet in employee
retirement benefits (162,764)$ (2,772)$ (165,536)$ (42,230)$
Weighted average actuarial assumptions
Discount rate:
Net periodic pension service cost N/A N/A N/A 4.21%
Net periodic pension interest cost 3.62% N/A 3.62% 4.63%
Benefit obligation 4.38% Varies 4.38% 3.48%
Expected return on plan assets 7.25% N/A 7.25% N/A
Rate of compensation increase N/A N/A N/A 4.13%
Amounts not yet recognized in net
periodic pension costs
Unrecognized prior service costs (credit) at
beginning of year -$ 222$ 222$ (14,374)$
Change in prior service (credit) cost - (7) (7) 3,809
Unrecognized prior service costs (credit) at
end of year -$ 215$ 215$ (10,565)$
Unrecognized actuarial losses (gains) at
beginning of year 190,127$ (248)$ 189,879$ 9,046$
Change in actuarial losses (gains) (15,055) 474 (14,581) 1,119
Unrecognized actuarial losses (gains) at
end of year 175,072$ 226$ 175,298$ 10,165$
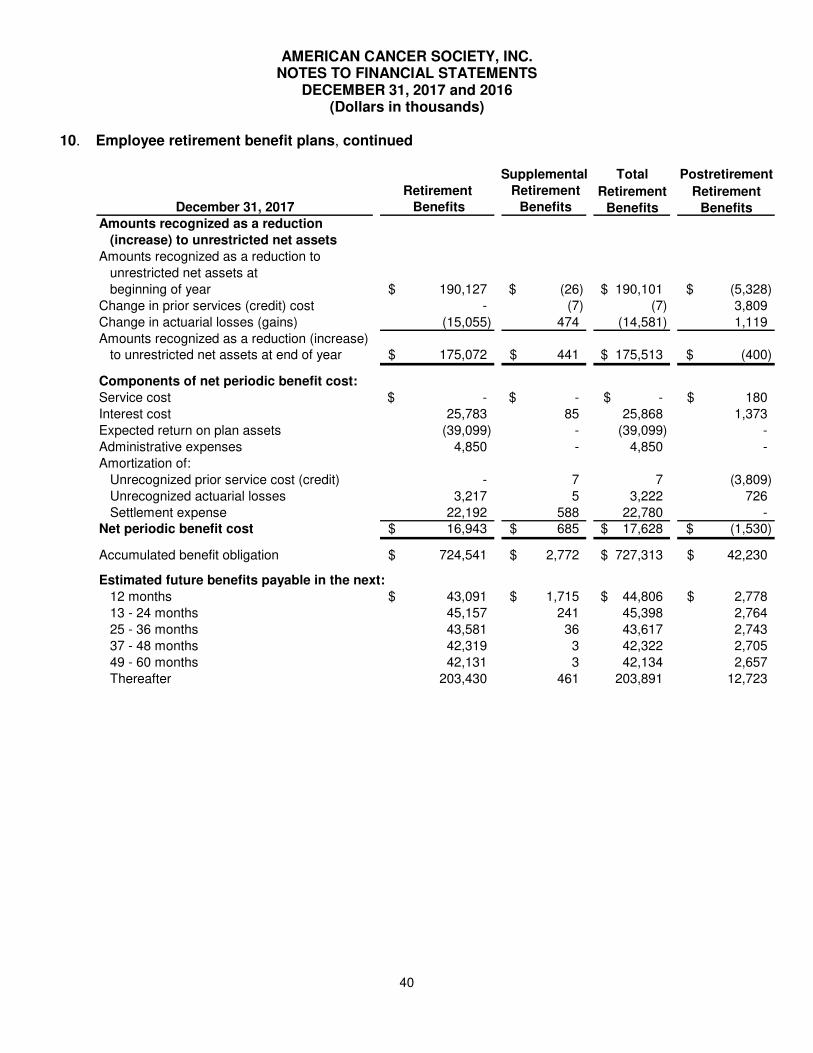
AMERICAN CANCER SOCIETY, INC. NOTES TO FINANCIAL STATEMENTS
DECEMBER 31, 2017 and 2016 (Dollars in thousands)
40
10. Employee retirement benefit plans, continued
Supplemental Total Postretirement
Retirement Retirement Retirement RetirementDecember 31, 2017 Benefits Benefits Benefits Benefits
Amounts recognized as a reduction
(increase) to unrestricted net assets
Amounts recognized as a reduction to
unrestricted net assets at
beginning of year 190,127$ (26)$ 190,101$ (5,328)$
Change in prior services (credit) cost - (7) (7) 3,809
Change in actuarial losses (gains) (15,055) 474 (14,581) 1,119
Amounts recognized as a reduction (increase)to unrestricted net assets at end of year 175,072$ 441$ 175,513$ (400)$
Components of net periodic benefit cost:
Service cost -$ -$ -$ 180$
Interest cost 25,783 85 25,868 1,373
Expected return on plan assets (39,099) - (39,099) -
Administrative expenses 4,850 - 4,850 -
Amortization of:
Unrecognized prior service cost (credit) - 7 7 (3,809)
Unrecognized actuarial losses 3,217 5 3,222 726
Settlement expense 22,192 588 22,780 - Net periodic benefit cost 16,943$ 685$ 17,628$ (1,530)$
Accumulated benefit obligation 724,541$ 2,772$ 727,313$ 42,230$
Estimated future benefits payable in the next:
12 months 43,091$ 1,715$ 44,806$ 2,778$
13 - 24 months 45,157 241 45,398 2,764
25 - 36 months 43,581 36 43,617 2,743
37 - 48 months 42,319 3 42,322 2,705
49 - 60 months 42,131 3 42,134 2,657
Thereafter 203,430 461 203,891 12,723

AMERICAN CANCER SOCIETY, INC. NOTES TO FINANCIAL STATEMENTS
DECEMBER 31, 2017 and 2016 (Dollars in thousands)
41
10. Employee retirement benefit plans, continued
Supplemental Total Postretirement
Retirement Retirement Retirement Nonpension
December 31, 2016 Benefits Benefits Benefits Benefits
Change in benefit obligation
Benefit obligation at beginning of year 706,007$ 7,051$ 713,058$ 40,955$
Service cost 10,704 128 10,832 208
Interest cost 30,900 291 31,191 1,768
Actuarial (gain) loss 21,034 875 21,909 544
Benefits paid (36,040) (1,926) (37,966) (2,729)
Retiree drug subsidy reimbursement - - - 180
Benefit obligation at end of year 732,605$ 6,419$ 739,024$ 40,926$
Change in plan assets
Fair value of plan assets at beginning of year 514,679$ -$ 514,679$ -$
Actual expenses paid (4,339) - (4,339) -
Actual return on plan assets 43,029 - 43,029 -
Employer contributions 41,400 1,926 43,326 2,729
Benefits paid (36,040) (1,926) (37,966) (2,729)
Fair value of plan assets at end of year 558,729$ -$ 558,729$ -$
Funded status and amounts recognized
in our balance sheet in employee
retirement benefits (173,876)$ (6,419)$ (180,295)$ (40,926)$
Weighted average actuarial assumptions
Discount rate:
Net periodic pension cost 4.38% Varies 4.38% 4.21%
Benefit obligation 4.38% Varies 4.38% 4.21%
Expected return on plan assets 7.25% N/A 7.25% N/A
Rate of compensation increase N/A N/A N/A 4.13%
Amounts not yet recognized in net
periodic pension costs
Unrecognized prior service costs (credit) at
beginning of year 4$ 450$ 454$ (18,183)$
Change in prior service (credit) cost (4) (228) (232) 3,809
Unrecognized prior service costs (credit) at
end of year -$ 222$ 222$ (14,374)$
Unrecognized actuarial losses (gains) at
beginning of year 188,328$ (1,260)$ 187,068$ 9,228$
Change in actuarial losses (gains) 1,799 1,012 2,811 (182)
Unrecognized actuarial losses (gains) at
end of year 190,127$ (248)$ 189,879$ 9,046$
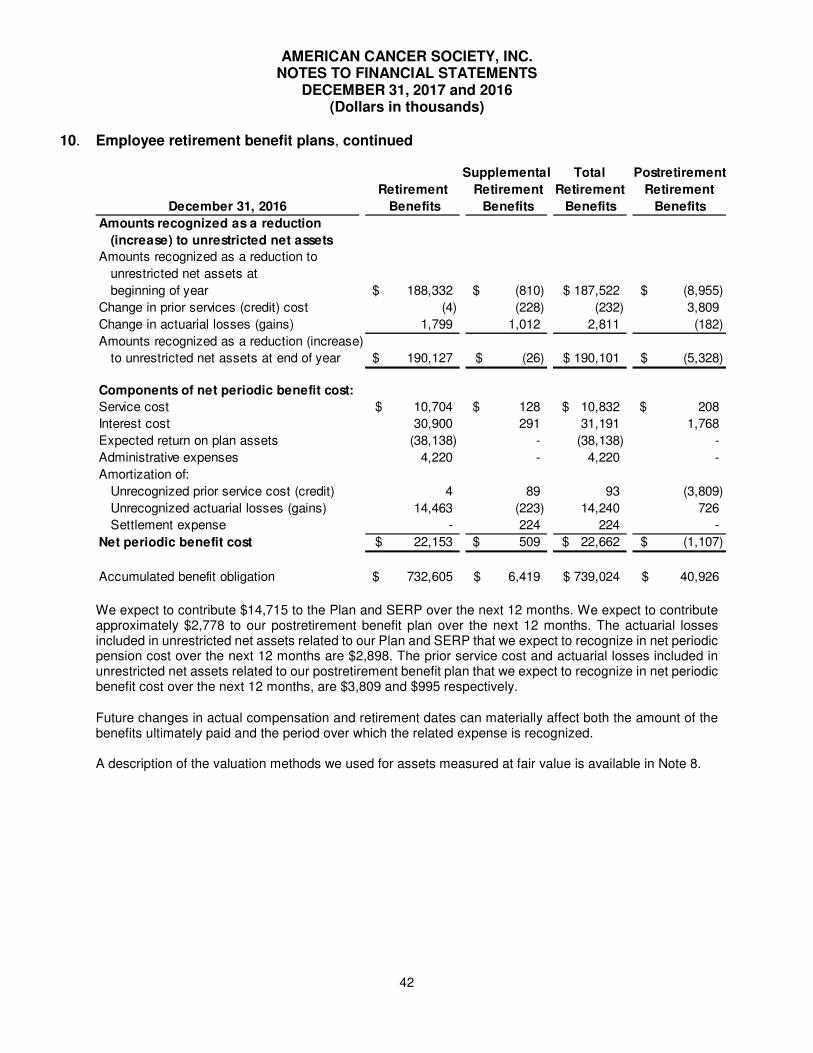
AMERICAN CANCER SOCIETY, INC. NOTES TO FINANCIAL STATEMENTS
DECEMBER 31, 2017 and 2016 (Dollars in thousands)
42
10. Employee retirement benefit plans, continued
We expect to contribute $14,715 to the Plan and SERP over the next 12 months. We expect to contribute approximately $2,778 to our postretirement benefit plan over the next 12 months. The actuarial losses included in unrestricted net assets related to our Plan and SERP that we expect to recognize in net periodic pension cost over the next 12 months are $2,898. The prior service cost and actuarial losses included in unrestricted net assets related to our postretirement benefit plan that we expect to recognize in net periodic benefit cost over the next 12 months, are $3,809 and $995 respectively.
Future changes in actual compensation and retirement dates can materially affect both the amount of the benefits ultimately paid and the period over which the related expense is recognized. A description of the valuation methods we used for assets measured at fair value is available in Note 8.
Supplemental Total Postretirement
Retirement Retirement Retirement Retirement
December 31, 2016 Benefits Benefits Benefits Benefits
Amounts recognized as a reduction
(increase) to unrestricted net assets
Amounts recognized as a reduction to
unrestricted net assets at
beginning of year 188,332$ (810)$ 187,522$ (8,955)$
Change in prior services (credit) cost (4) (228) (232) 3,809
Change in actuarial losses (gains) 1,799 1,012 2,811 (182)
Amounts recognized as a reduction (increase)
to unrestricted net assets at end of year 190,127$ (26)$ 190,101$ (5,328)$
Components of net periodic benefit cost:
Service cost 10,704$ 128$ 10,832$ 208$
Interest cost 30,900 291 31,191 1,768
Expected return on plan assets (38,138) - (38,138) -
Administrative expenses 4,220 - 4,220 -
Amortization of:
Unrecognized prior service cost (credit) 4 89 93 (3,809)
Unrecognized actuarial losses (gains) 14,463 (223) 14,240 726
Settlement expense - 224 224 -
Net periodic benefit cost 22,153$ 509$ 22,662$ (1,107)$
Accumulated benefit obligation 732,605$ 6,419$ 739,024$ 40,926$

AMERICAN CANCER SOCIETY, INC. NOTES TO FINANCIAL STATEMENTS
DECEMBER 31, 2017 and 2016 (Dollars in thousands)
43
10. Employee retirement benefit plans, continued The fair value of the Plan’s assets at December 31, 2017 and 2016 by asset category is as follows:
Level 1 Level 2 Level 3 Total
Cash and cash equivalents 7,060$ -$ -$ 7,060$
Corporate bonds - 194,299 - 194,299
U.S. government and government
agency obligations - 5,980 - 5,980
Commercial paper and
other short-term investments
Short-term investments - 12,497 - 12,497
Equity
Preferred stock 1,434 - - 1,434
Domestic 121,113 - - 121,113
International 100,999 40 - 101,039
Common collective trusts measured
at net asset value * 62,887
Limited partnership measured at
net asset value * 16,221
Other 39,141 - 106 39,247
Total investment assets, at fair value 269,747$ 212,816$ 106$ 561,777$
Financial assets measured at fair value on a recurring
basis as of December 31, 2017
Level 1 Level 2 Level 3 Total
Cash and cash equivalents 4,808$ -$ -$ 4,808$
Corporate bonds - 149,472 - 149,472
U.S. government and government
agency obligations - 21,025 - 21,025
Commercial paper and
other short-term investments
Mortgage backed - 17,652 - 17,652
Asset backed - 2,626 - 2,626
Short-term investments - 9,132 - 9,132
Equity
Preferred stock 1,209 - - 1,209
Domestic 157,323 - - 157,323
International 98,448 - - 98,448
Common collective trusts measured
at net asset value * 56,914
Government money fund 688 - - 688
Limited partnership measured at
net asset value * 15,003
Other 24,287 - 142 24,429
Total investment assets, at fair value 286,763$ 199,907$ 142$ 558,729$
Financial assets measured at fair value on a recurring
basis as of December 31, 2016

AMERICAN CANCER SOCIETY, INC. NOTES TO FINANCIAL STATEMENTS
DECEMBER 31, 2017 and 2016 (Dollars in thousands)
44
10. Employee retirement benefit plans, continued
* In accordance with Fair Value Measurement (Topic 820), certain investments that are measured at fair value using the net asset value per share (or its equivalent) practical expedient have not been classified in the fair value hierarchy. The fair value amounts presented in this table are intended to permit reconciliation of the fair value hierarchy to the amounts presented in the balance sheets. The table below provides a summary of changes in the fair value of the Plan’s Level 3 assets for the years ended December 31, 2017 and 2016:
11. Commitments and contingencies
We are a party to legal claims arising in the course of our normal business activities. Although the ultimate outcome of these claims cannot be ascertained at this time, we believe that none of these matters, when resolved, will have a material effect on our net assets.
12. Subsequent events
Management has evaluated the need for disclosures and/or adjustments resulting from subsequent events through June 27, 2018, the date the financial statements were issued. During this period, there were no subsequent events that required recognition or disclosure in the financial statements.
2017 2016
Balance, beginning of period 142$ 256$
Sales (36) (114)
Balance, end of period 106$ 142$
EY | Assurance | Tax | Transactions | Advisory
About EYEY is a global leader in assurance, tax, transaction and advisory services. The insights and quality services we deliver help build trust and confidence in the capital markets and in economies the world over. We develop outstanding leaders who team to deliver on our promises to all of our stakeholders. In so doing, we play a critical role in building a better working world for our people, for our clients and for our communities.
EY refers to the global organization, and may refer to one or more, of the member firms of Ernst & Young Global Limited, each of which is a separate legal entity. Ernst & Young Global Limited, a UK company limited by guarantee, does not provide services to clients. For more information about our organization, please visit ey.com.
© 2018 Ernst & Young LLP. All Rights Reserved.
ey.com